Article

Sustainability Analysis and Scenarios in Groundwater Pumping Systems: A Case Study for Tenerife Island to 2030

by
Daniella Rodríguez-Urrego
1,
Leonardo Rodríguez-Urrego
2,
Benjamín González-Díaz
1,* and
Ricardo Guerrero-Lemus
3
1
Departamento de Ingeniería Industrial, Escuela Superior de Ingeniería y Tecnología, Universidad de La Laguna (ULL), Camino San Francisco de Paula S/N, 38206 La Laguna, Santa Cruz de Tenerife, Spain
2
INDEVOS Research Group, Universidad EAN, Carrera 11 78-47, Bogotá 110221, Colombia
3
Departamento de Física, Universidad de La Laguna (ULL), Avenida Astrofísico Francisco Sánchez S/N, 38206 La Laguna, Santa Cruz de Tenerife, Spain
*
Author to whom correspondence should be addressed.
Energies 2022, 15(15), 5635; https://doi.org/10.3390/en15155635
Submission received: 30 June 2022 / Revised: 19 July 2022 / Accepted: 28 July 2022 / Published: 3 August 2022
(This article belongs to the Special Issue Recent Advances in Isolated Power Systems)

Abstract

:
Groundwater pumping systems using photovoltaic (PV) energy are increasingly being implemented around the world and, to a greater extent, in rural and electrically isolated areas. Over time, the cost of these systems has decreased, providing greater accessibility to freshwater in areas far from urban centers and power grids. This paper proposes a novel sustainability analysis of the groundwater pumping systems in Tenerife Island as an example of a medium-size isolated system, analyzing the current status and the business-as-usual projection to 2030, considering the water reservoirs available and the final use of water. The 2030 projection focused on the PV deployment, evaluation of the levelized cost of electricity (LCOE), and the availability of the groundwater resource. HOMER software was used to analyze the LCOE, and ArcGIS software was used for the visual modeling of water resources. As a result, the average LCOE for a purely PV installation supplying electricity to a pumping system in Tenerife is 0.2430 €/kWh, but the location and characteristic of each pumping system directly affect the performance and costs, mostly due to the solar availability.

1. Introduction

The world population is growing quickly, is currently estimated to be over 7.7 billion inhabitants, and is expected to increase by 2.0 billion over the next 30 years [1]. Therefore, demand for the three natural pillars of human sustainability, namely, cropland, freshwater, and fossil fuels, has tripled in the last 50 years and will continue to rise in the near future. Consequently, further exploitation of fossil fuels and freshwater resources to meet the basic needs of communities will mean that it will not be enough to adequately supply the population. Currently, approximately 66% of the population does not have adequate access to these resources [2], increasing the food, energy, and water security deficit worldwide [3,4], and representing a high risk in terms of human sustainability.
Overall, agricultural and industrial activities, together with the energy production sector, are responsible for almost 80% of the consumption of freshwater supplies worldwide [5,6]. For this reason, the current world panorama presents a shortage of freshwater and a worsening forecast for the coming years. Indeed, according to the World Resource Institute (WRI), there are currently 17 countries facing high levels of water stress, and by 2040 this number will increase to 33 countries [7,8]. Therefore, water security as a pillar of the global agricultural, energy, and industrial sectors should face the actual use of this valuable resource and optimize the final use of water in these sectors.
Fresh groundwater is one of the main sources of freshwater, but nowadays it is strongly affected by climate change, mainly due to altered precipitation patterns, acidification of waters due to pollution, and degradation of freshwater ecosystems. In addition, the high impact of aquifer exploitation is having serious repercussions worldwide. Indeed, with the modernization of societies and the increase in the world’s population, more freshwater is required, so the rate of aquifer exploitation in many locations is higher than the natural recharge rate of aquifers. This is placing 20% of the 39 million groundwater wells in 40 countries at risk of depletion [9], affecting future water availability, causing ecological degradation of the soil, and affecting aquifers due to the inflow of seawater [10,11,12].
The adequate management of freshwater resources is vital for the commitment to the Sustainable Development Goals (SDGs), in particular Objective 6. However, poor management of these resources represents a strong threat at a global level. For example, in Spain, during 2019, around 6,000 Hm3 of groundwater was exploited [13], where the groundwater pumping in illegal wells was not accounted for. In Spain, during 2018 according to [14], the legal extraction of groundwater was 6290 Hm3/year. However, illegal extraction was approximately 7059 Hm3/year, 11% more than the legal extraction. These illegal wells place the population and the water supply of the country at risk.
Despite the global overview, we focus on the framework of insular areas, which are considered territories that are vulnerable to climatic effects. The consequences of these climatic changes are increase of temperature, rainfall variation, sea level rise, and desertification, among others. They are also the most critical in terms of water resources due to the intense exploitation and, in turn, the high energy cost of groundwater pumping and purification [15].
In these areas, groundwater exploitation by pumping becomes one of the main strategies for obtaining freshwater resources to the islanders. Examples include the Lakshadweep archipelago or the Canary Islands [10,16,17]. However, the impact of pumped freshwater extraction represents greater energy expenditure than extraction from surface water sources or water distributed by gravity. On islands, diesel generators or the connection to the electrical grid to pump fresh groundwater, which have substantial polluting impacts, economic costs, and operational difficulties, are the most used systems.
Many research studies propose using photovoltaic systems, photovoltaic–wind hybrid systems, and diesel generators for freshwater pumping [18,19,20,21,22,23]. Most of the research on sustainable pumping applications is focused on the agricultural sector, as it represents the largest water consumer in insular areas [24,25]. Worldwide, approximately 70% of groundwater extraction is used for irrigation, an amount that can vary depending on the characteristics of each territory, the climate, energy resources, and the economic relevance of the sector in the territory. Therefore, renewable energy alternatives, such as the photovoltaic water pumping system (PVWPS), has become an energy opportunity for water pumping in agriculture [26,27,28,29,30].
Currently, in several territories, irrigated crops are mainly operated with diesel-powered equipment. In fact, the diesel approach is nowadays one of the most chosen solutions by the agricultural sector [27], operating in very shallow wells and small agricultural areas [30], as the investment costs are halved compared to those of a pumping photovoltaic (PV) power plant [27]. However, although the PVWPS has a high initial investment cost, it also has many features that make it an alternative energy source for water pumping. Among these features, the PVWPS solution is modular, produces no carbon emissions when operating, generates no noise, and has a low operating and maintenance cost, which allows for higher well yields, creating a clean and very competitive generation system [20,31,32].
On the other hand, these diesel-powered systems for pumping applications are based on imported diesel fuels, which generate a high levelized cost of electricity (LCOE).
However, before a decision on the implementation of PV pumping is performed, it is important to know the evolution of the availability of water in the aquifer, the energy consumption required, and the evaluation of the feasibility of a PV or hybrid project. Without an effective study that relates energy consumed, expected water production, and associated costs, the operation of a well can become unsustainable over time [33].
To analyze the performance of the solar pumping systems, Tenerife was chosen as a representative mid-size island with a larger number of wells, where the pumps are directly connected to the electrical grid.
This paper analyzes groundwater obtained by pumping in Tenerife and proposes sustainable exploitation in relation to energy required for the activity (energy–water nexus). The study proposes a 100% renewable scenario through the evaluation of the LCOE according to the characteristics of the aquifer and the energy resources available. Section 1 discusses the importance of groundwater resources at global and local levels on the island. Section 2 analyzes the current situation of the freshwater resource in Tenerife, including the initial characteristics of the wells, their location, and the demand for fresh water in recent years. The global context of the energy resource is also presented. Section 3 presents the methodology applied in this research. Finally, Section 4 shows the results and a brief discussion of the assumptions for a future 100% renewable scenario.

2. Groundwater and Energy Review in Tenerife

The Canary Archipelago is composed of eight islands and is located in the Atlantic Ocean, in southern Spain, off the Saharan coast of Africa (28°28′11″ N–16°15′18″ W). Tenerife is the largest of the Canary Islands in size and population, with an area of 2034 km2 and a population of 917,841 inhabitants (2020), divided into 31 municipalities [34] (Figure 1). Tenerife has a tropical climate with over 11 microclimates, and it is the most socioeconomically important of the entire archipelago due to its tourism and agricultural sectors, with an average of 8,324,697 visitors per year [35].

2.1. Water Resource Information

In terms of water resources, Tenerife is an island without rivers, mainly supplied by groundwater and desalinated water. It is considered the second Canary Island with the highest rainfall rate, with an average annual precipitation of about 400 mm per m2, and irregular in time [36]. In 2018, the island produced 204.58 Hm3 of fresh water from various sources: 42.5% from galleries, 23.4% from wells, 1.5% from springs, 0.3% from imported water, 26.9% from desalination, and 5.4% from reclaimed water (2019) [37].
As groundwater resources predominate on the island, we analyzed their behavior during the last decade. Figure 2 shows how groundwater extraction in recent years (2010–2019) has caused a water depletion in aquifers, represented by a 7.0% decrease in natural water extracted by wells and a 15.0% decrease in galleries. Although for the year 2019 the values increased 6.6% in comparison with 2018, the reduction of extracted water in recent years is worrisome.
In the Table 1, the yearly groundwater supply in 2019, registered by municipality and separated by water extraction infrastructure of the island is shown.

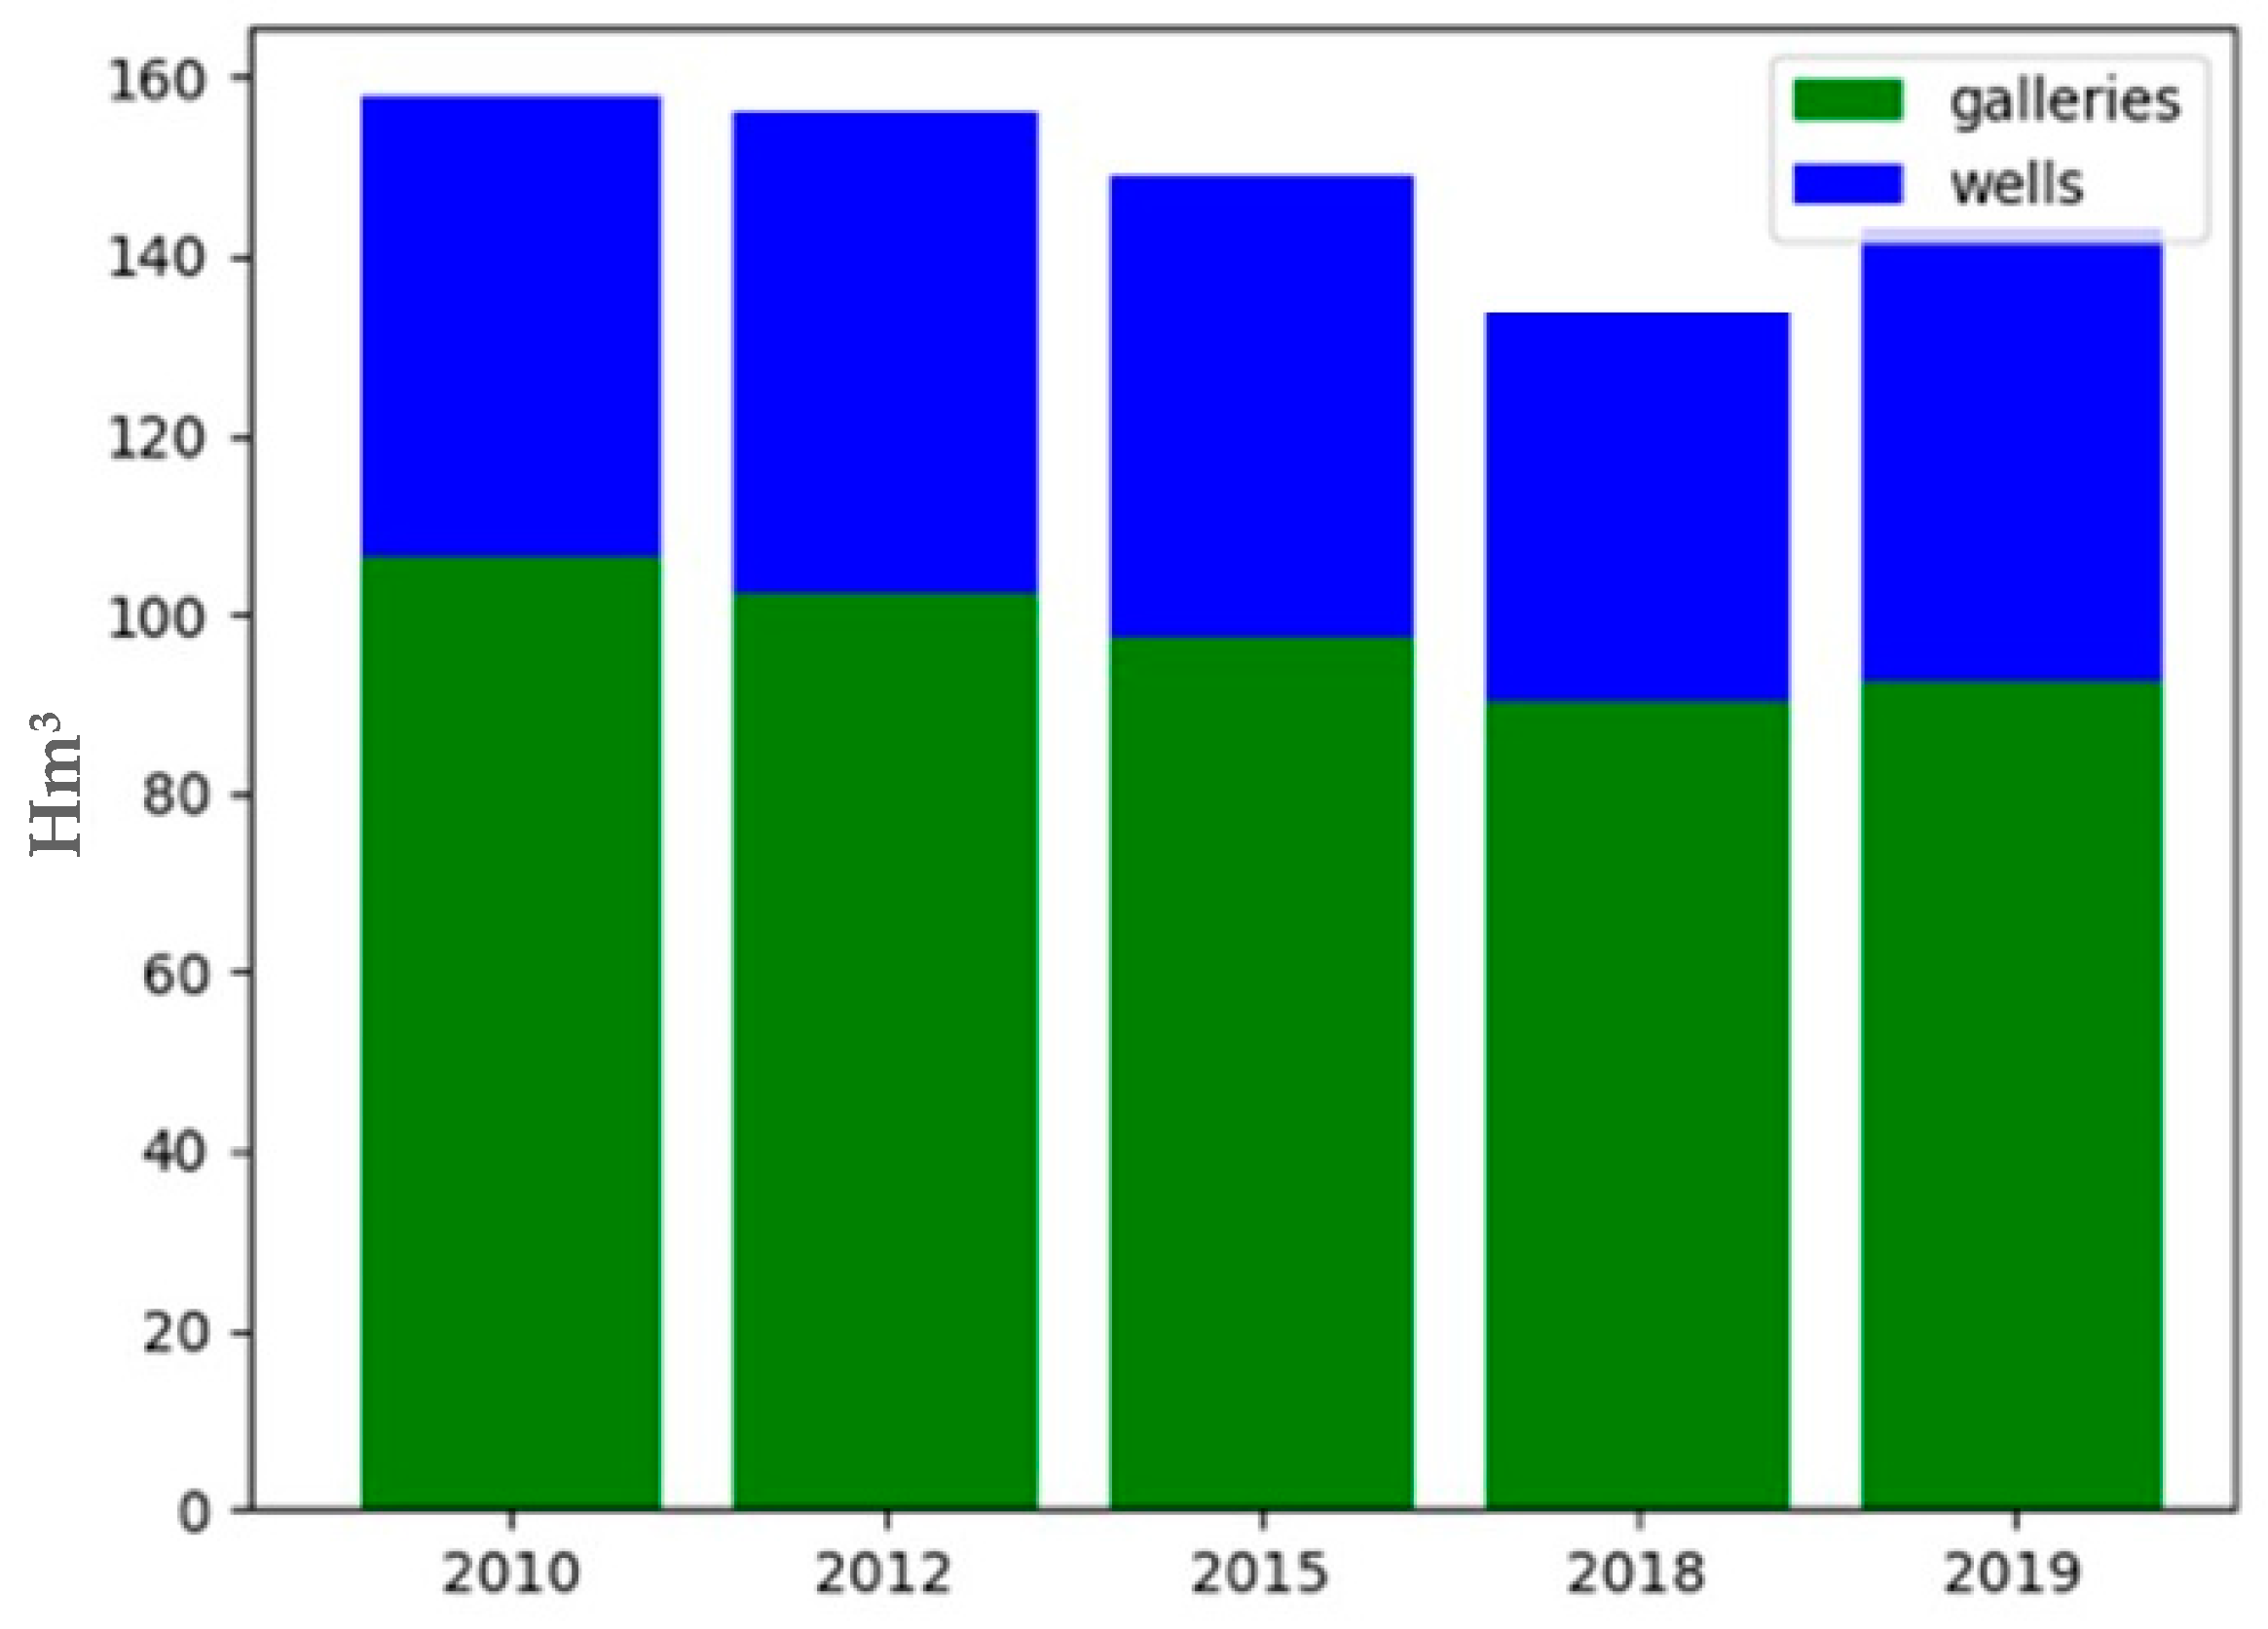
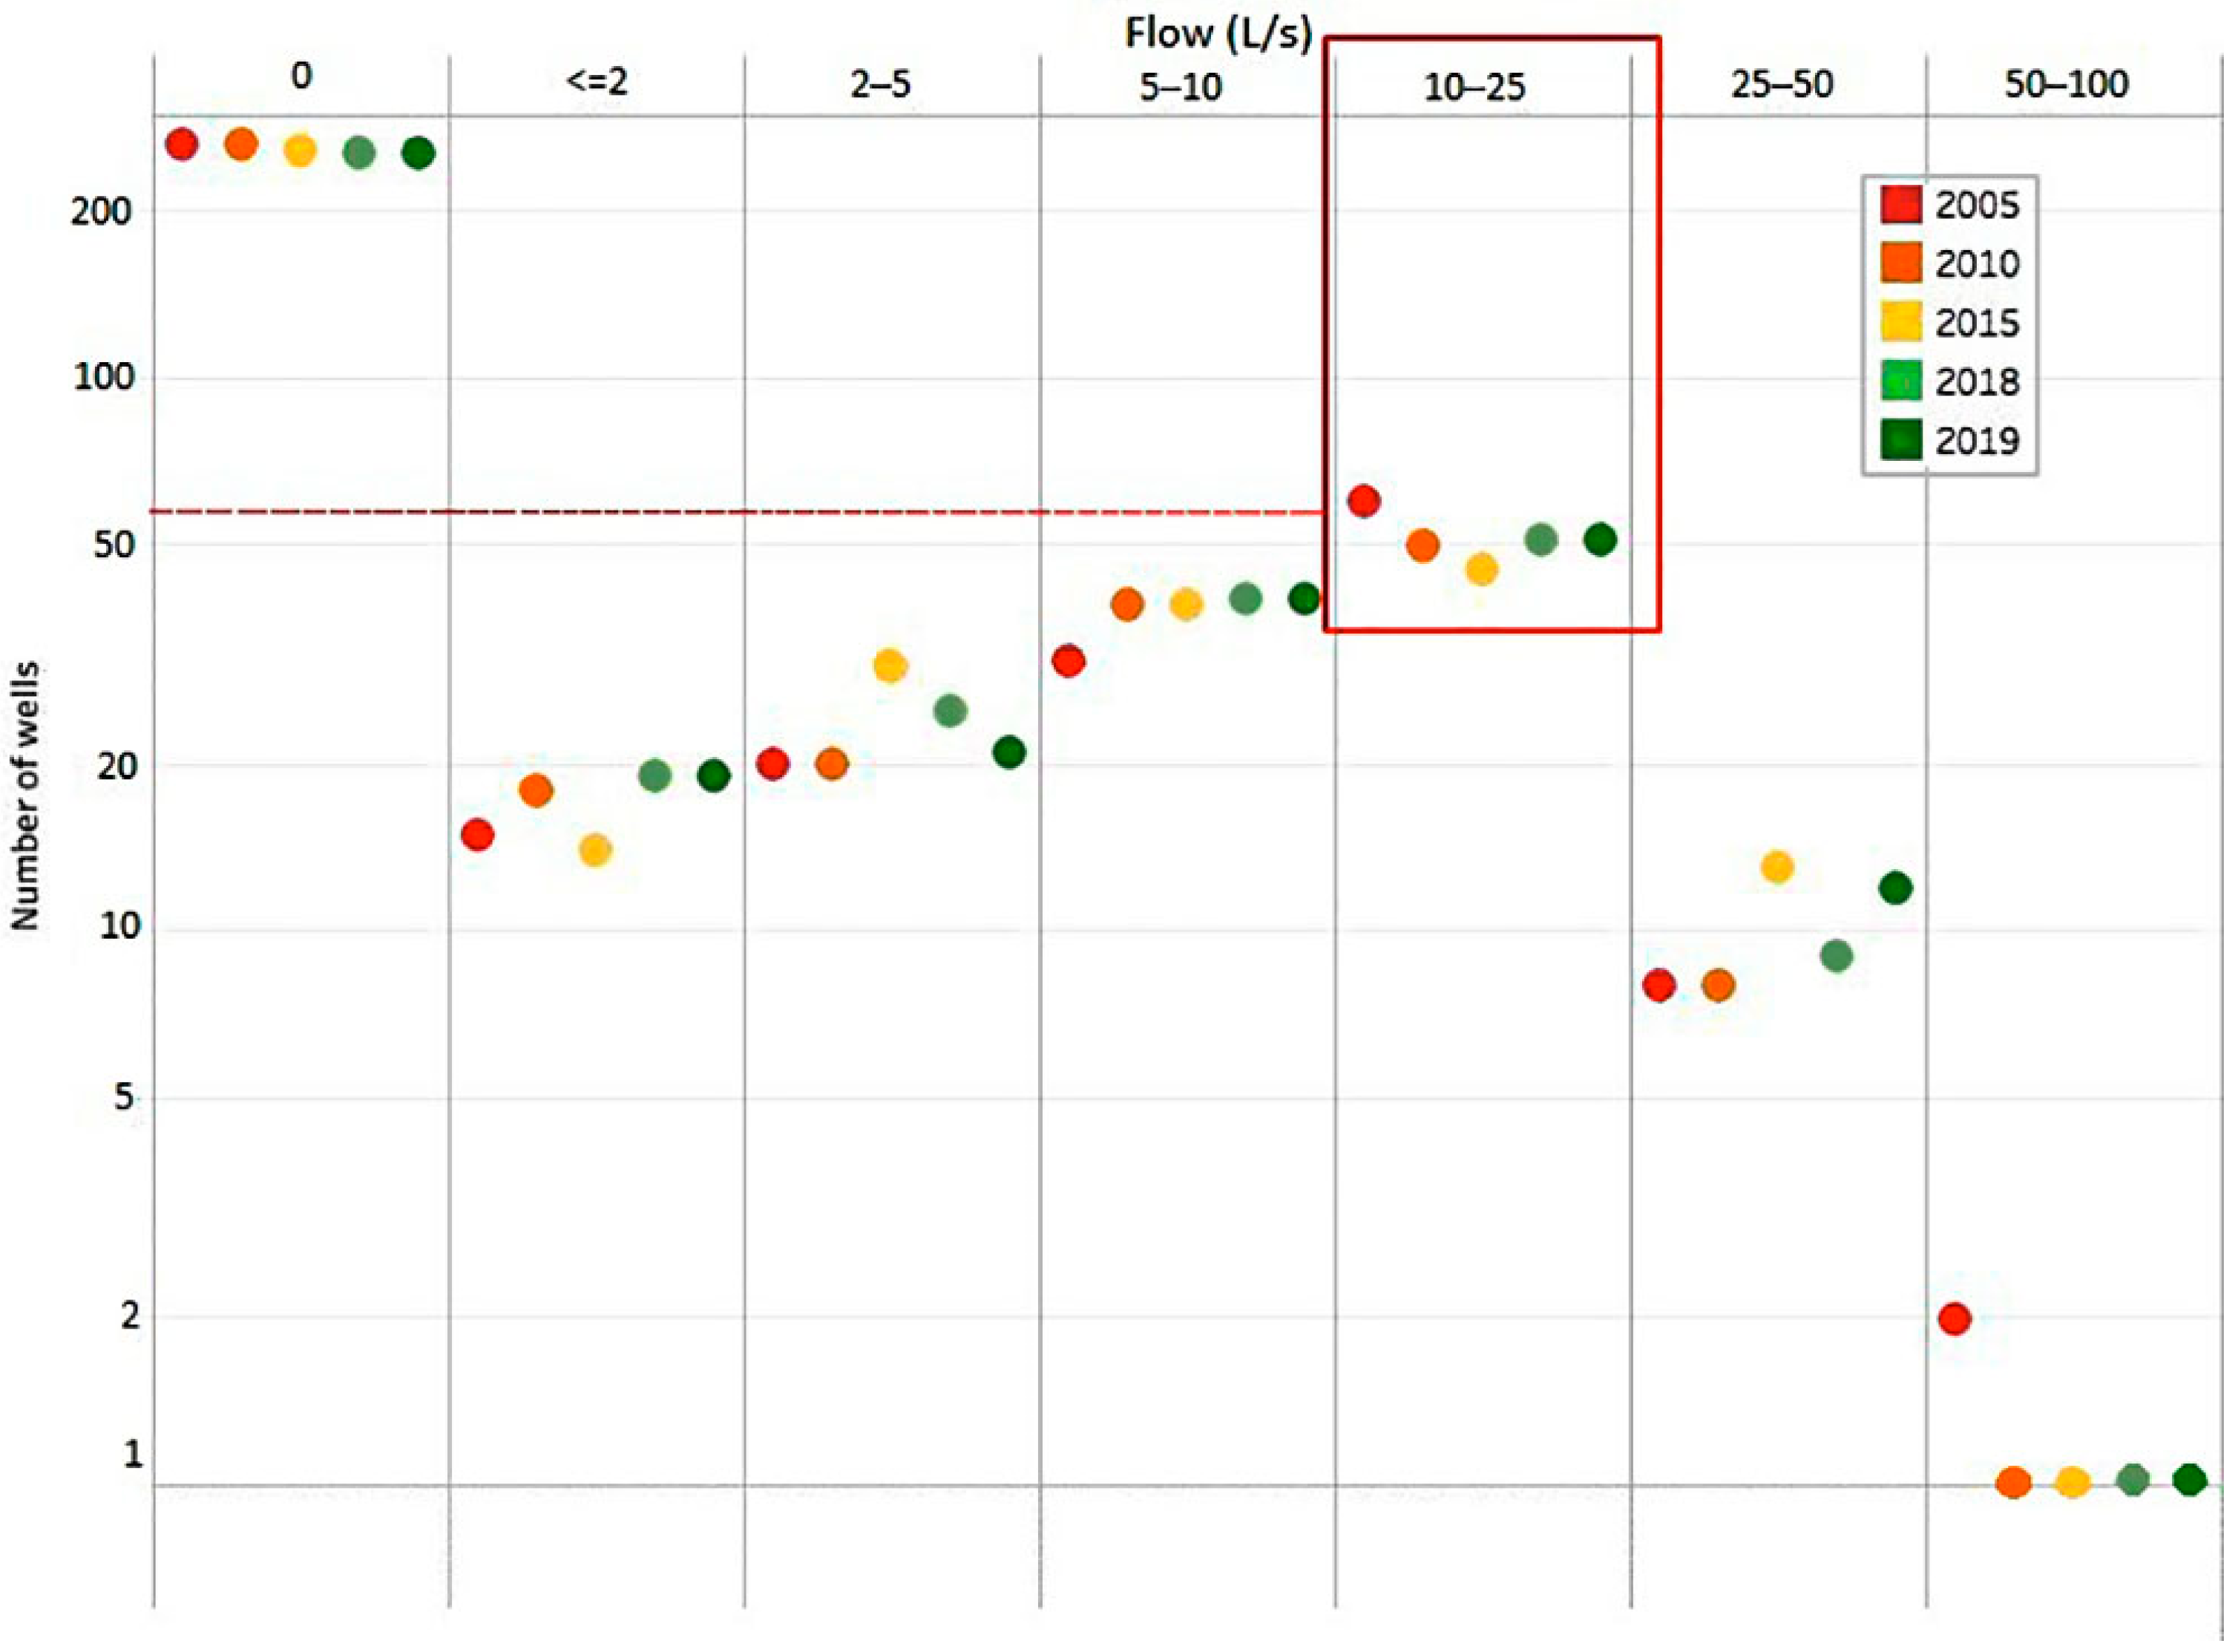
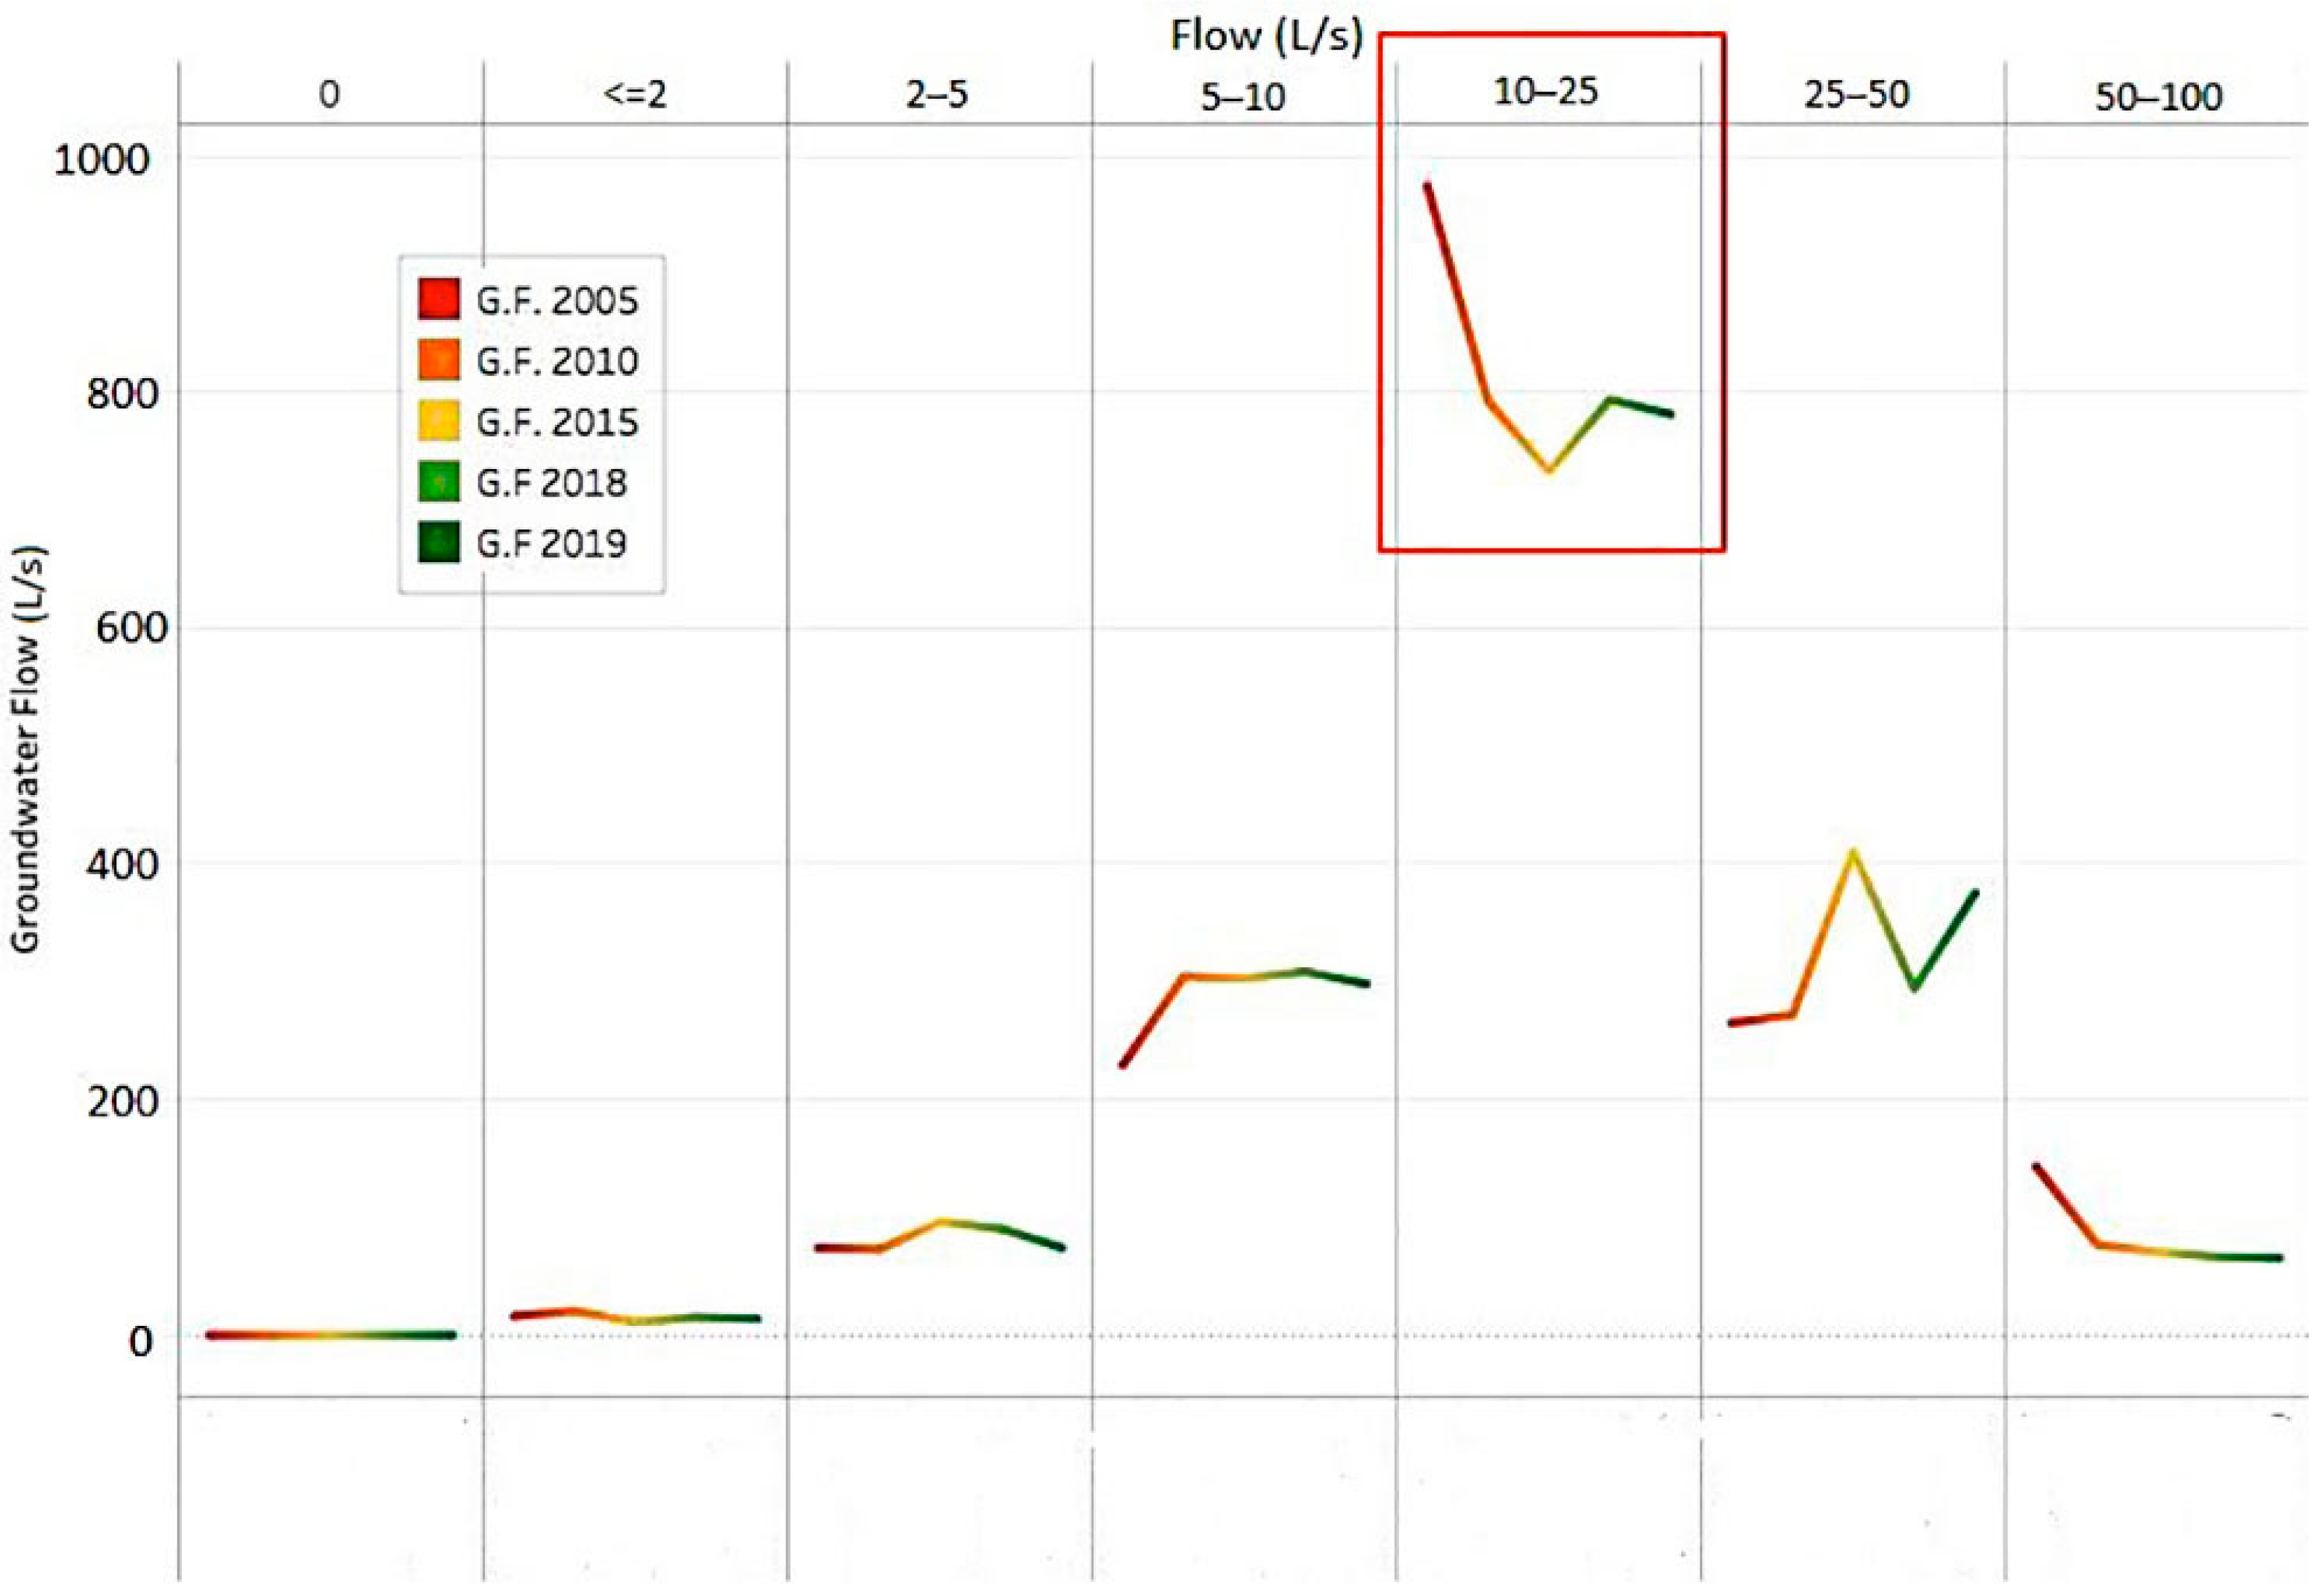
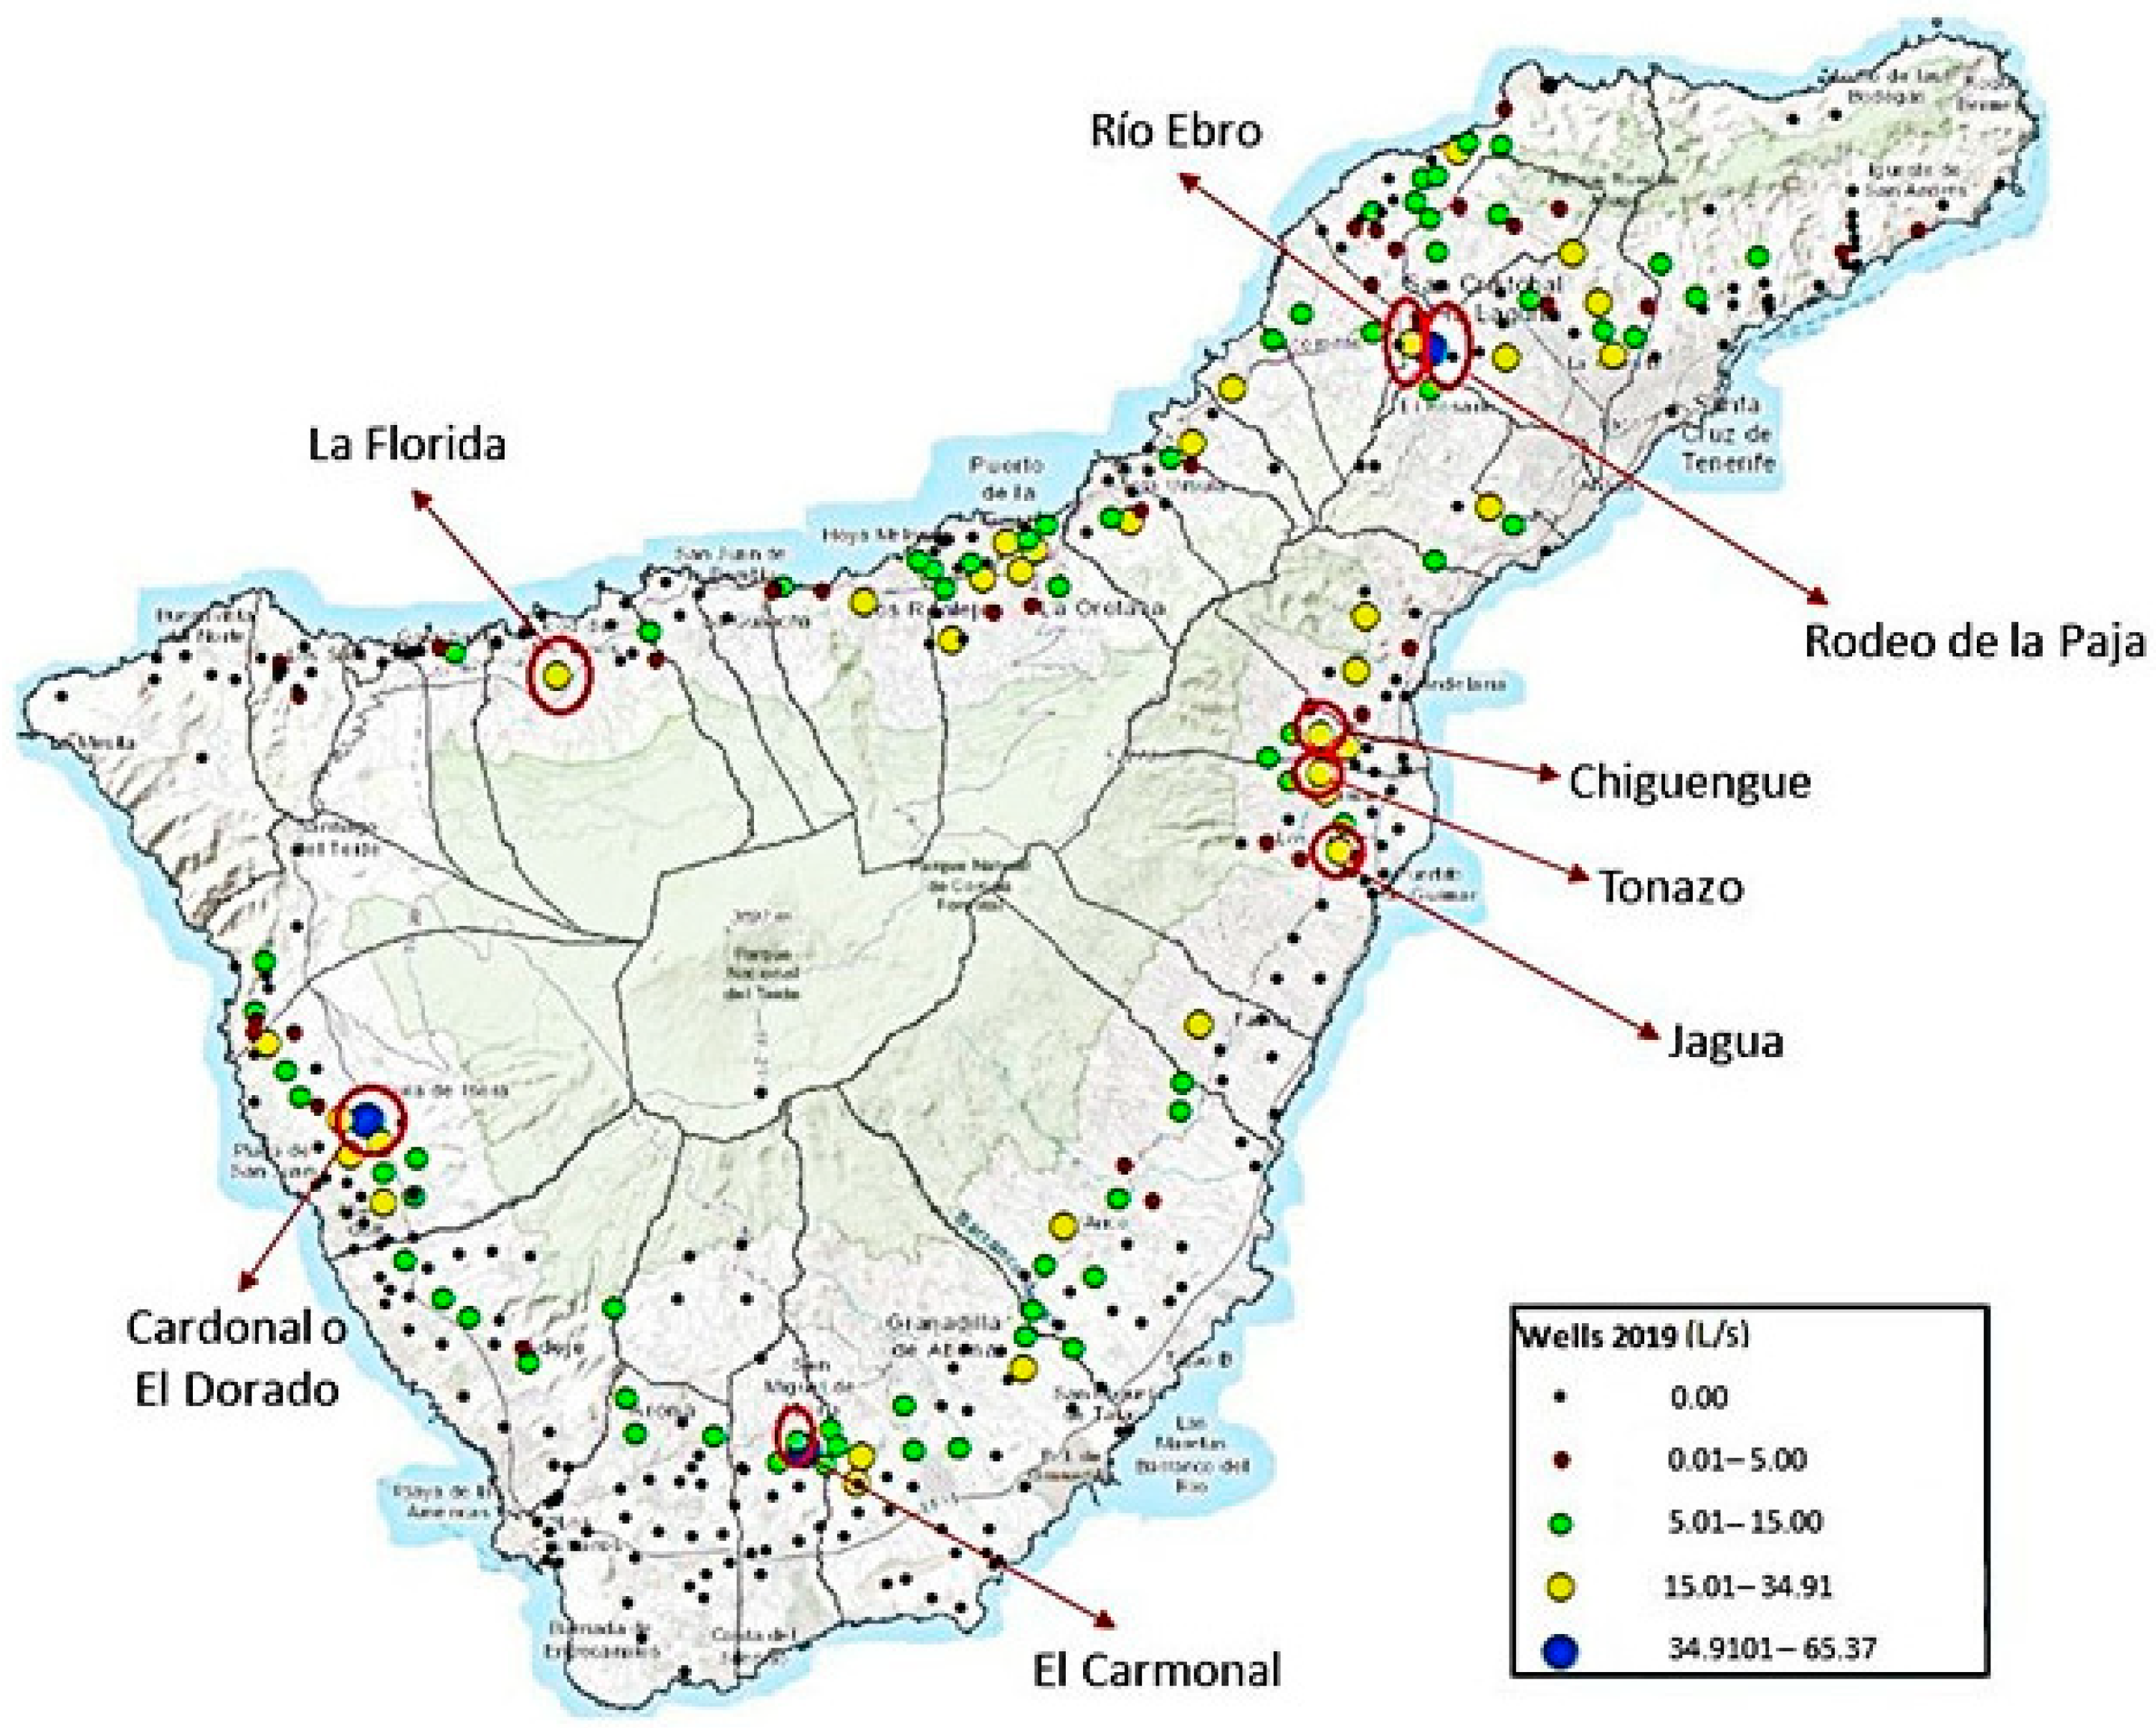
2.1.1. Groundwater Wells

Wells are vertical structures that allow the intense exploitation of fresh groundwater and that are vital sources of freshwater for the islanders. Groundwater can be collected in diverse types of wells: (i) ordinary: vertical boreholes of less than 25 m depth; (ii) conventional: characterized by having a diameter of about 3 m and reaching an average depth of 100 m; (iii) boreholes: mechanical boreholes up to 700 mm in diameter with an average depth of 380 m for those currently in exploitation [37].
Currently, the island has 401 wells from which 145 are producing freshwater (in exploitation), 63.0% of them are conventional wells, 34.0% are exploratory wells, and the rest are boreholes. Figure 3 shows the number of existing wells in Tenerife, classified according to the flow rate (L/s) produced by each well (0, ≤2, 2 to 5, 5 to 10, 10 to 25, 25 to 50, and 50 to 100 L/s) in the period 2005–2019. Similarly, the number of wells providing more freshwater resources (10–25 L/s) showed a downward trend in general, as indicated in the red box. There is only one well with a flow rate above 50 L/s, maintained quite constantly since 2010. After the analysis of the actual trend, it is expected that the number of active wells will decrease.
Figure 4 shows the total freshwater flow contributed by the wells on the y-axis, classified according to the flow rate (L/s) produced by each well (0, ≤2, 2 to 5, 5 to 10, 10 to 25, 25 to 50, and 50 to 100 L/s) in the last 15-year period, 2005–2019, on the x-axis. The largest water contribution to the island comes from the wells with 10–25 L/s freshwater flow, which are identified in a red box and will be analyzed consecutively. In total, 60 wells registered in 2005 (Figure 3) provided approximately 975 L/s (Figure 4); likewise, in 2015—represented by the yellow color—only 45 wells provided 732 L/s to the island, and in 2018—represented by the green color—the number of wells increased to 51 with a total supply of 794 L/s. With a general overview, the 401 wells registered in the year 2005 supplied 1702 L/s of freshwater, reducing this flow in the year 2018 to 1568 L/s, and increasing it in the year 2019 to 1614 L/s. This shows a reduction of 5.17% of freshwater from wells in the last 14 years; that is, an annual water reduction of approximately 0.189 Hm3.

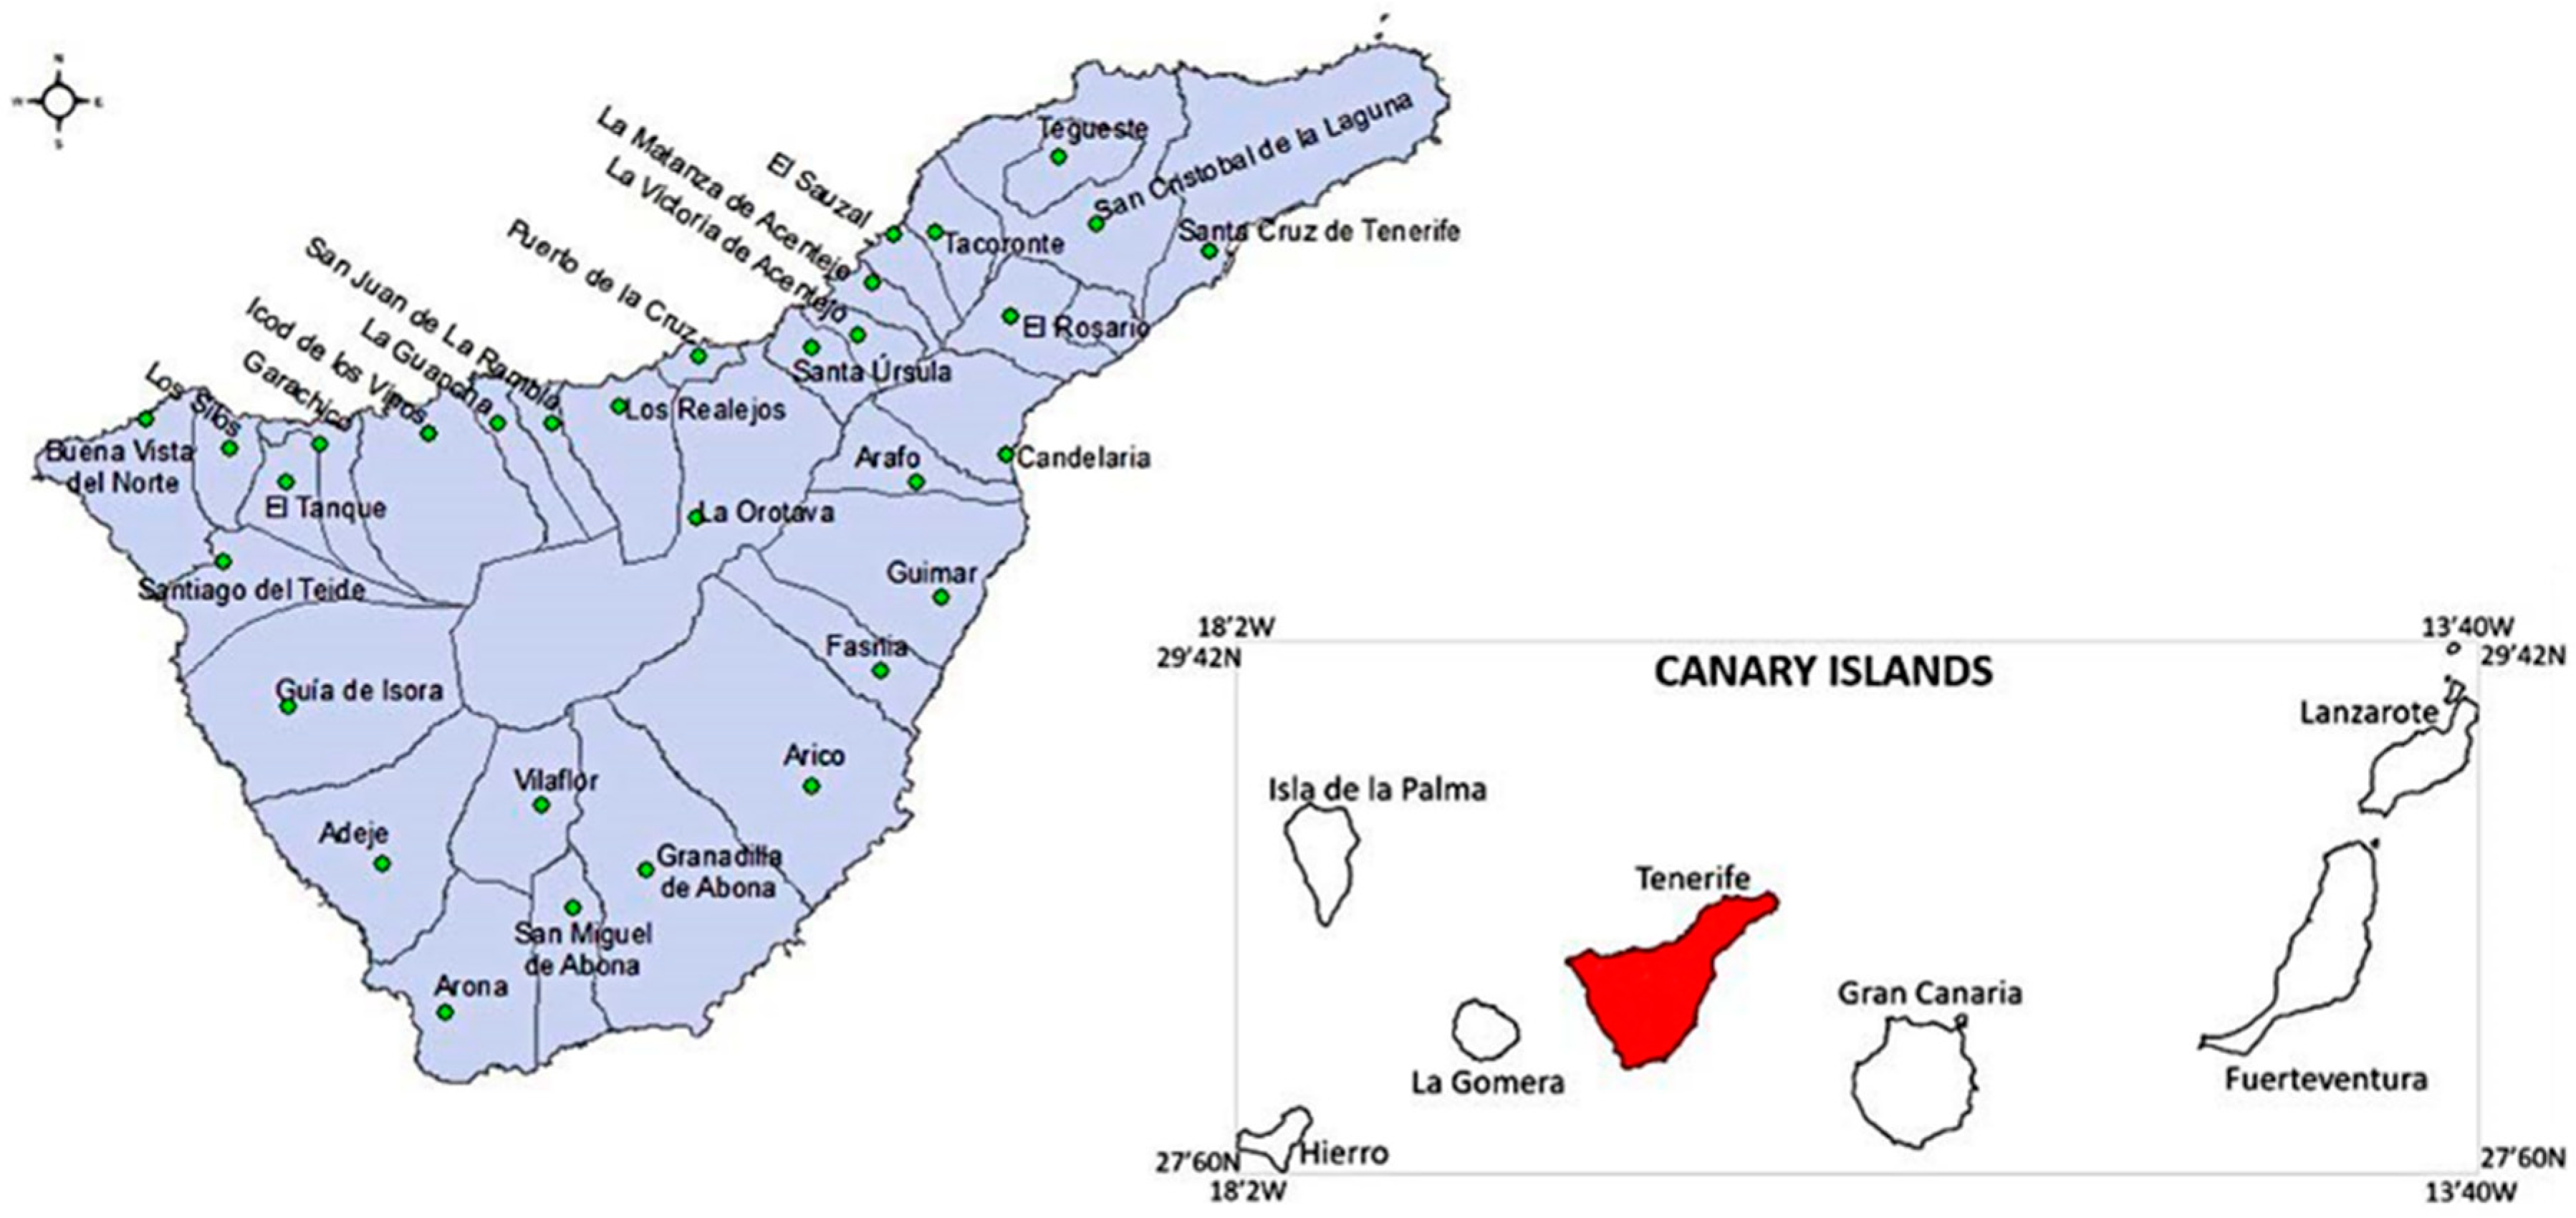
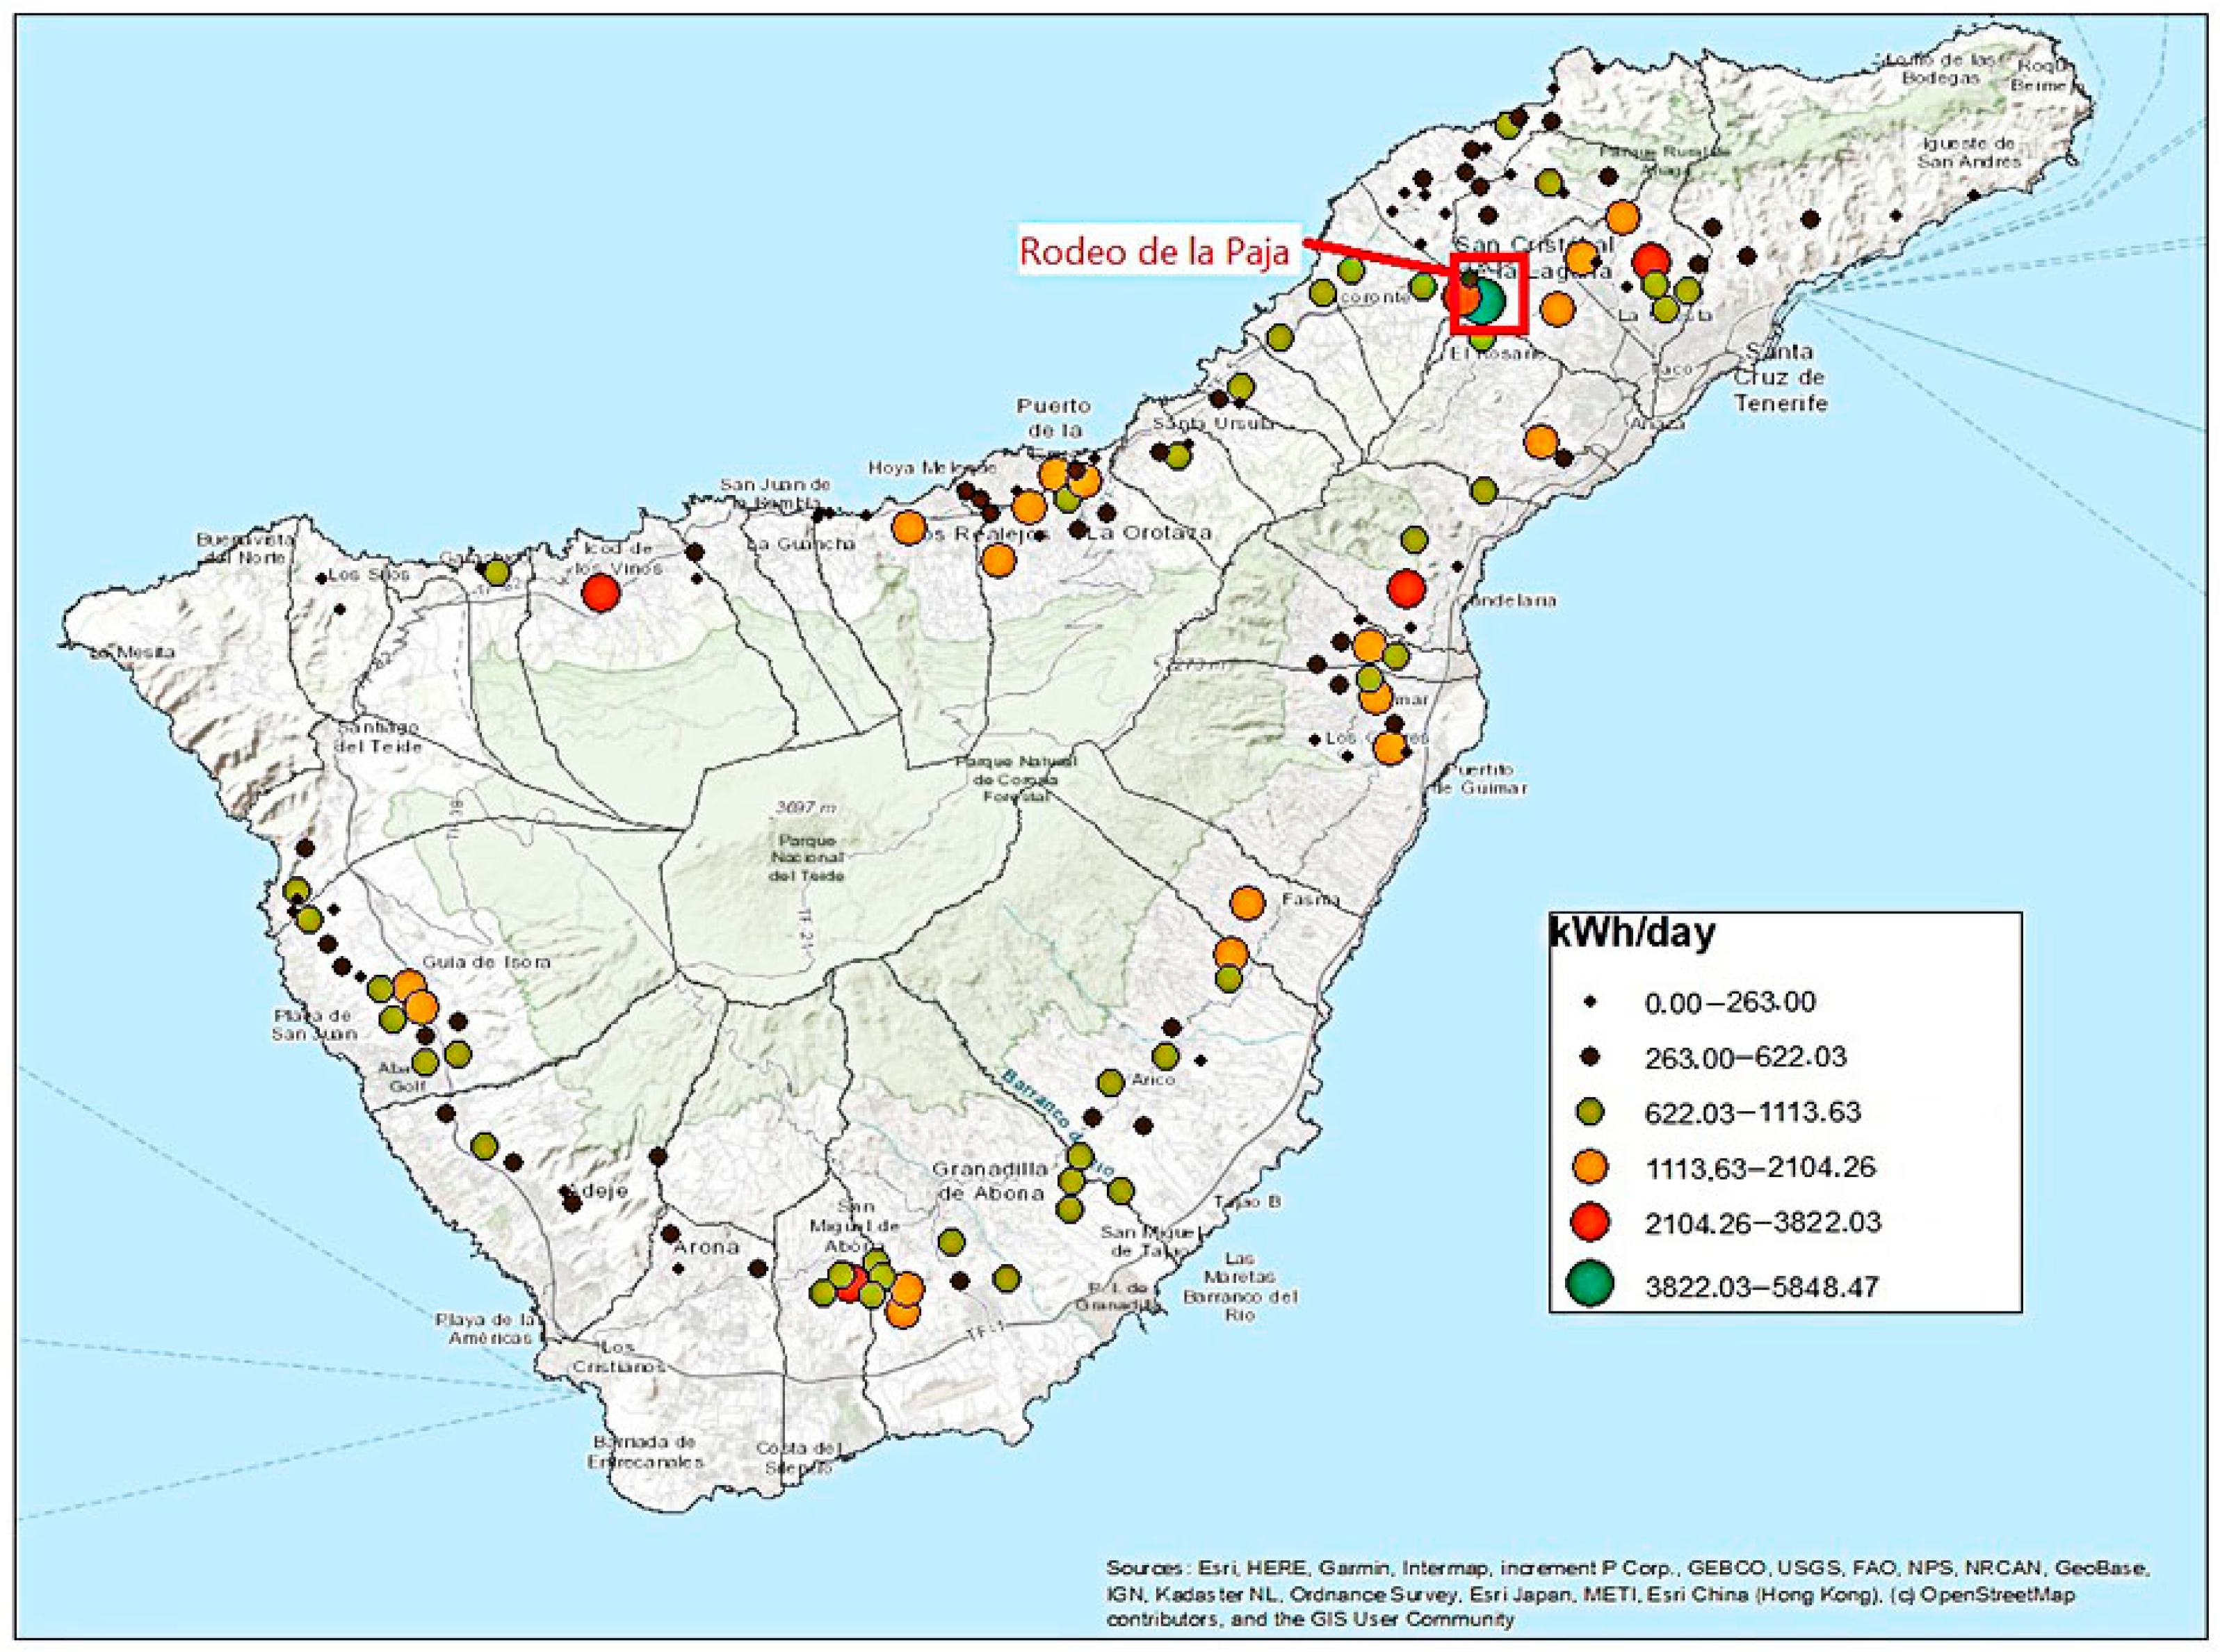
2.1.2. Location of the Wells

The coastal areas of the island have most of the socioeconomic activities, which explains why most of the groundwater extraction takes place in these areas. Figure 5 shows the location and flow rate of each well, highlighting the most productive ones. Rodeo de la Paja is the well with the highest flow in the island, with an annual extraction of 2.1 Hm3 per year [38]. This well is in the municipality of San Cristóbal de La Laguna and has a flow rate of 65.37 L/s [39]. It is currently being retrofitted to replace the borehole. The Ramonal well, located in the municipality of San Miguel and the Cardonal or El Dorado well in the municipality of Guía de Isora provide flows between 40 and 45 L/s, respectively. The Rio Ebro and Jagua wells, located on the northeastern side of the municipalities of La Laguna and Güímar, respectively, have a flow rate of 25 and 35 L/s, and a daily contribution between 2500 and 3100 m3. Wells with hourly flows greater than 15 L/s and less than 34 L/s are in Himeche, Tonazo, La Florida, and Chiguengue (Figure 5).

2.2. Groundwater Demand

Water demand in Tenerife is divided according to the consumption sectors: residential, touristic, industrial, and agricultural. Currently, the agricultural sector is the largest consumer of freshwater on the island [40], with an annual consumption of 87.76 Hm3/year, equivalent to 42.9% of the total water demand [37].
The cultivated area of Tenerife corresponds to 16,517 hectares (ha). The cultivation land is 72.0% irrigation (69.0% of the water is provided by galleries and 31.0% by wells) [41] and 28.0% rain-fed agriculture. From the irrigated agricultural area (11,683 ha), bananas (4849 ha) represent 42.0% of the land, vineyards 17.0%, potatoes and tomatoes 15.0%, and flowers and other crops 12.0%. In terms of water requirements, vines and potatoes stand out for the productive use of water, offering more food while using less water per unit of land. The difference with banana plants is that these are among the crops that use larger amounts of water in the world, with an approximate annual consumption between 12,375 and 18,000 m3/ha [42,43,44]. In Tenerife, the average annual consumption for banana plants is 12,076 m3/ha [37], with substantial variations depending on the microclimatic conditions and type of exploitation (open air/greenhouse).
To understand the large consumption of freshwater in the agriculture sector, we detailed the occupation of the island through the spatial distribution presented in Figure 6. The agricultural area occupies approximately 19.3% of the island’s surface, 8.1% is currently cultivated, and about 10.4% is uncultivated [45]. We also show the geographic location of the crops, specified by typology. The largest banana plantations on the island are geographically located in the southern area, usually at altitudes below 300 m above sea level. This allows them to have easy access to the island’s freshwater sources (galleries and wells). This particular crop consumes approximately 60.0% of agricultural water, potatoes use about 15.4%, and tomatoes 6.5%.

2.3. Energy Supply

In a summarized context at the island level, Tenerife’s primary energy supply in 2019 (1985 ktoe) was 98.1% dependent on fossil fuels [34]; 50.0% of the diesel and 71.8% of the heavy oil supplied to the island was consumed at the Granadilla thermal power plant, which supplied 82.7% of Tenerife’s electricity. In 2019, the electricity generation capacity on the island was 1426 MW, with a total electricity demand of 3514 GWh. Only 17.8% of electricity was produced by renewable resources from wind and PV power plants (195 and 116 MW, respectively) [34].
The electricity demand of the island’s wells was 57.27 GWh for the year 2018, equivalent to a 1.7% of the energy demand in Tenerife, related with extraction, elevation, and desalination of water processes.
PV has become the best option to reduce fossil fuel consumption in Tenerife. Solar radiation provides enormous photovoltaic potential, especially in rural areas, as it is shown in Figure 7. According to [35], the island currently has 116.07 MWp of installed PV capacity, and its global annual radiation is between 3.5 and 5.5 kWh/m2. Currently, most installations are in the south-eastern territory (Figure 7).
Nowadays, PV technology is being implemented all over the world and to a significant extent in many islands due to their high solar potential. Currently, most PV installations in Tenerife are directly supplying electricity to the grid. However, at present there are no PV installations supplying electricity directly for pumping. The wells are in areas with an average PV production of 3.8 kWh/m2/day.

3. Methodology and Preliminary Analysis

In this paper, the sizing of the PV pumping system for the wells on the island was methodologically performed based on the following phases (Figure 8):
  • Data: obtaining data and characteristics of the Tenerife Island in terms of water and energy (Section 2).
  • Methodology review: reviewing PV pump design methodologies based on different studies and the projection of future water resources.
  • Current scenario in Tenerife: implementing the methodology that allows modeling of a hypothetical scenario in which all wells are powered 100% by PV, and a study of the surface area required for the PV installations.
  • Economic study: evaluating the economic performance of a PV pumping system.
  • Tenerife 2030 scenario: an approximation of the future water scenario reaching the Sustainable Development Goals for 2030.

3.1. PV Capacity

For the definition of the capacity required, different factors must be considered, such as the average temperature of the area, the daily hours of solar irradiance, the relationship between the output power of the PV system in operating conditions, and its output at the maximum power point, as well as the daily efficiency of the subsystem [30,47]. The parameters considered are listed below.

3.1.1. Pumping Energy ( E h )

Hydraulic energy varies depending on the height (H) and the volume (V). The expression for hydraulic energy can be written as the following subsystem [34]:
E h = ρ · g · H · V 3.6 × 10 6   ,
where the hydraulic energy ( E h ) is expressed in kWh/day, the volume ( V ) of daily water in m3/day, the height ( H ) of the total pumping in m, the acceleration due to gravity ( g ) in m/s2, and the density ( ρ ) of water in kg/m3.

3.1.2. PV Capacity (P)

In order to determine the PV capacity (P), the average temperature of the area under study and the daily sun hours must be considered [47].
In the first step, we verify the relationship between the effective area of the PV system ( A P V ) and its efficiency ( η r ):
P = 1000 · A P V · η r   ,
where ( A P V ) is the effective area of the PV array expressed in m2; the solar radiation at a reference temperature is equal to ( 1000   W m 2 ) ; likewise, the efficiency of the PV array at the reference temperature (25 °C) is expressed as ( η r ) . This will determine the power of the photovoltaic array (P) expressed in Wp.
According to [30,47], the required area of the PV solar pump ( A P V ) array depends on the properties of the well, such as the height of the well ( h ); the volume ( V ), defined as the daily amount of water required; water density ( ρ ); gravity ( g ); and the daily solar radiation during the most unfavorable times of the year, in this case December or January ( G T ) , on the surface of the PV array expressed in kWh/m2; ( η P V ) being the efficiency of the PV array at operating conditions and ( η s ) the subsystem efficiency:
A P V   = ρ · g · h · V G T · η P V   · η s   .
Substituting Equation (3) in Equation (2), we obtain:
P = E h   A d i · F · E ,
where (F) is the array mismatch factor. The accepted value of the design of a PV system is 0.85–0.90; (E) is the daily efficiency of the subsystem with values between 0.2 and 0.6, and ( A d i ) is the average daily solar irradiation.
A safety factor for AC/DC and thermal losses during production was considered [34] (Equation (5)):
P f = 1.2 · P   ,
where 1.2 is a safety factor that compensates for energy losses due to high heat, dust, aging, etc.
The working parameters used for the case of Tenerife were selected according to the location of each well, where we identified: pumping height (m) according to the type of well, water flow (m3/day), solar irradiation (kWh/m2), and the price of electricity from the network (€/kWh).

3.2. LCOE

The economic analysis for the PV pumping system in Tenerife is based on the standard LCOE method, which allows investment options to be compared over time, where the cost is represented in €/kWp. Currently, the PV LCOE is below 10 c€/kWh in several countries, and by 2030 it may be below 4 c€/kWh [48].
The LCOE can be calculated as shown in Equation (6):
L C O E = t = 1 n i t + M t + F t ( 1 + i ) r t = 1 n E t ( 1 + i ) r ,
where i t is the investment, M t is the maintenance, and F t is the fuel in year t and in a period of n years. E t is the estimated annual energy produced by the PV system. The costs and annually energy obtained are affected by the discount rate r [49].
To obtain the feasibility of the solar water pumping system proposed for each well, we used HOMER, considering the values in the schematic diagram presented in Figure 9.
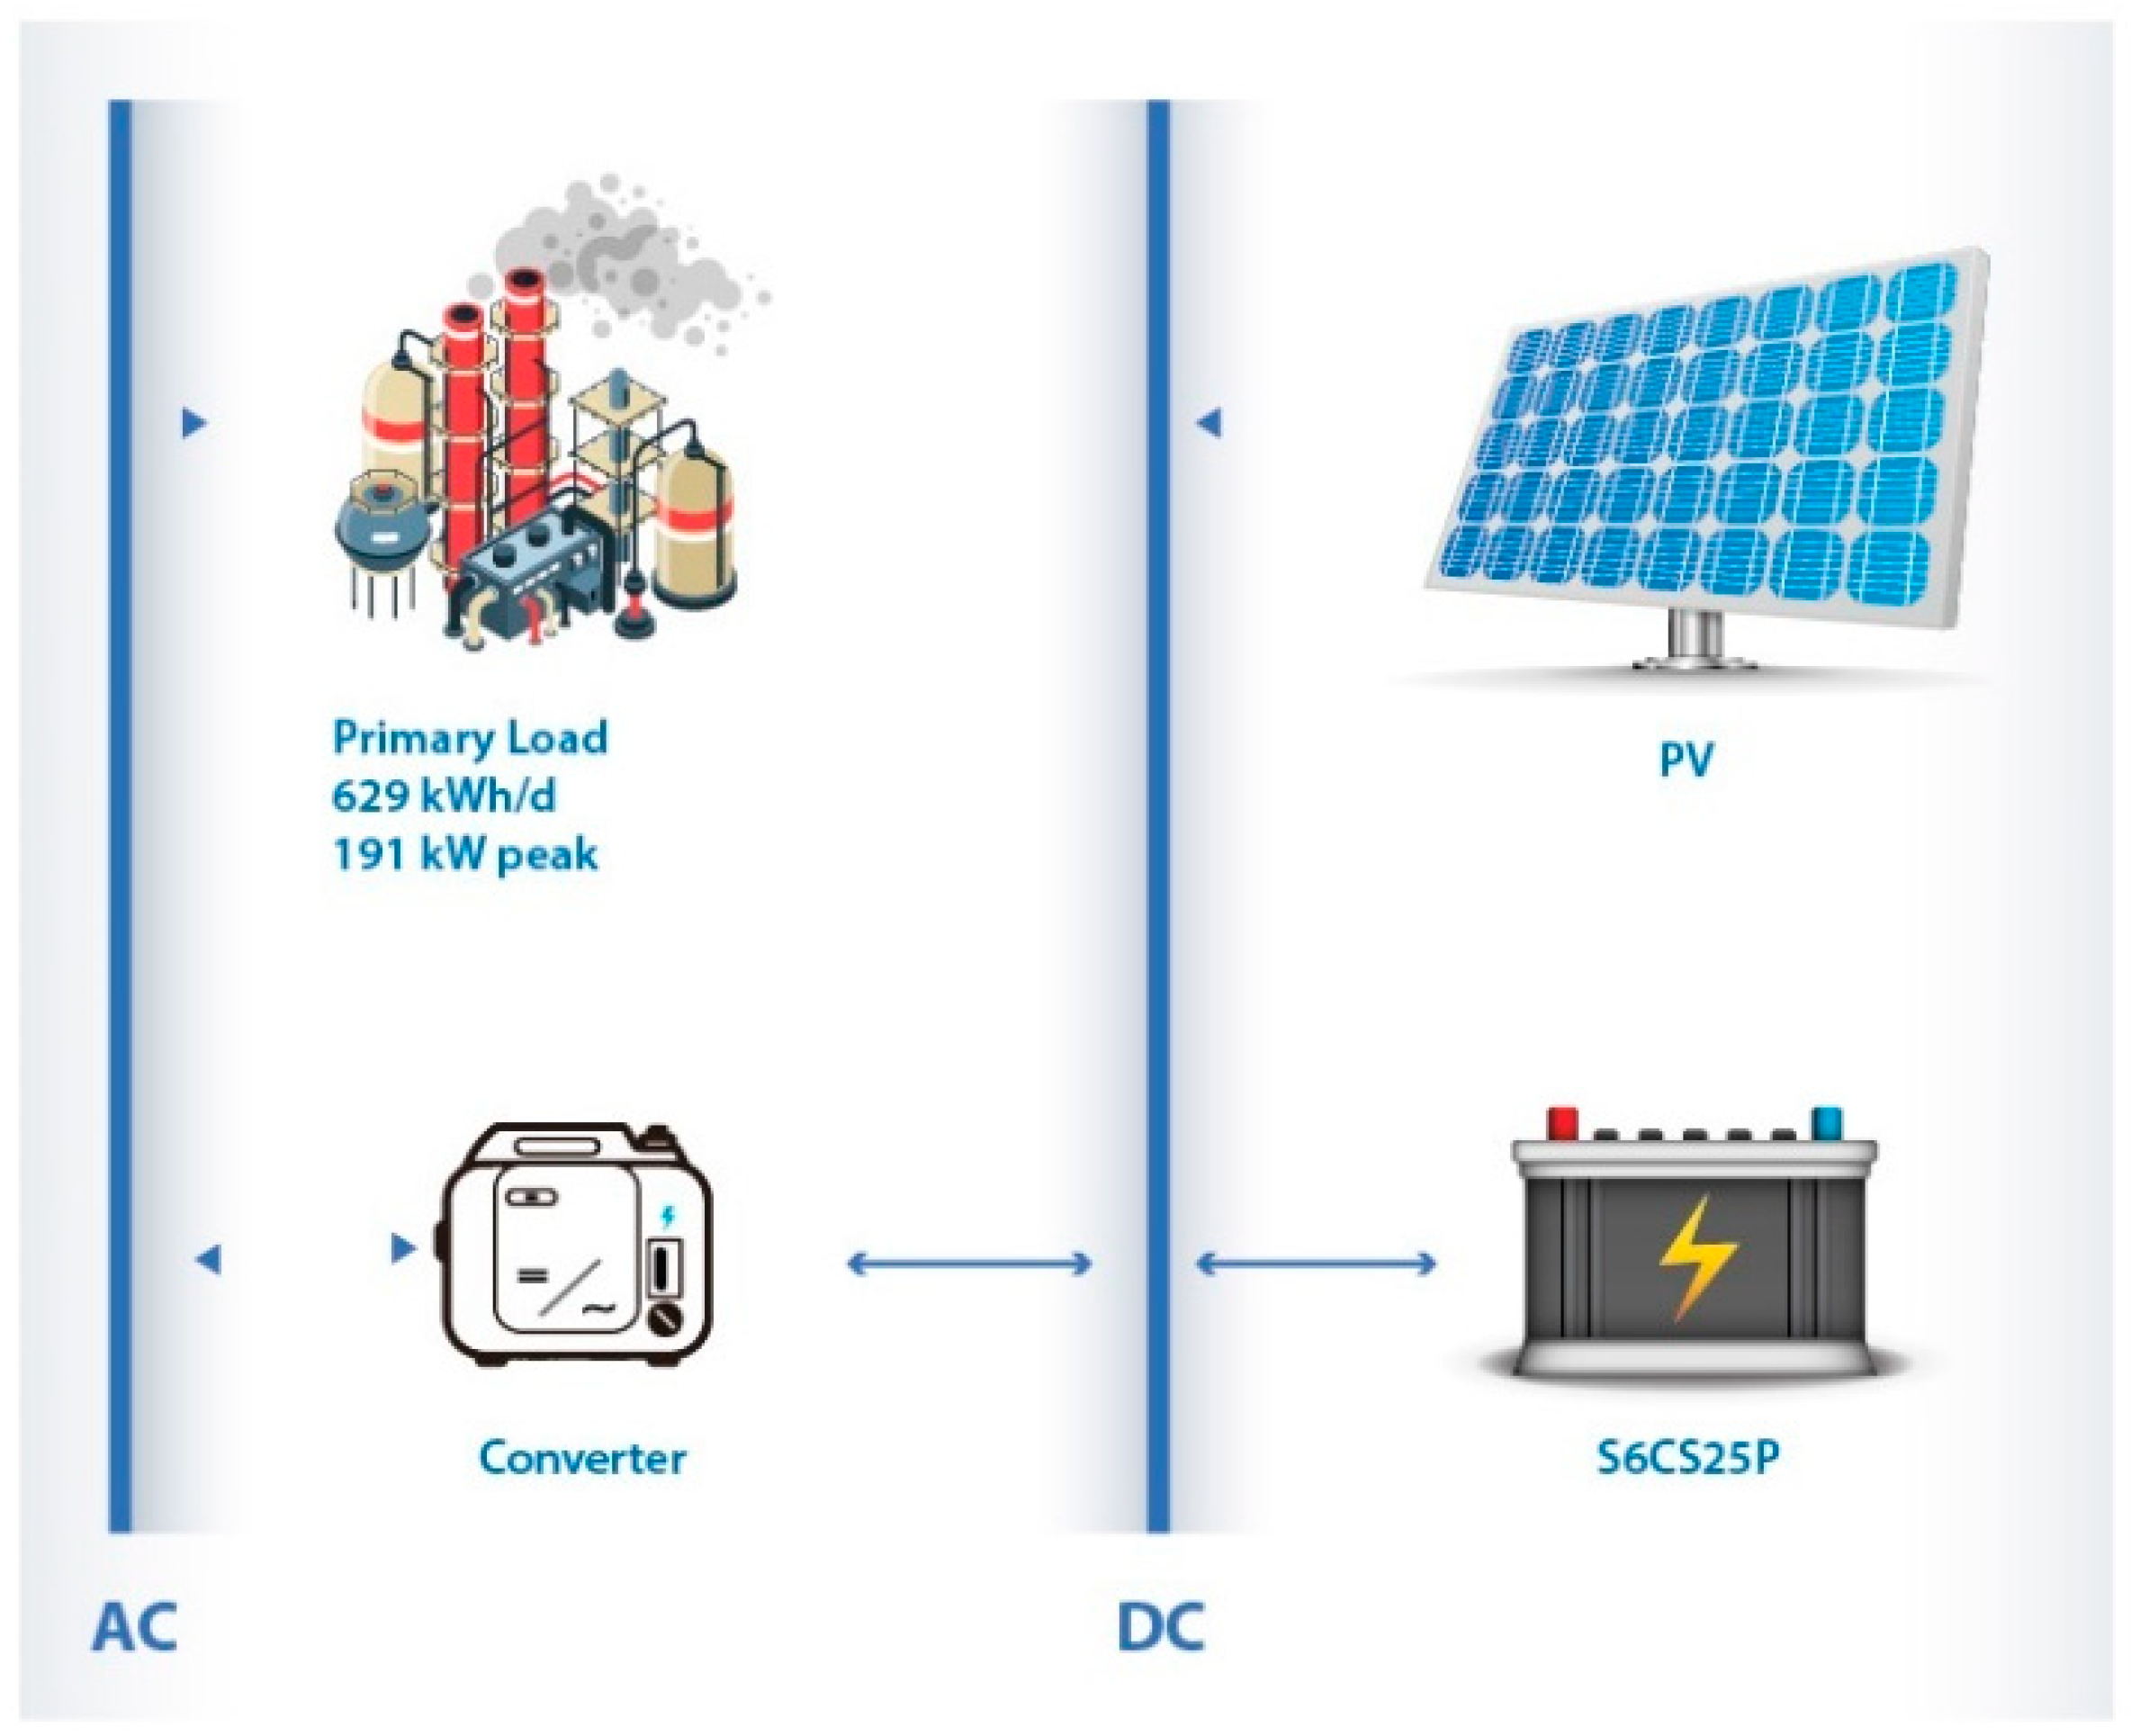
  • The PV plant only has an initial investment cost in the first year, t = 1. The cost is proportional to the peak power and was set to 1000 €/kWp.
  • Battery initial investment (Surette 4KS25P/6CS25P): 50 €/unit, where the battery is used to store energy when there is no solar resource available. Battery lifetime: 8 years.
  • Hybrid inverter initial investment: 150 €/kW.
  • The lifetime of the whole system was set in 25 years for the solar panels, 15 years for the inverter, 8 years for the battery, and 20 years for the pump and hydraulic system.
  • The annual energy production is according to the daily flow rate.
  • Discount rate.
  • Annual maintenance costs O   &   M t ( P V ) were considered to be 4.5% of the initial cost, an annual investment.
  • Annual maintenance costs O   &   M t ( B a t t e r y ) were considered as 5 €/year.
  • Inverter efficiency of 97% for all sizes was considered.
  • The primary load was considered to be between 9:00 and 15:00, the usual irrigation time.
Since Tenerife Island has different values of solar radiation depending on the geographical area, and wells have different technical characteristics, we established the LCOE costs by zones (box). Indeed, we defined a grid at the island level with quadrant areas of 16 km2. This grid will give a rough spatial cost resolution for specific geographical locations and finally at the more general island level.
To determine the LCOE cost per box, first we identified the number of wells per box, and from those, we identified the well with the highest ( E h 1 ) and the lowest ( E h 2 ) pumping energy demand (Equation (7)). Then, we obtained the L C O E 1 and L C O E 2 for the respective wells using HOMER. Based on the information obtained, we applied the following equation to obtain an average cost per area/frame selected:
L C O E ( A 1 ) = L C O E 1   E h 1 + L C O E 2   E h 2 E h 1 + E h 2 .

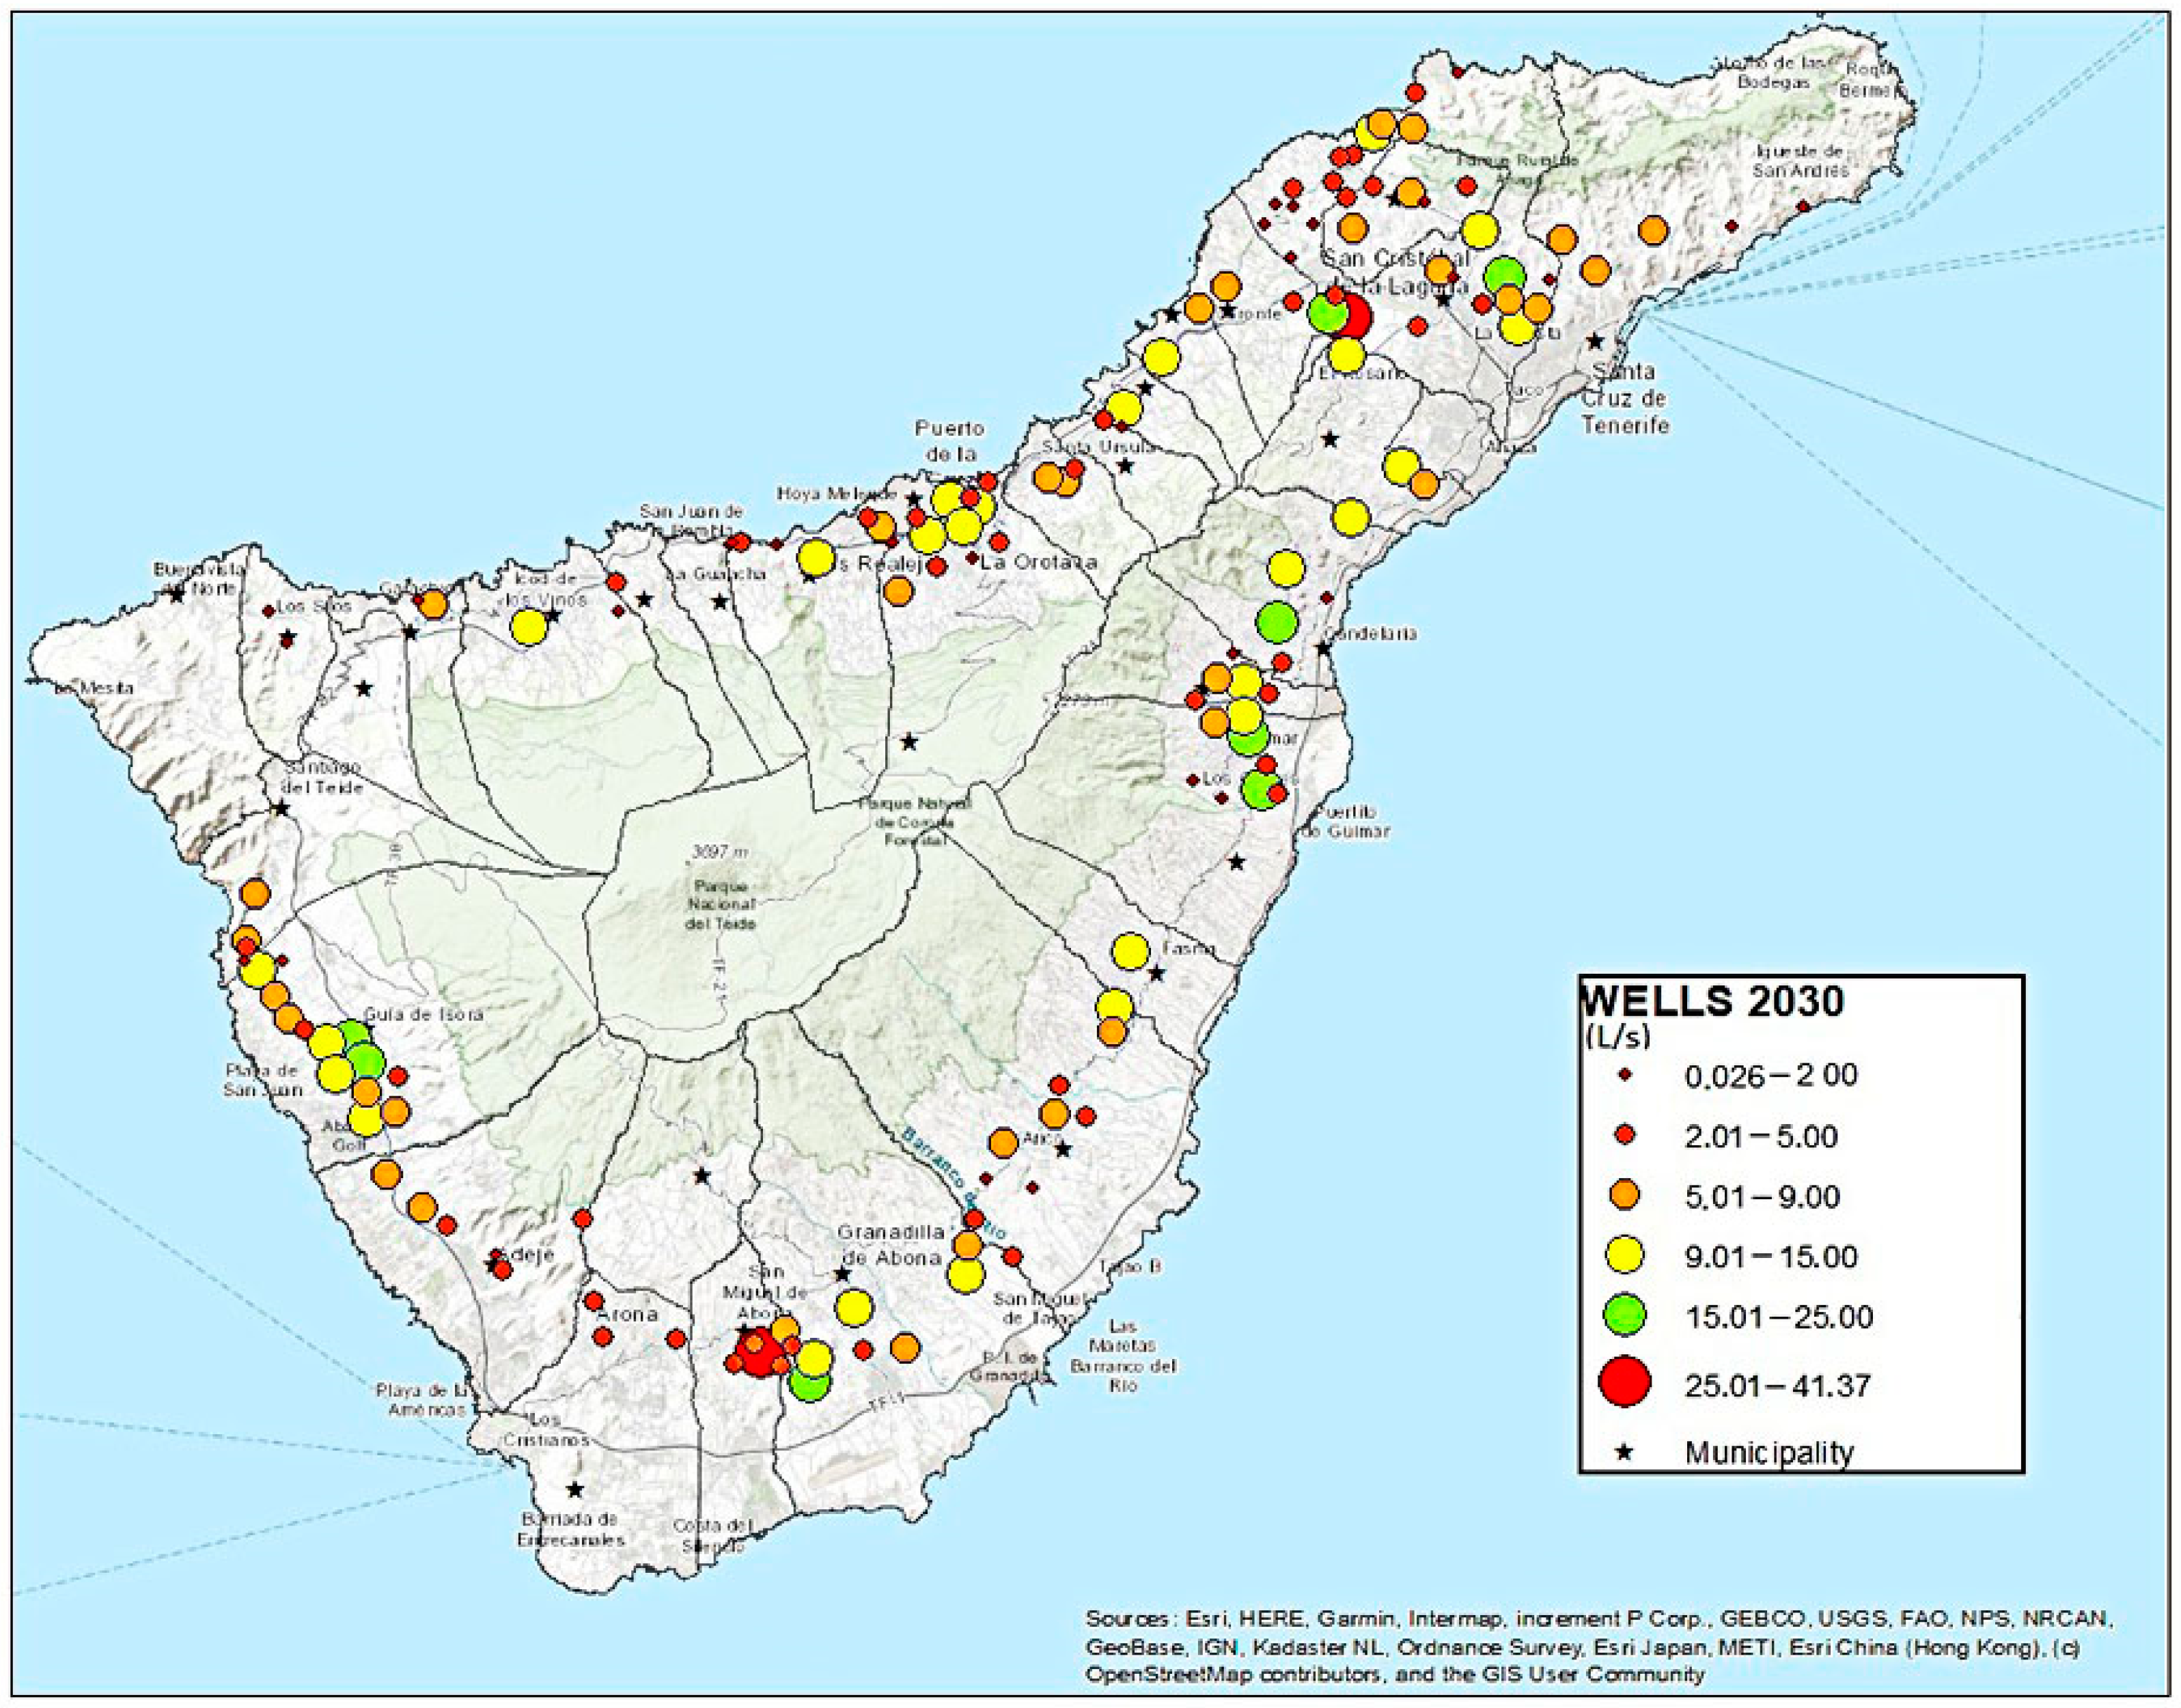
3.3. Water Resource Projection to 2030

The future groundwater production was calculated as follows: as a first step, based on the water resources provided in recent years, the groundwater trend was estimated from a linear regression. Once Equation (8) was obtained, it was possible to determine the linear flow rate for a given year in the future as:
W a b s t , X = 3.3983 · X + 168.56 ,
where W a b s t , X represents the groundwater pumped in Tenerife in Hm3.
Once the pumped groundwater was projected, we identified the ratio of water obtained from galleries and wells in recent years, shown in Section 2.2. Then, the water obtained from the wells for the future year ( W a b s t ( w ) ) was obtained by using Equation (9), where 0.30 is the historical ratio of water extracted from wells compared with the total groundwater abstracted:
W a b s t ( w ) = W a b s t · 0.30 .
Secondly, to know the water that will be supplied from each well in the future, it is important to know that due to topographic conditions, the flow, rainfall, climatology, among other variables, vary annually. Therefore, the first step was to obtain the flows contributed by each well in recent years (information obtained from [39]). After that, the proportion of water generated by each well was calculated for the different years in which the information was available.
With the above information, the water that will be generated by each well in the future was calculated using the following equation:
W a w i = Σ   r w w i ¯   ·   W a b s t ( w ) ,
where r w w i ¯ is the average proportion of water generated by each well during the years of study from the wells in Tenerife W a b s t ( w ) . This gave the water that will be generated by each well in future year W a w i , in Hm3.

4. Results and Discussion

4.1. PV Pumping for the Actual Scenario

Groundwater PV pumping consist of a PV array supported on a mechanical structure and an inverter, a submersible water pump, and batteries. These systems have a high front-end cost compared to diesel pumps, but the operation and maintenance costs are lower in the long term [50]. The productivity of these systems is affected by several factors, such as ambient temperature, maintenance of the panels in terms of cleanliness, and relative humidity of the air [51].
The capacity of the PV array of each well was determined from: (a) the productivity of each well (m3/day); (b) its depth (m); and (c) the solar radiation in the specific location (kWh/m2/day). Based on the initial characteristics and according to the methodology proposed in Section 3.1.1, we estimated the hydraulic energy required to pump the water from each well to evaluate the maximum power of the PV system (kWp).
Based on the above, Figure 10 shows the hydraulic energy for each well on the island, and Figure 11 shows the maximum capacity of the PV array (kWp). As specific cases, the Rodeo de la Paja and El Ramonal wells are the ones that require the largest hydraulic energy on the island (5848 and 3822 kWh/day). According to [46], San Diego, San Juan 2, and Viña Grande wells have the lowest radiation during the month of January/December, which increases the maximum power of the solar panels.

4.2. Required Surface Area

The PV panels occupy an area that depends on the surface power density of the available PV modules. Therefore, if 1 kWp corresponds to an area between 8 and 10 m2, the total PVWPS on the island would require a total area of 330,705 m2. To compare the surface requirements, to supply the energy for the residential sector on the island, 6.279 km2 of roof are required [52]. Figure 12 shows the approximate required surface area for each well.

4.3. LCOE Analysis

For the economic analysis, we established a grid of 16 km2 squares (boxes) on the island in order to determine an average LCOE value for each box, as specified in Section 3.2. This grid has a matrix of 19 × 19 squares (Figure 13). Each grid containing one or more wells was studied, resulting in a total of fifty-seven squares.
When running the HOMER model with the parameters described in the methodology, the average LCOE for a PV pumping system of the island was calculated at 0.2430 €/kWh. In comparison with the specified LCOE published in [51], the results obtained were higher, mainly due to the land price, the use of batteries as a storage system, and operation and maintenance costs. Figure 14 shows the number of wells per quadrant, and the LCOE, reporting 50.9% of the areas under study below the average value of the LCOE. On the contrary, as the well of Viña Grande registered very low solar radiation values in the winter season, it had the highest LCOE; 50.9% of the LCOE values ranged between 0.217 and 0.265 €/kWh.

4.4. 2030 Trend Scenario

The simulation model showed the results for a system composed of the photovoltaic array, batteries, and inverter for each quadrant under analysis. The variation in LCOE depended on the groundwater pump demands and the solar radiation of the area under study, varying between 0.179 and 0.290 €/kWh. It is important to note the price of land. According to [53], 1 hectare of land varies between €36,000 and €40,000. If the land is rented, the cost is between 1800 and 2300 €/ha per year. This cost was included in the model.
This approach was based on the socioeconomic context in Tenerife in 2019, but considering the evolution of the insular aquifers in recent years, a reduction of fresh groundwater is expected in the island. Then, the PV capacity defined could become over-dimensioned for 2030 and, consequently, not completely amortized.
Through deep analysis, according to the evolution of groundwater pumped from wells between 2000 and 2018, it is possible to identify how the behavior of each well would be in 2030. Although the variation of the flow depends on the pumping activity, the recharge time of the aquifers, or the type of service the water extraction gives, among others, it is possible to make a future estimate of the resource. Based on the evolution of the resources at the island level and using the methodology previously shown, it is estimated that in 2030 the freshwater resource provided by wells and galleries will be about 97.2 Hm3.
For future calculations, it is essential to know the variation of solar radiation, which is the main factor affecting changes in PV generation, as well as other atmospheric variables such as air temperature and wind speed. However, in Tenerife, the projected annual average changes in daily irradiation for the two future decades with respect to the current one are small and not statistically significant. However, if there were any increase such as the general increase expected in Spain at the peninsular level, it would be +2.3% [54], which would not affect the solar radiation in the Canary Islands.
With the reduction of freshwater in the wells by 42.7%, the pumping capacity required to extract water from the wells would be reduced by 41.9% by the year 2030. In fact, to accomplish the water demand, new extraction methods must be considered, as brackish, reuse [55], or desalination processes [56].
Therefore, to dampen the design, one proposal could be to inject the surplus energy produced annually by each solar pumping installation into the grid, according to the operation conditions and requirements [57], and to increase the renewable energy share, as has been proposed in similar islands [58].
The supply of electricity with PV or all groundwater pumping systems in Tenerife is an ambitious project but can help to reduce the CO2 emissions and should strengthen the water–energy nexus in municipalities, provide a strategy to promote the fulfillment of some of the SDG 2030, and contribute to manage a more sustainable water–energy system.
Taking into account the annual data on groundwater resources presented above and the distribution of production between wells and galleries, it is estimated that the flow provided by the wells for the year 2030 will be 29 Hm3, 41.0% less than the amount currently provided (Figure 15).

5. Conclusions

In this paper, the use of photovoltaic water pumping systems to obtain water from the wells in Tenerife, Canary Island, was analyzed. The PVWPS is proposed to pump small flows to accomplish the water demands of a specific region in the island, mainly due to the fact that it has an adequate cost and is environmentally sustainable. The current wells are connected to the island’s grid generation system, which has a renewable energy penetration of less than 20%. Therefore, in order to accomplish the European decarbonization objectives, this work demonstrates that this proposal can be completely feasible in Tenerife, both at present and in a future trend scenario, due to the solar resource. The methodology proposed in this paper can be easily applied to medium-sized islands with similar conditions. The results reveal a strong influence on the LCOE of the solar pumping system due to well location.
The results reveal that the average LCOE for a PV pumping groundwater system is 0.2430 €/kWh for the present and in the range of 0.179 to 0.290 €/kWh in the trend scenario to 2030. The LCOE values obtained for the island are slightly higher than the LCOE reported in the literature for mainland sites, mainly due to the price of land, being an island with limited space, and the inclusion of accumulation systems. However, in the path to decarbonize the electrical systems, the results show the feasibility of the proposal, completely oriented to accomplish the SDGs, reduce emissions, and mitigate the energy insecurity.

Author Contributions

Conceptualization, D.R.-U., B.G.-D. and L.R.-U.; methodology, D.R.-U. and B.G.-D.; software, D.R.-U.; validation, R.G.-L., B.G.-D. and L.R.-U.; formal analysis, D.R.-U.; investigation D.R.-U., B.G.-D. and L.R.-U.; resources, D.R.-U.; data curation, B.G.-D. and L.R.-U.; writing—original draft preparation, D.R.-U.; writing—review and editing, R.G.-L., B.G.-D. and L.R.-U.; visualization, L.R.-U.; supervision, R.G.-L. and B.G.-D.; project administration, B.G.-D.; funding acquisition, B.G.-D. All authors have read and agreed to the published version of the manuscript.

Funding

This research was funded by the CajaCanarias Foundation, grant number 2019SP25, and Cátedra de Medio Ambiente y Desarrollo Sostenible from the University of La Laguna.

Conflicts of Interest

The authors declare no conflict of interest.

References

  1. United Nations Population. Available online: https://www.un.org/en/global-issues/population (accessed on 12 March 2022).
  2. Pimentel, D.; Burgess, M. World Human Population Problems. In Encyclopedia of the Anthropocene; Dellasala, D.A., Goldstein, M.I., Eds.; Elsevier: Oxford, UK, 2018; pp. 313–317. ISBN 978-0-12-813576-1. [Google Scholar]
  3. Food and Agriculture Organization (FAO). El Estado de La Seguridad Alimentaria y La Nutrición en el Mundo 2019; FAO: Rome, Italy, 2019; ISBN 978-92-5-131600-9. [Google Scholar]
  4. UN-Water. Water for a Sustainable World (2022 Report). Available online: https://www.unwater.org/publications/un-world-water-development-report-2022 (accessed on 15 July 2022).
  5. WRI. Mexico Una Cuarta Parte de La Población Mundial Padece Escasez de Agua|WRI Mexico. Available online: https://wrimexico.org/bloga/una-cuarta-parte-de-la-poblaci%C3%83%C2%B3n-mundial-padece-escasez-de-agua#:~:text=Datos-arrojados-por-las-herramientas,en-promedio-cada-a%C3%83%C2%B1o%2Cm%C3%83%C2%A1s (accessed on 12 March 2022).
  6. Instituto de Recursos Mundiales. 17 Países, Hogar de Una Cuarta Parte de La Población Mundial, Enfrentan un Estrés Hídrico Extremadamente Alto. Available online: https://listindiario.com/la-vida/2022/03/22/714000/unos-17-paises-enfrentan-un-estres-hidrico-extremo-segun-estudio (accessed on 30 March 2022).
  7. WRI. Ranking the World’s Most Water-Stressed Countries in 2040|World Resources Institute. Available online: https://www.wri.org/insights/ranking-worlds-most-water-stressed-countries-2040 (accessed on 9 May 2022).
  8. WWAP. Informe Mundial de Las Naciones Unidas Sobre el Desarrollo de Los Recursos Hídricos 2019. No Dejar a Nadie Atrás. Available online: http://www.unwater.org/publications/world-water-development-report-2019/ (accessed on 20 April 2020).
  9. Jasechko, S.; Perrone, D. Global Groundwater Wells at Risk of Running Dry. Science 2021, 1979, 418–421. [Google Scholar] [CrossRef] [PubMed]
  10. Custodio, E.; del Carmen Cabrera, M.; Poncela, R.; Puga, L.-O.; Skupien, E.; del Villar, A. Groundwater Intensive Exploitation and Mining in Gran Canaria and Tenerife, Canary Islands, Spain: Hydrogeological, Environmental, Economic and Social Aspects. Sci. Total Environ. 2016, 557–558, 425–437. [Google Scholar] [CrossRef] [PubMed]
  11. Pétré, M.A.; Rivera, A.; Lefebvre, R. Numerical Modeling of a Regional Groundwater Flow System to Assess Groundwater Storage Loss, Capture and Sustainable Exploitation of the Transboundary Milk River Aquifer (Canada—USA). J. Hydrol. 2019, 575, 656–670. [Google Scholar] [CrossRef]
  12. Jasechko, S.; Perrone, D.; Seybold, H.; Fan, Y.; Kirchner, J.W. Groundwater Level Observations in 250,000 Coastal US Wells Reveal Scope of Potential Seawater Intrusion. Nat. Commun. 2020, 11, 3229. [Google Scholar] [CrossRef] [PubMed]
  13. Joaquín Melgarejo and Patricia Fernández-Aracil Congreso Nacional Del Agua Orihuela. Innovación y Sostenibilidad. In Proceedings of the Congreso Nacional del Agua Orihuela. Innovación y Sostenibilidad; Universitat d’Alacant: Alicante, Spain, 2019. [Google Scholar]
  14. Greenpeace La Incertidumbre Sobre el Robo del Agua: ¡Fíltrala! Available online: https://es.greenpeace.org/es/sala-de-prensa/documentos/la-incertidumbre-sobre-el-robo-del-agua-filtrala/ (accessed on 9 May 2022).
  15. Antony, S.; Dev, V.V.; Kaliraj, S.; Ambili, M.S.; Krishnan, K.A. Seasonal Variability of Groundwater Quality in Coastal Aquifers of Kavaratti Island, Lakshadweep Archipelago, India. Groundw. Sustain. Dev. 2020, 11, 100377. [Google Scholar] [CrossRef]
  16. Banks, E.W.; Post, V.E.A.; Meredith, K.; Ellis, J.; Cahill, K.; Noorduijn, S.; Batelaan, O. Fresh Groundwater Lens Dynamics of a Small Bedrock Island in the Tropics, Northern Australia. J. Hydrol. 2021, 595, 125942. [Google Scholar] [CrossRef]
  17. Werner, A.D.; Sharp, H.K.; Galvis, S.C.; Post, V.E.A.; Sinclair, P. Hydrogeology and management of freshwater lenses on atoll islands: Review of current knowledge and research needs. J. Hydrol. 2017, 551, 819–844. [Google Scholar] [CrossRef]
  18. Haffaf, A.; Lakdja, F.; Meziane, R.; Abdeslam, D.O. Study of Economic and Sustainable Energy Supply for Water Irrigation System (WIS). Sustain. Energy Grids Netw. 2021, 25, 100412. [Google Scholar] [CrossRef]
  19. Rubio-Aliaga, A.; García-Cascales, M.S.; Sánchez-Lozano, J.M.; Molina-Garcia, A. MCDM-Based Multidimensional Approach for Selection of Optimal Groundwater Pumping Systems: Design and Case Example. Renew. Energy 2021, 163, 213–224. [Google Scholar] [CrossRef]
  20. Aliyu, M.; Hassan, G.; Said, S.A.; Siddiqui, M.U.; Alawami, A.T.; Elamin, I.M. A Review of Solar-Powered Water Pumping Systems. Renew. Sustain. Energy Rev. 2018, 87, 61–76. [Google Scholar] [CrossRef]
  21. Muhsen, D.H.; Ghazali, A.B.; Khatib, T.; Abdulabbas, T.E. Techno-Economic Study and Optimal Sizing of a Stand-Alone Photovoltaic Water Pumping System. Int. Trans. Electr. Energy Syst. 2017, 27, e2355. [Google Scholar] [CrossRef]
  22. Ebaid, M.S.Y.; Qandil, H.; Hammad, M. A Unified Approach for Designing a Photovoltaic Solar System for the Underground Water Pumping Well-34 at Disi Aquifer. Energy Convers. Manag. 2013, 75, 780–795. [Google Scholar] [CrossRef]
  23. Khatib, T. Tamer Khatib Design of PV Water Pumping System at Minimum Cost for Palestine: A Review. J. Appl. Sci. 2010, 22, 2773–2784. [Google Scholar] [CrossRef] [Green Version]
  24. WRI. Domestic Water Use Grew 600% Over the Past 50 Years|World Resources Institute. Available online: https://www.wri.org/blog/2020/02/growth-domestic-water-use (accessed on 14 March 2021).
  25. Shi, F.; Zhao, C.; Zhao, X.; Zhou, X.; Li, X.; Zhu, J. Spatial Variability of the Groundwater Exploitation Potential in an Arid Alluvial-Diluvial Plain Using GIS-Based Dempster-Shafer Theory. Quat. Int. 2020, 571, 127–135. [Google Scholar] [CrossRef]
  26. Mostefaoui, Z.; Amara, S. Renewable Energy Analysis in the Agriculture–Greenhouse Farms: A Case Study in the Mediterranean Region (Sidi Bel Abbes, Algeria). Environ. Prog. Sustain. Energy 2019, 38, e13029. [Google Scholar] [CrossRef]
  27. Rubio-Aliaga, Á.; García-Cascales, M.S.; Sánchez-Lozano, J.M.; Molina-García, A. Multidimensional Analysis of Groundwater Pumping for Irrigation Purposes: Economic, Energy and Environmental Characterization for PV Power Plant Integration. Renew. Energy 2019, 138, 174–186. [Google Scholar] [CrossRef]
  28. Sarkar, M.N.I.; Ghosh, H.R. Techno-Economic Analysis and Challenges of Solar Powered Pumps Dissemination in Bangladesh. Sustain. Energy Technol. Assess. 2017, 20, 33–46. [Google Scholar] [CrossRef]
  29. Singh, D.B.; Mahajan, A.; Devli, D.; Bharti, K.; Kandari, S.; Mittal, G. A Mini Review on Solar Energy Based Pumping System for Irrigation. Mater. Today Proc. 2021, 43, 417–425. [Google Scholar] [CrossRef]
  30. Al-Smairan, M. Application of photovoltaic array for pumping water as an alternative to diesel engines in Jordan Badia, Tall Hassan station: Case study. Renew. Sustain. Energy Rev. 2012, 16, 4500–4507. [Google Scholar] [CrossRef]
  31. Jadhav, P.J.; Sawant, N.; Panicker, A.M. Technical Paradigms in Electricity Supply for Irrigation Pumps: Case of Maharashtra, India. Energy Sustain. Dev. 2020, 58, 50–62. [Google Scholar] [CrossRef]
  32. Verma, S.; Mishra, S.; Chowdhury, S.; Gaur, A.; Mohapatra, S.; Soni, A.; Verma, P. Solar PV Powered Water Pumping System—A Review. Mater. Today Proc. 2020, 46, 5601–5606. [Google Scholar] [CrossRef]
  33. Gupta, E. The Impact of Solar Water Pumps on Energy-Water-Food Nexus: Evidence from Rajasthan, India. Energy Policy 2019, 129, 598–609. [Google Scholar] [CrossRef]
  34. Insituto Canario de Estadística. Anuario Energético de Canarias. Available online: http://www.gobiernodecanarias.org/istac/jaxi-istac/menu.do?uripub=urn:uuid:131cf873-66a9-408d-8cfa-537d6be05067 (accessed on 1 June 2021).
  35. Life, T. 100% Tenerife Tourism—Tourism Research. Available online: https://www.webtenerife.com/investigacion/situacion-turistica/turismo-cifras/?page-index=4 (accessed on 9 June 2020).
  36. Santana, L.M.; Hern, R.E.Z.S.; Primavera, N.B. Precipitaciones Anuales Siglo XXI en Tenerife Segunda Parte. Available online: https://www.museosdetenerife.org/muna-museo-de-naturaleza-y-arqueologia/wp-content/uploads/sites/2/2021/01/LLUVIA-SIGLO-XXI-TENERIFE-SEGUNDA-PARTE-FINAL-MUNA-1-1.pdf (accessed on 9 May 2022).
  37. Consejo Insular de Aguas de Tenerife. Plan Hidrológico de Tenerife. Available online: https://www.aguastenerife.org/index.php?option=com_content&view=article&id=138&Itemid=1675 (accessed on 7 November 2021).
  38. Informe Rodeo de La Paja. Available online: https://www.tenerife.es/portalcabtfe/images/articulos/CEAT/Informe_Rodeo_de_la_Paja_web.report.pdf (accessed on 14 April 2021).
  39. Consejo Insular de Aguas de Tenerife. Obras de Captación de Aguas Subterráneas. Arcgis. Available online: https://www.arcgis.com/home/item.html?id=cda91956bd2541dca14236459219dcd6 (accessed on 9 September 2021).
  40. Domingoz Méndez, J. Agricultura en Tenerife: El Campo de Tenerife Ha Perdido Más de 7000 Hectáreas en Los Últimos Doce Años. Available online: https://www.eldia.es/tenerife/2021/05/02/campo-tinerfeno-perdido-7-000-50335757.html (accessed on 16 June 2021).
  41. CIATF. Análisis Económico y Recuperación de Costes Según Directiva Marco del Agua. Available online: https://www.aguastenerife.org/images/pdf/PHT1erCiclo/I-DocumentoInformacion/I-2-Anejos/I-2-Anejo2-DMAArt9-AnalisisEcRecuperacionCostes.pdf (accessed on 9 May 2022).
  42. Hernández, C.M. Recomendaciones de Riego en Tenerife. Available online: https://wapps001.uimp.es/uxxiconsultas/ficheros/5/22732Recomendaciones_de_riego_en_platanera_en_Tenerife.pdf (accessed on 9 May 2022).
  43. Ritter, A.; Machín, N. Nuevas Tecnologías Para Riego Sostenible en Platanera. Available online: https://www.icia.es/icia/download/suelosyriegos/Ritter_CanariasAgr_y_Pesq.pdf (accessed on 9 May 2022).
  44. Traxco. Análisis de Los Diferentes Sistemas de Riego del Plátano. Available online: https://www.traxco.es/blog/tecnologia-del-riego/riego-del-platano (accessed on 25 January 2022).
  45. Servicio_de_Planificación_Ordenación_Rural. Informe Estadistico. Mapa de Cultivos de Tenerife. Available online: https://www.gobiernodecanarias.org/agricultura/temas/mapa_cultivos/ (accessed on 9 May 2022).
  46. IDECanarias Visor 4.5.1. Available online: https://visor.grafcan.es/visorweb/ (accessed on 15 April 2021).
  47. Gumede, T.G.; Zau, A.T.P.; Malatji, M.J.; Daniel Chowdhury, S.P. Design of Stand-Alone Solar PV System to Pump Water to the Mtubatuba Village. In Proceedings of the IEEE AFRICON Conference 2019, Accra, Ghana, 25–27 September 2019. [Google Scholar] [CrossRef]
  48. UNEF. El Tiempo De La Energía Solar Fotovoltaica. Available online: www.unef.es (accessed on 31 March 2022).
  49. Cirés, E.; Marcos, J.; de la Parra, I.; García, M.; Marroyo, L. The Potential of Forecasting in Reducing the LCOE in PV Plants under Ramp-Rate Restrictions. Energy 2019, 188, 116053. [Google Scholar] [CrossRef]
  50. Closas, A.; Rap, E. Solar-Based Groundwater Pumping for Irrigation: Sustainability, Policies, and Limitations. Energy Policy 2017, 104, 33–37. [Google Scholar] [CrossRef]
  51. Pérez, J.C.; González, A.; Díaz, J.P.; Expósito, F.J.; Felipe, J. Climate Change Impact on Future Photovoltaic Resource Potential in an Orographically Complex Archipelago, the Canary Islands. Renew. Energy 2019, 133, 749–759. [Google Scholar] [CrossRef]
  52. Schallenberg-Rodríguez, J. Photovoltaic Techno-Economical Potential on Roofs in Regions and Islands: The Case of the Canary Islands. Methodological Review and Methodology Proposal. Renew. Sustain. Energy Rev. 2013, 20, 219–239. [Google Scholar] [CrossRef]
  53. Ramón Vozmediano, J. Cebrián Expansión y Características de Los «Huertos Solares»|Negocio Inmobiliario. Available online: https://negocioinmo.com/expansion-y-caracteristicas-de-los-huertos-solares/ (accessed on 28 June 2022).
  54. Sanchez-Lorenzo, A.; Calbó, J.; Wild, M. Global and Diffuse Solar Radiation in Spain: Building a Homogeneous Dataset and Assessing Their Trends. Glob. Planet. Chang. 2013, 100, 343–352. [Google Scholar] [CrossRef]
  55. Rodríguez-Urrego, D.; Cañadillas-Ramallo, D.; González-Díaz, B.; Guerrero-Lemus, R. Analysis of the Water-Energy Nexus Applied to an Insular System: Case Study of Tenerife. Sustainability 2022, 14, 1653. [Google Scholar] [CrossRef]
  56. Rosales-Asensio, E.; García-Moya, F.J.; González-Martínez, A.; Borge-Diez, D.; de Simón-Martín, M. Stress Mitigation of Conventional Water Resources in Water-Scarce Areas through the Use of Renewable Energy Powered Desalination Plants: An Application to the Canary Islands. Energy Rep. 2020, 6, 124–135. [Google Scholar] [CrossRef]
  57. Berna-Escriche, C.; Vargas-Salgado, C.; Alfonso-Solar, D.; Escrivá-Castells, A. Can a Fully Renewable System with Storage Cost-Effectively Cover the Total Demand of a Big Scale Standalone Grid? Analysis of Three Scenarios Applied to the Grand Canary Island, Spain by 2040. J. Energy Storage 2022, 52, 104774. [Google Scholar] [CrossRef]
  58. Cabrera, P.; Carta, J.A.; Lund, H.; Thellufsen, J.Z. Large-Scale Optimal Integration of Wind and Solar Photovoltaic Power in Water-Energy Systems on Islands. Energy Convers. Manag. 2021, 235, 113982. [Google Scholar] [CrossRef]
Figure 1. Municipalities and location of Tenerife. Source: Own elaboration.
Energies 15 05635 g001
Figure 2. Water extraction from wells and galleries between 2010 and 2019. Data obtained from [37].
Energies 15 05635 g002
Figure 3. Number of wells according to flow (L/s) 2005–2019. The red rectangle indicate the number of wells with flow between 10 and 25 L/s. Source: Own elaboration.
Energies 15 05635 g003
Figure 4. Total groundwater flow (G.F.) according to flow intervals (L/s) 2005–2019. The red rectangle indicate the groundwater flow (L/s) from wells with flow between 10 and 25 L/s Source: Own elaboration.
Energies 15 05635 g004
Figure 5. Fresh ground wells in 2019. Source: Own elaboration.
Energies 15 05635 g005
Figure 6. Distribution of the cultivated land in Tenerife. Source: Own elaboration according to [45].
Energies 15 05635 g006
Figure 7. Global radiation in Tenerife and the area where most PV plants are located. Source: Own elaboration from the available data in [46].
Energies 15 05635 g007
Figure 8. Flow chart of the steps of the proposed methodology for the 2030 scenario.
Energies 15 05635 g008
Figure 9. Flow chart of the steps of the proposed methodology for the 2030 scenario. System diagram used for simulation in HOMER software.
Energies 15 05635 g009
Figure 10. Electric energy per day required by each well under study for pumping water. Source: Own elaboration.
Energies 15 05635 g010
Figure 11. Minimum PV capacity for each well under study. Source: Own elaboration.
Energies 15 05635 g011
Figure 12. Surface area occupied (m2) required by the PV array (2019). Source: Own elaboration.
Energies 15 05635 g012
Figure 13. Grid of 16 km2 squares placed for the spatial analysis of the LCOE for PV pumping systems. Source: Own elaboration.
Energies 15 05635 g013
Figure 14. Distribution of LCOE for PV pumping systems and location of the related wells in Tenerife.
Energies 15 05635 g014
Figure 15. Water supply from wells on Tenerife Island in 2030.
Energies 15 05635 g015
Table 1. Number of wells and galleries by municipality (2019). Data obtained from [37].
MunicipalityGalleriesWellsMunicipalityGalleriesWells
NumberHm3NumberHm3NumberHm3NumberHm3
Adeje322.00261.57Los Realejos1689.8160.87
Arafo413.07101.84El Rosario 361.0381.87
Arico734.66232.65El Tanque122.6900.00
Arona92.04320.51Los Silos291.5190.10
Buenavista del Norte431.1870.00La Victoria de Acentejo181.6050.29
Candelaria392.42101.56Puerto de la Cruz10.87131.90
Fasnia202.9860.74San Juan de la Rambla281.1710.00
Garachico252.3790.44San Miguel10.06141.87
Granada de Abona370.61364.05Santa Cruz de Tenerife521.33300.99
Guía de Isora509.81276.47Santa Úrsula362.3870.84
Güímar403.69233.55Santiago del Teide302.8890.81
Icod de los Vinos415.08120.92Sauzal191.0520.92
La Guancha2311.2940.22Tacoronte240.6430.63
La Laguna400.90439.87Tegueste190.0871.21
La Matanza de Acentejo121.4830.49Vilaflor370.6640.00
La Orotava8611.22123.66
Publisher’s Note: MDPI stays neutral with regard to jurisdictional claims in published maps and institutional affiliations.

