Article

Effect of Temperature Gradient on Chloride Ion Diffusion in Nuclear Reactor Containment Building Concrete

1
Emirates Nuclear Technology Center, Khalifa University of Science and Technology, Abu Dhabi 127788, United Arab Emirates
2
Department of Nuclear Engineering, Khalifa University of Science and Technology, Abu Dhabi 127788, United Arab Emirates
3
Department of Civil Infrastructure and Environmental Engineering, Khalifa University of Science and Technology, Abu Dhabi 127788, United Arab Emirates
4
Department of Chemistry, Khalifa University of Science and Technology, Abu Dhabi 127788, United Arab Emirates
5
Department of Chemical Engineering, Khalifa University of Science and Technology, Abu Dhabi 127788, United Arab Emirates
*
Author to whom correspondence should be addressed.
Energies 2022, 15(15), 5581; https://doi.org/10.3390/en15155581
Submission received: 26 June 2022 / Revised: 15 July 2022 / Accepted: 18 July 2022 / Published: 1 August 2022
(This article belongs to the Special Issue New Challenges in Nuclear Energy Systems)

Abstract

:
Chloride diffusion through concrete is influenced by harsh environmental conditions such as high ambient temperature and relative humidity. This paper examined the influence of temperature gradient on chloride diffusion in concrete under high ambient temperature conditions. Chloride diffusion tests using cylindrical concrete samples were performed in constant temperature and temperature gradient conditions. In a temperature gradient condition, a much higher chloride concentration was measured than at constant temperatures, which could not be explained only by the mass diffusion driven by the concentration gradient. A new analytical model of chloride diffusion with the mass diffusion term including the temperature effect and the thermo-diffusion term including the temperature gradient effect was applied to the results, which showed that the thermo-diffusion contribution was significant. Using the analytical model with the mass diffusion (DCl) and thermo-diffusion (DT) coefficients, the service life of reactor containment buildings (RCBs) in nuclear power plants (NPPs) in the Middle Eastern and North African (MENA) region was estimated. The results showed that the service life of the RCBs could be reduced by the temperature gradient, indicating the possible application of the proposed analytical model.

1. Introduction

The reactor containment buildings (RCBs) in nuclear power plants (NPPs) play an important role as the last barrier to the release of radioactive materials. For this reason, it is essential to ensure the integrity of RCBs. Like other materials in NPPs, RCBs suffer from various degradation mechanisms. Alhanaee et al. [1] performed a finite element analysis using ABAQUS to evaluate the effects of different degradation mechanisms on the integrity of RCBs. One of the main conclusions of their study was that rebar corrosion could be the most influential degradation mechanism. The corrosion of rebar in concrete structures is mainly caused by carbonation and chloride ion (Cl-) ingress [2,3,4,5,6]. Since most NPPs are located in coastal areas due to the supply of cooling water, it has been known that RCBs are prone to chloride-induced corrosion due to airborne salts [7]. Moreover, the degradation of RCBs in the Middle East and North Africa (MENA) region could be more severe, being exposed to the harsh environments of high temperatures and high relative humidity compared with other areas [8].
The chloride diffusion behavior through concrete is affected by environmental factors and by internal factors. Ambient temperature and relative humidity are the major environmental factors that directly affect the diffusion behavior of chloride diffusion [9,10]. The internal factors such as pore microstructure and pore moisture distribution of concrete determine paths for ionic transport. The relationship of chloride diffusion behavior with pore scale and connectivity has been investigated [11,12]. While the pore microstructure is determined by concrete mixture and production, the effect of water-to-cement ratio, aggregate size, and mix ratio on chloride diffusion have been investigated [13,14,15,16,17]. Climent et al. [18] and de Vera et al. [19] suggested a test method for measuring chloride diffusion coefficients through partially saturated concrete. Zhang et al. [20,21] presented an analytical model for predicting the relative chloride diffusion coefficient at different degrees of water saturation and pore structure. Abdelahman and Xi [15] performed an experimental study to investigate the effect of the water-to-cement ratio variation and the aggregate volume fraction on chloride diffusion coefficient in non-saturated conditions. This study focuses on examining the effect of the temperature gradient on chloride diffusion in concrete structures, with the goal of predicting the service life of RCBs in NPPs under harsh environmental conditions in the MENA region.
Many studies have used Fick’s laws of diffusion to evaluate the kinetics of chloride ion diffusion in concrete under constant temperature [9,10,17,22,23,24,25]. Recently, Isteita and Xi [26] performed chloride diffusion experiments using a new method to evaluate the temperature gradient effect on chloride diffusion through concrete and developed a theoretical model characterizing the coupled chloride penetration and temperature gradient. However, in their experiments, the mass diffusion expressed by Fick’s law of diffusion was evaluated by test data only at room temperature, and therefore the temperature effect on the mass diffusion was not considered. For this reason, the coupling parameter, DCl-T, in their model does not seem to accurately represent the temperature gradient effect on chloride diffusion, and it is questionable if their model could be applied to the life prediction of concrete structures under temperature gradient conditions.
In this study, an experimental setup was established for chloride diffusion tests using cylindrical concrete samples under high ambient temperature and temperature gradient conditions. Moreover, we proposed a new analytical model with the mass diffusion term including the temperature effect and the thermo-diffusion term including the temperature gradient effect. The mass diffusion and thermo-diffusion coefficients were determined from chloride diffusion using concrete in constant temperature and temperature gradient conditions, respectively. The tests were conducted in the fully saturated condition of concrete pores to exclusively evaluate the effect of the temperature gradient on the diffusion coefficients. In addition, the elevated concentration (6.14 M) of NaCl solution was used for the accelerated diffusion tests. By applying the analysis results to the structure variables of RCB in APR 1400 NPP, the effect of the temperature gradient on its service life was evaluated.

2. Materials and Methods

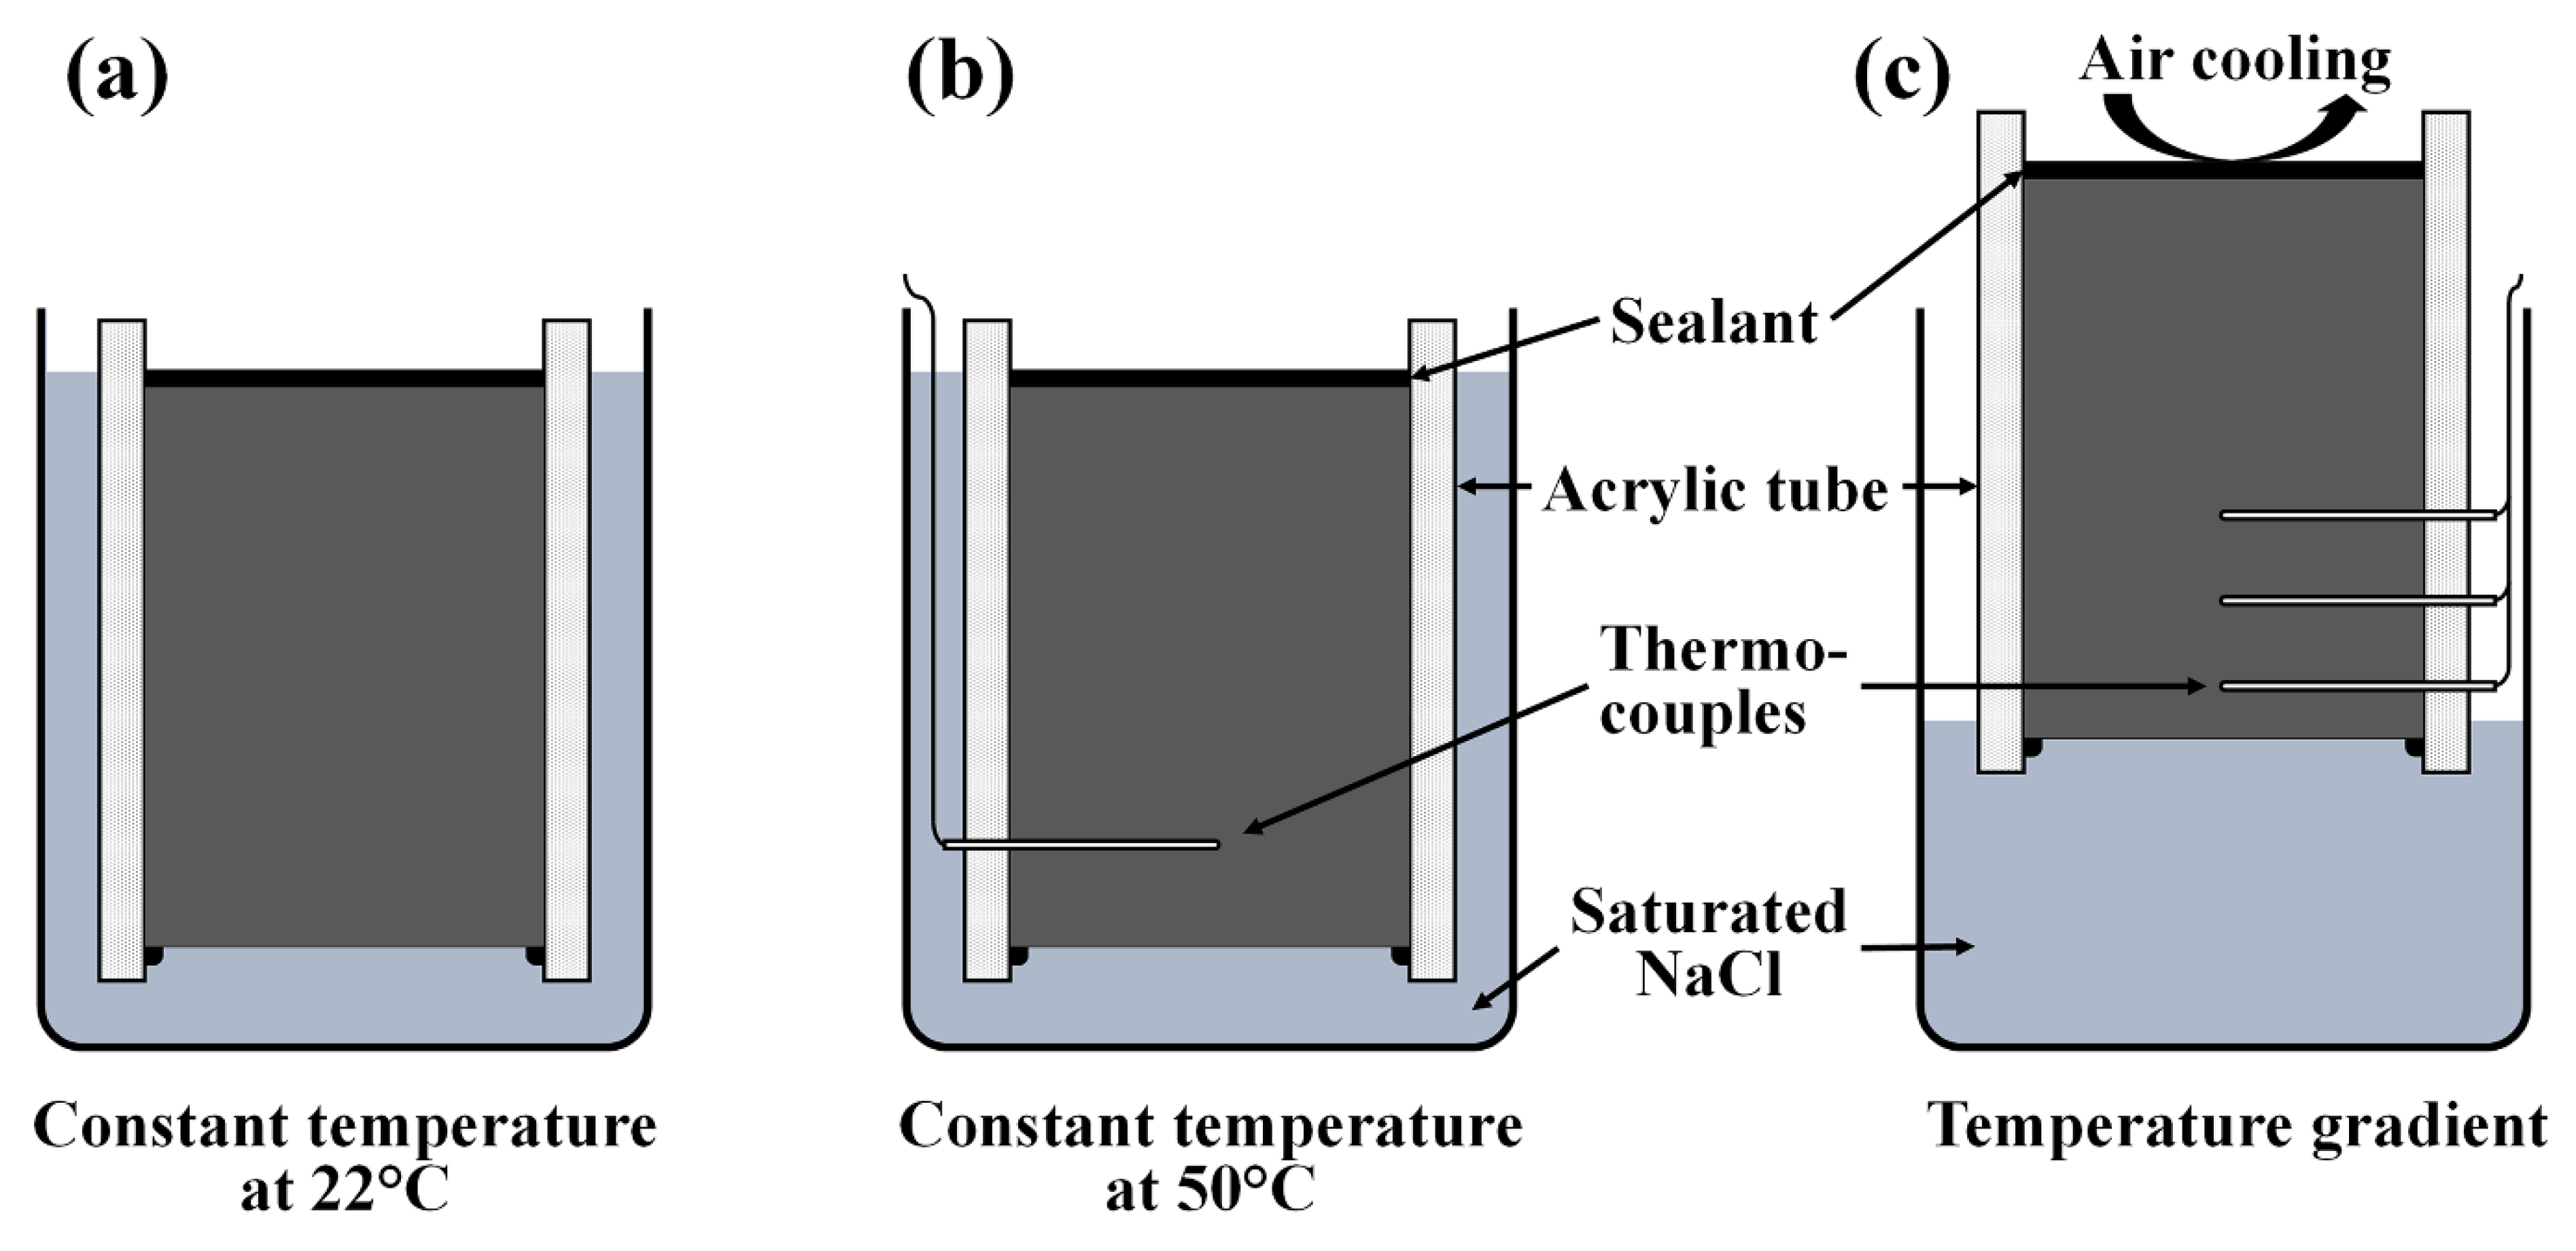
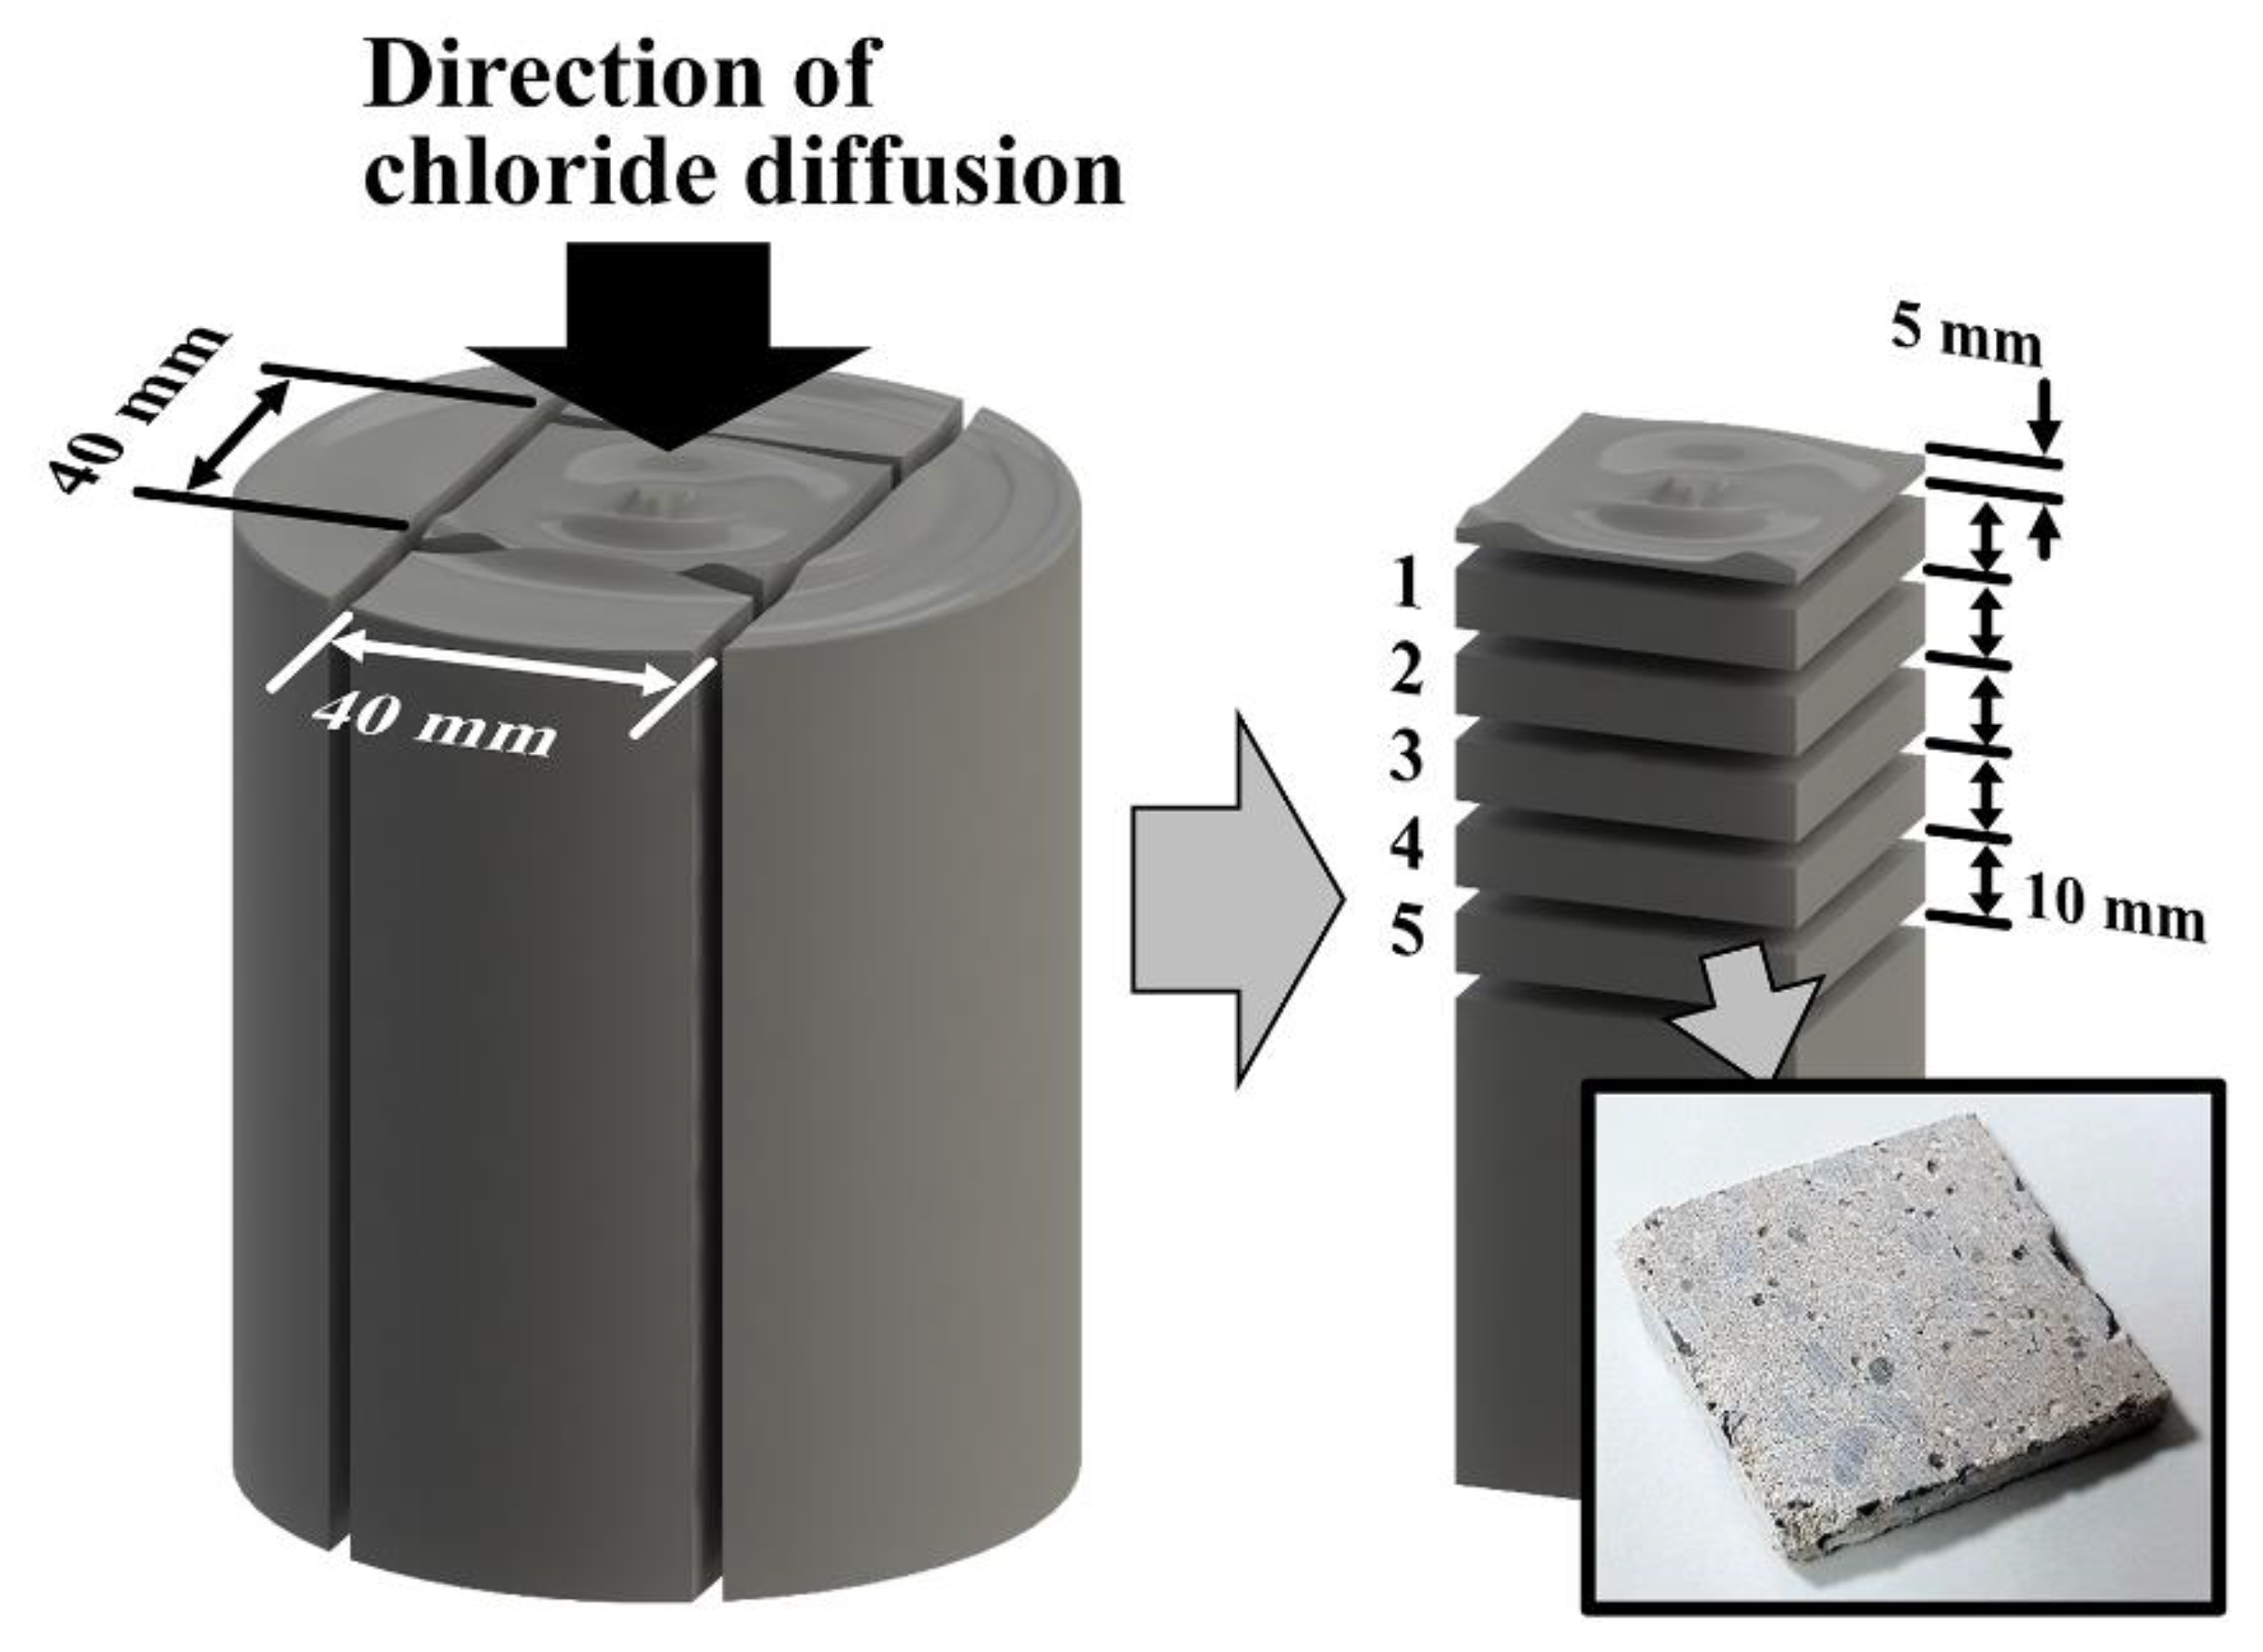
2.1. Concrete and Test Samples

Cylindrical concrete samples with a diameter of 96 mm and a height of 80 mm were cast using acryl tubes as a mold. The proportions of the concrete mixture are shown in Table 1. The water-to-cement ratio (w/c ratio) and density were 0.6 and 2258 (±36) kg/m3, respectively. After the concrete samples were cast, slump tests were performed according to ACI 211.1-91. The slump value was recorded as ~4 inches, which falls into the recommended slumps for beams, reinforced walls, and building columns (Table 6.31 of ACI 211.1-91). The concrete cylinders were kept at the atmospheric condition in the lab for 24 h and were cured at room temperature for 30 days in saturated lime water ((Ca(OH)2).

2.2. Chloride Diffusion Tests

The chloride diffusion tests were performed in a fully saturated concrete pore condition. After curing, the concrete cylinders were reinserted into 100 mm long acryl tubes to simulate one-directional diffusion of chloride. Silicone sealant was used for sealing the gap between the cylinder and the tube on the exposed bottom surfaces. The entire top surfaces of the cylinders were also sealed with the sealant to prevent the evaporation of the pore solution, and the opened areas of the solution baths were also covered with PVC films.
Samples were exposed to the NaCl solution at three different temperature conditions: (i) constant temperature at 22 °C (CT22); (ii) constant temperature at 50 °C (CT50); (iii) and temperature gradient condition (TG) as shown in Figure 1. In the cases of CT22 and CT50, the samples were submerged in the solution up to the sample height. For the TG condition, the sample was fixed over the solution, with the bottom surface immersed in the solution. The sealed surface of the TG sample was air-cooled with a fan. The temperatures at 10 mm, 30 mm, and 50 mm depths from the exposed bottom surface were monitored during the test using thermocouples. Two samples were tested per condition, and the test duration was 30 days.

2.3. Chloride Ion Analysis

After the chloride diffusion tests in the previous section, concrete samples were sliced into five layers with a 10 mm interval after removing 5 mm of the surface layer (Figure 2) by using an electrical cutting wheel without using any liquid suspension to prevent the loss of chloride contents during the process. The slices had 7 mm thicknesses due to the cutting margin, which represent depths of 10~50 mm ± 3.5 mm. The sliced samples were pulverized with a sledgehammer and sieved to powder sized under 850 μm.
The chloride concentration of each depth was determined by using the potentiometric titration method, specified in ASTM C1152/1152M-04(2012)e1 [27]. The potentiometric titration was performed using the open circuit potential measurement with an AgCl-coated Ag billet electrode and saturated calomel electrode (SCE) as a reference electrode without the filtration of powder [28]. Approximately 5 g of powdered samples were dispersed into 75 mL of deionized water, and 25 mL of nitric acid (1 + 1) was added. Samples were heated to boiling for a few seconds and were cooled down to room temperature. While gradually adding the standardized 0.05 N silver nitrate (AgNO3) solution using a burette with a 0.05 mL increment, the volume of consumed AgNO3 solution and the corresponding potential readings were recorded. The chloride concentrations of samples were calculated from the volume of consumed AgNO3 solution to meet the equivalence point of potential change. The equivalence point of potential change was determined by the first derivate curve of the potential recording. At the equivalent point, the open circuit potential was around 230 mV.
C C l = V A g N O 3 × N A g N O 3 × m C l m c o n c r e t e
where CCl is the chloride concentration (wt. % of concrete), V A g N O 3 is the consumed volume of AgNO3, N A g N O 3 is the normality of the AgNO3 solution, m C l is the molar mass of chloride, and m c o n c r e t e is the mass of the analyzed concrete.

3. Results and Discussion

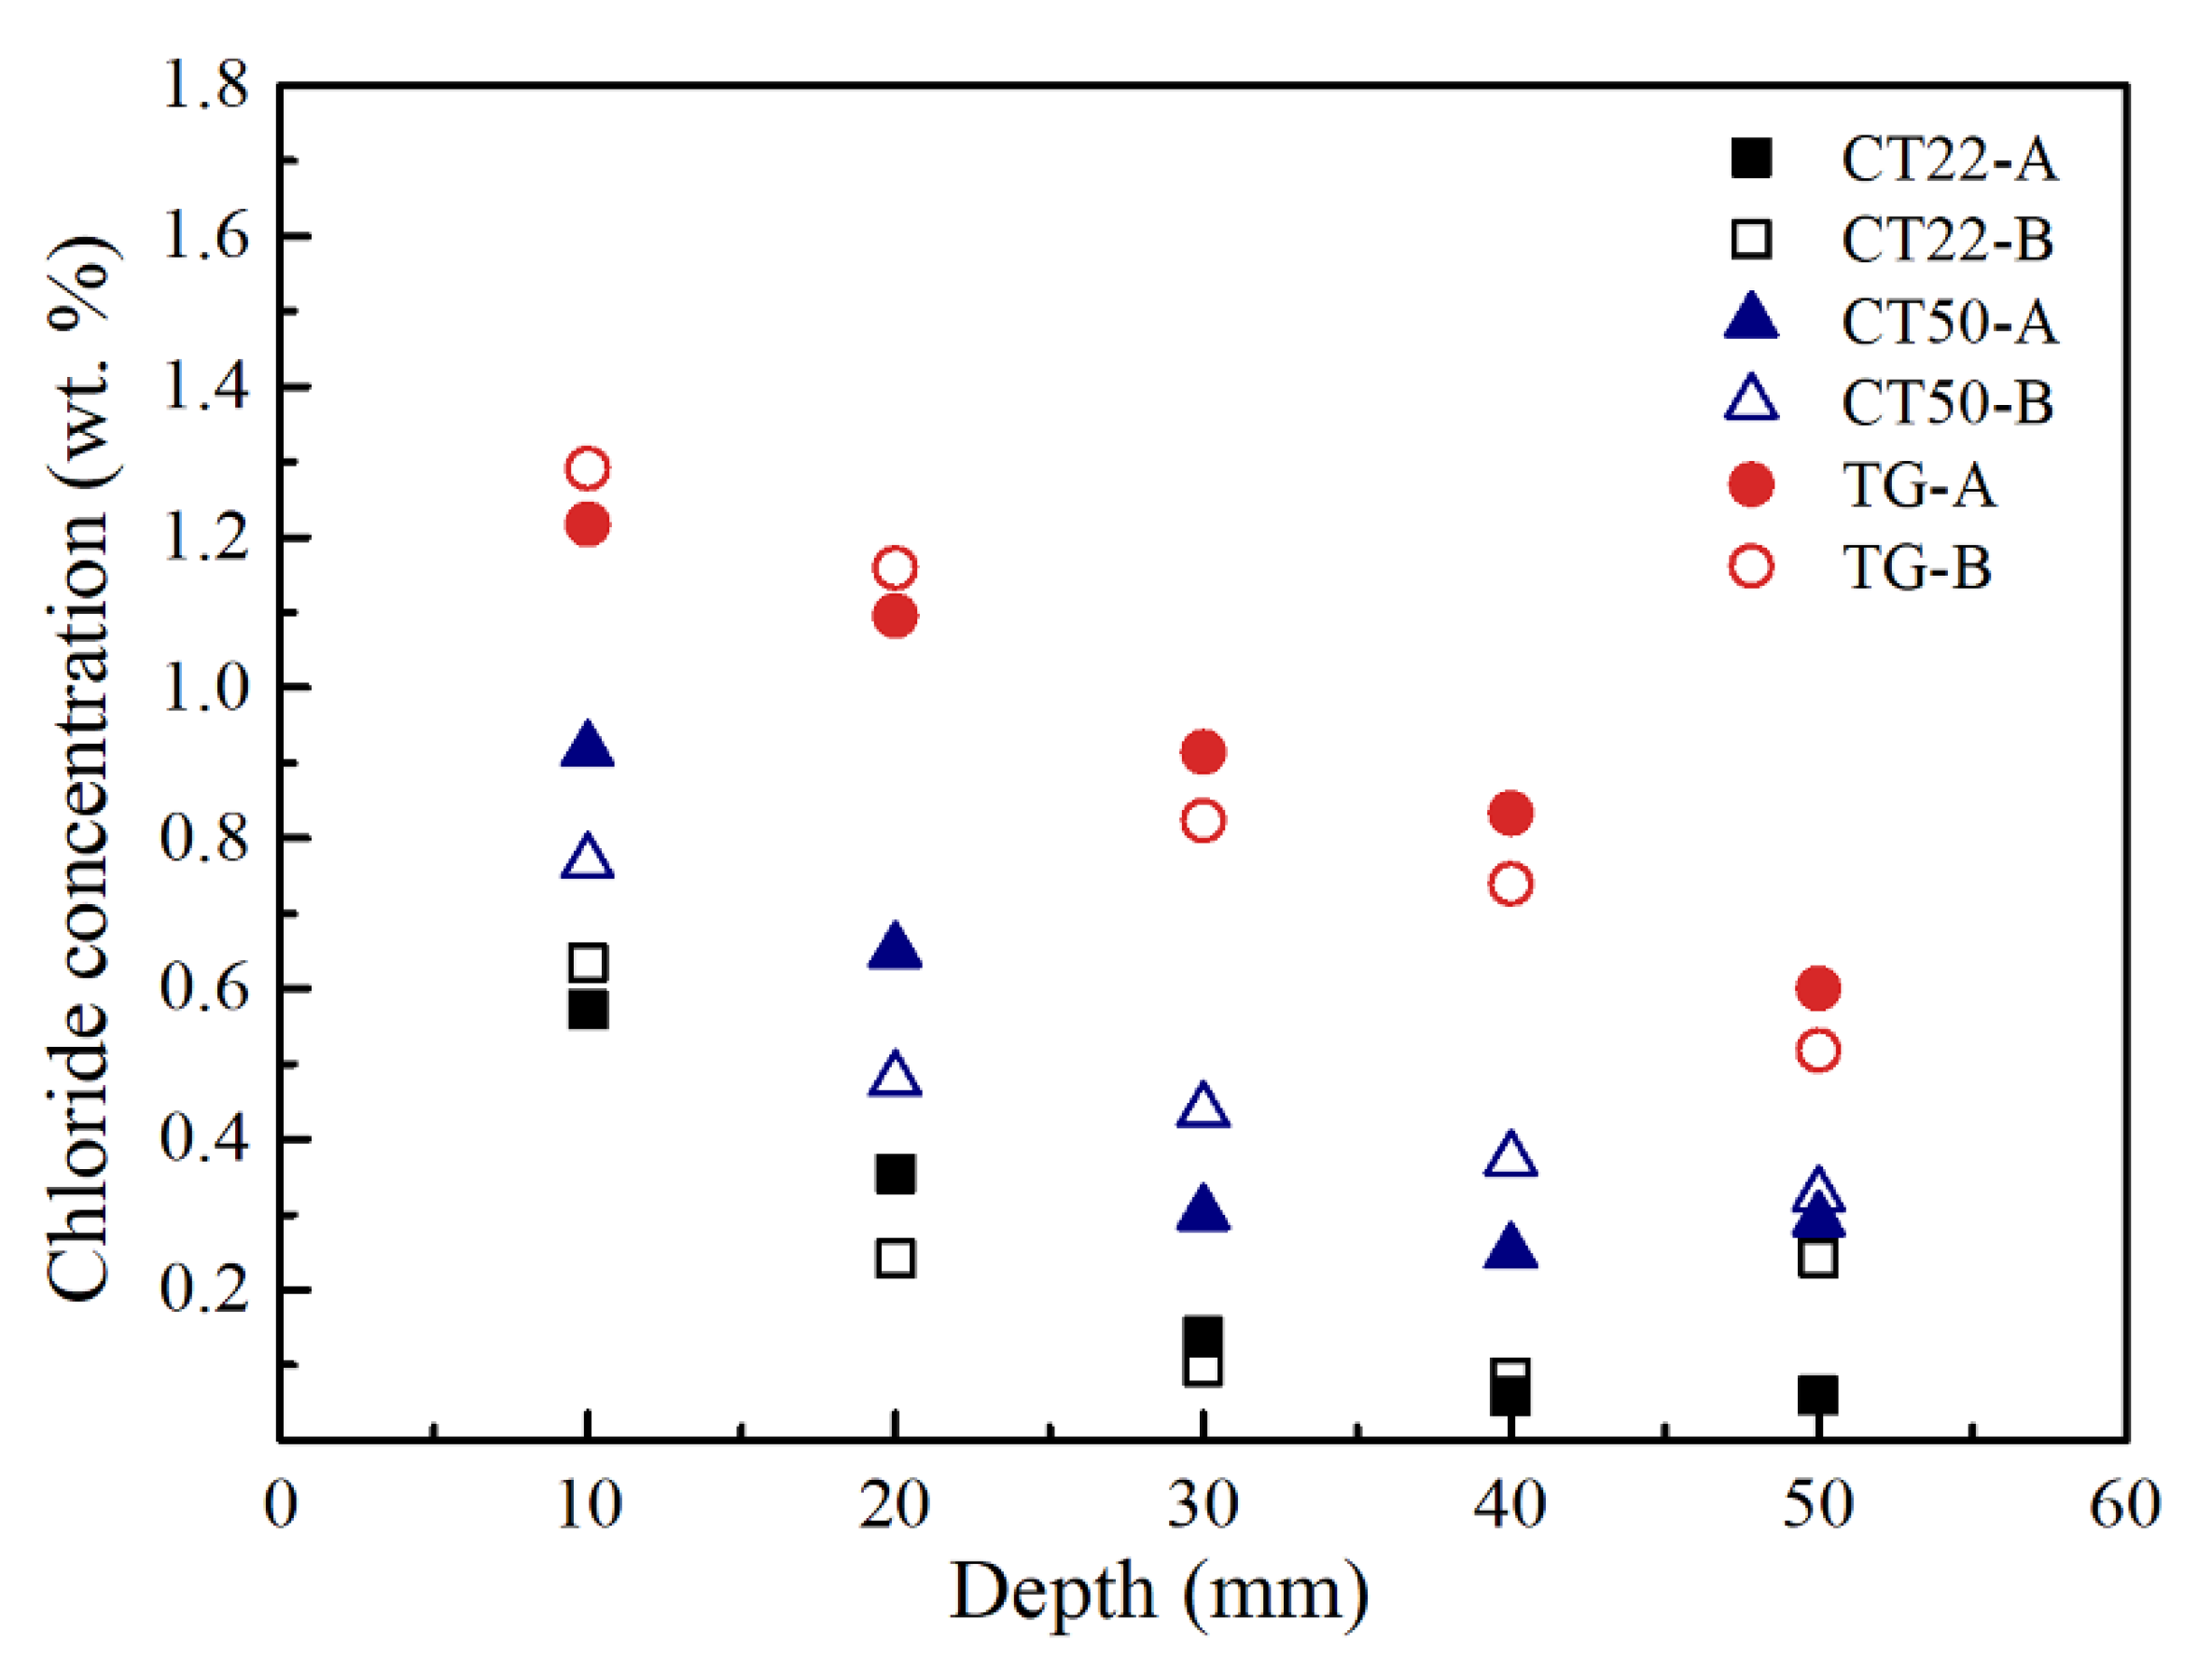
3.1. Chloride Concentrations in Concrete

The Cl concentrations at the different depths of the samples determined using the potentiometric titration method are summarized in Table 2 and graphically displayed in Figure 3. In each temperature condition, two samples were tested, and their Cl concentration values are close to each other with small differences (ΔCCl in Table 2). As expected from Arrhenius’s law, the values of CCl at a constant temperature of 50 °C are higher than those at 22 °C. An interesting result is that the Cl concentrations at the TG conditions are much higher than those at 50 °C. This cannot be explained simply by Arrhenius’s law, which is discussed in subsequent sections.
It should be noted that the measured chloride contents are total chloride since the ASTM test method used in this study provides the procedures for analyzing acid-soluble chloride [27]. Although free chloride is responsible for the diffusion through concrete and the initiation of corrosion on the rebar surface, the techniques determining free chloride contents in concrete have practical difficulties compared with a total chloride measurement [29,30], and therefore the chloride threshold values of chloride-induced corrosion have still been quantified in terms of either total or free chloride content [31]. Moreover, an approximately linear relationship between free chloride and total chloride contents has been established in long-term exposure tests [30,32]. Therefore, further analysis in this study was conducted with the measured total chloride contents.

3.2. Determination of Chloride Diffusion Coefficients in Constant Temperatures

Only the bottom surfaces of the concrete cylinder samples were exposed to the NaCl solution, resulting in unidirectional chloride diffusion. By neglecting the initial chloride concentration in samples, the apparent chloride diffusion coefficients (DCl) of concrete were determined by fitting the measured data to the error function solution given by:
C ( x , t ) = C s ( 1   e r f ( x 2 D C l t ) )
where C(x,t) is the chloride concentration at the depth x and the exposure time t, erf is the Gaussian error function, Cs is the surface concentration of chloride, and DCl is the apparent diffusion coefficient of chloride. In this calculation, it was assumed that the DCl should be constant over the exposure time, depending only on temperature.
Considering the same experimental conditions for CT22 and CT50 except temperature condition, the values for Cs of both the conditions were assumed to be identical. Hence, the DCl of CT22 and CT50 was determined for the identical value of Cs, instead of a separate fitting to the concentration profiles for each condition. First, the value of the surface chloride concentration (Cs) was determined with the following assumptions:
(i)
Cs is equal to the chloride concentration in the concrete surface of which pores are filled with the NaCl solution;
(ii)
Cs does not change with time;
(iii)
From Assumption (i), Cs is a single value for all the temperature conditions.
With the above assumptions, the surface chloride concentration (Cs) can be calculated by:
C s = p c × M C l × m C l ρ c
where p c is the porosity of the concrete (vol. %), M C l is the molarity of chloride in the solution (mol/cm3), m C l is the molar mass of chloride (g/mol), and ρ c is the density of the concrete (g/cm3).
The porosity of the concrete sample was determined as 13 vol. % using the boiling water saturation technique, specified in ASTM C 642-13 [33]. Since the samples were prepared in fully wet states and submerged in the NaCl solution, the pores at the surface were filled with the solution. Assuming that no initial chloride existed in the concrete and pores, Cs was estimated as 1.261 wt.%. Equation (2) was fitted to the chloride concentration profiles with the estimated Cs values, as shown in Figure 4. From Figure 4, it was judged that the surface chloride concentration (Cs) determined from the concrete porosity was a reasonable value. The apparent chloride diffusion coefficient (DCl) and the residual sum of squares (SR) of CT22 and CT50 from the regression are shown in Table 3.
The apparent diffusion coefficient of concrete, DCl, increases with temperature, which is expressed by DCl(T):
D C l ( T ) = D 0   e x p ( E a R T )
where D0 is the maximum diffusion coefficient, Ea is the activation energy of diffusion, and R is the gas constant. Using the values of DCl in Table 3, D0 and Ea were calculated to be 6.66 ± 0.09 × 10⁻⁵ m2/s and 34.6 ± 2.0 kJ/mol, respectively. The average values of the DCl of two samples were used for the calculation.

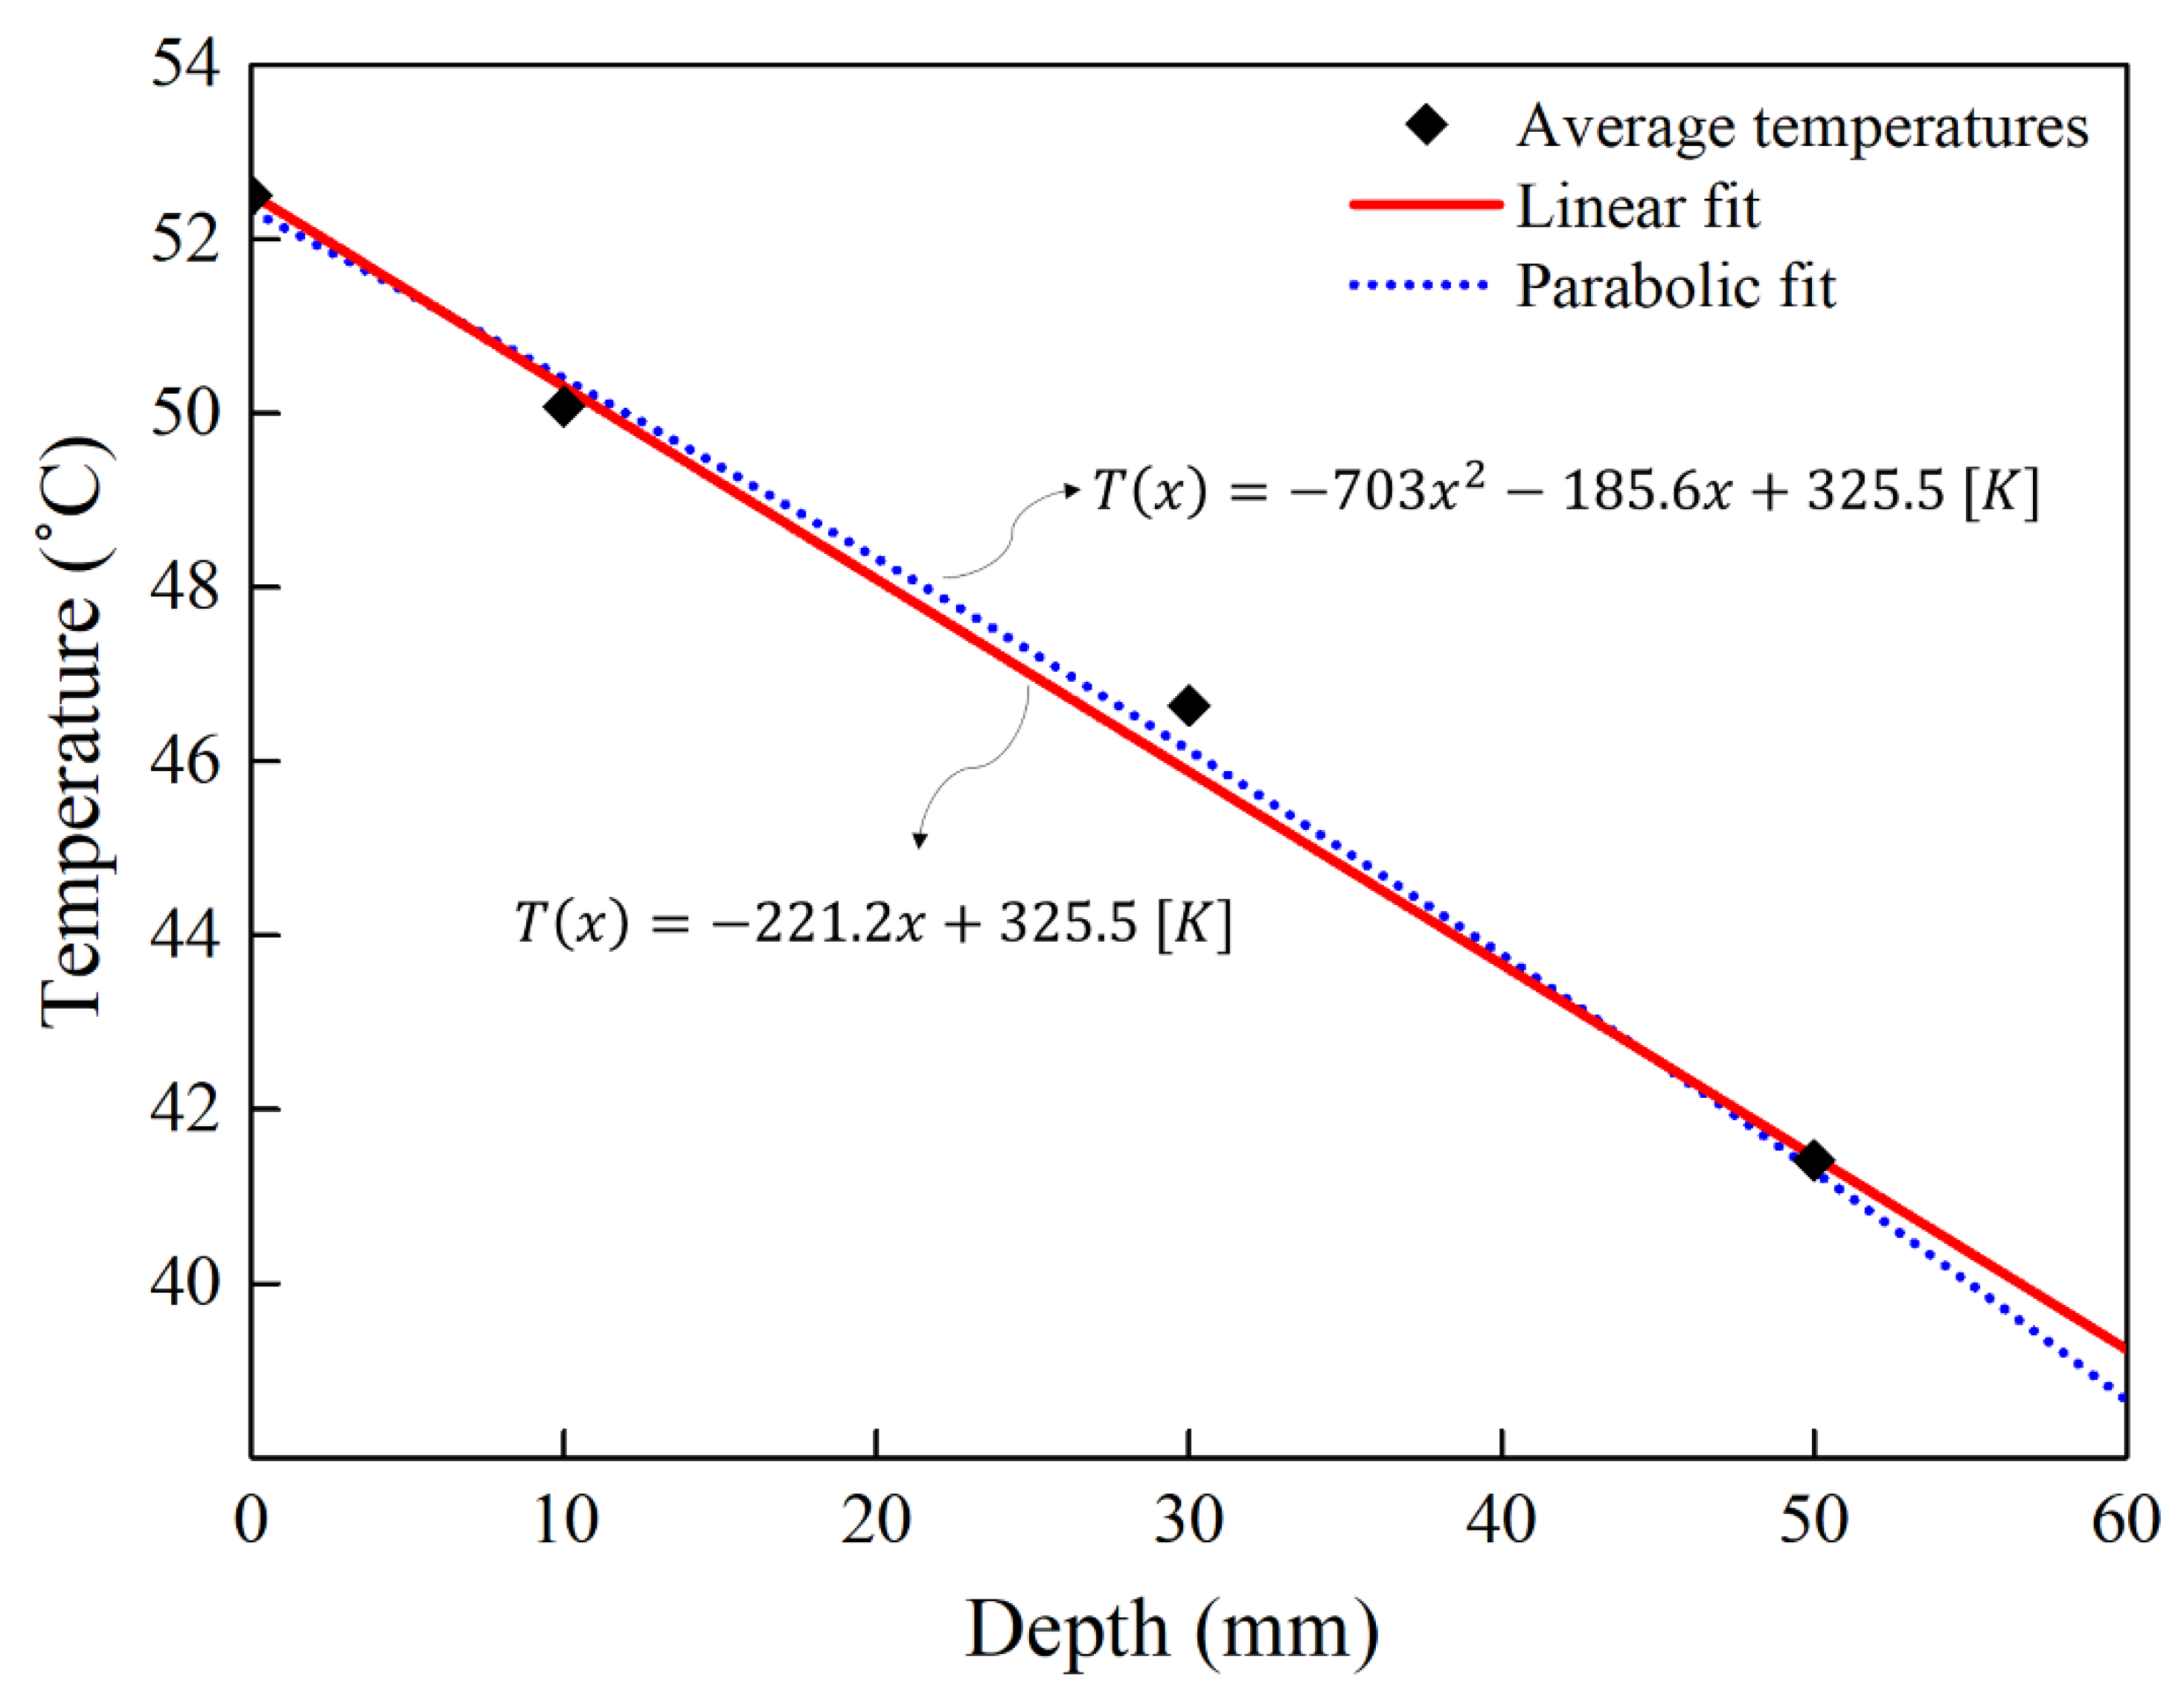
3.3. Temperature Profile in Concrete in Temperature Gradient Condition

In the TG condition, the internal temperature readings from the different depths obtained by the data loggers were recorded and plotted as shown in Figure 5. The average temperatures of each depth are shown in Figure 6, and the variation in temperatures along the depth direction could be fitted with either linear or parabolic approximation. By assuming that the temperature varies linearly with the depth, the temperature is expressed as T ( x ) = 221.2 x + 325.5   [ K ] from the measured temperature profile of a concrete sample in the TG condition, where x [m] is the depth from the exposure surface.

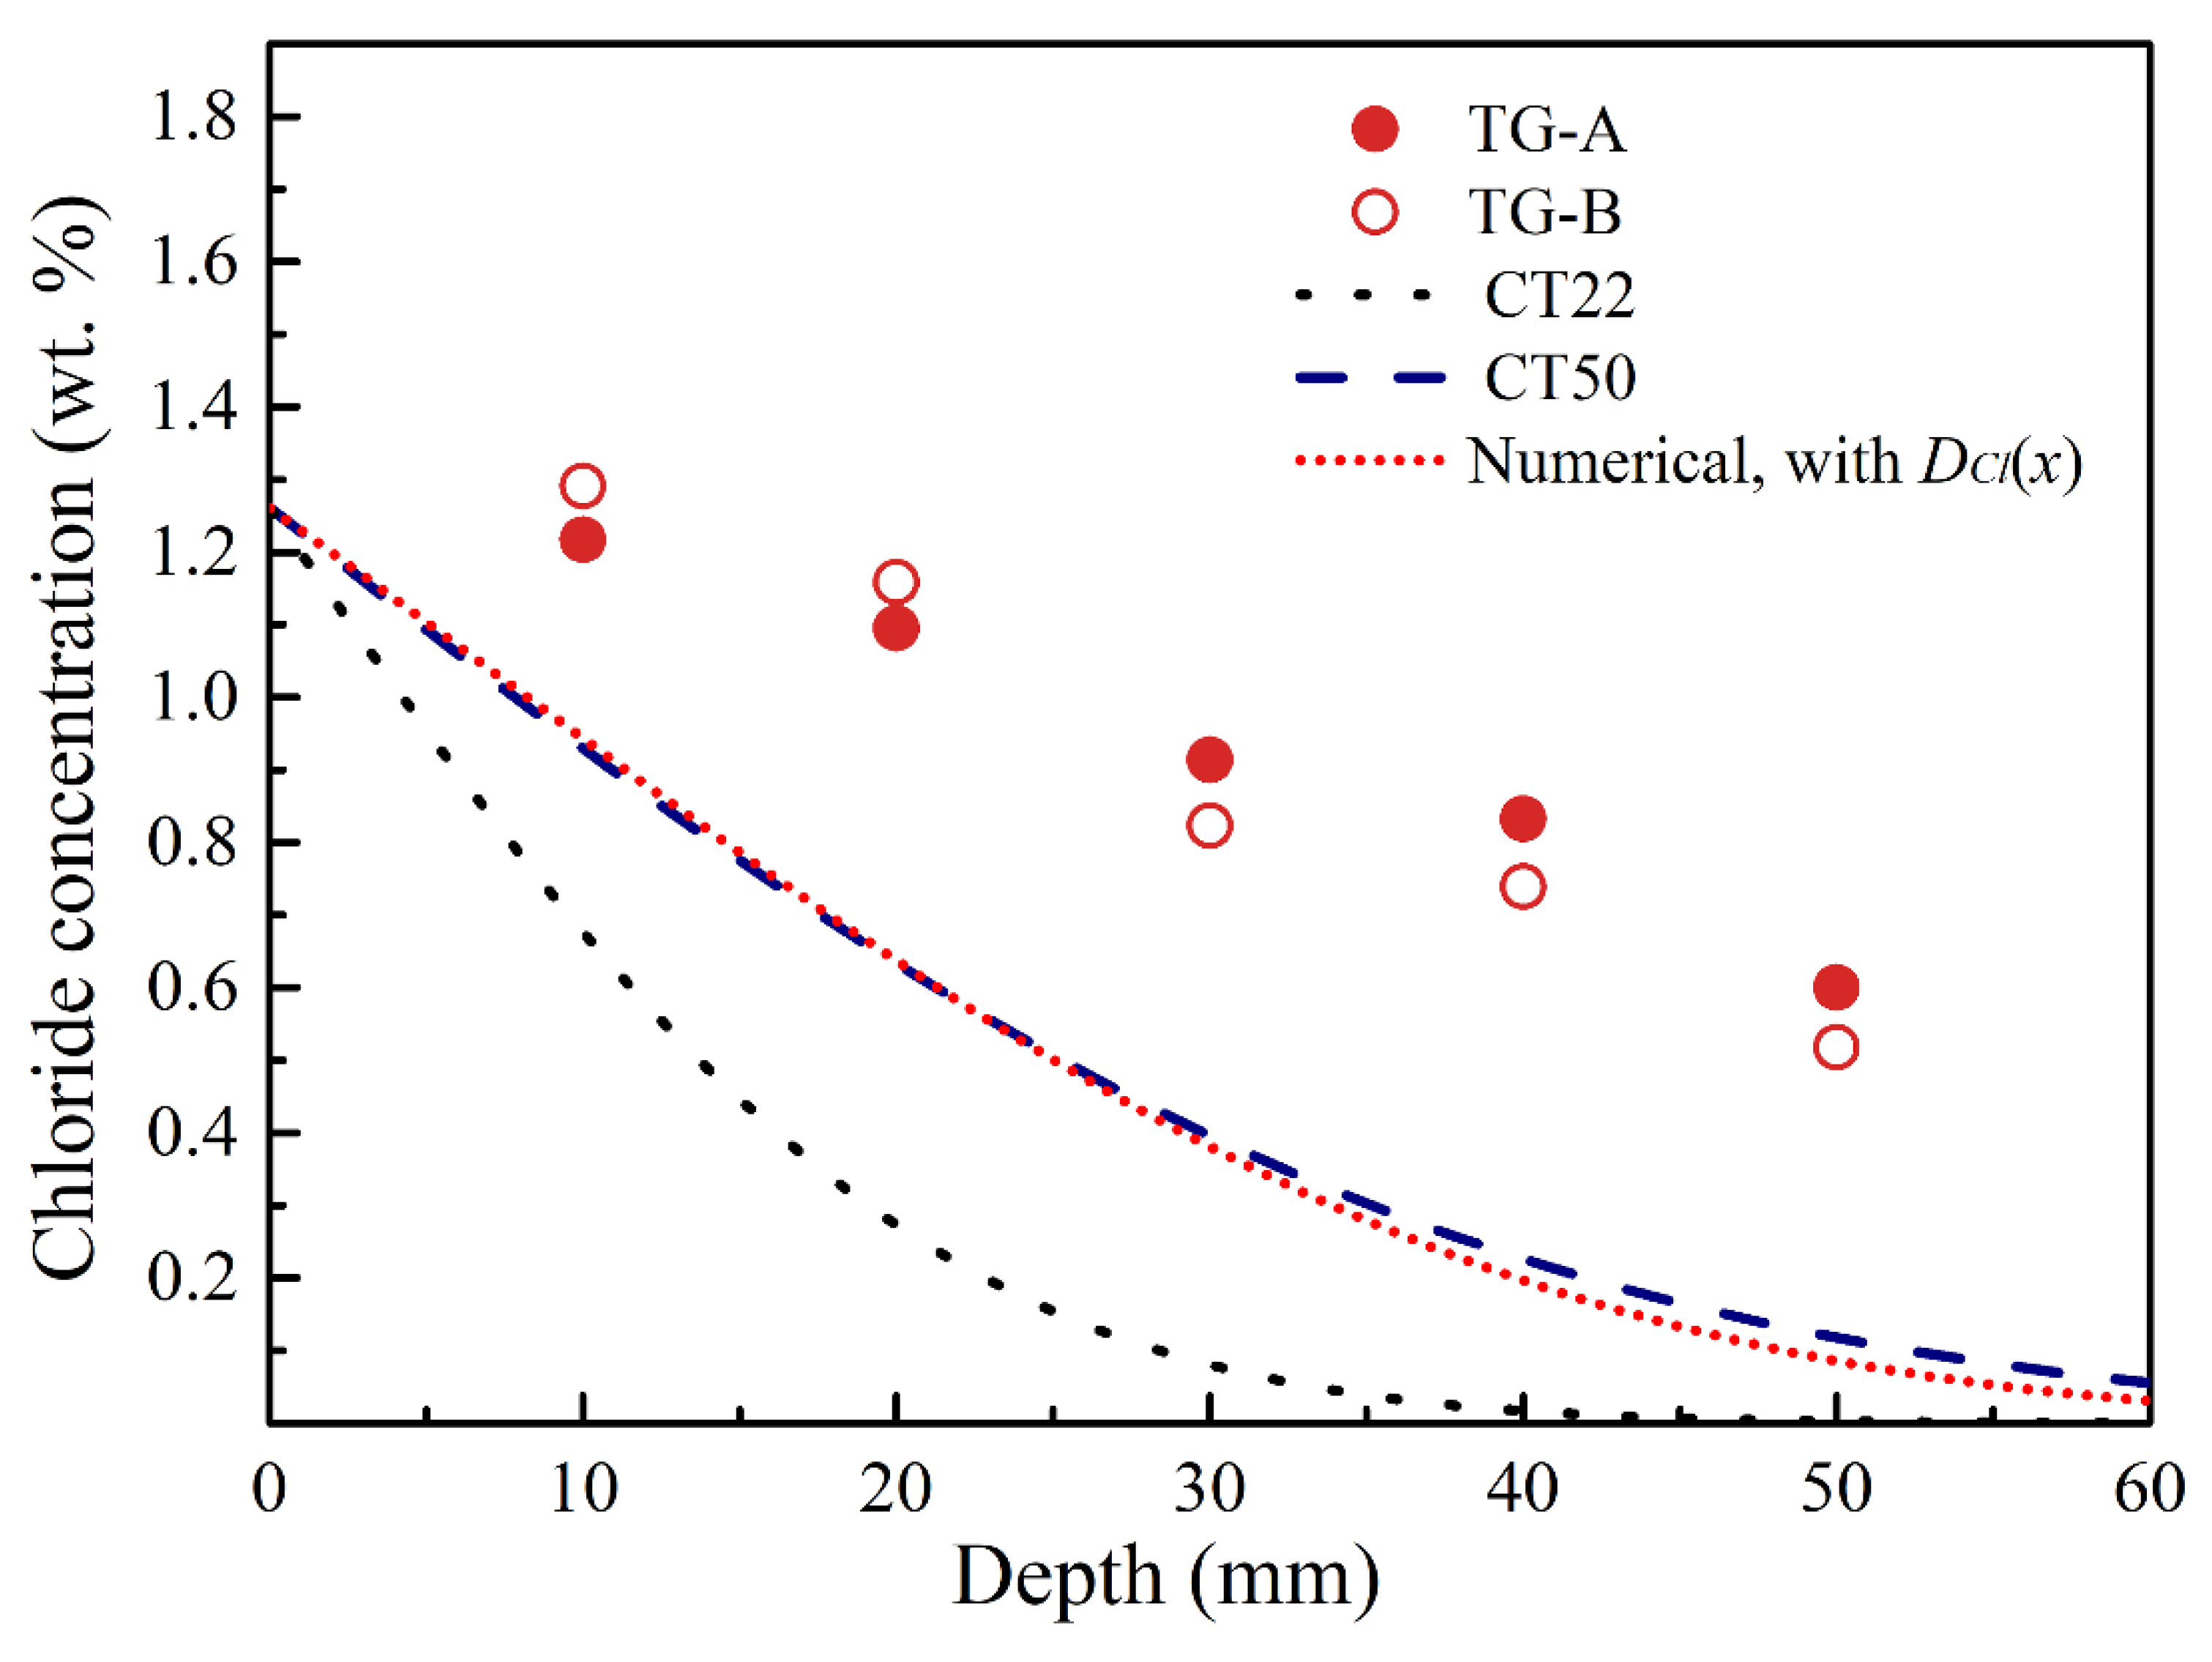
3.4. Determination of Chloride Diffusion Coefficient in Temperature Gradient Condition

In the TG condition, the temperature varies along the depth direction, and therefore the diffusion coefficient, DCl, should be expressed as a function of either temperature (t) or depth (x). Equation (4) can be rewritten by:
D C l ( x ) = D 0 e x p ( E a R T ( x ) )
where D C l ( x ) is the chloride diffusion coefficient for the TG condition as a function of x. Fick’s second law was modified with consideration of the diffusion coefficient, D C l ( x ) :
C ( x , t ) t = x ( D C l ( x ) C ( x , t ) x )
The modified Fick’s second law in Equation (6) was solved by a numerical method using Matlab on an interval of 0 ≤ x ≤ 1 (m) for 0 ≤ t ≤ 30 (days). The equation satisfies the initial condition C(x,0) = 0, and boundary conditions C(0,t) ≡ Cs and C(1,t) = 0. Figure 7 shows the calculated chloride profile with varying DCl(x) for the TG condition. There appears to be a large discrepancy between the calculated (red dotted curve) and measured chloride (red circle symbols) profiles in the TG condition, which implies that there should be another driving force of the chloride diffusion. It is well known that a flux of salt is generated by a temperature gradient [34], which is called thermo-diffusion. The contribution of the thermo-diffusion to chloride transport in the TG condition is discussed in the following section.

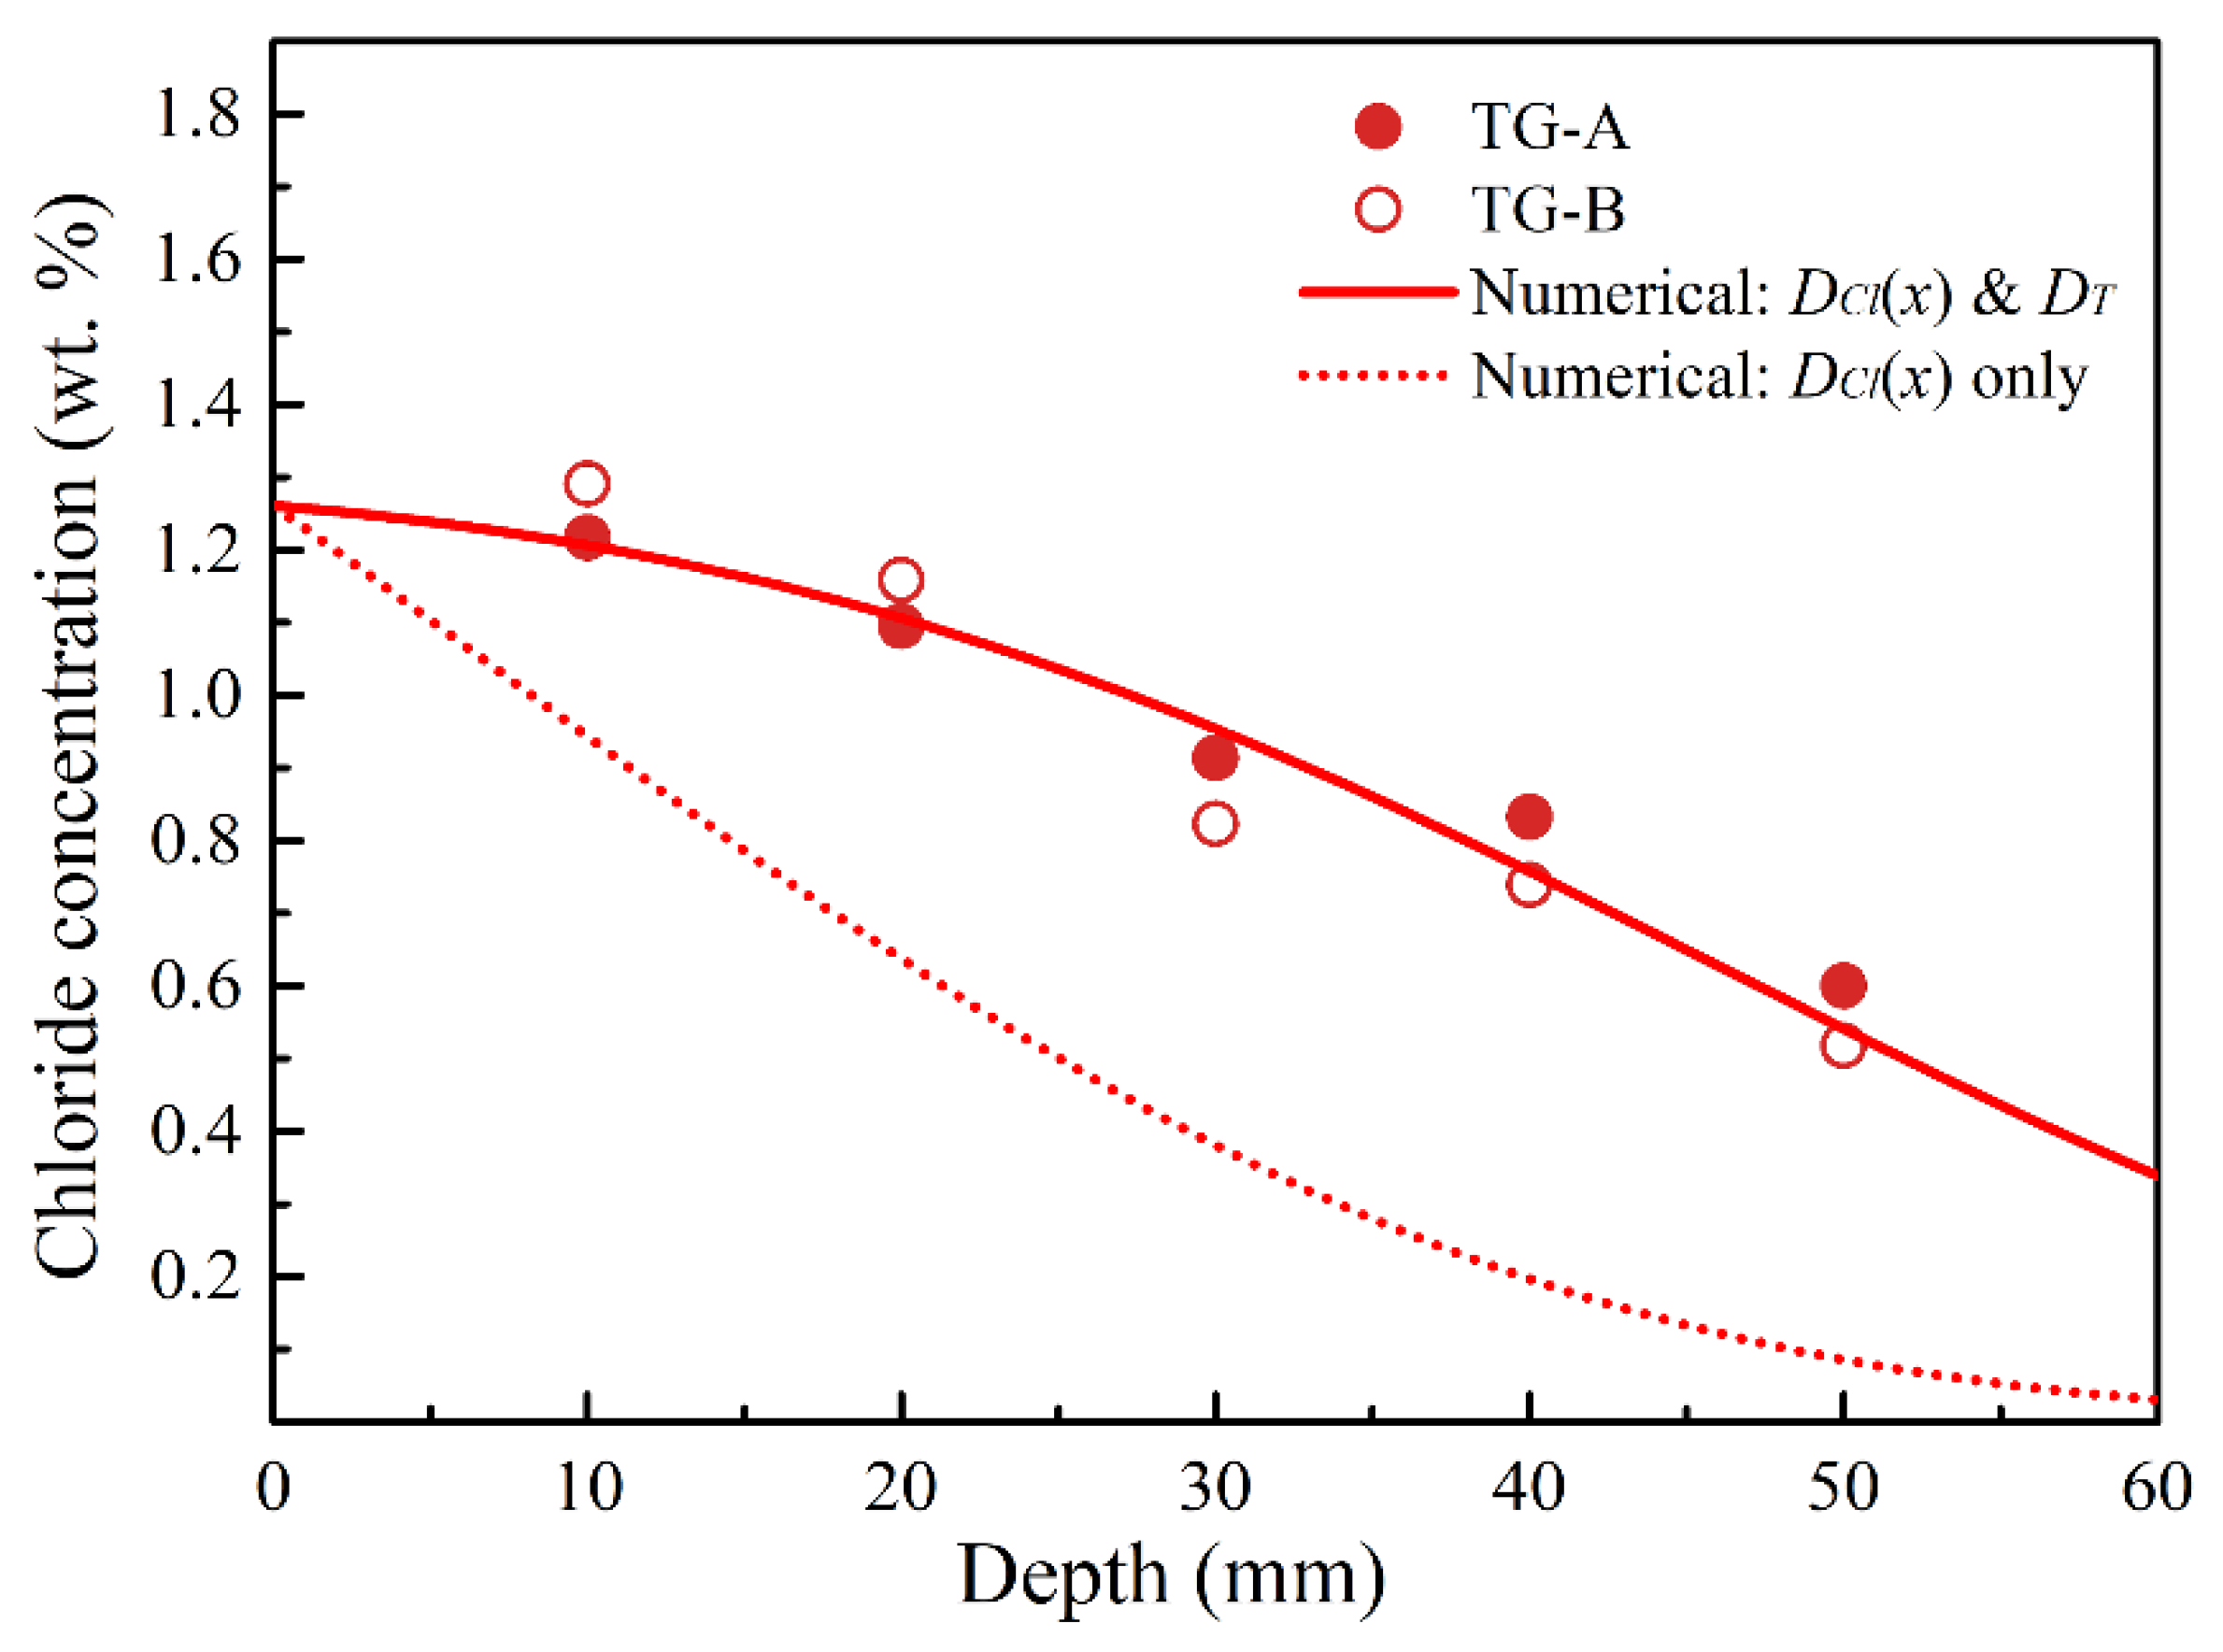
3.5. Determination of Thermo-Diffusion Coefficient

Thermo-diffusion is the mass transport response to a gradient of temperature. Quantitative evaluations of thermo-diffusion for aqueous solutions or organic mixtures have usually been conducted with the Soret coefficient, which is defined as the ratio of the thermo-diffusion coefficient, DT, to the mass diffusion coefficient [34,35,36,37]. In this study, a new analytical equation was developed by modifying the mass transfer equation [35], which consists of two terms: mass flux by DCl(x) (hereinafter referred to as the mass diffusion coefficient) and by the thermo-diffusion coefficient, DT:
J C l , T ( x , t ) = D C l ( x ) C ( x , t ) x D T C ( x , t ) T x
The second term of Equation (7) represents the temperature gradient effect on the flux of chloride. The general time-dependent partial differential equation considering Fick’s second law can be rewritten as
C ( x , t ) t = x ( D C l ( x ) C ( x , t ) x + D T C ( x , t ) T x ) .
The thermo-diffusion coefficient, DT, was determined by Equation (8) based on the measured chloride concentration profile of the TG condition with the other parameters determined from the previous analysis. The mass diffusion coefficient of chloride, DCl(x) was determined as a function of x from the Da of CT22 and CT50 by Equation (4). Since a linear temperature gradient was imposed from the measured temperature profile of TG, ∂T/∂x is a constant as T ( x ) = 221.2 x + 325.5   [ K ] , and Equation (8) can be simplified to:
C ( x , t ) t = x ( D C l ( x ) C ( x , t ) x ) + D T T x C ( x , t ) x
The substitution numerical calculation on DT was conducted for Equation (9) using Matlab. The initial condition of C(x,0) = 0 and boundary conditions of C(0,t) ≡ 1.261 wt. % and C(1,t) = 0 were set for the analysis on an interval of 0 ≤ x ≤ 1 (m) for 0 ≤ t ≤ 30 (days). The value of DT with the lowest residual sum of squares to the measured concentration profile of the TG condition was determined to be 6.201 × 10⁻¹¹ m2/s·K. Figure 8 shows the comparison of the chloride concentration profiles from the model by solving Equation (9) with the determined DT and from the measured data of the TG condition. With this analytical model, the higher chloride concentrations measured in the TG condition compared with those measured in the isothermal conditions could be explained as the result of the thermo-diffusion effect due to the temperature gradient.

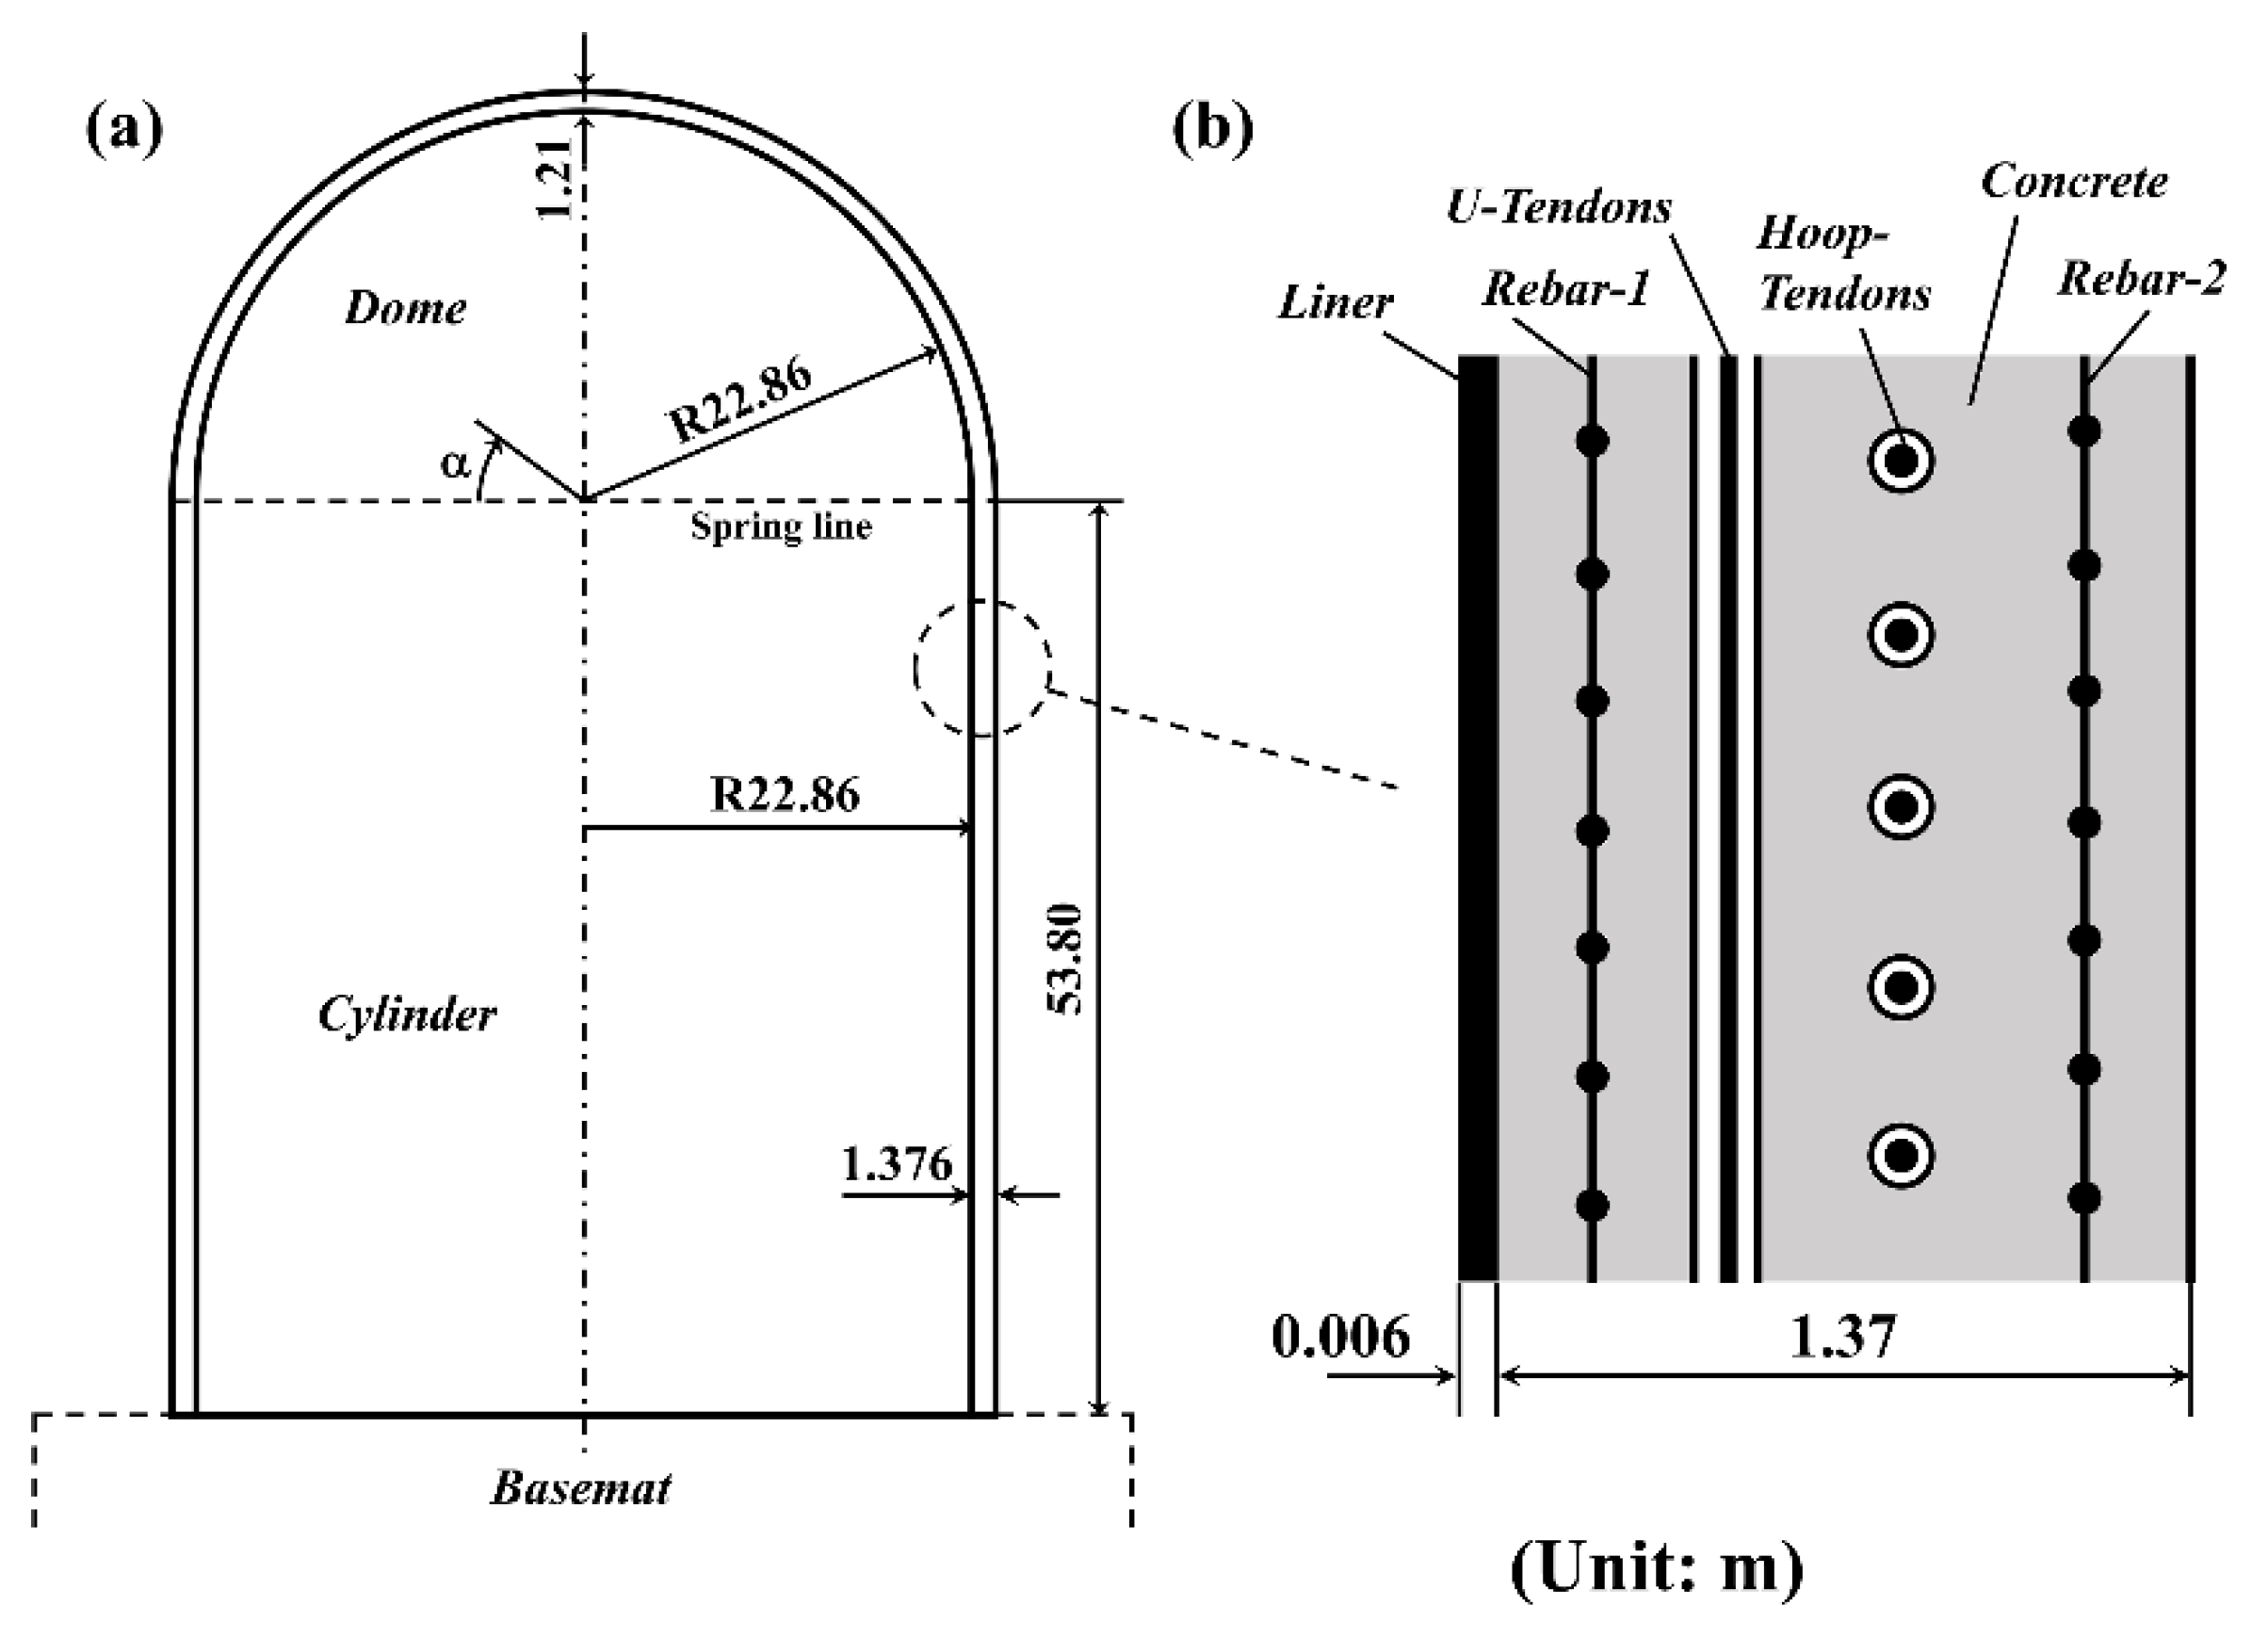
3.6. Estimation of Cl Diffusion in RCBs

As the analytical model of chloride diffusion in concrete in Equation (8) has two separate terms of mass diffusion and thermo-diffusion, the effect of thermo-diffusion on the lifetime prediction of RCBs can be evaluated. To assess the effect of thermo-diffusion in an actual service condition quantitatively, the time of corrosion initiation on the rebar was estimated by the model. The critical chloride content (Ccrit) is the major parameter to quantify the susceptibility to rebar corrosion in concrete [38]. While a range of Ccrit values has been reported, in this work, Ccrit of 1 wt. % in the binder was used as a threshold value of the corrosion initiation, which can be converted into 0.246 wt. % in concrete.
Figure 9 is a schematic of the RCB structure of an APR1400 nuclear reactor. While the inside of RCBs is air-conditioned, the ambient temperature may range from 30 °C to 60 °C in a typical summer in the MENA region, which causes a temperature gradient up to 40 °C, along with the wall thickness of 1.37 m. The estimation was performed in the range of a temperature gradient from 10 to 40 °C/wall thickness of the RCB with a fixed inside temperature of 20 °C. In addition, the effect of daily temperature variation was also considered by assuming sinusoidal changes in external temperature, which have the lowest temperature of 20 °C and highest temperature from 30 °C to 60 °C.
For rebar embedded at 20 cm from the surface in the 1.37 m thick RCB walls, the times for the chloride concentration to reach Ccrit were estimated for the different temperature gradients with the thermo-diffusion term considered as Equation (8) and compared with those not considering thermo-diffusion using Equation (6). The calculated constant value of DT was used for the estimation. The equations were numerically solved using Matlab with the initial condition C(x,0) = 0 and boundary conditions C(0,t) = 1.261 wt. % and C(5,t) = 0 for a month time interval. The estimated times to corrosion initiation at the depth of rebar (20 cm from the surface) are shown in Figure 10 and Table 4. When the times estimated only with mass diffusion under fixed temperature gradients from 10 to 40 °C/wall thickness were calculated (A), the estimated times were shortened by considering thermo-diffusion (B) in the same temperature gradients. The estimated results with mass diffusion only (C) and with both mass and thermo-diffusion (D) with daily variations in temperature were compared as well.
When the thermo-diffusion term was included in the chloride transport, the estimated time of the corrosion initiation decreased to around 61% of the time of the corrosion initiation if only the mass diffusion was considered in both cases, assuming fixed external temperature and considering daily variation in temperature. In other words, the time to the initiation of corrosion in reinforced concrete (RC) structures could be shortened by 30~40% if the effects of the temperature gradient are considered. Hence, the thermo-diffusion effect should be considered in further research for the lifetime estimation of RCBs of NPPs. It should be noted that the time to corrosion initiation in Figure 10 and Table 4 does not represent the real service life of RCBs since all the parameters used in this estimation were determined from the fully saturated condition of concrete pores and the elevated surface chloride concentration. Nevertheless, the simulation considering the chloride transport via thermo-diffusion, as well as mass diffusion, implies that the chloride ion diffusion could be significantly accelerated by the temperature gradient along with the wall thickness of RCBs.

4. Conclusions

Chloride diffusion tests using cylindrical concrete samples were conducted in two isothermal conditions and in a temperature gradient condition to evaluate the effect of the temperature gradient on chloride diffusion through concrete and on the service life of reactor containment buildings in nuclear power plants. The following conclusions can be drawn from this work:
  • Using isothermal diffusion test results, the mass diffusion coefficients (DCl) of chloride ions were determined by applying Fick’s law of diffusion. In the curve fitting, the surface chloride concentration was estimated by the concrete sample porosity, which was judged to be a reasonable value.
  • At 50 °C, the value of the mass diffusion coefficient (DCl) was 3.7 times higher than at 20 °C with the activation energy of 34.6 kJ/mol.
  • In the temperature gradient condition (TG) varying from 52.5 °C to 22 °C, much higher chloride concentration values were measured than in the constant 50 °C condition.
  • For the TG condition, Fick’s law was rewritten in a binary form including both the mass diffusion and thermo-diffusion terms. By the curve fitting of the TG results, the thermo-diffusion coefficient (DT) was determined to be 6.201 × 10⁻¹¹ m2/s·K.
  • The values of the mass diffusion and thermo-diffusion coefficients were applied to the RCBs in APR1400 nuclear power plants. With the temperature gradient and daily variation in atmosphere temperature being considered, the time to corrosion initiation was reduced by 30~40% compared with the prediction without considering the temperature gradient.
This work shows that the effect of temperature gradient on chloride diffusion through concrete is significant. However, the experiments and analyses in this study were performed without considering the saturation degree of concrete pores. It is well known that the degree of pore saturation is one of the main factors governing chloride diffusion [18,19,20,21]. For a more accurate prediction of RCB service life in NPPs, further study should be focused on the effect of temperature and its gradient on the moisture transport and on the effect the degree of pore saturation in concrete has on chloride diffusion.

Author Contributions

Conceptualization, T.-Y.K., A.A., P.R. and Y.Y.; Funding acquisition, T.-Y.K., A.A., P.R. and Y.Y.; Investigation, B.A., P.C., T.-Y.K. and Y.Y.; Methodology, B.A., P.C., T.-Y.K. and Y.Y.; Project administration, T.-Y.K., A.A. and Y.Y.; Validation, B.A. and P.C.; Visualization, B.A., P.C. and R.A.S.; Writing—original draft, B.A. and Y.Y.; Writing—review & editing, R.A.S. and T.-Y.K. All authors have read and agreed to the published version of the manuscript.

Funding

The authors are grateful for the financial support and test facilities provided by Emirates Nuclear Technology Center funding (RC2-2018-002—8474000129), Khalifa University. The preliminary results of this study were presented at the 2019 Spring Meeting of the European Materials Research Society (E-MRS) and at EUROCORR 2020.

Institutional Review Board Statement

Not applicable.

Informed Consent Statement

Not applicable.

Conflicts of Interest

The authors declare no conflict of interest.

References

  1. Alhanaee, S.; Yi, Y.; Schiffer, A. Ultimate pressure capacity of nuclear reactor containment buildings under unaged and aged conditions. Nucl. Eng. Des. 2018, 335, 128–139. [Google Scholar] [CrossRef]
  2. Moreno, M.; Morris, W.; Alvarez, M.G.; Duffó, G.S. Corrosion of reinforcing steel in simulated concrete pore solutions. Corros. Sci. 2004, 46, 2681–2699. [Google Scholar] [CrossRef]
  3. Zhang, J.; Lounis, Z. Sensitivity analysis of simplified diffusion-based corrosion initiation model of concrete structures exposed to chlorides. Cem. Concr. Res. 2006, 36, 1312–1323. [Google Scholar] [CrossRef] [Green Version]
  4. Aveldaño, R.R.; Ortega, N.F. Characterization of concrete cracking due to corrosion of reinforcements in different environments. Constr. Build. Mater. 2011, 25, 630–637. [Google Scholar] [CrossRef]
  5. Angst, U.M.; Geiker, M.R.; Alonso, M.C.; Polder, R.; Isgor, O.B.; Elsener, B.; Wong, H.; Michel, A.; Hornbostel, K.; Gehlen, C.; et al. The effect of the steel–concrete interface on chloride-induced corrosion initiation in concrete: A critical review by RILEM TC 262-SCI. Mater. Struct. 2019, 52, 88. [Google Scholar] [CrossRef]
  6. Qasem, M.; Yi, Y.; Al Hanaei, S.; Cho, P. Electrochemical behavior of reinforcing steel for nuclear reactor containment buildings. IOSR J. Mech. Civil Eng. 2016, 13, 80–90. [Google Scholar]
  7. Jung, S.-H.; Ryu, H.-S.; Karthick, S.; Kwon, S.-J. Time and Crack Effect on Chloride Diffusion for Concrete with Fly Ash. Int. J. Concr. Struct. Mater. 2018, 12, 14. [Google Scholar] [CrossRef] [Green Version]
  8. Al Saadi, S.; Yi, Y. Dry storage of spent nuclear fuel in UAE—Economic aspect. Ann. Nucl. Energy 2015, 75, 527–535. [Google Scholar] [CrossRef]
  9. Tian, Y.; Jin, N.; Jin, X. Coupling effect of temperature and relative humidity diffusion in concrete under ambient conditions. Constr. Build. Mater. 2018, 159, 673–689. [Google Scholar] [CrossRef]
  10. Stanish, K.; Thomas, M. The use of bulk diffusion tests to establish time-dependent concrete chloride diffusion coefficients. Cem. Concr. Res. 2003, 33, 55–62. [Google Scholar] [CrossRef]
  11. Yang, Y.; Wang, M. Pore-scale modeling of chloride ion diffusion in cement microstructures. Cem. Concr. Compos. 2018, 85, 92–104. [Google Scholar] [CrossRef]
  12. Xi, Y.; Willam, K.; Frangopol, D.M. Multiscale Modeling of Interactive Diffusion Processes in Concrete. J. Eng. Mech. 2000, 126, 258–265. [Google Scholar] [CrossRef]
  13. Titi, H.H.; Tabatabai, H. Effect of coarse aggregate type on chloride ion penetration in concrete. Constr. Build. Mater. 2018, 162, 871–880. [Google Scholar] [CrossRef]
  14. Wang, Y.; Wu, L.; Wang, Y.; Liu, C.; Li, Q. Effects of coarse aggregates on chloride diffusion coefficients of concrete and interfacial transition zone under experimental drying-wetting cycles. Constr. Build. Mater. 2018, 185, 230–245. [Google Scholar] [CrossRef]
  15. Abdelrahman, M.; Xi, Y. The effect of w/c ratio and aggregate volume fraction on chloride penetration in non-saturated concrete. Constr. Build. Mater. 2018, 191, 260–269. [Google Scholar] [CrossRef]
  16. Petcherdchoo, A. Closed-form solutions for modeling chloride transport in unsaturated concrete under wet-dry cycles of chloride attack. Constr. Build. Mater. 2018, 176, 638–651. [Google Scholar] [CrossRef]
  17. Real, S.; Bogas, J.A. Chloride ingress into structural lightweight aggregate concrete in real marine environment. Mar. Struct. 2018, 61, 170–187. [Google Scholar] [CrossRef]
  18. Climent, M.A.; de Vera, G.; López, J.F.; Viqueira, E.; Andrade, C. A test method for measuring chloride diffusion coefficients through nonsaturated concrete Part I. The instantaneous plane source diffusion case. Cem. Concr. Res. 2002, 32, 1113–1123. [Google Scholar] [CrossRef]
  19. de Vera, G.; Climent, M.A.; Viqueira, E.; Antón, C.; Andrade, C. A test method for measuring chloride diffusion coefficients through partially saturated concrete. Part II: The instantaneous plane source diffusion case with chloride binding consideration. Cem. Concr. Res. 2007, 37, 714–724. [Google Scholar] [CrossRef]
  20. Zhang, Y.; Ye, G. A model for predicting the relative chloride diffusion coefficient in unsaturated cementitious materials. Cem. Concr. Res. 2019, 115, 133–144. [Google Scholar] [CrossRef]
  21. Zhang, Y.; Yang, Z.; Ye, G. Dependence of unsaturated chloride diffusion on the pore structure in cementitious materials. Cem. Concr. Res. 2020, 127, 105919. [Google Scholar] [CrossRef]
  22. McGrath, P.F.; Hooton, R.D. Re-evaluation of the AASHTO T259 90-day salt ponding test. Cem. Concr. Res. 1999, 29, 1239–1248. [Google Scholar] [CrossRef]
  23. Erdoǧdu, Ş.; Kondratova, I.L.; Bremner, T.W. Determination of chloride diffusion coefficient of concrete using open-circuit potential measurements. Cem. Concr. Res. 2004, 34, 603–609. [Google Scholar] [CrossRef]
  24. Lizarazo-Marriaga, J.; Claisse, P. Determination of the concrete chloride diffusion coefficient based on an electrochemical test and an optimization model. Mater. Chem. Phys. 2009, 117, 536–543. [Google Scholar] [CrossRef]
  25. Thomas, R.J.; Ariyachandra, E.; Lezama, D.; Peethamparan, S. Comparison of chloride permeability methods for Alkali-Activated concrete. Constr. Build. Mater. 2018, 165, 104–111. [Google Scholar] [CrossRef]
  26. Isteita, M.; Xi, Y. The effect of temperature variation on chloride penetration in concrete. Constr. Build. Mater. 2017, 156, 73–82. [Google Scholar] [CrossRef]
  27. ASTM C1152/C1152M-04(2012)e1; Standard Test Method for Acid-Soluble Chloride in Mortar and Concrete. ASTM International: West Conshohocken, PA, USA, 2012.
  28. Climent, M.A.; Viqueira, E.; de Vera, G.; López-Atalaya, M.M. Analysis of acid-soluble chloride in cement, mortar, and concrete by potentiometric titration without filtration steps. Cem. Concr. Res. 1999, 29, 893–898. [Google Scholar] [CrossRef]
  29. Arya, C.; Newman, J.B. An assessment of four methods of determining the free chloride content of concrete. Mater. Struct. 1990, 23, 319–330. [Google Scholar] [CrossRef]
  30. Mohammed, T.U.; Hamada, H. Relationship between free chloride and total chloride contents in concrete. Cem. Concr. Res. 2003, 33, 1487–1490. [Google Scholar] [CrossRef]
  31. Pargar, F.; Koleva, D.A.; van Breugel, K. Determination of Chloride Content in Cementitious Materials: From Fundamental Aspects to Application of Ag/AgCl Chloride Sensors. Sensors 2017, 17, 2482. [Google Scholar] [CrossRef] [Green Version]
  32. Dousti, A.; Shekarchi, M. Relationship between free and total chloride profiles for optimization of service life prediction in chloride exposed RC structures. In Proceedings of the Third International Conference on Modeling, Simulation and Applied Optimization, Sharjah, United Arab Emirates, 20–22 January 2009. [Google Scholar]
  33. ASTM C642-13; Standard Test Method for Density, Absorption, and Voids in Hardened Concrete. ASTM International: West Conshohocken, PA, USA, 2013.
  34. Platten, J.K. The Soret Effect: A Review of Recent Experimental Results. J. Appl. Mech. 2006, 73, 5–15. [Google Scholar] [CrossRef]
  35. Cygan, R.; Jarrell, G. Thermal Diffusion Processes in Aqueous Sodium Chloride Solutions; Sandia National Labs: Albuquerque, NM, USA, 1992. [Google Scholar]
  36. Caldwell, D.R.; Eide, S.A. Soret coefficient and isothermal diffusivity of aqueous solutions of five principal salt constituents of seawater, Deep Sea Research Part A. Oceanogr. Res. Pap. 1981, 28, 1605–1618. [Google Scholar] [CrossRef]
  37. Rahman, M.A.; Saghir, M.Z. Thermodiffusion or Soret effect: Historical review. Int. J. Heat Mass Transfer. 2014, 73, 693–705. [Google Scholar] [CrossRef]
  38. Angst, U.; Elsener, B.; Larsen, C.K.; Vennesland, Ø. Critical chloride content in reinforced concrete—A review. Cem. Concr. Res. 2009, 39, 1122–1138. [Google Scholar] [CrossRef]
Figure 1. Chloride diffusion test setup at three different temperature conditions immersed in the NaCl solution, which are: (a) constant temperature of 22 °C, (b) constant 50 °C, and (c) temperature gradient condition. Thermocouples were positioned at depths of 10 mm, 30 mm, and 50 mm from the exposed surface. (Double-column fit).
Energies 15 05581 g001
Figure 2. A sampling of the concrete cylinder samples for potentiometric titration after NaCl exposure test. (Single-column fit).
Energies 15 05581 g002
Figure 3. Chloride concentration profiles measured at depths of 10–50 mm after 30-day exposure to the NaCl solution. (Single-column fit).
Energies 15 05581 g003
Figure 4. Fitted curves of chloride concentration profile to error function solution of Fick’s second law of diffusion with Cs = 1.261 wt. %. (Single-column fit).
Energies 15 05581 g004
Figure 5. Internal temperature measured at depths of 10, 30, and 50 mm in temperature gradient condition vs. exposure time. (Single-column fit).
Energies 15 05581 g005
Figure 6. Average temperature profile from the measurement with linear and parabolic fit to the profile, where x is in meters and T(x) in Kelvin. (Single-column fit).
Energies 15 05581 g006
Figure 7. The chloride concentration profile of calculation results by considering the diffusion coefficient, D C l ( x ) , as a function of x, compared with measured concentration profiles (Single-column fit).
Energies 15 05581 g007
Figure 8. Chloride concentration profile calculated by the modified equation of Fick’s second law, compared with measured data points of the TG condition. (Single-column fit).
Energies 15 05581 g008
Figure 9. (a) The geometry of reactor containment building of APR1400 [1] (b) Schemeatic of the RCB wall. (Single-column fit).
Energies 15 05581 g009
Figure 10. Estimated time for chloride concentration to reach Ccrit at the depth of the rebar, calculated for the different temperature gradient conditions from 10 to 40 °C/wall thickness with fixed external temperature (A,B) and with daily temperature variation (C,D). (Single-column fit).
Energies 15 05581 g010
Table 1. Proportions of concrete mixture.
Distilled WaterPortland CementDune SandCoarse Aggregate *Fine AggregateTotal
Weight (kg)7.28412.1418.2118.2118.2174.054
% w/w9.8416.3924.5924.5924.59100.00
* Max. size of aggregate was 3/8 inch.
Table 2. Chloride concentrations (CCl) of concrete samples determined via potentiometric titration. (wt. % of concrete).
Temperature (°C)SampleDepth (mm)
1020304050
22CT22-A0.5720.3540.1380.0580.060
CT22-B0.6340.2410.0990.0840.242
ΔCCl0.0620.1130.0390.0260.182
50CT50-A0.9160.6500.3010.2500.292
CT50-B0.7680.4780.4370.3720.325
ΔCCl0.1480.1720.1360.1220.033
Temperature gradient (TG)TG-A1.2171.0950.9140.8330.600
TG-B1.2911.1580.8230.7390.518
ΔCCl0.0740.0630.0910.0940.082
Table 3. Apparent diffusion coefficients of concrete: DCl and residual sum of squares, SR estimated with the method of least squares fit.
SampleDCl (×10−11 m2/s)SR
CT22-A5.370.025
CT22-B4.730.064
CT50-A18.10.040
CT50-B19.20.113
Table 4. Estimated time to corrosion initiation, calculated with/without consideration of thermo-diffusion effect for the different temperature gradients from 10 to 40 °C/wall thickness with fixed external temperature (A and B) and with daily temperature variations (C and D).
ΔT
(°C/Wall Thickness)
Time to Corrosion Initiation (Month)
Fixed ΔTDaily Variation T
Without Thermo-Diffusion (A)With Thermo-Diffusion (B)B/AWithout Thermo-Diffusion (C)With Thermo-Diffusion (D)D/C
1064420.6684590.70
2042250.6063410.65
3029170.5955290.53
4020120.6040230.58
Publisher’s Note: MDPI stays neutral with regard to jurisdictional claims in published maps and institutional affiliations.

