
Feasibility Study of a Fan-Driven Device Generating Downforce for Road Cars


Abstract
:1. Introduction
2. Materials and Methods
2.1. The Basic Theory of Periferial Jet
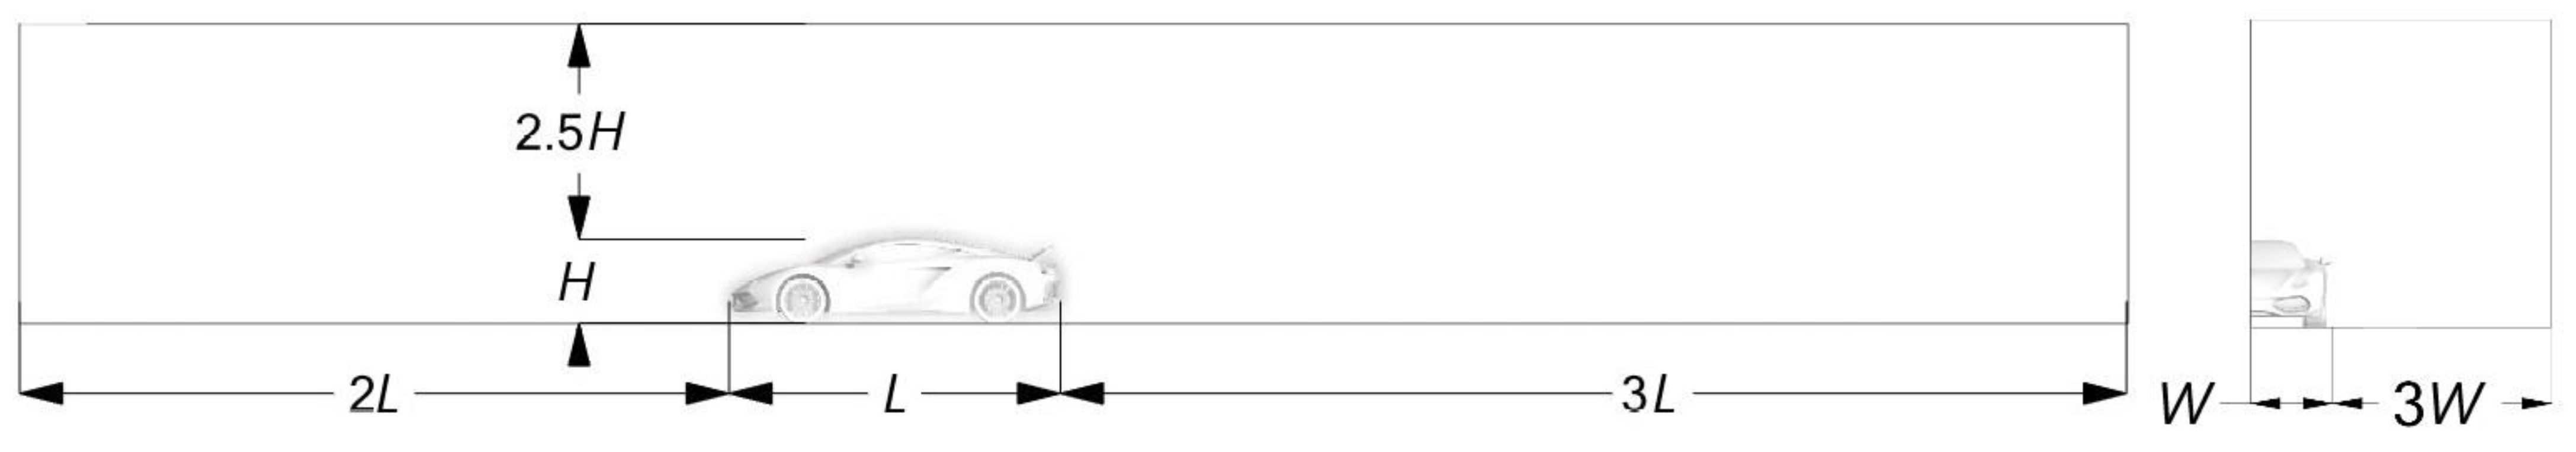
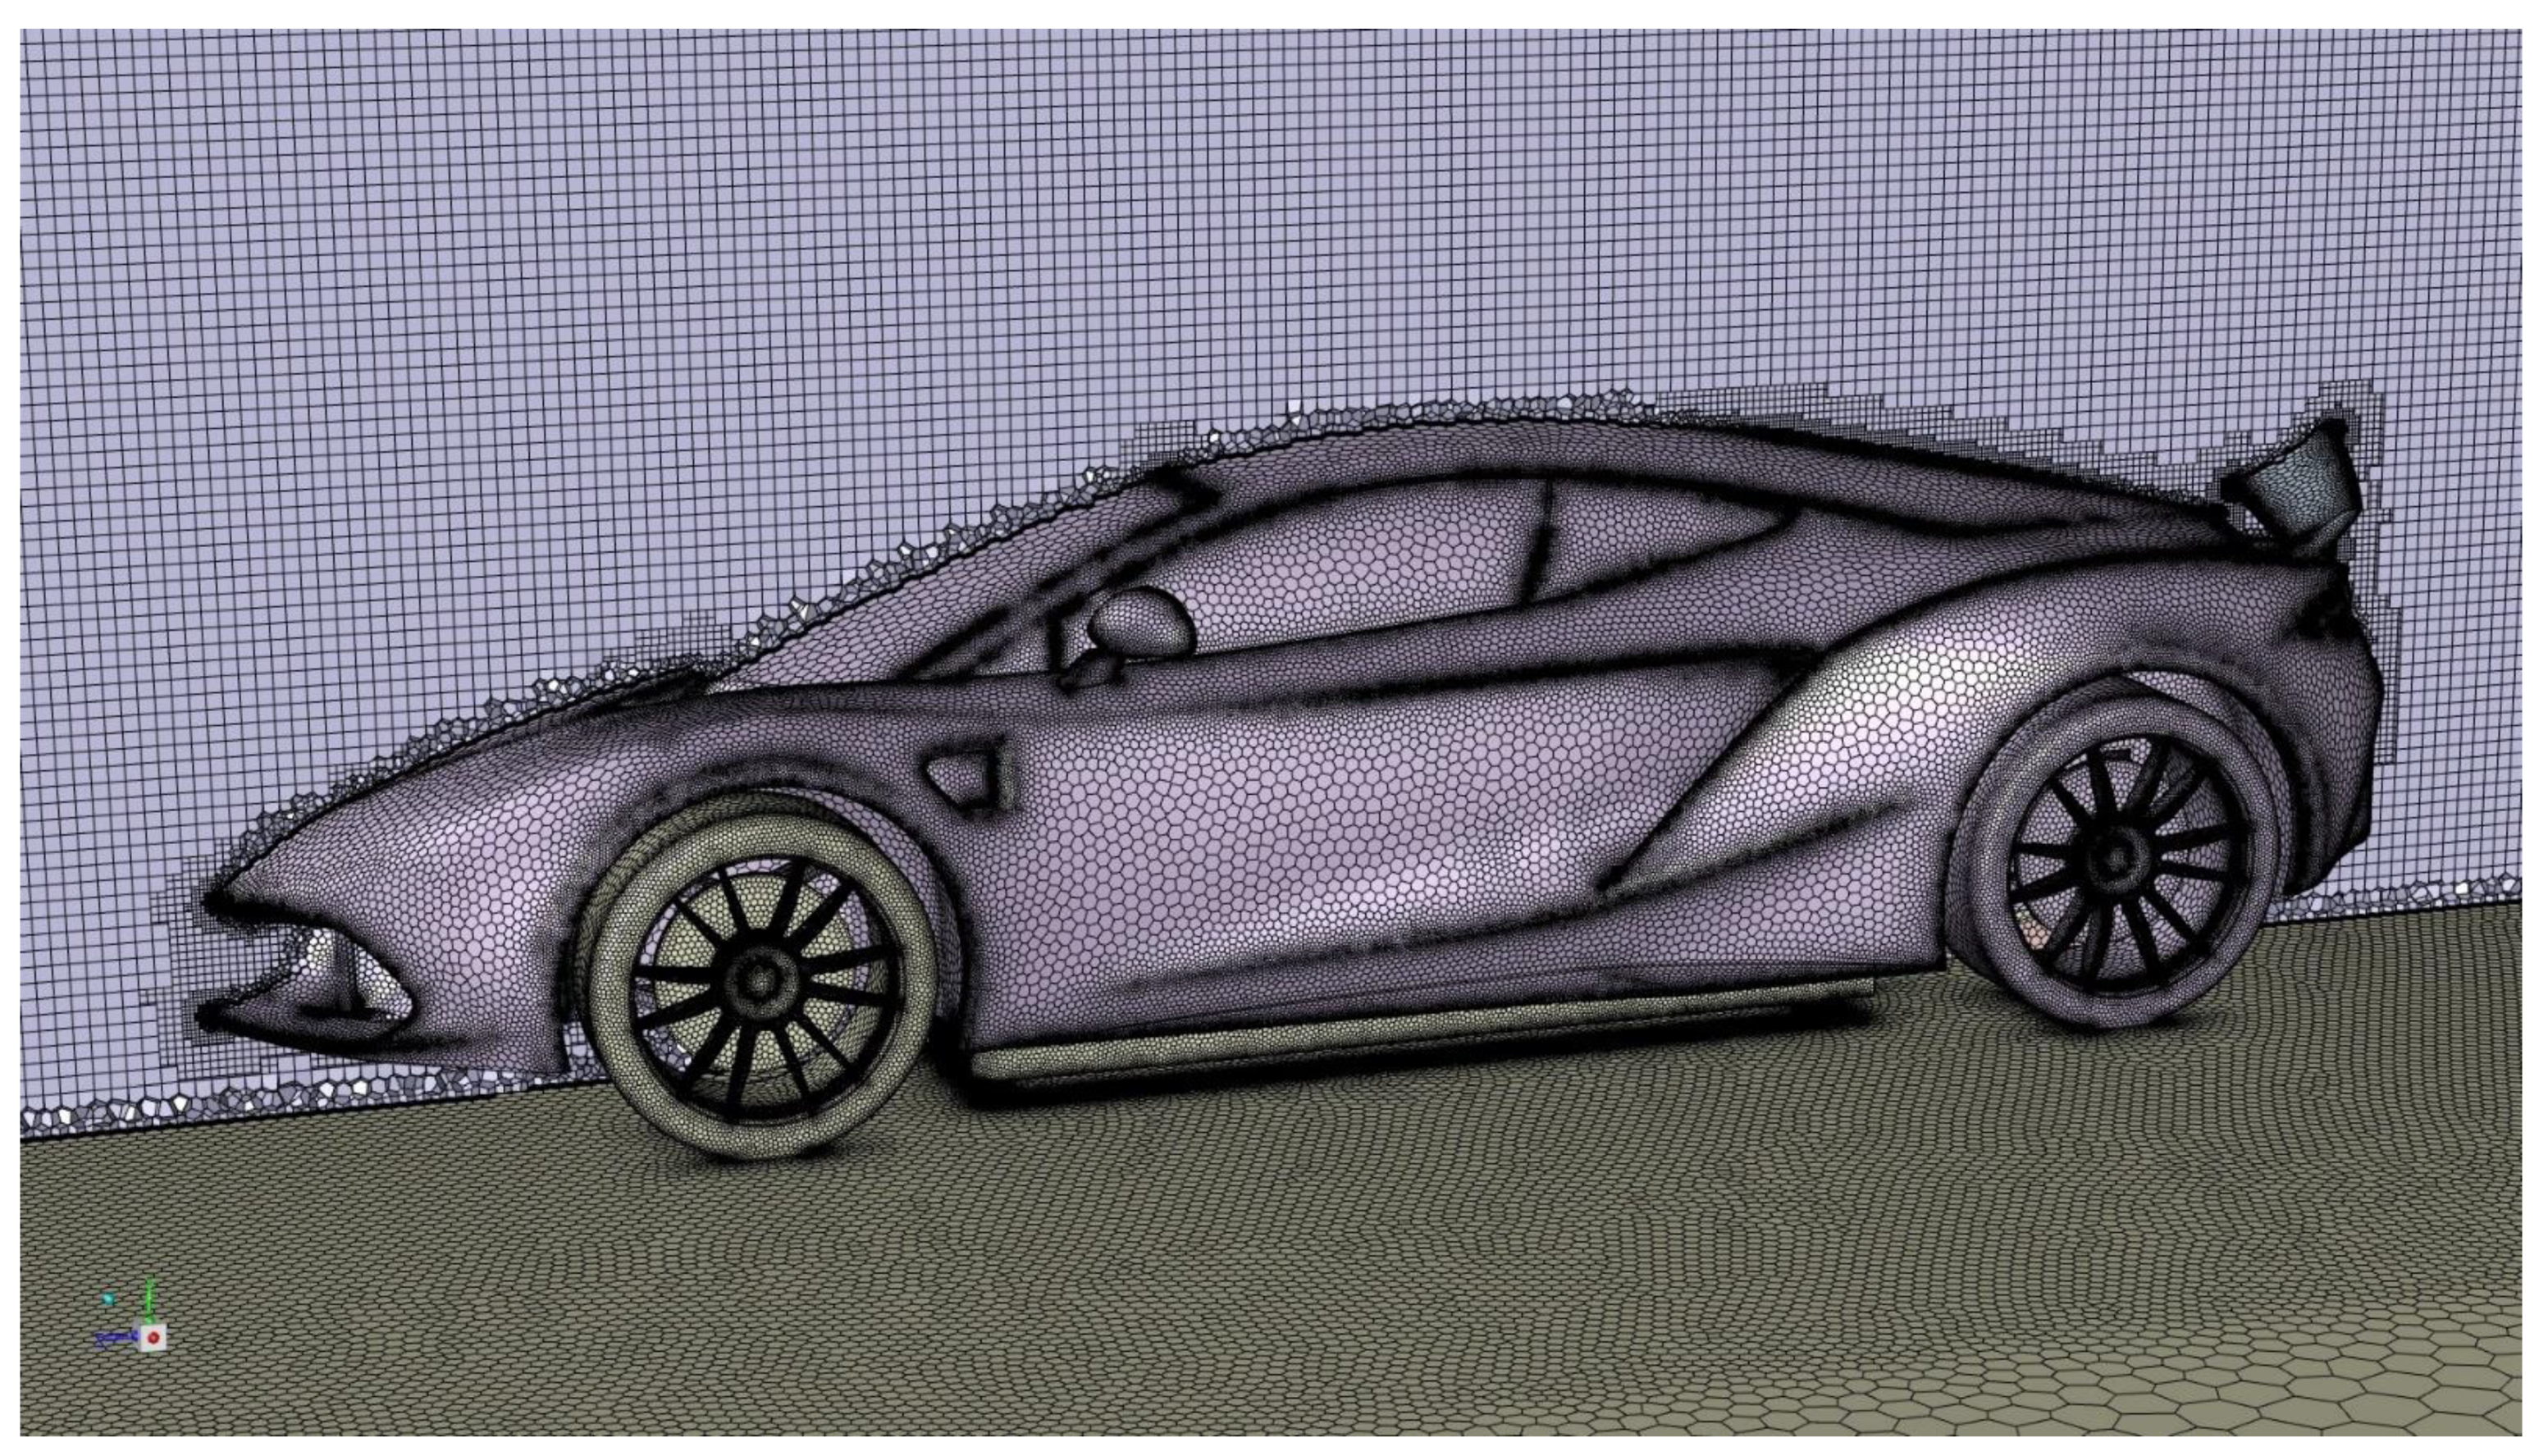
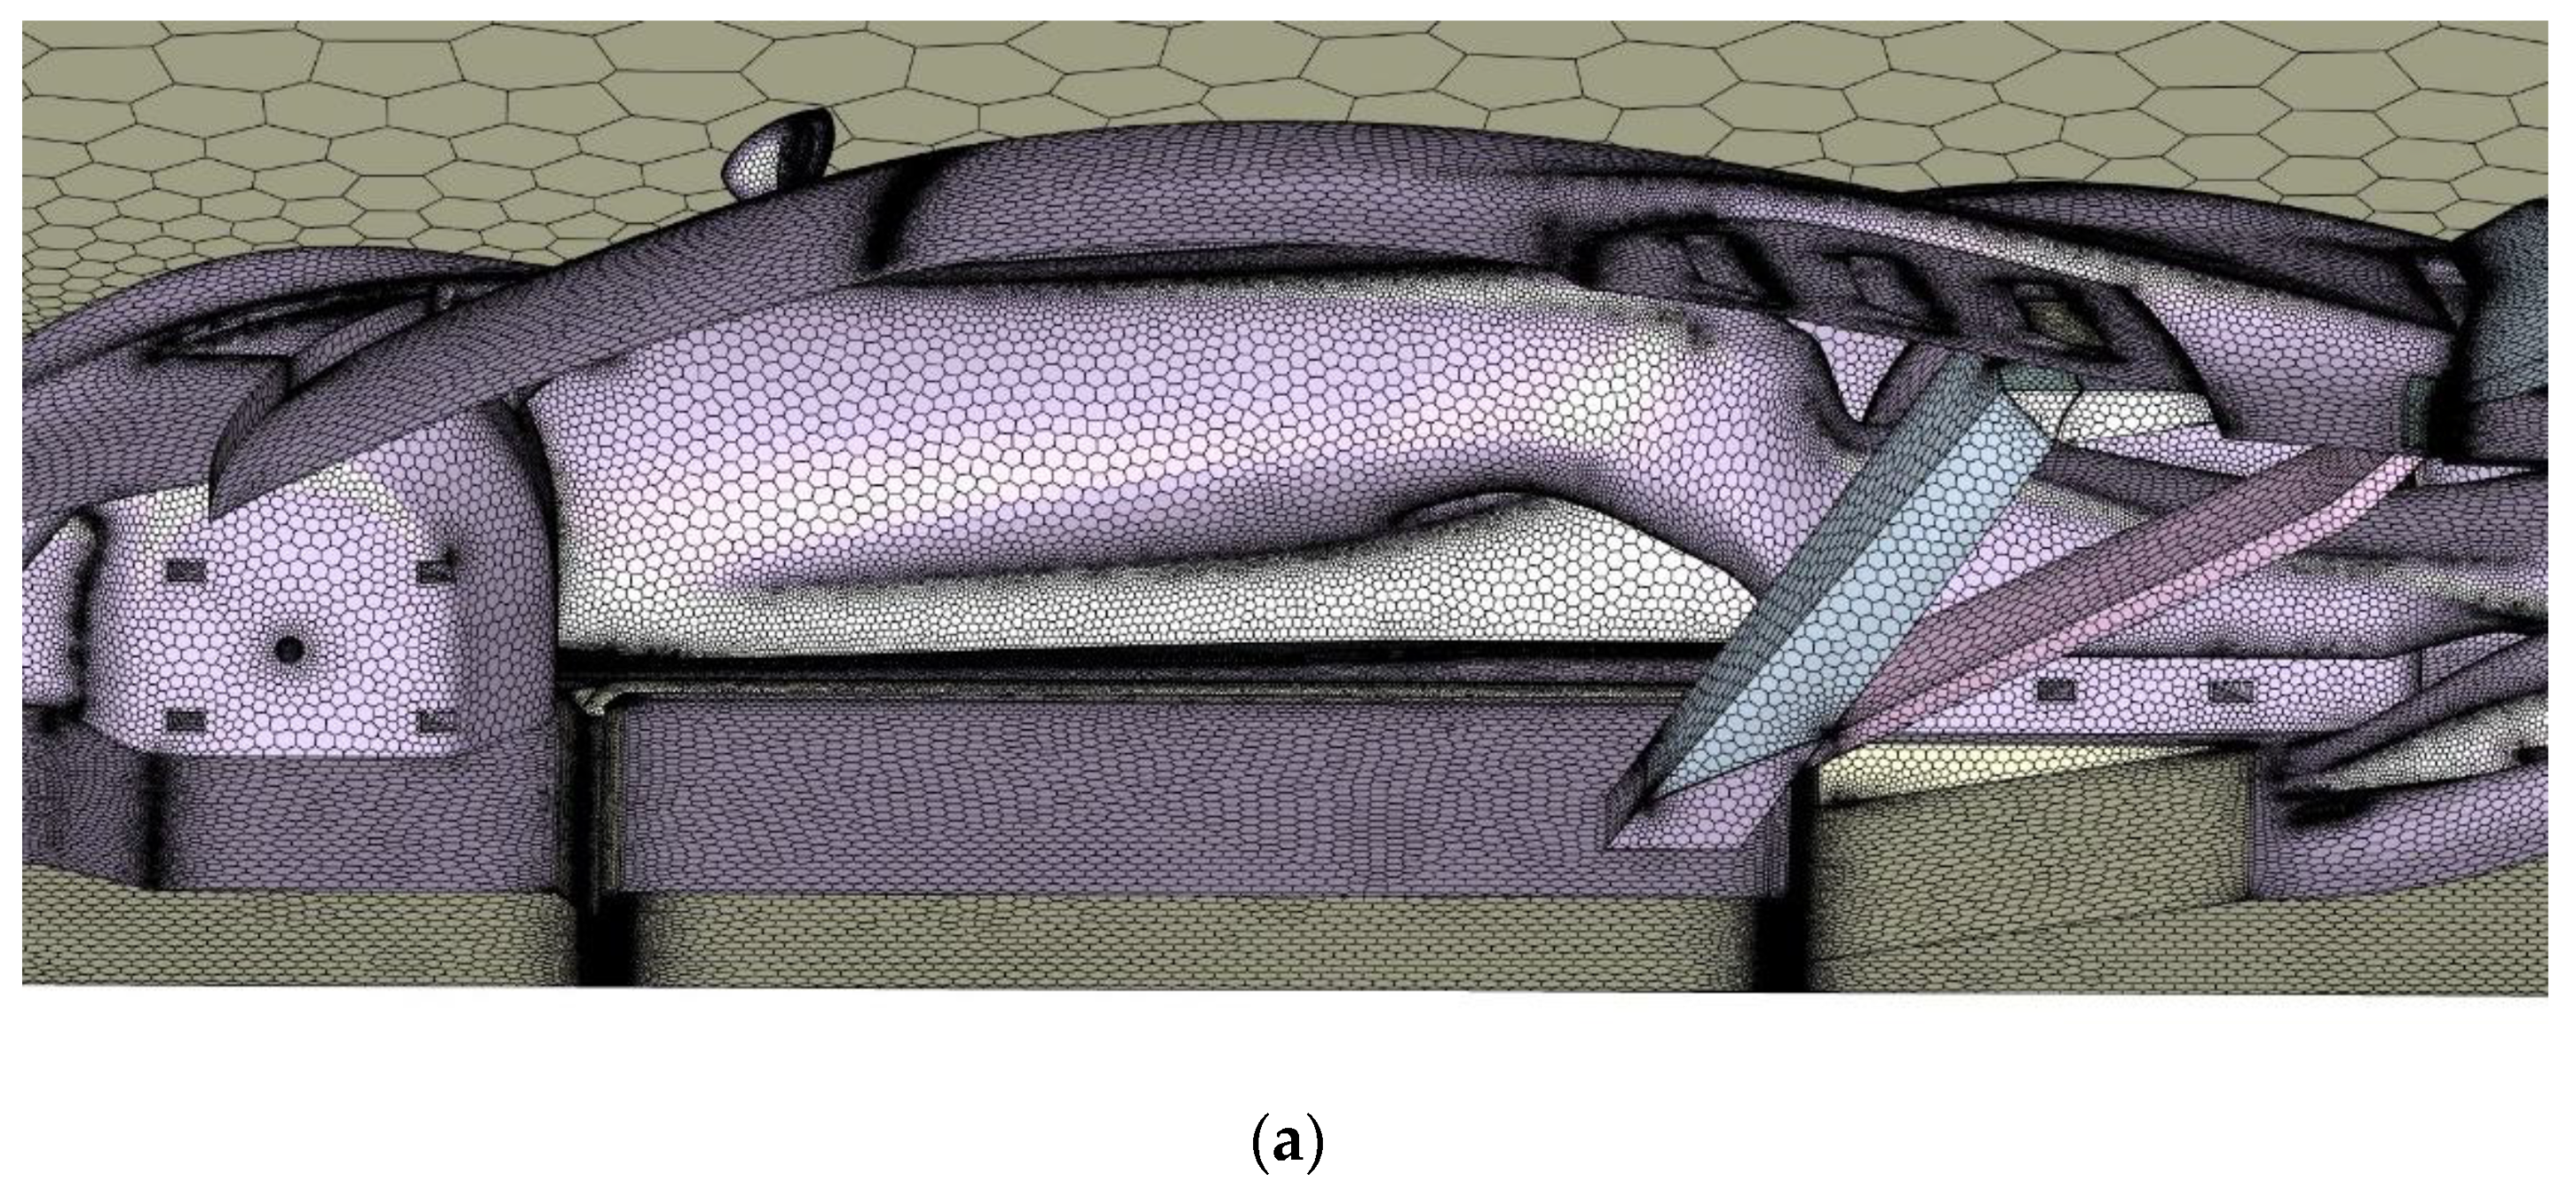
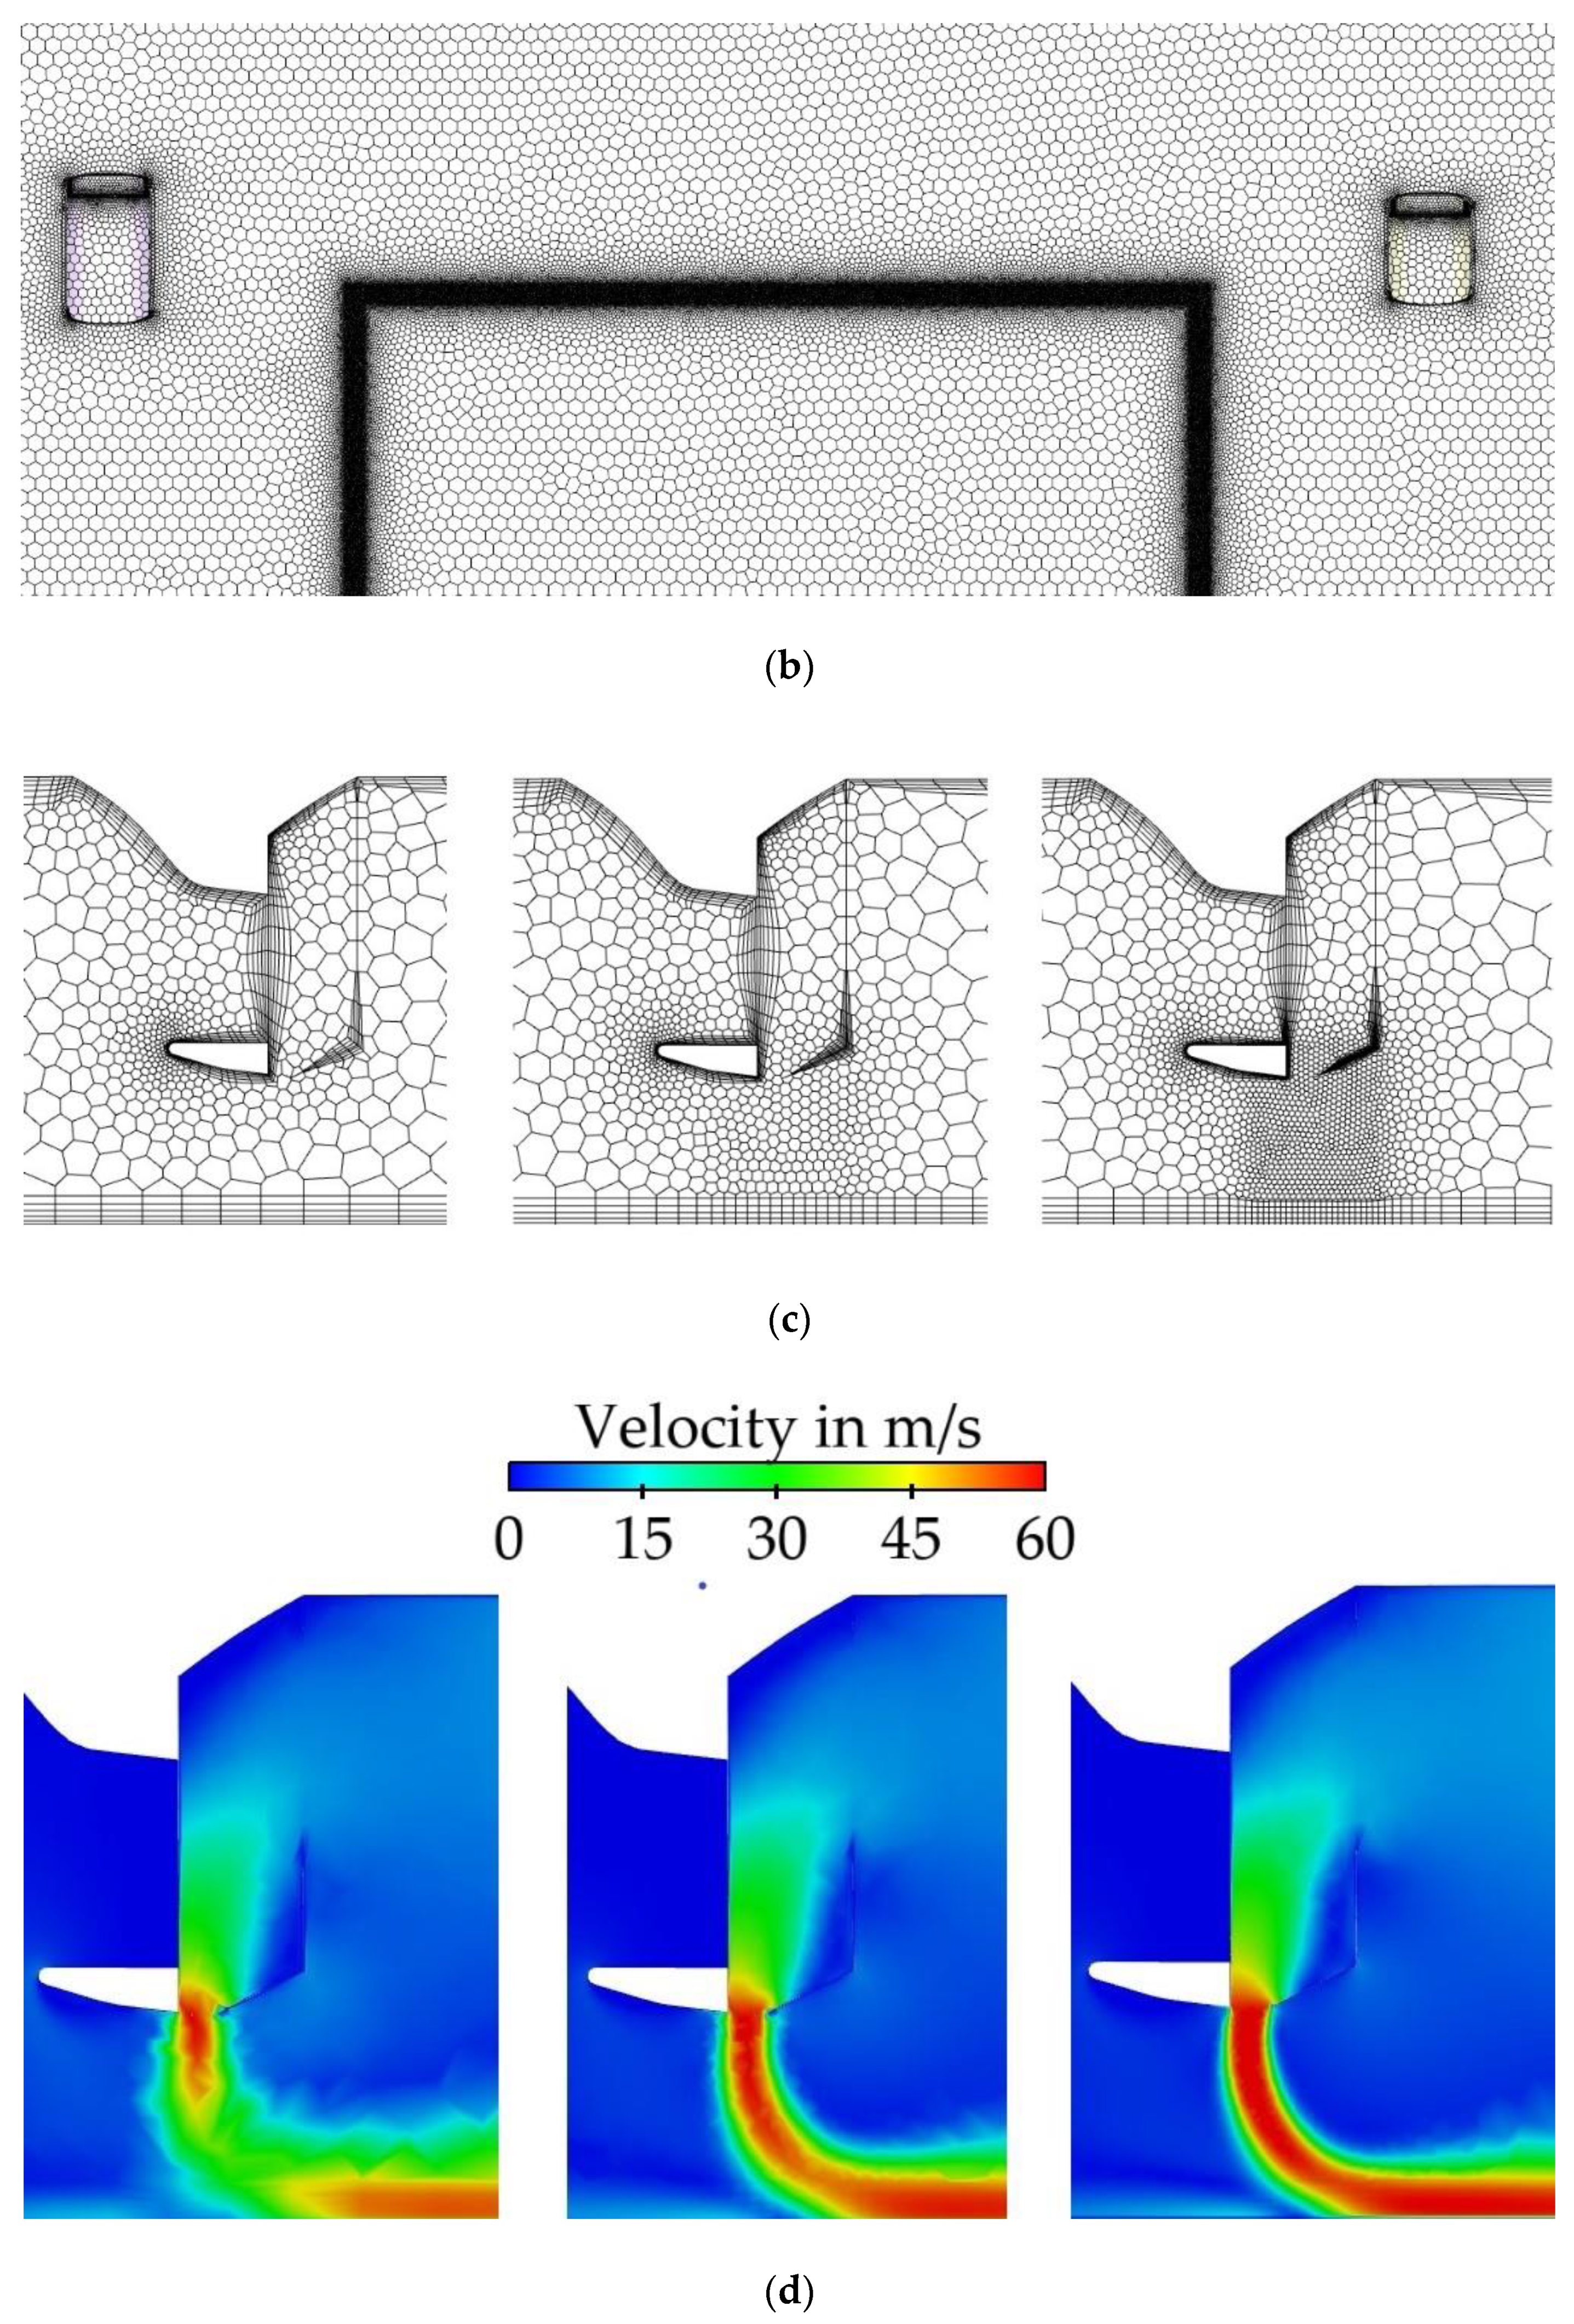
2.2. CFD Methodology
3. Results and Discussion
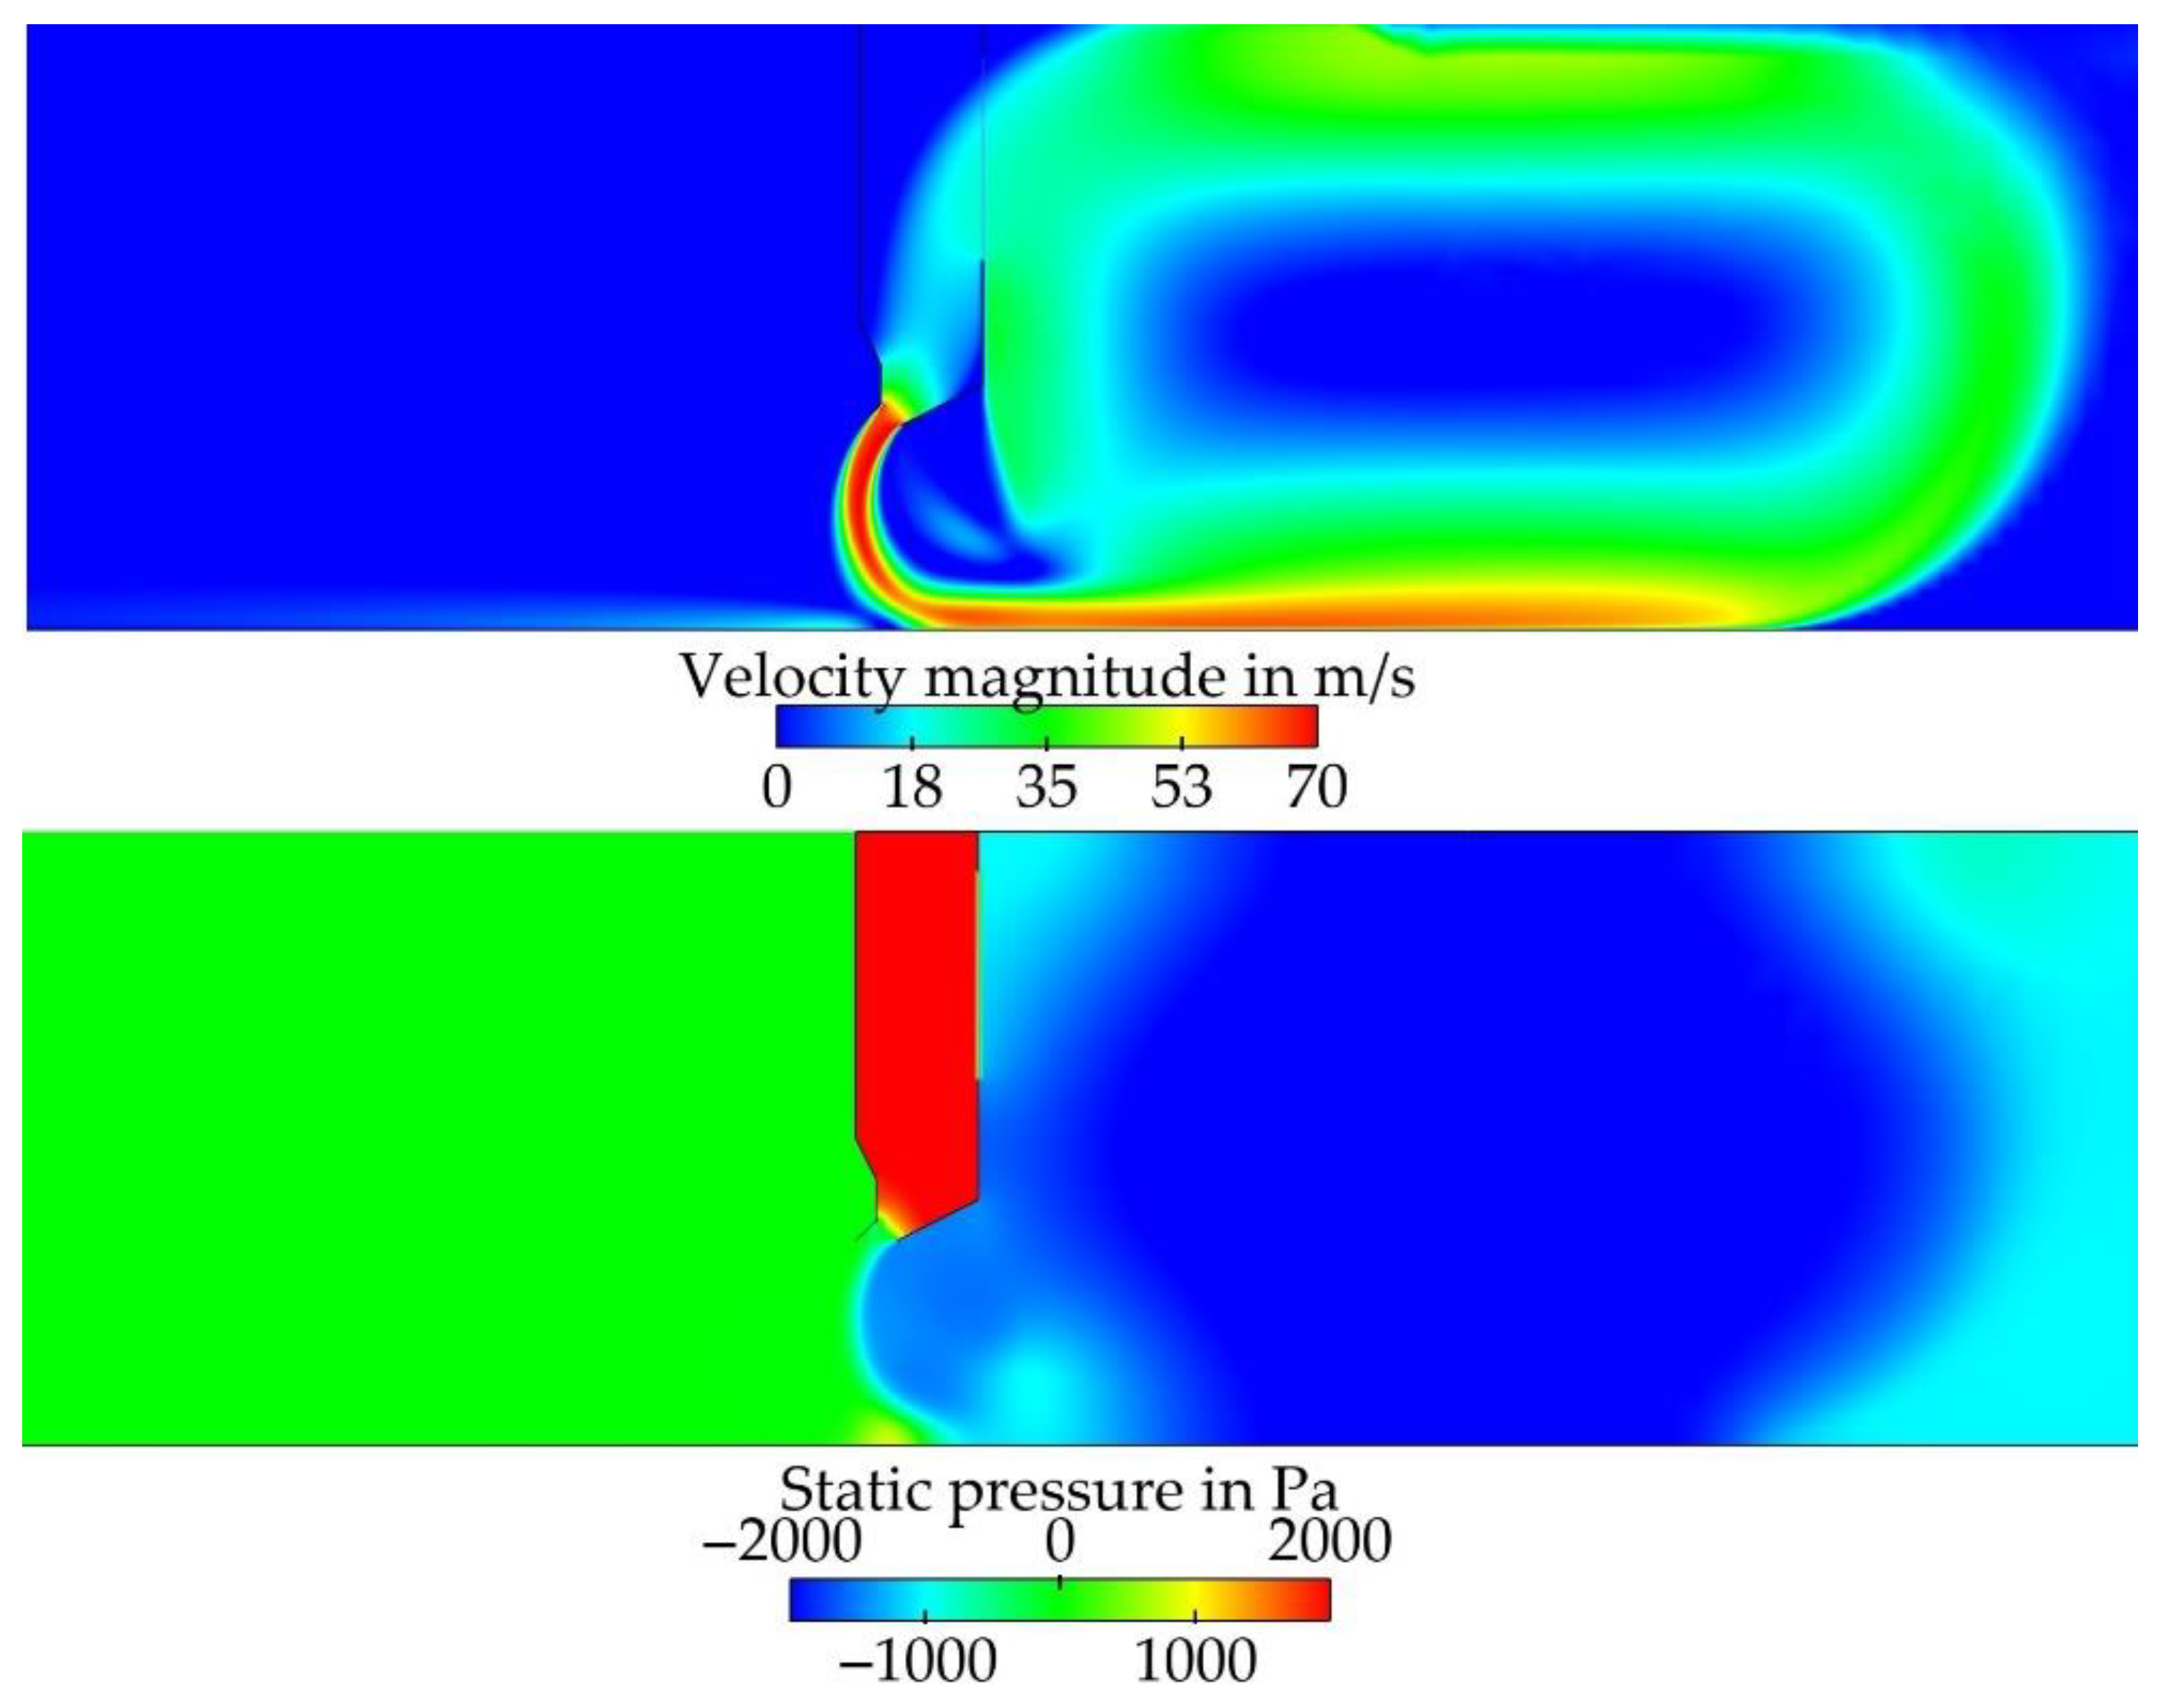
3.1. CFD Analyses of a Two-Dimensional Stationary Air Curtain
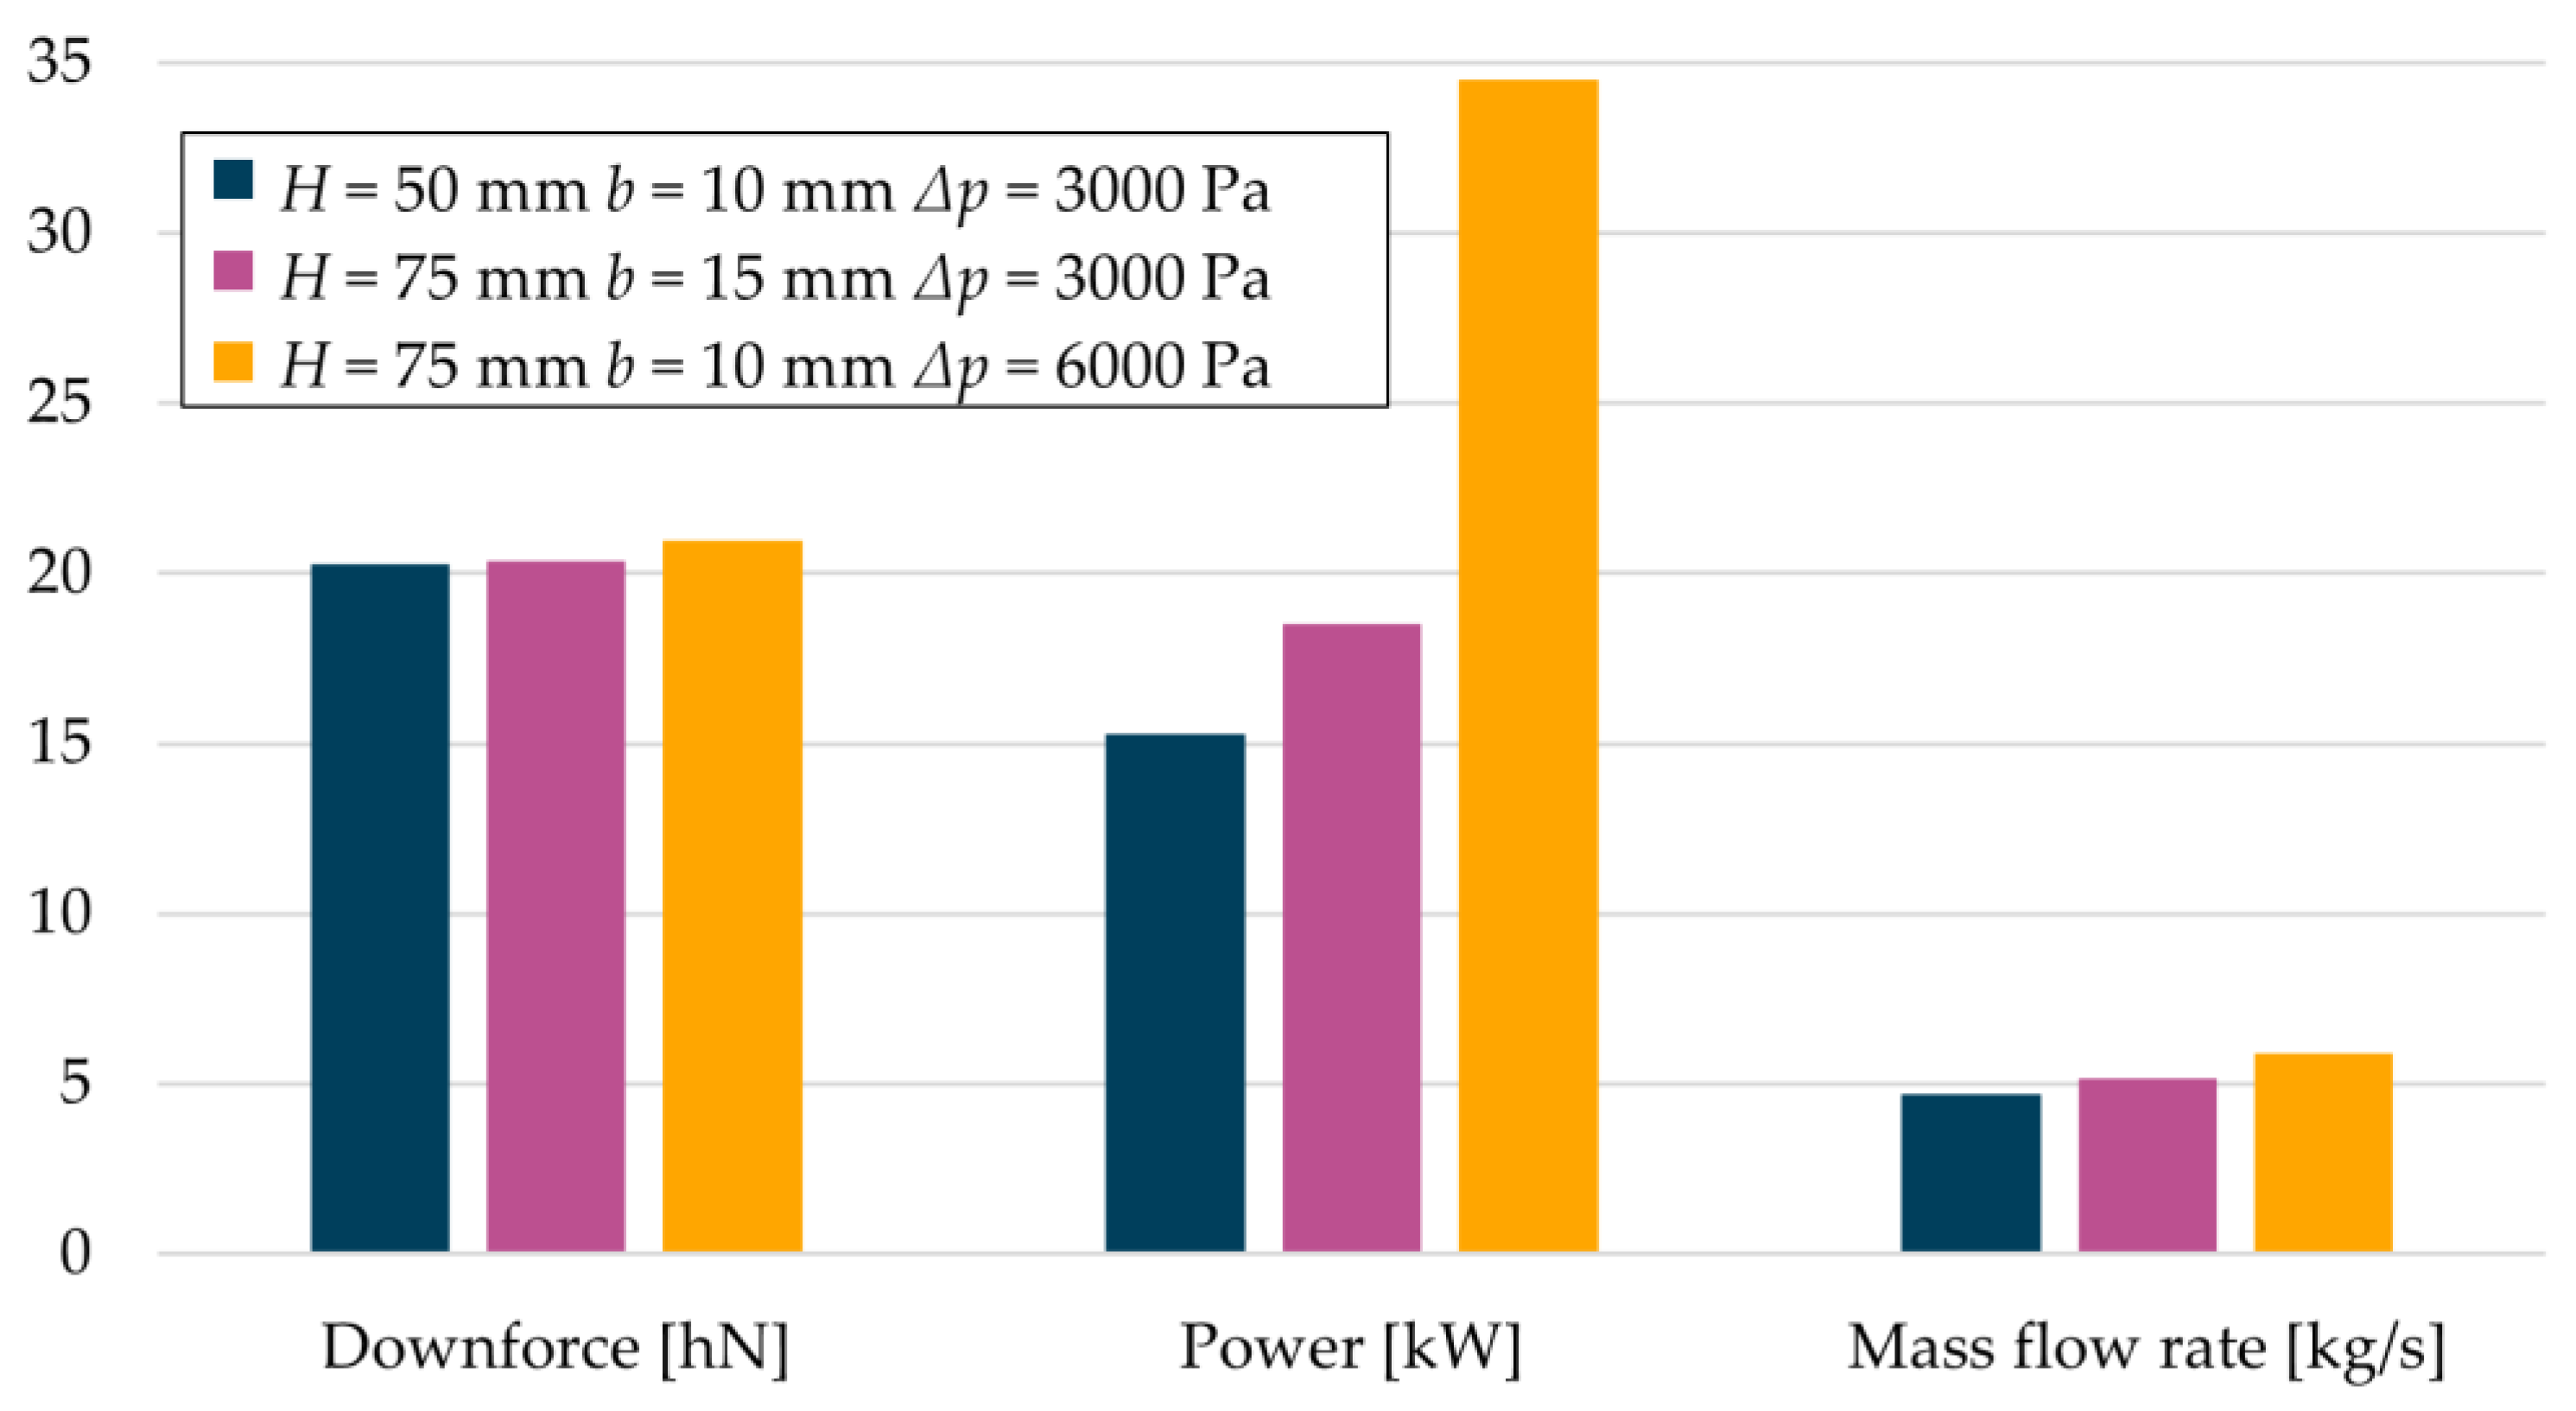
3.1.1. Curtain Height Considerations
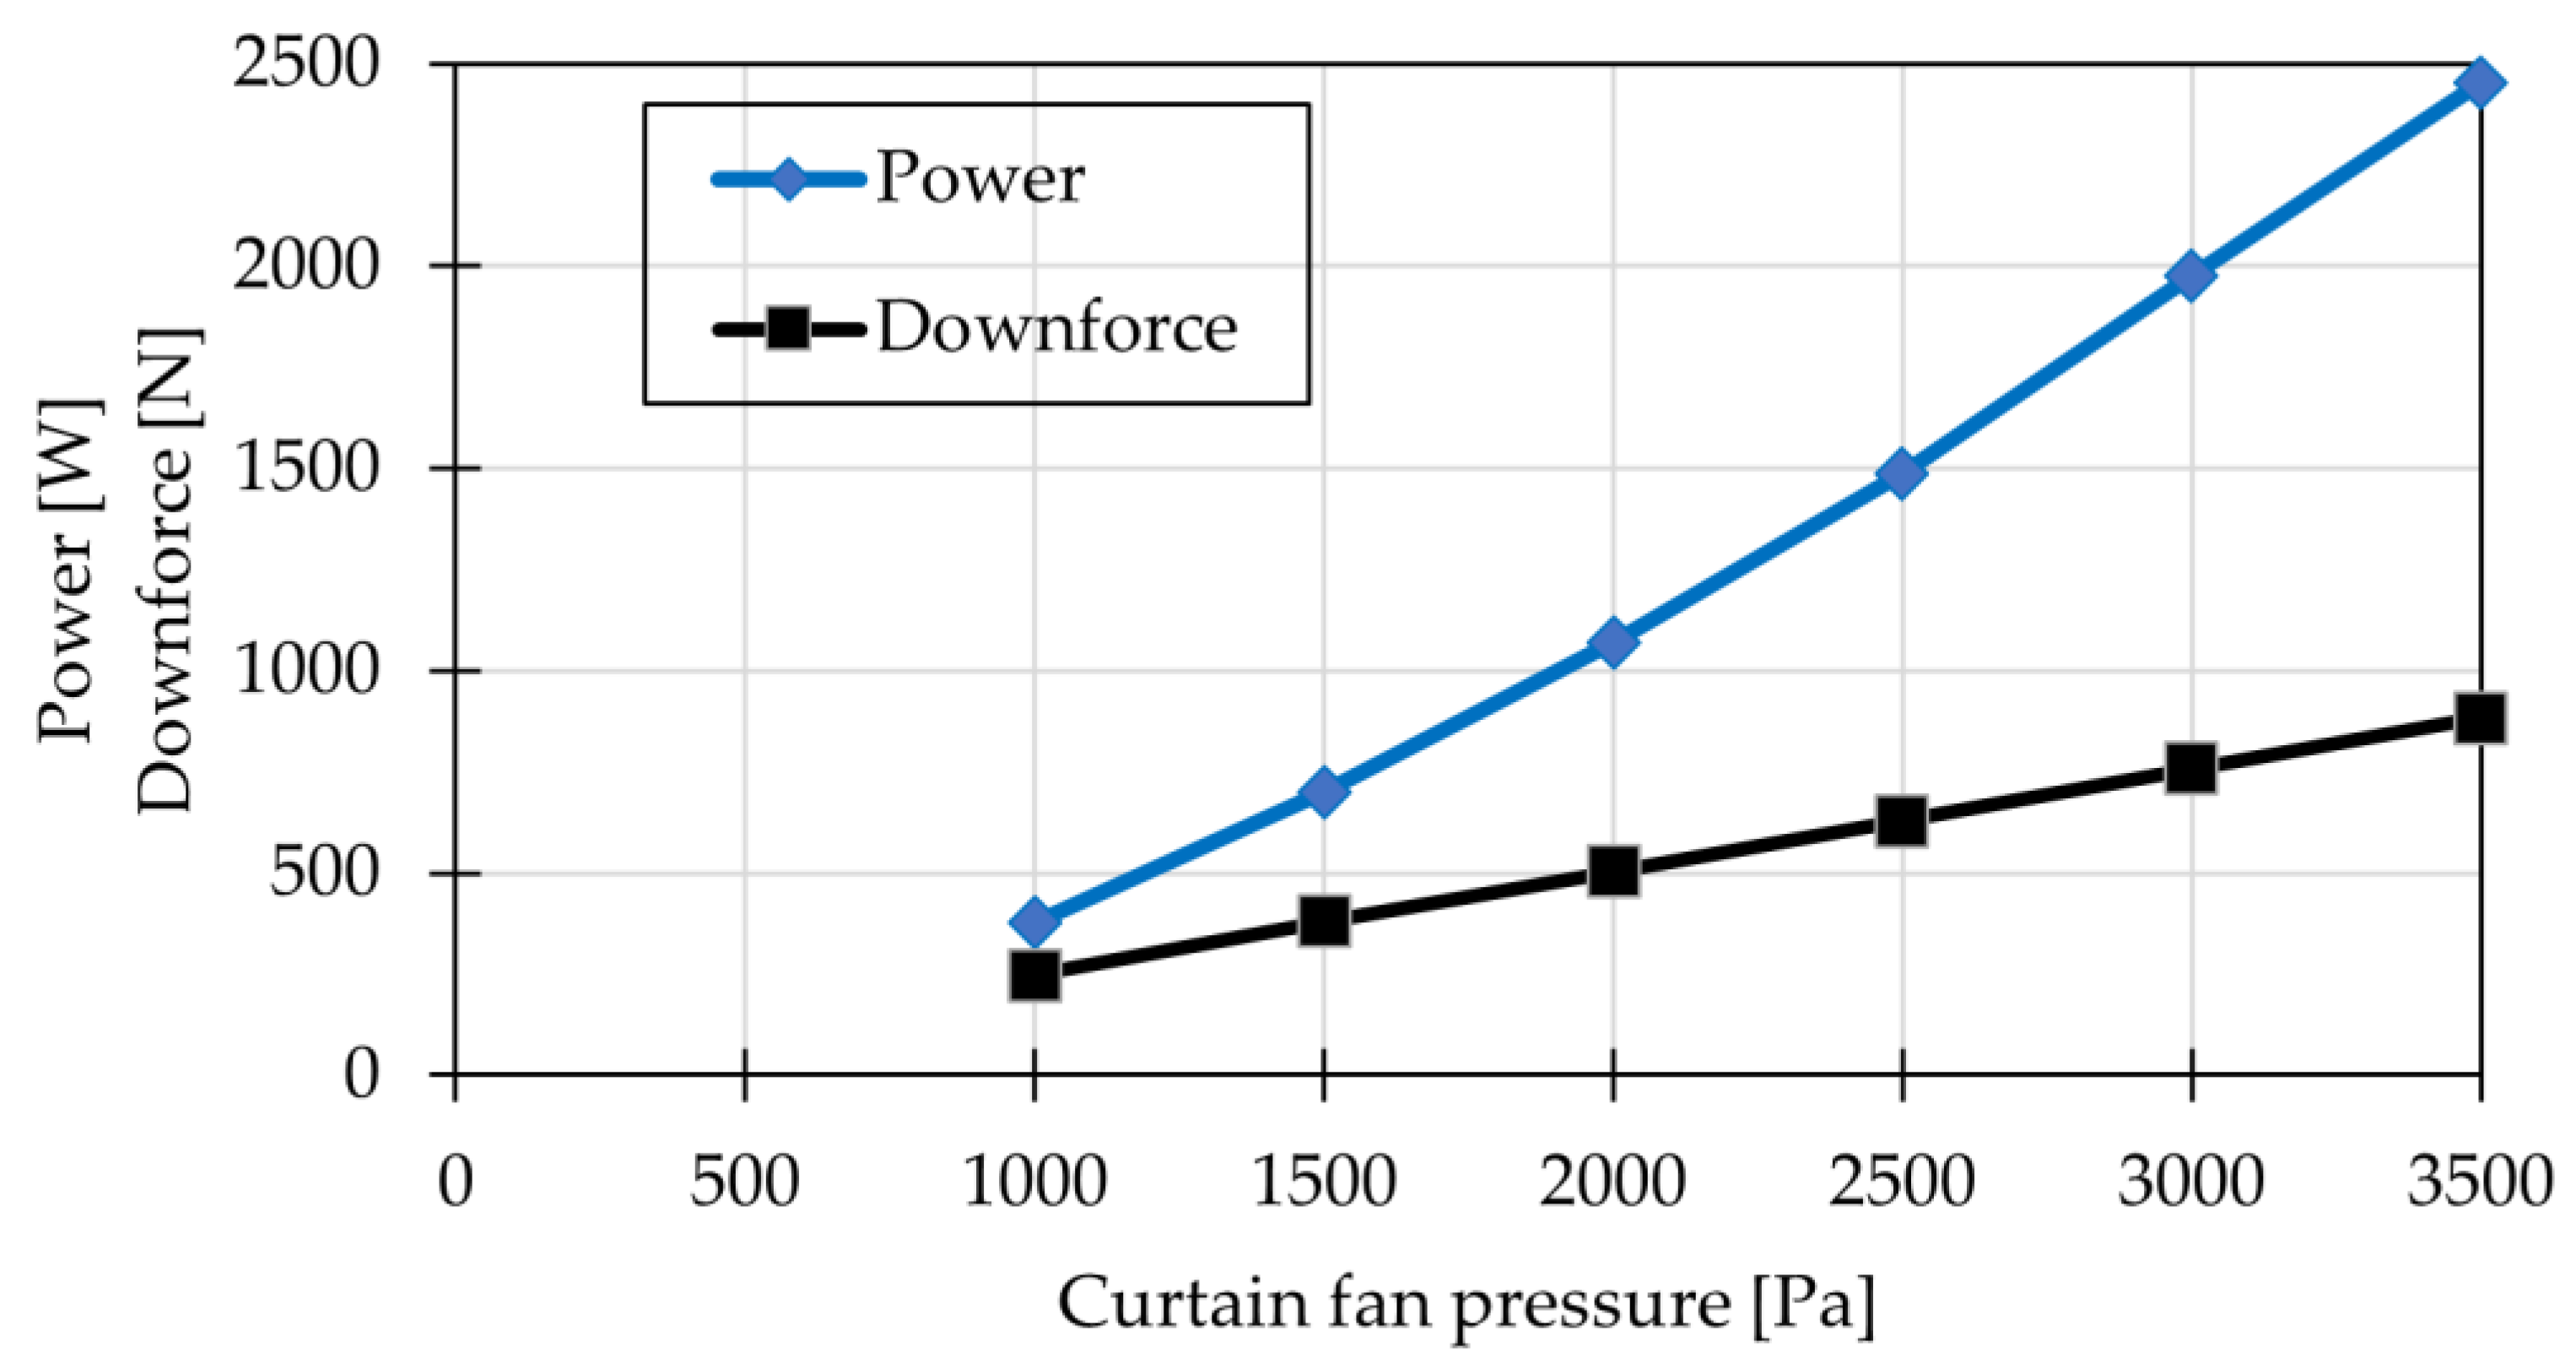
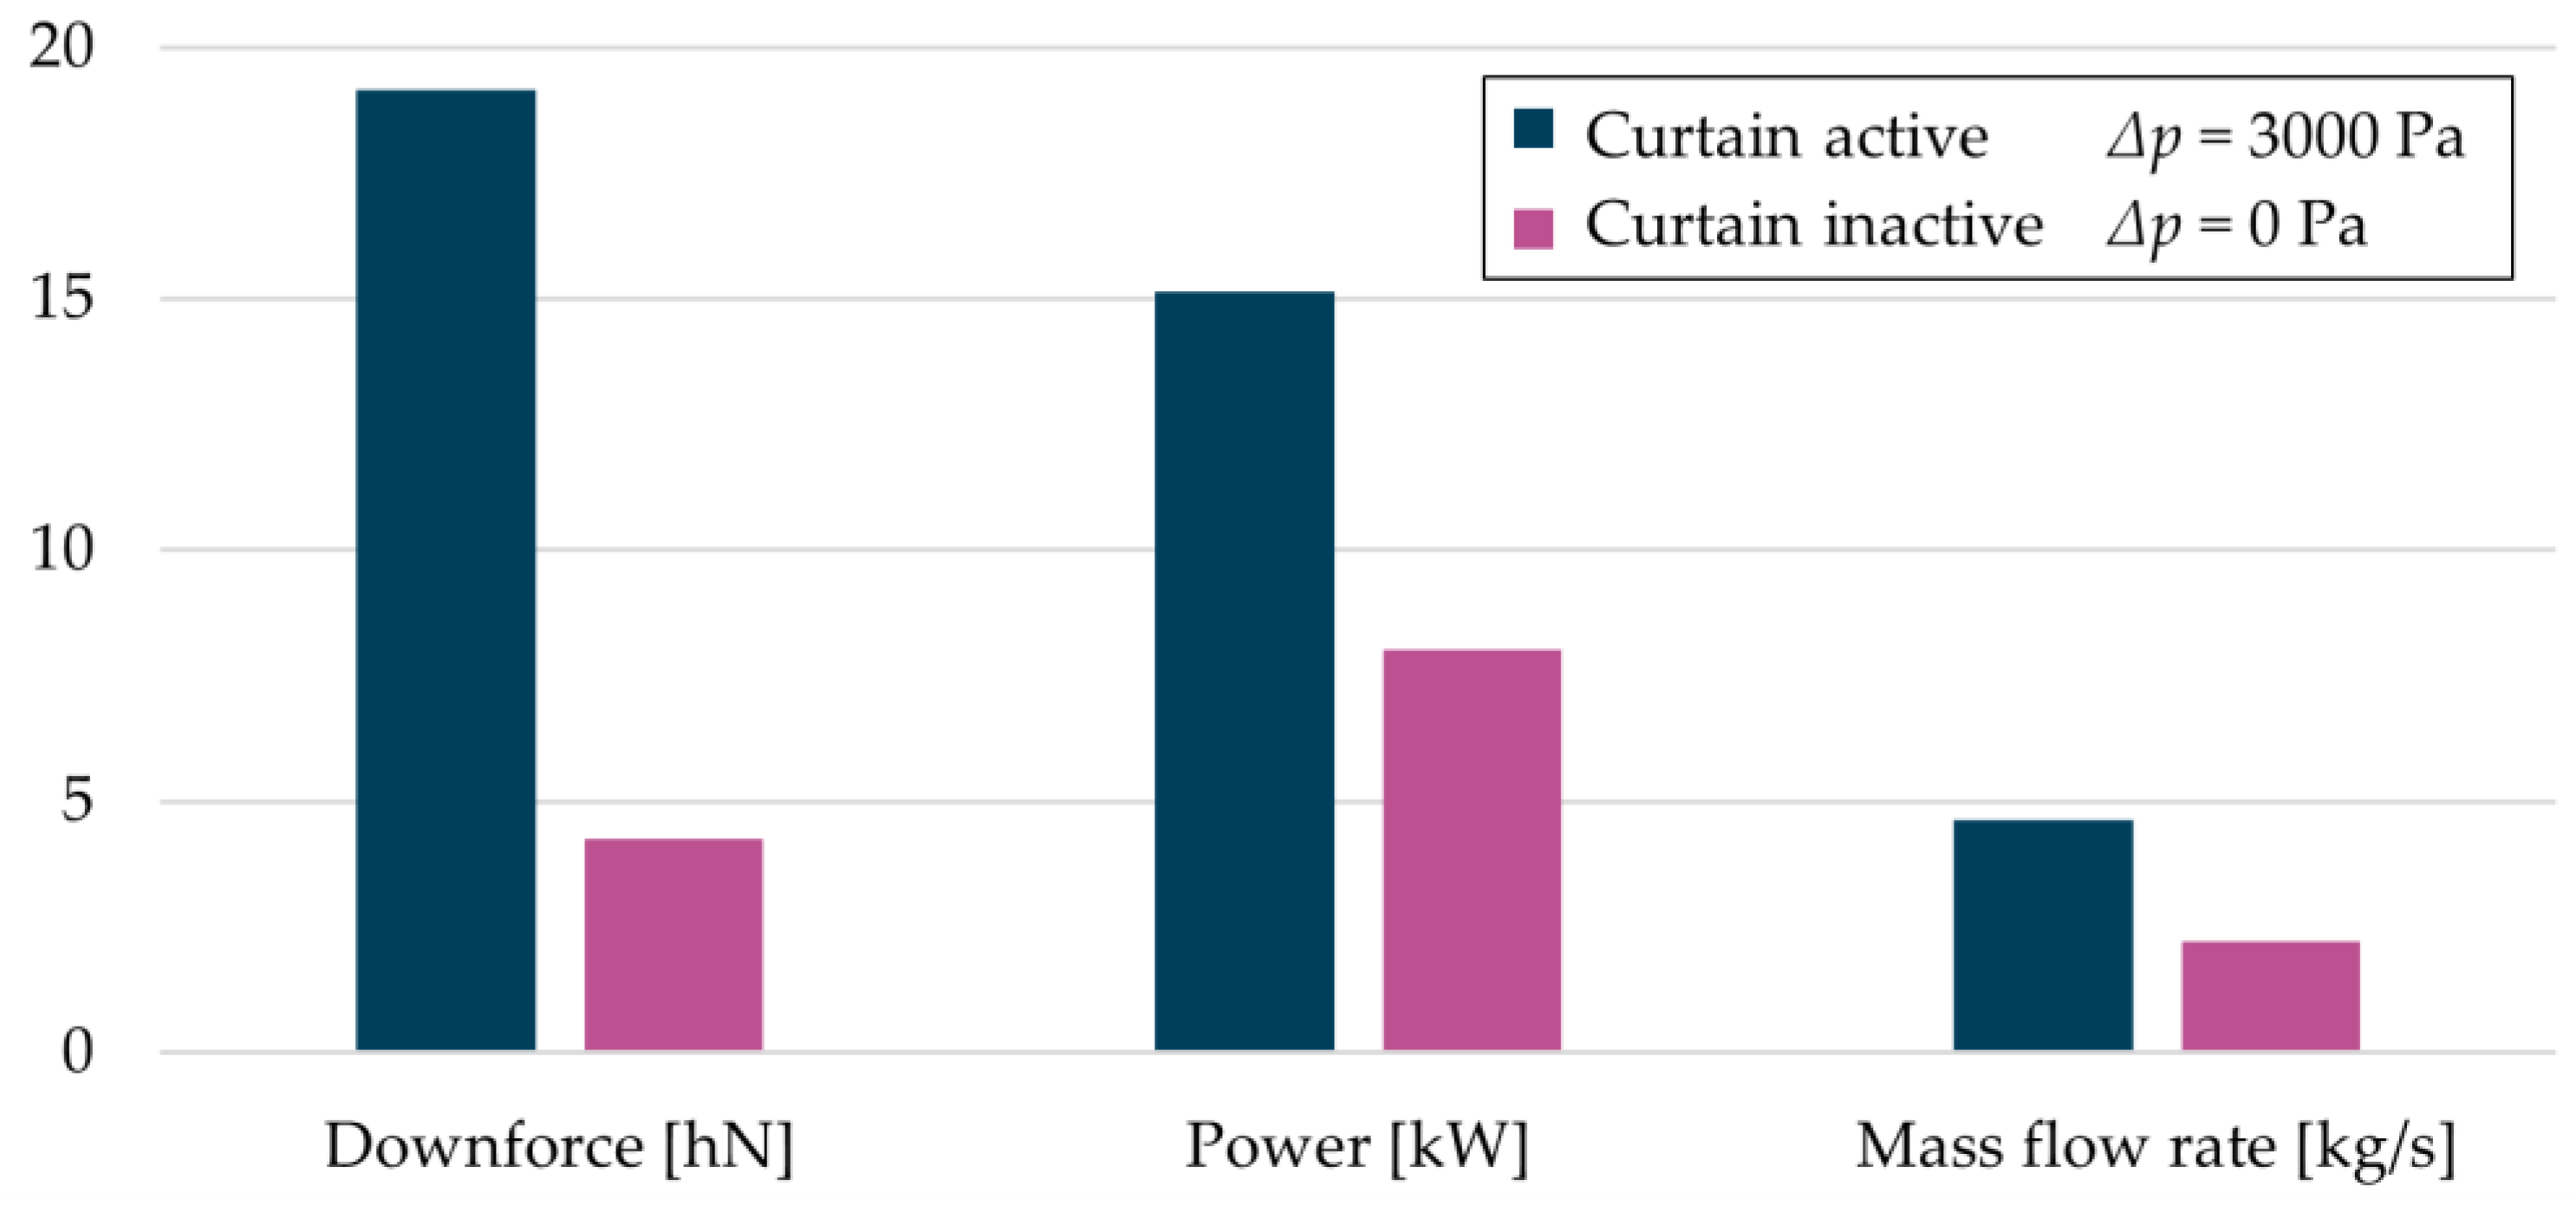
3.1.2. Curtain-Only Variant of FDDG
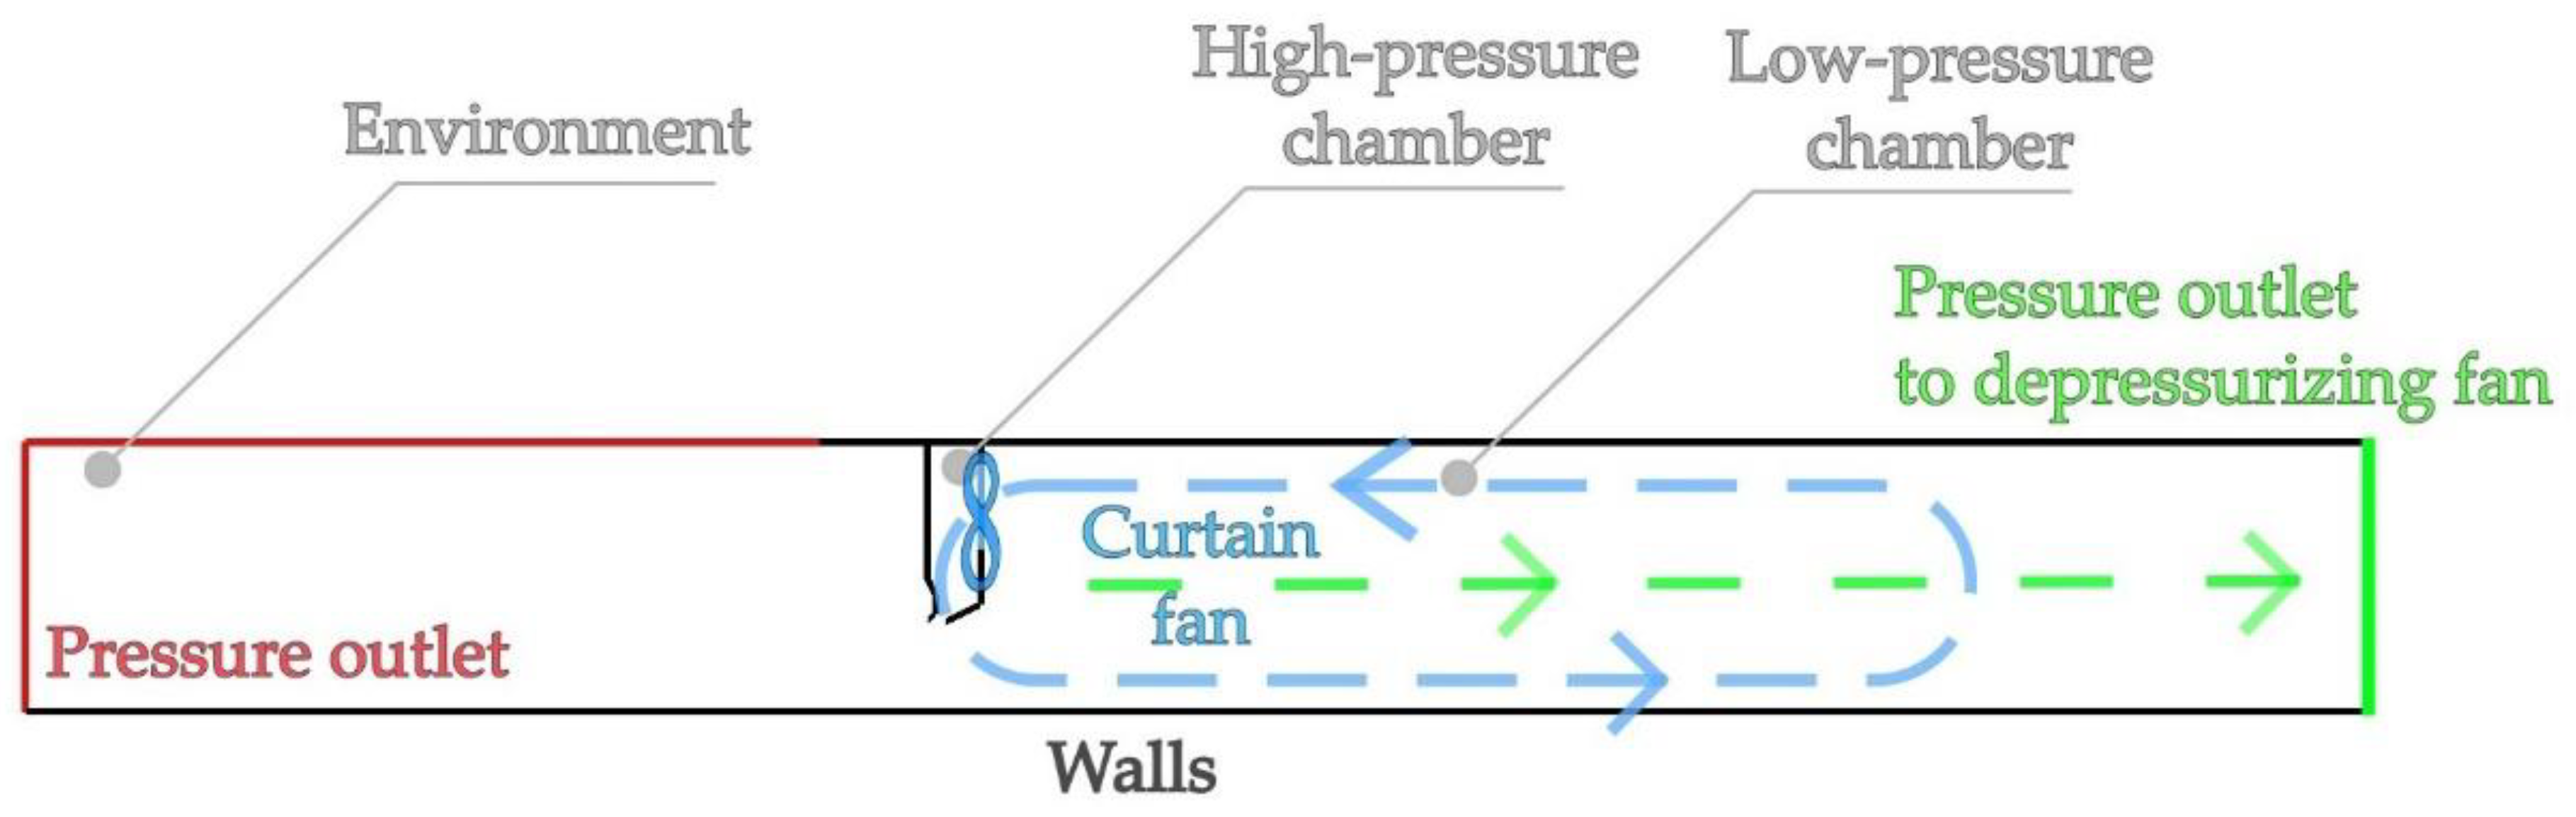
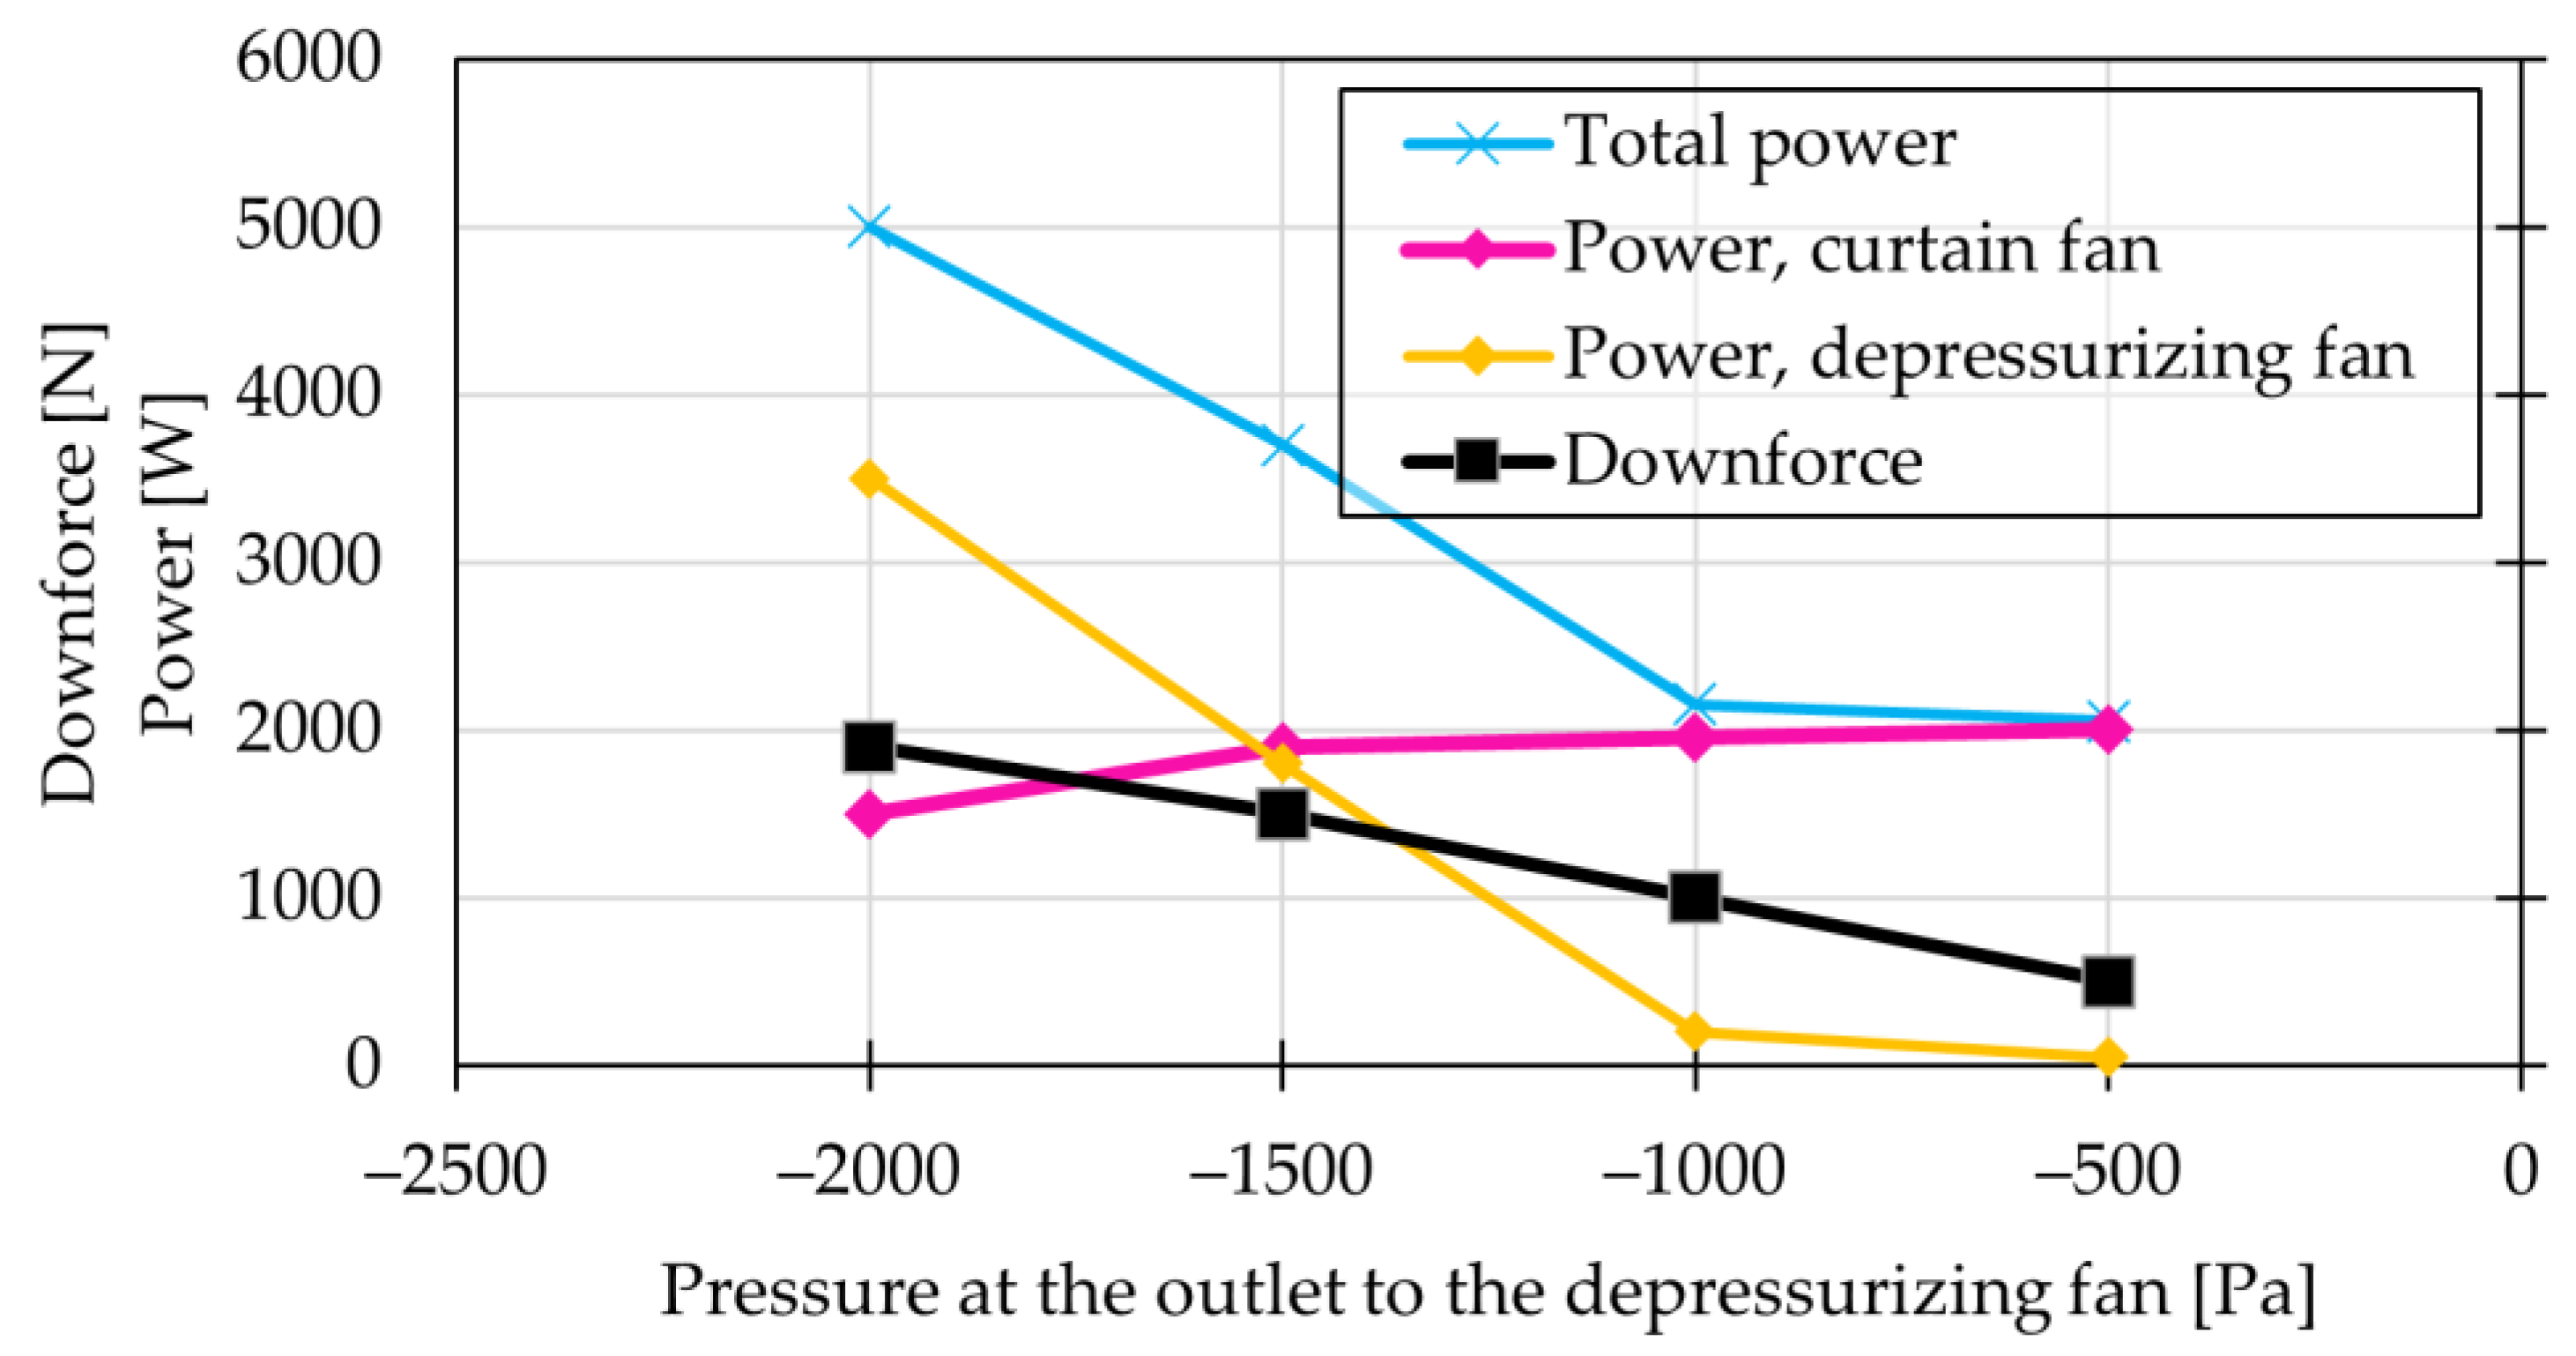
3.1.3. Curtain with Depressurizing Fan
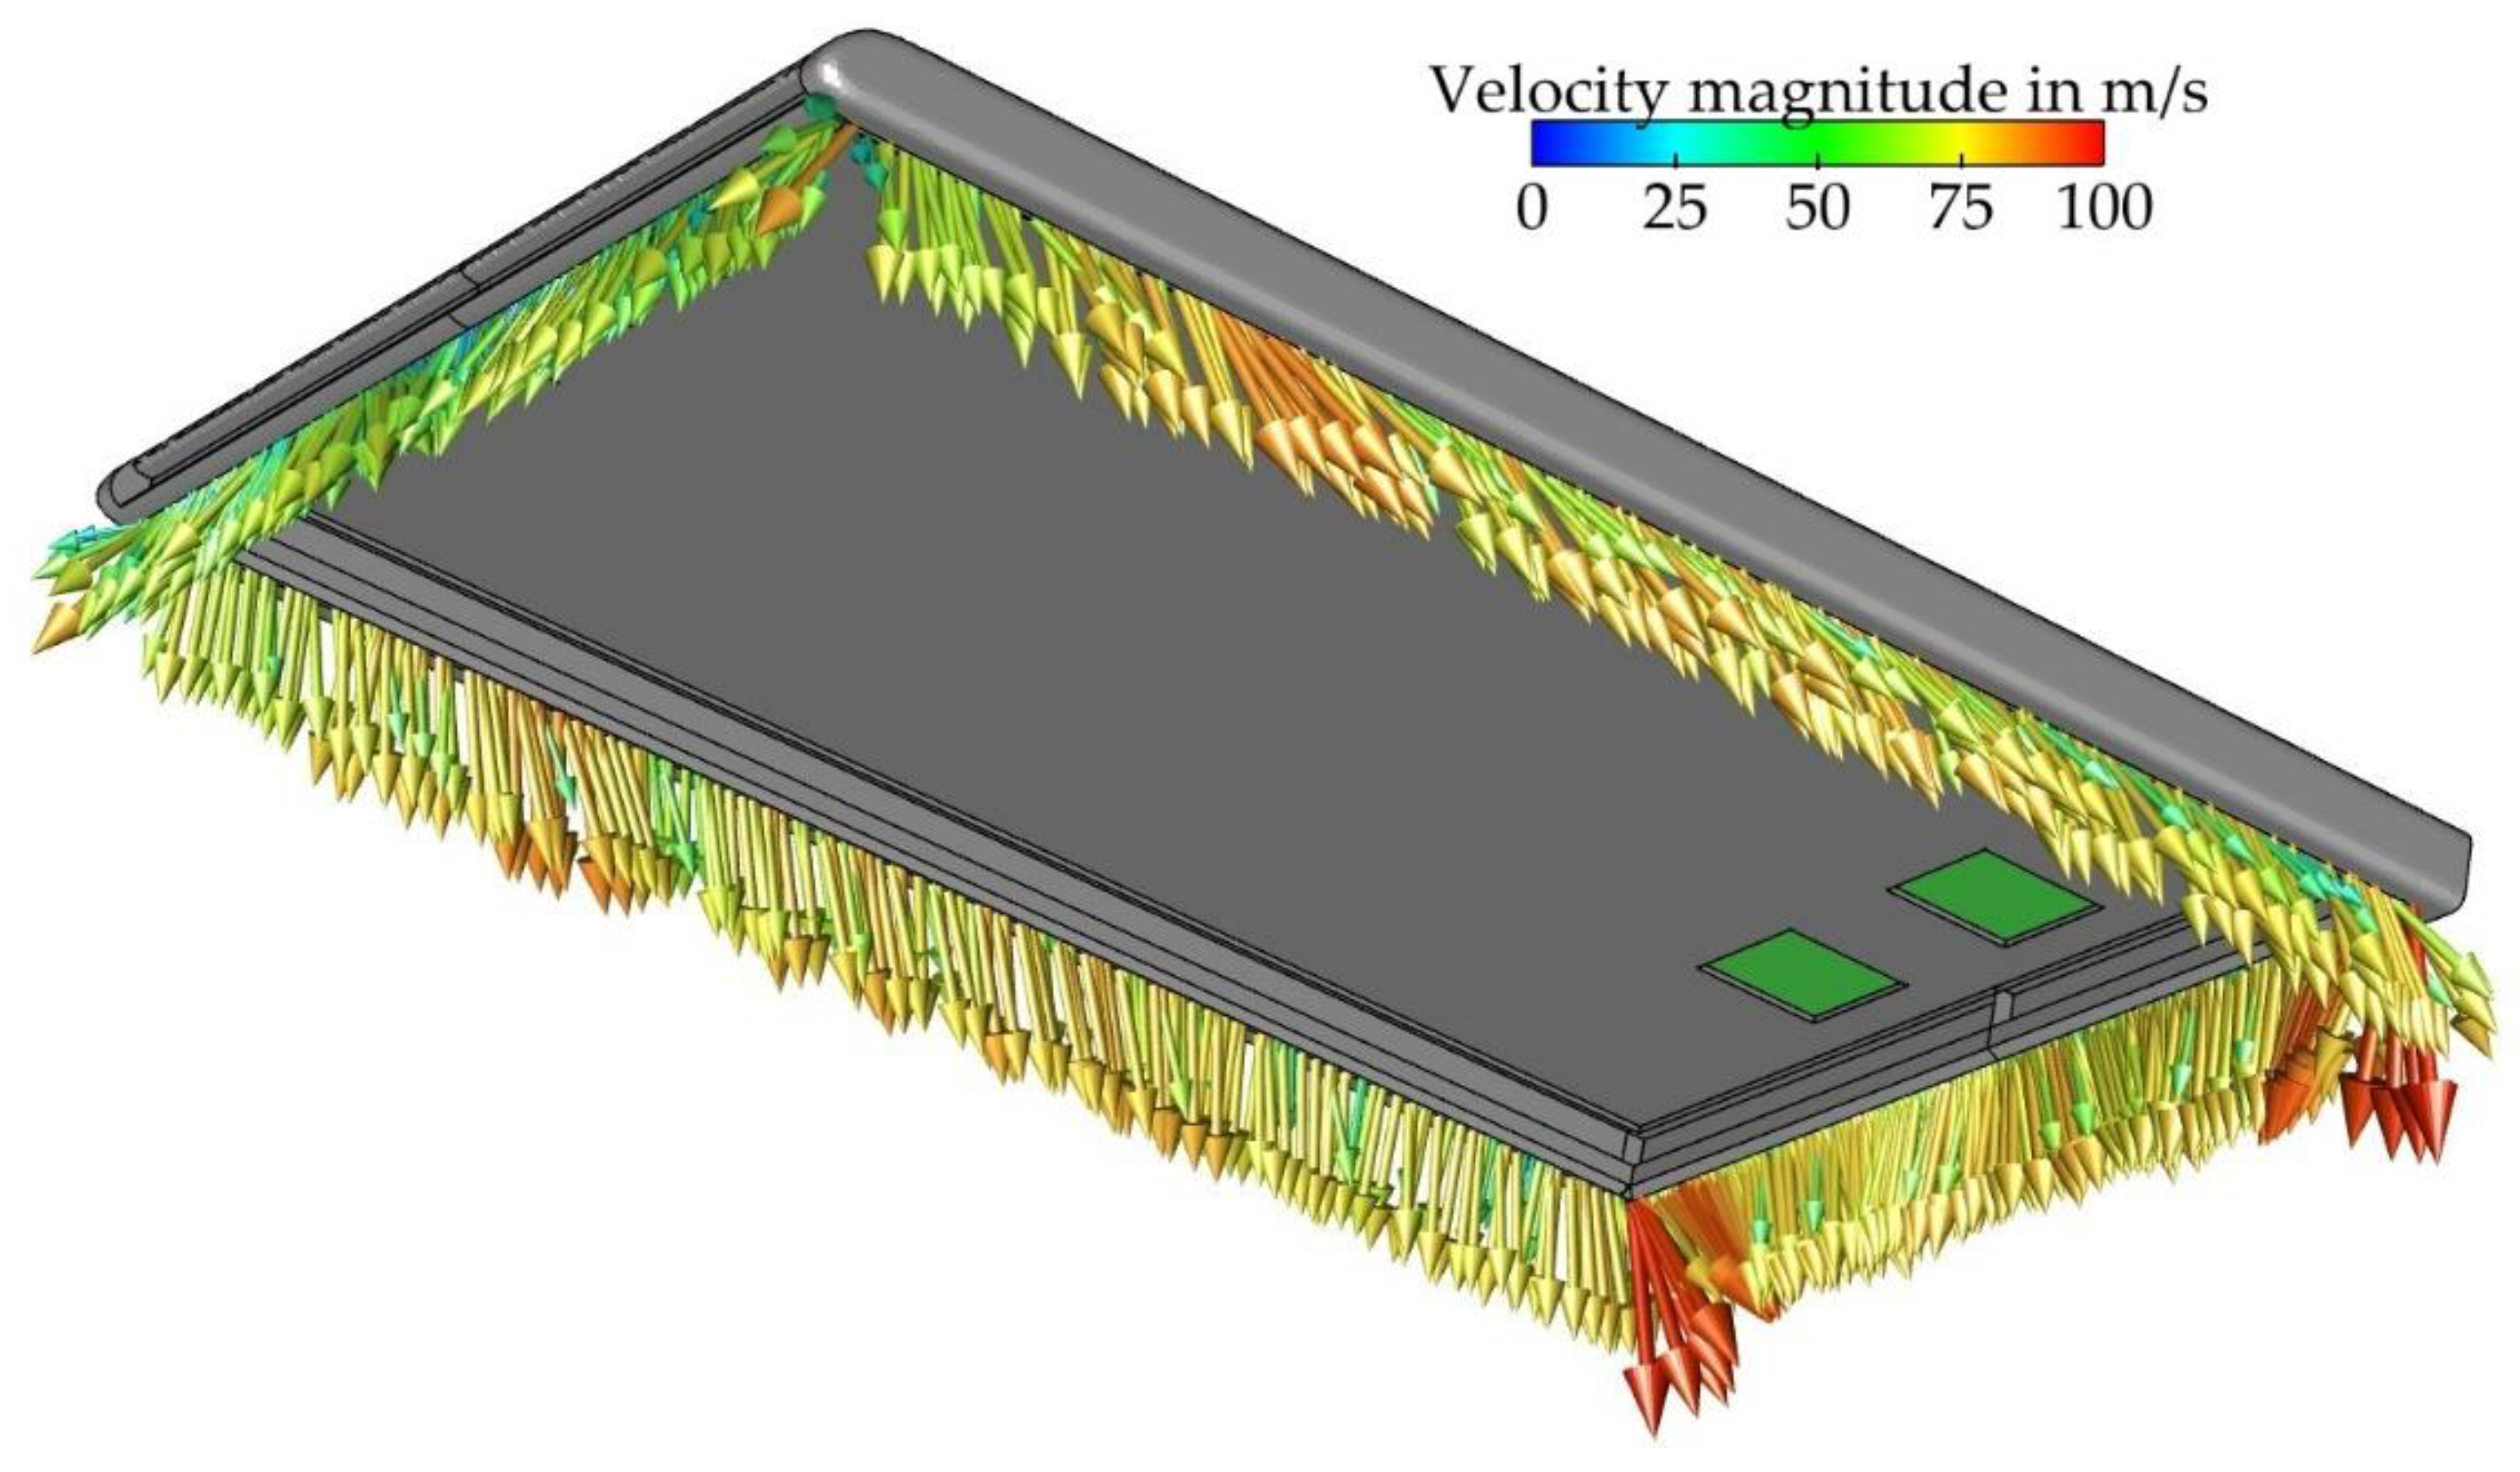
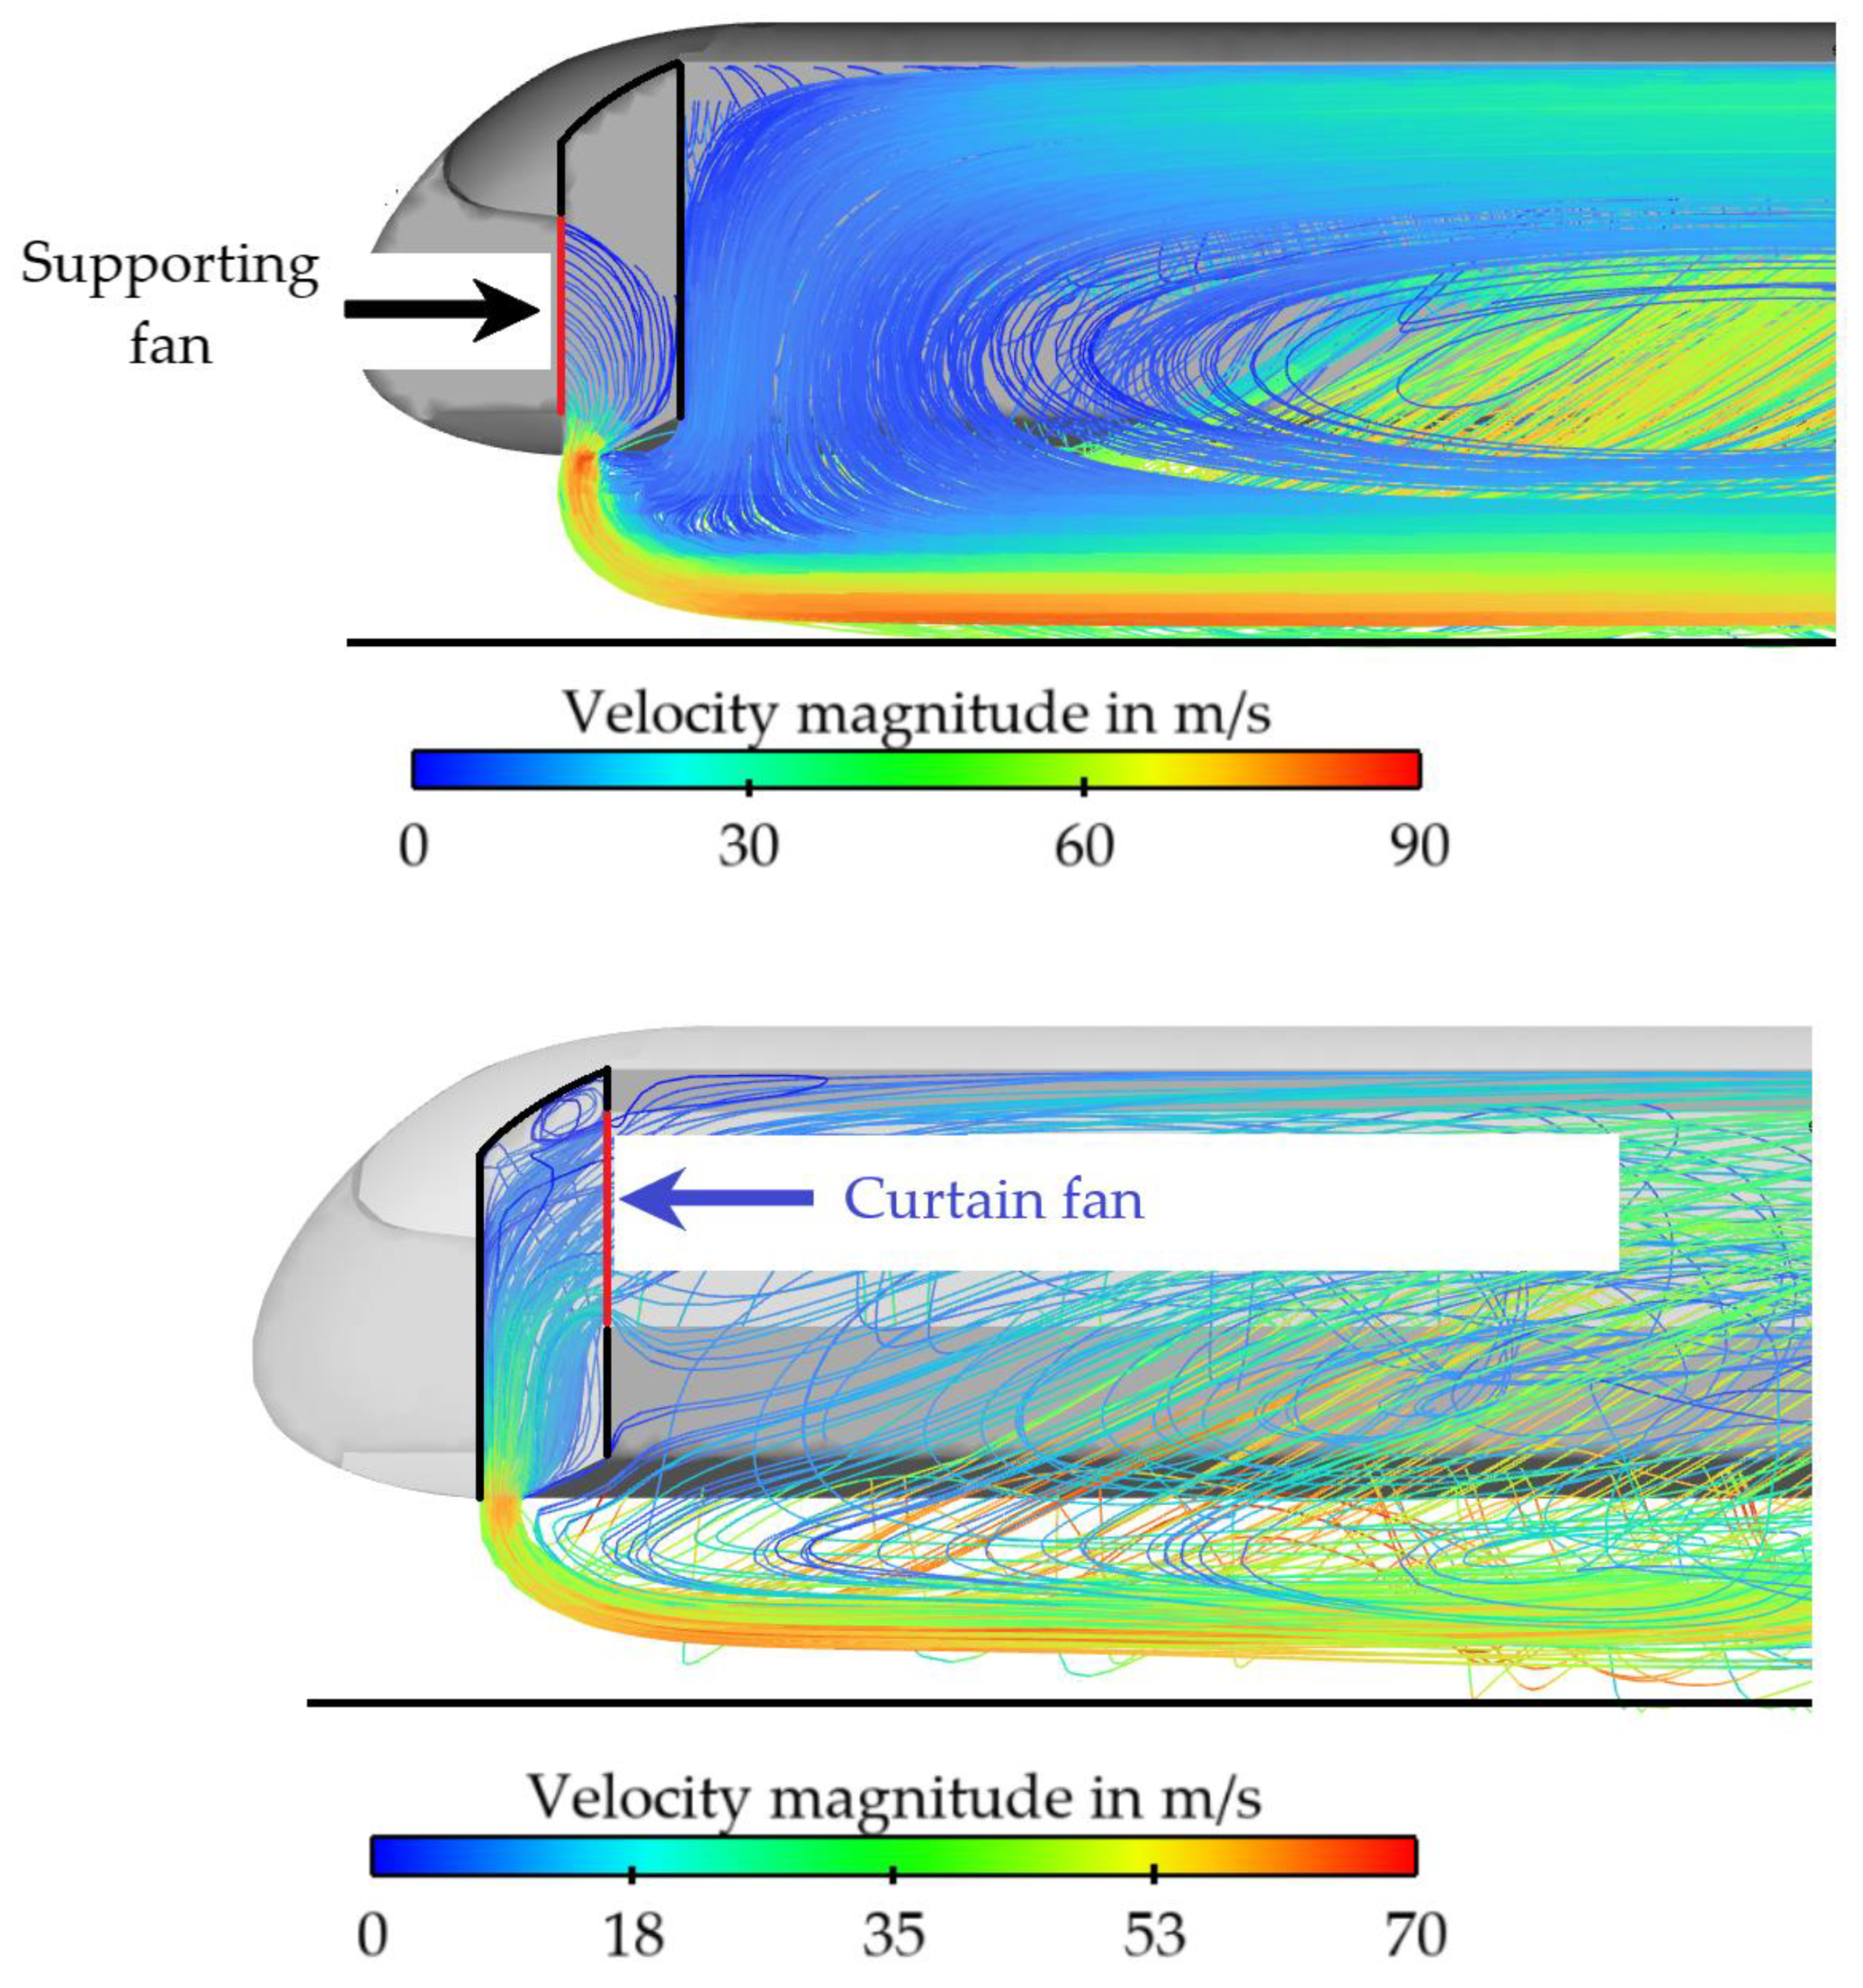
3.2. CFD Analyses of a Three-Dimensional Moving Air Curtain
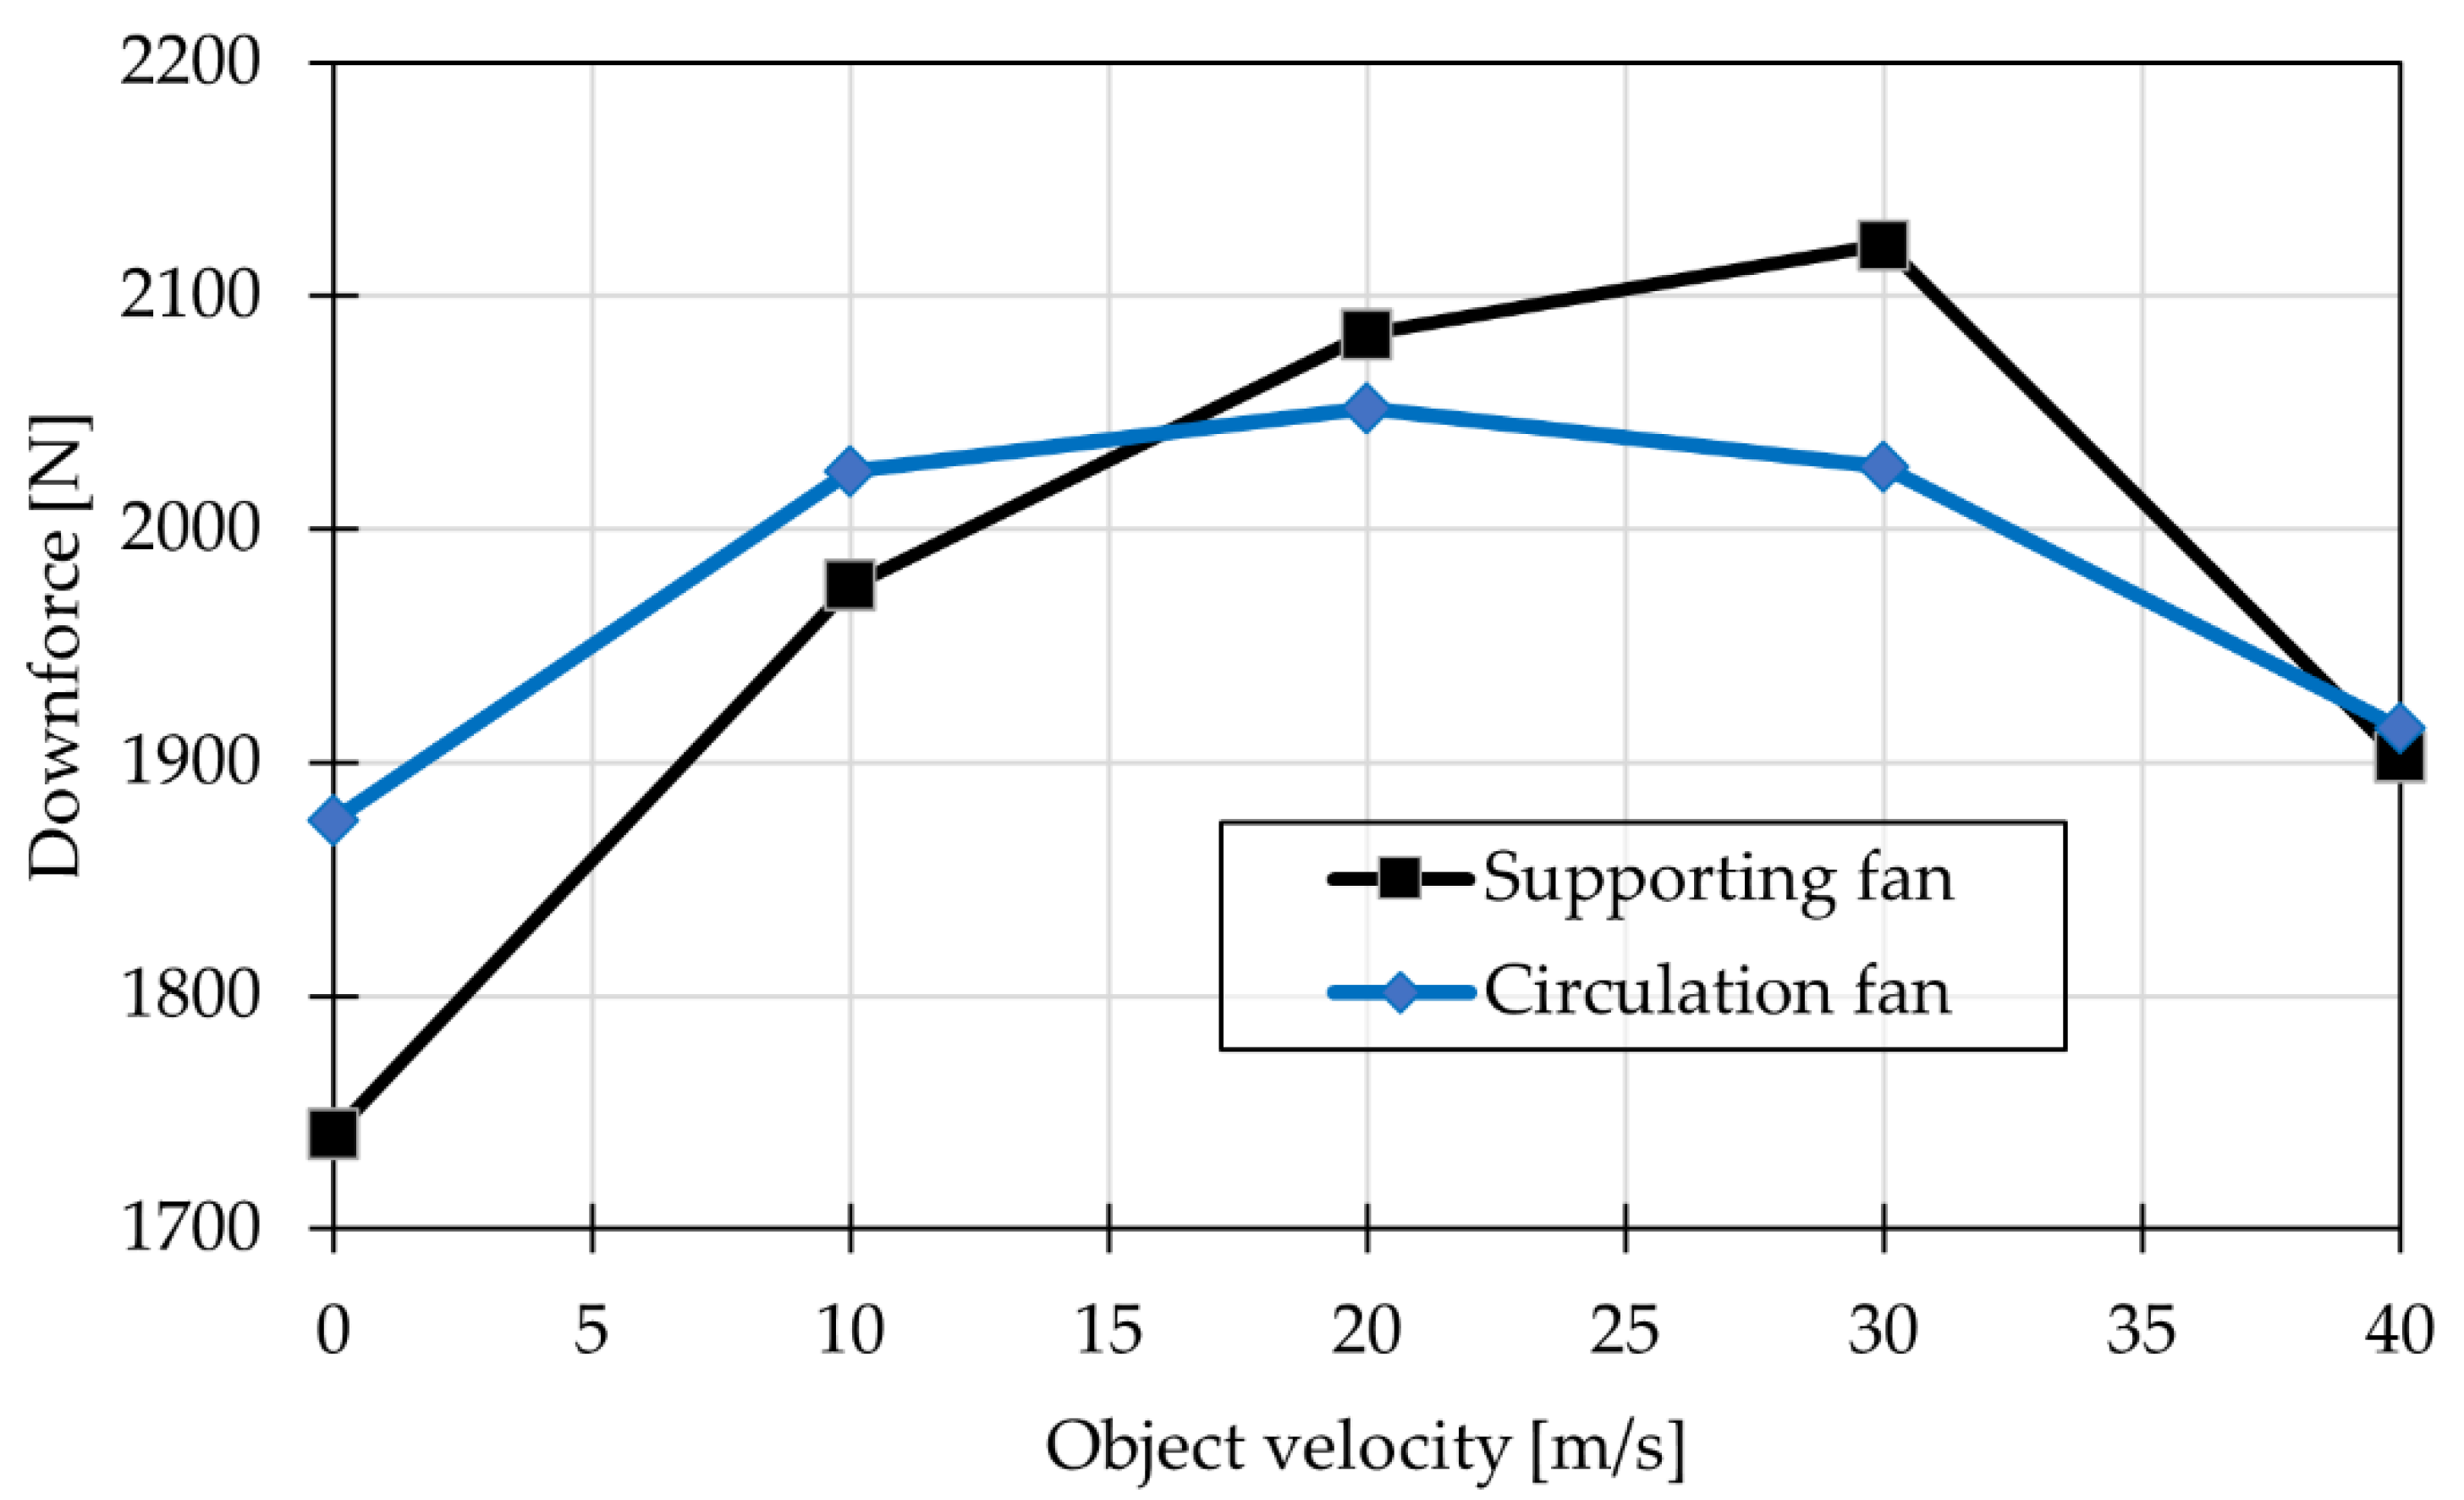
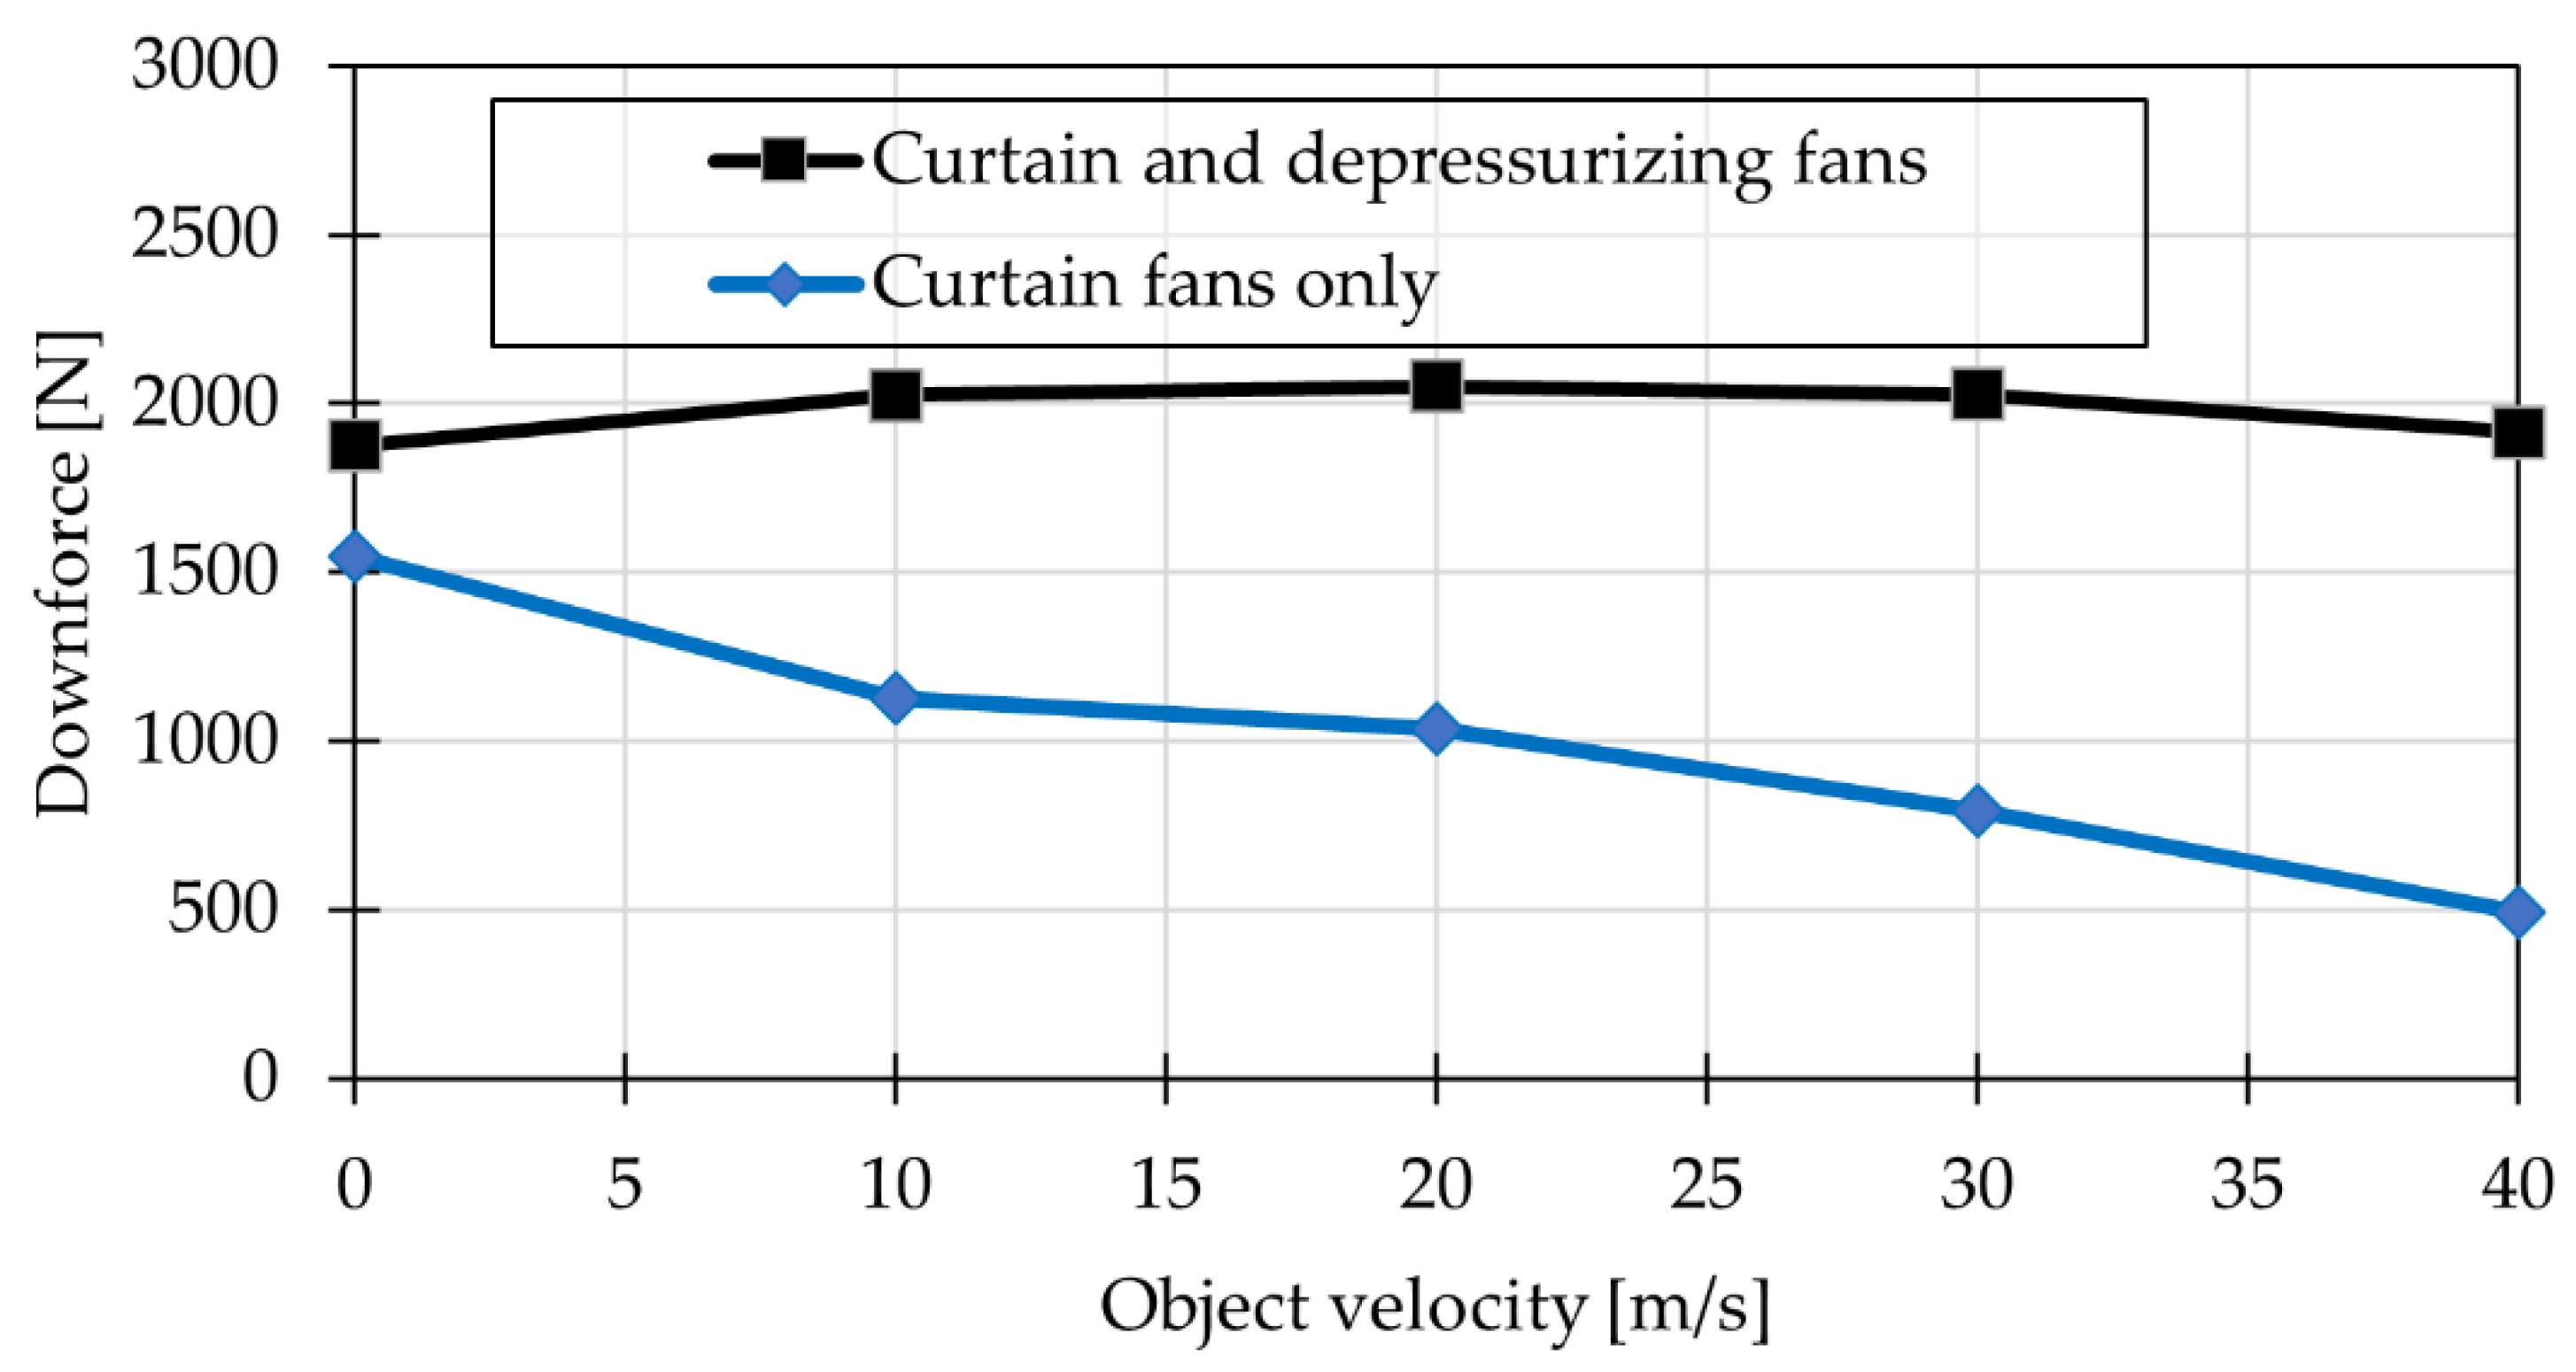
3.2.1. Discussion of Various FDDG Variants
3.2.2. Taking Advantage of the Stagnation Pressure
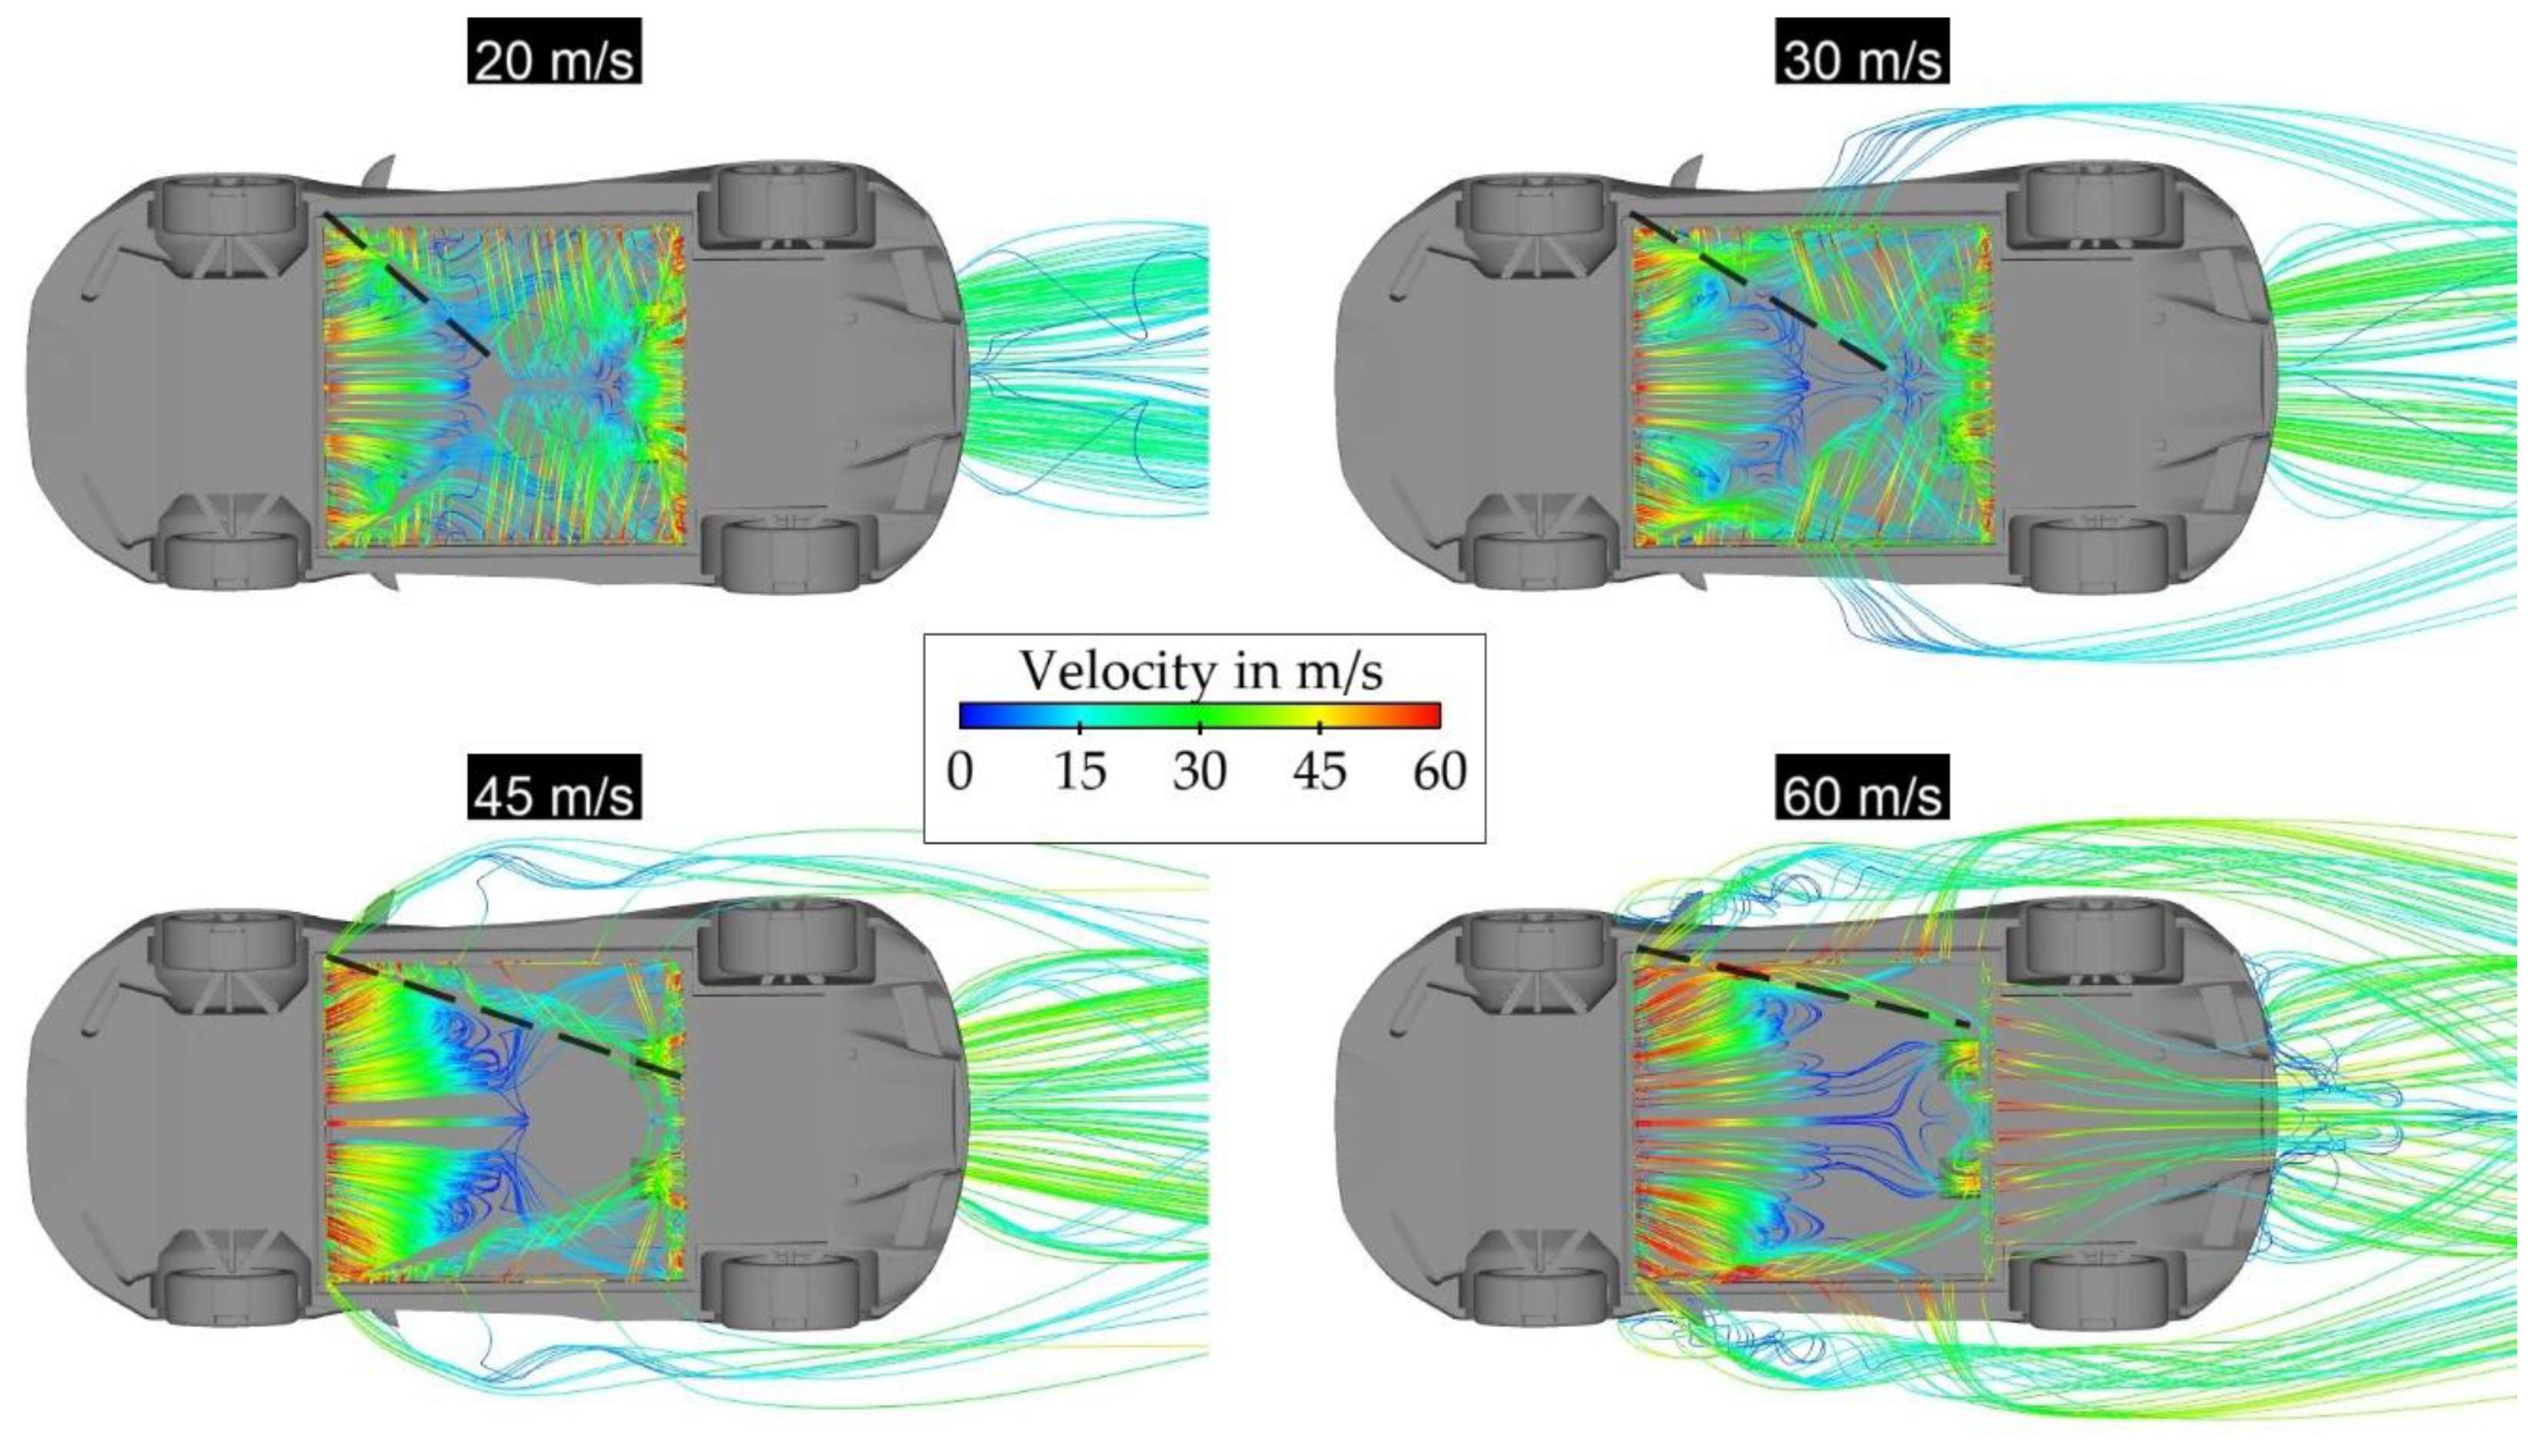
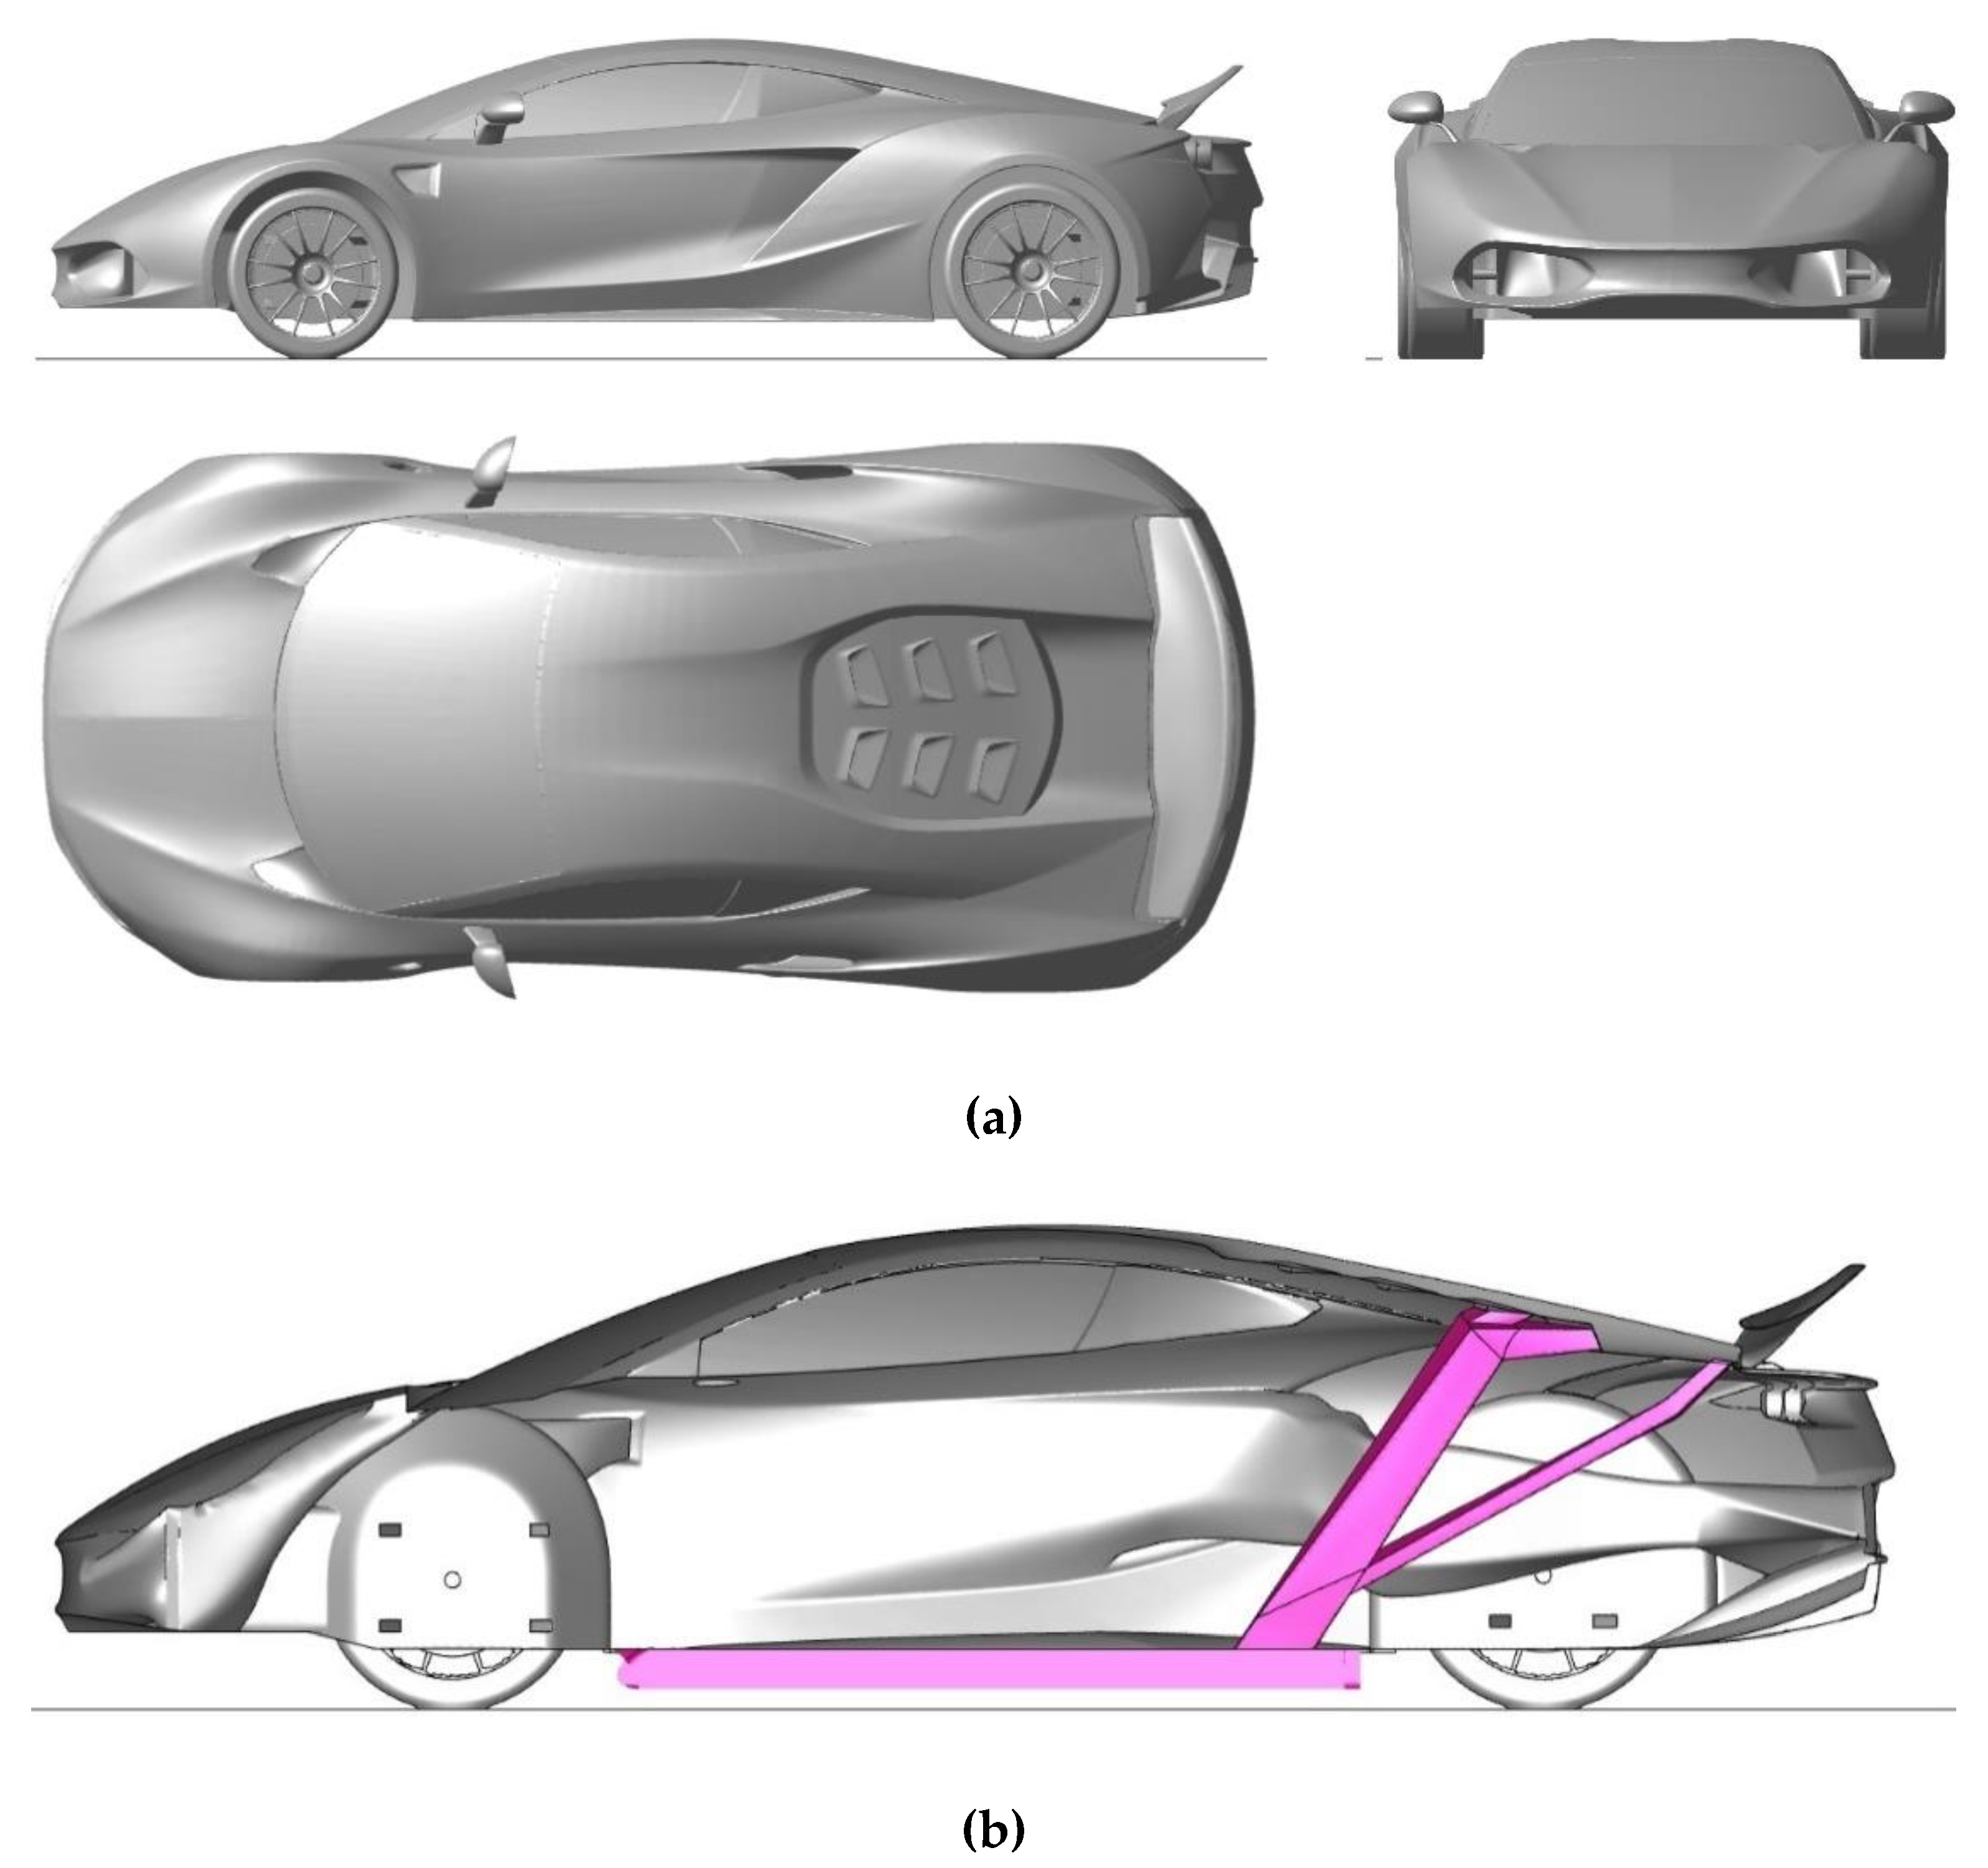
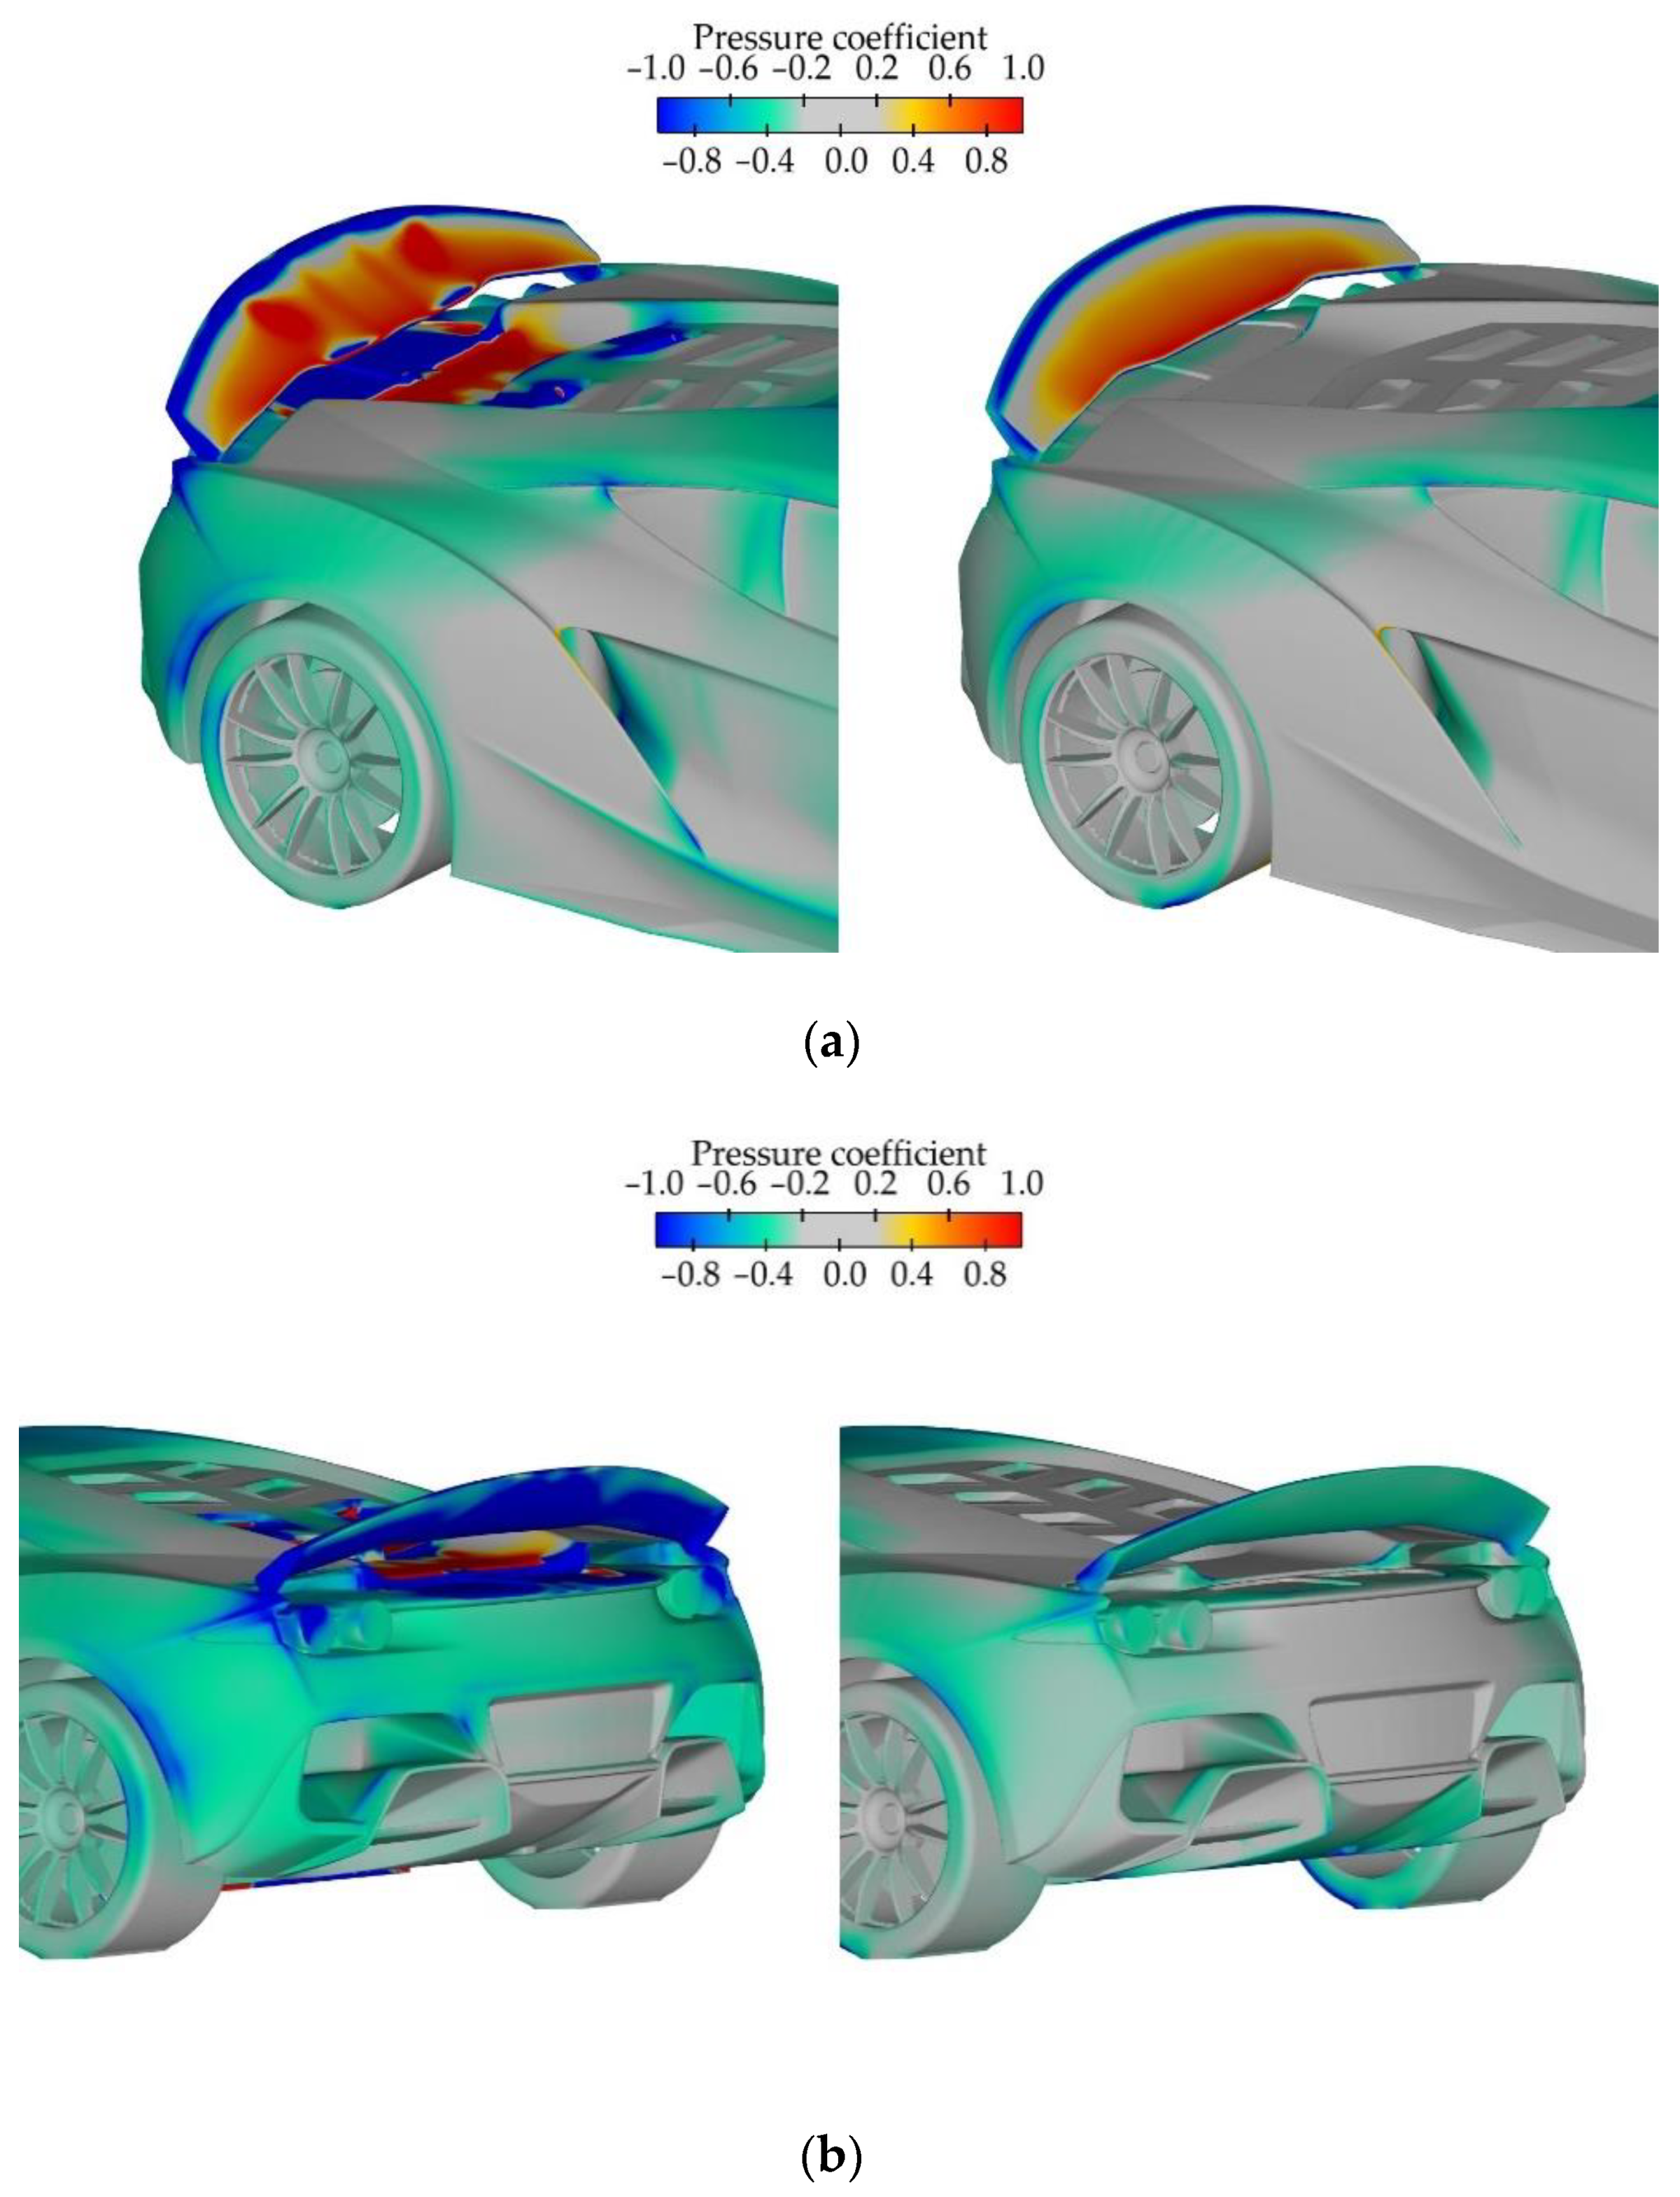
3.3. CFD Analyses of the FDDG in a Sports Car
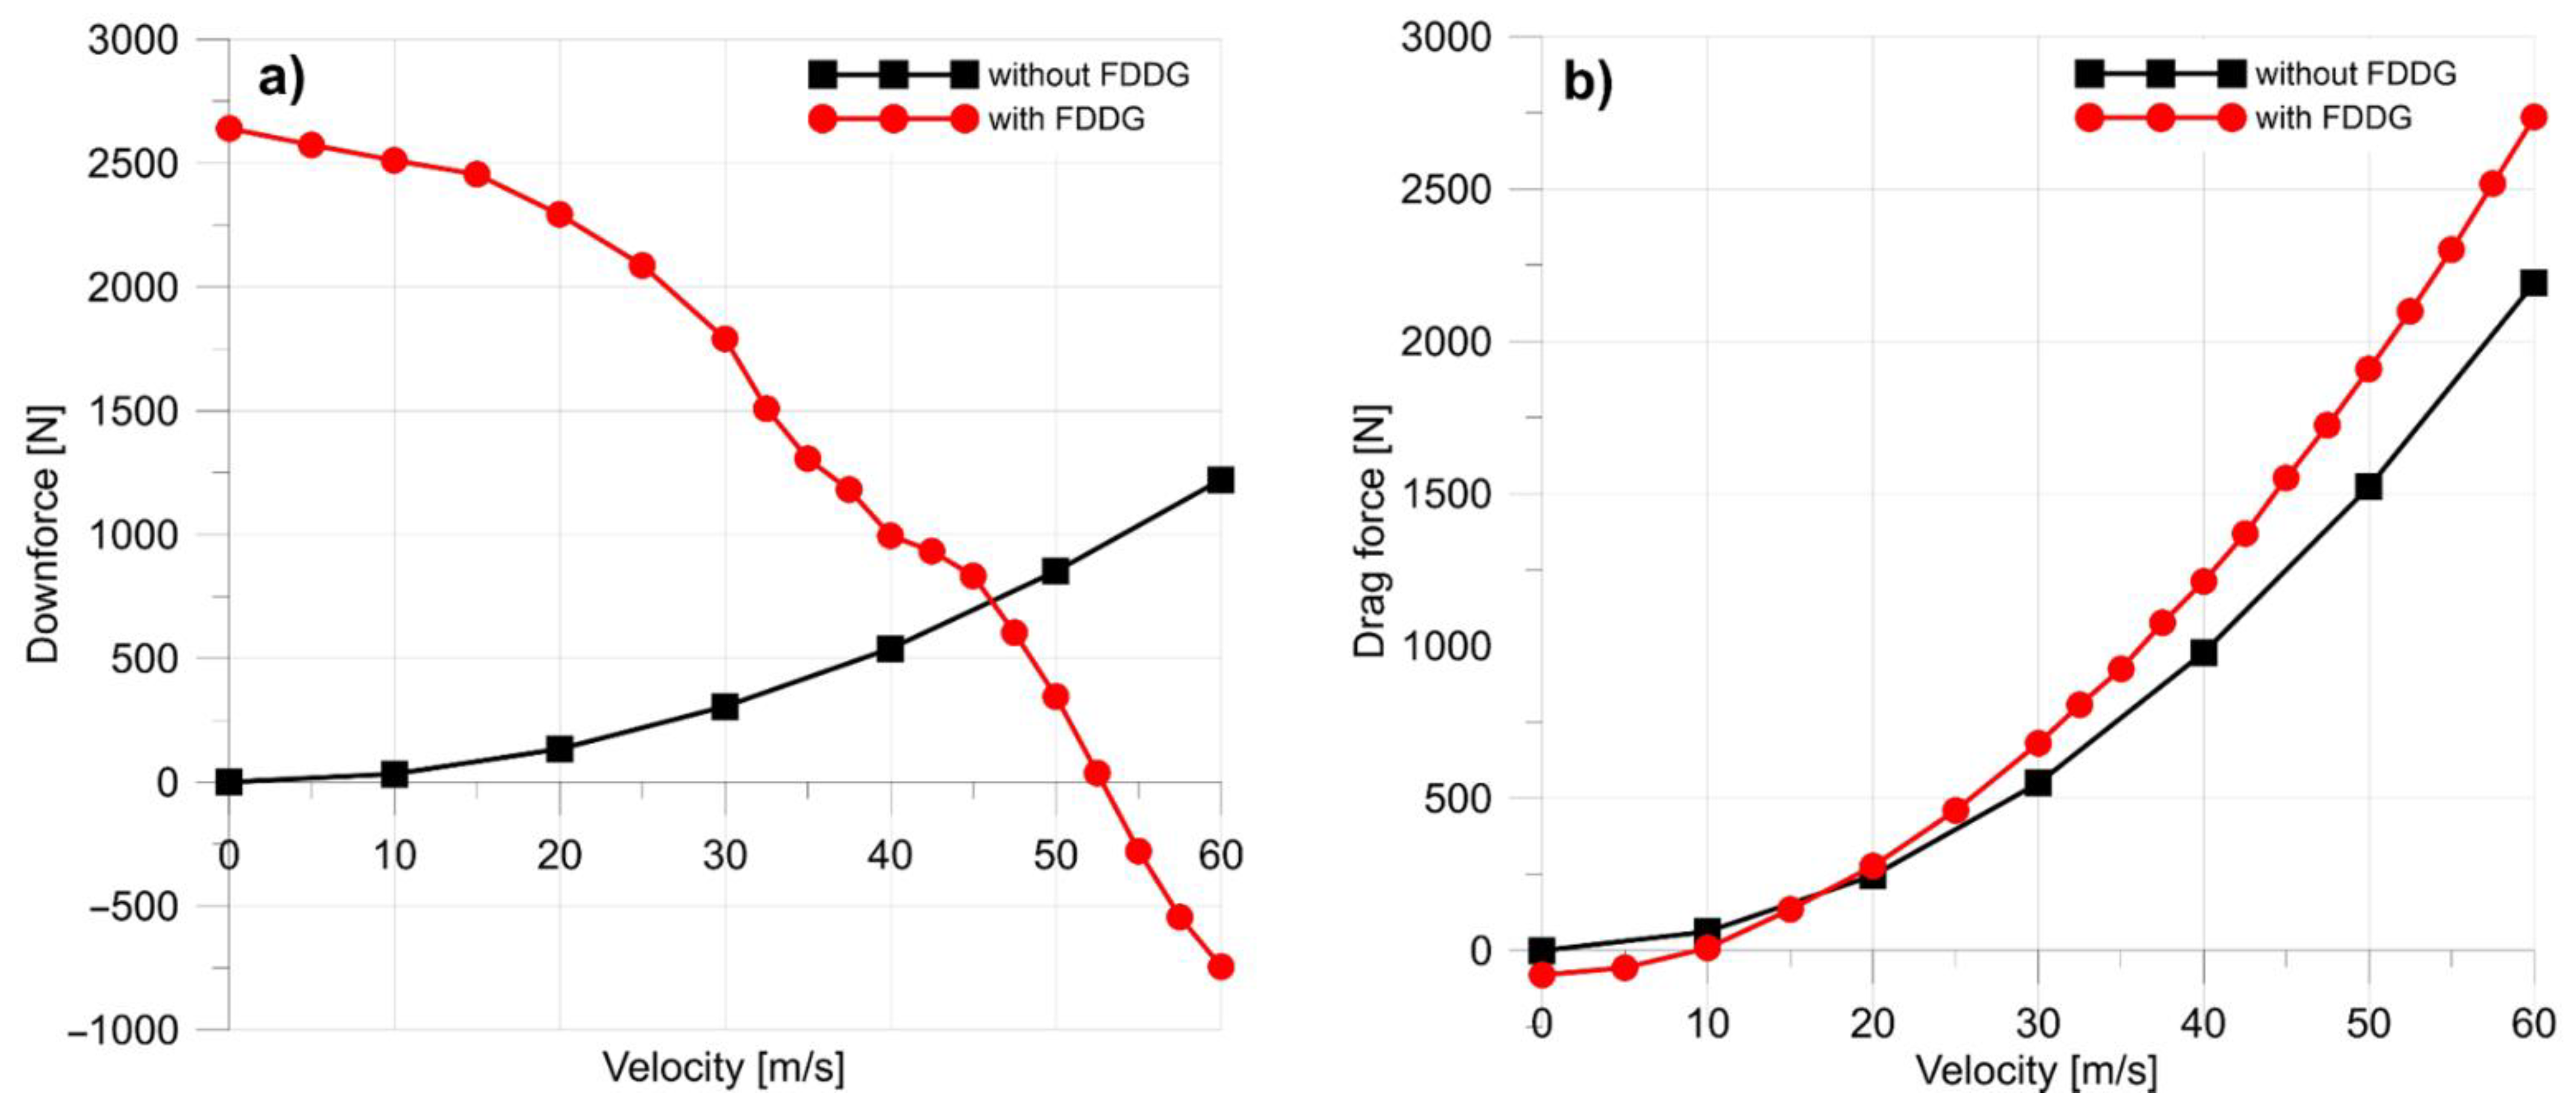
3.3.1. Analysis of FDDG Performance
3.3.2. Further Optimization Directions
3.4. Dynamic Model of a Car with FDDG
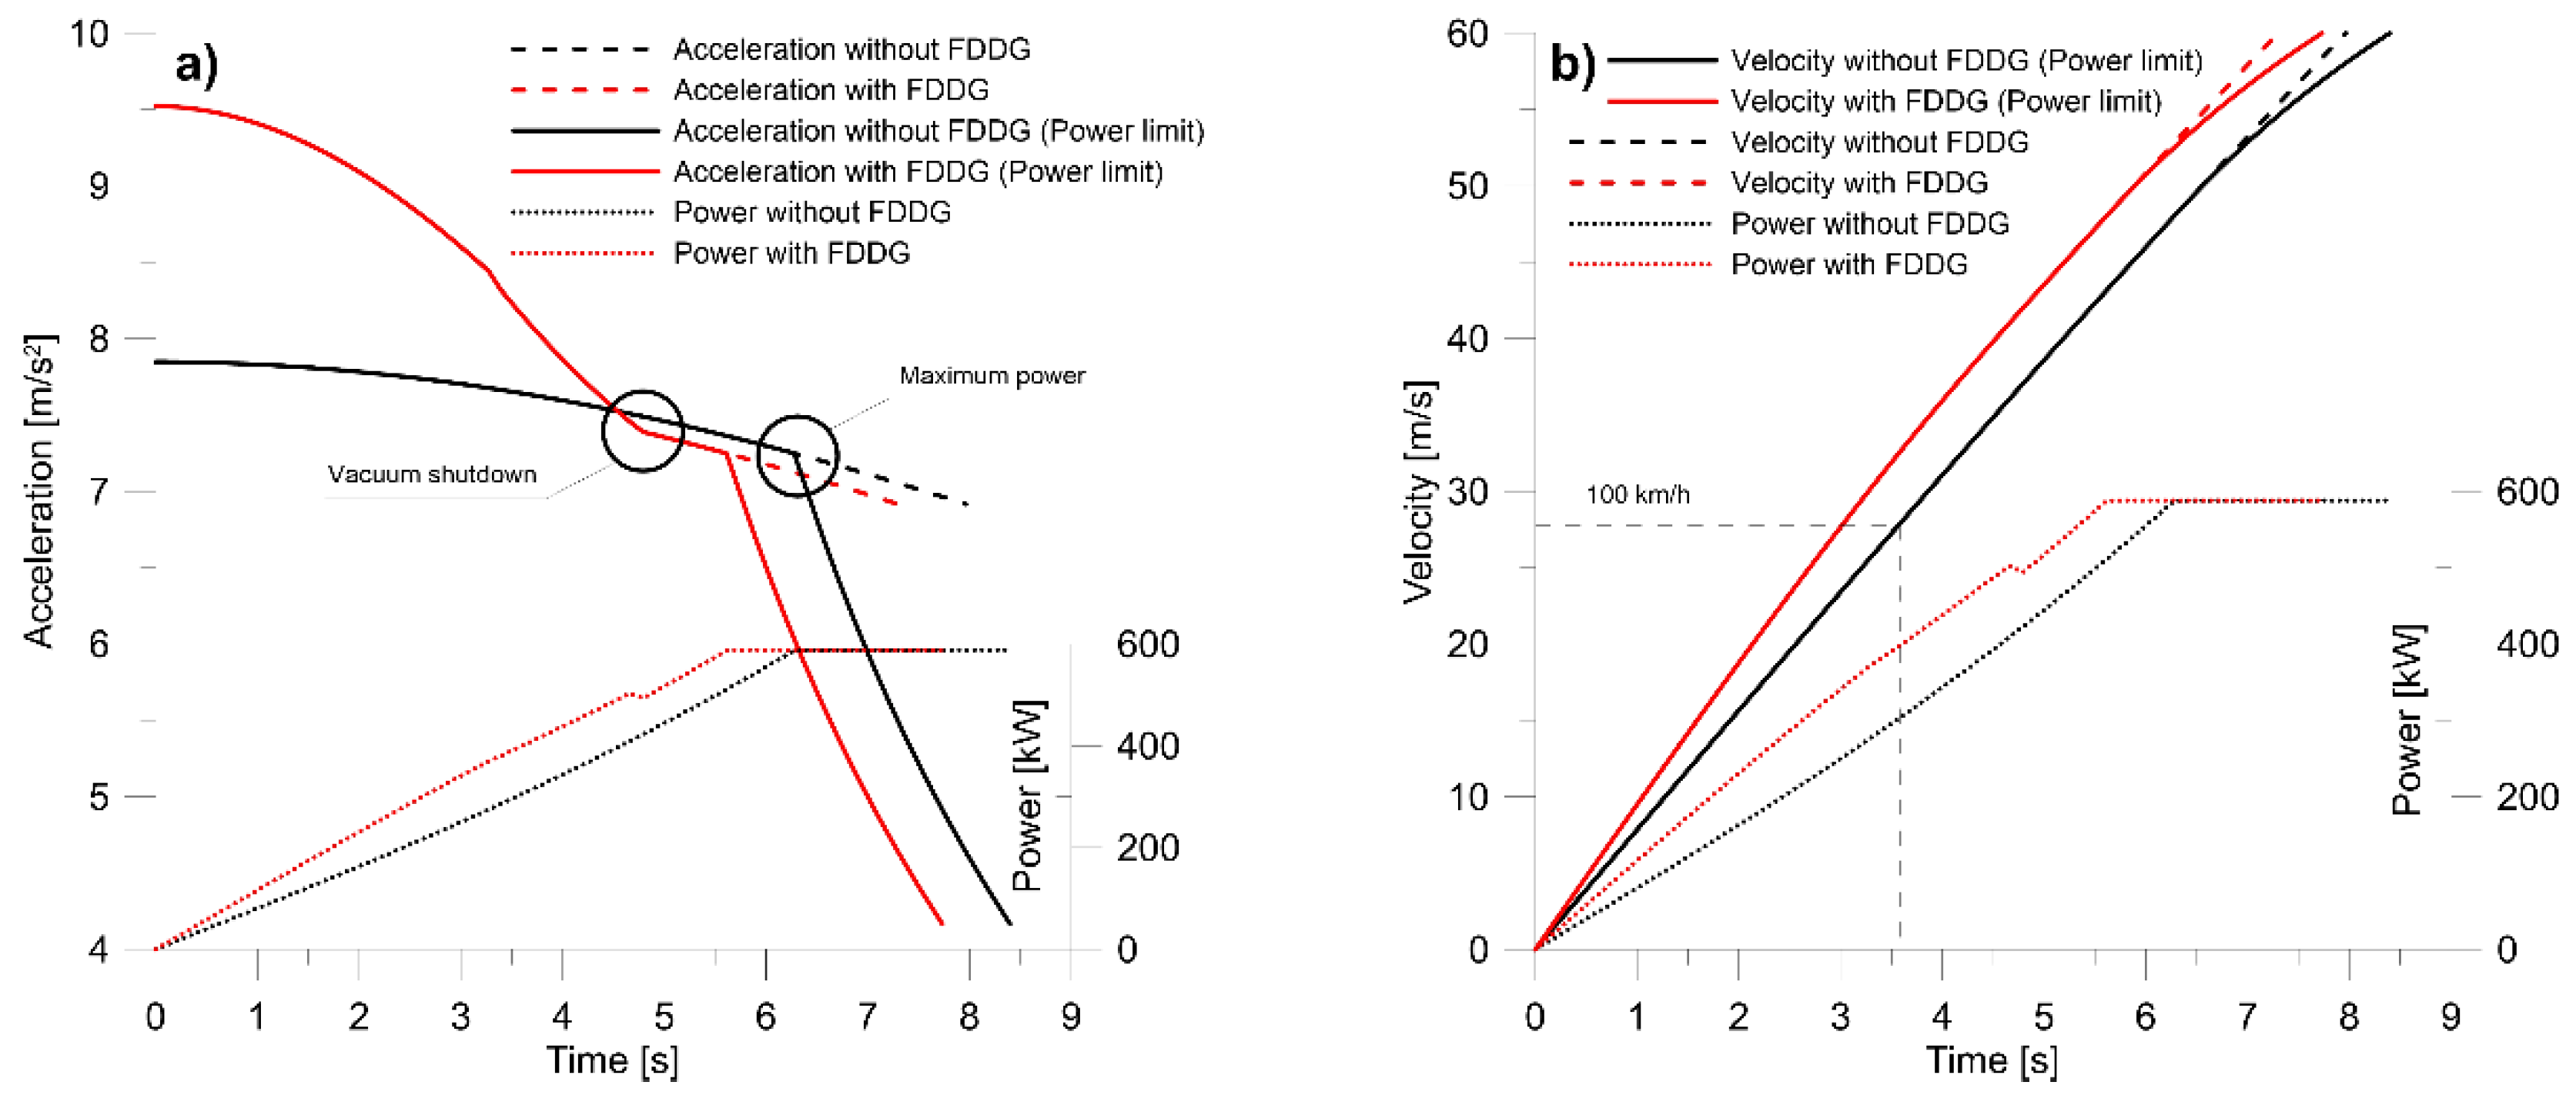
3.4.1. Acceleration
- a—acceleration in m/s2
- μ—friction coefficient (0.8)
- g—gravitational acceleration in m/s2
- Fz—downforce in N
- Fd—drag force in N
- m—car mass (1300 kg)
- v—car velocity in m/s
- P—power in W
- Plimit—engine power (588,000 W)
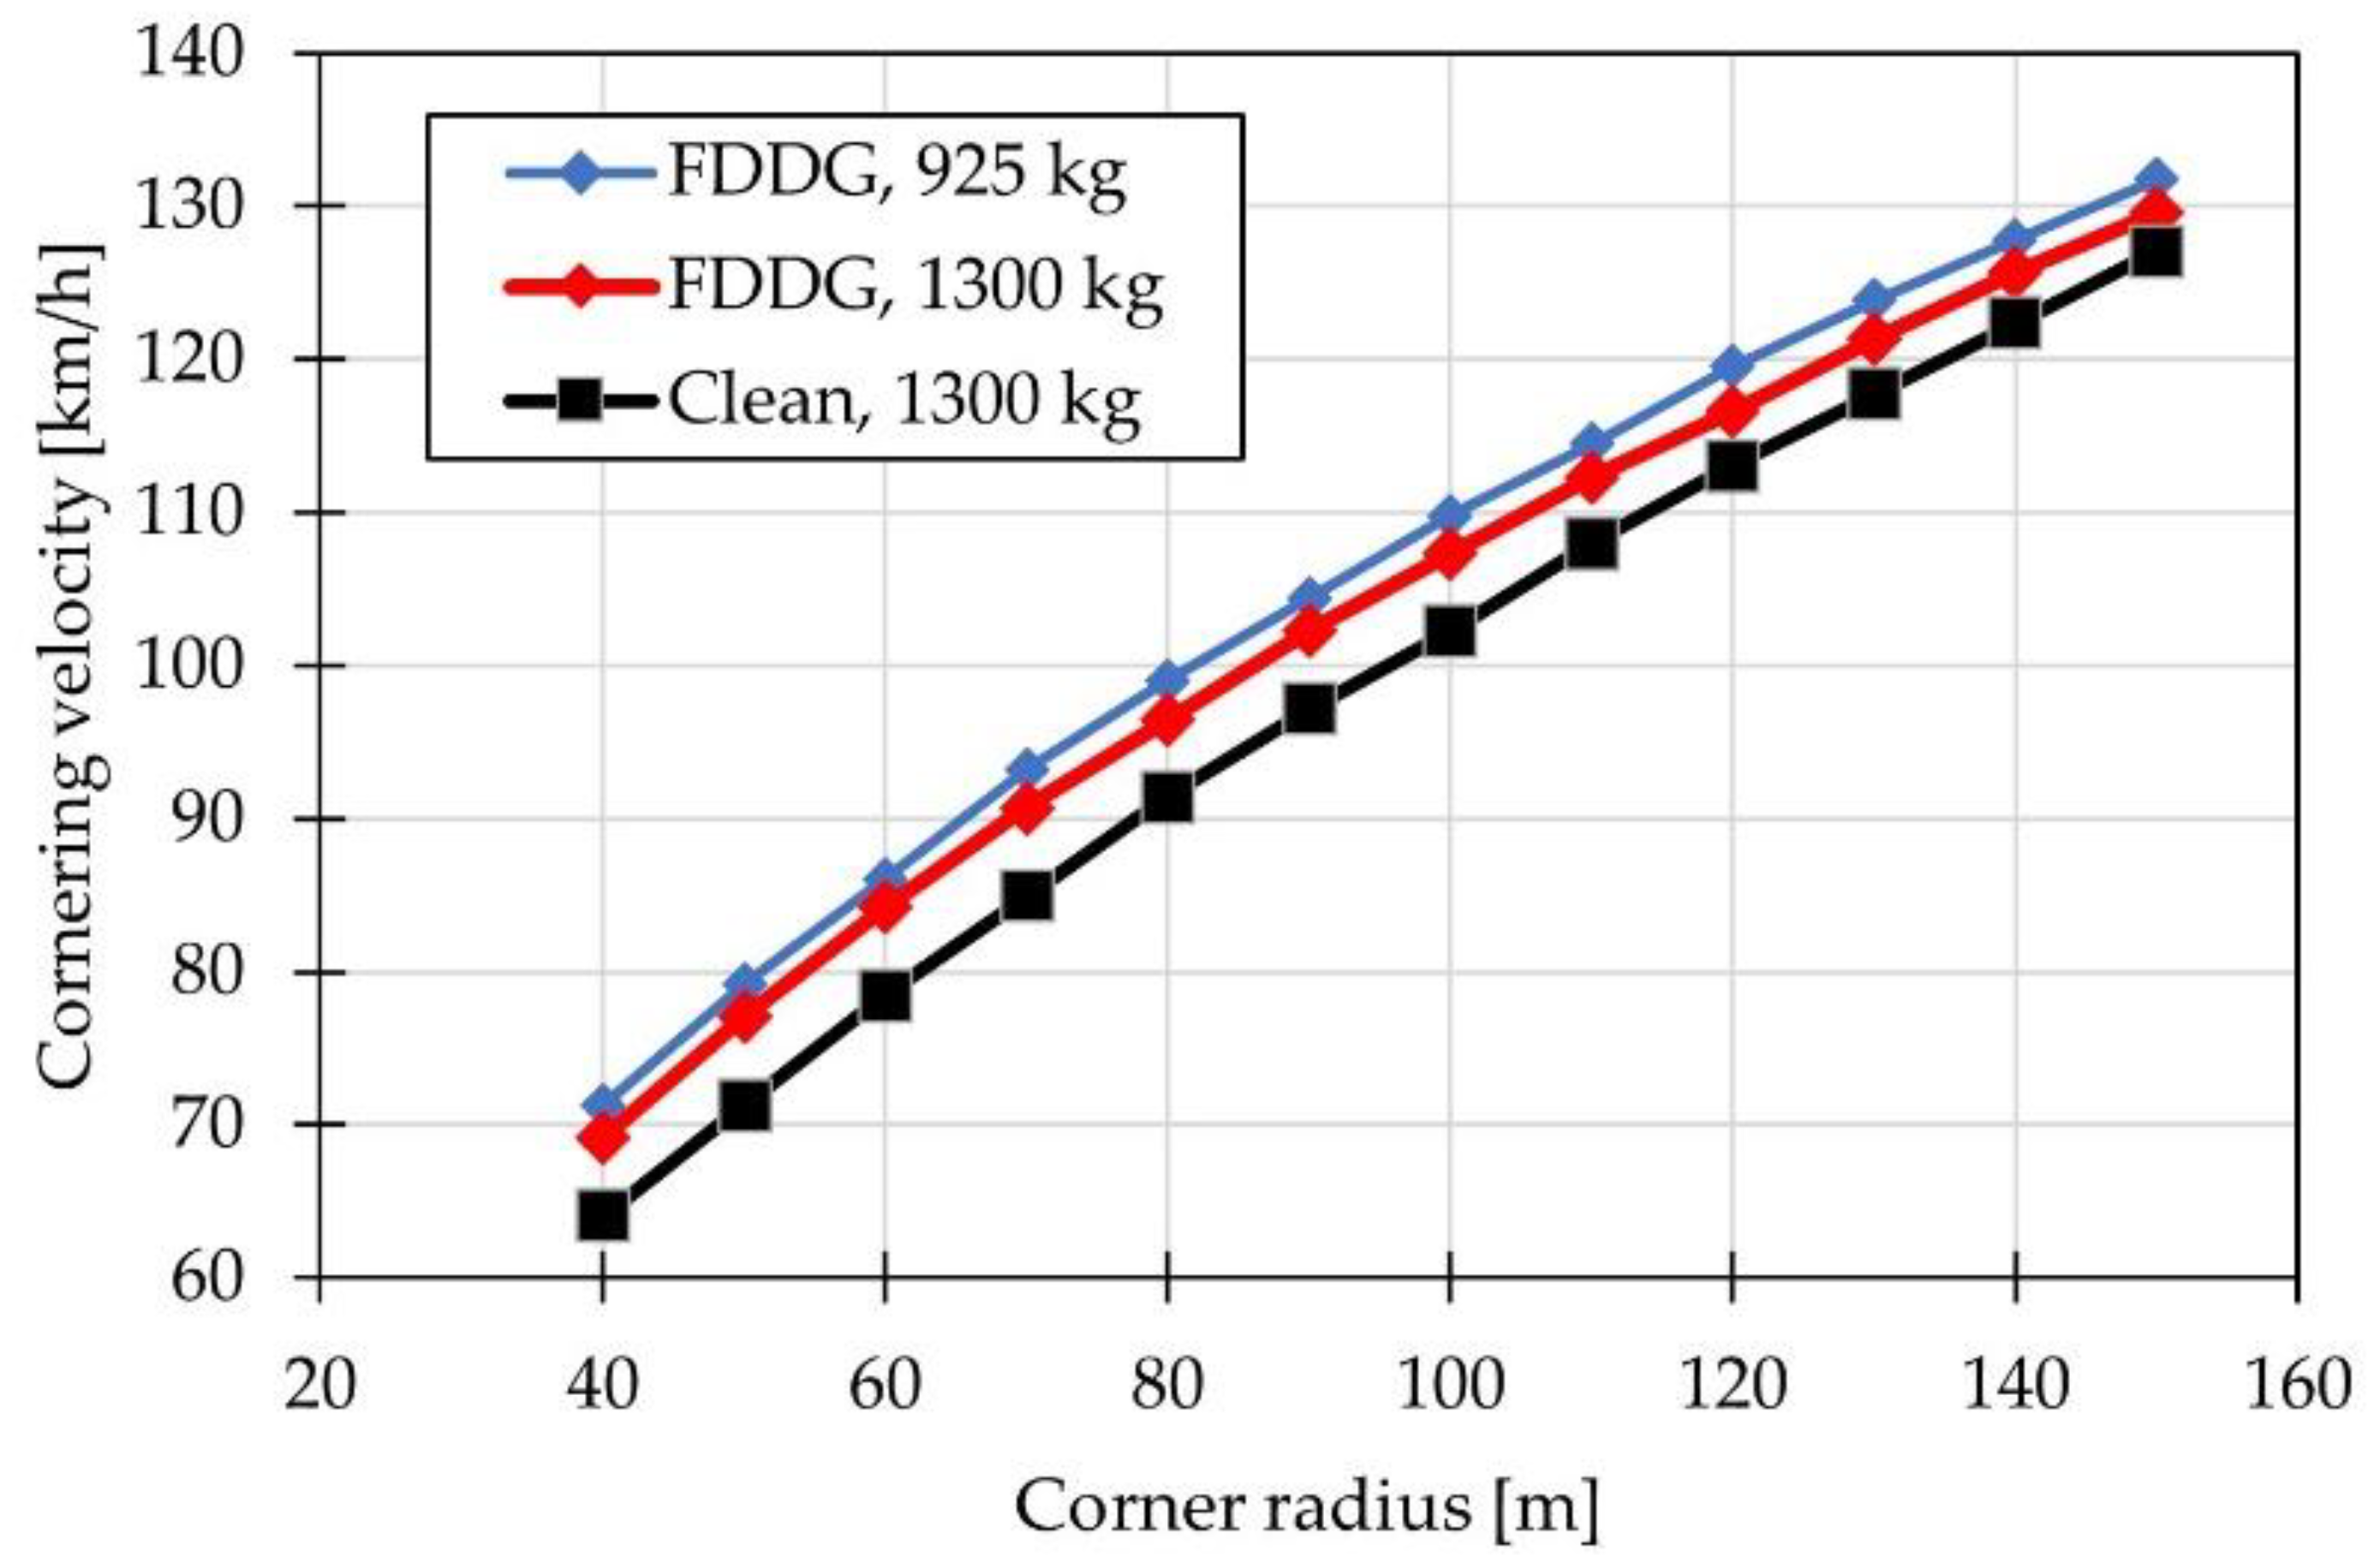
3.4.2. Cornering
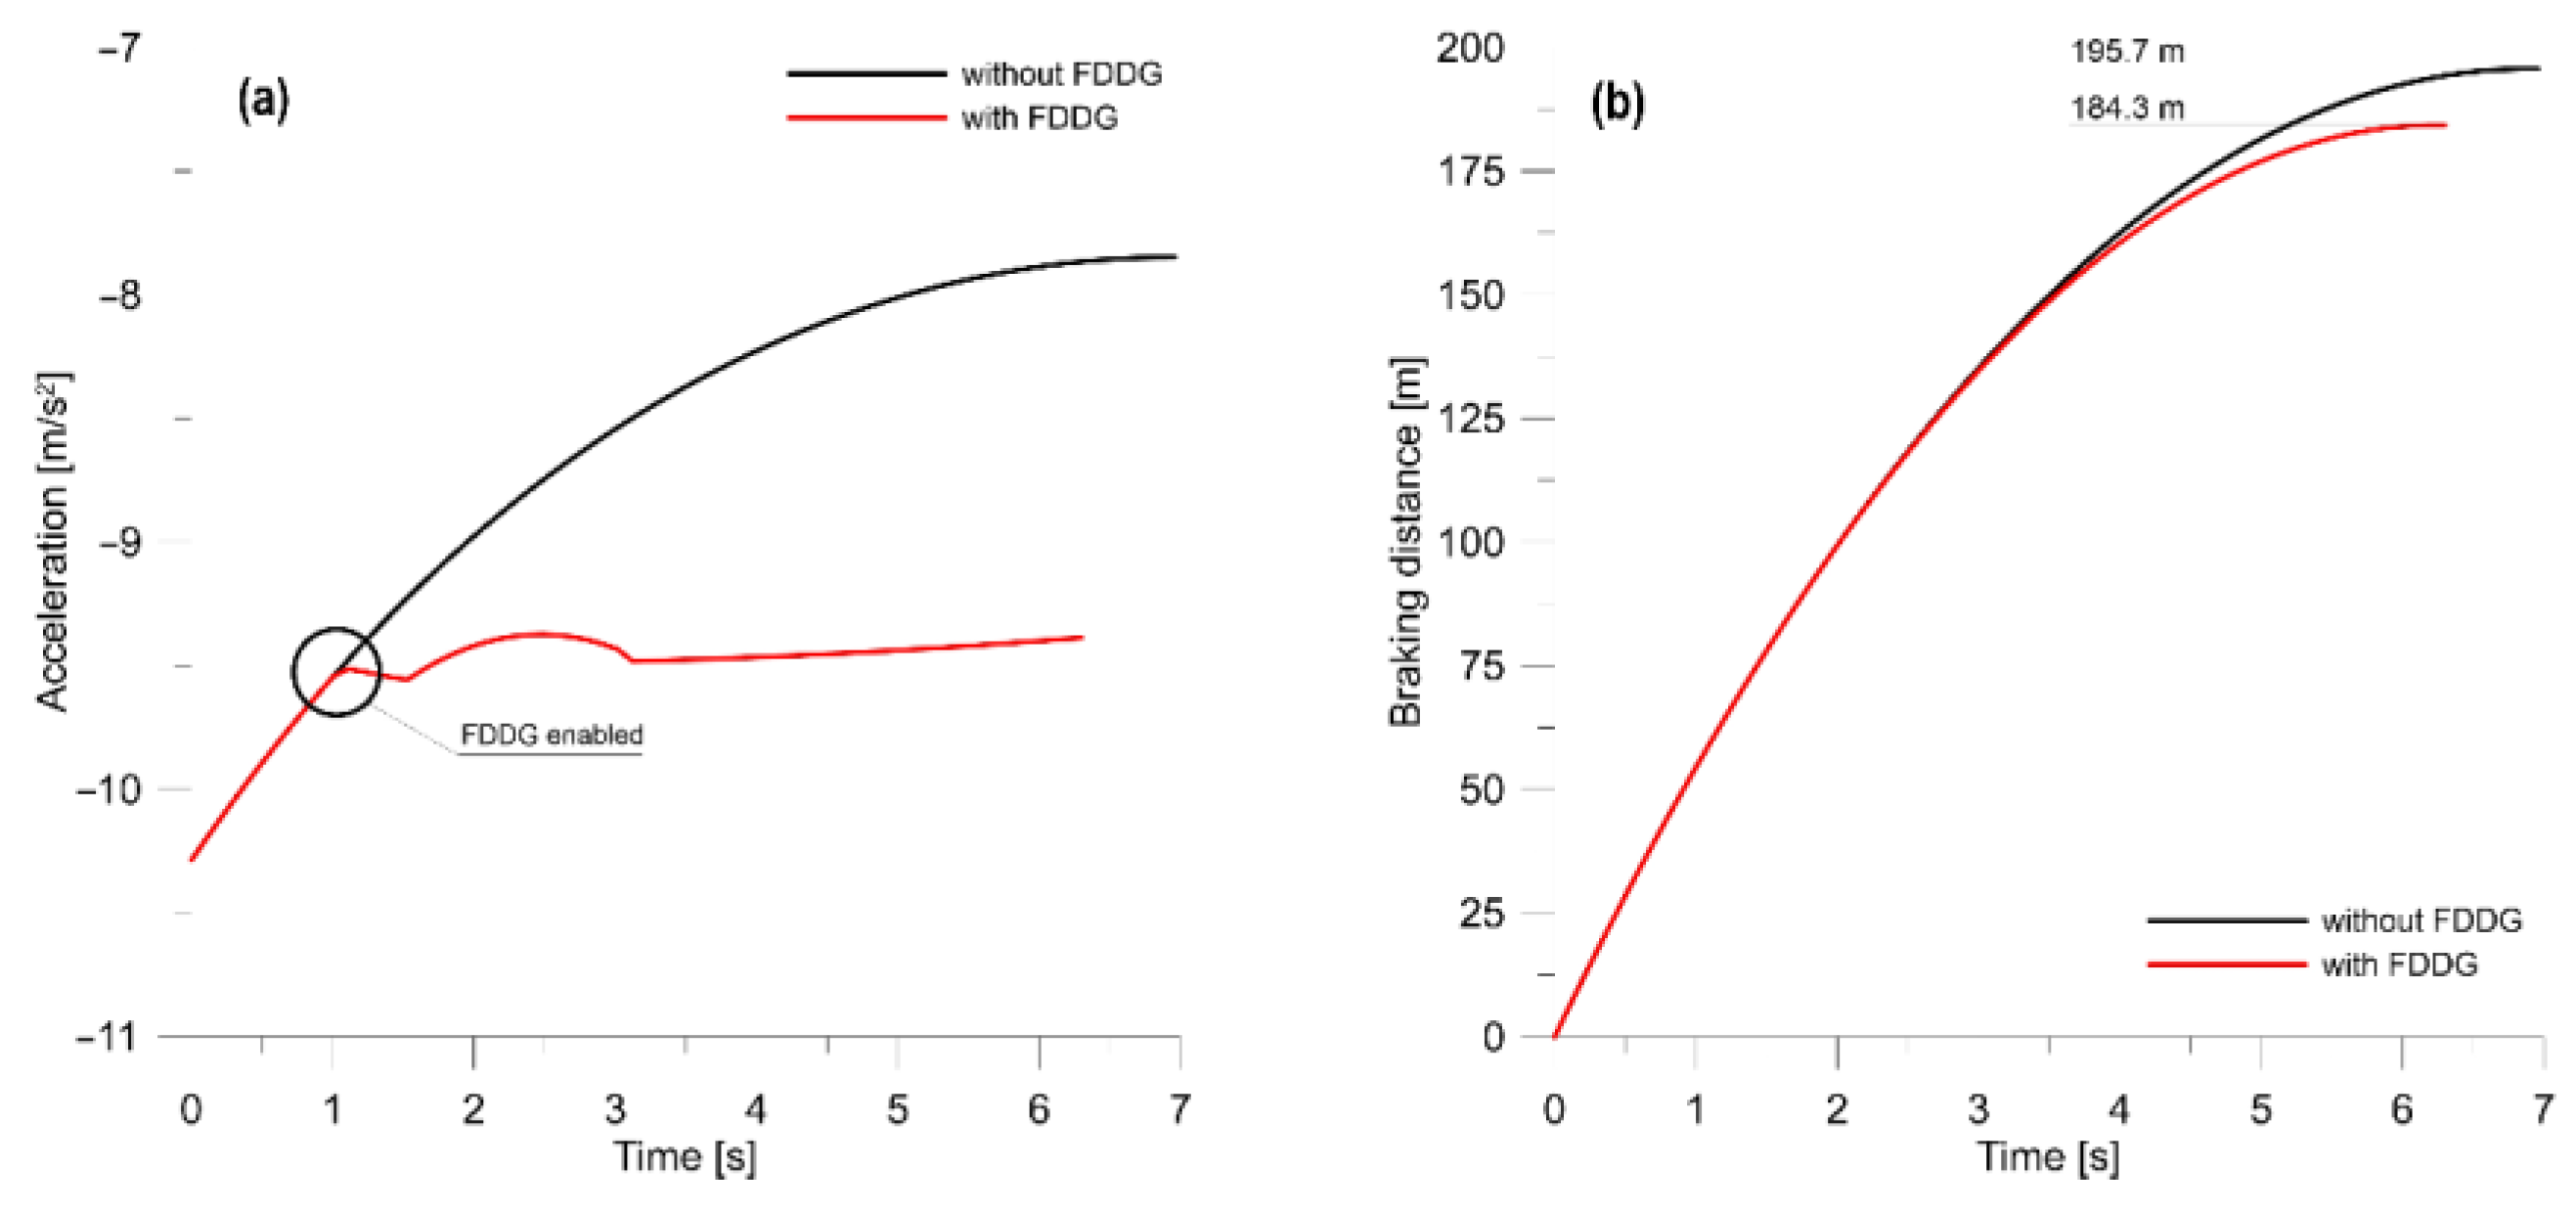
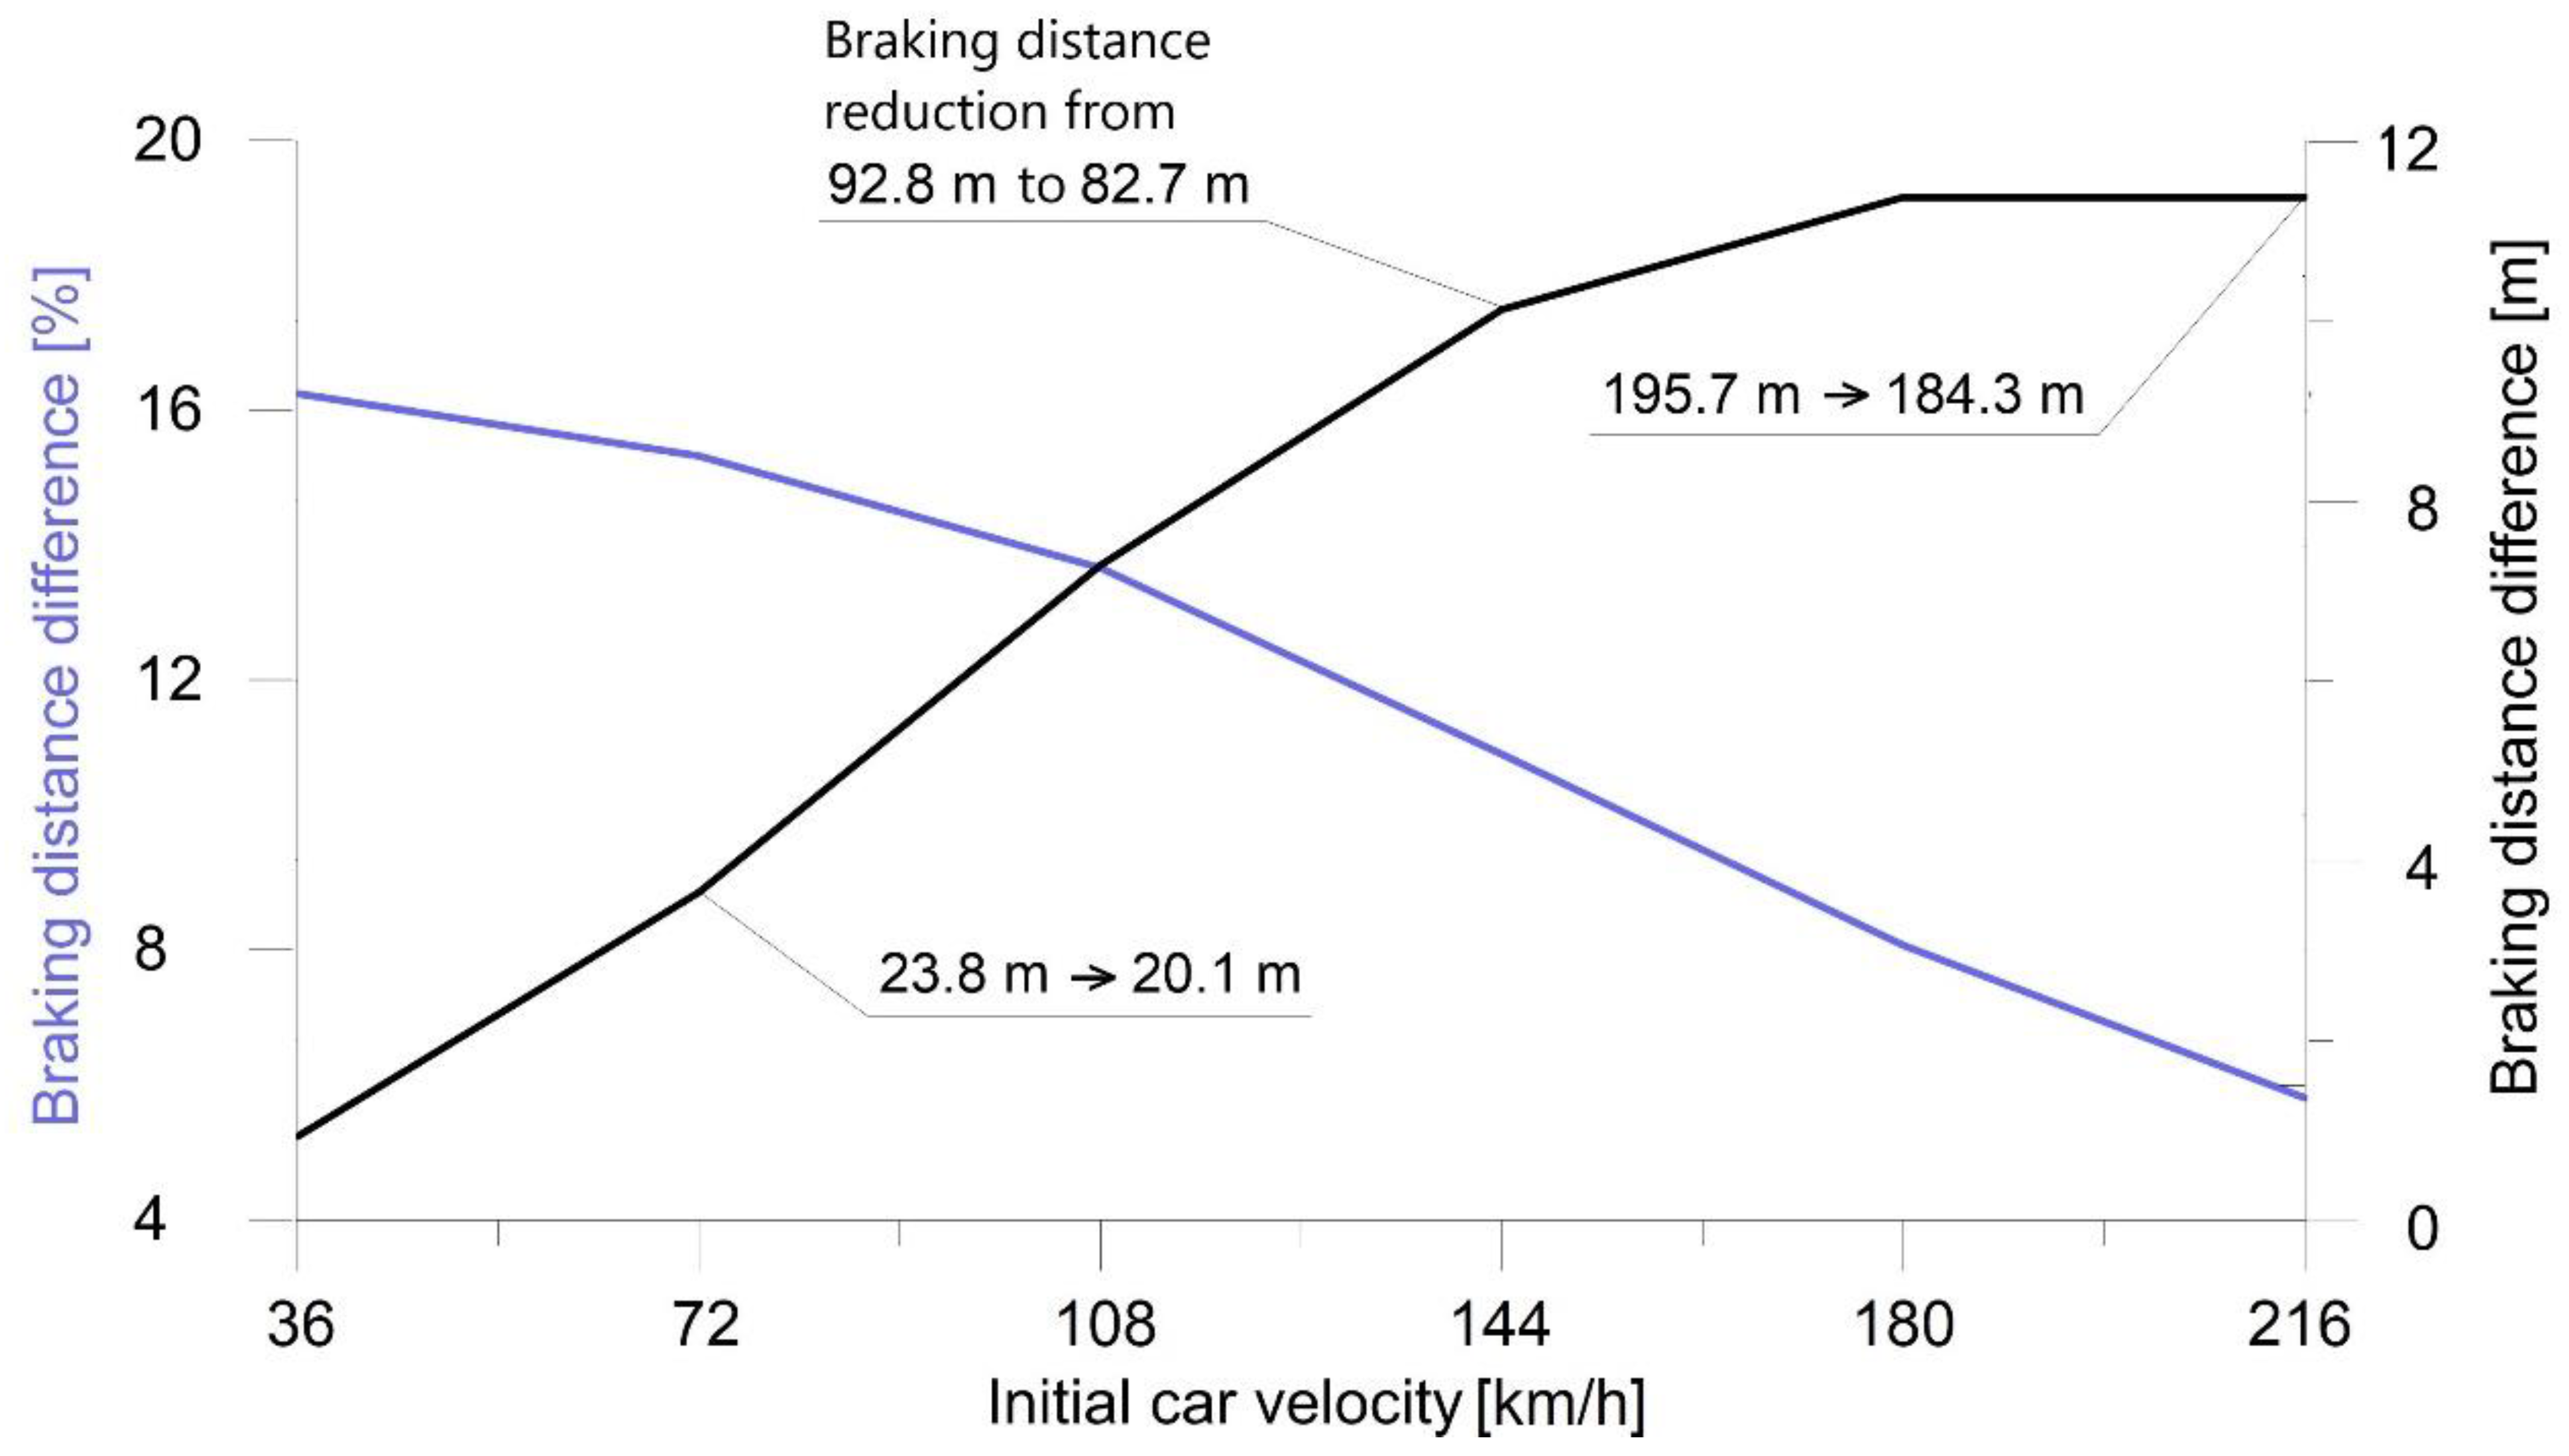
3.4.3. Braking
4. Conclusions
- The presented solution is the first approximation showing the potential construction possibilities and advantages of the FDDG with air curtains.
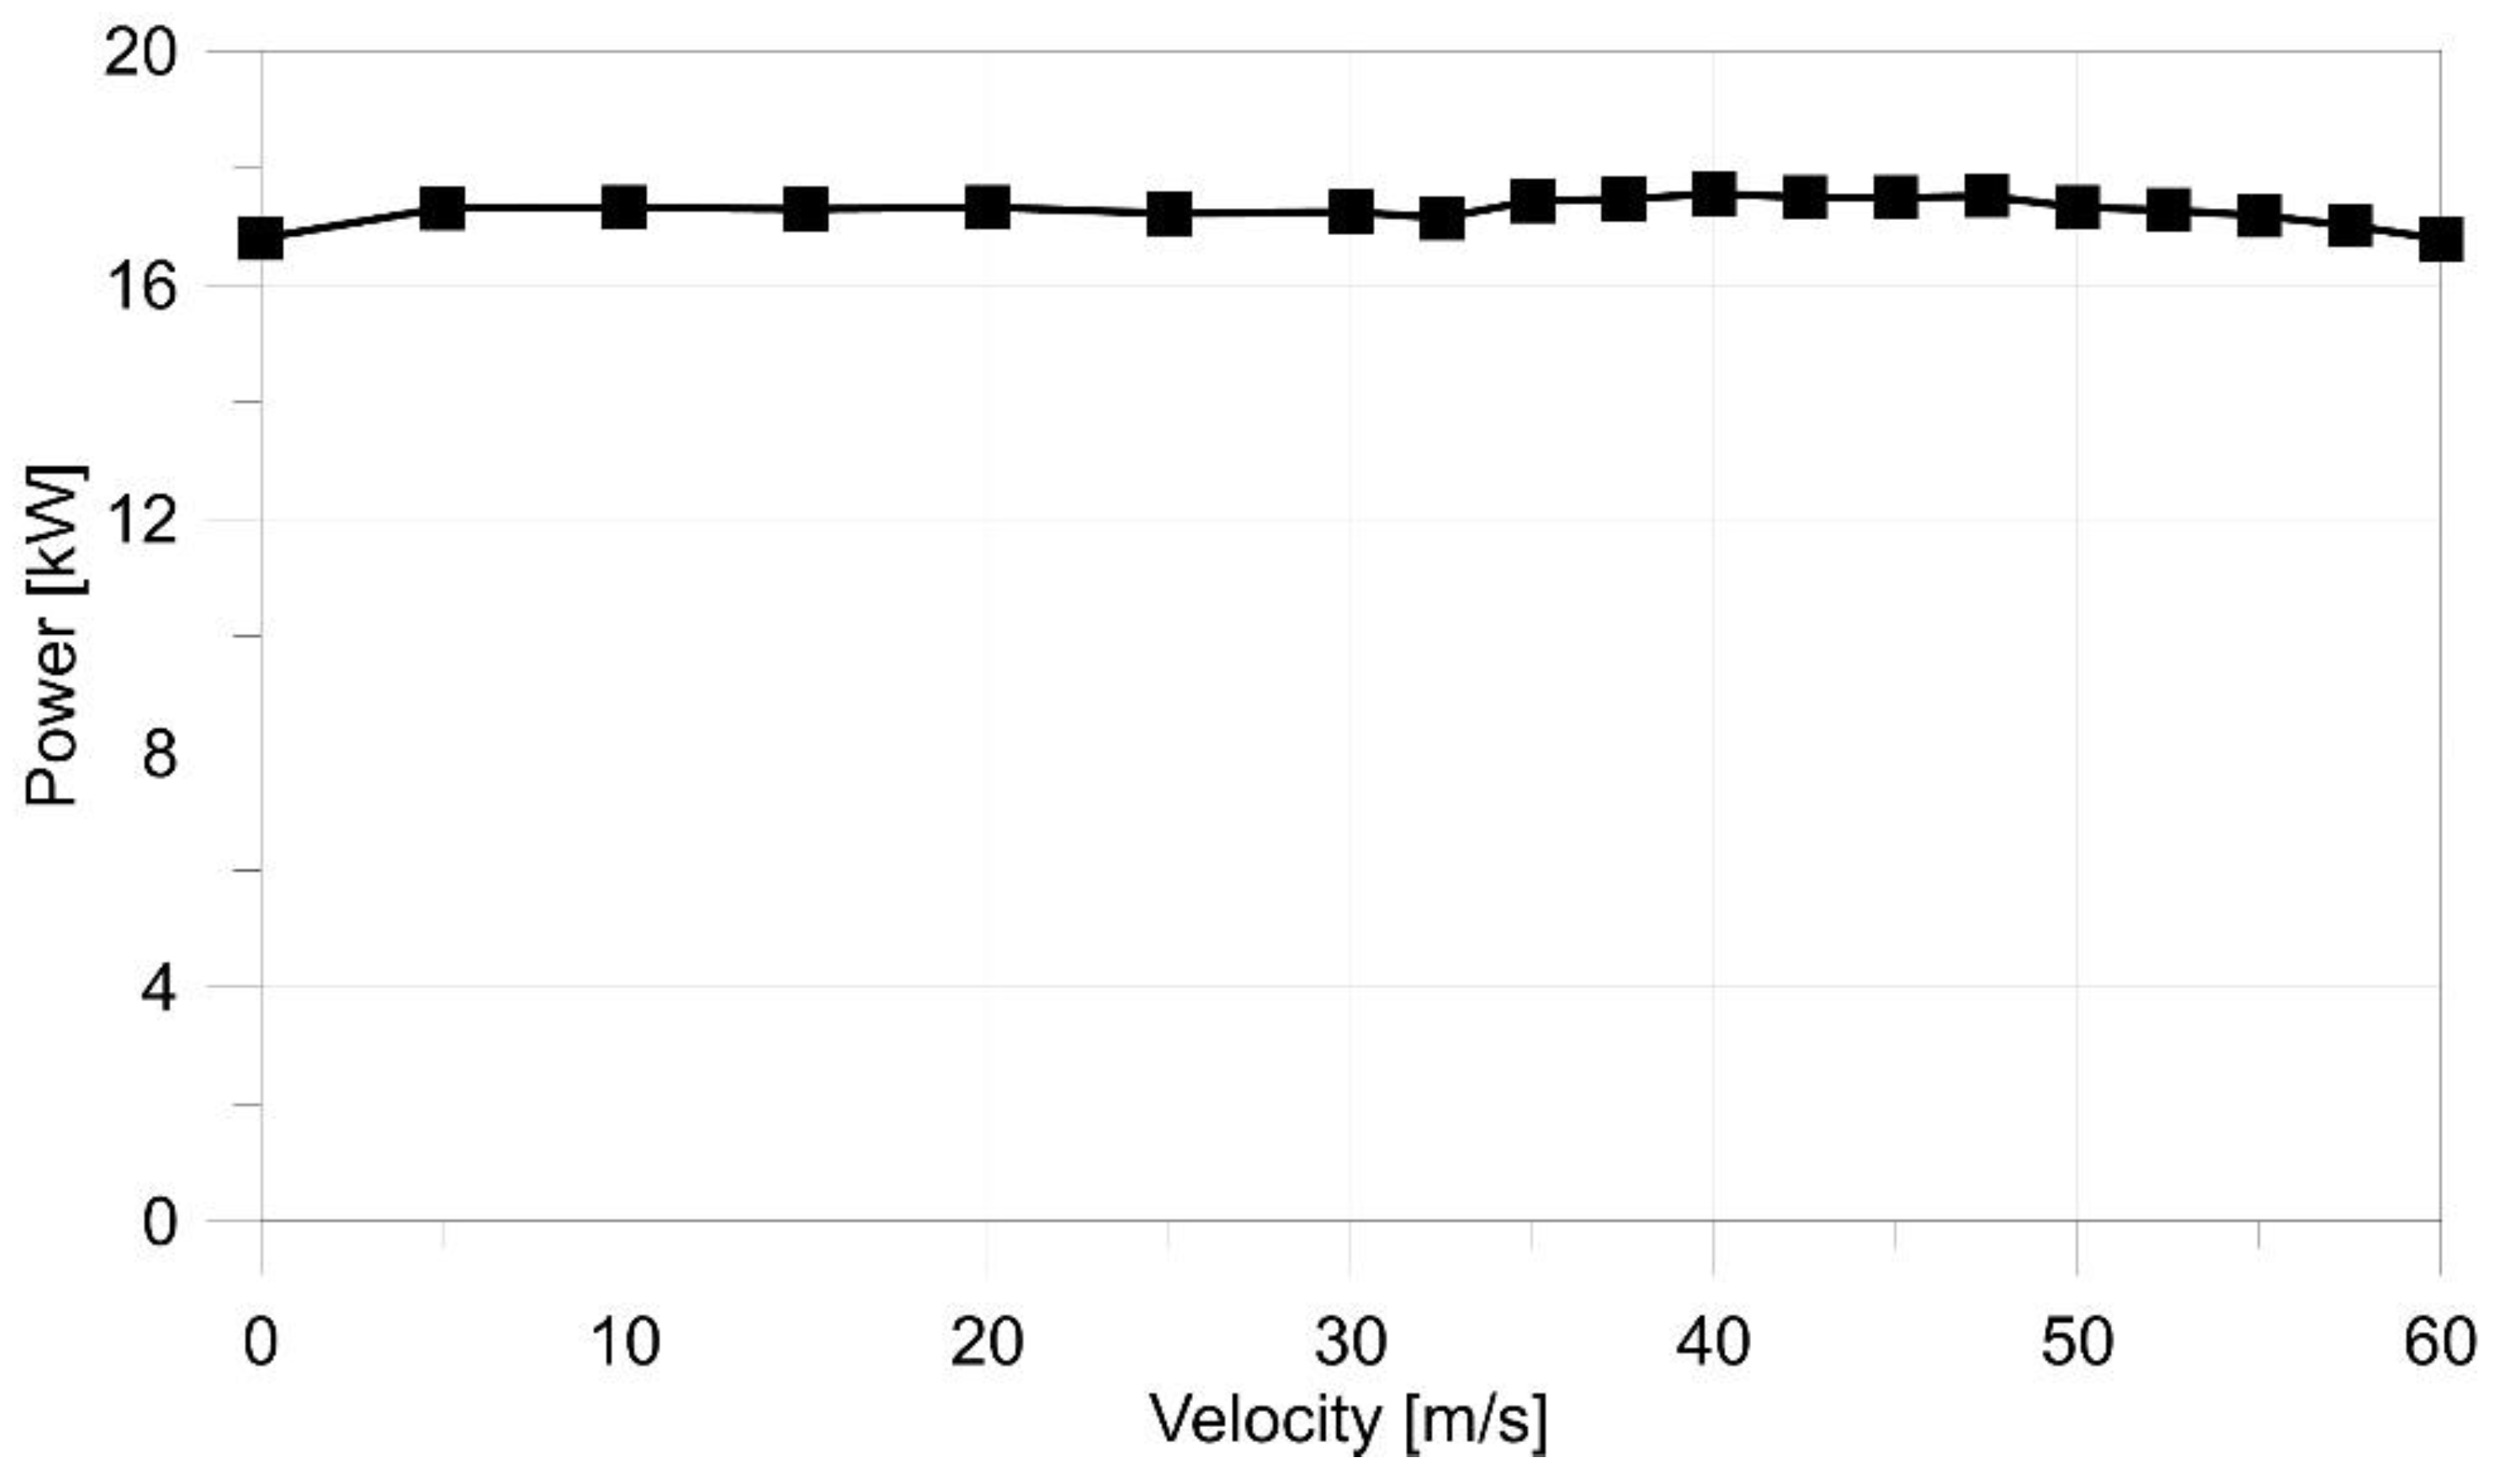
- In the tested application of a sports car, the device provided additional downforce, 2600 N at zero velocity: to 1000 N at 40 m/s, using 17 kW of power supplying idealized fans. Koenigsegg Agera R, according to the official data [32], generates 3000 N total downforce at 250 km/h (69.5 m/s).
- Most importantly, the area of effective use of artificially generated aerodynamic downforce can be very wide. In the last subsections of the article, scenarios of fan-enhanced acceleration and braking were studied. The acceleration time to achieve 100 km/h was reduced from 3.6 s to 3.0 s. In the case of braking from 216 km/h to a halt, the braking distance was reduced by 11 m.
Author Contributions
Funding
Institutional Review Board Statement
Informed Consent Statement
Data Availability Statement
Acknowledgments
Conflicts of Interest
References
- Katz, J.; Garcia, D. Aerodynamic effects of Indy car components. SAE Tran. 2002, 111, 2322–2330. [Google Scholar]
- Mezger, H. Der Porsche 4,5-l-Rennsportwagen Typ 917, Teil 2, ATZ, BD.; 1969; Volume 71, pp. 417–423. Available online: https://presskit.porsche.de/museum/en/2019/topic/anniversaries/porsche-celebrates-50-years-of-the-917/hans-mezger-the-porsche-917-chief-engineer.html (accessed on 15 September 2021).
- Lamar, P. Aerodynamics & The Group Seven Racing Car. In Proceedings of the AIAA Symposium on The Aerodynamics of Sports & Competition Automobiles, Los Angeles, CA, USA, 20 April 1968. [Google Scholar]
- Hucho, W.-H. (Ed.) Aerodynamics of Road Vehicles, 4th ed.; SAE International: Warrendale, PA, USA; Materials Park, OH, USA, 1998; p. 918. [Google Scholar] [CrossRef]
- Savkoor, A.R.; Chou, C.T. Application of Aerodynamic Actuators to Improve Vehicle Handling. Veh. Syst. Dyn. Int. J. Veh. Mech. Mobil. 1999, 32, 345–374. [Google Scholar]
- Kataoka, T.; China, H.; Nakagawa, K.; Yanagimoto, K.; Yoshida, M. Numerical simulation of road vehicle aerodynamics and effect of aerodynamic devices. SAE Trans. 1991, 100, 722–734. [Google Scholar]
- Winkelmann, H. Aerodynamics of the new BMW Z4. In Proceedings of the 4th MIRA International Vehicle Aerodynamics Conference, Gaydon, UK, 25–26 October 2006. [Google Scholar]
- Hall, J.E.; Mrlik, J.R.; Musser, J.G.; Winchell, F.J. Aerodynamic Spoiler for Automotive Vehicles. US Patent 3455594, 15 July 1969. [Google Scholar]
- Ludwig, K.; Bruder, W.A. Aerodynamic Braking Mechanism for Motor Vehicles. U.S. Patent 2932370A, 11 June 1956. [Google Scholar]
- Broniszewski, J.; Piechna, J. A fully coupled analysis of unsteady aerodynamics impact on vehicle dynamics during braking. Eng. Appl. Comput. Fluid Mech. 2019, 13, 623–641. [Google Scholar] [CrossRef]
- Broniszewski, J.; Piechna, J.R. Fluid-Structure Interaction Analysis of a Competitive Car during Brake-in-Turn Manoeuvre. Energies 2022, 15, 2917. [Google Scholar] [CrossRef]
- Kurec, K.; Remer, M.; Mayer, T.; Tudruj, S.; Piechna, J. Flow control for a car-mounted rear wing. Int. J. Mech. Sci. 2019, 152, 384–399. [Google Scholar] [CrossRef]
- Piechna, J.R.; Kurec, K.; Broniszewski, J.; Remer, M.; Piechna, A.; Kamieniecki, K.; Bibik, P. Influence of the Car Movable Aerodynamic Elements on Fast Road Car Cornering. Energies 2022, 15, 689. [Google Scholar] [CrossRef]
- Szudarek, M.; Piechna, J. CFD Analysis of the Influence of the Front Wing Setup on a Time Attack Sports Car’s Aerodynamics. Energies 2021, 14, 7907. [Google Scholar] [CrossRef]
- Rong, B.Z. Jim Hall and the Chaparral 2J: The Story of America’s Most Extreme Race Car. Available online: https://www.roadandtrack.com/motorsports/a32350/jim-hall-chaparral-2j-history/ (accessed on 28 June 2022).
- Falconer, R.; Nye, D. Chapparal; Motorbooks International: Osceola, WI, USA, 1992. [Google Scholar]
- O’Callaghan, D. Chaparral 2J: Here’s How It Worked and What Happened When It Raced. Available online: https://www.hotcars.com/chaparral-2j-see-how-it-worked-and-what-happened-when-it-raced/ (accessed on 28 June 2022).
- This Was the Brabham BT46B, the Revolutionary Fan Car That Formula 1 Had to Ban for Bullying. Available online: https://tekdeeps.com/this-was-the-brabham-bt46b-the-revolutionary-fan-car-that-formula-1-had-to-ban-for-bullying/ (accessed on 28 June 2022).
- Secrets of the Lotus 79 Skirts. Available online: https://classicteamlotus.co.uk/en/news/posts/2021/secrets-of-the-lotus-79-skirts/ (accessed on 28 June 2022).
- Dernie, F.W. Vehicle Suspension Systems. U.S. Patent 4861066, 29 August 1989. [Google Scholar]
- Active Suspension. Available online: https://www.motorsportmagazine.com/archive/article/december-2001/69/active-suspension (accessed on 28 June 2022).
- Suspension III: Active Suspension Systems. Available online: https://www.edmunds.com/car-technology/suspension-iii-active-suspension-systems.html (accessed on 28 June 2022).
- Is the Aston Martin DB11’s Virtual Spoiler a Gimmick? Available online: https://www.carthrottle.com/post/wpm4dxr/ (accessed on 28 June 2022).
- Ehrich, F.F. The Curtain Jet. J. Aerosp. Sci. 1961, 28, 855–860. [Google Scholar] [CrossRef]
- Strand, T. Inviscid incompressible flow theory of static peripheral jets in proximity to the ground. J. Aer./Space Sci. 1961, 28, 27–33. [Google Scholar] [CrossRef]
- Roche, J.T.D. The peripheral jet theory. In Applied Mechanics; Görtler, H., Ed.; Springer: Berlin/Heidelberg, Germany, 1966. [Google Scholar] [CrossRef]
- Makowski, F.T.; Kim, S.E. Advances in External-Aero Simulation of Ground Vehicles Using the Steady RANS Equations; Technical Paper; SAE: Warrendale, PA, USA, 2000; No. 2000-01-0484. [Google Scholar] [CrossRef]
- Shih, T.H.; Liou, W.; Shabbir, A.; Yang, Z.; Zhu, J. A new k-ϵ eddy viscosity model for high reynolds number turbulent flows. Comput. Fluids 1995, 24, 227–238. [Google Scholar] [CrossRef]
- Menter, F.R. Two-Equation Eddy-Viscosity Turbulence Models for Engineering Applications. AIAA J. 1994, 32, 1598–1605. [Google Scholar] [CrossRef] [Green Version]
- Cooke, G.C.; Duffy, R.E. Forward-Speed Effects on Peripheral-Jet Ground Support Systems. J. Aircr. 1972, 9, 675–681. [Google Scholar] [CrossRef]
- Koenigsegg Gemera. Available online: https://www.koenigsegg.com/model/gemera (accessed on 28 June 2022).
- Koenigsegg Agera, R. Available online: https://www.koenigsegg.com/technical-specifications-agera-r (accessed on 28 June 2022).


| Parameter | Coarse Mesh | Medium Mesh | Fine Mesh |
|---|---|---|---|
| Cell count | 7 mln | 8 mln | 9 mln |
| Force in the forward direction in N | 87 (+3.1%) | 86 (+1.7%) | 84 |
| Downforce in N | 2541 (−3.3%) | 2624 (−0.2%) | 2629 |
| Volumetric flow rate through all fans in m3/s | 5.81 (+1.9%) | 5.79 (+1.5%) | 5.70 |
Publisher’s Note: MDPI stays neutral with regard to jurisdictional claims in published maps and institutional affiliations. |
© 2022 by the authors. Licensee MDPI, Basel, Switzerland. This article is an open access article distributed under the terms and conditions of the Creative Commons Attribution (CC BY) license (https://creativecommons.org/licenses/by/4.0/).
Share and Cite
Szudarek, M.; Piechna, A.; Piechna, J. Feasibility Study of a Fan-Driven Device Generating Downforce for Road Cars. Energies 2022, 15, 5549. https://doi.org/10.3390/en15155549
Szudarek M, Piechna A, Piechna J. Feasibility Study of a Fan-Driven Device Generating Downforce for Road Cars. Energies. 2022; 15(15):5549. https://doi.org/10.3390/en15155549
Chicago/Turabian StyleSzudarek, Maciej, Adam Piechna, and Janusz Piechna. 2022. "Feasibility Study of a Fan-Driven Device Generating Downforce for Road Cars" Energies 15, no. 15: 5549. https://doi.org/10.3390/en15155549
APA StyleSzudarek, M., Piechna, A., & Piechna, J. (2022). Feasibility Study of a Fan-Driven Device Generating Downforce for Road Cars. Energies, 15(15), 5549. https://doi.org/10.3390/en15155549