Article

Experimental Characterization of Transitory Functioning Regimes of a Biomass Stirling Micro-CHP

by
Ștefan-Dominic Voronca
1,2,
Monica Siroux
1,* and
George Darie
2
1
INSA Strasbourg ICUBE, University of Strasbourg, 67000 Strasbourg, France
2
Department of Power Generation and Usage, University Politehnica of Bucharest, 060042 Bucharest, Romania
*
Author to whom correspondence should be addressed.
Energies 2022, 15(15), 5547; https://doi.org/10.3390/en15155547
Submission received: 14 June 2022 / Revised: 19 July 2022 / Accepted: 27 July 2022 / Published: 30 July 2022

Abstract

:
Micro-cogeneration (micro-combined heat and power) is a technology that simultaneously produces decentralized thermal and electrical energy with a power of less than 50 kWel. This technology consists of using the waste heat generated by a thermodynamic process to meet the heating and hot water demands of buildings. The use of biomass as a fuel offers important advantages: use of a renewable energy, carbon neutrality, availability, and low cost. Furthermore, the analysis and optimization of hybrid energy systems, which include existing micro-cogeneration systems powered by renewable energy, is a scientific challenge needing experimental characterization of such micro-cogeneration systems. In this context, a biomass Stirling micro-CHP unit (μCHP), was tested to characterize its energy performance. A dynamic model based on these experimental investigations was developed to evaluate its thermal power output and energy efficiencies. The dependence of the nominal load on the water flow rate of the consumer and the inlet temperature of the fluid heated by the cogeneration system was studied. Results showed that the flow rate of the heat transfer fluid rejecting heat from the μCHP unit influences the temperature of the heat transfer fluid exiting the μCHP to supply domestic hot water to the user, which, if too high, will prompt the self-guarding mechanism of the machine.

1. Introduction

To facilitate the energy transition, it is necessary to develop sustainable energy technologies. Micro-combined heat and power (µCHP) is such a technology that simultaneously produces decentralized heat and electricity energy at low power (electrical power lower than 50 kWel) [1]. Micro-cogeneration consists of exploiting the waste heat generated by a thermodynamic process to meet the heat and hot water demands of buildings [2].
Micro-CHP technology offers significant benefits: reduced primary energy consumptions, reduced CO2 emissions, and lack of requirements for central plant and network construction [3]. Micro-CHP technology can contribute to the transition of the traditionally centralized energy supply system towards a more sustainable system [4].
A biomass engine was previously tested in INSA Strasbourg to characterize its performance. The unit used to co-generate heat and power is the PELLEMATIC Condens_e model, which was manufactured by the Austrian company “ÖkoFEN” [5].
The unit has been tested for peak shaving purposes in local grids and found to be profitable in transition heating periods (spring and autumn) and winter, while, in the summer, the heat produced was greater than the demand [6].
The unit has been paired with an open-source Building Energy Management System (oBEMS) aimed at reducing the building energy demand [7]. The developed system was the first of its kind, due to the fact that the BEMS focused on low-temperature heat networks with distributed generation, whereas BEMS have previously been largely focused on electrical controls.
The ÖkoFEN micro-cogeneration unit is fitted with a free-piston type Stirling engine, which has a broad use in biomass, biogas, and natural gas cogeneration.
Several studies of CHP applications equipped with a Stirling engine were reviewed [8,9,10,11,12,13,14,15,16,17,18,19,20,21,22,23]. The characteristics of the units presented in the studies are synthesized in Table 1. In some studies, certain categories of information were not available.
In terms of fuel comparison, it was found that sugarcane pellets and commercial biomass pellets have similar temperature outputs [8]. The Stirling engine efficiency was slightly lower when using sugarcane pellets. The ash level accumulations are higher for sugarcane pellets; therefore, the heat exchanger surface must be cleaned more frequently for this type of fuel, or the efficiency of the Stirling engine decreases.
The influence of the adiabatic combustion temperature on the maximum performance of Stirling engines has been studied [9]. Adiabatic combustion temperatures from solid biomass can reach up to 1100 °C. The authors propose the integration of an efficient combustion cooling in order to prevent exceeding ash melting temperatures.
An experimental prototype µCHP based on a 100 kWth straw-fired boiler and a 14.8 kW steam engine producing 1.1 kWel was investigated [10]. The authors found a correlation between the resulted electrical efficiency of 2% and constructive factors such as the absence of thermal insulation and the relatively large diameter of the steam piping.
A dynamic performance assessment of two internal combustion engines fueled by natural gas and a reciprocating external combustion Stirling engine was performed using simulation software [11]. The comparison showed that, for any of the proposed systems, the primary energy consumption reduction can be up to 13.4%, and the CO2 equivalent emissions can be reduced up to 18.9%, resulting in a reduction of 20.9% in operating costs with respect to the conventional systems.
A thermodynamic and economic optimization of a solar-powered Stirling engine µCHP was developed [12]. The best configuration studied can deliver 3.65 kWel of electric power and 11.06 kWth of thermal power. The economic results show that the proposed system has a payback period of approximately 10 years.
A Stirling engine was placed between a gasification unit and an internal combustion engine [13]. The high temperature of the hot raw gas stream was found to be an economically attractive hot source for a Stirling engine. In this finance-oriented study, it was found that profitability depends on the required investment costs and the investment becomes more profitable as the cost of biomass rises.
The thermal efficiency has been studied for different domestic hot water temperatures [14]. The analyzed temperatures were 30, 50, and 70 °C, and it was found that the thermal efficiency was between 90% for 30 °C and 84% for 70 °C. In both cases, the electrical efficiency slightly exceeded 9%.
The integration of a Stirling engine in biomass-integrated gasification combined heat and power (BIGCHP) was studied [15]. It was found that the function is best oriented towards producing electrical power, because it is more costly than thermal output power.
The functioning with pellets of different diameters (Ø6 and Ø8 mm) was analyzed [16]. For the pellets having a diameter of Ø8 mm, the temperature ratio of the Stirling engine was lower, and the regenerator effectiveness was higher. Moreover, a higher thermal efficiency was recorded using Ø8 mm diameter pellets.
Agricultural biomass and wood waste were used as fuel to power a µCHP fitted with a free-piston Stirling engine [17]. The power obtained was 10.71 W from the pruning of trees and 25.79 W from sawdust.
A conceptual design and performance analysis of a free-piston Stirling engine was conducted [18]. The components of a free-piston type Stirling engine were simulated and optimized using different thermodynamic parameters and dimensional sizes.
A free-piston Stirling engine was also used for a µCHP application, running on natural gas [19]. The study found that the developed Stirling engine had good power efficiency even when functioning in a partial-load mode.
A pairing of a gamma-type Stirling engine with a fluidized bed combustor was realized and it was found that the fluidized bed enabled the heat recovery produced in the gas phase [20]. It was also found that higher temperatures can be achieved by placing the heater of the Stirling engine in the fluidized bed, instead of the conventional flue gas stream.
A CHP application using a Stirling engine was studied in order to meet a 1.23 MWth heat demand from a village [21]. It was concluded that CHP units fitted with Stirling engines totaling 1 MWth could meet 70% of the heat demand, and the remainder could be covered by a biomass furnace.
Before being implemented as µCHP, the Stirling engine was tested for CHP plants [22]. With a thermal power of 475 kWth and power of 75 kWth, it obtained similar efficiencies to the µCHP applications.
A transient model of a µCHP unit running on diesel fuel was realized in the TRNSYS program, describing the functioning process as a five-stage process [23]. The proposed dynamic model showed that, during the start-up and steady states, the produced power is proportional to the temperature difference between the Stirling engine block and the burner.

2. Materials and Methods

The ÖkoFEN PELLEMATIC Condens_e is an improved version of the Pellematic Condens, which is fitted with a Stirling engine. Its output is described by a nominal thermal power of 12 kWth and a nominal power of 1 kWel. Its partial thermal power can drop to 8 kWth. It weighs 294 kg. It runs on wooden pellets, being fitted with an internal 30 kg fuel reservoir and connected to an additional 120 kg fuel silo. Its energy efficiency index is 125. Its boiler temperature ranges from 25 to 85 °C. Its maximum operating pressure is 3 bar. It has been tested by manufacturers to withstand pressures up to 4.6 bar.
Figure 1 shows the principal diagram of a biomass micro-cogeneration unit. The air and biomass enter the furnace, producing heat, part of which is transferred to the heater of the Stirling engine. The engine transforms the thermal power into mechanical power and, through the generator, into electric power. The cooler of the Stirling engine transfers the residual heat to the cold water coming from the end-user. This water is heated in 2 steps, firstly from the rejected heat of the Stirling engine, and secondly from the remaining heat of the flue gasses, through the economizer. When starting, the machine first mechanically cleans the exhaust pipe of the previously deposed ash and combustion residue. The machine is equipped with an automatic pneumatic fuel handling system. The electrical combustion mechanism consuming 0.2 kWel is activated and heat from the combusting pellets starts to release in the combustion chamber. The machine prioritizes the start of the Stirling engine, whose inner working fluid (helium) will be heated to 220 °C prior to producing power. At the starting point, it produces 100 to 120 W, and it increases to 850 to 1000 W in 60 min depending on the configured thermal flow output. The exhaust fumes are used to heat the heat transfer fluid (water) entering the machine that transports heat to the end-user through a regenerator. The fumes have a temperature of 40 °C upon exit due to the heat exchange with low temperature water entering the µCHP circuit, as shown in Figure 1. After the temperature of the Stirling engine has reached 220 °C, an internal heat exchanger transfers additional heat from the engine to the water that transports heat to the user, while simultaneously ensuring the cooling of the Stirling engine. Once the Stirling engine starts functioning, the starting phase is finished and the combustion process is stabilized, the system starts circulating heat transfer fluid towards the user with a nominal temperature of 60 °C. The hot water temperature can reach 75 °C if the flow rate is too low to evacuate heat from the machine. If this temperature is reached, the safeguard mechanism of the machine will automatically switch the functioning to partial load, to trigger circuit cooldown.
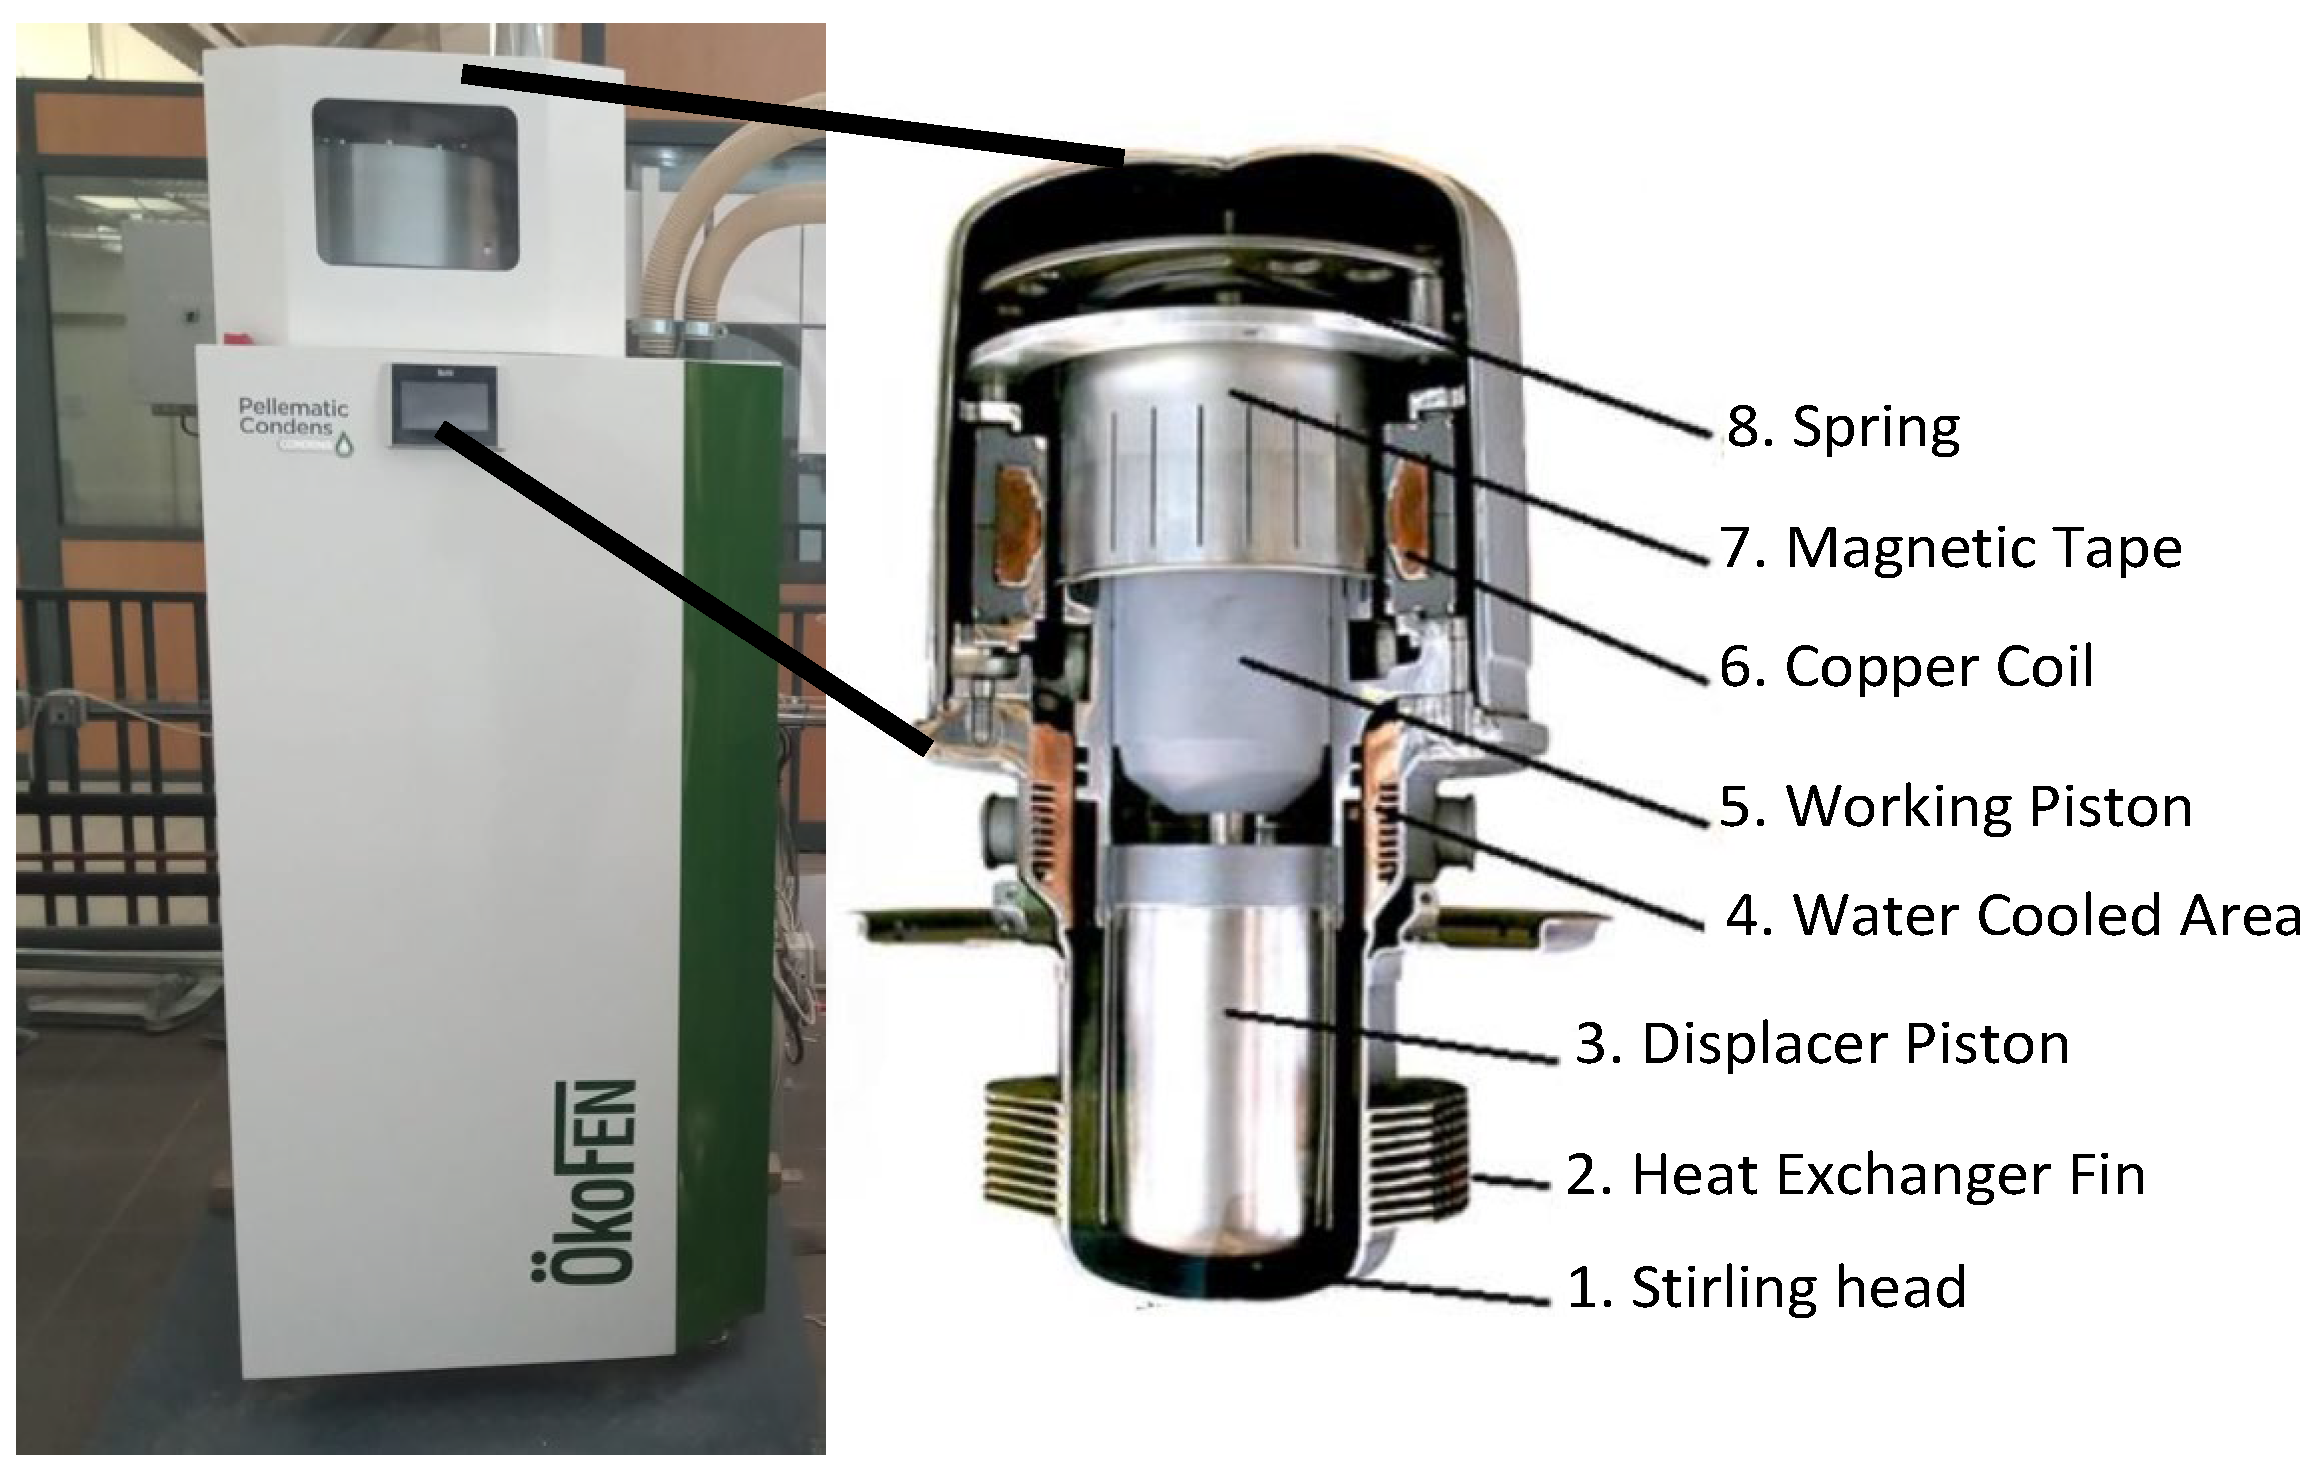
As shown in Figure 2, the displacement piston (3) pushes helium through the heat exchanger (2) from the Stirling head (1) to the cooler (4). The spring (8) on the opposite casing at the bottom pulls the piston back upwards. The helium is alternatively heated and cooled, and as a result it expands and contracts again. The working piston (5) is moved up and down by these pressure waves. The magnetic working piston (5) is surrounded by a fixed magnetic coil (6) with copper windings (7). The maximum electrical output is 1050 W. The engine efficiency is 26% and its designed life is 50,000 h. It is sealed and does not require maintenance.
The ÖkoFEN Pellematic Condens_e machine has its own internal sensors that can be accessed locally, and through an Internet connection. The machine was tested in an ON–OFF regime. Data was registered from the moment that the machine was turned on and one hour after it was turned off, to observe parameters during cooling. The first tests were performed for a total period of 270 min (4.5 h), including the cooling period. The period was chosen so that the machine could put itself into partial load if necessary. As soon as this happened, the experiment ended, because the goal was to produce electrical power and a partial load has a negative impact on this production.
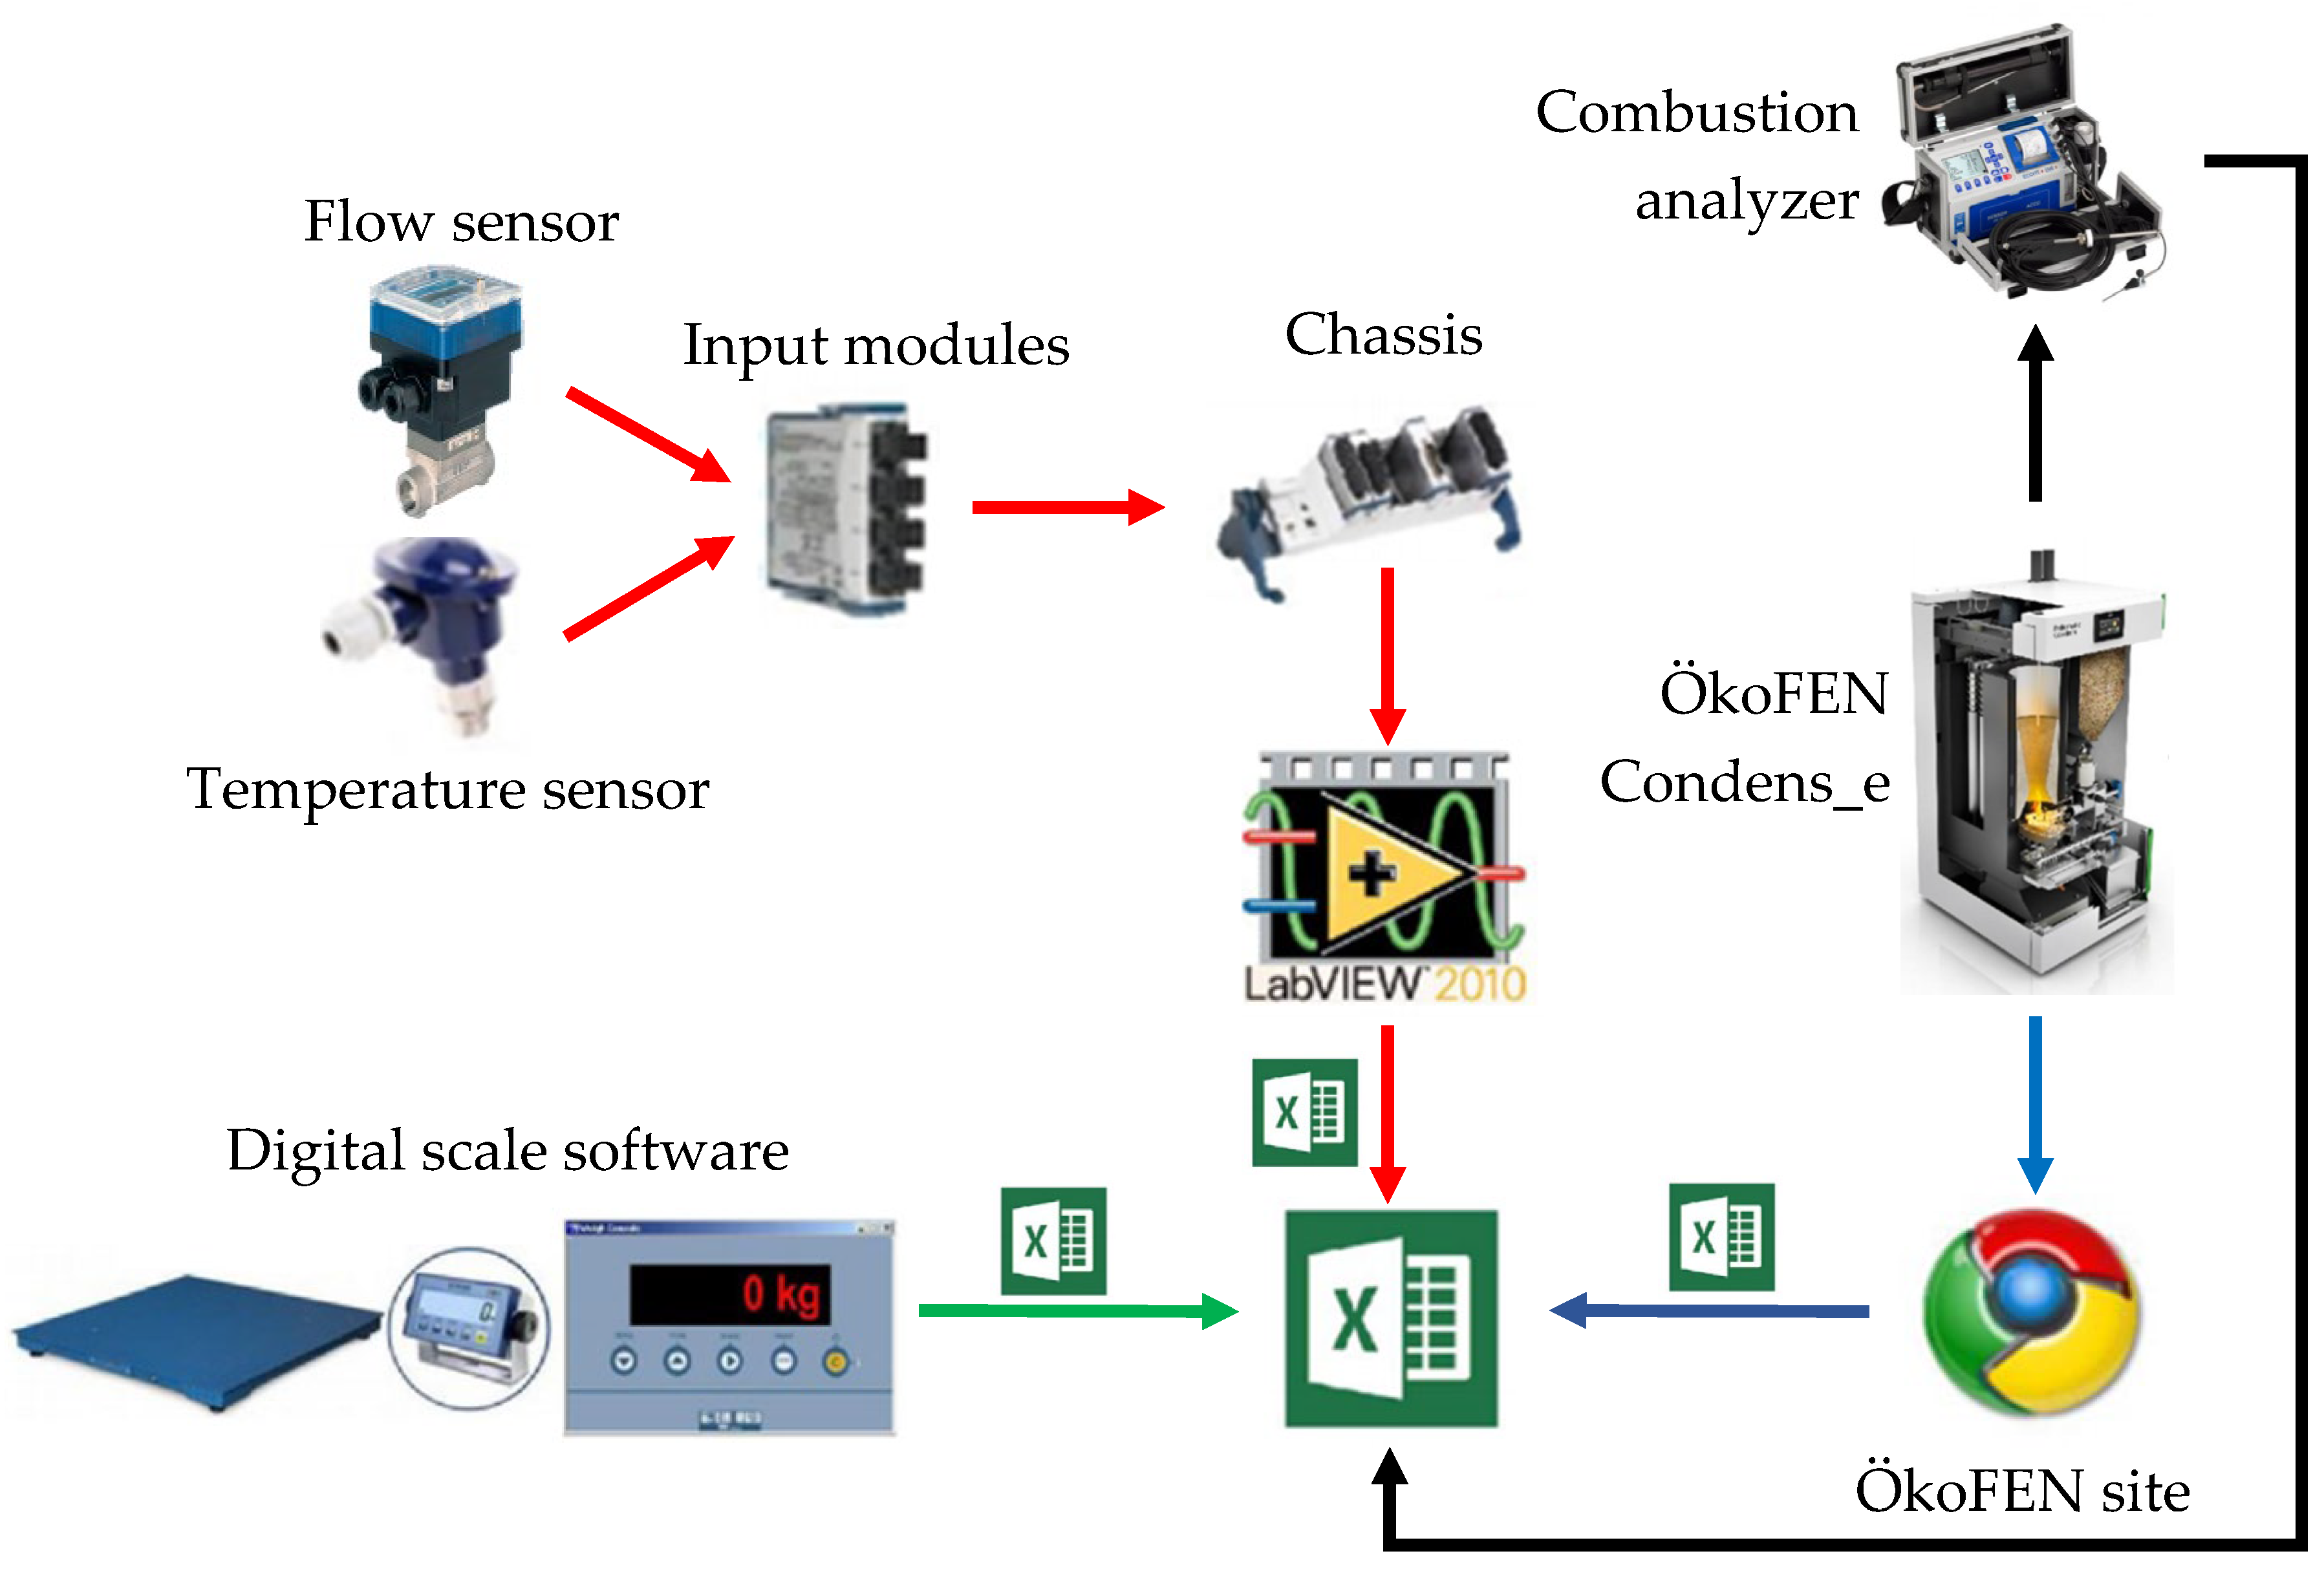
The data acquisition system is presented in Figure 3. The red arrow set represents the process of measuring the thermal power output of the machine, the blue arrows that of electrical power output, and the green arrows that of fuel mass flow.
The thermal power output, represented with a red arrow, was measured by heat transfer fluid flow and temperature. The water flow rate was recorded by a Flowmeter Burkert 8035t, connected to a 100 S/s/channel, 4-Channel C Series Universal Analog Input Module, model NI 9219, made by National Instruments, connected to a National Instruments CompactDAQ Chassis, connected to a LabVIEW algorithm that registered the data once per minute in Excel. The heat transfer fluid temperature was recorded with a JUMO PT100 model, connected to a C Series Temperature Input Module made by National instruments, connected to the National Instruments CompactDAQ Chassis, connected to the LabVIEW algorithm writing in Excel.
The blue arrow set represents the process of measuring the output power, which was recorded internally by the ÖkoFEN PELLEMATIC Condens_e, and the data were recorded once per minute.
The green arrow set represents the process of measuring the fuel mass, which was recorded on a WALL-E Floor scale and connected to the PC with an RS232 to USB cable, then exported to Excel via the DINI-TOOLS program. The fuel mass flow was determined by recording the weight of the machine once every 60 s, because the fuel reservoir was inside the µCHP.
The characteristics of the measuring sensors used are shown in Table 2.
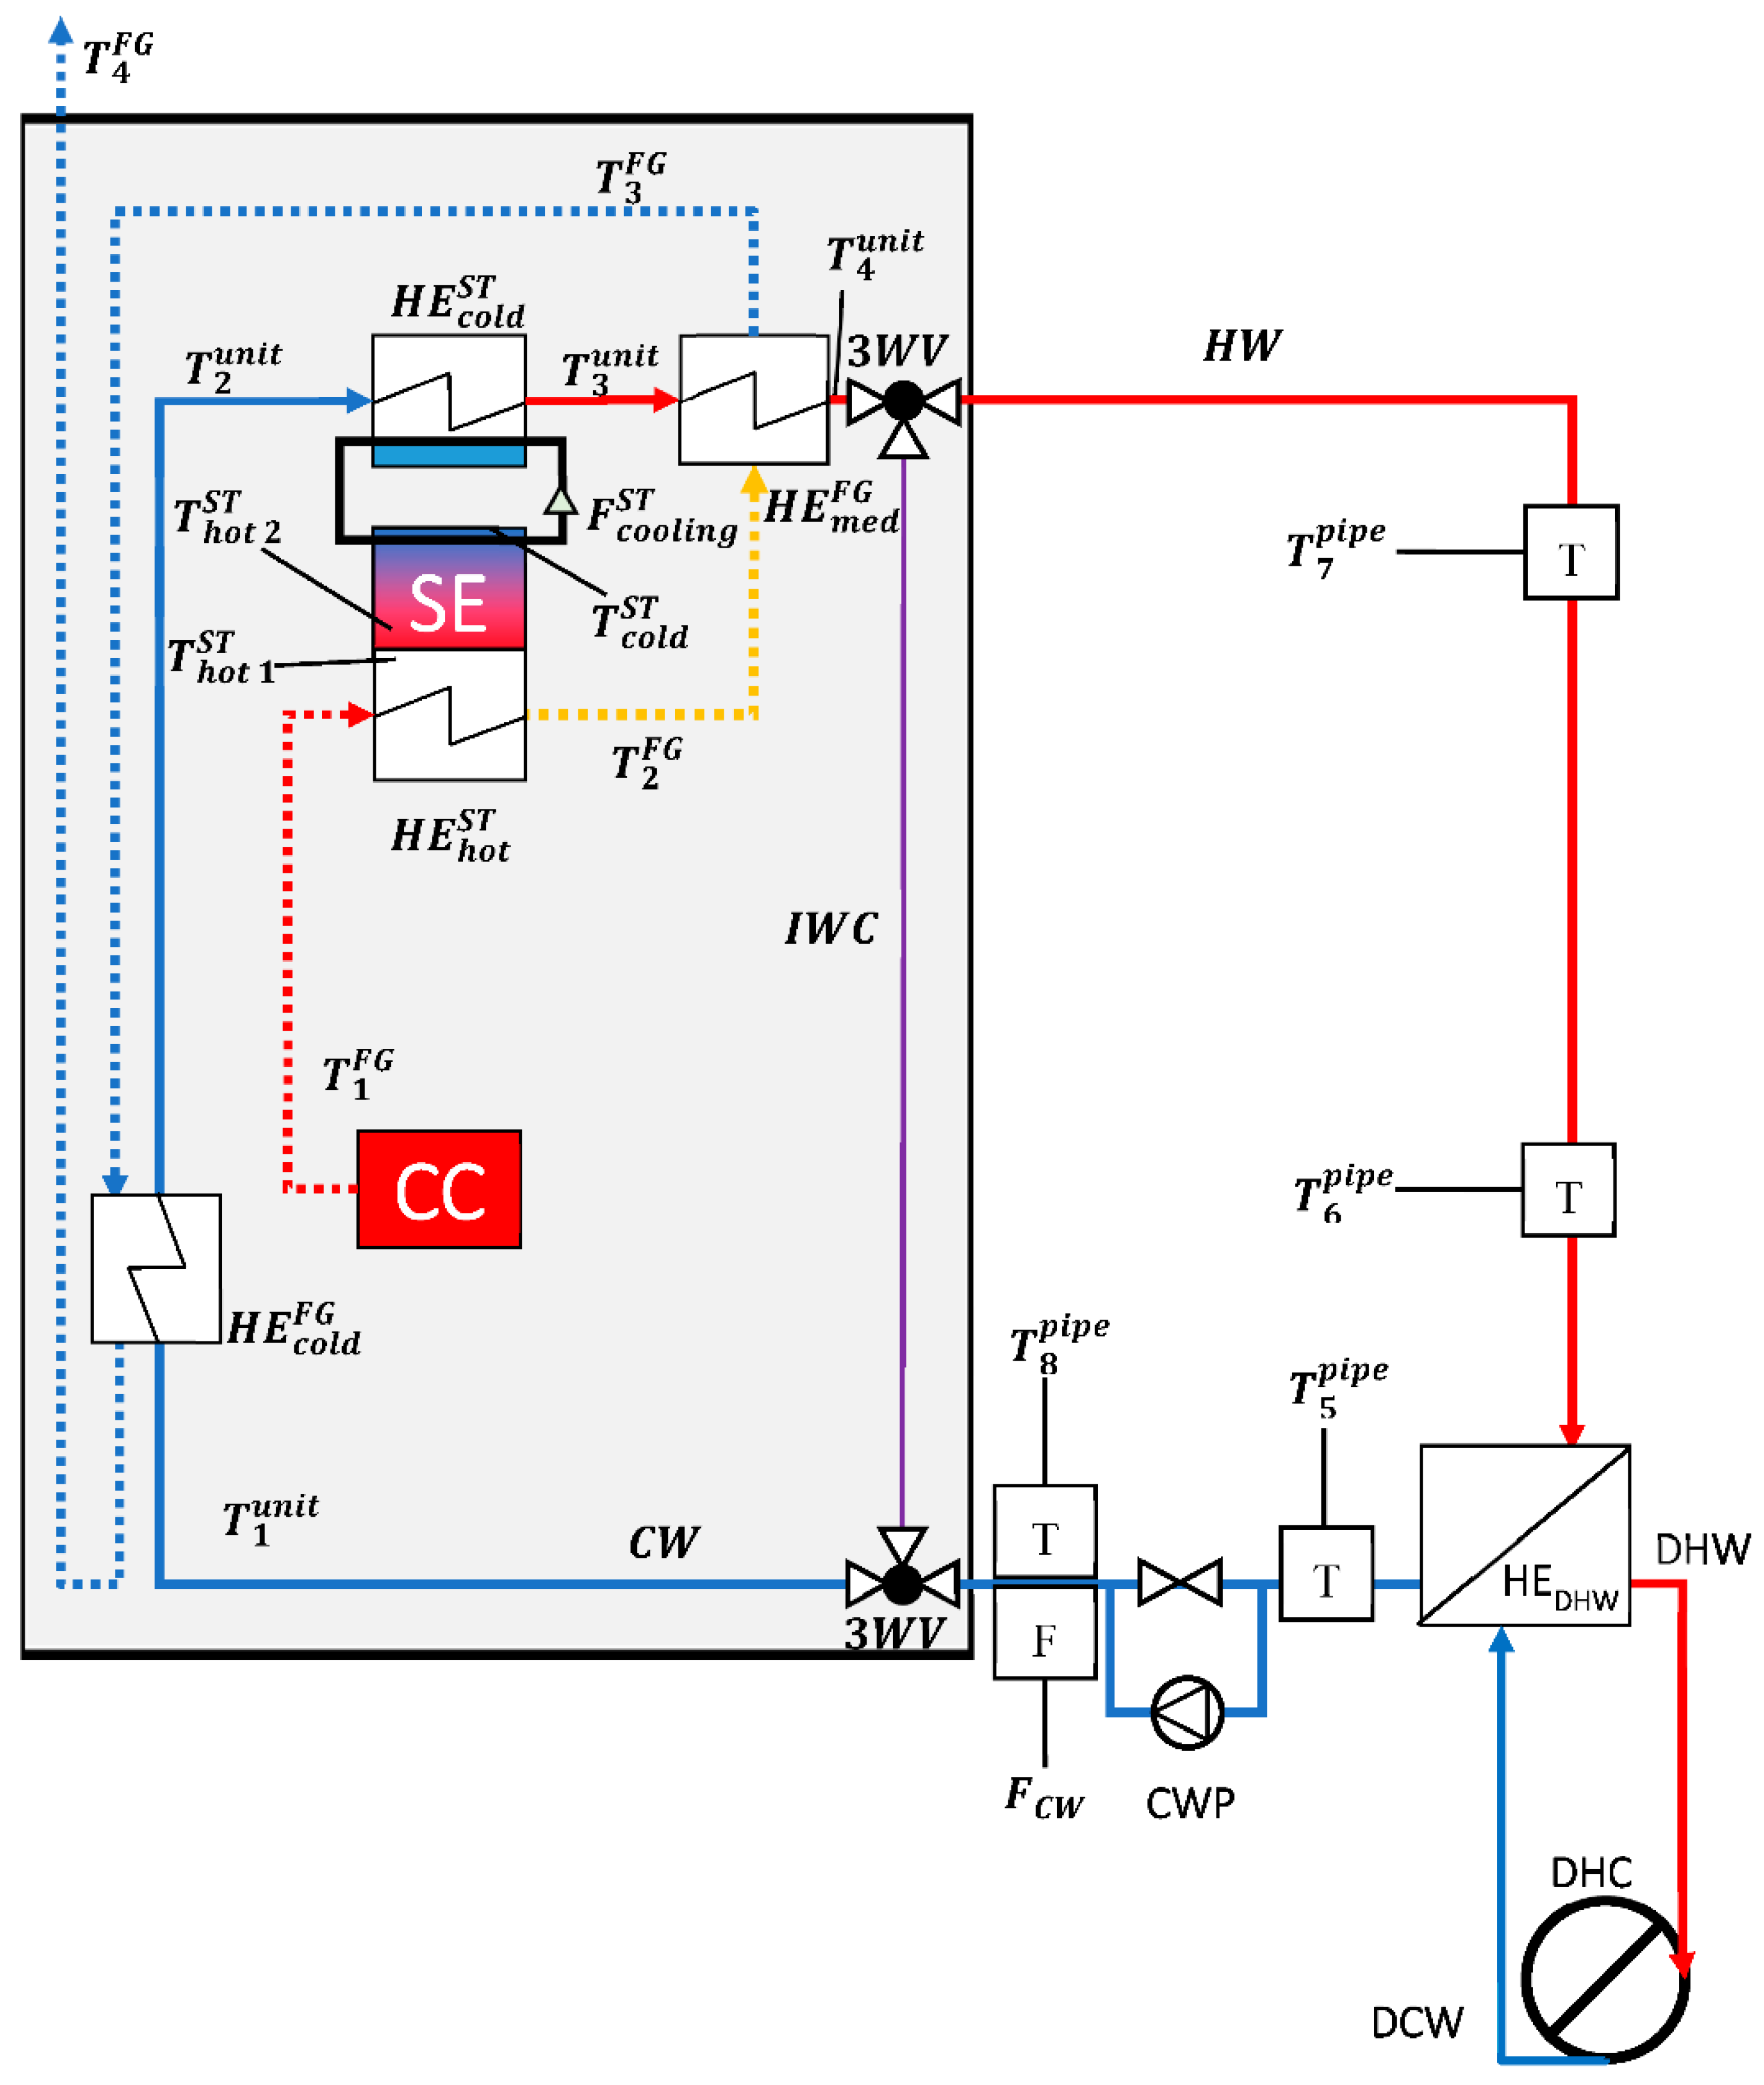
Figure 4 shows the measured and calculated parameters of the heat transfer fluid (water) and flue gas on the micro-cogeneration unit. Details are given in Appendix A Table A1, Table A2 and Table A3.
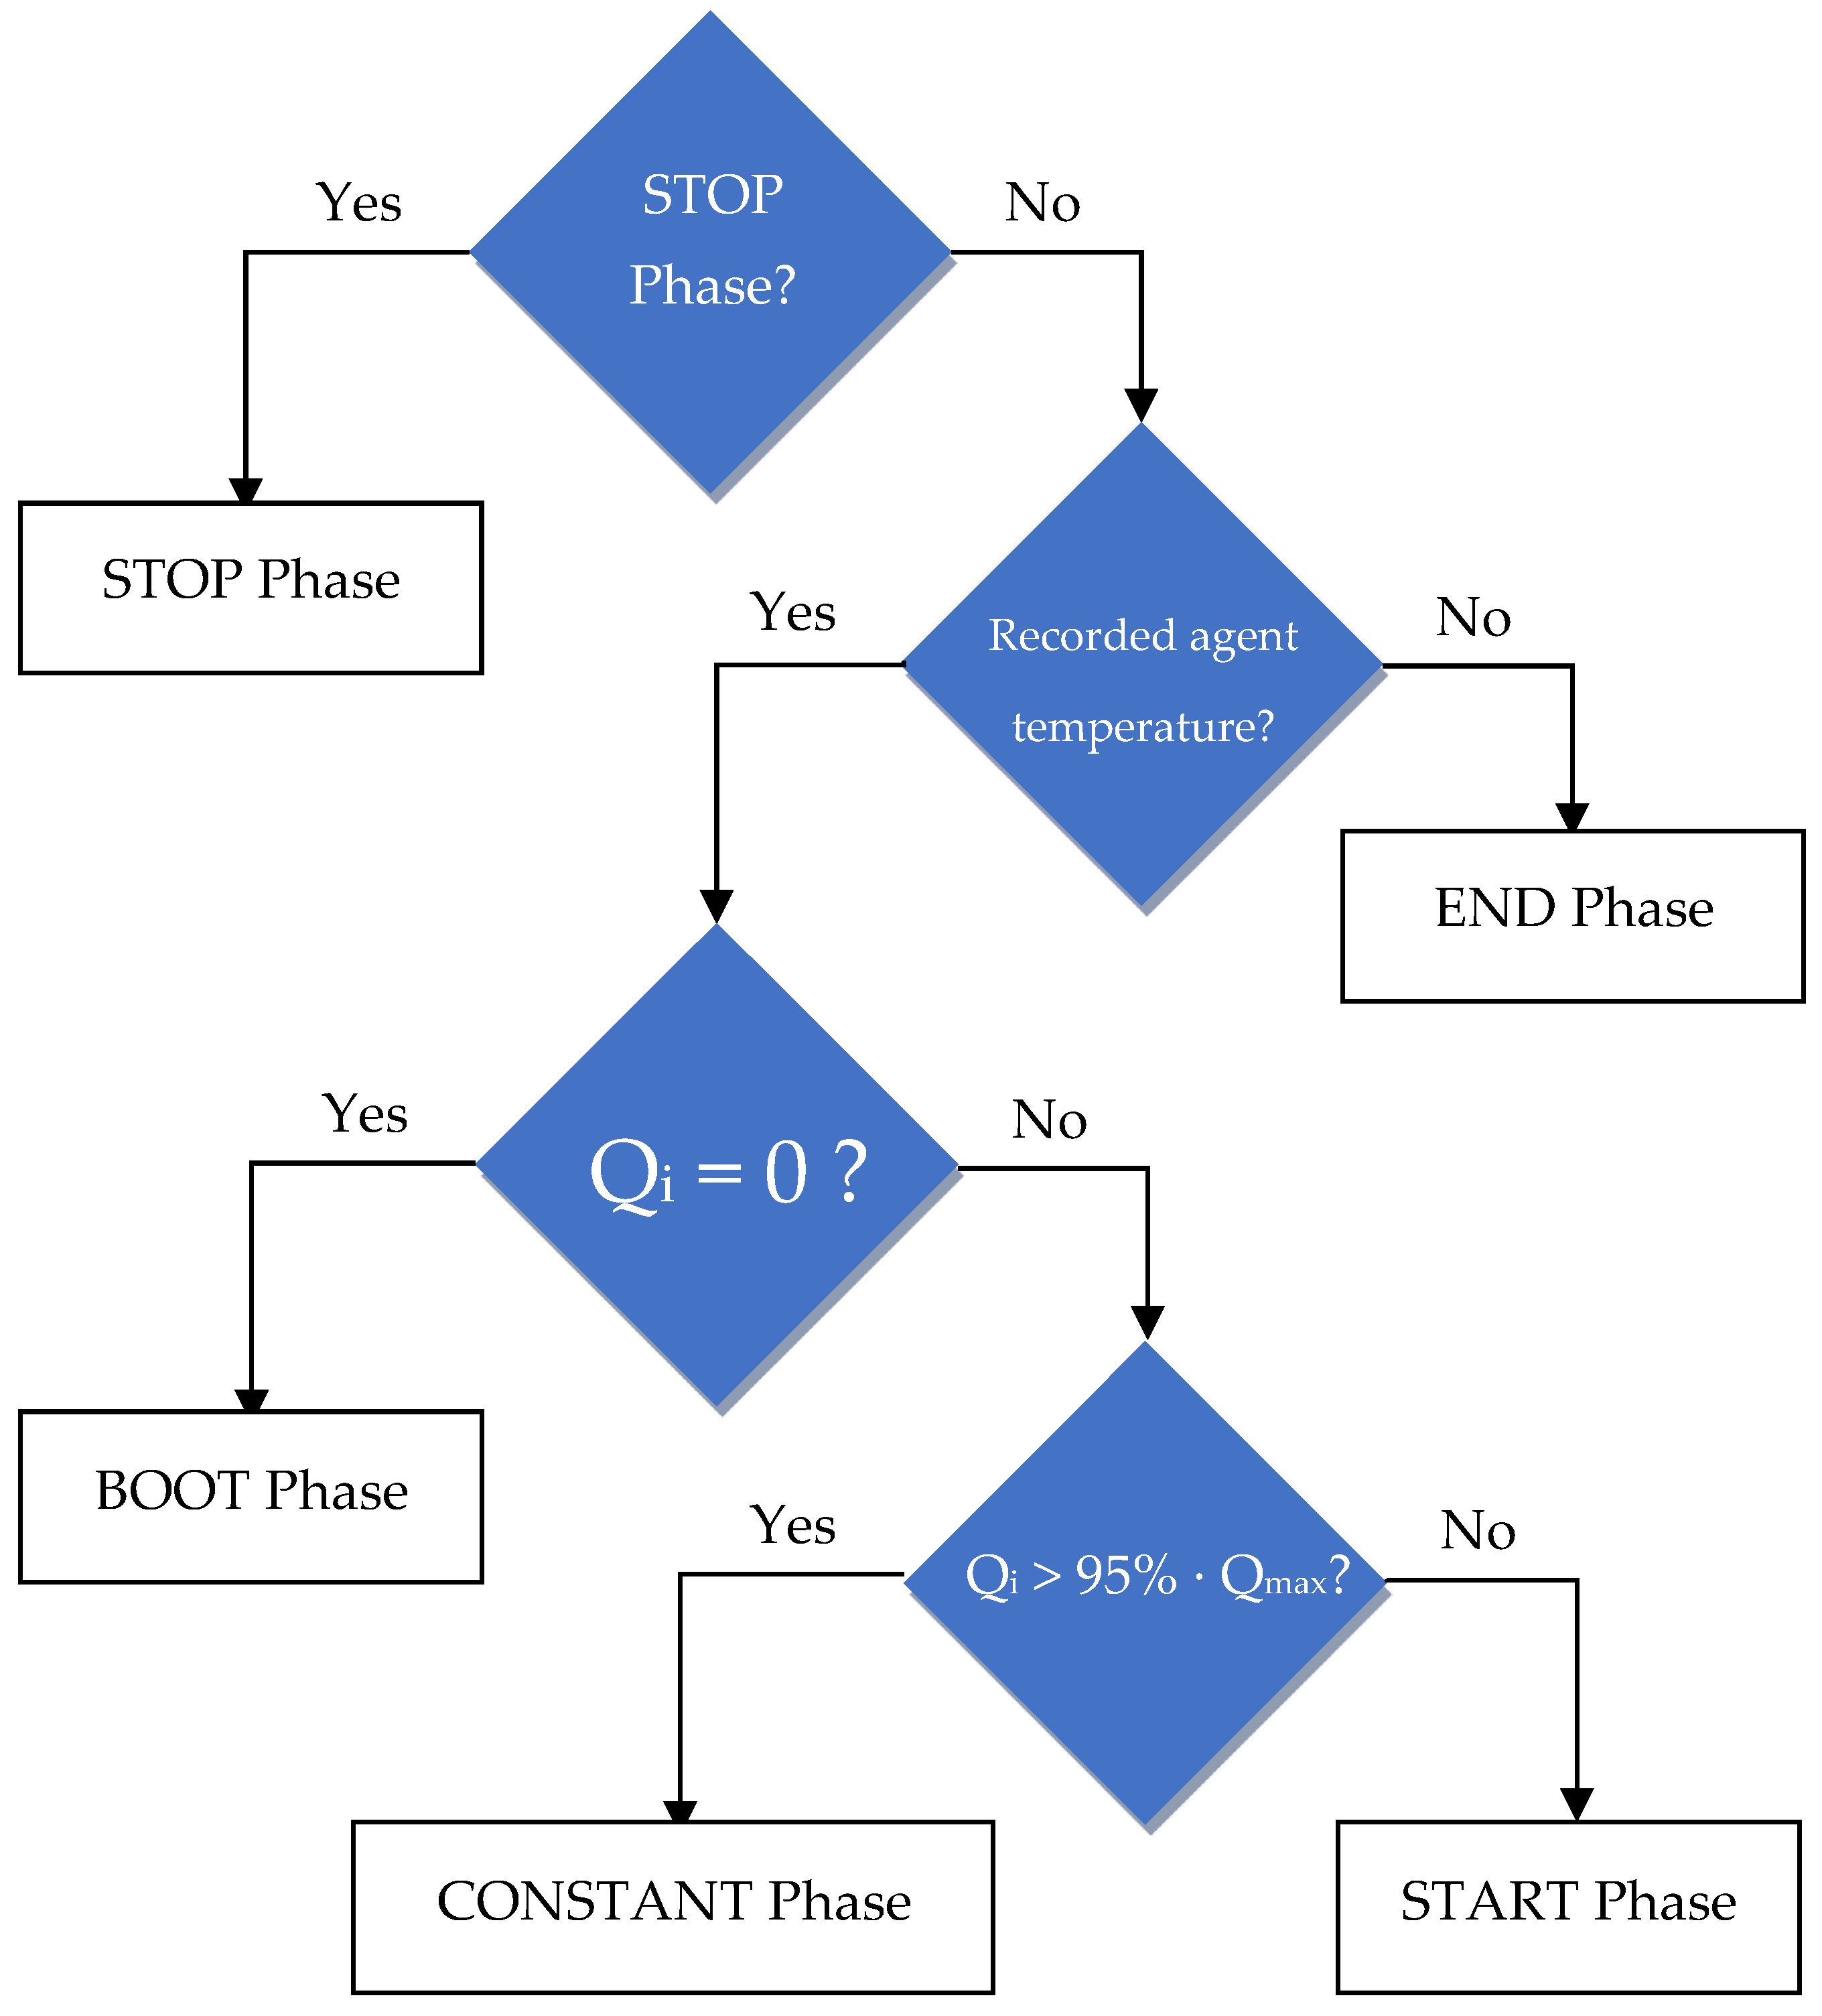
The formula used to calculate the thermal power of the heat transfer fluid is presented below as Equation (1). To calculate the flue gas temperatures, iterative calculus was used, as shown in Figure 5. Equation (2) was used to calculate the thermal power of the flue gas and, through Equation (3) [24], the flue gas temperature T i FG was calculated.
P th unit i = F cw 60 · ρ water · c p water ( T i + 1 unit T i pipe )
P th unit i = η HE FG W · P th unit   FG i
P th unit   FG i = v th CO 2 FG · ( ρ CO 2 T i + 1 FG · c p CO 2 T i + 1 FG · T I + 1 FG ρ CO 2 T i FG · c p CO 2 T i FG · T i FG ) + v th SO 2 FG · ( ρ SO 2 T i + 1 FG · c p SO 2 T i + 1 FG · T I + 1 FG ρ SO 2 T i FG · c p SO 2 T i FG · T i FG ) + v th N 2 FG · ( ρ N 2 T i + 1 FG · c p N 2 T i + 1 FG · T I + 1 FG ρ N 2 T i FG · c p N 2 T i FG · T i FG ) + v th H 2 O air · ( ρ H 2 O T i + 1 FG · c p H 2 O T i + 1 FG · T I + 1 FG ρ H 2 O T i FG · c p H 2 O T i FG · T i FG ) + ( λ 1 ) · v th dry air · ( ρ wet   air T i + 1 FG · c p wet   air T i + 1 FG · T I + 1 FG ρ wet   air T i FG · c p wet   air T i FG · T i FG ) + ( λ 1 ) · v th H 2 O FG · ( ρ H 2 O T i + 1 FG · c p H 2 O T i + 1 FG · T I + 1 FG ρ H 2 O T i FG · c p H 2 O T i FG · T i FG )
To calculate the heat transfer coefficient for the flue gas, polynomial functions of the 5th degree were calculated using the Microsoft Excel functions shown in Table 3, based on property tables [25] of specific heat [ kJ kg · m 3 ] and densities [ kg m 3 ] of all composing elements of the flue gas, which depend on temperature. The parameters (specific heat and density) were determined through polynomial functions of the 5th degree by correlating the values of property tables [25] (Y) to their corresponding temperatures (X).
Measurements were performed by varying the heat transfer fluid flow rate and the thermal output configuration of the machine. The flow rate variation was undertaken by manipulating a pump in the heat transfer fluid’s circuit. The pump has three flow rate settings, which are referred to as Flow 1, Flow 2, and Flow 3. The thermal output variation was undertaken by regulating the machines’ settings. The thermal output configuration power was 10, 12, and 14 kWth. The purpose of varying the heat transfer fluid flow rate and the thermal output power configuration was to determine the impact on the capacity to evacuate the produced heat. In terms of efficiency, the question was whether it is more efficient to send heat from the machine to the end-user at a slower speed, consuming less fuel, or whether it is more efficient to send more heat, consuming more fuel. This would determine how the machine fits an end-user household, in order to obtain the best use of fuel. Each of the 3 flows was paired with 3 thermal power outputs, resulting in a total of 9 configurations, as shown in Table 4.
The flow rate was measured once per minute during the start and end of functioning, and arbitrarily in short intervals of 1 to 10 min after stabilization. Once the flow stabilized, the variation between the average value of the flow and instantaneous values was between −1.12% and 0.42%. Using Equation (4), the categorizing into phases was undertaken.
For each configuration, the flow was divided into 5 stages: boot phase, start phase, constant phase, end phase, and stop phase, as explained in Table 5. A flow was considered “constant” if the produced thermal power varied with less than 5% in comparison to the highest value recorded for the respective experiment. If the heat transfer fluid temperature was not recorded in Excel by the LabVIEW algorithm, it meant that the experiment was over; therefore, the stage was that of “end”.
= if ( noted _ stage = " stop " , " stop "   if ( recorded _ temperature = " null " , " end "   if ( thermal _ power _ generated = 0 , " boot "   if ( thermal _ power _ generated > 0.95 maximum _ thermal _ power _ generated , " constant " , " starting " ) ) ) )
If neither of the two met the conditions, the flow was considered as part of the starting phase. This was performed using 4 IF clauses in Excel, as shown in Equation (4) and explained in Figure 5.
Of the 5 phases of the experiment, those considered for the flow were the start, constant, and end phase. The thermal output of the machine depended on whether it was sending heat transfer fluid to the heat exchanger with the end-user; therefore, the flow had a significant impact on the stage of the experiment.
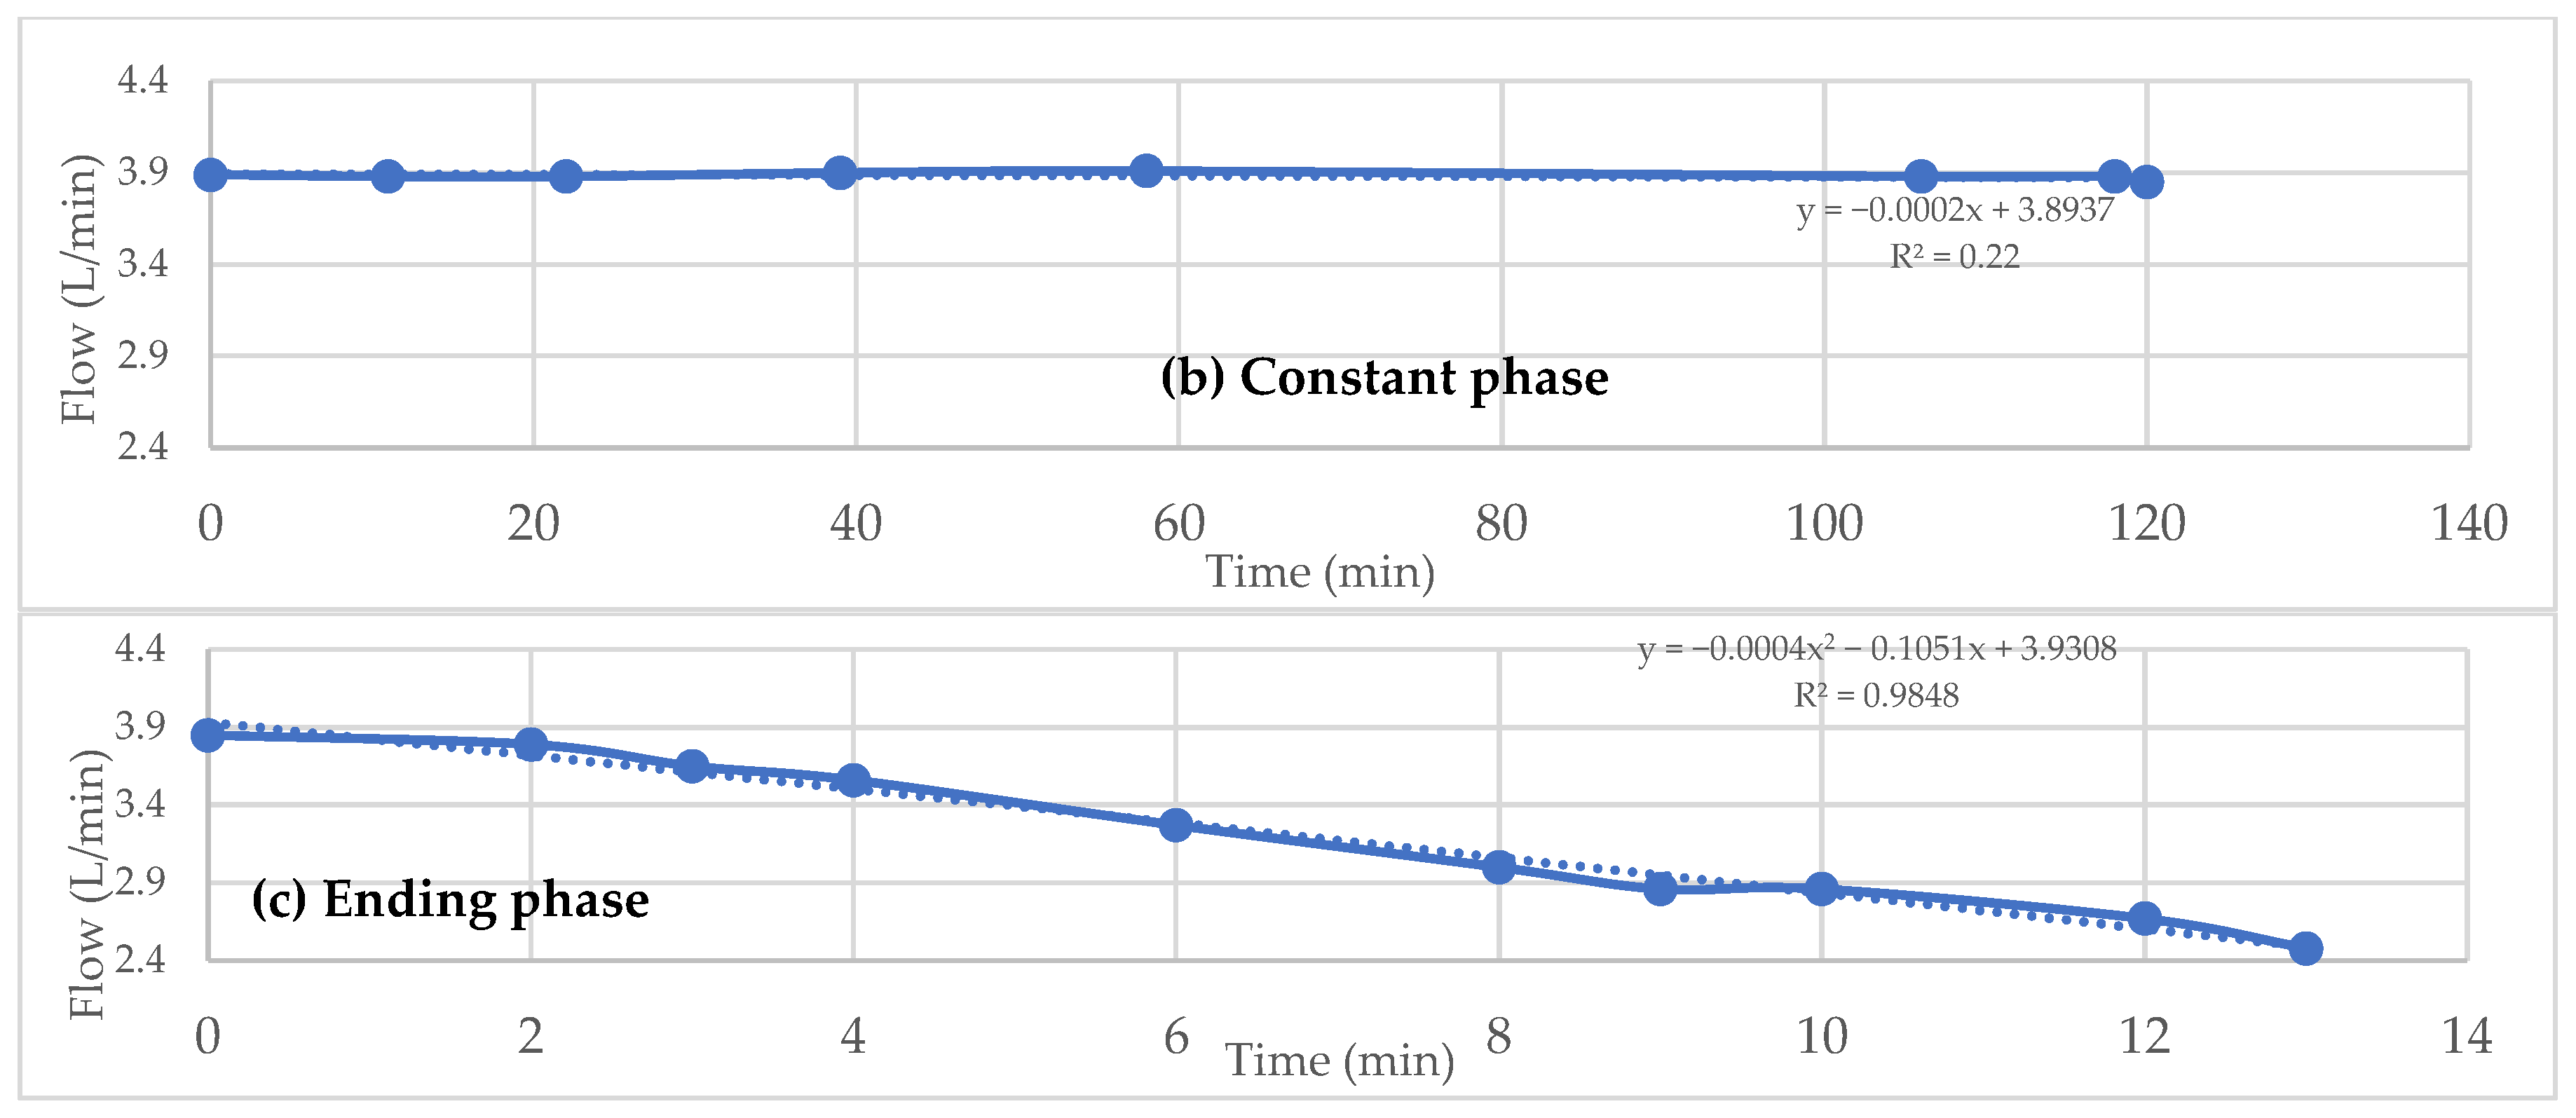
Figure 6 shows the three phases of the flow. Values of the flow start from and stop at approximately 2.5 L/min, due to the machine beginning and stopping to circulate heat transfer fluid. During the starting phase, the goal is to power-up the Stirling engine in the shortest time possible; therefore, there is no output heat from the machine, in order to attain a 420 °C temperature in the hot source of the Stirling engine ( T hot   2 ST ). During the constant phase, the cold source of the machine ( T cold ST ) is cooled to a temperature of 36 °C, by the water present in the inner circuit of the machine ( T 2 unit ). The iCube laboratory where the tests were conducted had an average temperature of 23 °C; therefore, even with no thermal power output, the cooling of the Stirling engine was possible. No tests were conducted with a room temperature above 36 °C.
Using the INDEX and the LINEST functions in Microsoft Excel, the coefficients of the 3rd degree equation (start phase), 1st degree equation (constant phase), and 2nd degree equation (ending phase) were automatically calculated, for a more precise calculation of the functions. The equations describing the flows in the start, constant, and ending phases are shown in Equations (5)–(7). The functions are shown in Table 6, Table 7 and Table 8. It is important to note that every time a new phase started, the minute at which the flow varied was reset to 0.
F start ( x ) = x 3 c 0 + x 2 c 1 + x 1 c 2 + x 0 c 3
F constant ( x ) = x 1 c 0 + x 0 c 1
F end ( x ) = x 2 c 0 + x 1 c 1 + x 0 c 2
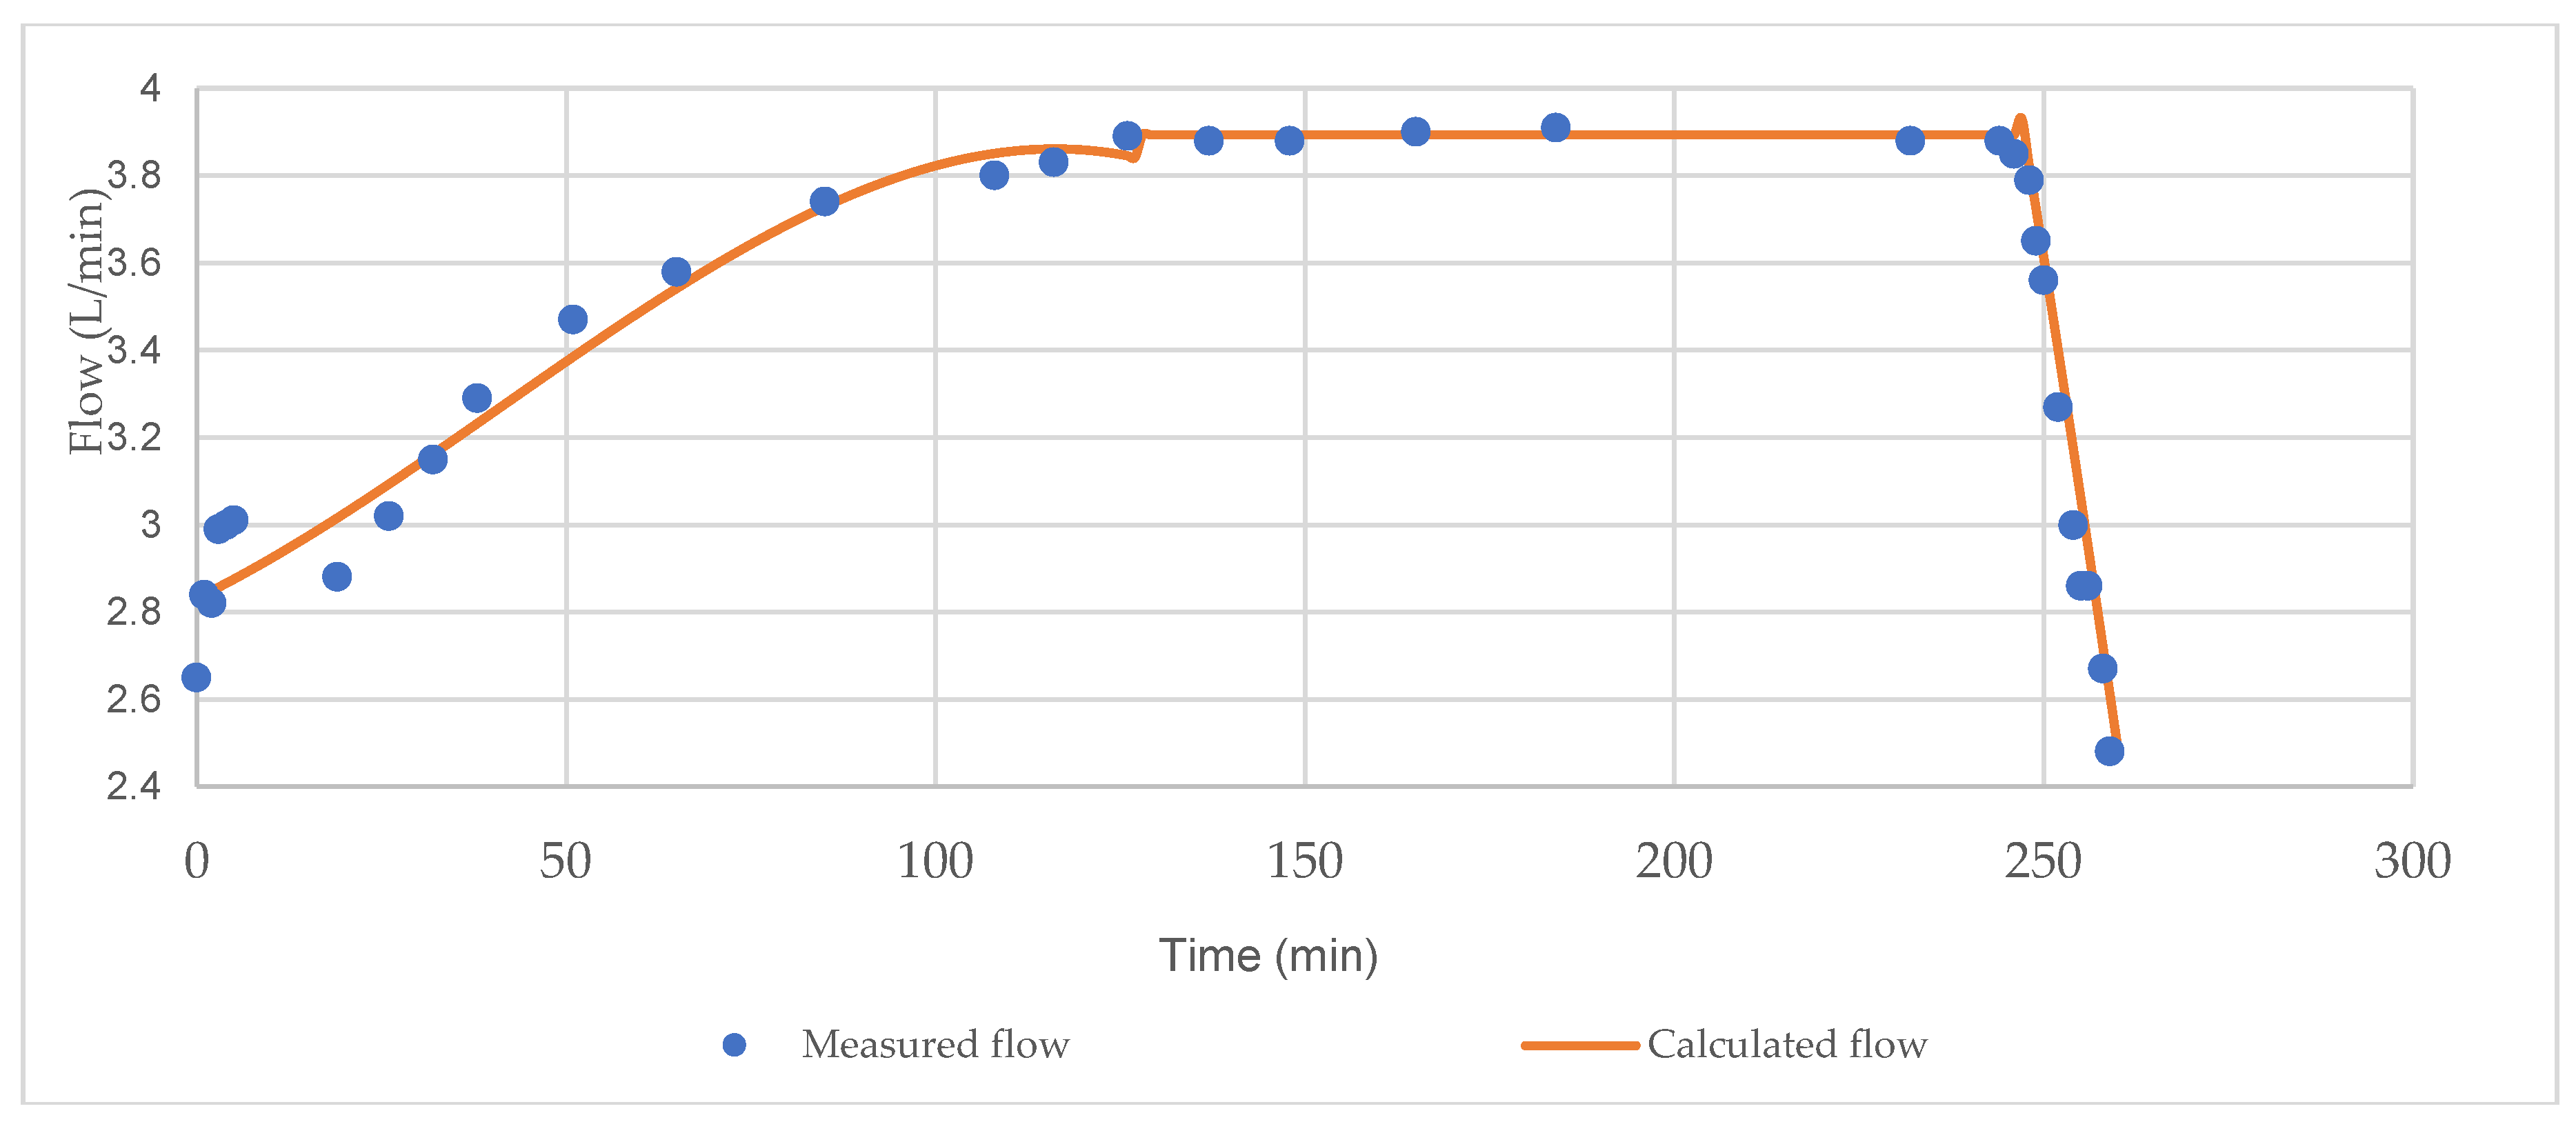
Figure 7 shows the calculated flow in comparison to the measured flow. The constant phase was considered equal to the coefficient of the 1st degree function. The starting phase and the ending phase were calculated using the obtained equations. By measuring the flow and through functions presented in Table 6, Table 7 and Table 8, values were obtained for each minute of functioning, enabling the correlation with the other data that was obtained in a 1 min interval.
In the STOP phase of the experiment, when the machine was no longer consuming pellets, its weight remained the same; the weight would then be recorded, and it would be subtracted from all the weights measured until that point. This showed the effective mass of biomass that was consumed in the experiment. As Figure 8 shows, these weights were recorded and the “SLOPE” function was used in Excel to determine the consumption of biomass during the experiment, in order to calculate the fuel power consumed. The Excel function is shown in Equation (8). The “ABS” function was used in the formula because the slope shows the decrease in fuel mass in the inner reservoir of the machine; therefore, its value is negative. The aim was to obtain the hourly mass consumption of the machine.
= ABS ( SLOPE ( k n o w n   Y s ,   k n o w n   X s ) · 60 )
To obtain the fuel power used by the machine, Equation (9) was used. The lower heating value of the fuel was taken from previous works [26], which included a lower heating value analysis of the fuel performed by a third-party laboratory. The previous study [26] studied a different µCHP, but used the same fuel from the same manufacturer; thus, the composition of the fuel remained the same.
P f u e l = L H V f u e l · f m f u e l
The thermal and power efficiencies were calculated by Equations (10) and (11).
η t h = P t h P c o m b = V water ˙ 60 · ρ water · c p water ( T 6 T 5 ) P c o m b
η e l = P e l P c o m b
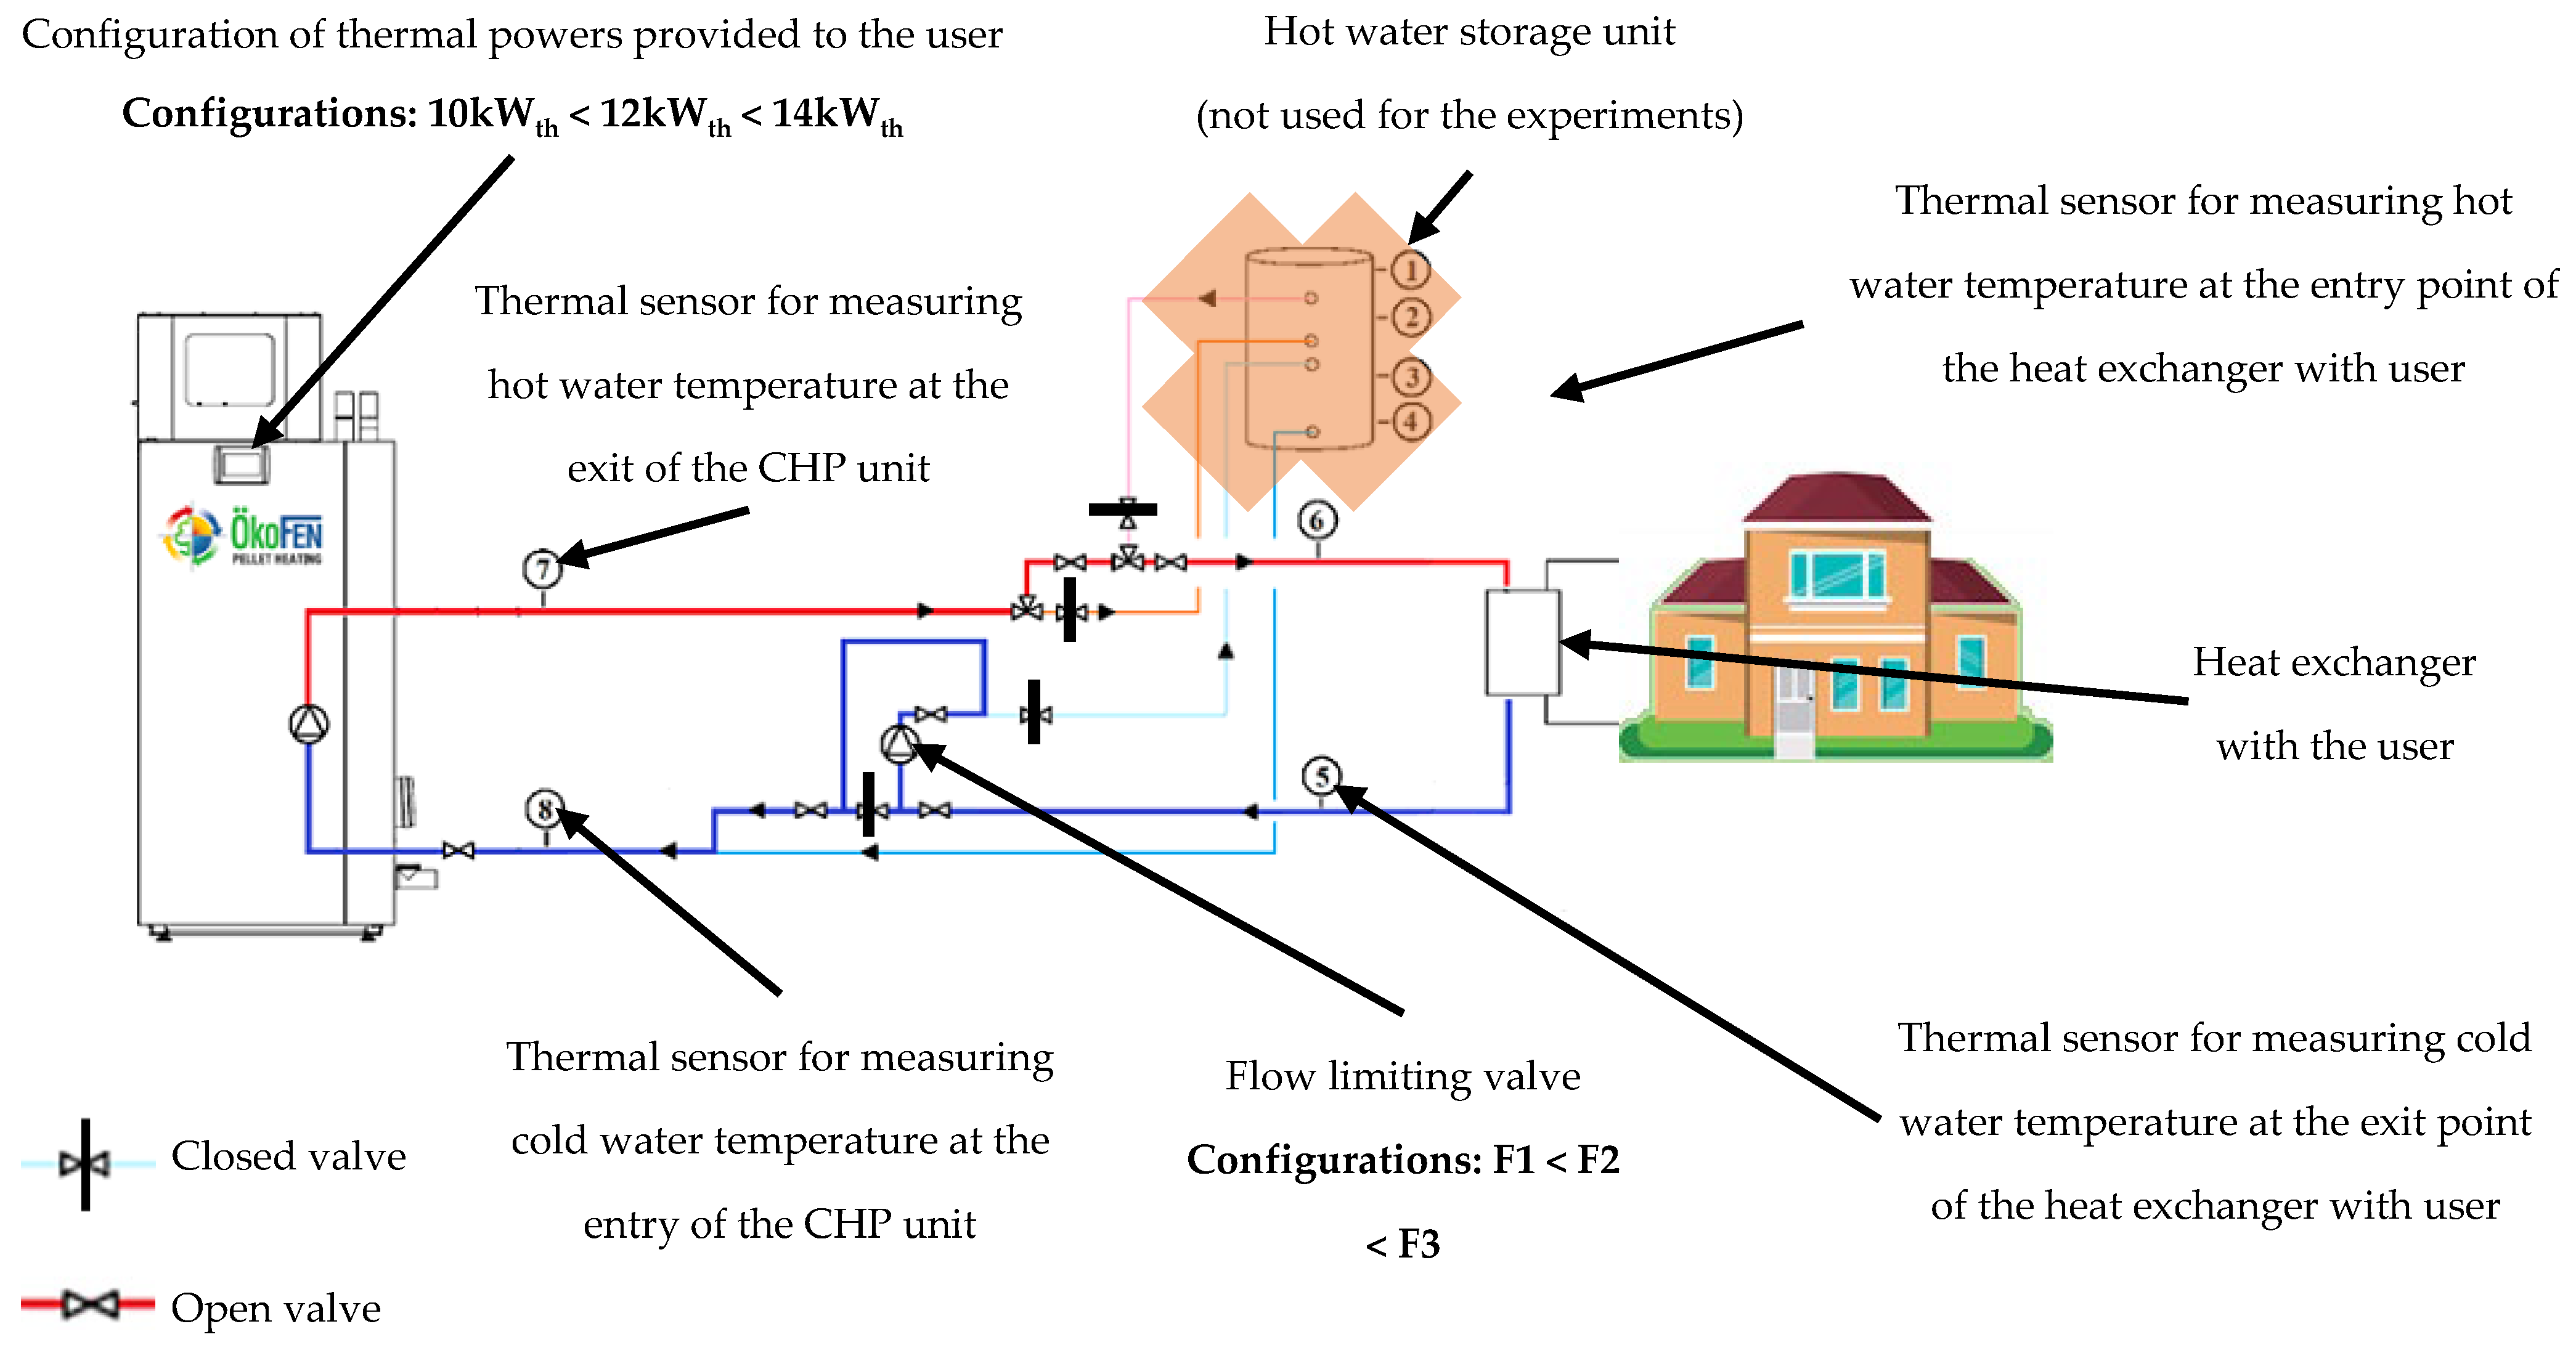
An overview of the CHP-to-user circuit is presented in Figure 9. The thermal power was calculated according to temperatures in points 6 and 5 of the diagram presented below, as also shown in Equation (10). In calculating the total efficiency of the system, the thermal losses occurring between points 6 and 7 were considered and included in the final efficiency of the CHP unit. The reason for this inclusion was that the machine itself is being described in this article and not the circuit connecting it to the user. The thermal losses occurring depend on the distance from the machine to the heat exchanger with the user, the isolation of the pipes, and other parameters that are variable from one case to the other. Therefore, the thermal losses were calculated with Equation (12) and the total efficiency was calculated with Equation (13).
η t h l o s s = V water ˙ 60 · ρ water · c p water ( T 7 T 6 ) P c o m b
η t o t a l = ( η t h + η t h l o s s ) + η e l

3. Results

3.1. Flow Results

As shown in Equation (1), the thermal power output of the cogeneration unit depends on the difference between the high temperature (Thot) and the low temperature (Tcold), in addition to the flow of the heat transfer fluid conducting heat. The nominal temperature for hot water is 60 °C and the machine has an inner safeguard, which lowers the thermal output power automatically once the temperature of 75 °C is reached.
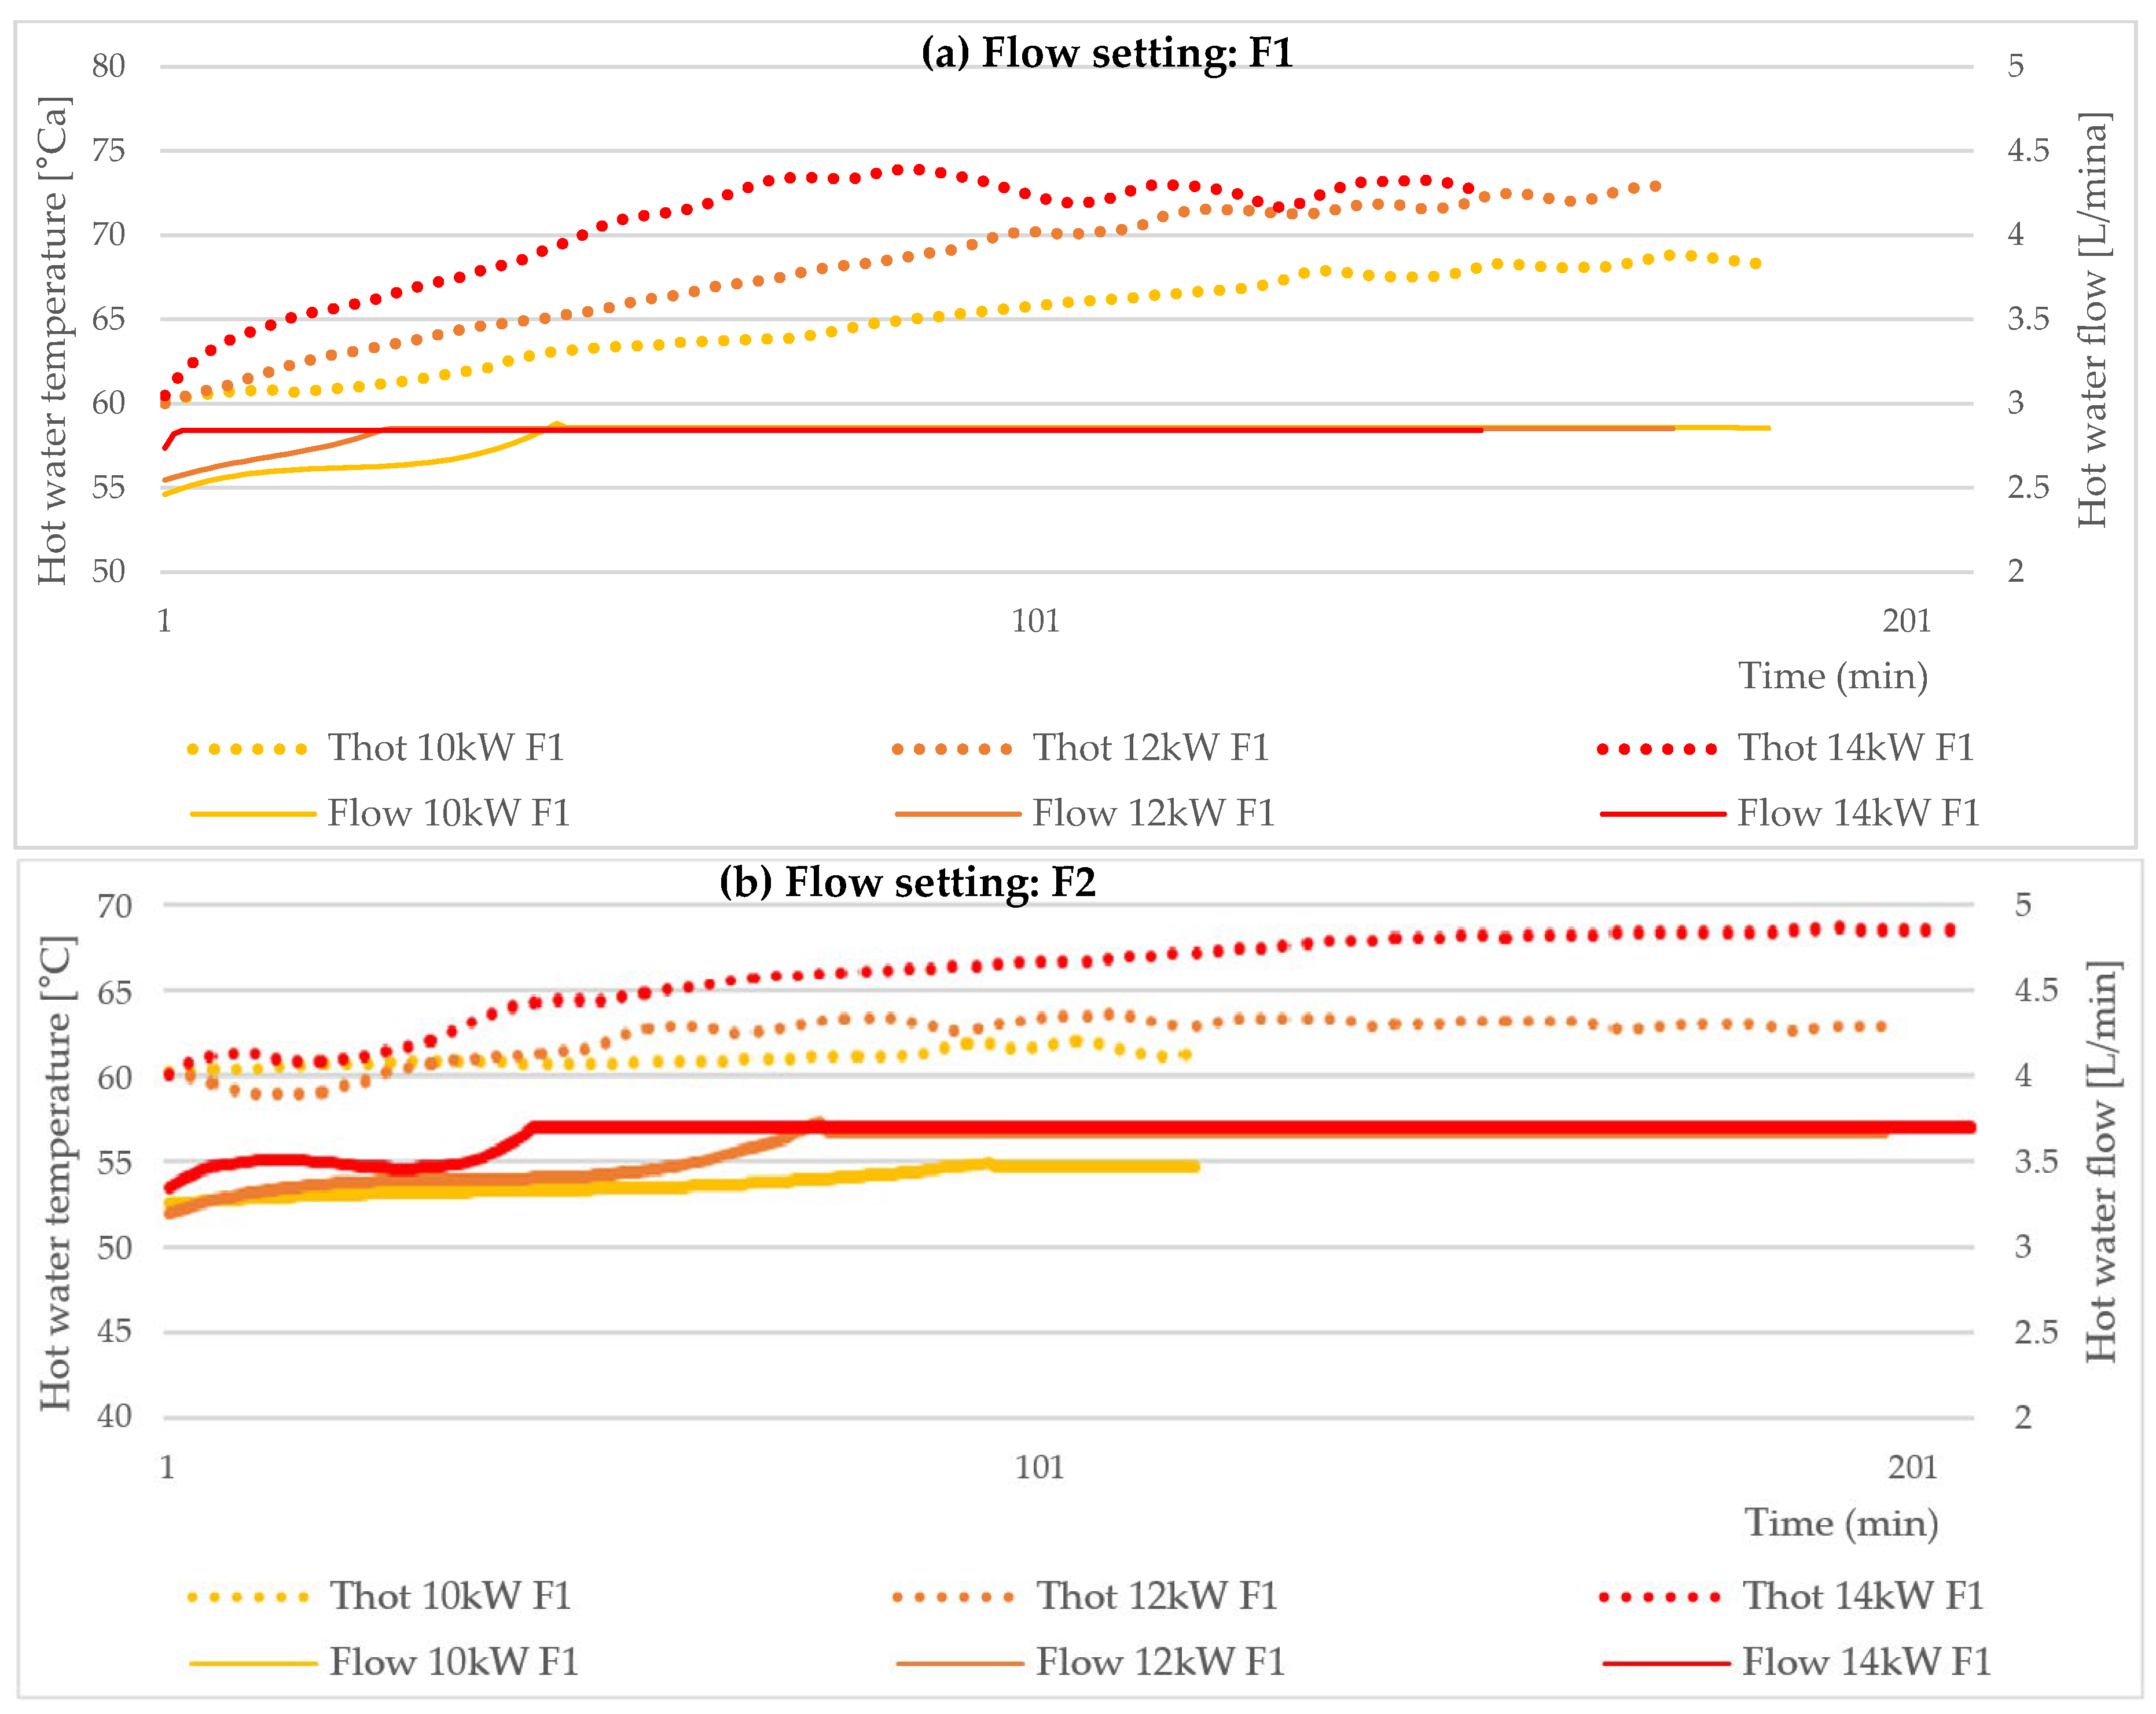
The flow of the heat transfer fluid conducting heat from the machine to the user cannot be precisely set. It depends on the quantity of heat available after powering the Stirling engine. The flow increases in correlation to the amount of heat to be rejected by the cogeneration unit and its setting influences the maximum flow value attainable. Figure 10a shows that, for all scenarios of functioning on the 1st pump setting, the flow reaches a constant value of 2.85 L/min, which is the upmost limit of the F1 setting.
As the amount of produced thermal power increases, so must the heat transfer fluid flow that evacuates heat from the Stirling engine and flue gasses. If this flow is sufficient to evacuate the available heat from the machine, the temperatures of the heat transfer fluid will remain around 60 °C. Figure 10b shows that the machine reaches a constant flow limit of 3.4 L/min after more than 160 min for the 10 kWth thermal power output. For the thermal output power of 12 and 14 kWth, the constant flow limit is superior to that of the 10 kWth configuration. The limit reached is superior, at 3.7 L/min, which is consistent with the superior amount of heat to be evacuated from the CHP unit. This limit is reached faster for the 14 kWth configuration than for the 12 kWth configuration, in under 50 min, in comparison to 90 min.
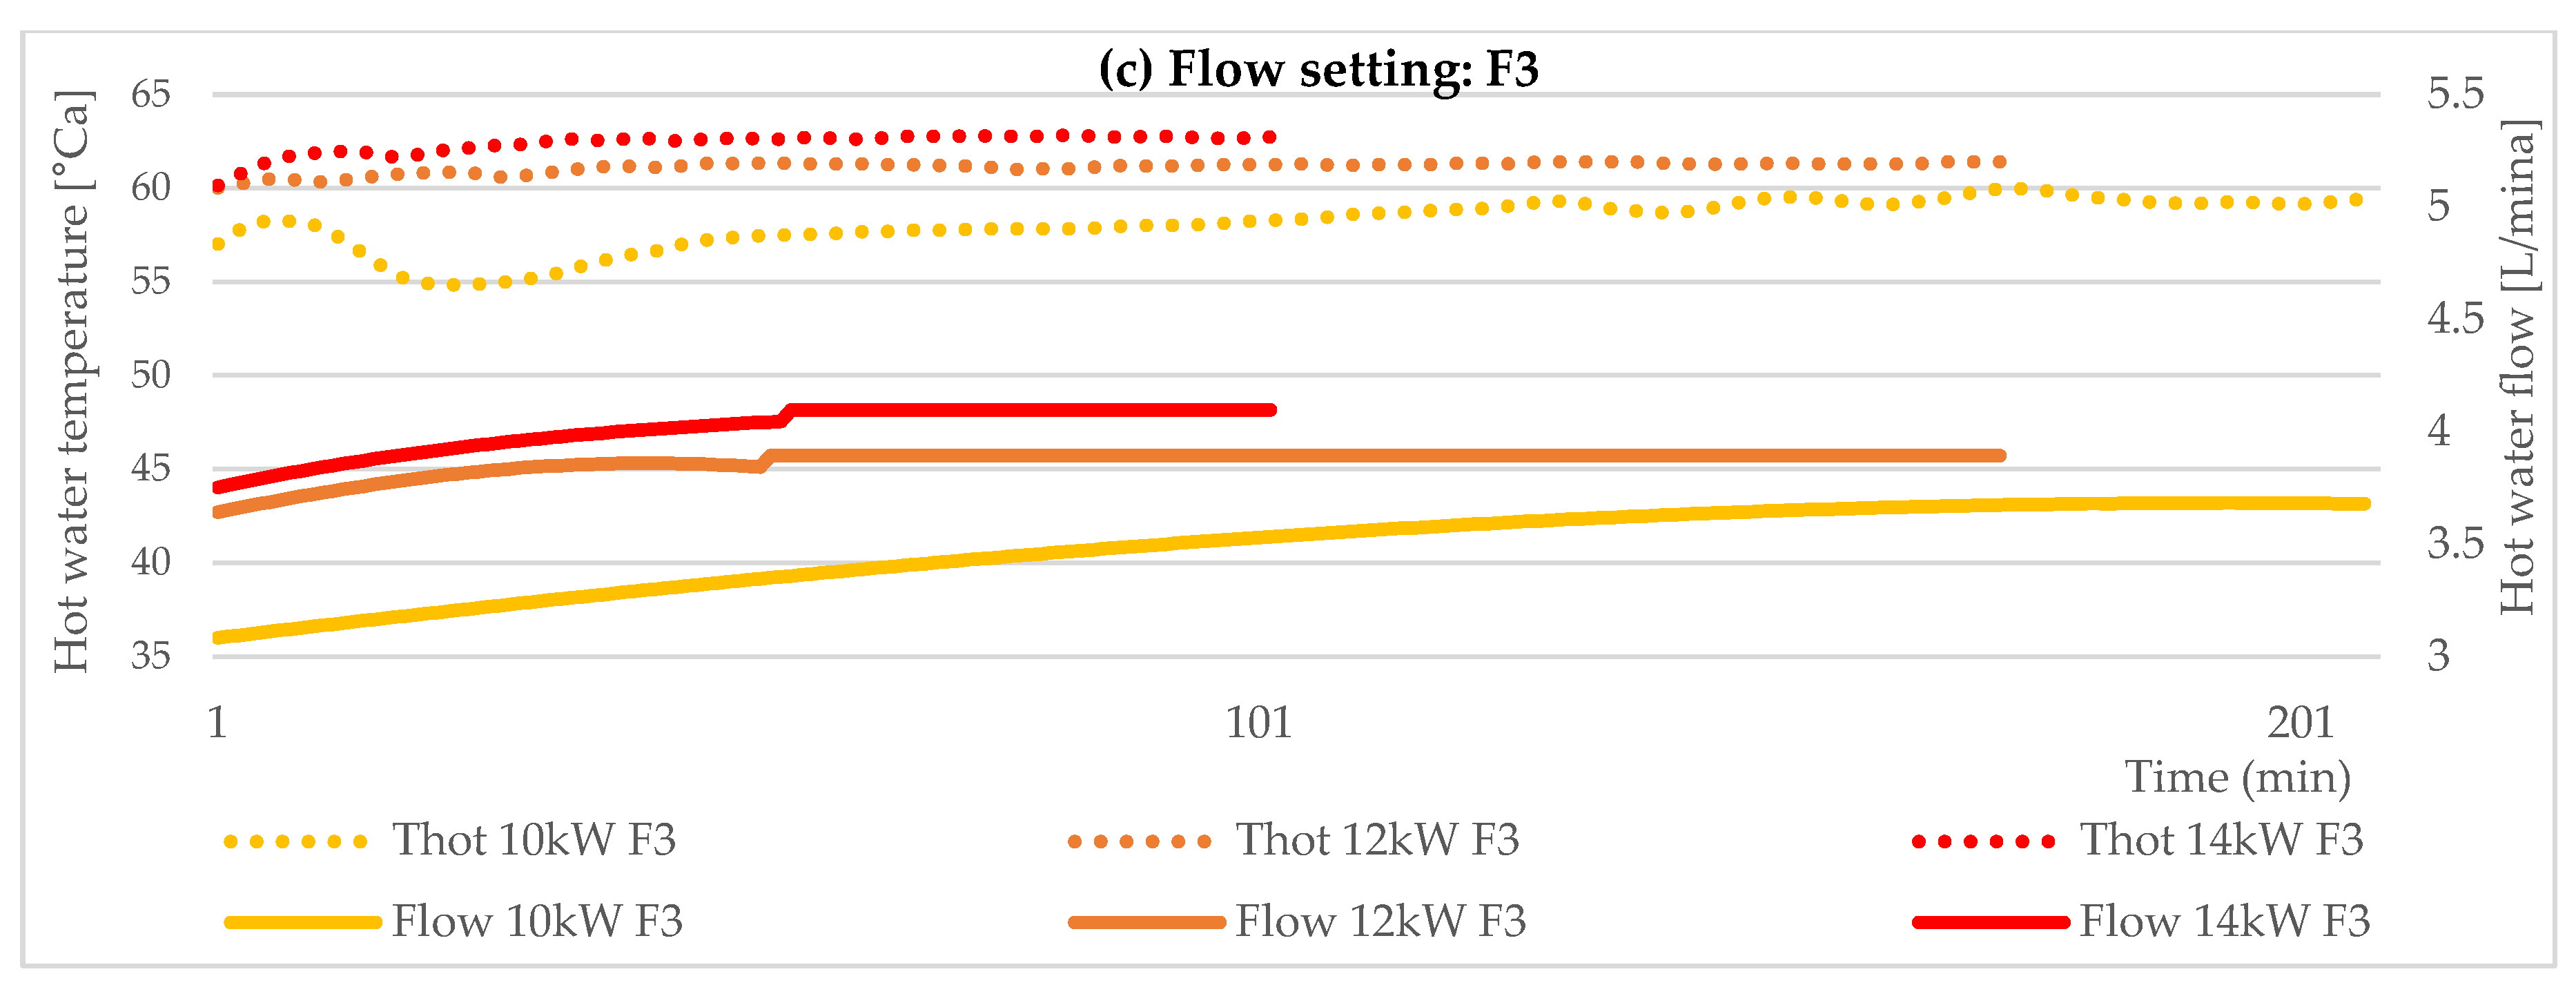
The 3rd configuration of the flow has the highest limit of flow. As shown in Figure 10c, it reaches 4.1 L/min in the case of a thermal power output of 14 kWth. The limitation of this pump can be observed since the flow remains approximately the same for the 10 kWth thermal power output, which is 3.5 L/min for F2 and 3.7 L/min for F3, whereas the same is available for the 12 kWth thermal power output, registering 3.7 L/min for F2 and 3.8 L/min for F3. The 14 kWth thermal power output necessitates the biggest flow of heat transfer fluid to evacuate heat from the CHP unit, reaching 4.1 L/min.

3.2. Heat Transfer Fluid Temperature in Corelation with the Heat Transfer Flow

As seen in the previous sub-section, the heat transfer flow conducting heat from the machine to the user cannot be precisely set, but only limited. Upon stabilizing, the value of the flow depends on the quantity of heat rejected by the Stirling engine. The flow rises in correlation to the amount of heat to be rejected by the cogeneration unit, and its setting influences the maximum flow value attainable.
Figure 11a shows that, for all thermal power outputs on the 1st pump setting F1, the flow reaches a constant value limited to 2.85 L/min, as previously also seen in Figure 8. By correlating the flow values with the temperatures of the heat transfer fluid evacuating heat from the machine, it can be observed that the temperature rises above 60 °C for all configurations. In the case of 14 kWth using Flow 1 (14 kWth F1), the temperature (Thot) raises to 74 °C. The machine enables its safeguard of keeping its temperature below 75 °C and switches to a partial-load ratio functioning of the Stirling engine, in order to lower the temperature of its inner water. The temperature of the 12 kWth configuration using Flow 1 (12 kWth F1) steadily rises to the same temperature of 74 °C as for the 14 kWth F1 configuration, and the safeguard system of the machine activates partial-load ratio mode.
The temperatures correlated to the functioning in Flow 2 in Figure 11b show that only the 10 kWth configuration temperature (Thot 10 kWth F2) stayed at a temperature of 61 °C, whereas the 12 kWth and 14 kWth configurations had temperatures of 64 and 69 °C. These results show that, even with a lower thermal power output of 10 kWth, the flow is insufficient to evacuate the heat produced by the machine for the heat transfer fluid to remain at 60 °C. The return water was kept at a constant temperature of 10 °C, due to the heat exchanger with the user, which had a temperature of 8 °C. On the consumer side, the water heated in this heat exchanger was not recirculated in the circuit; thus, the temperature of 8 °C was maintained.
In the flow configuration with the highest limit, F3, shown in Figure 11c, it can be observed that the temperatures still reach values greater than 60 °C, which is the desirable temperature for the domestic hot water arriving at the consumer. The highest temperature attained is for the 14 kWth thermal power output, of 63 °C, whereas the second-highest temperature is for the 12 kWth thermal power output, of 61 °C, and the third-highest is that of the 10 kWth thermal output, of 60 °C.
Since the flow of the heat transfer fluid influences its temperature, the same thermal power output of 10 kWth is compared to flows in settings F1, F2, and F3 in Figure 12a. For the thermal power output of 10 kWth, the F2 and F3 flow configurations ensured a temperature of the heat transfer fluid between 59 °C and 61 °C. However, for the F1 flow, the temperature rose to nearly 69 °C, which shows that the F1 setting of the flow was insufficient for evacuating heat from the machine.
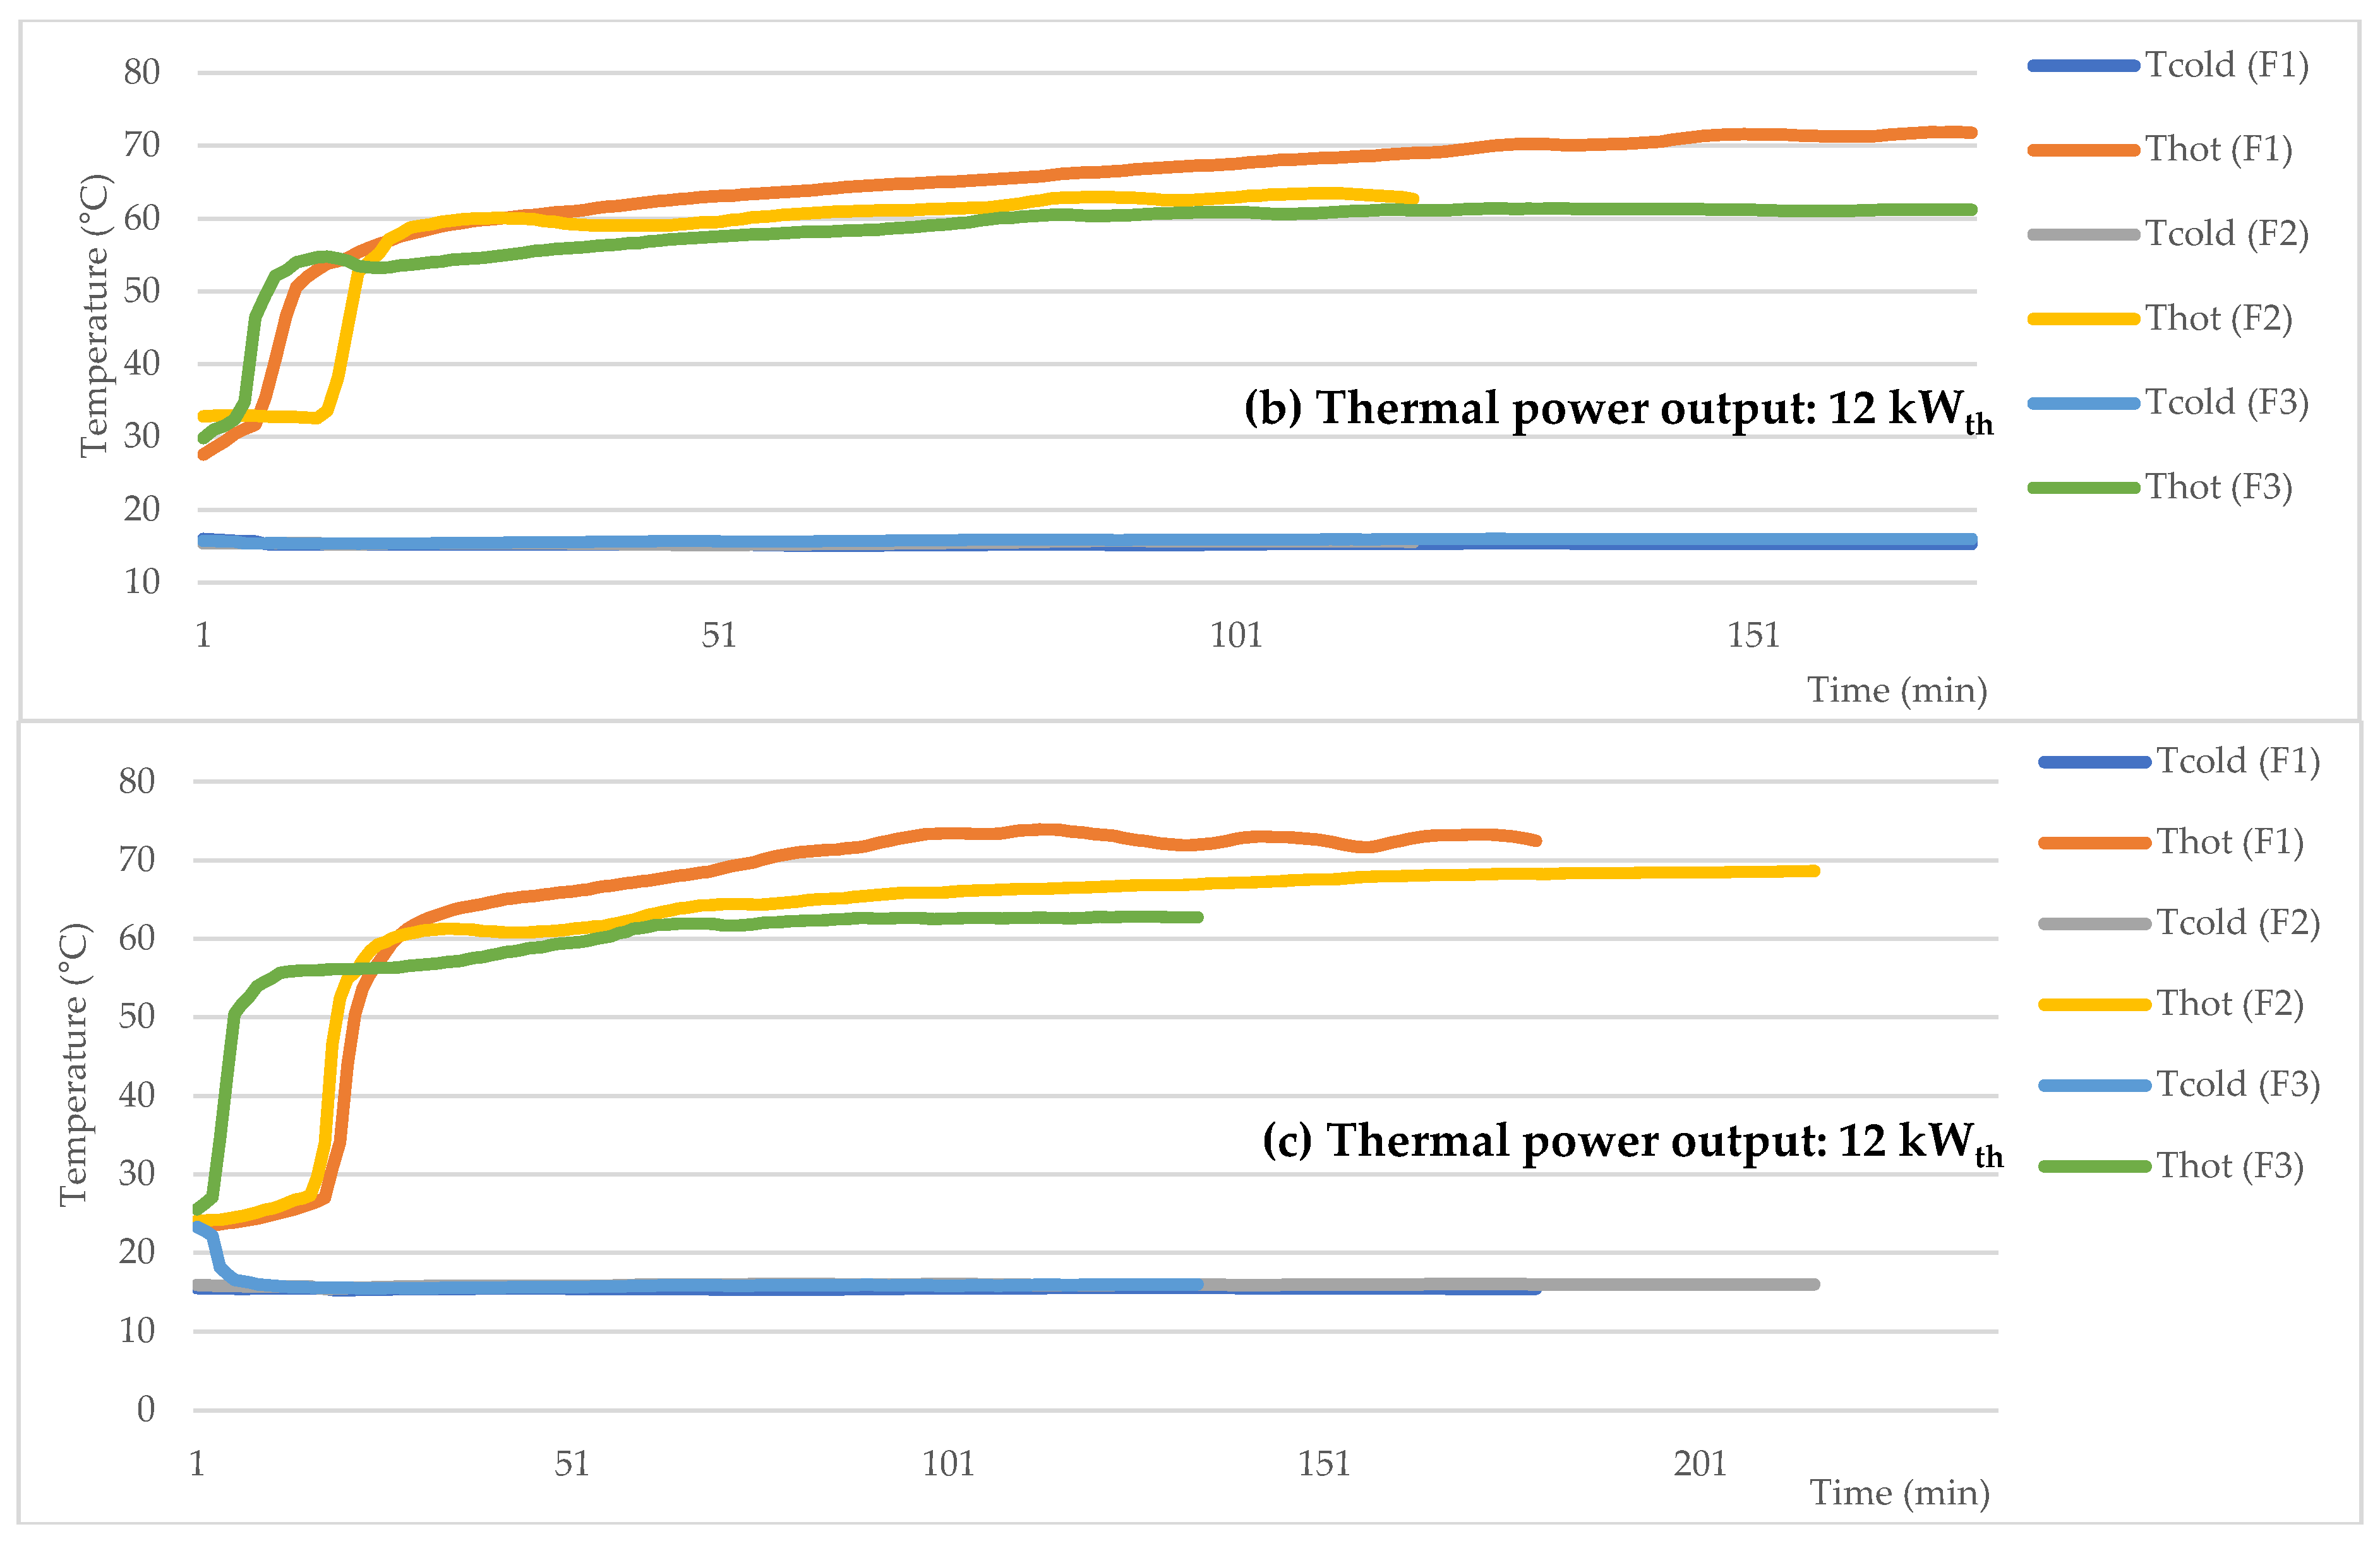
As shown in Figure 12b, in the 12 kWth thermal power output configuration, the temperature of the F2 and F3 configurations rose to the interval of 60 to 62 °C, i.e., 2 °C more than in the 10 kWth thermal output configurations, while still remaining at an acceptable level of near 60 °C. The F1 configuration also registered a rise in the temperature of the heat transfer fluid of 2 °C, reaching 71 °C. This temperature is above the 60 °C threshold that the domestic hot water should have when arriving to the consumer.
For the 14 kWth thermal power output configuration shown in Figure 12c, the temperatures of the heat transfer fluid rise by 2 °C for the F3 flow setting, by 7 °C for the F2 flow setting, and by 2 °C for the F1 flow setting. The inconsistency of these raises is due to the safeguarding mechanism of the machine because, intuitively, there should have been a proportionate increase in temperature for the F1 flow setting, in comparison to the F2 and F3 settings. However, the CHP unit starts to automatically run in the partial-load ratio mode, to decrease its temperature and prevent reaching the set limit of 75 °C, which may damage its components.

3.3. Generated Power and Stirling Engine Work Fluid Temperature

Because the CHP unit entered the partial-load ratio mode in many cases, it is interesting to observe the power output that was generated as a function of different flow rate settings. The same thermal power output was grouped with the three flow rates to observe the variation in the power produced due to the machine’s safeguarding mechanism.
As seen in Figure 13a, the temperatures of the working fluid of the CHP unit reached similar values, of 420 to 440 °C. It can be observed that the 14 kWth thermal output configuration generates the most power, reaching values of 950 to 1000 W. This configuration was also the fastest to reach a stable value of 700 W. The configurations 10 and 12 kWth reached lower values in comparison to that of 14 kWth, halting at 900 W. The difference between the 10 and 12 kWth configurations is that, in the case of 12 kWth, the generated power of 900 W stabilized faster than that of the 10 kWth configuration. However, the F3 configuration has a more constant power generation with less noise.
For the flow setting F2, it can be observed in Figure 13b that the temperatures of the working fluid of the Stirling engine are similar to those for the flow setting F1. Moreover, similar to the case of the F1 configuration, the 14 kWth configuration with F2 achieves the nominal generated power faster than the 10 and 12 kWth configurations. The generated power for the 14 kWth case passes the 1000 Wel threshold after 220 min of functioning, whereas it reaches 950 Wel for the 12 kWth configuration after 140 min; this value is comparable to the 14 kWth configuration at that point in time. The 10 kWth configuration reaches only 900 Wel after 200 min of functioning.
For the F3 flow setting, shown in Figure 13c, the 14 kWth thermal power output configuration passes the 1000 Wel threshold much faster than in the F2 flow setting, after 145 min, in comparison to 220 min for F2. The temperatures of the working fluid remain similar, in the interval of 420 to 440 °C. The power generated by the 12 kWth thermal power output is relatively stable at 900 to 950 Wel, reaching this point after 65 min of functioning, whereas for the 14 kWth configuration, this power is reached after 55 min of functioning. In the case of 10 kWth, the generated power reaches the 900 Wel value after 150 min, and the values remain under 950 Wel.

3.4. Fuel Mass Flow Consumption and Efficiencies

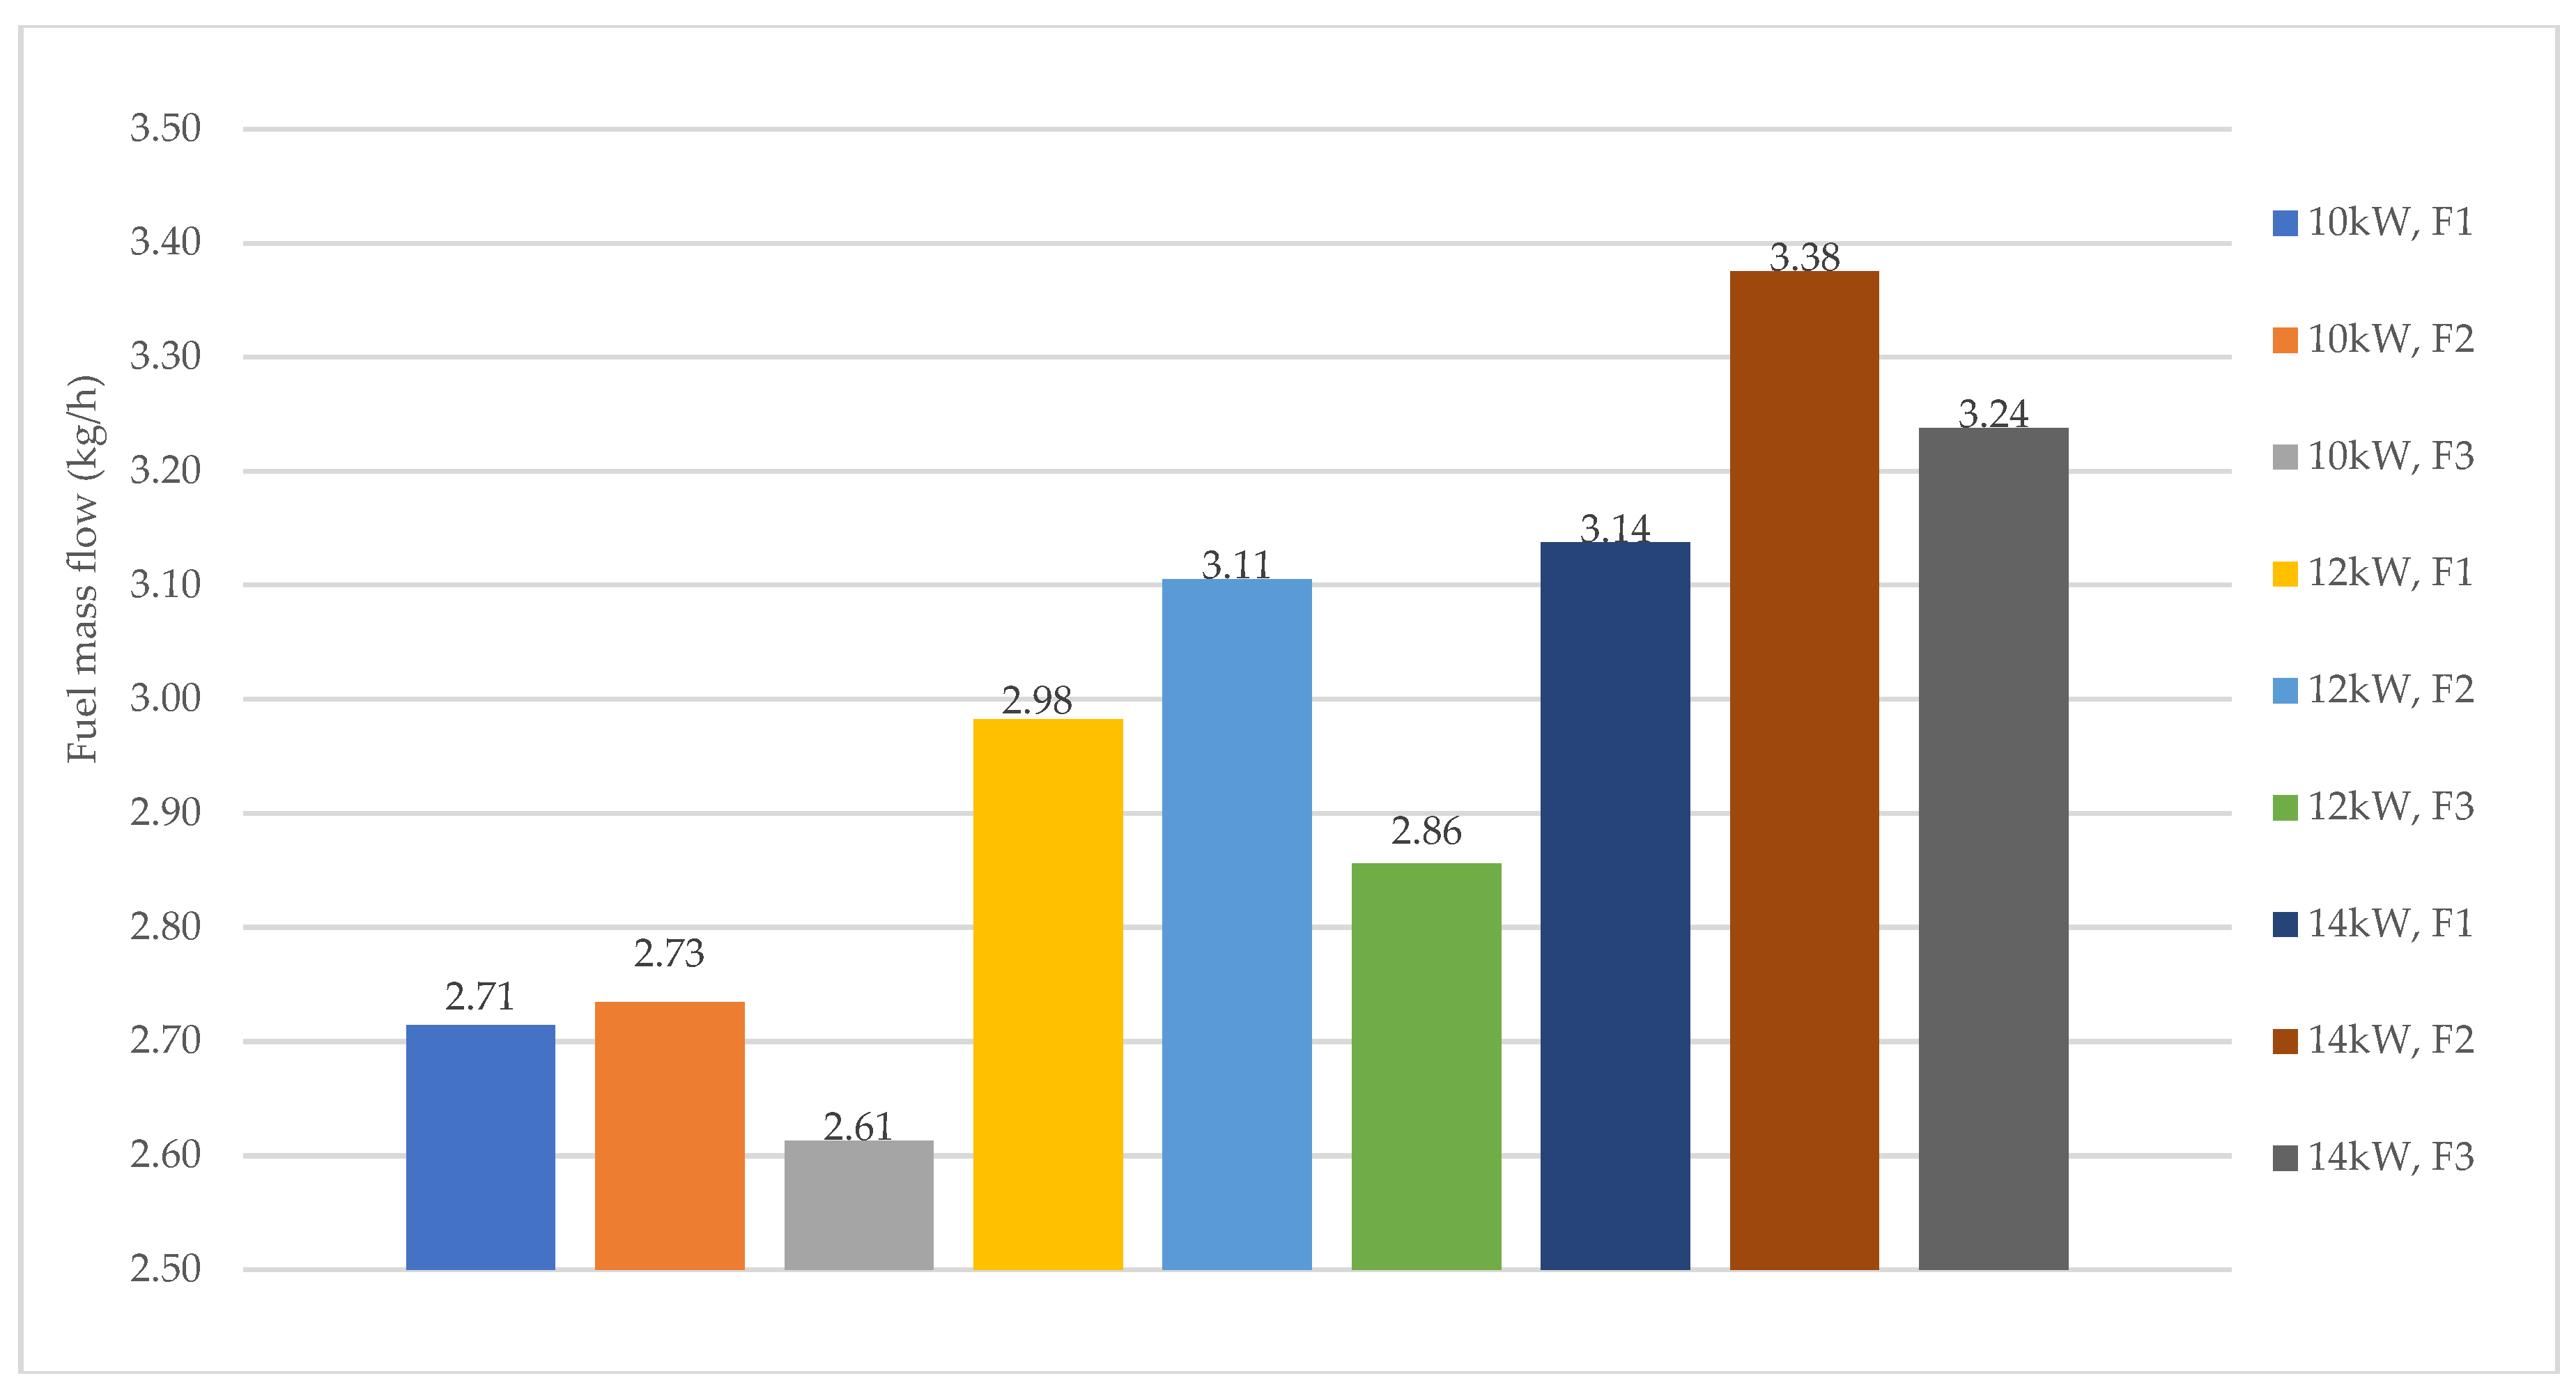
The fuel mass flow was calculated with Equation (3) for all configurations. The results are shown in Figure 14. The highest consumption of fuel per hour was for the F2 flows for the three thermal power outputs (10, 12, and 14 kWth). For the 10 and 12 kWth configurations, the F1 flow had a higher rate of consumption than that of the F3 flow, whereas, in the case of 14 kWth, it was the opposite.
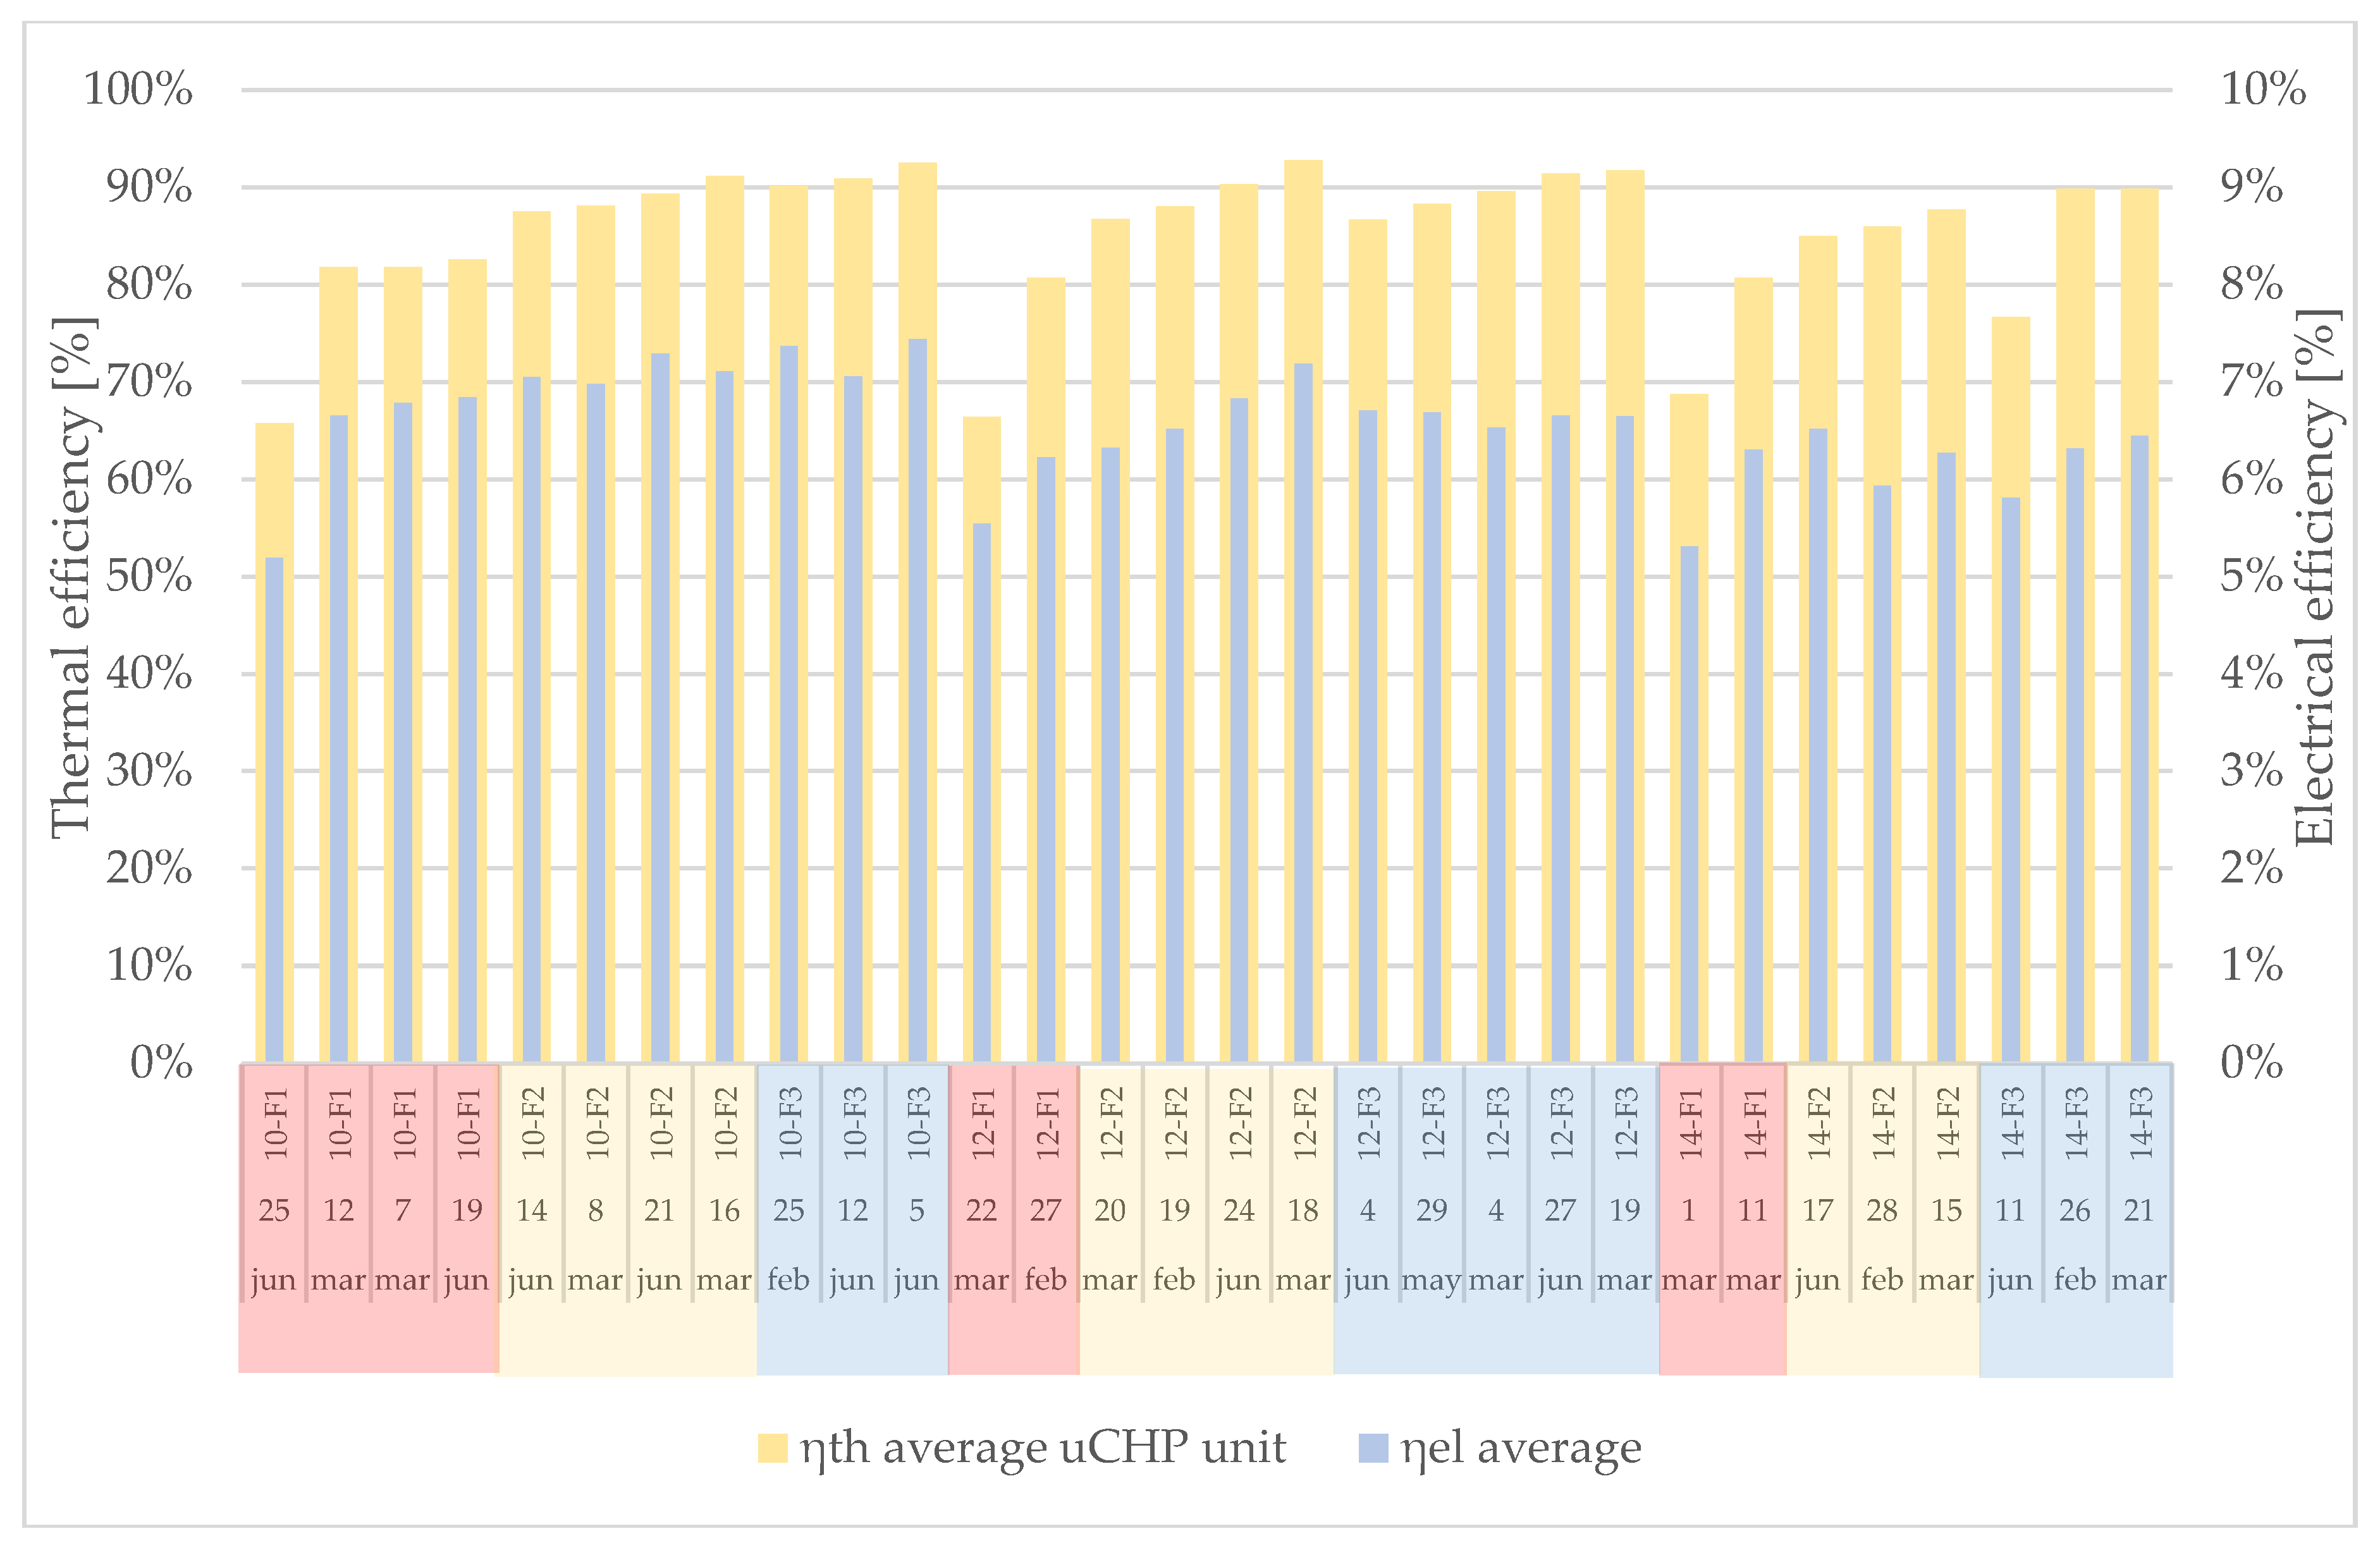
The thermal and power efficiencies were calculated using Equations (10)–(12). The results are shown in Figure 15. The highest overall efficiency calculated with Equation (8) was that of the 12 kWth thermal power output with the flow F3 configuration. The ranking of the nine total efficiencies is shown in Table 6. It can be observed that the flow of heat transfer fluid evacuating heat from the machine was the defining factor in the total efficiency of the configurations. As a general pattern, the greater the flow, the better the total efficiency.
Table 9 shows the values of the stable temperatures reached by the heat transfer fluid and the time to reach said values, and also indicates whether the configuration yielded in an automatic enabling of partial load functioning due to an insufficient heat evacuation. Generally, for all configurations, the greater the flow (F1 < F2 < F3), the better the heat evacuation from the µCHP unit and, therefore, the lower the stable temperature. With good heat evacuation, the temperature will ideally stay around 60 °C; with medium-quality heat evacuation, the temperature will stay below 75 °C; and, with poor-quality heat evacuation, the temperature will exceed 75 °C, resulting in a partial load functioning.
One of the premises of the current study was that only one configuration would be manually applied at a time, per each test. However, if this premise were to be modified and the machine was able to switch from one configuration to another, a higher thermal power output could be configured with a lower heat transfer fluid flow in order to reach the desired temperature as fast as possible, and then to switch to a more stable configuration. In this case, the 14 kWth, F1 configuration would be best suited to power-up the system as fast as possible, although it has the lowest efficiency. After reaching the 60 °C value, the configuration could be switched to 12 kWth, F3, for functioning while having the best total efficiency. In the summer season, the end-user requirement for heat would diminish; therefore, a lower thermal power configuration would be better suited. In this case, a configuration of 10 kWth, F1, would be recommended to obtain to the nominal temperature of 60 °C, after which the flow rate would be changed to F3.
Table 10 shows the time necessary for all configurations to reach 60 °C and 0.8 kWel. The value of 60 °C was chosen because it is the configured end-user domestic hot water temperature. The value of 0.8 kWel was chosen as 80% of the nominal power generation capacity of the Condens_e µCHP unit produced by ÖkoFEN, because not all configurations reach 1 kWel in power generation, whereas all configurations produce more than 0.8 kWel.

4. Conclusions and Perspectives

Hybrid Renewable Energy Systems (HRESs) that use micro-cogeneration devices are a key solution to increase the decarbonization of the building sector [27]. From this perspective, a biomass Stirling micro-cogeneration device was tested in order to determine its performance, and for consideration in analyses of such HRESs. In particular, a dynamic model based on physics and experimental investigations was developed to evaluate its output thermal power and power efficiencies.
In the tests conducted at Institut National des Sciences Appliquées de Strasbourg, the cogeneration unit worked in nine configurations: three heat transfer fluid flow rates and three thermal power outputs. The temperature of the heat transfer fluid fueling the household end-user with domestic hot water was configured in the studied µCHP unit to be 60 °C. In contrast to the study where the thermal efficiency increased with the temperature of the domestic hot water [13], in this case, an increase in the temperature of the domestic hot water correlates with an inability of the flow rate of the thermal medium to reject the amount of thermal power produced by the machine. This results in an accumulation of heat inside the µCHP unit, leading to a rise in temperature, which triggers the self-protection mechanism of the machine when it reaches 75 °C. This self-protection mechanism activates the part-load operation, which has a negative impact on electric energy production, since a reduction in thermal power also has an impact on Stirling hot-source temperature.
For further studies, it would be interesting to couple the µCHP unit with a thermal storage unit, in order to determine the optimal functioning regime for heating a large tank of water, and then maintaining its temperature. Since the studied µCHP unit is supposed to meet the baseload demand of household electricity consumption, a photovoltaic-thermal system (PVT) and battery system would be a relevant addition to the goal of energetic self-sufficiency in terms of electricity production and consumption. A dynamic simulation of a photovoltaic-thermal (PVT) system was previously conducted [28], evaluating the PVT output power coverage of household power demands in two different European climates and an a HRES based on a biomass Stirling micro-cogeneration system. A PVT was also thermo-economically assessed under three different European climates and sets of economic conditions [27].

Author Contributions

Conceptualization, Ș.-D.V., M.S. and G.D.; methodology, Ș.-D.V., M.S. and G.D.; software, Ș.-D.V.; validation, Ș.-D.V., M.S. and G.D.; formal analysis, Ș.-D.V.; investigation, Ș.-D.V.; resources, Ș.-D.V.; data curation, Ș.D.V.; writing—original draft preparation, Ș.-D.V., M.S. and G.D.; writing—review and editing, Ș.-D.V., M.S. and G.D.; visualization, Ș.D.V.; supervision, M.S. and G.D.; project administration, M.S. and G.D.; funding acquisition, M.S. All authors have read and agreed to the published version of the manuscript.

Funding

This research received no external funding.

Institutional Review Board Statement

Not applicable.

Informed Consent Statement

Not applicable.

Data Availability Statement

Not applicable.

Conflicts of Interest

The authors declare no conflict of interest.

Appendix A

Table A1. Measured parameters and equipment used in measurement.
Measured ParameterEquipment UsedEquipment ModelSymbolUnit
Cold water flowFlow sensorSE35 F CW l min
μCHP unit inner water temperature 1Condens_e
temperature sensor
N/A T 1 unit ° C
μCHP unit inner water temperature 2Condens_e
temperature sensor
N/A T 2 unit ° C
μCHP unit inner water temperature 3Condens_e temperature sensorN/A T 3 unit ° C
μCHP unit inner water temperature 4Condens_e temperature sensorN/A T 4 unit ° C
Cold water exiting the DHW HE temperature 5 Temperature sensorJUMO PT100 T 5 pipe ° C
Hot water entering the DHW HE temperature 6Temperature sensorJUMO PT100 T 6 pipe ° C
Hot water exiting the μCHP unit temperature 7Temperature sensorJUMO PT100 T 7 pipe ° C
Cold water exiting the μCHP unit temperature 8Temperature sensorJUMO PT100 T 8 pipe ° C
Flue gas final temperatureCombustion analyzerECOM EN2 T 4 FG ° C
Stirling hot head outer temperature 1Condens_e
temperature sensor
N/A T hot   1 ST ° C
Stirling hot head inner temperature 2Condens_e
temperature sensor
N/A T hot   2 ST ° C
Stirling cold head temperatureCondens_e
temperature sensor
N/A T cold ST ° C
Power outputCondens_e
power sensor
N/A P kW el
Fuel massWeight scaleWALL-E Floor Scale m fuel kg
Room air temperatureCombustion analyzerECOM EN2 T air   room ° C
Exiting flue gas O2 contentCombustion analyzerECOM EN2 % O 2 FG %
Exiting flue gas CO contentCombustion analyzerECOM EN2 % CO FG ppm
Exiting flue gas NO contentCombustion analyzerECOM EN2 % NO FG ppm
Exiting flue gas NOx contentCombustion analyzerECOM EN2 % NO x FG ppm
Exiting flue gas SO2 contentCombustion analyzerECOM EN2 % SO 2 FG ppm
Exiting flue gas CO2 contentCombustion analyzerECOM EN2 % CO 2 FG %
Exiting flue gas air excessCombustion analyzerECOM EN2 λ
Table A2. Constants used in calculus.
ConstantValueSymbolUnit
Water density997 ρ water kg/m3
Water specific heat at constant pressure4.18 c p water kJ kg · K
Flue gas—water heat exchanger efficiency0.98 η HE FG W -
Table A3. Calculated parameters shown in results.
Calculated ParameterSymbolUnit
Thermal power output of the μCHP unit P th unit kW th
Thermal   power   of   water   passing   through   HE cold FG P th unit 1 kW th
Thermal   power   of   water   passing   through   HE cold ST P th unit 2 kW th
Thermal   power   of   water   passing   through   HE med FG P th unit 3 kW th
Thermal   power   of   water   passing   through   HE DHW P th pipe kW th
Flue gas temperature exiting the combustion chamber CC T 1 FG ° C
Flue   gas   temperature   exiting   HE hot ST T 2 FG ° C
Flue   gas   temperature   exiting   HE med FG T 3 FG ° C
Carnot efficiency η c -

References

  1. Bouvenot, J.-B.; Andlauer, B.; Stabat, P.; Marchio, D.; Flament, B.; Latour, B.; Siroux, M. Gas Stirling engine μCHP boiler experimental data driven model for building energy simulation. Energy Build. 2014, 84, 113–117. [Google Scholar] [CrossRef]
  2. Bianchi, M.; De Pascale, A.; Melino, F. Performance analysis of an integrated CHP system with thermal and Electric Energy Storage for residential application. Appl. Energy 2013, 112, 928–938. [Google Scholar] [CrossRef]
  3. Mameri, F. Caractérisation Multi-Physique et Multi-Échelle d’une Installation de Conversion d’Énergie: Application À une Unité de Cogénération Biomasse. Ph.D. Thesis, Université Polytehnique Hauts de France, Valenciennes, France, 2018. [Google Scholar]
  4. Martinez, S. Etudes Expérimentales et Numériques d’un Micro-Cogénérateur Solaire—Intégration à un BÂtiment Résidentiel. Ph.D. Thesis, Université de la Rochelle, La Rochelle, France, 2018. [Google Scholar]
  5. ÖkoFEN Pellematic Condens_e Technical Data. 2017. Available online: http://www.ÖkoFEN-e.com/en/pellematic_smart_e/ (accessed on 20 August 2021).
  6. Gliński, M.; Bojesen, C.; Rybiński, W.; Bykuć, S. Modelling of the biomass µCHP unit for power peak shaving in the local electrical grid. Energies 2019, 12, 458. [Google Scholar] [CrossRef] [Green Version]
  7. Jones, S.R.; Beardmore, J.; Gillott, M.; Boukhanouf, R.; Walker, G. A control methodology for building energy management systems (BEMS) in heat networks with distributed generation. Energy Procedia 2018, 153, 295–302. [Google Scholar] [CrossRef]
  8. Cardozo, E.; Malmquist, A. Performance comparison between the use of wood and sugarcane bagasse pellets in a Stirling engine micro-CHP system. Appl. Therm. Eng. 2019, 159, 113945. [Google Scholar] [CrossRef]
  9. Schneider, T.; Müller, D.; Karl, J. A review of thermochemical biomass conversion combined with Stirling engines for the small-scale cogeneration of heat and power. Renew. Sustain. Energy Rev. 2020, 134, 110288. [Google Scholar] [CrossRef]
  10. Żołądek, M.; Figaj, R.; Sornek, K. Energy analysis of a micro-scale biomass cogeneration system. Energy Convers. Manag. 2021, 236, 114079. [Google Scholar] [CrossRef]
  11. Rosato, A.; Sibilio, S.; Ciampi, G. Energy, environmental and economic dynamic performance assessment of different micro-cogeneration systems in a residential application. Appl. Therm. Eng. 2013, 59, 599–617. [Google Scholar] [CrossRef]
  12. Ferreira, A.C.; Nunes, M.L.; Teixeira, J.C.; Martins, L.A.; Teixeira, S.F. Thermodynamic and economic optimization of a solar-powered Stirling engine for micro-cogeneration purposes. Energy 2016, 111, 1–17. [Google Scholar] [CrossRef]
  13. Bartela, Ł.; Kotowicz, J.; Dubiel-Jurgaś, K. Investment risk for biomass integrated gasification combined heat and power unit with an internal combustion engine and a Stirling engine. Energy 2018, 150, 601–616. [Google Scholar] [CrossRef]
  14. Valenti, G.; Silva, P.; Fergnani, N.; Di Marcoberardino, G.; Campanari, S.; Macchi, E. Experimental and numerical study of a micro-cogeneration Stirling engine for residential applications. Energy Procedia 2014, 45, 1235–1244. [Google Scholar] [CrossRef] [Green Version]
  15. Bartela, Ł.; Kotowicz, J.; Remiorz, L.; Skorek-Osikowska, A.; Dubiel, K. Assessment of the economic appropriateness of the use of Stirling engine as additional part of a cogeneration system based on biomass gasification. Renew. Energy 2017, 112, 425–443. [Google Scholar] [CrossRef]
  16. Cardozo, E.; Erlich, C.; Malmquist, A.; Alejo, L. Integration of a wood pellet burner and a Stirling engine to produce residential heat and power. Appl. Therm. Eng. 2014, 73, 671–680. [Google Scholar] [CrossRef]
  17. Damirchi, H.; Najafi, G.; Alizadehnia, S.; Mamat, R.; Nor Azwadi, C.S.; Azmi, W.H.; Noor, M.M. Micro combined heat and power to provide heat and electrical power using biomass and gamma-type Stirling engine. Appl. Therm. Eng. 2016, 103, 1460–1469. [Google Scholar] [CrossRef] [Green Version]
  18. Qiu, S.; Gao, Y.; Rinker, G.; Yanaga, K. Development of an advanced free-piston Stirling engine for micro combined heating and power application. Appl. Energy 2019, 235, 987–1000. [Google Scholar] [CrossRef]
  19. Park, B.-S.; Usman, M.; Imran, M.; Pesyridis, A. review of organic Rankine cycle experimental data trends. Energy Convers. Manag. 2018, 173, 679–691. [Google Scholar] [CrossRef]
  20. Urciuolo, M.; Chirone, R.; Saverio Marra, F.; Solimene, R. Power generation by Stirling engine during fluidized bed combustion of wood pellets. Combust. Sci. Technol. 2018, 191, 263–274. [Google Scholar] [CrossRef]
  21. Katona, B.; Laza, T. The technical applicability of Stirling engines in a Hungarian village. Chem. Pap. 2018, 72, 3093–3103. [Google Scholar] [CrossRef]
  22. Biedermann, F.; Carlsen, H.; Obernberger, I.; Schöch, M. Small-scale CHP Plant based on a 75 kWel hermetic eight cylinder Stirling engine for biomass fuels—Development, technology and operating experiences. In Proceedings of the 2nd World Conference and Exhibition on Biomass for Energy, Industry and Climate Protection, Rome, Italy, 10–14 May 2004. [Google Scholar]
  23. Ulloa, C.; Míguez, J.L.; Porteiro, J.; Eguía, P.; Cacabelos, A. Development of a transient model of a Stirling-based CHP system. Energies 2013, 6, 3115–3133. [Google Scholar] [CrossRef] [Green Version]
  24. van Loo, S.; Koppejean, J. The Handbook of Biomass Combustion and Co-Firing; Earthscan: London, UK, 2008; p. 195. Available online: https://boilersinfo.com/ (accessed on 5 September 2019).
  25. Engineering Toolbox Website. Available online: https://www.engineeringtoolbox.com/ (accessed on 20 August 2021).
  26. Bouvenot, J.B.; Latour, B.; Siroux, M.; Flament, B.; Stabat, P.; Marchio, D. Dynamic model based on experimental investigations of a wood pellet steam engine micro CHP for building energy simulation. Appl. Therm. Eng. 2014, 73, 1041–1054. [Google Scholar] [CrossRef]
  27. Kallio, S.; Siroux, M. Exergy and Exergo-economic analysis of a hybrid renewable energy system under different climate conditions. Renew. Energy 2022, 194, 396–414. [Google Scholar] [CrossRef]
  28. Barbu, M.; Darie, G.; Siroux, M. Analysis of a residential photovoltaic-thermal (PVT) system in two similar climate conditions. Energies 2019, 12, 3595. [Google Scholar] [CrossRef] [Green Version]
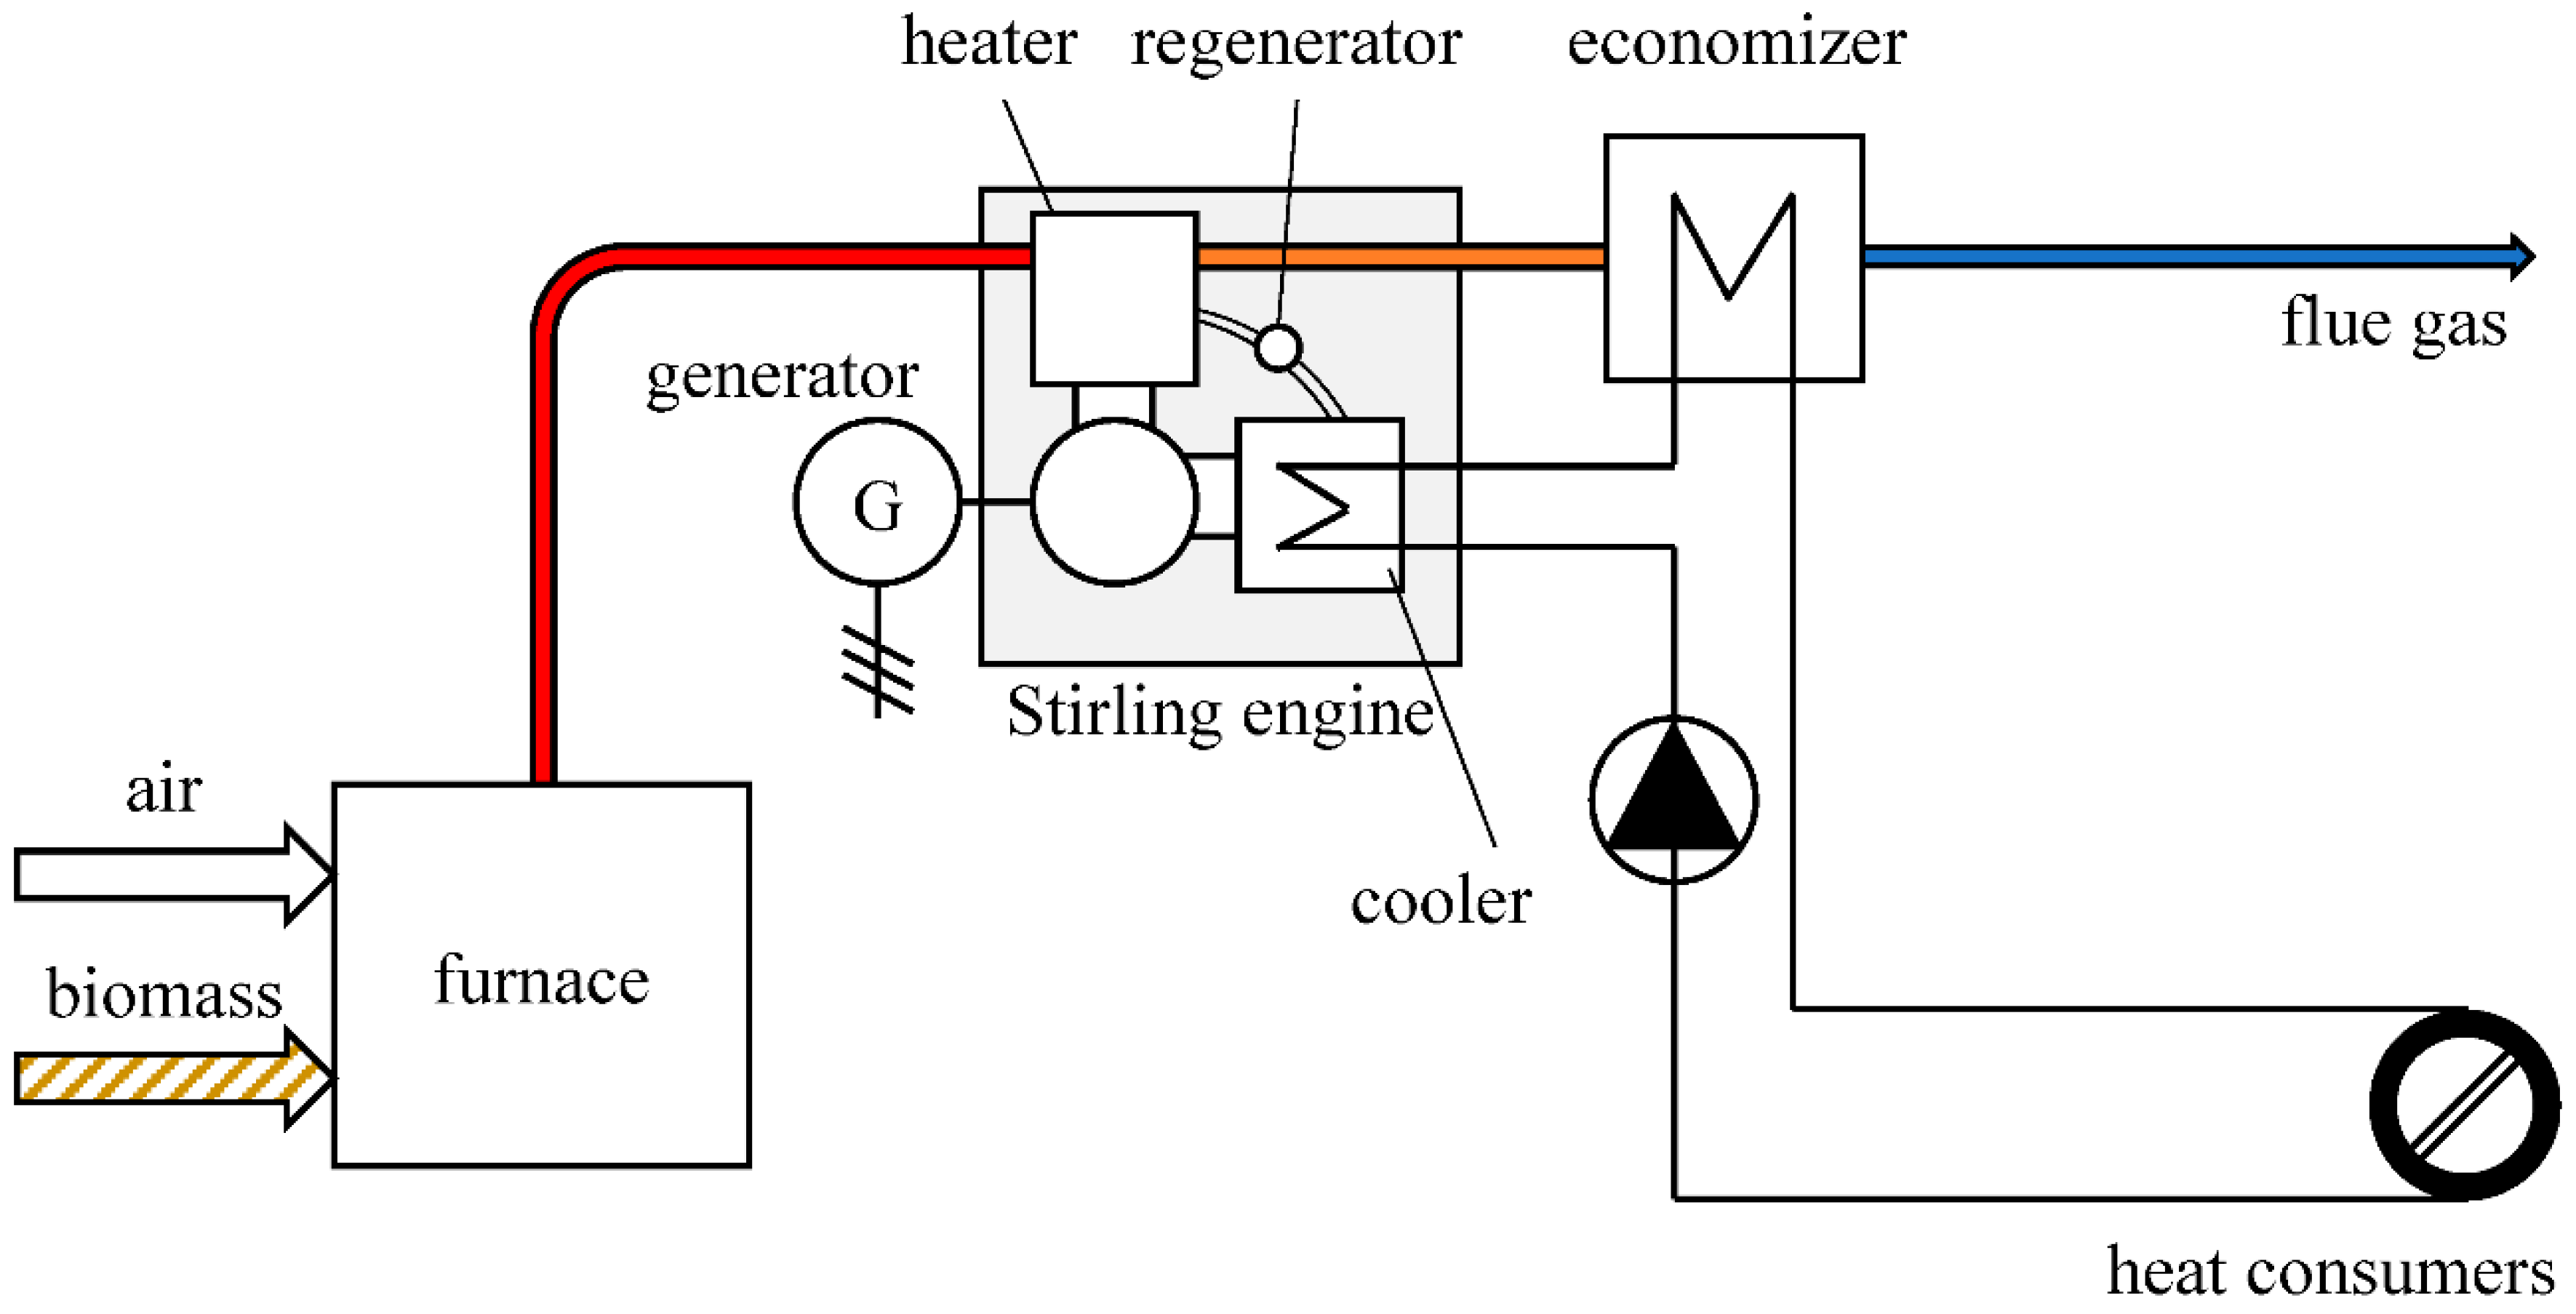
Figure 1. A biomass cogeneration unit with Stirling engine adapted from [23].
Energies 15 05547 g001
Figure 2. ÖkoFEN Pellematic Condens_e Stirling Engine.
Energies 15 05547 g002
Figure 3. Data acquisition schema.
Energies 15 05547 g003
Figure 4. Measurement points on the ÖkoFEN Condens_e cogeneration unit.
Energies 15 05547 g004
Figure 5. The algorithm used in Excel for determining the experiment phase.
Energies 15 05547 g005
Figure 6. Examples of a flow during the starting (a), constant (b), and ending (c) phases.
Energies 15 05547 g006aEnergies 15 05547 g006b
Figure 7. An example of a flow function in its entirety.
Energies 15 05547 g007
Figure 8. An example of a mass flow function during an experiment.
Energies 15 05547 g008
Figure 9. The overview of the CHP-to-user circuit and the points of temperature measurement.
Energies 15 05547 g009
Figure 10. Flow results for the F1 (a), F2 (b), and F3 (c) settings, depending on thermal output powers of 10 kWth, 12 kWth, and 14 kWth.
Energies 15 05547 g010aEnergies 15 05547 g010b
Figure 11. Heat transfer fluid temperature and flow result correlation for the F1 (a), F2 (b), and F3 (c) settings, for thermal power outputs of 10, 12, and 14 kWth.
Energies 15 05547 g011aEnergies 15 05547 g011b
Figure 12. Heat exchanger temperatures for thermal power outputs of 10 kWth (a), 12 kWth (b), and 14 kWth (c).
Energies 15 05547 g012aEnergies 15 05547 g012b
Figure 13. Generated power output and Stirling work fluid temperature for the F1 (a), F2 (b), and F3 (c) flow settings.
Energies 15 05547 g013
Figure 14. The fuel mass flow consumption of the studied configurations.
Energies 15 05547 g014
Figure 15. Power and thermal efficiencies of the studied configurations.
Energies 15 05547 g015
Table 1. Stirling engine-fitted µCHP/CHP units.
SourceStirling TypeWorking FluidThermal Power
[kWth]
Power
[kWel]
TStirling
[°C]
Fuel UseFuel Typeηthηel
[8]N/ANitrogen201549CombustionPellets81%9%
[13]N/AN/AN/AN/AN/AGasificationBiomass46%23%
[14]N/ANitrogen81823CombustionNatural gas90%9%
[15]AlphaN/AN/AN/A600N/AN/AN/AN/A
[16]GammaNitrogen201500–660N/ABiomassN/AN/A
[17]GammaHeliumN/A1370–410CombustionAgricultural wasteN/AN/A
[18]Free pistonN/A1.11N/AN/ABiomass38%42%
[19]Free pistonN/AN/A1525CombustionNatural gasN/A23%
[20]GammaN/A15–400.3625N/APelletsN/AN/A
[21]N/AN/AN/AN/AN/AN/AWood residueN/AN/A
[22]N/AHelium47575N/AN/AChopped wood74%12%
[23]AlphaNitrogen60.92460–480CombustionDieselN/AN/A
Table 2. Characteristics of measuring sensors.
TypeMetrologic MeansMeasurement RangeUncertainty
Water temperatureJUMO PT--100−20 °C to +150 °C0.1 °C
Water flow rateFlowmeter Burkert 80350.5 L/min to 1000 L/min1%
Fuel massWALL-E Floor Scale0 kg to 600 kg0.03%
Exhaust gasCombustion analyzer
ECOM EN2
NO (0–5000 ppm)
CO (0–4000 ppm)
Table 3. The units comprising the thermal flow.
Coefficient Excel   Function
x 5 = @ INDEX ( LINEST ( known   Y s , known   X s ^ { 1 , 2 , 3 , 4 , 5 } ) , 1 )
x 4 = INDEX ( LINEST ( known   Y s , known   X s ^ { 1 , 2 , 3 , 4 , 5 } ) , 1 , 2 )
x 3 = INDEX ( LINEST ( known   Y s , known   X s ^ { 1 , 2 , 3 , 4 , 5 } ) , 1 , 3 )
x 2 = INDEX ( LINEST ( known   Y s ,   known   X s ^ { 1 , 2 , 3 , 4 , 5 } ) , 1 , 4 )
x 1 = INDEX ( LINEST ( known   Y s ,   known   X s ^ { 1 , 2 , 3 , 4 , 5 } ) , 1 , 5 )
x 0 = INDEX ( LINEST ( known   Y s ,   known   X s ^ { 1 , 2 , 3 , 4 , 5 } ) , 1 , 6 )
Table 4. The 9 tested configurations of the 3 thermal outputs paired to the 3 heat transfer fluid flow rates.
Power, Flow 1Power, Flow 2Power, Flow 3
10 kWth, F110 kWth, F210 kWth, F3
12 kWth, F112 kWth, F212 kWth, F3
14 kWth, F114 kWth, F214 kWth, F3
Table 5. The 5 stages of the experimental study.
StageDescription
Bootcombustion process has started
Startthermal power evacuation process has started
Constantthermal power production is constant
Stopthermal power production is stopping
Endthermal power production ended
Table 6. Functions used for determining the 3rd degree equation of the flow in the starting phase.
CoefficientMicrosoft Excel Function
x3 = @ INDEX ( LINEST ( k n o w n   Y s ,   k n o w n   X s ^ { 1 , 2 , 3 } ) , 1 )
x2 = INDEX ( LINEST ( k n o w n   Y s ,   k n o w n   X s ^ { 1 , 2 , 3 } ) , 1 , 2 )
x1 = INDEX ( LINEST ( k n o w n   Y s ,   k n o w n   X s ^ { 1 , 2 , 3 } ) , 1 , 3 )
x0 = INDEX ( LINEST ( k n o w n   Y s ,   k n o w n   X s ^ { 1 , 2 , 3 } ) , 1 , 4 )
Table 7. Functions used for determining the 1st degree equation of the flow in the constant phase.
CoefficientMicrosoft Excel Function
x1 = SLOPE ( k n o w n   Y s ,   k n o w n   X s )
x0 = INTERCEPT ( k n o w n   Y s ,   k n o w n   X s )
Table 8. Functions used for determining the 2nd degree equation of the flow in the ending phase.
CoefficientExcel Function
x2 = @ INDEX ( LINEST ( k n o w n   Y s ,   k n o w n   X s ^ { 1 , 2 } ) , 1 )
x1 = INDEX ( LINEST ( k n o w n   Y s ,   k n o w n   X s ^ { 1 , 2 } ) , 1 , 2 )
x0 = INDEX ( LINEST ( k n o w n   Y s ,   k n o w n   X s ^ { 1 , 2 } ) , 1 , 3 )
Table 9. Heat transfer fluid properties and partial load functioning for the configurations.
ConfigurationStable Temperature
[°C]
Time to Reach Stable Temperature
[min]
Automatic Switch to Partial Load Functioning
10 kWth, F169160YES
10 kWth, F26075NO
10 kWth, F35875NO
12 kWth, F171150YES
12 kWth, F26180YES
12 kWth, F35980NO
14 kWth, F174120YES
14 kWth, F269100YES
14 kWth, F36260NO
Table 10. Time required to reach the configured temperature of the heat transfer fluid for each configuration.
ConfigurationTime to Reach 60 °C [min]Time to Reach 0.8 kWel [min]
10 kW, F125110
10 kW, F270110
10 kW, F3150110
12 kW, F12080
12 kW, F22070
12 kW, F38060
14 kW, F12040
14 kW, F22550
14 kW, F35550
Publisher’s Note: MDPI stays neutral with regard to jurisdictional claims in published maps and institutional affiliations.