
Efficiency of a Compressor Heat Pump System in Different Cycle Designs: A Simulation Study for Low-Enthalpy Geothermal Resources


Abstract
:1. Introduction
2. Materials and Methods
2.1. Geothermal Borehole Parameters
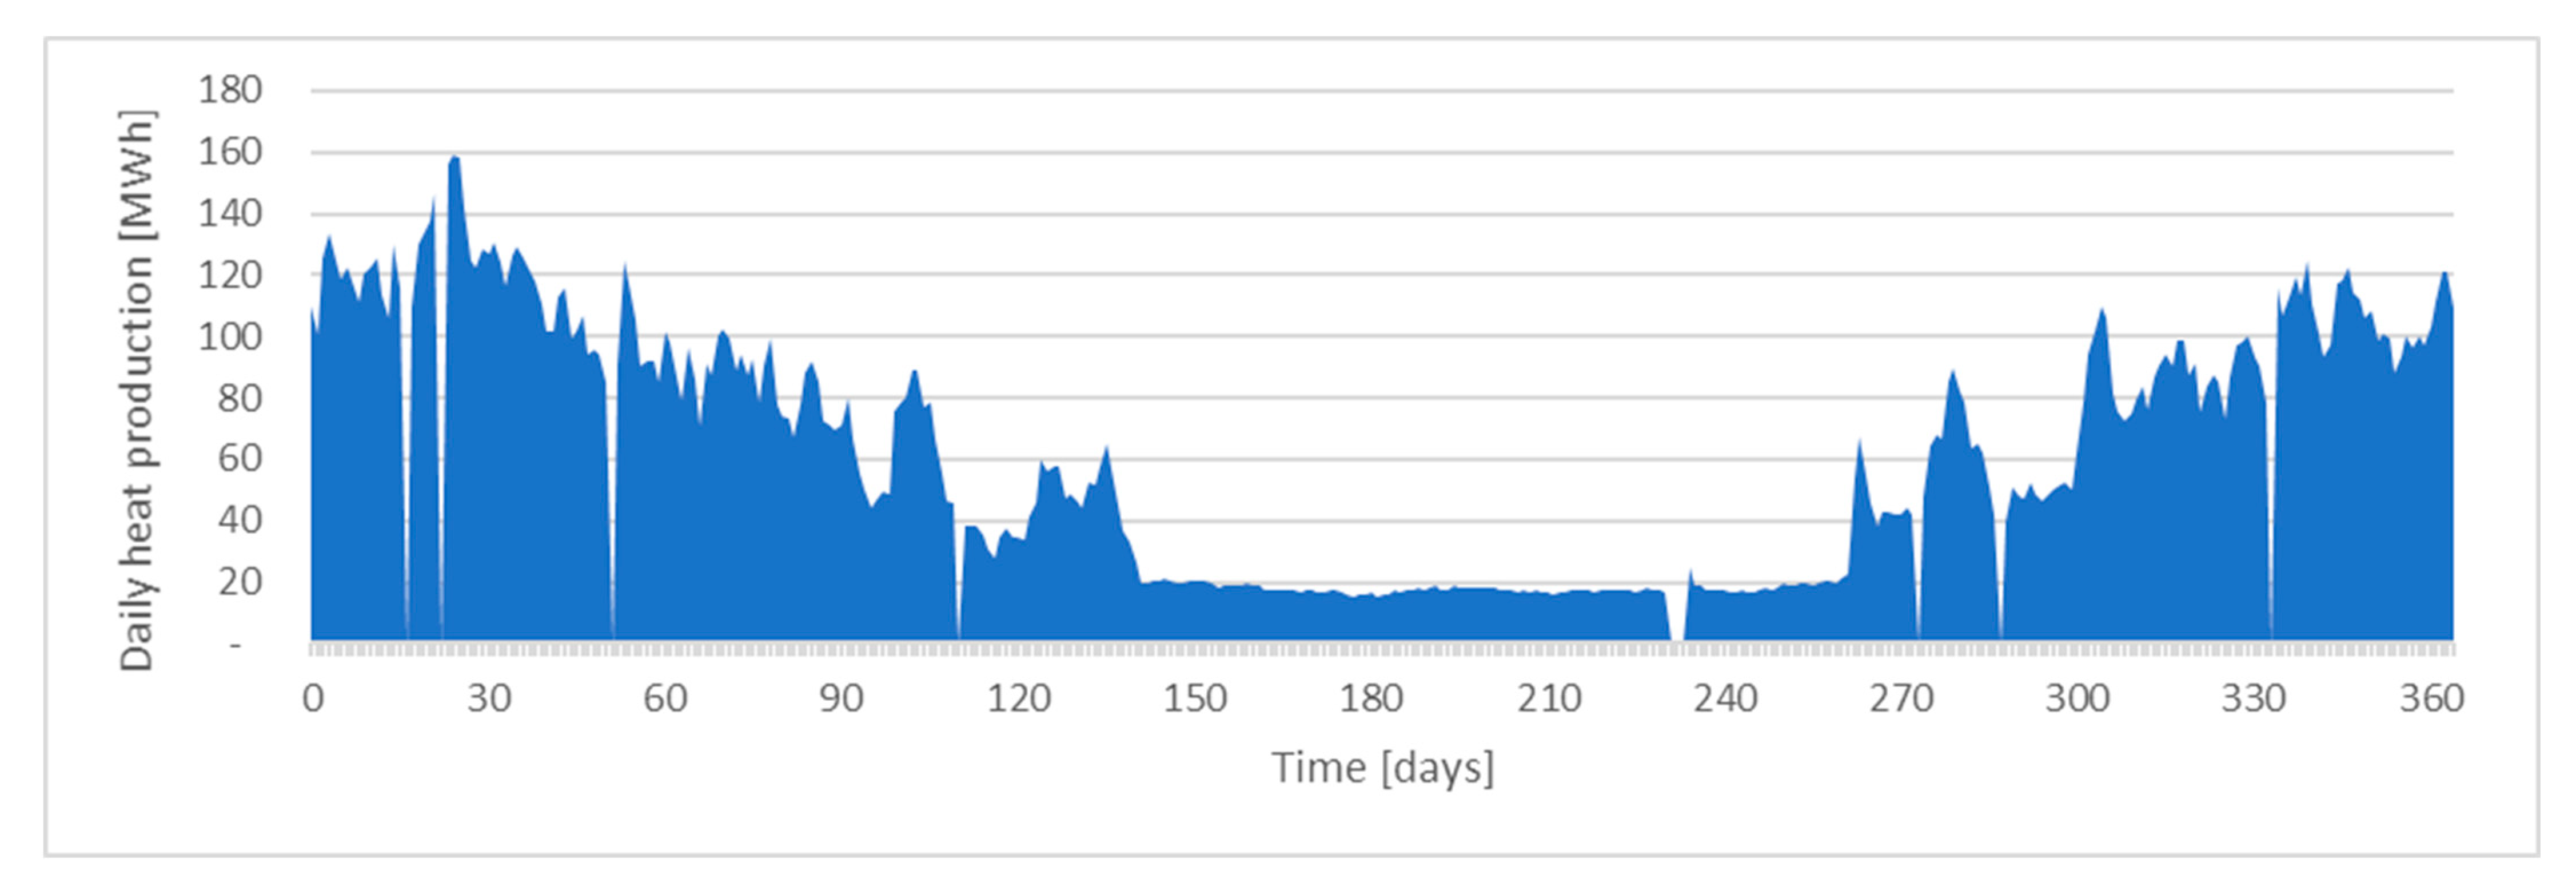
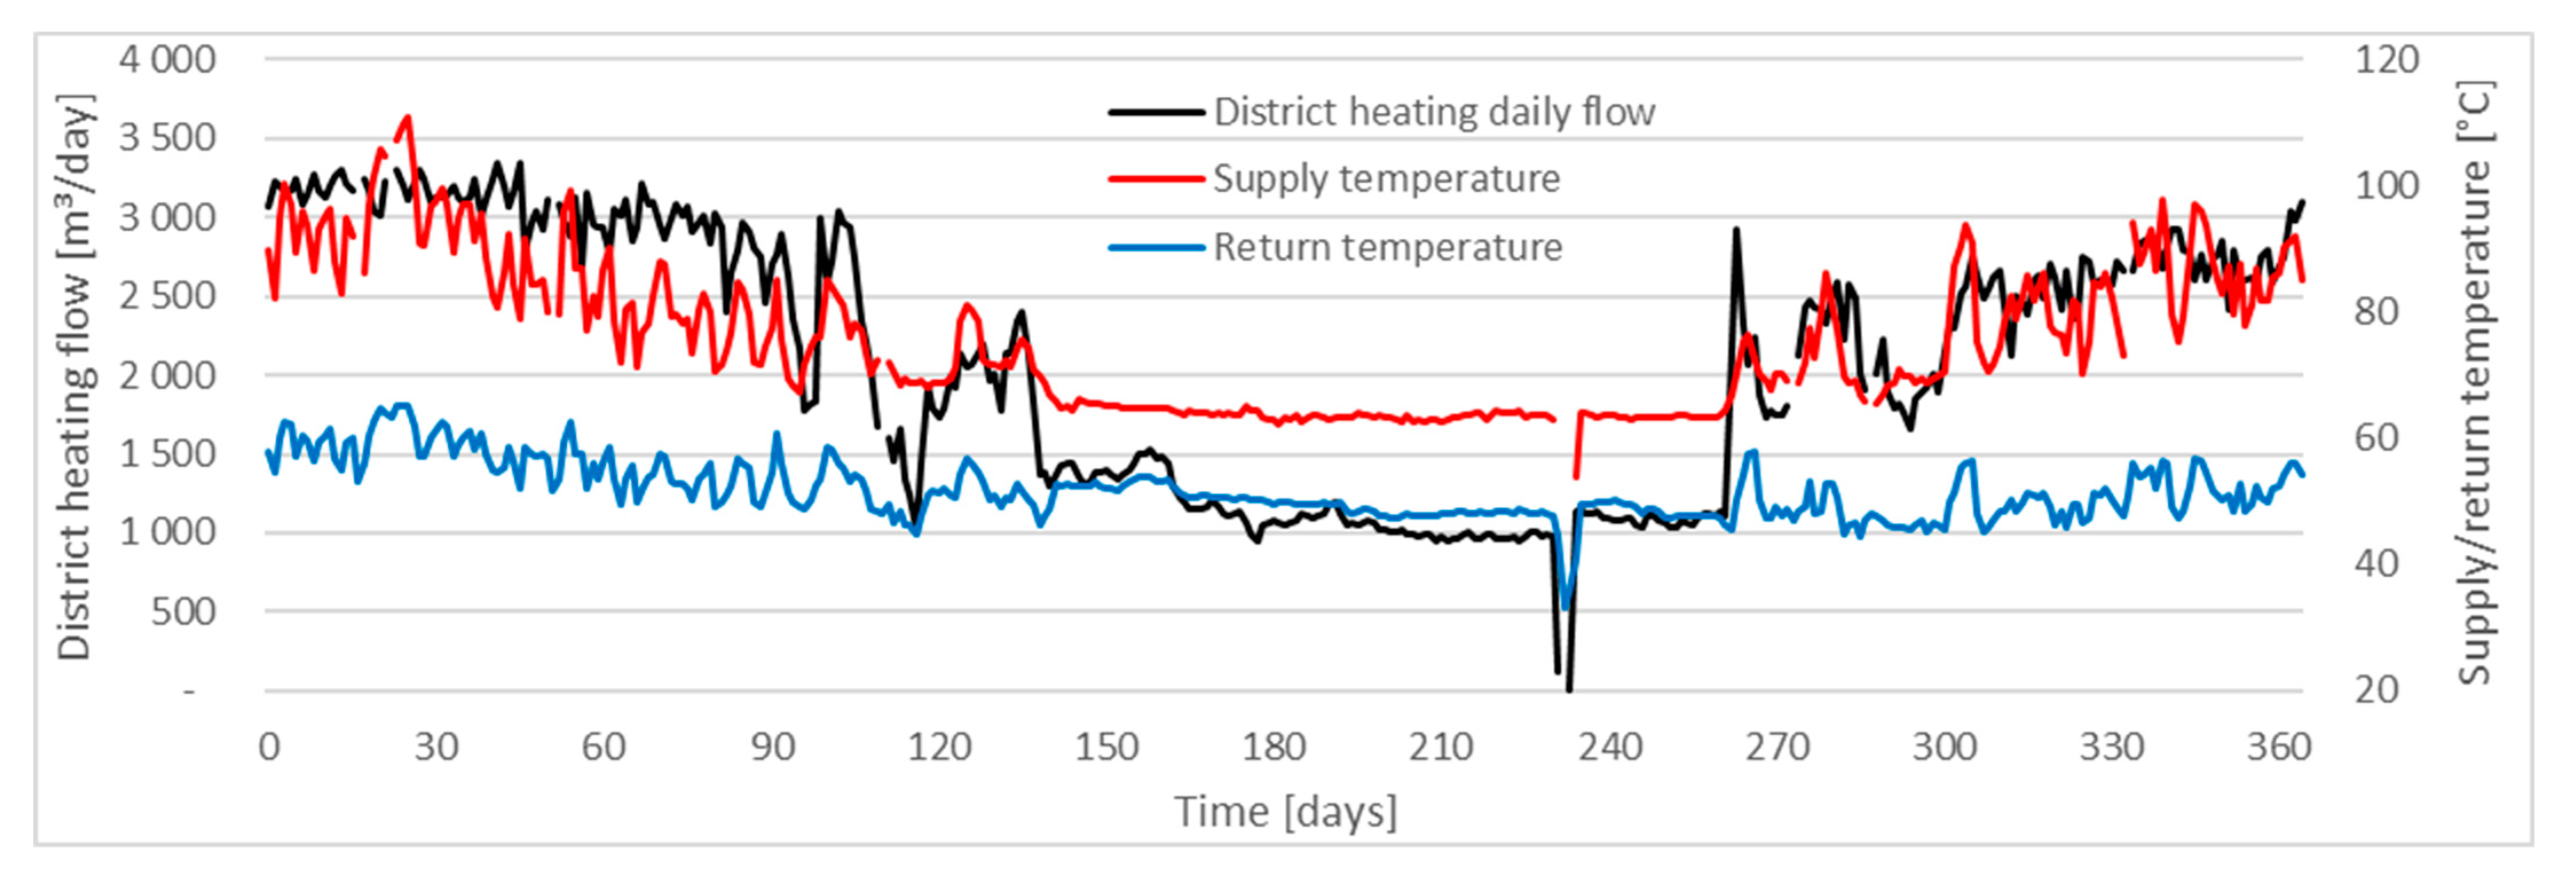
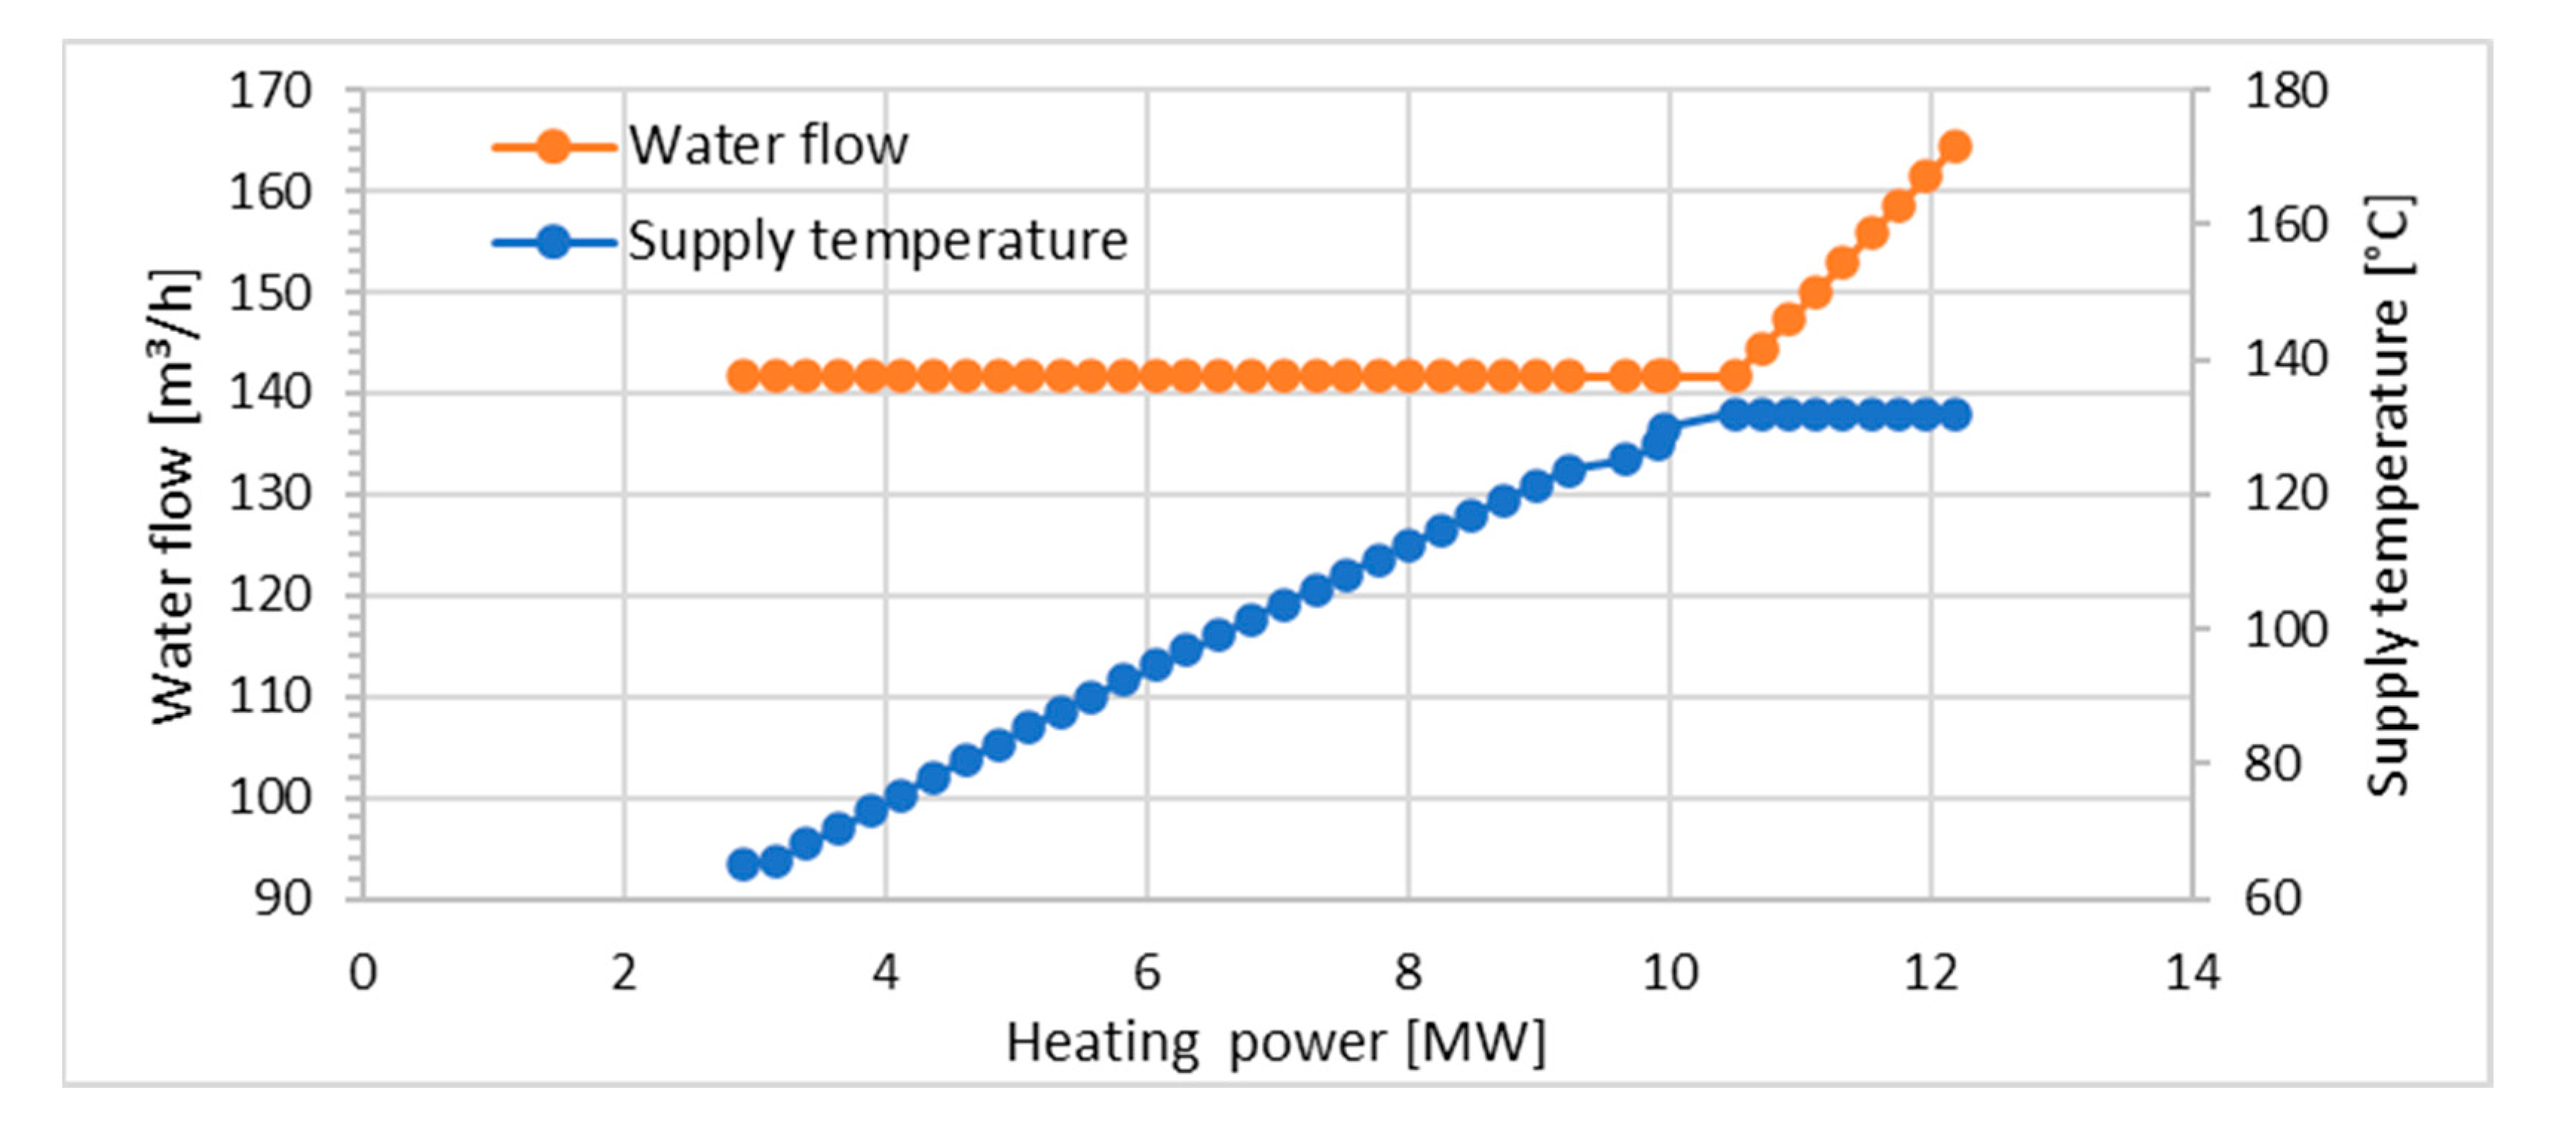
2.2. District Heating Parameters
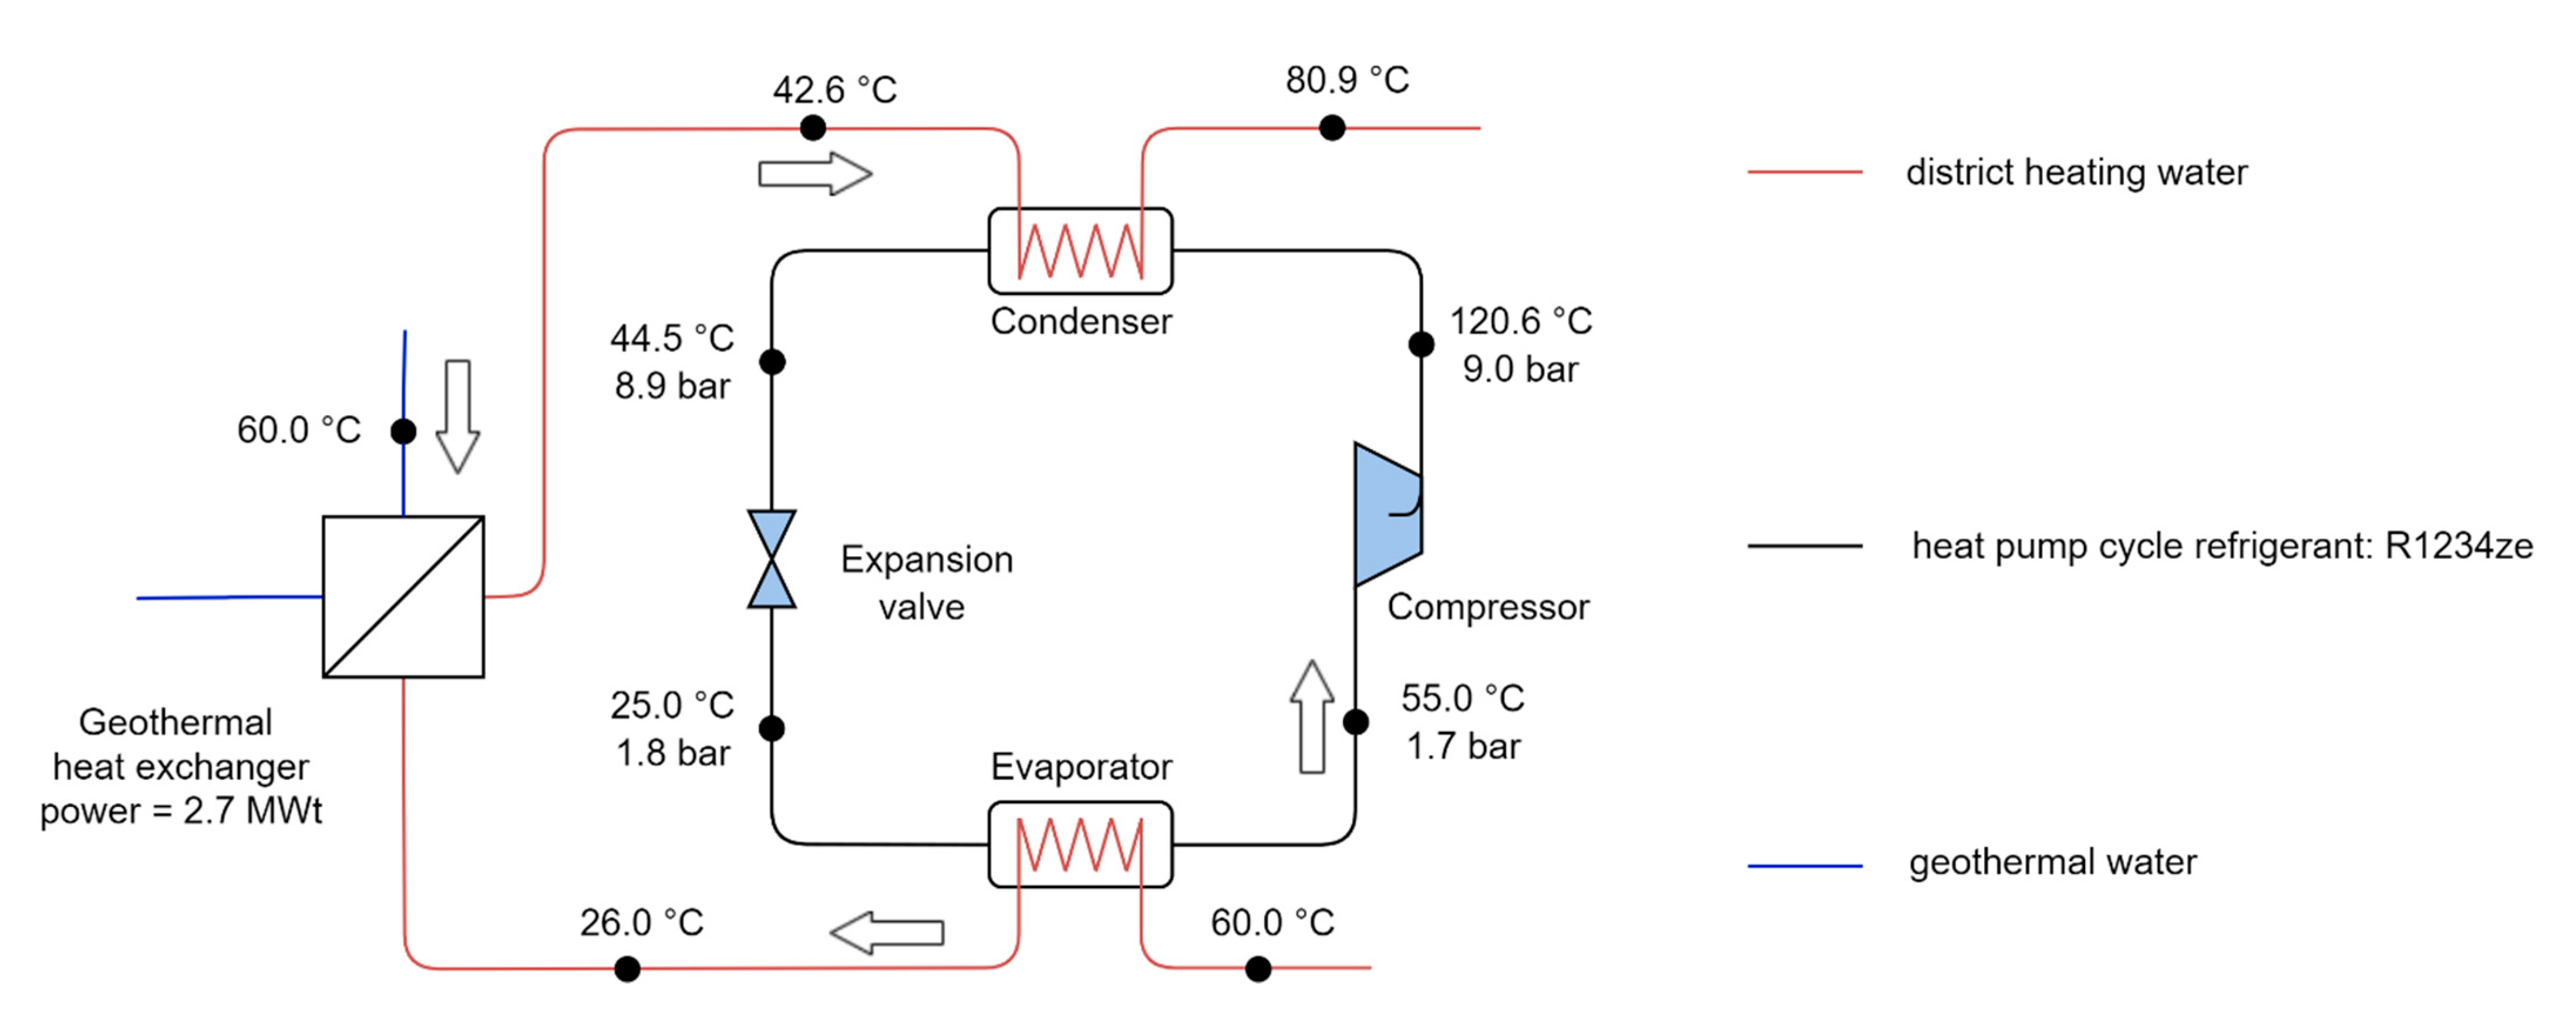
2.3. The Proposed Heat Pump System Selection
2.4. The Heat Pump System Models
- Basic variant
- Cascade variant
- Subcooling variant
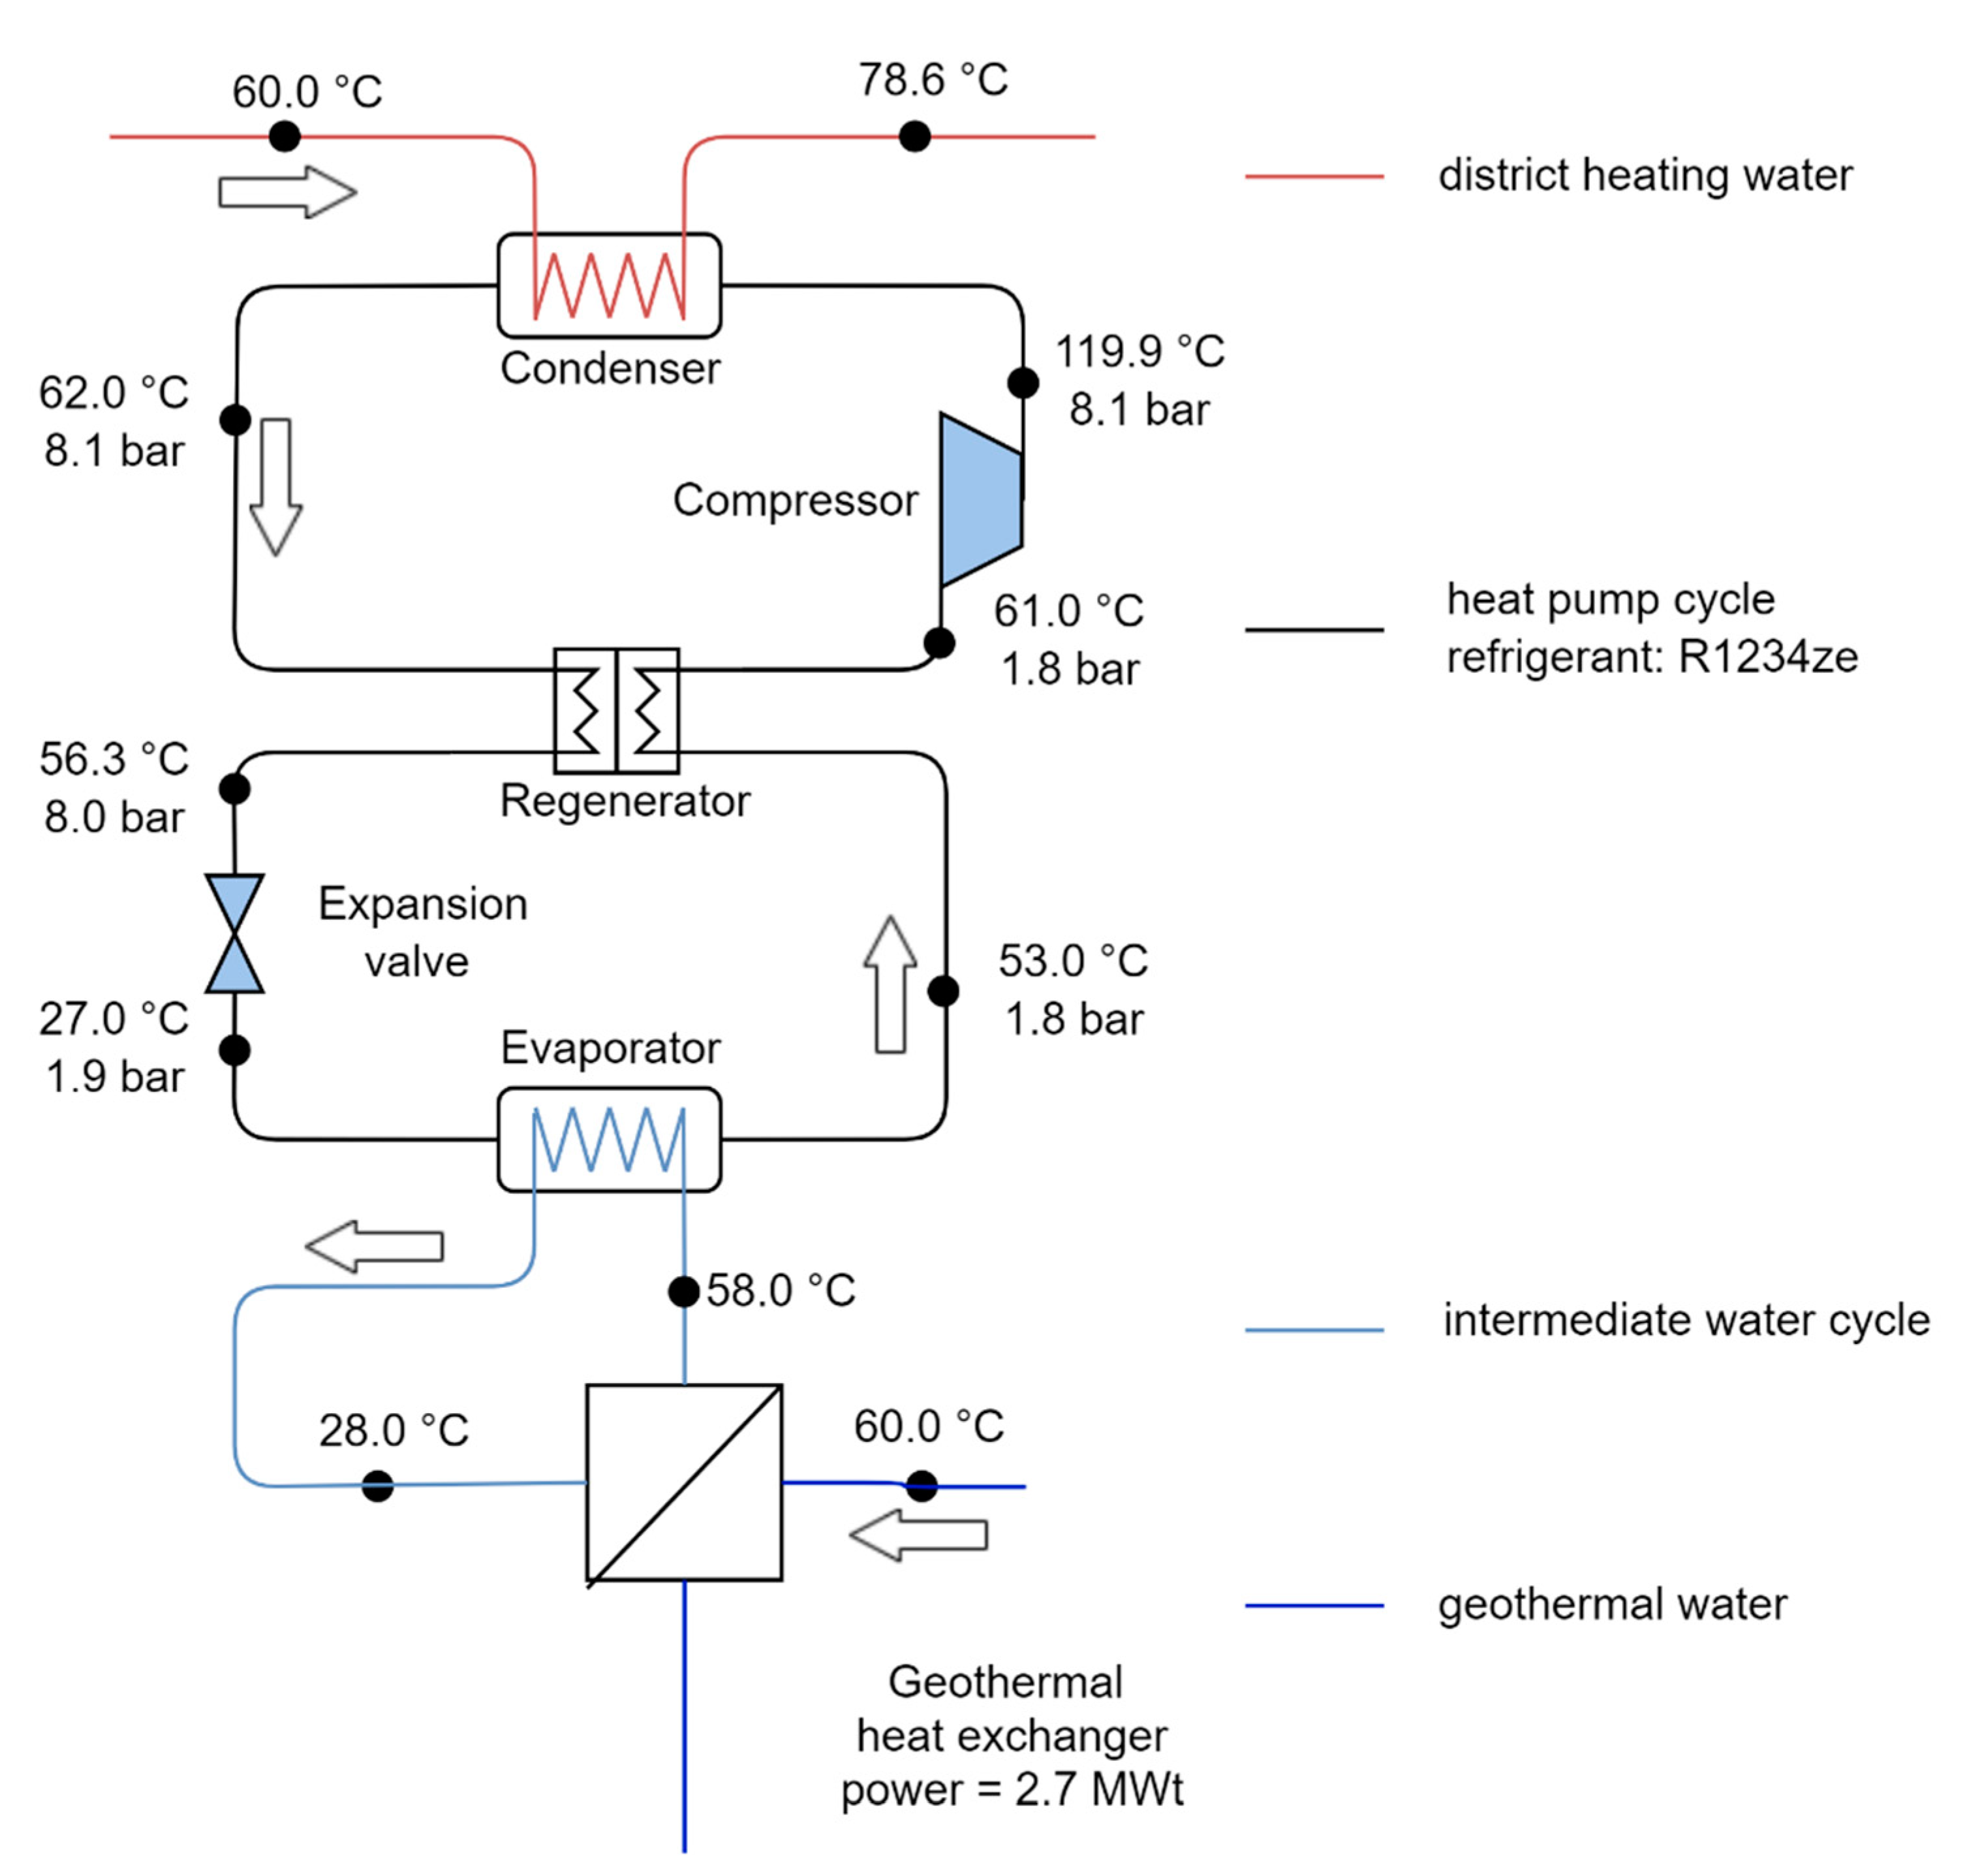
- Regenerator variant
2.5. Simulations
3. Results
3.1. Heat Production
- heat produced from geothermal heat pumps = 16,059 MWh
- heat produced from peak gas boiler = 6136 MWh
3.2. COP and SCOP
4. Discussion
5. Conclusions
Author Contributions
Funding
Institutional Review Board Statement
Data Availability Statement
Conflicts of Interest
References
- Fleiter, T.; Steinbach, J.; Ragwitz, M.; Arens, M.; Aydemir, A.; Elsland, R.; Frassine, C.; Herbst, A.; Hirzel, S. Mapping and Analyses of the Current and Future (2020–2030) Heating/Cooling Fuel Deployment (Fossil/Renewables); Work Package 2: Assessment of the Technologies for the Year 2012; European Commission: Brussel, Belgium, 2016. [Google Scholar]
- Jakubcionis, M.; Santamaria, M.; Kavvadias, K.; Moles, C.; Carlsson, J. Synthesis Report on the Evaluation of National Notifications Related to Article 14 of the Energy Efficiency Directive; JRC112225; Publications Office of the European Union: Luxembourg, 2018; Volume 2018. [Google Scholar]
- Kostarev, V.S.; Tashlykov, O.L.; Klimova, V.A. The Increasing of the Energy Efficiency of Nuclear Power Plants with Fast Neutron Reactors by Utilizing Waste Heat Using Heat Pumps. IOP Conf. Ser. Mater. Sci. Eng. 2019, 552, 012022. [Google Scholar] [CrossRef]
- Soroureddin, A.; Mehr, A.S.; Mahmoudi, S.M.S.; Yari, M. Thermodynamic Analysis of Employing Ejector and Organic Rankine Cycles for GT-MHR Waste Heat Utilization: A Comparative Study. Energy Convers. Manag. 2013, 67, 125–137. [Google Scholar] [CrossRef]
- Mahbaz, S.B.; Yaghoubi, A.; Dehghani-Sanij, A.; Sarvaramini, E.; Leonenko, Y.; Dusseault, M.B. Well-Doublets: A First-Order Assessment of Geothermal Sedheat Systems. Appl. Sci. 2021, 11, 697. [Google Scholar] [CrossRef]
- Wolfgramm, M.; Bartels, J.; Hoffmann, F.; Kittl, G.; Lenz, G.; Seibt, P.; Schulz, R.; Thomas, R.; Unger, H.J. Unterhaching Geothermal Well Doublet: Structural and Hydrodynamic Reservoir Characteristic; Bavaria (Germany). In Proceedings of the European Geothermal Congress 2007, Unterhaching, Germany, 30 May–1 June 2007. [Google Scholar]
- Boissavy, C.; Vernier, R.; Laplaige, P. Geothermal Energy Use, Country Update for France. In Proceedings of the European Geothermal Congress 2013, Pisa, Italy, 3–7 June 2013. [Google Scholar]
- Vernier, R.; Desplan, A.; Boissavy, C. France Country Update. In Proceedings of the World Geothermal Congress 2015, Melbourne, Australia, 19–24 April 2015. [Google Scholar]
- Iorio, M.; Carotenuto, A.; Corniello, A.; di Fraia, S.; Massarotti, N.; Mauro, A.; Somma, R.; Vanoli, L. Low Enthalpy Geothermal Systems in Structural Controlled Areas: A Sustainability Analysis of Geothermal Resource for Heating Plant (The Mondragone Case in Southern Appennines, Italy). Energies 2020, 13, 1237. [Google Scholar] [CrossRef] [Green Version]
- Huttrer, G.W. Geothermal Power Generation in the World 2015–2020 Update Report. In Proceedings of the World Geothermal Congress 2020+1, Reykjavik, Iceland, 24–27 October 2021. [Google Scholar]
- Butuzov, V.A. Geothermal Heat Supply for the Towns of Erding (Germany) and Creteil (France). Therm. Eng. 2011, 58, 85–88. [Google Scholar] [CrossRef]
- Averfalk, H.; Ingvarsson, P.; Persson, U.; Gong, M.; Werner, S. Large heat pumps in Swedish district heating systems. Renew. Sustain. Energy Rev. 2017, 79, 1275–1284. [Google Scholar] [CrossRef]
- Zimny, J.; Michalak, P.; Szczotka, K. Polish Heat Pump Market between 2000 and 2013: European Background, Current State and Development Prospects. Renew. Sustain. Energy Rev. 2015, 48, 791–812. [Google Scholar] [CrossRef]
- Islam, M.M.; Mun, H.-S.; Bostami, A.B.M.R.; Ahmed, S.T.; Park, K.-J.; Yang, C.-J. Evaluation of a Ground Source Geothermal Heat Pump to Save Energy and Reduce CO2 and Noxious Gas Emissions in a Pig House. Energy Build. 2016, 111, 446–454. [Google Scholar] [CrossRef]
- Wahlroos, M.; Pärssinen, M.; Rinne, S.; Syri, S.; Manner, J. Future Views on Waste Heat Utilization—Case of Data Centers in Northern Europe. Renew. Sustain. Energy Rev. 2018, 82, 1749–1764. [Google Scholar] [CrossRef]
- Ebrahimi, K.; Jones, G.F.; Fleischer, A.S. A Review of Data Center Cooling Technology, Operating Conditions and the Corresponding Low-Grade Waste Heat Recovery Opportunities. Renew. Sustain. Energy Rev. 2014, 31, 622–638. [Google Scholar] [CrossRef]
- David, A.; Mathiesen, B.V.; Averfalk, H.; Werner, S.; Lund, H. Heat Roadmap Europe: Large-Scale Electric Heat Pumps in District Heating Systems. Energies 2017, 10, 578. [Google Scholar] [CrossRef] [Green Version]
- Industrial & Commercial Heat Pump Working Group. Large Scale Heat Pumps in Europe; 16 Examples of Realized and Successful Projects. 2017. Available online: https://www.ehpa.org/fileadmin/documents/Large_heat_pumps_in_Europe_final.pdf (accessed on 4 July 2022).
- Industrial & Commercial Heat Pump Working Group. Large Scale Heat Pumps in Europe, Volume 2; Real Examples of Heat Pump Applications in Several Industrial Sectors. 2019. Available online: https://www.ehpa.org/fileadmin/red/03._Media/Publications/Large_heat_pumps_in_Europe_Vol_2_FINAL.pdf (accessed on 4 July 2022).
- Midttømme, K.; Hauge, A.; Grini, R.S.; Stene, J.; Skarphagen, H. Underground Thermal Energy Storage (UTES) with Heat Pumps in Norway. In Proceedings of the Effstock 2009, Thermal Energy Storage for Efficiency and Sustainability: 11th International Conference on Thermal Energy Storage, Stockholm, Sweden, 14–17 June 2009. [Google Scholar]
- Midttømme, K.; Banks, D. Ground-Source Heat Pumps and Underground Thermal Energy Storage: Energy for the Future. NGU Spec. 2008, 11, 93–98. [Google Scholar]
- Alberti, L.; Angelotti, A.; Antelmi, M.; la Licata, I. Borehole Heat Exchangers in Aquifers: Simulation of the Grout Material Impact. Rend. Online Soc. Geol. Ital. 2016, 41, 268–271. [Google Scholar] [CrossRef]
- Antelmi, M.; Alberti, L.; Barbieri, S.; Panday, S. Simulation of Thermal Perturbation in Groundwater Caused by Borehole Heat Exchangers Using an Adapted CLN Package of MODFLOW-USG. J. Hydrol. 2021, 596, 126106. [Google Scholar] [CrossRef]
- Hecht-Méndez, J.; de Paly, M.; Beck, M.; Bayer, P. Optimization of Energy Extraction for Vertical Closed-Loop Geothermal Systems Considering Groundwater Flow. Energy Convers. Manag. 2013, 66, 1–10. [Google Scholar] [CrossRef]
- Babaei, M.; Nick, H.M. Performance of Low-Enthalpy Geothermal Systems: Interplay of Spatially Correlated Heterogeneity and Well-Doublet Spacings. Appl. Energy 2019, 253, 113569. [Google Scholar] [CrossRef]
- Sbrana, A.; Marianelli, P.; Pasquini, G.; Costantini, P.; Palmieri, F.; Ciani, V.; Sbrana, M. The Integration of 3D Modeling and Simulation to Determine the Energy Potential of Low-Temperature Geothermal Systems in the Pisa (Italy) Sedimentary Plain. Energies 2018, 11, 1591. [Google Scholar] [CrossRef] [Green Version]
- Liu, J.; Xue, Y.; Zhang, Q.; Wang, H.; Wang, S. Coupled Thermo-Hydro-Mechanical Modelling for Geothermal Doublet System with 3D Fractal Fracture. Appl. Therm. Eng. 2022, 200, 117716. [Google Scholar] [CrossRef]
- Meroni, A.; Zühlsdorf, B.; Elmegaard, B.; Haglind, F. Design of Centrifugal Compressors for Heat Pump Systems. Appl. Energy 2018, 232, 139–156. [Google Scholar] [CrossRef]
- Bamigbetan, O.; Eikevik, T.M.; Nekså, P.; Bantle, M.; Schlemminger, C. Experimental Investigation of a Prototype R-600 Compressor for High Temperature Heat Pump. Energy 2019, 169, 730–738. [Google Scholar] [CrossRef]
- Frate, G.F.; Ferrari, L.; Desideri, U. Analysis of Suitability Ranges of High Temperature Heat Pump Working Fluids. Appl. Therm. Eng. 2019, 150, 628–640. [Google Scholar] [CrossRef]
- Mikielewicz, D.; Wajs, J. Performance of the Very High-Temperature Heat Pump with Low GWP Working Fluids. Energy 2019, 182, 460–470. [Google Scholar] [CrossRef]
- Uusitalo, A.; Turunen-Saaresti, T.; Honkatukia, J.; Tiainen, J.; Jaatinen-Värri, A. Numerical Analysis of Working Fluids for Large Scale Centrifugal Compressor Driven Cascade Heat Pumps Upgrading Waste Heat. Appl. Energy 2020, 269, 115056. [Google Scholar] [CrossRef]
- Hashimoto, M.; Otsuka, T.; Fukushima, M.; Okamoto, H.; Hayamizu, H.; Ueno, K.; Akasaka, R. Development of New Low-GWP Refrigerants–Refrigerant Mixtures Including HFO-1123. Sci. Technol. Built Environ. 2019, 25, 776–783. [Google Scholar] [CrossRef] [Green Version]
- Sun, Z.; Wang, Q.; Dai, B.; Wang, M.; Xie, Z. Options of Low Global Warming Potential Refrigerant Group for a Three-Stage Cascade Refrigeration System. Int. J. Refrig. 2019, 100, 471–483. [Google Scholar] [CrossRef]
- Hu, B.; Xu, S.; Wang, R.Z.; Liu, H.; Han, L.; Zhang, Z.; Li, H. Investigation on Advanced Heat Pump Systems with Improved Energy Efficiency. Energy Convers. Manag. 2019, 192, 161–170. [Google Scholar] [CrossRef]
- Mateu-Royo, C.; Navarro-Esbrí, J.; Mota-Babiloni, A.; Amat-Albuixech, M.; Molés, F. Theoretical Evaluation of Different High-Temperature Heat Pump Configurations for Low-Grade Waste Heat Recovery. Int. J. Refrig. 2018, 90, 229–237. [Google Scholar] [CrossRef]
- Pająk, L.; Tomaszewska, B.; Bujakowski, W.; Bielec, B.; Dendys, M. Review of the Low-Enthalpy Lower Cretaceous Geothermal Energy Resources in Poland as an Environmentally Friendly Source of Heat for Urban District Heating Systems. Energies 2020, 13, 1302. [Google Scholar] [CrossRef] [Green Version]
- Soboń, J.A. Geological, Hydrogeological and Technological Conditions of the Use of Production-Injection Systems in the Lower Jurassic (Liassic) Reservoir Horizons of the Polish Lowland; Springer: Berlin/Heidelberg, Germany, 2020. [Google Scholar]
- Kasztelewicz, A.; Tomaszewska, B. The Assessing of the Quality of Geothermal Reservoirs on the Example of the Lower Triassic Aquifer in the Mogilno-Łódz Trough (Polish Lowlands). E3S Web Conf. 2020, 154, 05001. [Google Scholar] [CrossRef] [Green Version]
- Kępińska, B. Geothermal Energy Use—Country Update for Poland, 2016–2018. In Proceedings of the European Geothermal Congress 2019, Kraków, Poland, 11–14 June 2019. [Google Scholar]
- Sowizdzal, A. Geothermal Energy Resources in Poland—Overview of the Current State of Knowledge. Renew. Sustain. Energy Rev. 2018, 82, 4020–4027. [Google Scholar] [CrossRef]
- Górecki, W.; Szczepański, A.; Sadurski, A.; Hajto, M.; Papiernik, B.; Kuźniak, T.; Kozdra, T.; Soboń, J.; Jan, S.; Sokołowski, A.; et al. Atlas of Geothermal Resources of Mesozoic Formations in the Polish Lowlands; Akademia Górniczo-Hutnicza im. S. Staszica w Krakowie, Wydział Geologii, Geofizyki i Ochrony Środowiska, Zakład Surowców Energetycznych: Kraków, Poland, 2006. [Google Scholar]
- Górecki, W.; Szczepański, A.; Sadurski, A.; Hajto, M.; Papiernik, B.; Jan, S.; Sokołowski, A.; Strzetelski, W.; Haładus, A.; Kania, J.; et al. Atlas of Geothermal Resources of Paleozoic Formations in the Polish Lowlands; Akademia Górniczo-Hutnicza im. S. Staszica w Krakowie, Wydział Geologii, Geofizyki i Ochrony Środowiska, Zakład Surowców Energetycznych: Kraków, Poland, 2006. [Google Scholar]
- Zimny, J.; Struś, M.; Kowalski, W.; Szymiczek, J.; Michalak, P.; Szczotka, K. Possibilities for Use of Geothermal Energy in Greater Poland Province—Modernization of the Nowy Tomy Heating System. Rynek Energii 2021, 1, 26–37. [Google Scholar]
- Szulc-Wrońska, A.; Tomaszewska, B. Low Enthalpy Geothermal Resources for Local Sustainable Development: A Case Study in Poland. Energies 2020, 13, 5010. [Google Scholar] [CrossRef]
- Ramalingam, A.; Arumugam, S. Experimental Study on Specific Heat of Hot Brine for Salt Gradient Solar Pond Application. Int. J. ChemTech Res. 2012, 4, 956–961. [Google Scholar]
- Simion, A.I.; Grigoraş, C.-G.; Roșu, A.-M.; Gavrilă, L. Mathematical Modelling of Density and Viscosity of Nacl Aqueous Solutions. J. Agroaliment. Process. Technol. 2015, 21, 41–52. [Google Scholar]
- Romanchenko, D.; Nyholm, E.; Odenberger, M.; Johnsson, F. Impacts of Demand Response from Buildings and Centralized Thermal Energy Storage on District Heating Systems. Sustain. Cities Soc. 2021, 64, 102510. [Google Scholar] [CrossRef]
- Gadd, H.; Werner, S. Daily Heat Load Variations in Swedish District Heating Systems. Appl. Energy 2013, 106, 47–55. [Google Scholar] [CrossRef] [Green Version]
- Djurić Ilić, D. Classification of Measures for Dealing with District Heating Load Variations—A Systematic Review. Energies 2020, 14, 3. [Google Scholar] [CrossRef]
- Maddah, S.; Goodarzi, M.; Safaei, M.R. Comparative Study of the Performance of Air and Geothermal Sources of Heat Pumps Cycle Operating with Various Refrigerants and Vapor Injection. Alex. Eng. J. 2020, 59, 4037–4047. [Google Scholar] [CrossRef]
- Janković, Z.; Sieres, J.; Cerdeira, F.; Pavković, B. Analysis of the Impact of Different Operating Conditions on the Performance of a Reversible Heat Pump with Domestic Hot Water Production. Int. J. Refrig. 2018, 86, 282–291. [Google Scholar] [CrossRef]
- Mateu-Royo, C.; Mota-Babiloni, A.; Navarro-Esbrí, J.; Barragán-Cervera, Á. Comparative Analysis of HFO-1234ze(E) and R-515B as Low GWP Alternatives to HFC-134a in Moderately High Temperature Heat Pumps. Int. J. Refrig. 2021, 124, 197–206. [Google Scholar] [CrossRef]
- Wojtan, L. High Temperature Heat Pumps Technology for Geothermal District Heating Applications. Tech. Poszuk. Geol. 2013, 52, 1. [Google Scholar]
- Xu, L.; Li, E.; Xu, Y.; Mao, N.; Shen, X.; Wang, X. An Experimental Energy Performance Investigation and Economic Analysis on a Cascade Heat Pump for High-Temperature Water in Cold Region. Renew. Energy 2020, 152, 674–683. [Google Scholar] [CrossRef]
- Boahen, S.; Choi, J.M. A Study on the Performance of a Cascade Heat Pump for Generating Hot Water. Energies 2019, 12, 4313. [Google Scholar] [CrossRef] [Green Version]
- Yang, W.; Cao, X.; He, Y.; Yan, F. Theoretical Study of a High-Temperature Heat Pump System Composed of a CO2 Transcritical Heat Pump Cycle and a R152a Subcritical Heat Pump Cycle. Appl. Therm. Eng. 2017, 120, 228–238. [Google Scholar] [CrossRef]
- Mota-Babiloni, A.; Mateu-Royo, C.; Navarro-Esbrí, J.; Molés, F.; Amat-Albuixech, M.; Barragán-Cervera, Á. Optimisation of High-Temperature Heat Pump Cascades with Internal Heat Exchangers Using Refrigerants with Low Global Warming Potential. Energy 2018, 165, 1248–1258. [Google Scholar] [CrossRef]
- Kim, M.S.; Kang, D.H.; Kim, M.S.; Kim, M. Investigation on the Optimal Control of Gas Cooler Pressure for a CO2 Refrigeration System with an Internal Heat Exchanger. Int. J. Refrig. 2017, 77, 48–59. [Google Scholar] [CrossRef]
- Ye, X.; Dong, Z.; Lu, J.; Li, C. Thermoeconomic Evaluation of Double-Reheat Coal-Fired Power Units with Carbon Capture and Storage and Waste Heat Recovery Using Organic Rankine Cycle. Int. J. Greenh. Gas Control 2021, 105, 103247. [Google Scholar] [CrossRef]
- Jiang, C.; Jia, C.; Liu, P.; Li, Z. Analysis of the Effect of the Ceramic Membrane Module Based on Ebsilon Software on Water Recovery of Flue Gas from Coal-Fired Power Plants. Comput. Aided Chem. Eng. 2020, 48, 421–426. [Google Scholar]
- Tashtoush, B.; Algharbawi, A.b.R. Parametric Exergetic and Energetic Analysis of a Novel Modified Organic Rankine Cycle with Ejector. Therm. Sci. Eng. Prog. 2020, 19, 100644. [Google Scholar] [CrossRef]
- Hao, Y.; He, Q.; Du, D. A Trans-Critical Carbon Dioxide Energy Storage System with Heat Pump to Recover Stored Heat of Compression. Renew. Energy 2020, 152, 1099–1108. [Google Scholar] [CrossRef]
- Babak, T.; Duić, N.; Khavin, G.; Boldyryev, S.; Krajačić, G. Possibility of Heat Pump Use in Hot Water Supply Systems. J. Sustain. Dev. Energy Water Environ. Syst. 2016, 4, 203–215. [Google Scholar] [CrossRef] [Green Version]
- Mancini, R.; Zühlsdorf, B.; Kjær Jensen, J.; Brix Markussen, W.; Elmegaard, B. Deriving Guidelines for the Design of Plate Evaporators in Heat Pumps Using Zeotropic Mixtures. Energy 2018, 156, 492–508. [Google Scholar] [CrossRef]
- Olympios, A.V.; Pantaleo, A.M.; Sapin, P.; Markides, C.N. On the Value of Combined Heat and Power (CHP) Systems and Heat Pumps in Centralised and Distributed Heating Systems: Lessons from Multi-Fidelity Modelling Approaches. Appl. Energy 2020, 274, 115261. [Google Scholar] [CrossRef]
- Khor, J.O.; Dal Magro, F.; Gundersen, T.; Sze, J.Y.; Romagnoli, A. Recovery of Cold Energy from Liquefied Natural Gas Regasification: Applications beyond Power Cycles. Energy Convers. Manag. 2018, 174, 336–355. [Google Scholar] [CrossRef]
- Zühlsdorf, B.; Bühler, F.; Bantle, M.; Elmegaard, B. Analysis of Technologies and Potentials for Heat Pump-Based Process Heat Supply above 150 °C. Energy Convers. Manag. X 2019, 2, 100011. [Google Scholar] [CrossRef]
- Mirjalili, S. Genetic Algorithm. In Studies in Computational Intelligence; Springer: Cham, Switzerland, 2019; Volume 780. [Google Scholar] [CrossRef]
- Dahash, A.; Mieck, S.; Ochs, F.; Krautz, H.J. A Comparative Study of Two Simulation Tools for the Technical Feasibility in Terms of Modeling District Heating Systems: An Optimization Case Study. Simul. Model. Pract. Theory 2019, 91, 48–68. [Google Scholar] [CrossRef]
- The National Centre for Emissions Management (KOBiZE). Emission Factors CO2, SO2, NOx, CO and Total Particulate Matter for Electricity (in Polish). 2020. Available online: https://www.kobize.pl/uploads/materialy/materialy_do_pobrania/wskazniki_emisyjnosci/Wskazniki_emisyjnosci_grudzien_2020.pdf (accessed on 23 April 2021).
- The National Centre for Emissions Management (KOBiZE). Calorific Values (WO) and CO2 Emission Factors (WE) in 2018 for Reporting in EU (in Polish). 2020. Available online: https://www.kobize.pl/uploads/materialy/materialy_do_pobrania/monitorowanie_raportowanie_weryfikacja_emisji_w_eu_ets/WO_i_WE_do_monitorowania-ETS-2021.pdf (accessed on 23 April 2021).
- European Environment Agency. Greenhouse Gas Emission Intensity of Electricity Generation (Data Visualization). 2020. Available online: https://www.eea.europa.eu/data-and-maps/daviz/co2-emission-intensity-6 (accessed on 23 April 2021).
- Werner, S. International Review of District Heating and Cooling. Energy 2017, 137, 617–631. [Google Scholar] [CrossRef]
- Blarke, M.B.; Dotzauer, E. Intermittency-Friendly and High-Efficiency Cogeneration: Operational Optimisation of Cogeneration with Compression Heat Pump, Flue Gas Heat Recovery, and Intermediate Cold Storage. Energy 2011, 36, 6867–6878. [Google Scholar] [CrossRef]
- Hansen, C. Flue Gas Condensation with Electrically-Powered Heat Pumps in Bjerringbro—Denmark Røggaskondensering Med Eldrevne Varmepumper i Bjerringbro; HPT-AN47-Case14; Technology Collaboration Programme: Bjerringbro, Denmark, 2020. [Google Scholar]


| Boundary Parameter | Value | Source |
|---|---|---|
| Terminal temperature difference | 2 K | [63,64,65] |
| Pressure drop | 0.05 bar | [63,64,65] |
| Heat loss | 5% | [32,66,67] |
| Compressor isentropic efficiency | 0.75 | [28,29,63,67,68] |
| Water pressure | 15 bar | - |
| Variant | Thermal Load [MW] | Supply Temp. [°C] | Return Temp. [°C] | Highest Pressure [bar] | Lowest Pressure [bar] | Max Refrigerant Temperature [°C] | Refrigerant Mass Flow [kg/s] | COP [-] |
|---|---|---|---|---|---|---|---|---|
| Basic | 2.88 | 64.0 | 46.5 | 6.23 | 2.03 | 97.3 | 12.9 | 6.44 |
| 2.98 | 71.3 | 53.2 | 7.48 | 2.03 | 105.2 | 13.6 | 5.42 | |
| 3.09 | 78.8 | 60.0 | 8.96 | 2.03 | 113.4 | 14.3 | 4.64 | |
| 3.17 | 83.7 | 64.5 | 10.06 | 2.03 | 118.9 | 14.8 | 4.22 | |
| 3.26 | 88.8 | 69.1 | 11.29 | 2.03 | 124.7 | 15.3 | 3.86 | |
| Cascade | 2.81 | 63.6 | 46.5 | 6.58 | 2.99 | 84.9 | 7.0 | 8.55 |
| 5.22 | 1.84 | 78.8 | 6.9 | |||||
| 2.90 | 70.9 | 53.2 | 7.78 | 2.99 | 92.2 | 7.4 | 6.86 | |
| 6.23 | 1.84 | 86.3 | 7.3 | |||||
| 3.01 | 78.3 | 60.0 | 9.16 | 2.99 | 99.7 | 7.8 | 5.66 | |
| 7.40 | 1.84 | 94.0 | 7.7 | |||||
| 3.08 | 83.2 | 64.5 | 10.17 | 2.99 | 104.8 | 8.2 | 5.04 | |
| 8.26 | 1.84 | 99.2 | 8.0 | |||||
| 3.17 | 88.3 | 69.1 | 11.28 | 2.99 | 110.1 | 8.5 | 4.50 | |
| 9.21 | 1.84 | 104.6 | 8.3 | |||||
| Subcooling | 2.98 | 64.7 | 46.5 | 6.01 | 1.77 | 94.1 | 16.0 | 4.78 |
| 3.15 | 72.4 | 53.2 | 7.31 | 1.77 | 105.8 | 20.9 | 3.45 | |
| 3.43 | 80.9 | 60.0 | 8.98 | 1.77 | 120.6 | 25.5 | 2.58 | |
| 3.69 | 86.9 | 64.5 | 10.34 | 1.77 | 131.7 | 28.5 | 2.19 | |
| 4.06 | 93.7 | 69.1 | 12.03 | 1.77 | 144.8 | 31.5 | 1.89 | |
| Regenerator | 2.88 | 64.1 | 46.5 | 5.78 | 1.90 | 97.1 | 13.0 | 6.38 |
| 2.98 | 71.3 | 53.2 | 6.87 | 1.90 | 107.0 | 13.4 | 5.41 | |
| 3.07 | 78.6 | 60.0 | 8.13 | 1.90 | 119.9 | 13.6 | 4.73 | |
| 3.13 | 83.5 | 64.5 | 9.05 | 1.90 | 128.4 | 13.8 | 4.36 | |
| 3.19 | 88.5 | 69.1 | 10.07 | 1.90 | 137.1 | 14.0 | 4.05 |
| Heat Pump Variant | Polynomial Equation for COP | R2 Value |
|---|---|---|
| Base | COP = 0.0004x2 − 0.1127x + 12.144 | 0.9978 |
| Cascade | COP = 0.0007x2 − 0.1892x + 17.997 | 0.9976 |
| Subcooling | COP = 0.0006x2 − 0.1602x + 12.614 | 0.9995 |
| Regenerator | COP = 0.0004x2 − 0.1052x + 11.640 | 0.9774 |
| Heat Pump Variant | Average COP | Annual SCOP |
|---|---|---|
| Base | 5.82 | 5.61 |
| Cascade | 7.53 | 7.19 |
| Subcooling | 3.99 | 3.73 |
| Regenerator | 5.79 | 5.60 |
| Existing Gas Boiler | Proposed Modernization Emissions | ||
|---|---|---|---|
| Heat Pump Variant | PL Conditions | EU Conditions | |
| [tones/annum] | |||
| 4416 | Base | 3396 | 2014 |
| Cascade | 2920 | 1841 | |
| Subcooling | 4491 | 2411 | |
| Regenerator | 3401 | 2016 | |
Publisher’s Note: MDPI stays neutral with regard to jurisdictional claims in published maps and institutional affiliations. |
© 2022 by the authors. Licensee MDPI, Basel, Switzerland. This article is an open access article distributed under the terms and conditions of the Creative Commons Attribution (CC BY) license (https://creativecommons.org/licenses/by/4.0/).
Share and Cite
Szymiczek, J.; Szczotka, K.; Banaś, M.; Jura, P. Efficiency of a Compressor Heat Pump System in Different Cycle Designs: A Simulation Study for Low-Enthalpy Geothermal Resources. Energies 2022, 15, 5546. https://doi.org/10.3390/en15155546
Szymiczek J, Szczotka K, Banaś M, Jura P. Efficiency of a Compressor Heat Pump System in Different Cycle Designs: A Simulation Study for Low-Enthalpy Geothermal Resources. Energies. 2022; 15(15):5546. https://doi.org/10.3390/en15155546
Chicago/Turabian StyleSzymiczek, Jakub, Krzysztof Szczotka, Marian Banaś, and Przemysław Jura. 2022. "Efficiency of a Compressor Heat Pump System in Different Cycle Designs: A Simulation Study for Low-Enthalpy Geothermal Resources" Energies 15, no. 15: 5546. https://doi.org/10.3390/en15155546
APA StyleSzymiczek, J., Szczotka, K., Banaś, M., & Jura, P. (2022). Efficiency of a Compressor Heat Pump System in Different Cycle Designs: A Simulation Study for Low-Enthalpy Geothermal Resources. Energies, 15(15), 5546. https://doi.org/10.3390/en15155546