Article

A Numerical Study on the Application of Stress Cage Technology

by
Pouya Abdollahpour
1,
Seyyed Shahab Tabatabaee Moradi
1,*,
Ekaterina Leusheva
2 and
Valentin Morenov
2,*
1
Faculty of Petroleum and Natural Gas Engineering, Sahand University of Technology, Tabriz 5331817634, Iran
2
Petroleum Engineering Department, Saint Petersburg Mining University, 199106 St. Petersburg, Russia
*
Authors to whom correspondence should be addressed.
Energies 2022, 15(15), 5439; https://doi.org/10.3390/en15155439
Submission received: 25 June 2022 / Revised: 20 July 2022 / Accepted: 25 July 2022 / Published: 27 July 2022

Abstract

:
Lost circulation is considered a time-consuming, costly problem during the construction of oil and gas wells. There are several preventive techniques to mitigate this problem. Stress cage technology is a mechanical lost circulation method, in which the formation at the wellbore wall is strengthened to stop the creation of induced fractures as one of the main causes of lost circulation. In this research, a two-dimensional numerical model, considering the elastic, poro-elastic, and thermo-poro-elastic behavior of the rock, is built to investigate the effectiveness of the stress cage method. Results show that better performance of the technology is achieved if the fractures are bridged close to their apertures. Additionally, it was found that the difference between the elastic, poro-elastic, and thermo-poro-elastic models is slightly visible. The conclusion states that the application of the stress cage methods leads to an increase in hoop stress and subsequent formation fracture gradient.

1. Introduction

Lost circulation is defined as the partial or total loss of drilling fluid from the wellbore into the subsurface formations [1], as a result of which, less fluid is returned to the surface than is pumped into the drill string. The problem of lost circulation is common in high permeability zones, naturally fractured formations, and weak formations, where induced fractures may develop as a result of increased wellbore pressure. Depleted reservoirs, deep offshore wells, and directional wells are among the circumstances, where induced fracture may develop. Some studies show that about 20% of non-productive time during drilling operations are due to lost circulation problems [2,3,4,5,6,7].
Based on Cook et al. [8], lost circulation management techniques are divided into two main categories, remedial and preventive methods. The remedial methods are used after diagnosis of lost circulations, where lost circulation material (LCM) pills are usually applied to solve the problem. LCMs are usually accumulated on the borehole wall to form a cake structure on the wall and reduce fluid entrance into the formation. Preventive techniques are applied in possible trouble zones to mitigate upcoming problems. A class of preventive techniques is wellbore strengthening (WBS) methods to increase the formation fracture gradient and, hence, hinder the development of natural and induced fractures, which are known as the main source of lost circulation [5,9,10,11,12].
Stress cage technology, presented by Aston et al. in 2004, is a mechanical WBS method. This method involves the creation of artificial shallow fractures at the wellbore wall and bridging them at the fracture opening to increase the hoop stress at or the near wellbore wall. This increase in hoop stress will eventually lead to a rise in the fracture resistance of the rock at the wellbore wall. Therefore, fewer induced fractures are created, which, in turn, leads to less possibility of lost circulation. A higher fracture gradient guarantee a wider mud weight window, which can contribute to better drilling and completion practices, and, in the best case, it can lead to a reduced number of casing strings [2,13,14,15,16,17].
The work [18] investigates the effect of effective stress on the permeability of sandstone in the near-bottomhole zone. The results of laboratory studies showed that the fractional composition of medium- and fine-grained sandstones influences the pressure sensitivity coefficient and material constant, which are used to estimate the rock permeability and pressure gradient. The stress state of the borehole walls and their stability, taking into account the penetration of drilling fluid into the pores and fractures of rocks, are also influenced by the circulation of the muds with various fillers [19,20].
The concept and application of stress cage technology have been the subject of several theoretical and experimental studies. Alberty et al. (2004) developed the first two-dimensional physical model based on a linear elastic mechanism and finite element method to study the effectiveness of stress cage technology. They showed that the amount of trapped stress in the near wellbore region depends on the formation strength, fracture width and length, the bridge position in the fracture opening, and compressive strength of the bridging materials [14].
Gil et al. (2006) emphasized the low effectiveness of stress cage technology in low-permeability rocks, such as shales, and proposed a new procedure for the application of the technology in such formations. The procedure involved the precooling of the formation to decrease hoop stress first and then following the normal stress cage technology steps. In conclusion, authors highlighted the sensitivity of the shales to temperature changes and the application of the proposed procedure in conduction for an effective stress cage technology application in low permeability rocks [21].
In 2007, Wang et al. presented their numerical model to investigate the basics of the lost circulation problem and the effectiveness of stress cage technology in the strengthening of depleted reservoirs. They concluded that propping the cracks can strengthen the wellbore wall in both depleted and non-depleted formations. In another study, Wang et al. examined the fracture stability under strengthening conditions. They showed that wellbore geometrical properties; rock mechanical and physical parameters, including stress anisotropy, wellbore radius, fracture length, and width; propping location; rock Young modulus; and rock Poisson’s ratio have significant effects on the result of stress cage treatment. It should be noted that the details of the numerical models are not clearly described in these papers. For example, the lack of pore pressure in the input data is noticeable [22,23].
Salehi et al. (2010), considering a linear elastic rock behavior, used a 3D finite element fracture model to study the effect of rock permeability on fracture growth. The result of the simulation showed wider fractures in high permeability rocks. However, the effect of temperature variation on the results of stress cage technology is not investigated [24].
Shahri et al. (2015) provided a semi-analytical model to predict fracture width distribution and fracture re-initiation pressure, considering near well stress distribution, in situ stress anisotropy, and directional trajectory of the well. Using the results of the proposed model, the authors investigated the effect of different parameters on the design of lost circulation materials. Authors did not include the temperature effect in the semi-analytical model [25].
Feng et al. (2014) used two-dimensional elastic and poro-elastic models to evaluate the stress state at the near wellbore region before fracture initiation, during fracture propagation, and after fracture bridging with LCM. In the conclusion, authors provided a detailed description of the wellbore strengthening mechanism and affecting parameters [26].
Zhong et al. (2017) developed a mathematical model for wellbore strengthening in directional wells. Some parameters, such as injection rate, fluid viscosity, wellbore radius, wellbore inclination, fracture plug width, and optimal wellbore strengthening operations, were investigated in the study. The presented results do not include the variation of hoop stress around the borehole, which is critical for evaluation of stress cage effectiveness [27].
In 2019, Liu et al. presented a complete numerical model that included the elastic deformation of the rock, fluid flow, and the plugging mechanism. The output of the model was the stresses near the borehole wall, the opening of the fracture, and the pressure inside the fracture in the conditions before and after bridging [28].
In 2020, Li et al. developed a fully coupled numerical elastic model to investigate the state of near-wellbore stresses, and fracture evolution. They concluded that after WBS the compressive hoop stress and confining stress are altered [29].
Mirabbasi et al. (2020) developed a thermo-poro-elastic analytical model to study the effects of different well geometrical and rock mechanical properties on WBS effectiveness. The authors also presented the stress intensity factor (SIF) as the stress concentration at the fracture tip to evaluate the WBS operation. Comparing the results of elastic, poro-elastic, and thermo-poro-elastic models, they showed the more accurate results of the thermo-poro-elastic model, as the variation of temperature and pore pressure significantly affects the state of stresses in near-wellbore region [15].
As it was discussed, in most of the above-mentioned studies, the effect of temperature is ignored, which may lead to over- or under-estimation of stress cage effectiveness. Additionally, in none of the reviewed studies, elastic (E), poro-elastic (PE) and thermo-poro-elastic (TPE) models were compared. This is worth investigating, as it should be shown if the results of TPE are significantly different from the other two models. In this work, all models are developed to study the state of stresses in the near-wellbore region. Fracture width and hoop stress variation are investigated before fracturing, before bridging the artificial fracture, and after bridging the fracture to evaluate the effectiveness of stress cage technology.

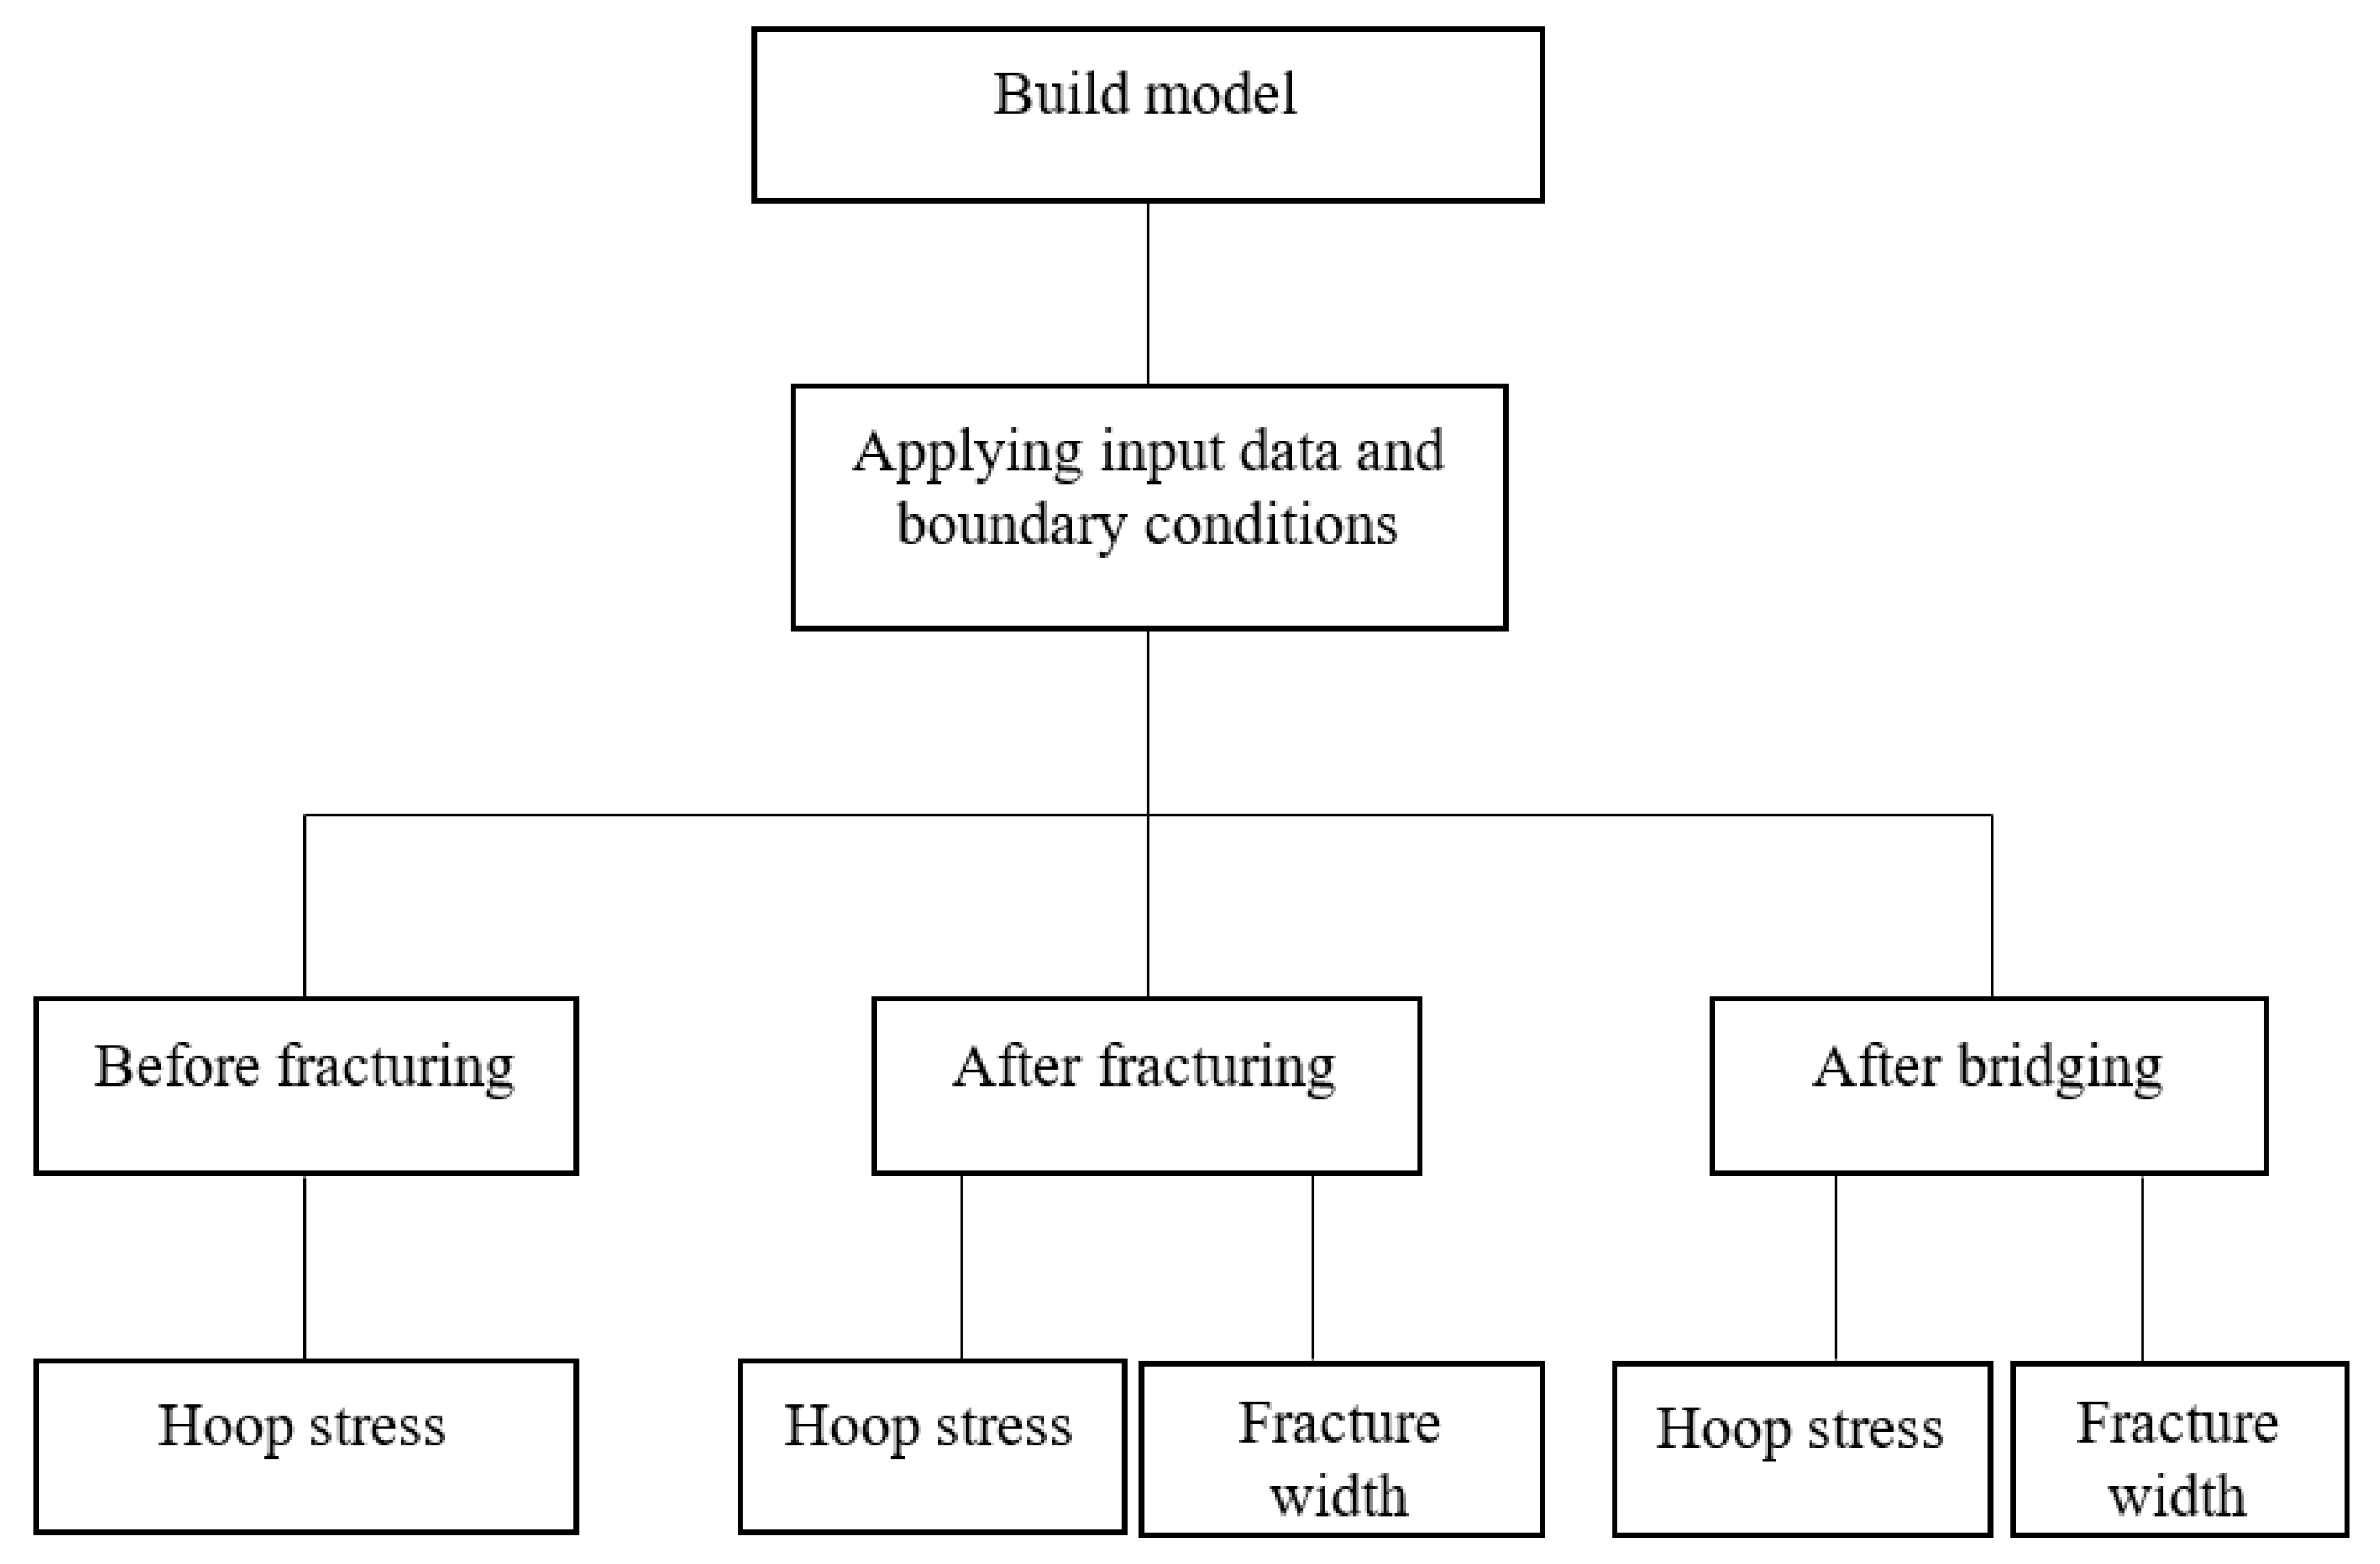
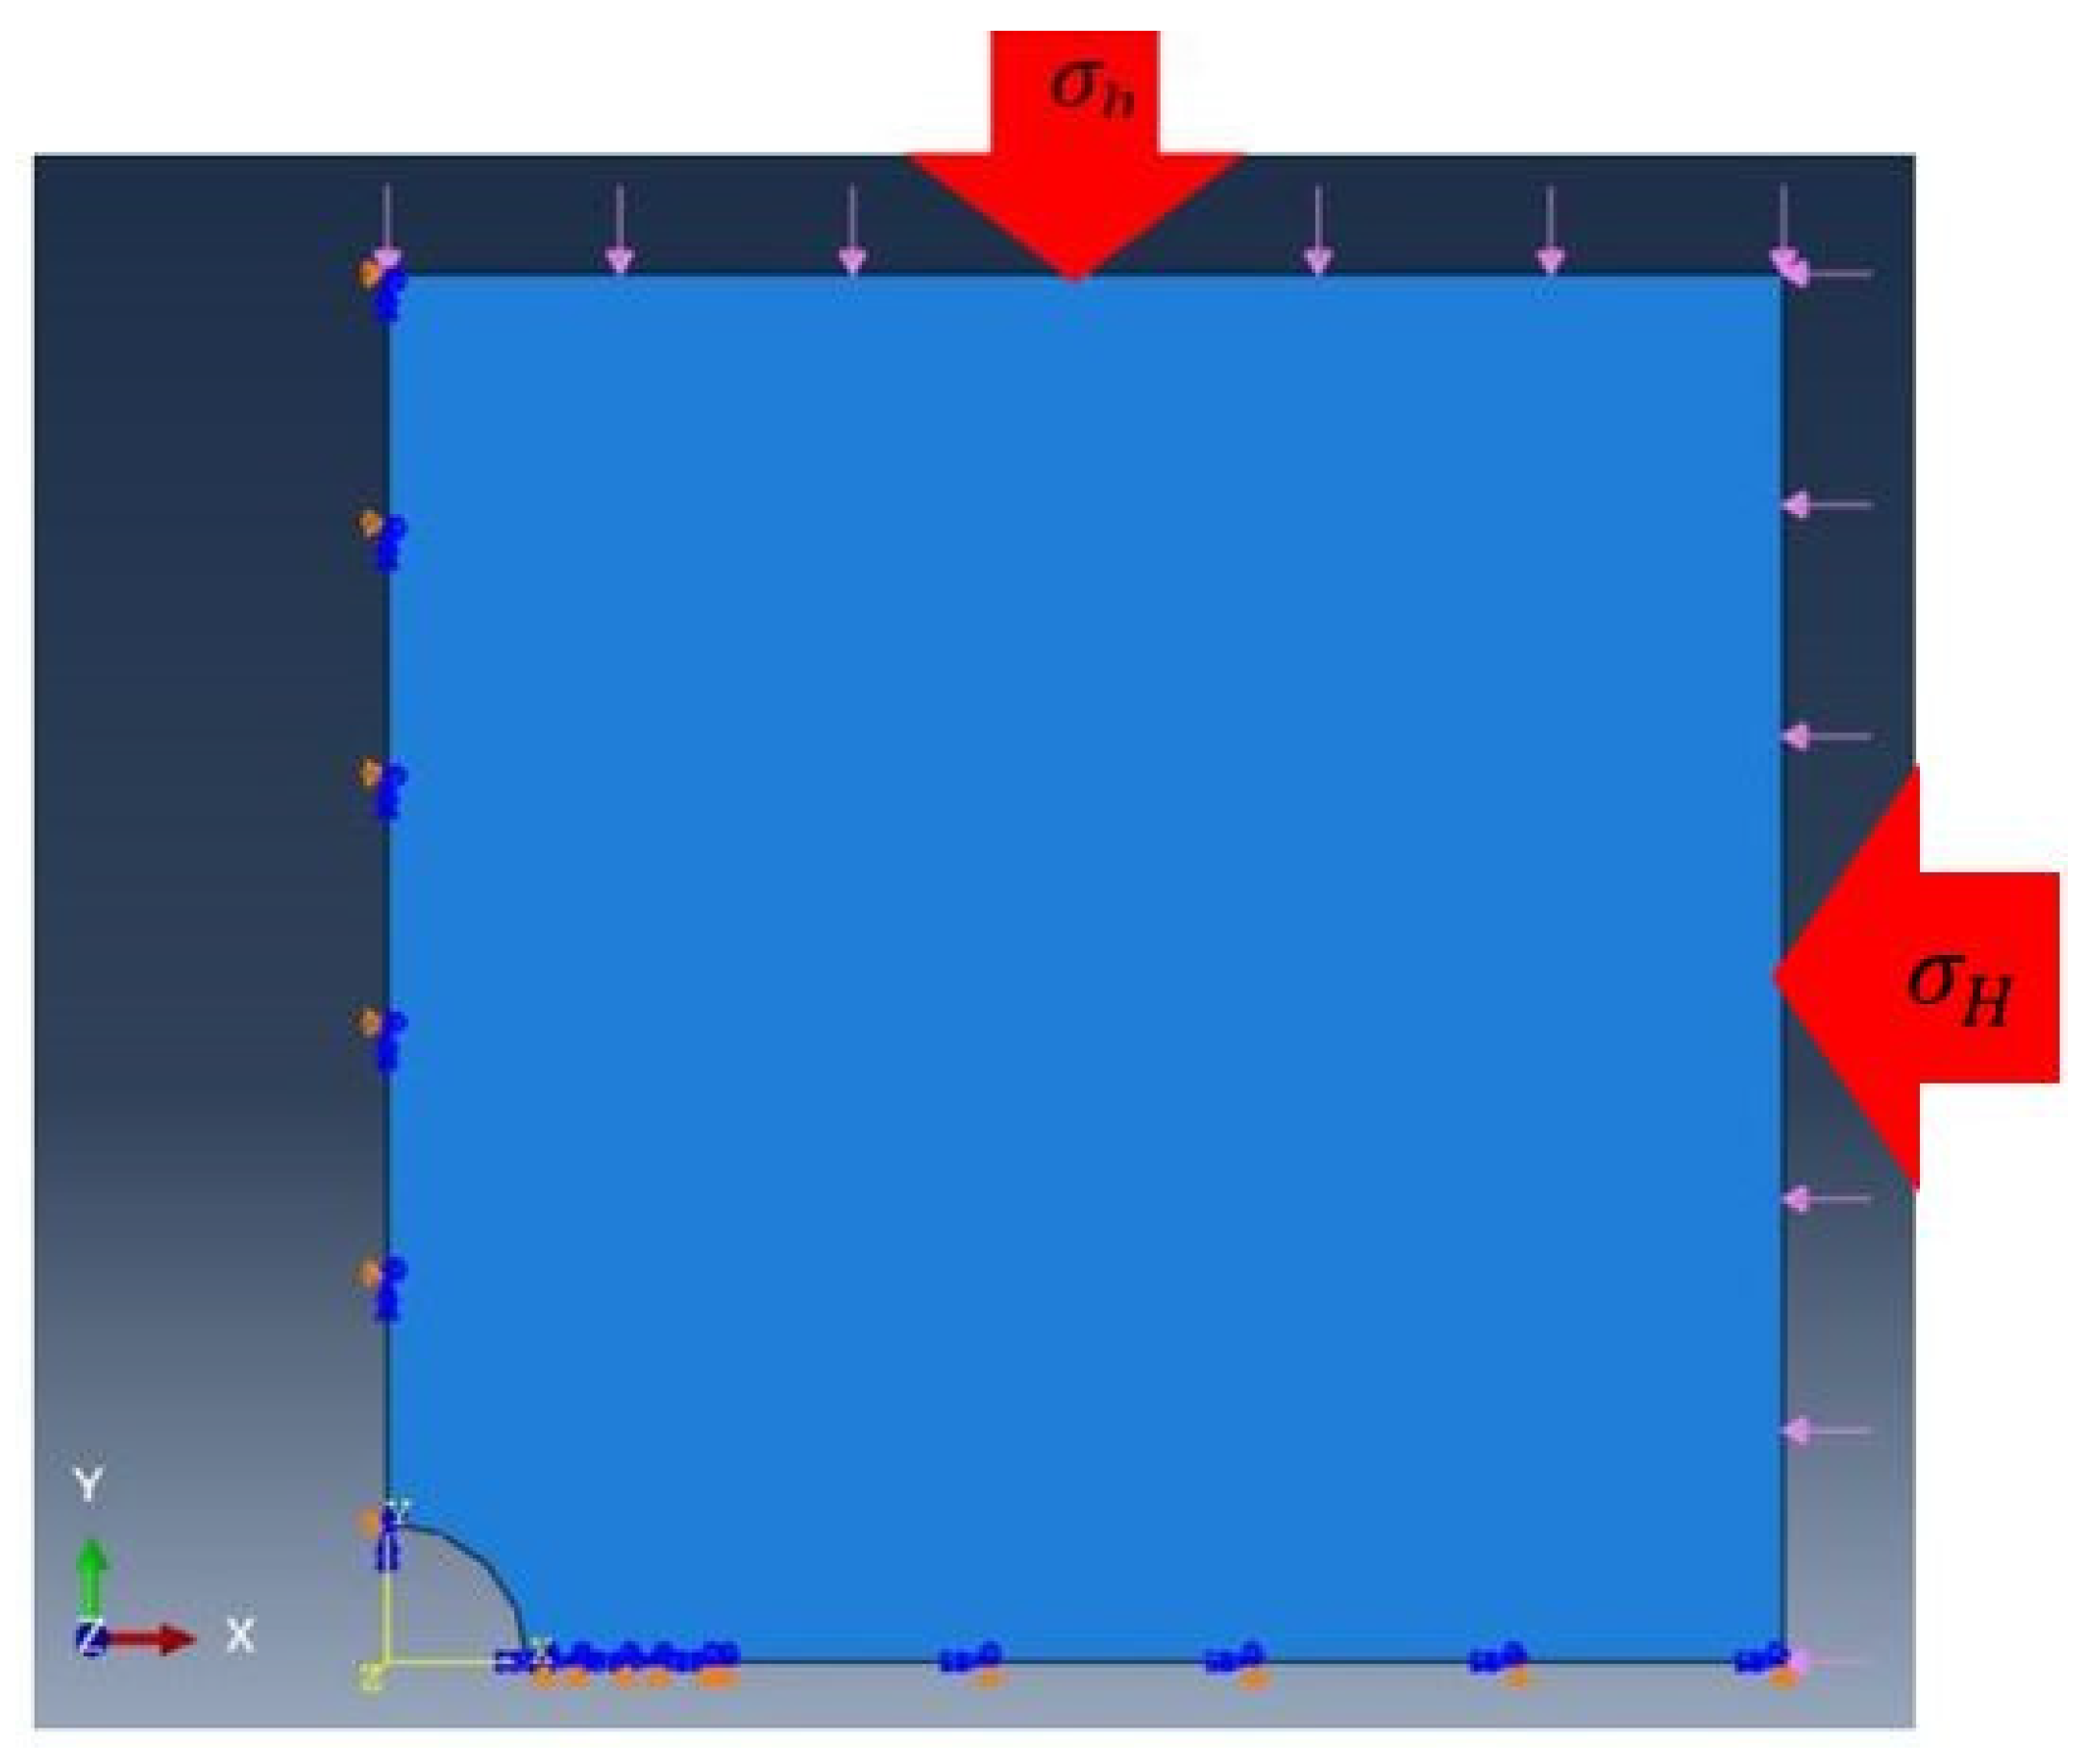
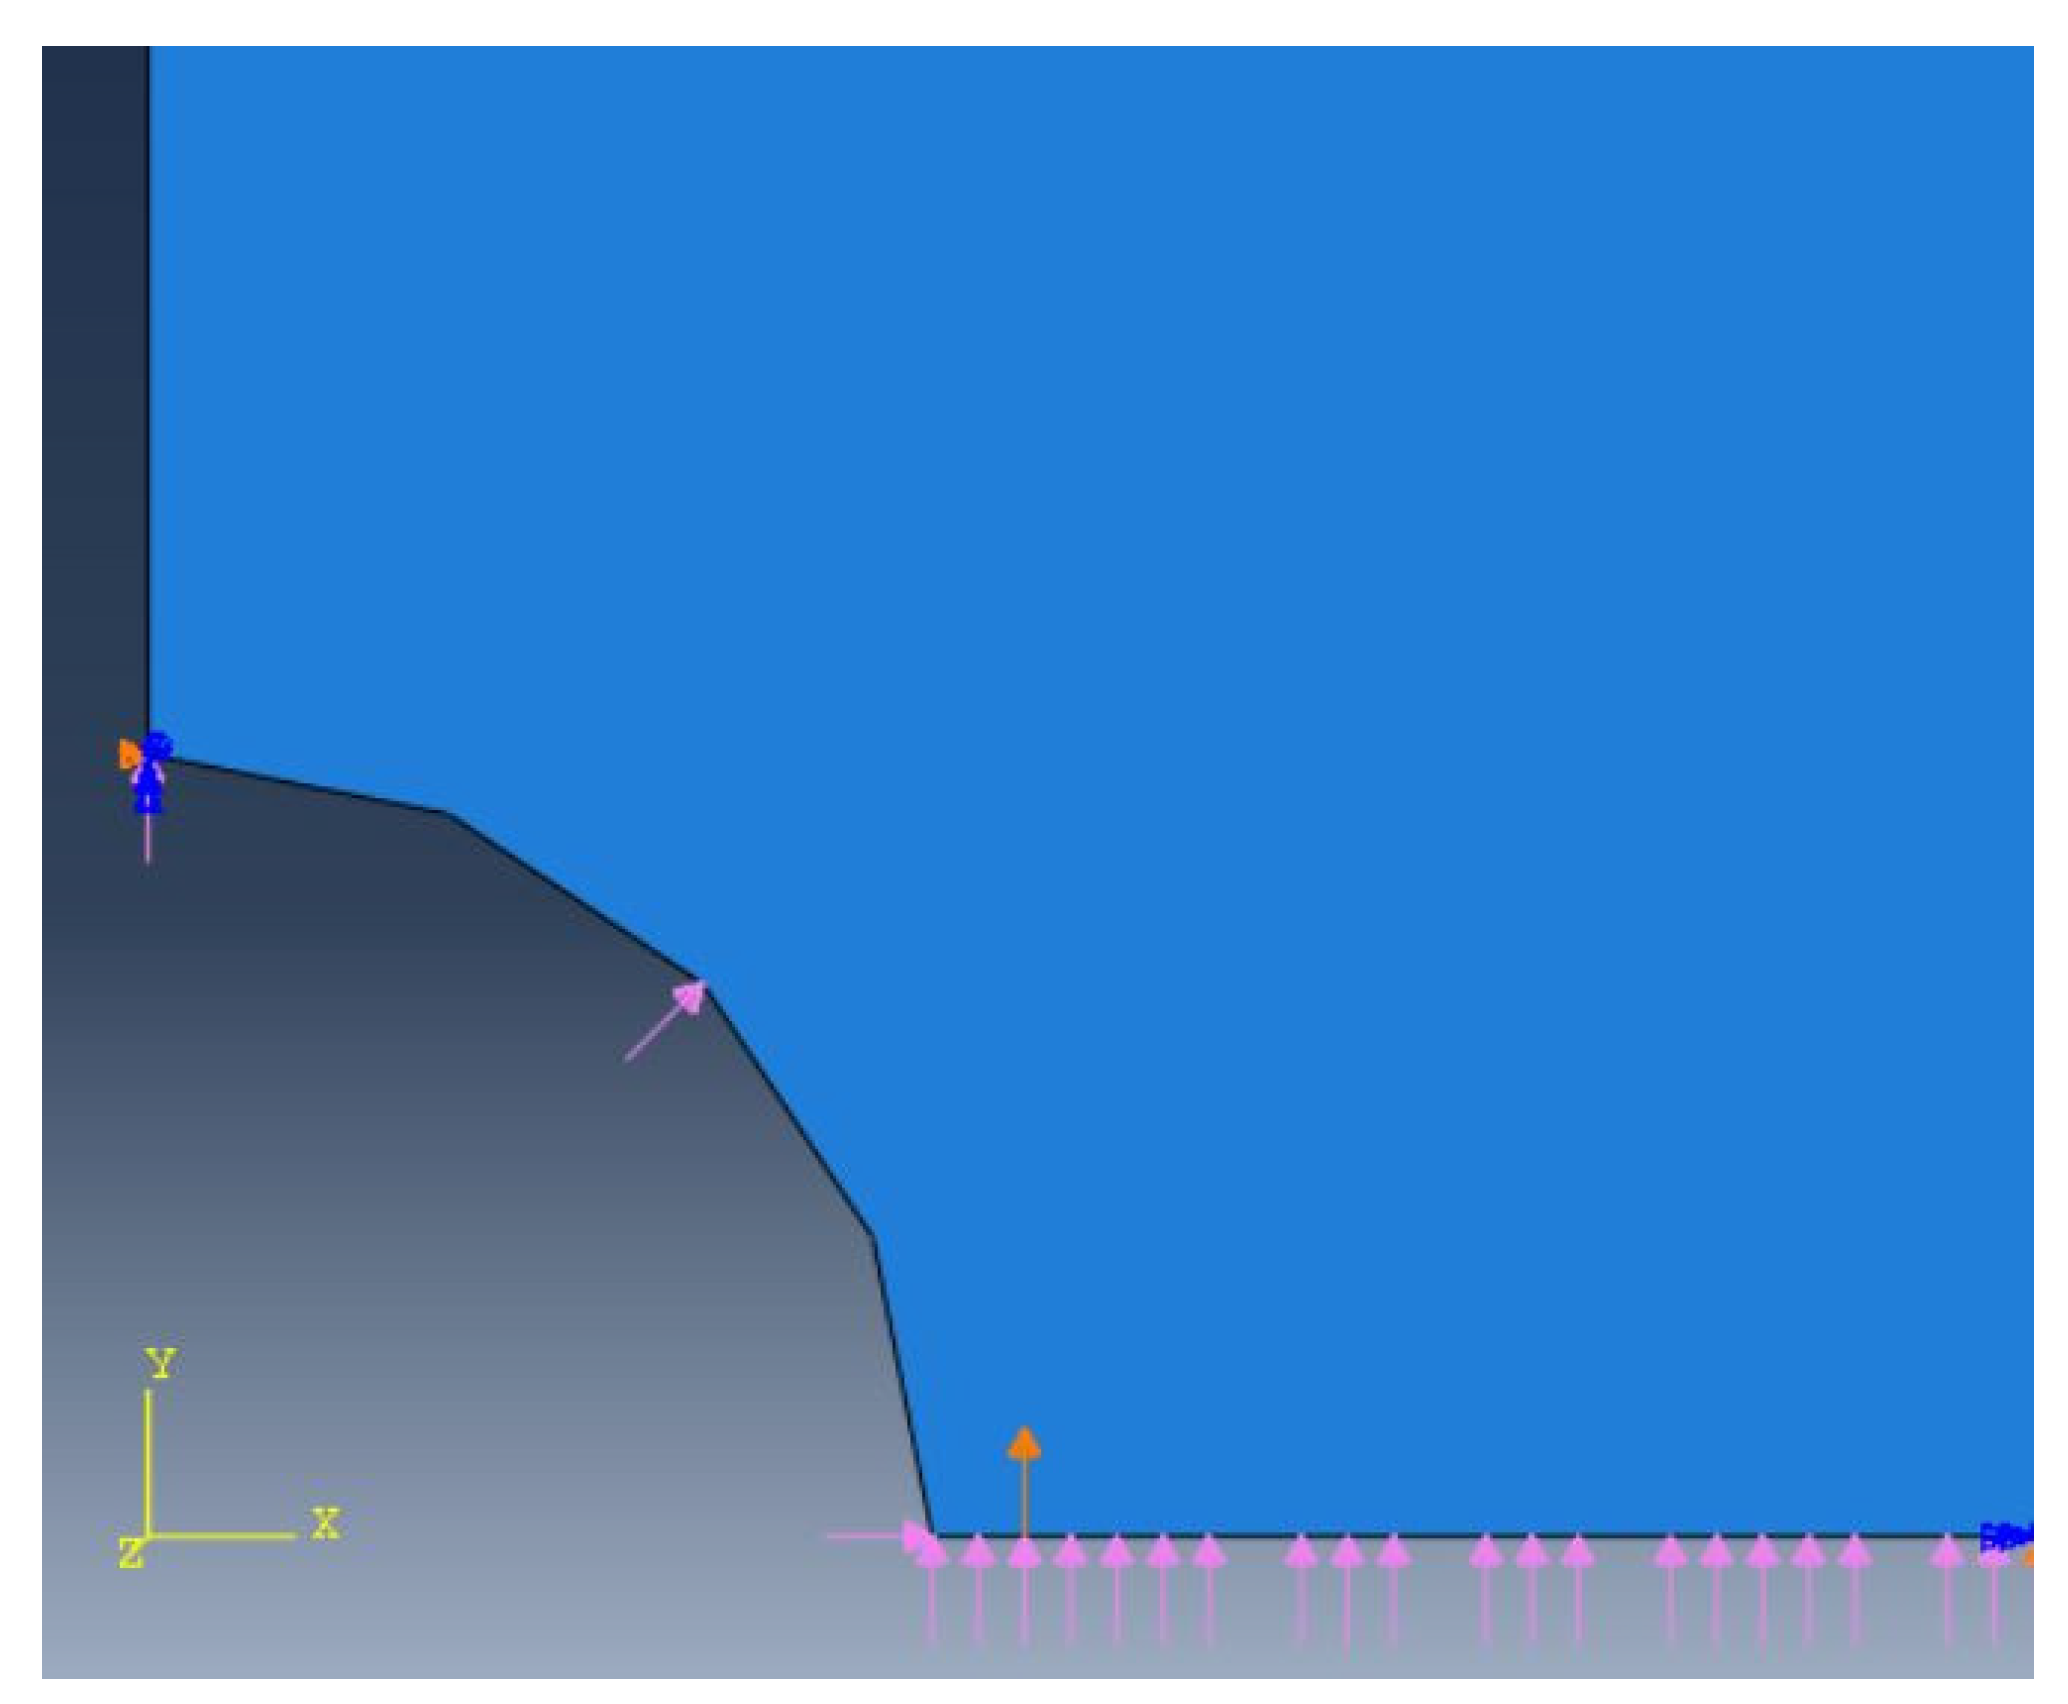
2. Materials and Methods

A key factor of stress cage investigation is to fully understand the rock behavior around the wellbore. Rocks are usually heterogeneous and anisotropic porous mediums and, hence, it is not always easy to predict their mechanical response under the influence of induced stresses. The behavior of rocks is usually defined by many controllable and uncontrollable factors, such as the magnitude and direction of in situ stresses, mechanical properties of the formation, temperature variation, etc. [30,31,32,33].
For a poro-elastic model, considering a rock as a porous medium saturated with fluids, the state of induced stresses around the borehole can be represented by the following equations [30]:
σ r = σ x + σ y 2 1 R 2 r 2 + σ x σ y 2 1 + 3 R 4 r 4 4 R 4 r 4 c o s 2 θ + σ x y 1 + 3 R 4 r 4 4 R 4 r 4 s i n 2 θ + P w R 2 r 2 α p p
σ θ = σ x + σ y 2 1 R 2 r 2 σ x σ y 2 1 + 3 R 4 r 4 c o s 2 θ σ x y 1 + 3 R 4 r 4 s i n 2 θ P w R 2 r 2 α p p
σ z z = σ z v 2 σ x σ y R 2 r 2 c o s 2 θ + 4 σ x y R 2 r 2 s i n 2 θ α P p
In the above equations, σ r , σ θ and σ zz are radial, hoop, and axial stresses, respectively. σ x , σ y , σ z , σ x y are the local stress distribution around the borehole in Cartesian coordinate. P w is the wellbore pressure, θ is the counterclockwise circumferential angle of the wellbore measured from the maximum horizontal stress direction, υ is the formation Poisson ratio, R is wellbore radius, and α is the rock Biot coefficient.
The main aim of the stress cage technology is to increase the hoop stress ( σ θ ) at the near-wellbore region to extend the fracture gradient of the formation.
The workflow of this paper is presented in Figure 1. As it can be seen from the figure, firstly the geometrical models are built. Then, the input data and boundary conditions are applied to the models. Finally, the width of the artificial fracture and hoop stress variations are determined at three stages: before creation of artificial fractures, before bridging the created artificial fractures, and after bridging the artificial fractures.
All elastic, poro-elastic, and thermo-poro-elastic models are developed with an identical geometry (Figure 2). The well is considered vertical and perpendicular to the horizontal far-field stresses of the formation. For the models presented in this research, square meshes with size of 0.1 inches are used and, finally, the model has 175,753 nodes.
The rock is considered a homogenous, isotropic, and permeable medium with linear behavior and under the influence of in situ stresses. Both horizontal in situ stresses are in the same plane and perpendicular to each other, such that the maximum horizontal stress (σH) is parallel to the x-axis and, therefore, the y-axis represents the direction of the minimum horizontal stress (σh). Considering the proposed stress geometry, it is clear that the artificial fractures will propagate parallel to the x-axis, while the direction of fracture opening will be parallel to the y-axis.
The x and y axes are fixed with respect to the geometry to keep the shape constant after the application of stresses. Figure 3 shows the direction of in situ stresses and the boundary conditions.
The fracture width in the proposed models is calculated after inserting a known wellbore pressure. The pressure is selected at 300 psi above the formation breakdown pressure. It should be noted that the fracture length is considered constant at 6 inches. Figure 4 represents the direction of applied wellbore pressures. The orange arrow in Figure 4 indicates the possible bridging location after the creation of the artificial fracture.
The parameters used in 2D models are shown in Table 1. Table 1 presents the summary of input data and boundary conditions of the proposed models. Data includes the formation of mechanical and thermal properties, regime of stresses, well geometry, and parameters related to the application of stress cage technology.
The value of formation breakdown pressure, presented in Table 1, is calculated based on the Haimson and Fairhurst analytical [34]:
P b = 3 σ h σ H P p + T 0
In the above equation, P b is formation breakdown pressure, σ H is the maximum horizontal stress, σ h is the minimum horizontal stress, and T 0 is the rock tensile strength. The tensile strengths of the rocks usually are much smaller than their compressive strengths and, therefore, can be neglected in the calculations.
For validation of the hoop stress value, obtained from numerical models, the following equation, based on the Kirsch and Mirabbasi analytical models, is selected for hoop stress calculation at the wellbore wall. This equation is valid before inducing the artificial fractures [15,35].
σ θ = σ H + σ h P w 2 σ H σ h c o s 2 θ 4 τ x y s i n 2 θ P p + σ T
In the above equation, τ x y is shear stress and σ T is the induced stress due to the temperature difference between the formation and well. σ T can be calculated as follows [15,35]:
σ T = α T E T m u d T f 1 υ
where α T is the formation thermal expansion coefficient, E is the formation Young modulus, T mud is the mud temperature, and T f is the formation temperature.
For simplicity of calculations, the T xy is neglected. Additionally, it should be noted that the pore pressure expression ( P p ) is not considered in the elastic model. The effect of σ T , as the thermal stress, is only determined in the thermo-poro-elastic model. Considering this modification, the output of Equation (5), is compared to the numerical model output before the creation of induced fratures.
To validate the fracture width values of the elastic and poro-elastic models, the analytical solution of Alberty and McLean is used [14]:
W x = 4 1 υ 2 E ( p w σ h ) L + R 2 x 2
where W(x) is the width of the fracture at x distance from the fracture aperture, L is fracture length, and x is the investigation radius.
In the case of thermo-poro-elastic model, Yao modified Equation (7) for fracture width calculation as follows [10,14]:
W x = 4 1 υ 2 E ( p w σ h ) L + R 2 x 2 + 2 λ Δ T 1 υ L R 2 x 2
In the above equation, λ is the formation linear thermal expansion coefficient and Δ T is the temperature difference between drilling fluid and formation.

3. Results and Discussions

For all three models (elastic, poro-elastic, and thermo-poro-elastic), hoop stresses at the wellbore wall were calculated in three stages: before creating the fracture, after creating the fracture, and after bridging the fracture.
Figure 5, Figure 6 and Figure 7 show the hoop stress values at the wellbore wall, before creating the artificial fractures. The result of analytical models is also presented for validation.
As it can be implied by the figures, the hoop stress, obtained from numerical models is in good agreement with the analytical model output. Therefore, the quality of the built numerical model can be approved for further investigations. Additionally, it is evident from the figures that the maximum hoop stress is anticipated at ϴ angles of 90 degrees.
After the application of required wellbore pressure, the artificial fractures are created. However, they are not still bridged. Figure 8 shows the hoop stress values for the elastic, poro-elastic, and thermo-poro-elastic models.
As can be seen from the figure, due to the consideration of pore pressure in the poro-elastic and thermo-poro-elastic models, the hoop stress value is less than its value for the elastic model.
Since the temperature difference between the drilling fluid and the formation is not significant, there is a slight difference between the hoop stress values of poro-elastic and thermo-poro-elastic model.
Figure 9 represents the hoop stress variation for the elastic model after bridging the created fracture. The bridge location is selected at 0.5, 1, 2, and 3 inches from the fracture aperture to see the effect of bridge location on the effectiveness of stress cage technology. The cases for poro-elastic and thermo-poro-elastic models are presented in Figure 10 and Figure 11.
Results show that the maximum hoop stress is anticipated at the bridging location of 0.5 inches. Therefore, it can be concluded that the closer the bridging location to the fracture aperture, the more effective stress cage technology. This result is in agreement with previous studies [23,26].
Figure 12 shows the hoop stress at three stages (before fracturing, after fracturing, and after bridging the fracture). Results confirm the application of stress cage technology in hoop stress increase.
The half-width of the fracture in the pre-bridge and after-bridge conditions is investigated in this section. Figure 13 shows the fracture half-width for analytical models and each of the three numerical models before the bridging.
The results show that almost all three models predict the same profile of fracture width.
After the fracture is bridged, different geometries of the fracture are formed depending on the location of the bridge. Figure 14 shows the fracture width profile for four bridging locations along the fracture length.
Figure 14 shows the fracture geometry in each model separately. It can be seen that the area under the fracture profile decreases as the bridge location becomes closer to the fracture aperture. The maximum fracture opening in each of the three numerical models is seen in the bridge location of 3 inches from the fracture aperture and in contrast, the minimum fracture opening is seen at the bridge location of 0.5 inches.

4. Conclusions

Based on the presented results, the following conclusions can be made:
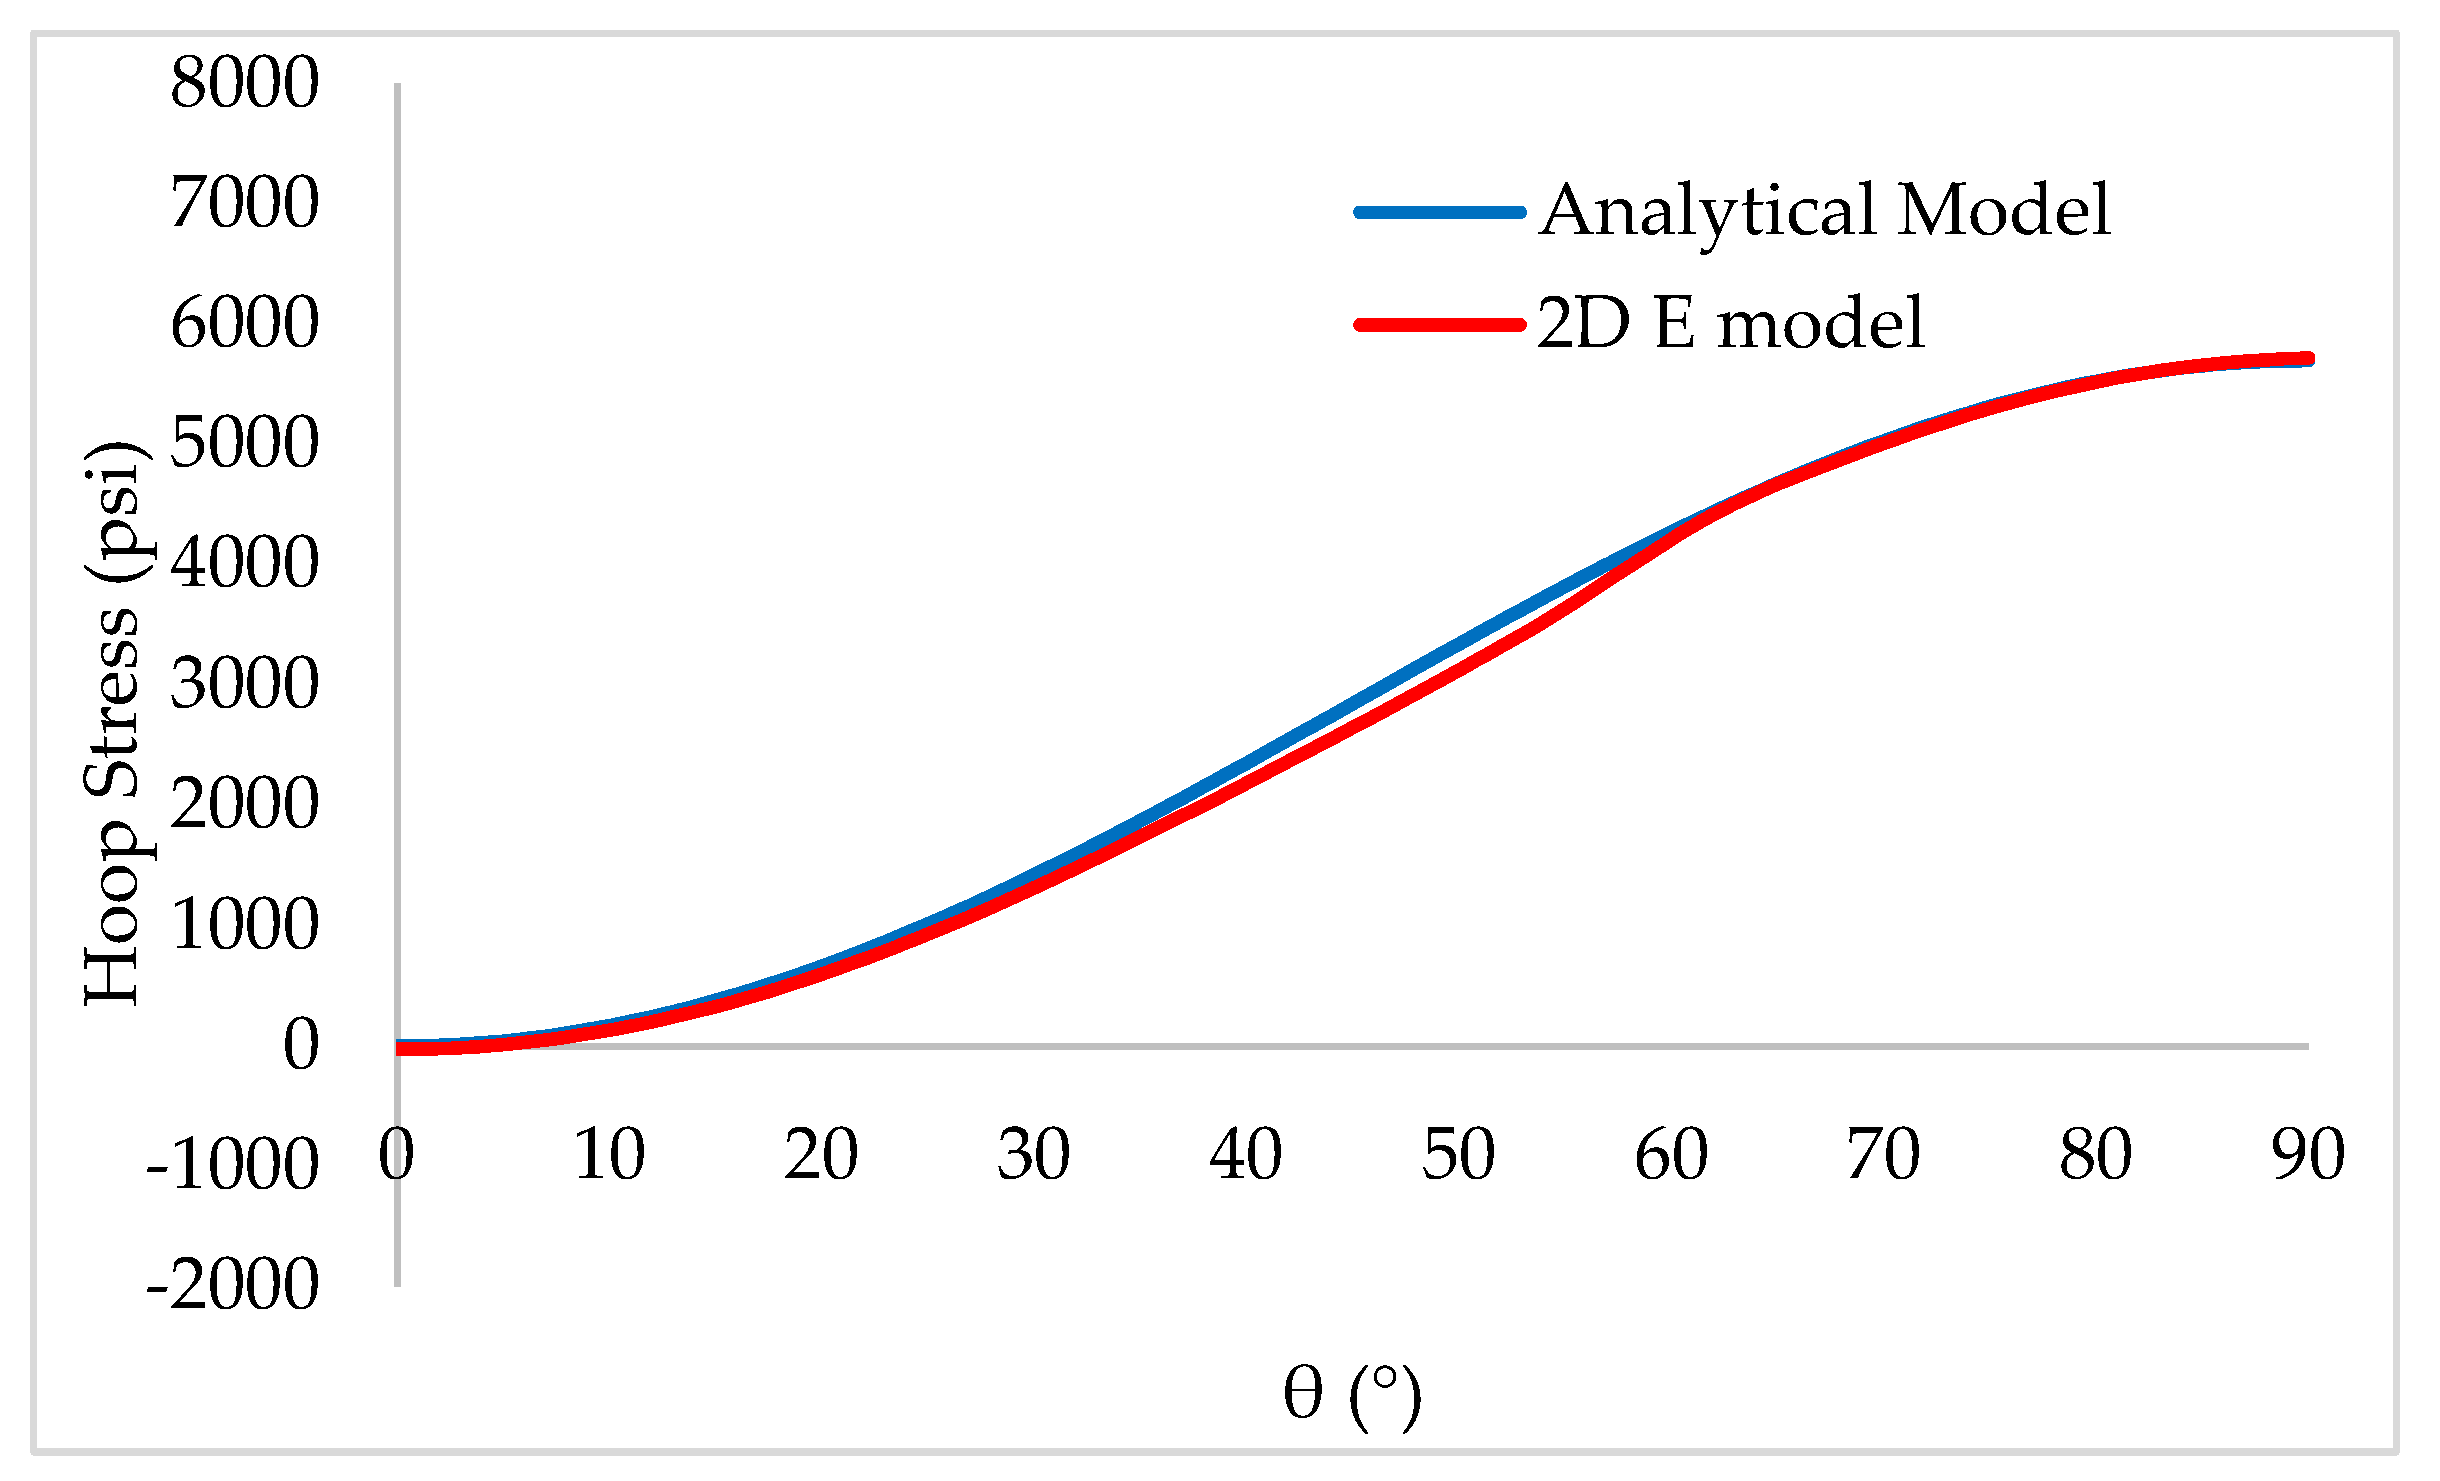
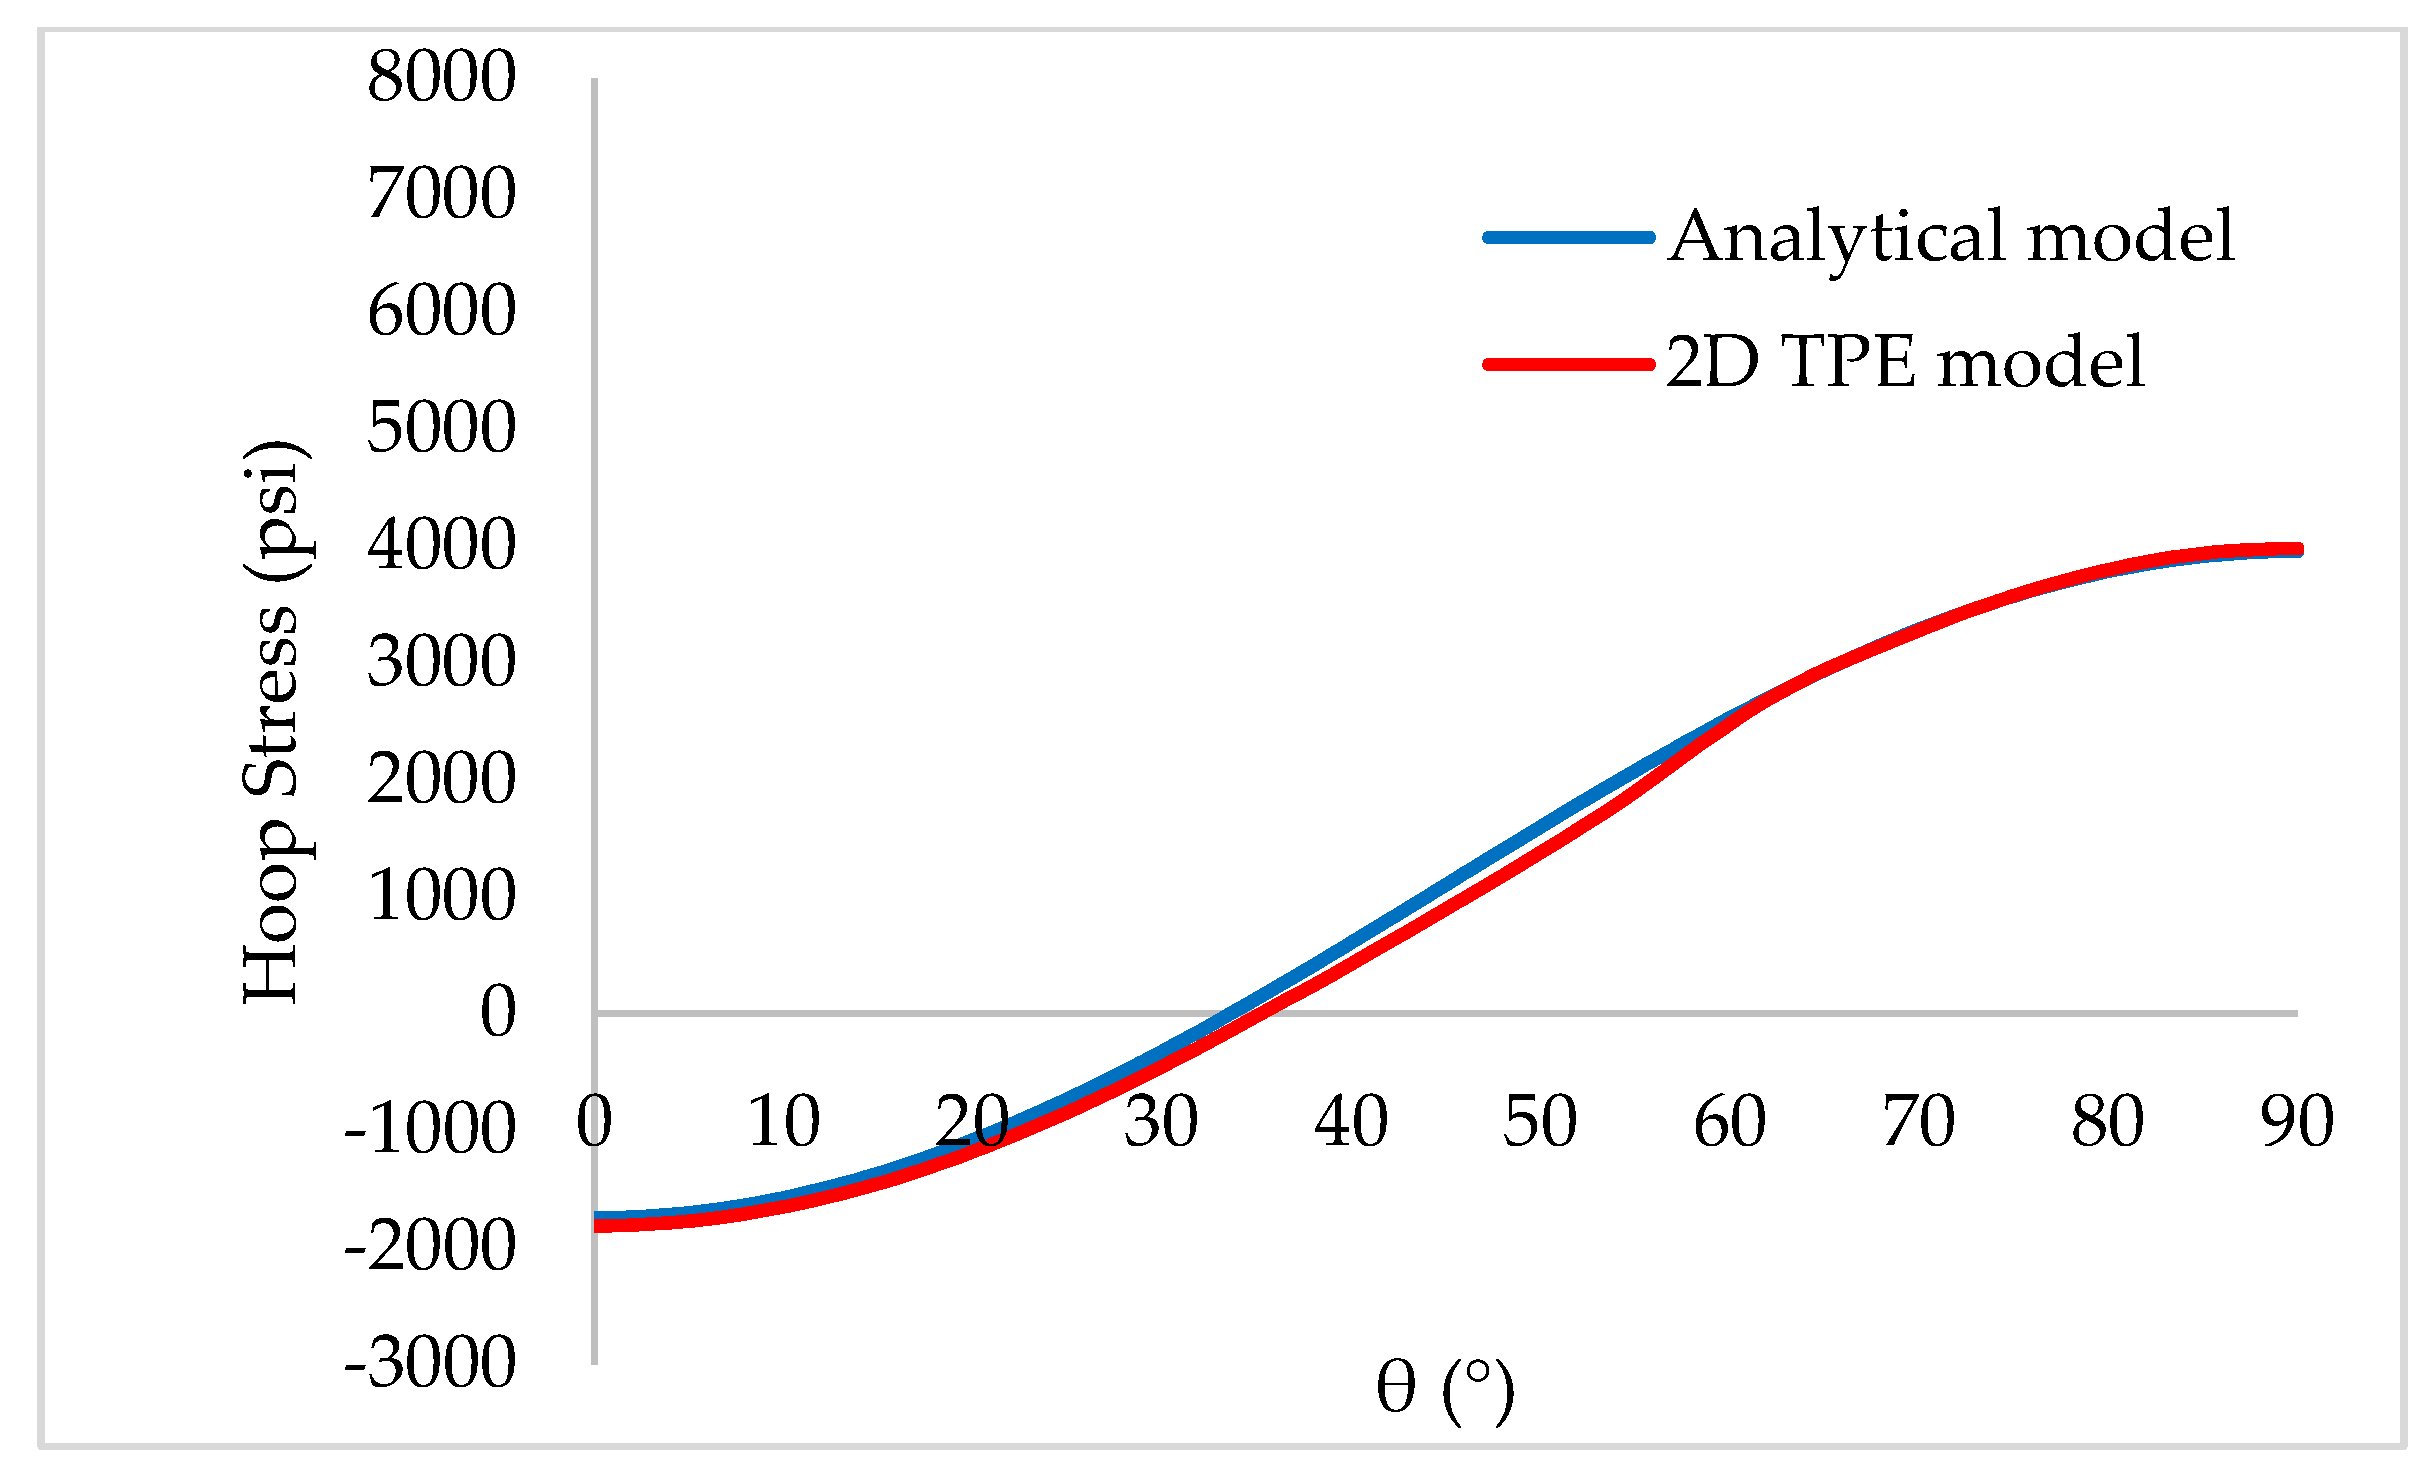
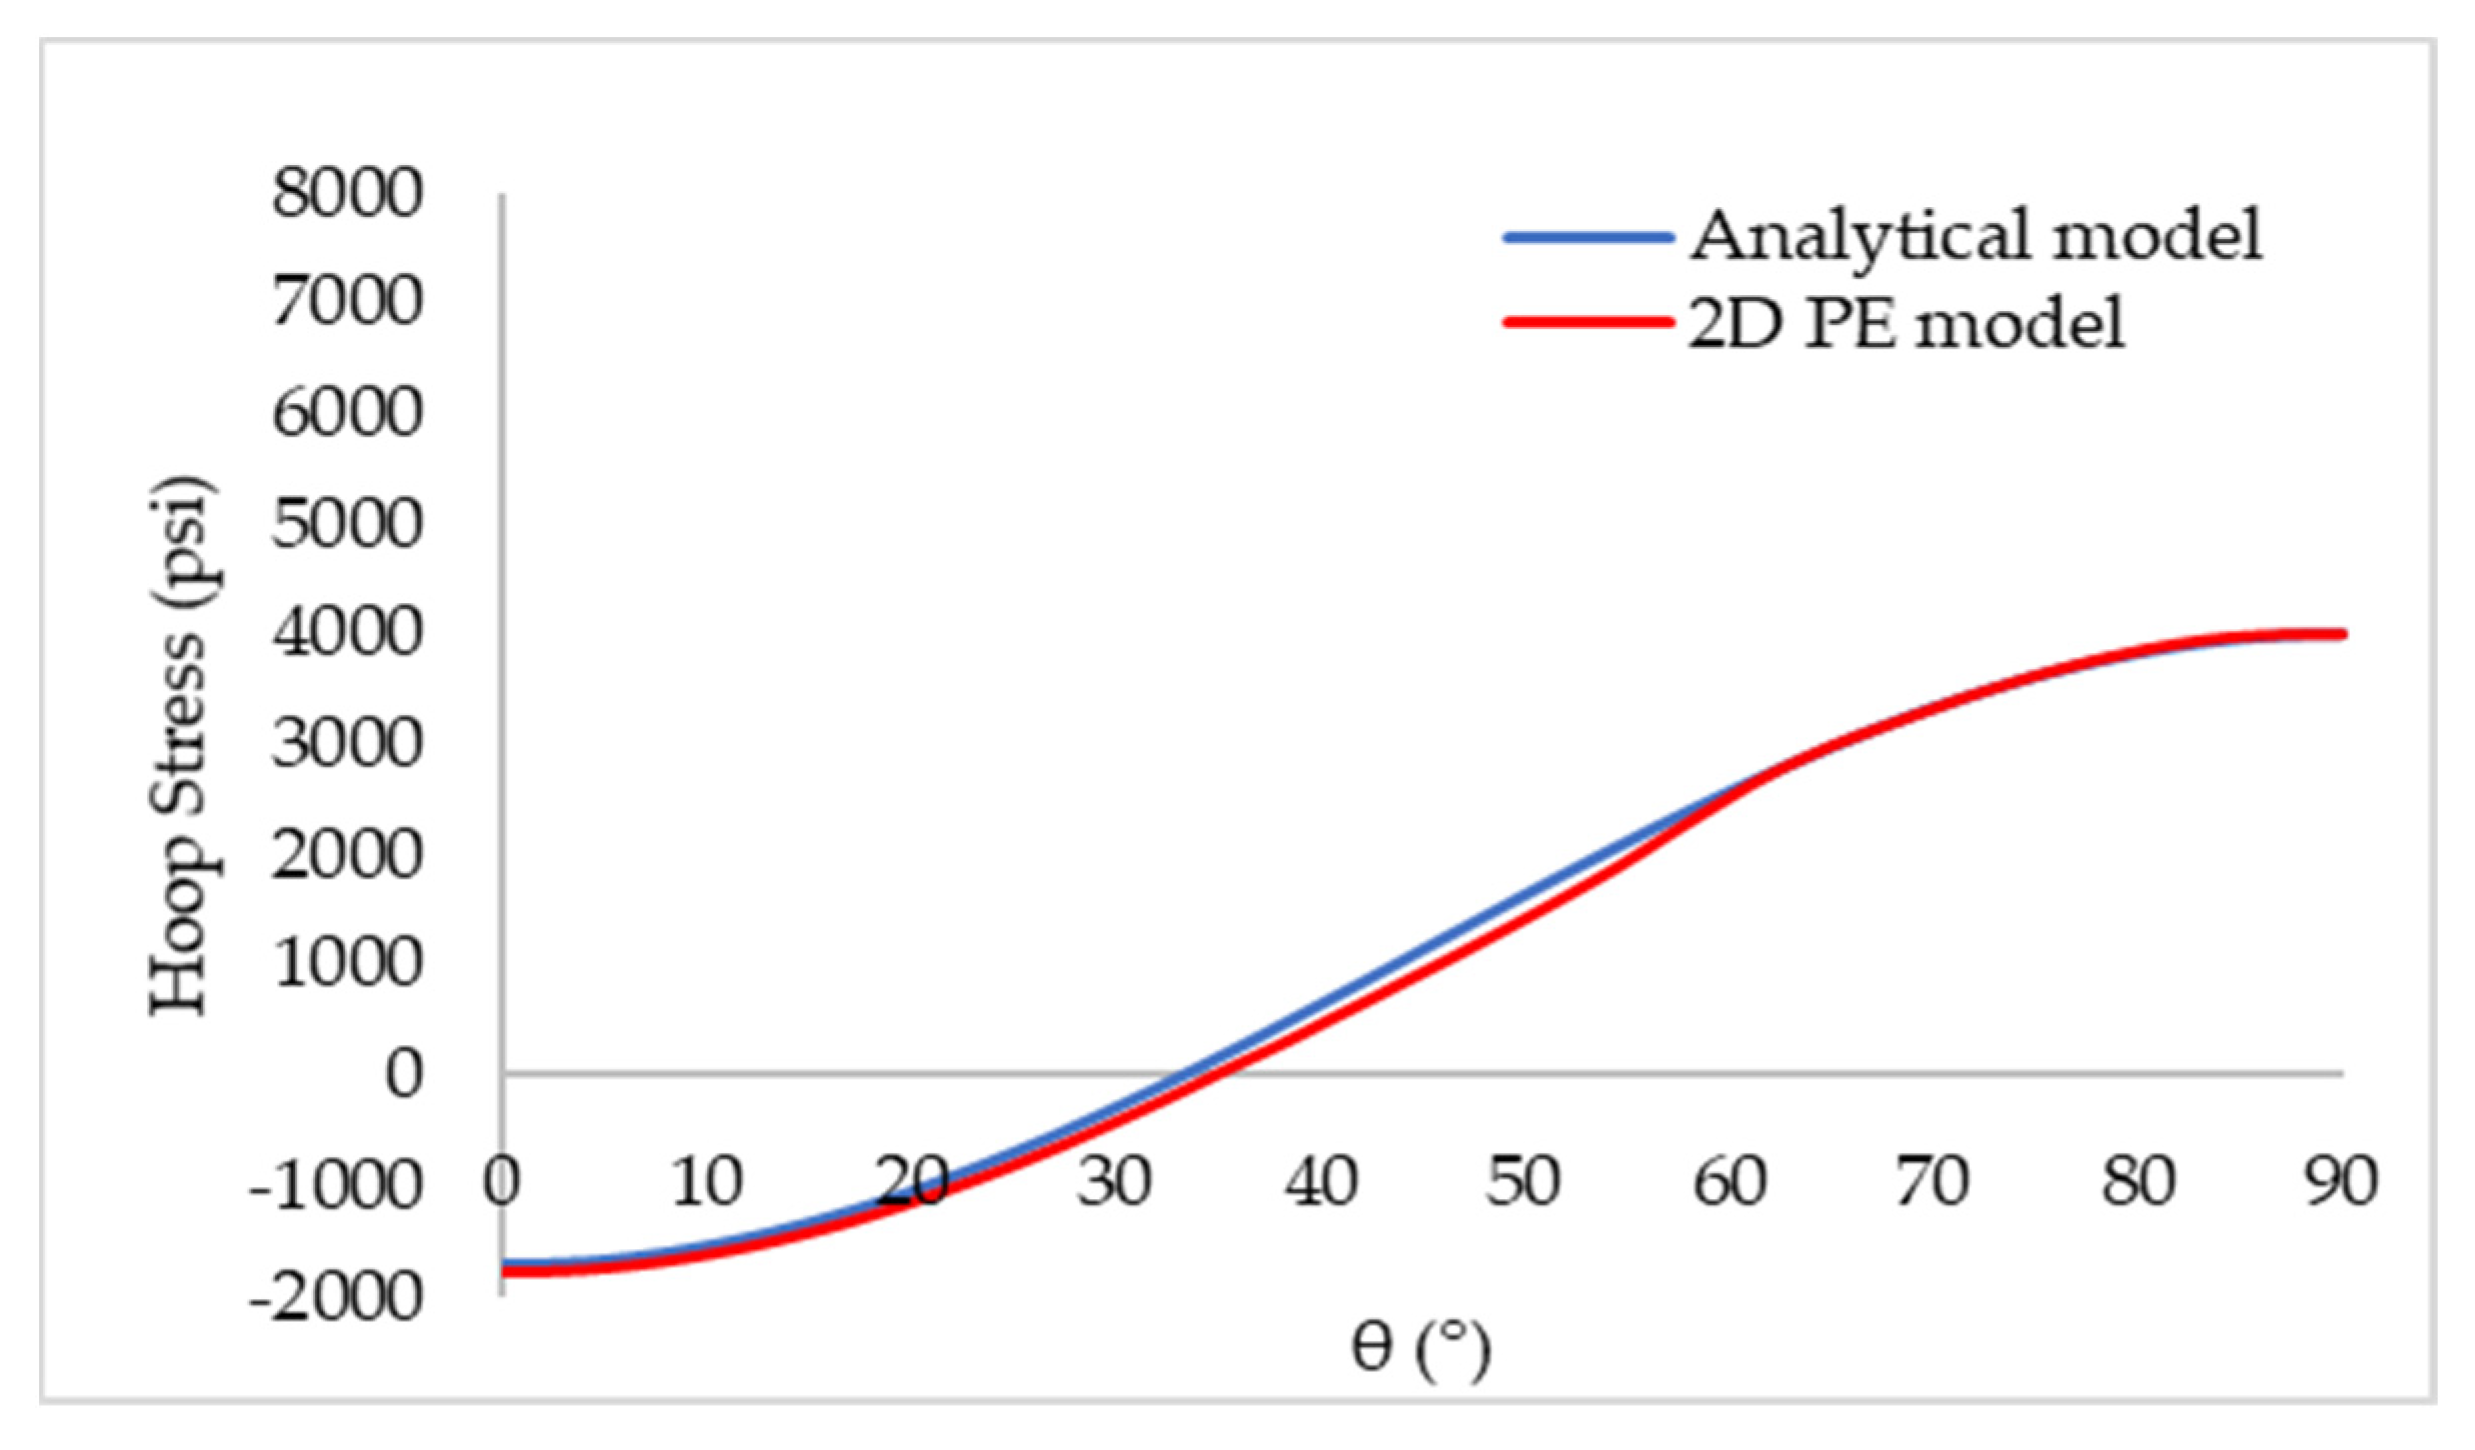
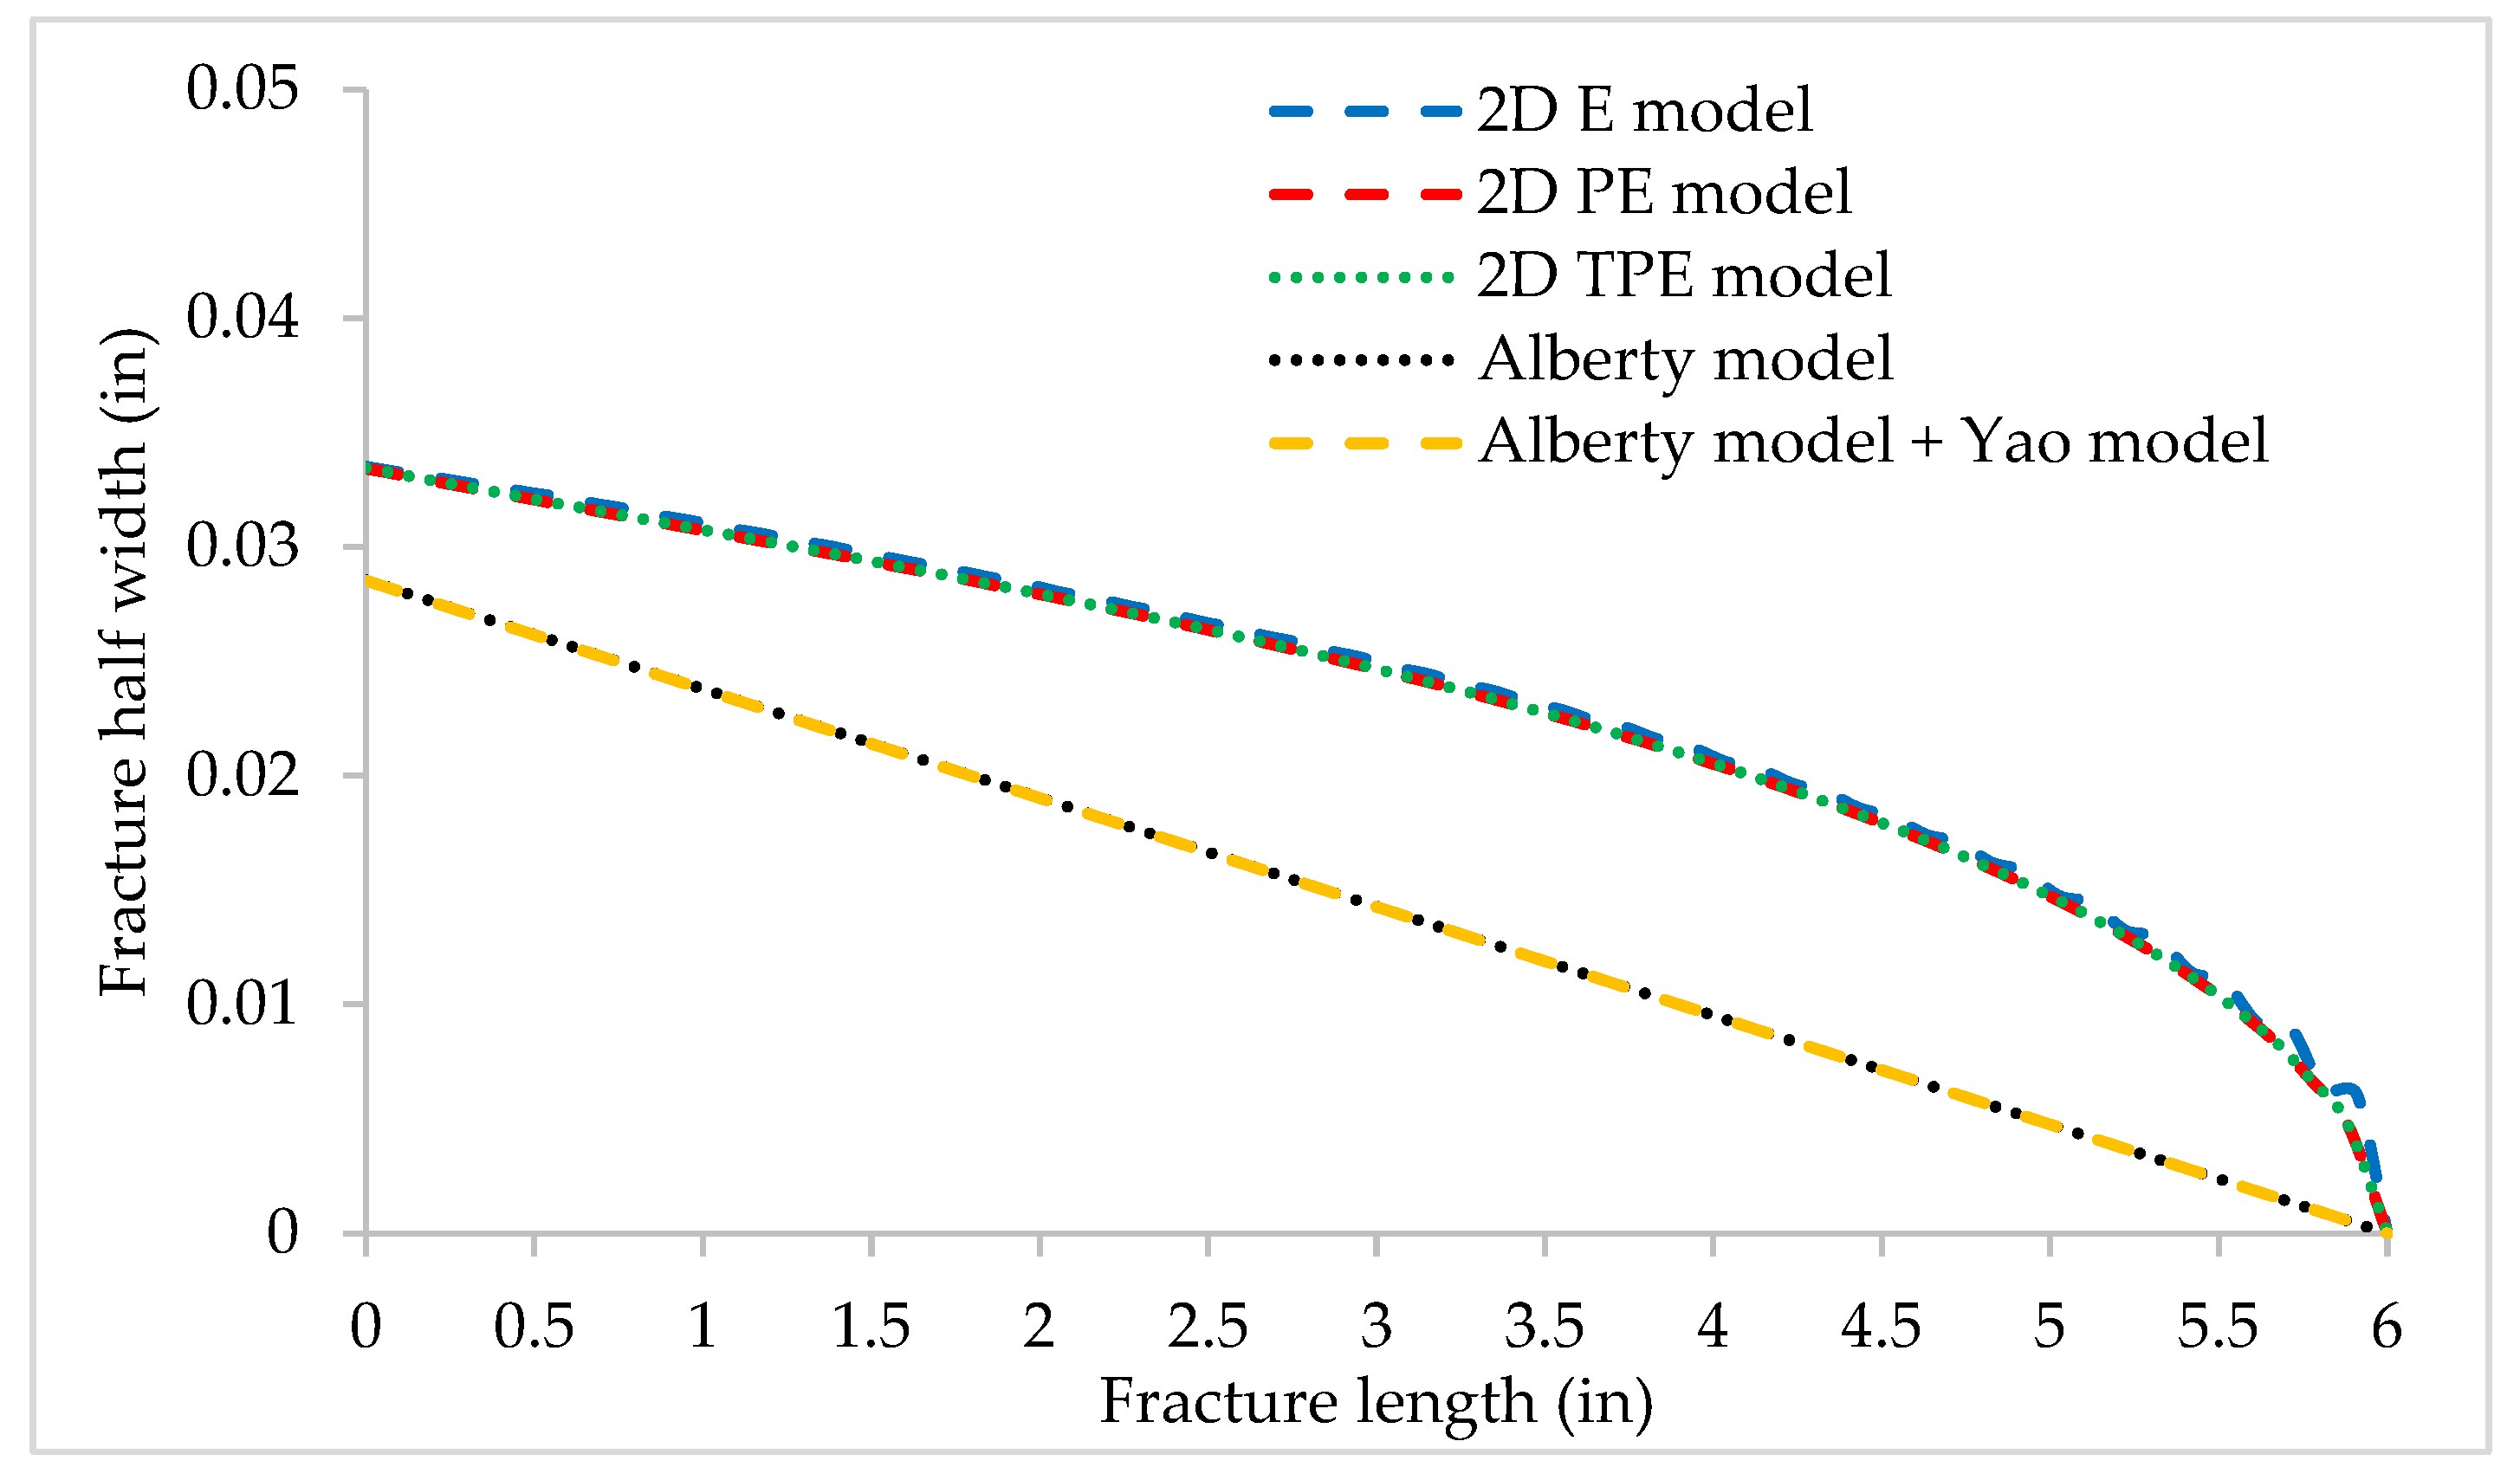
  • The built numerical models are in a good agreement with known analytical models;
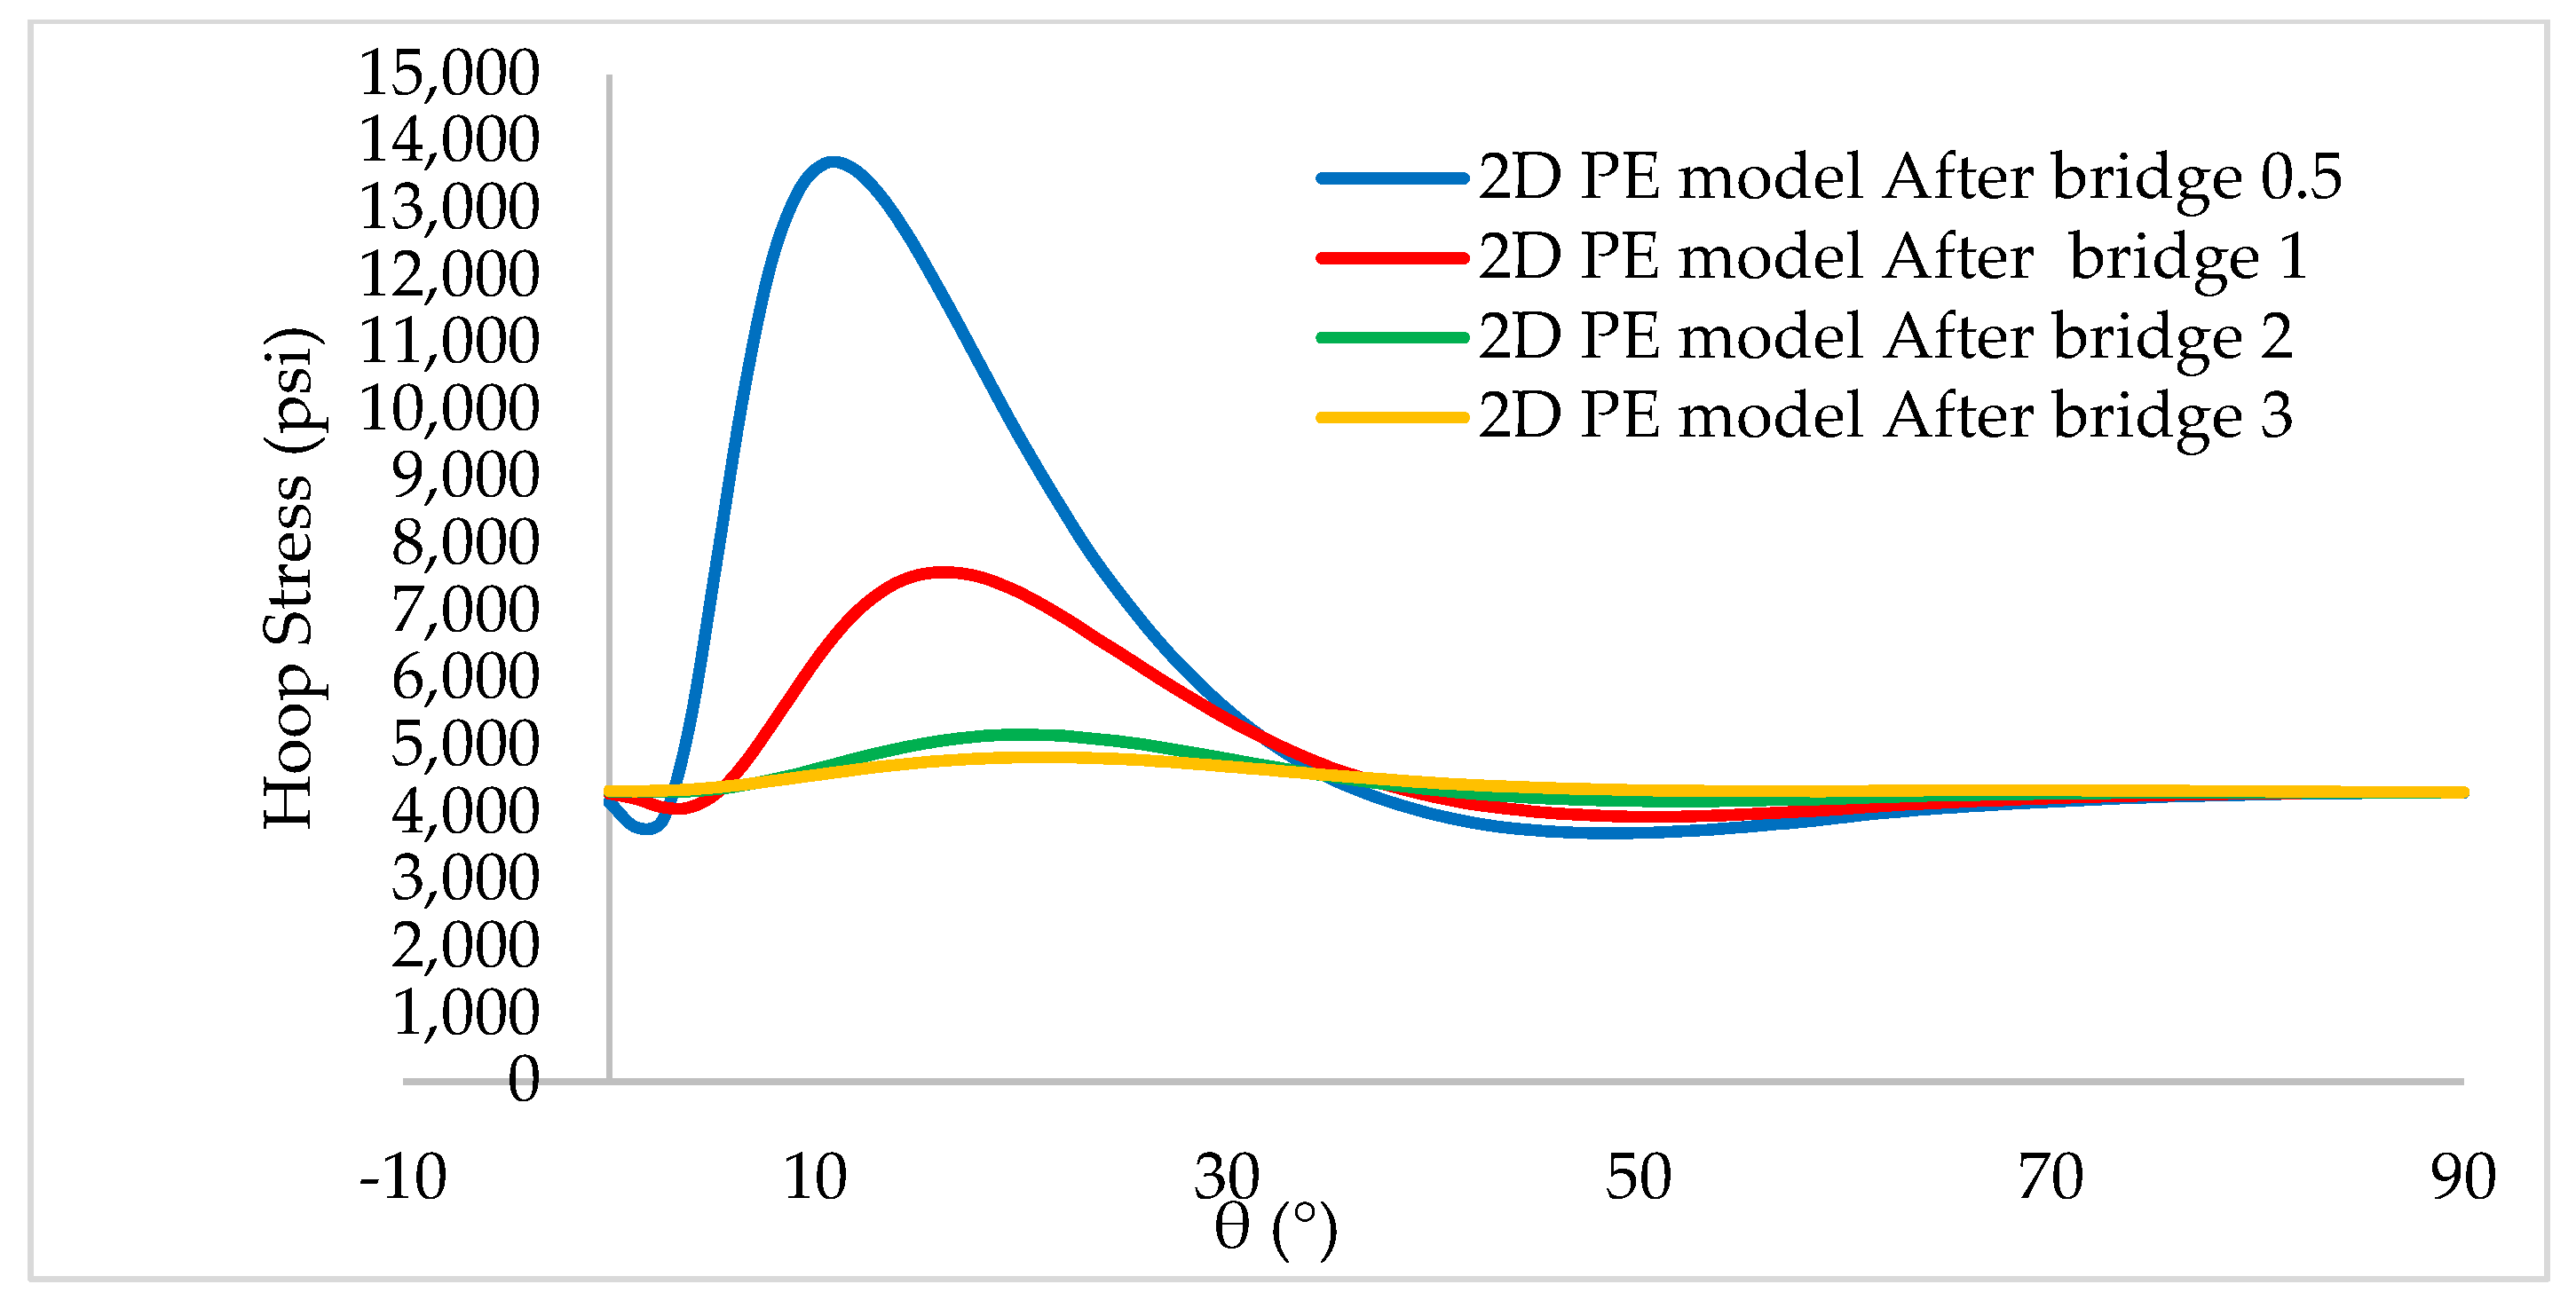
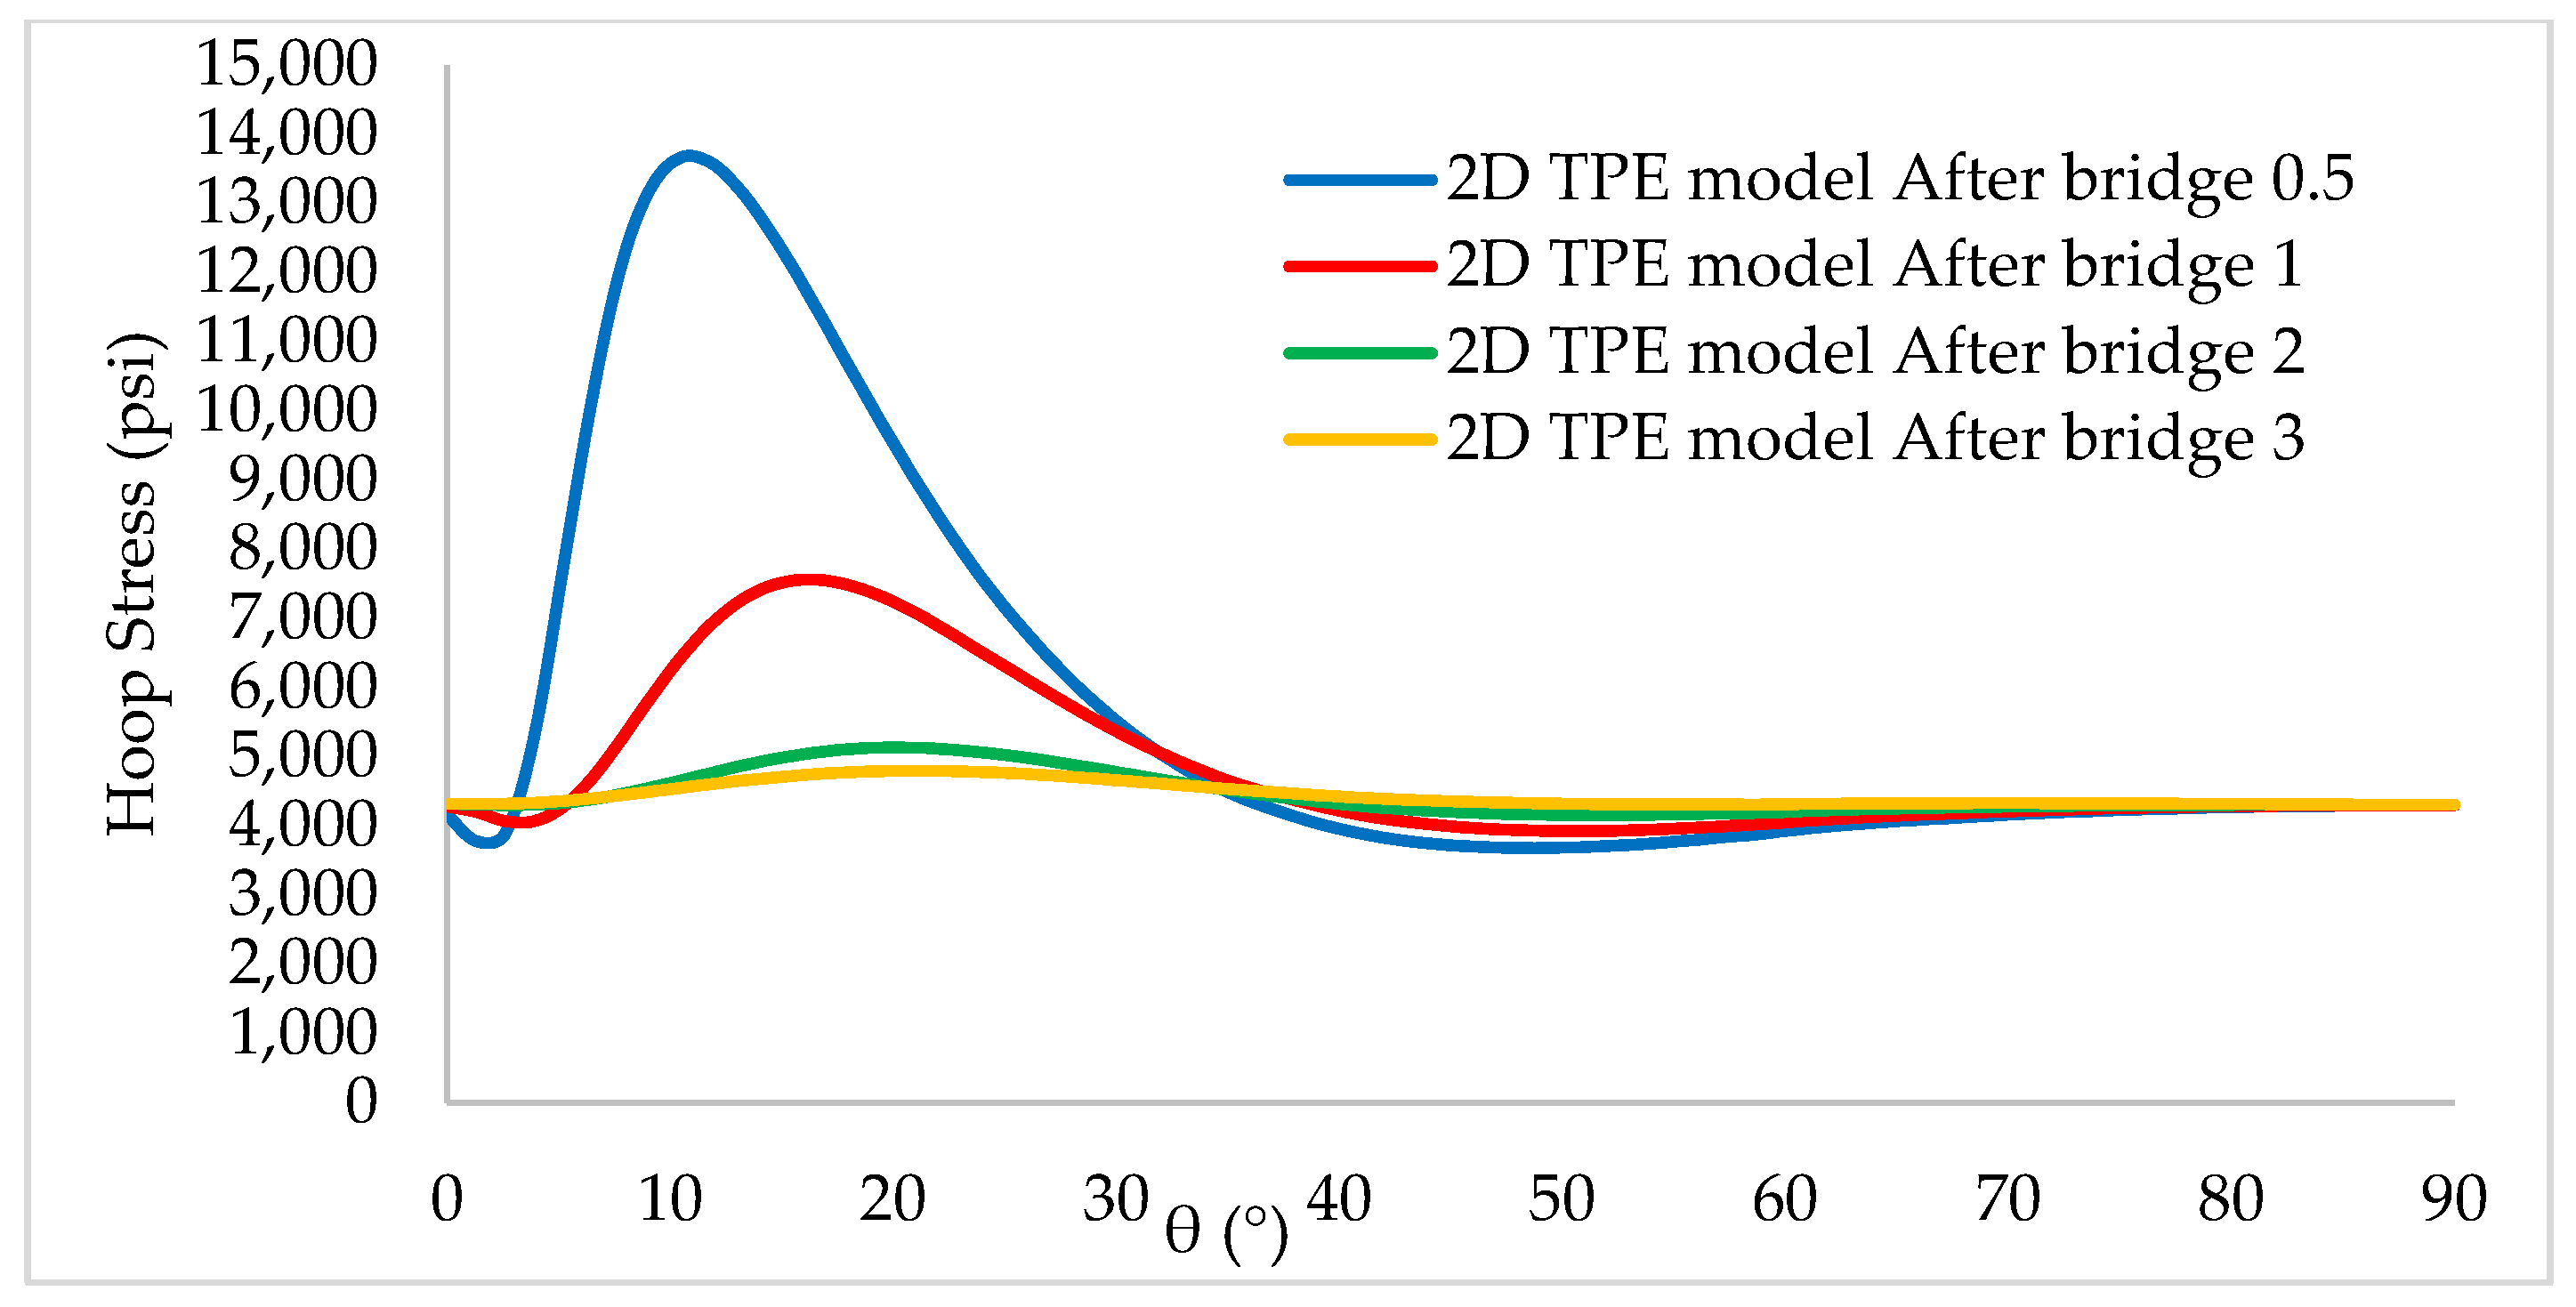
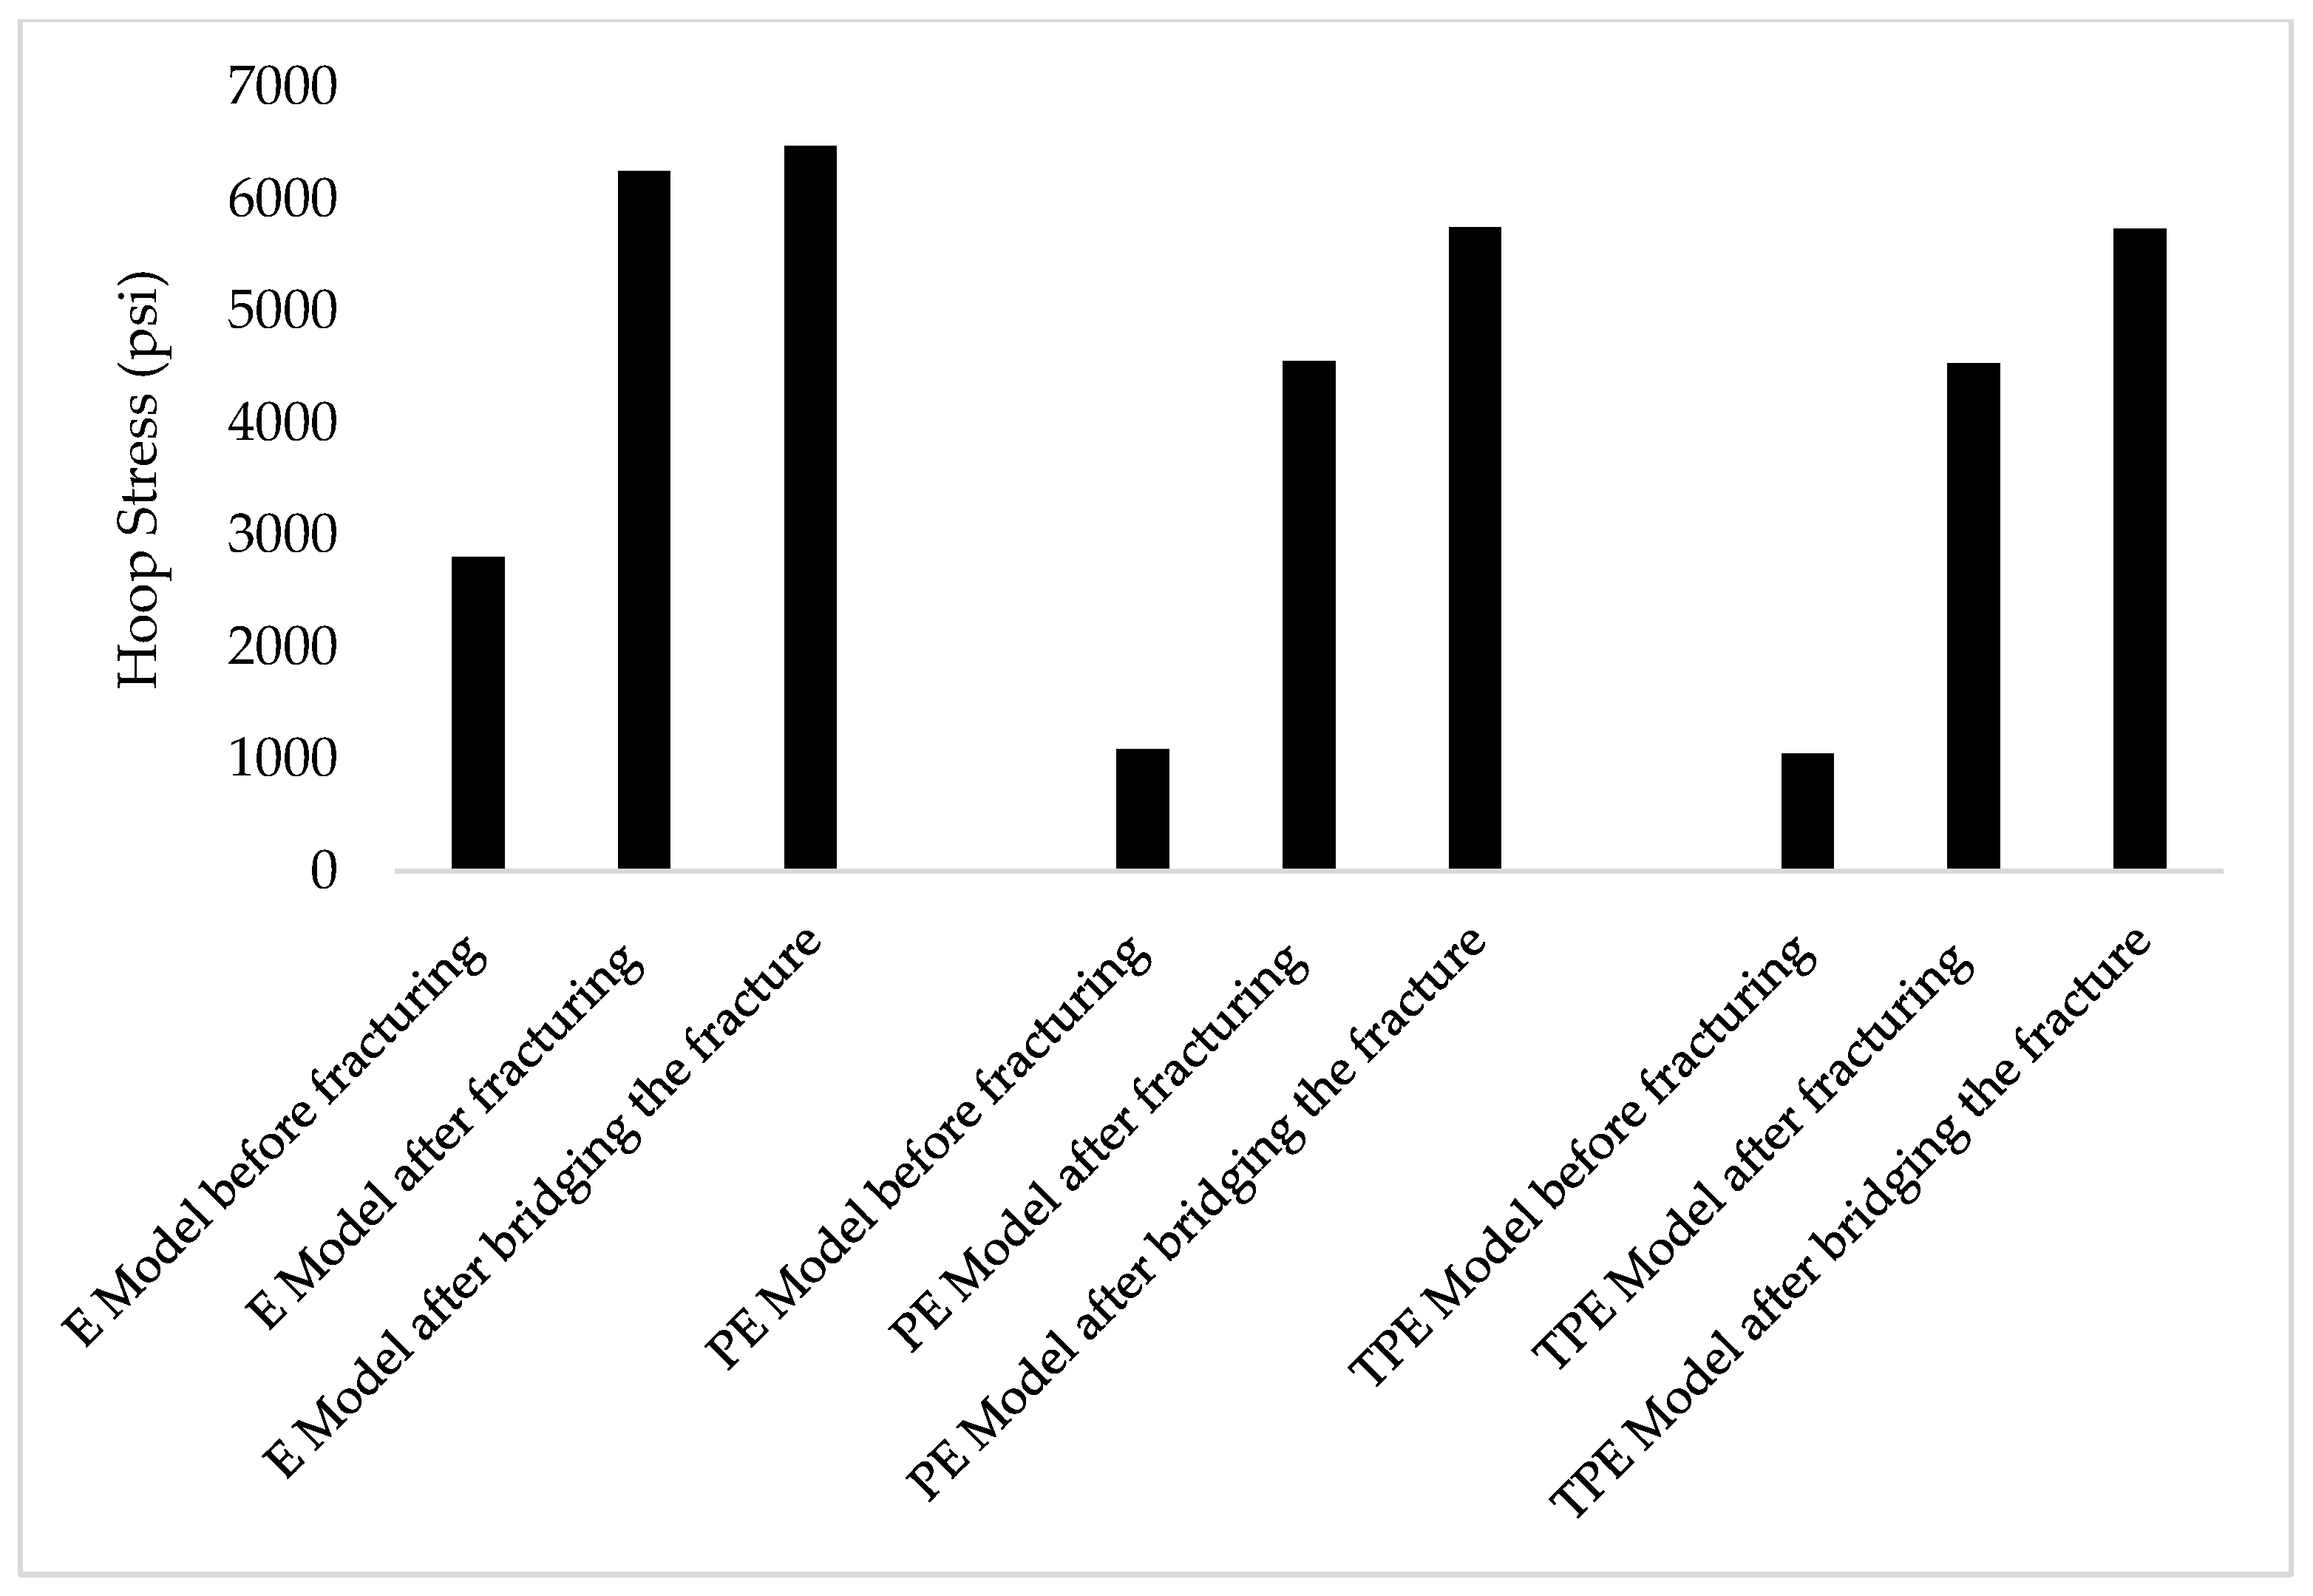
  • The maximum hoop stress at three stages (before fracturing, after fracturing, and after bridging) was observed at different circumferential angles. This is due to the change in stress states around the borehole;
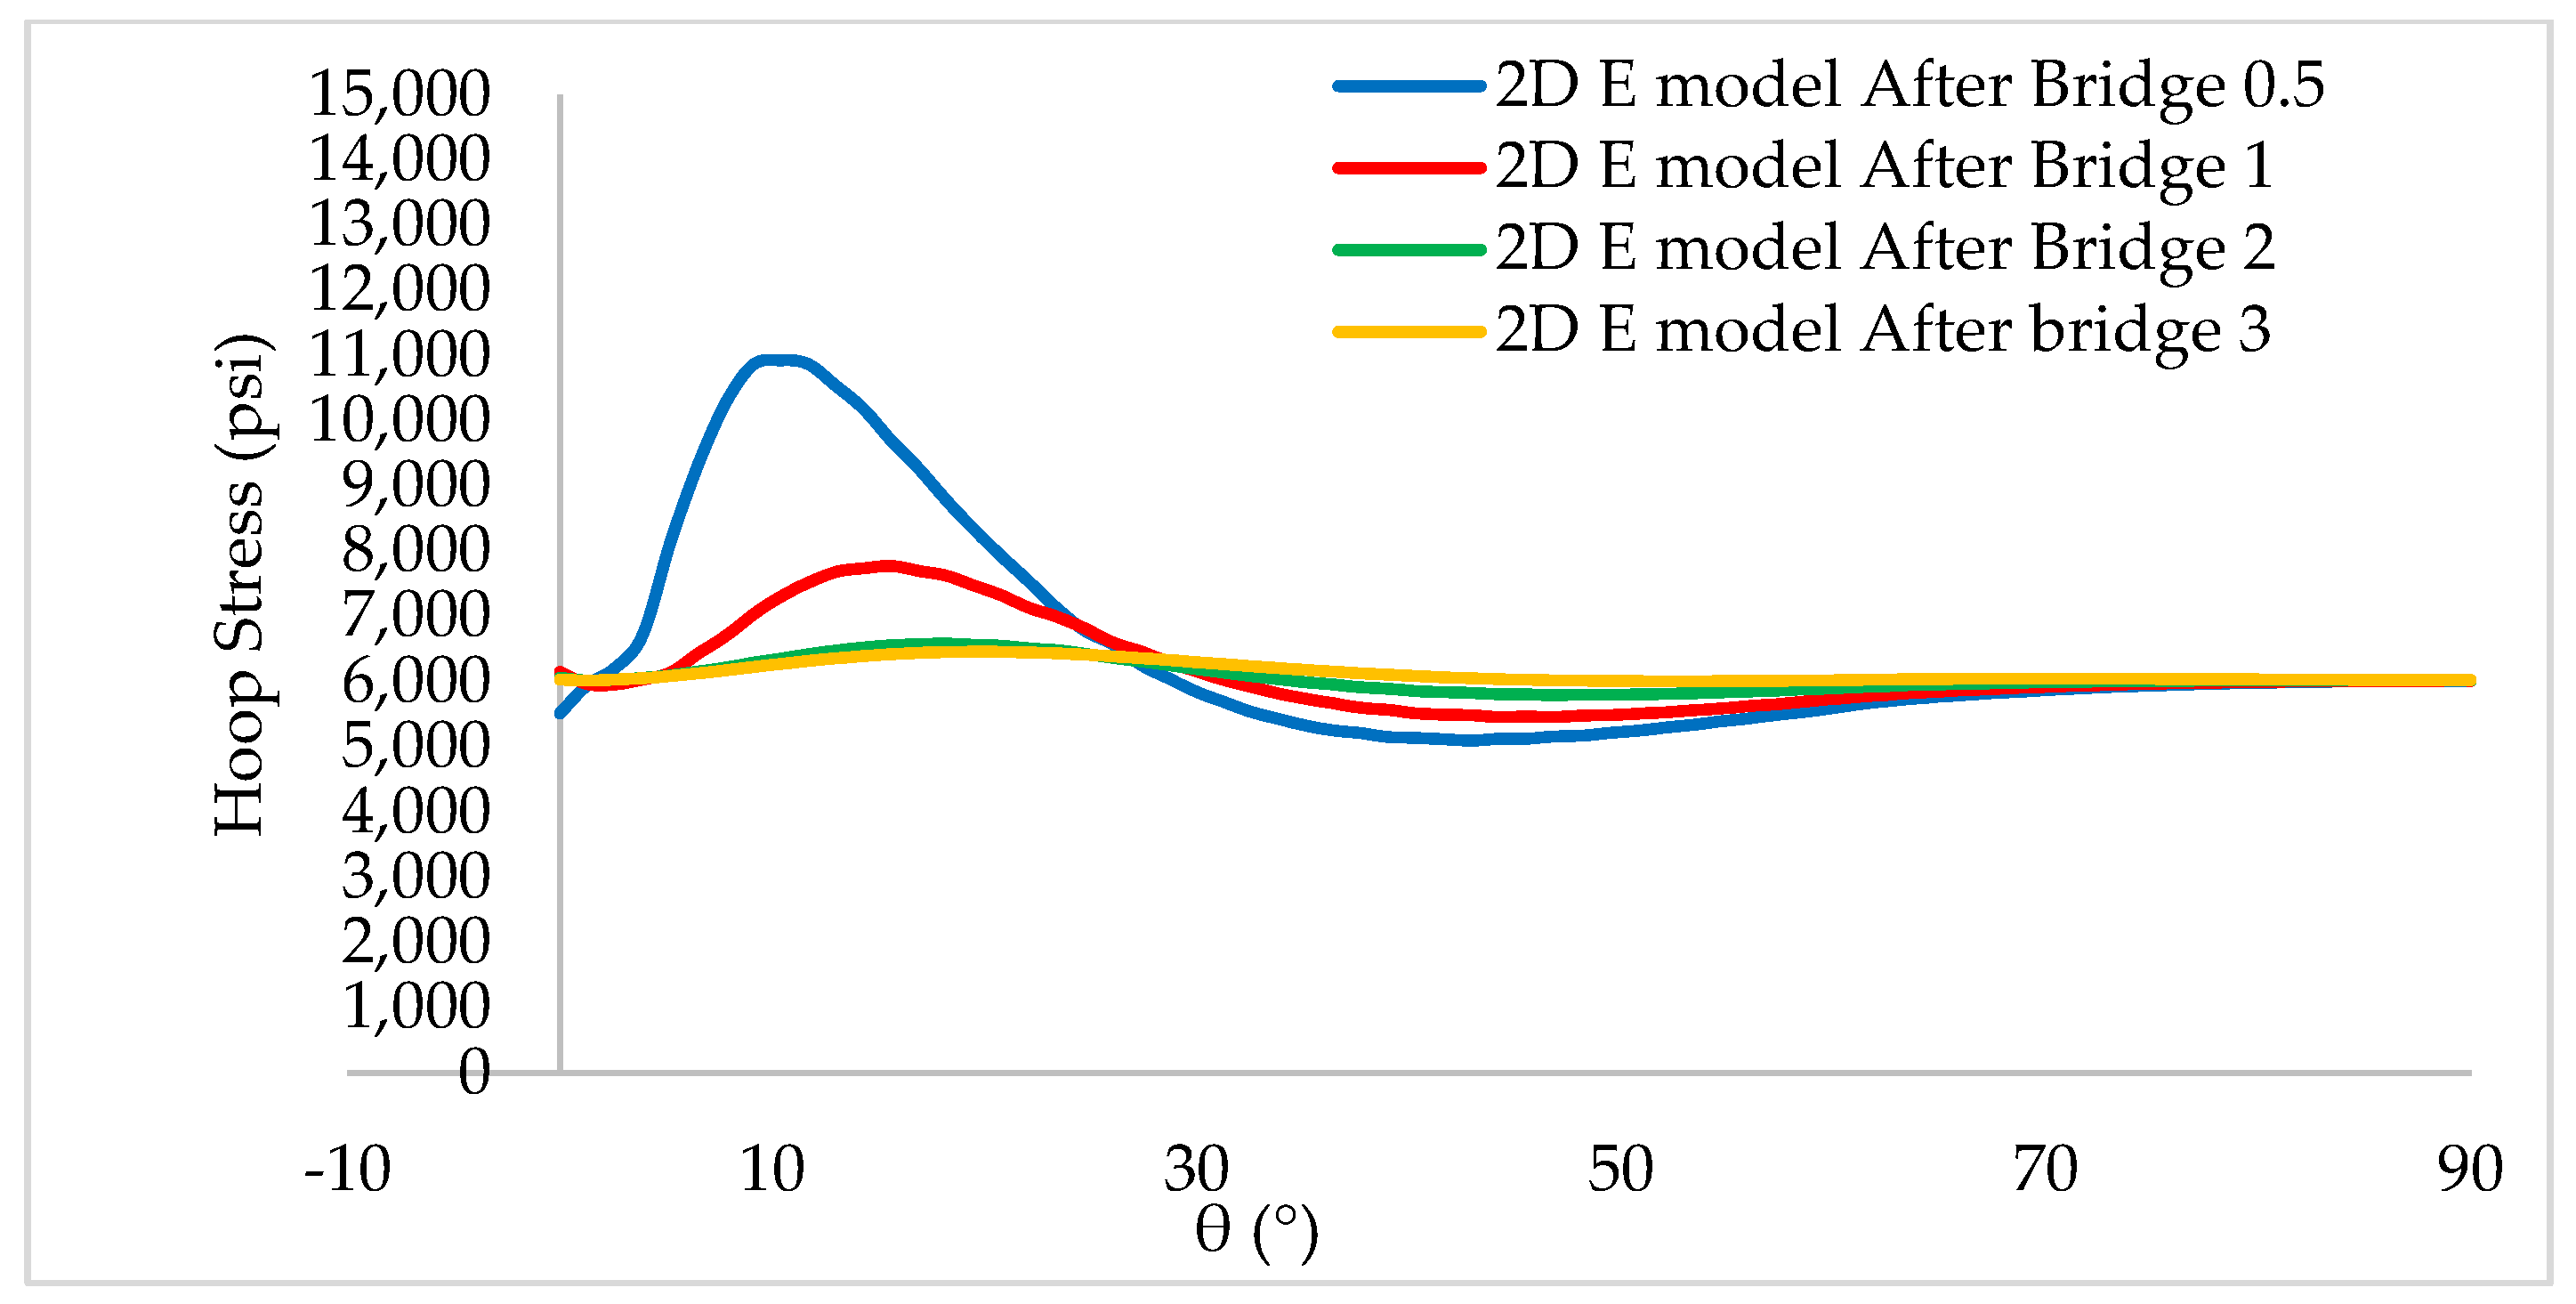
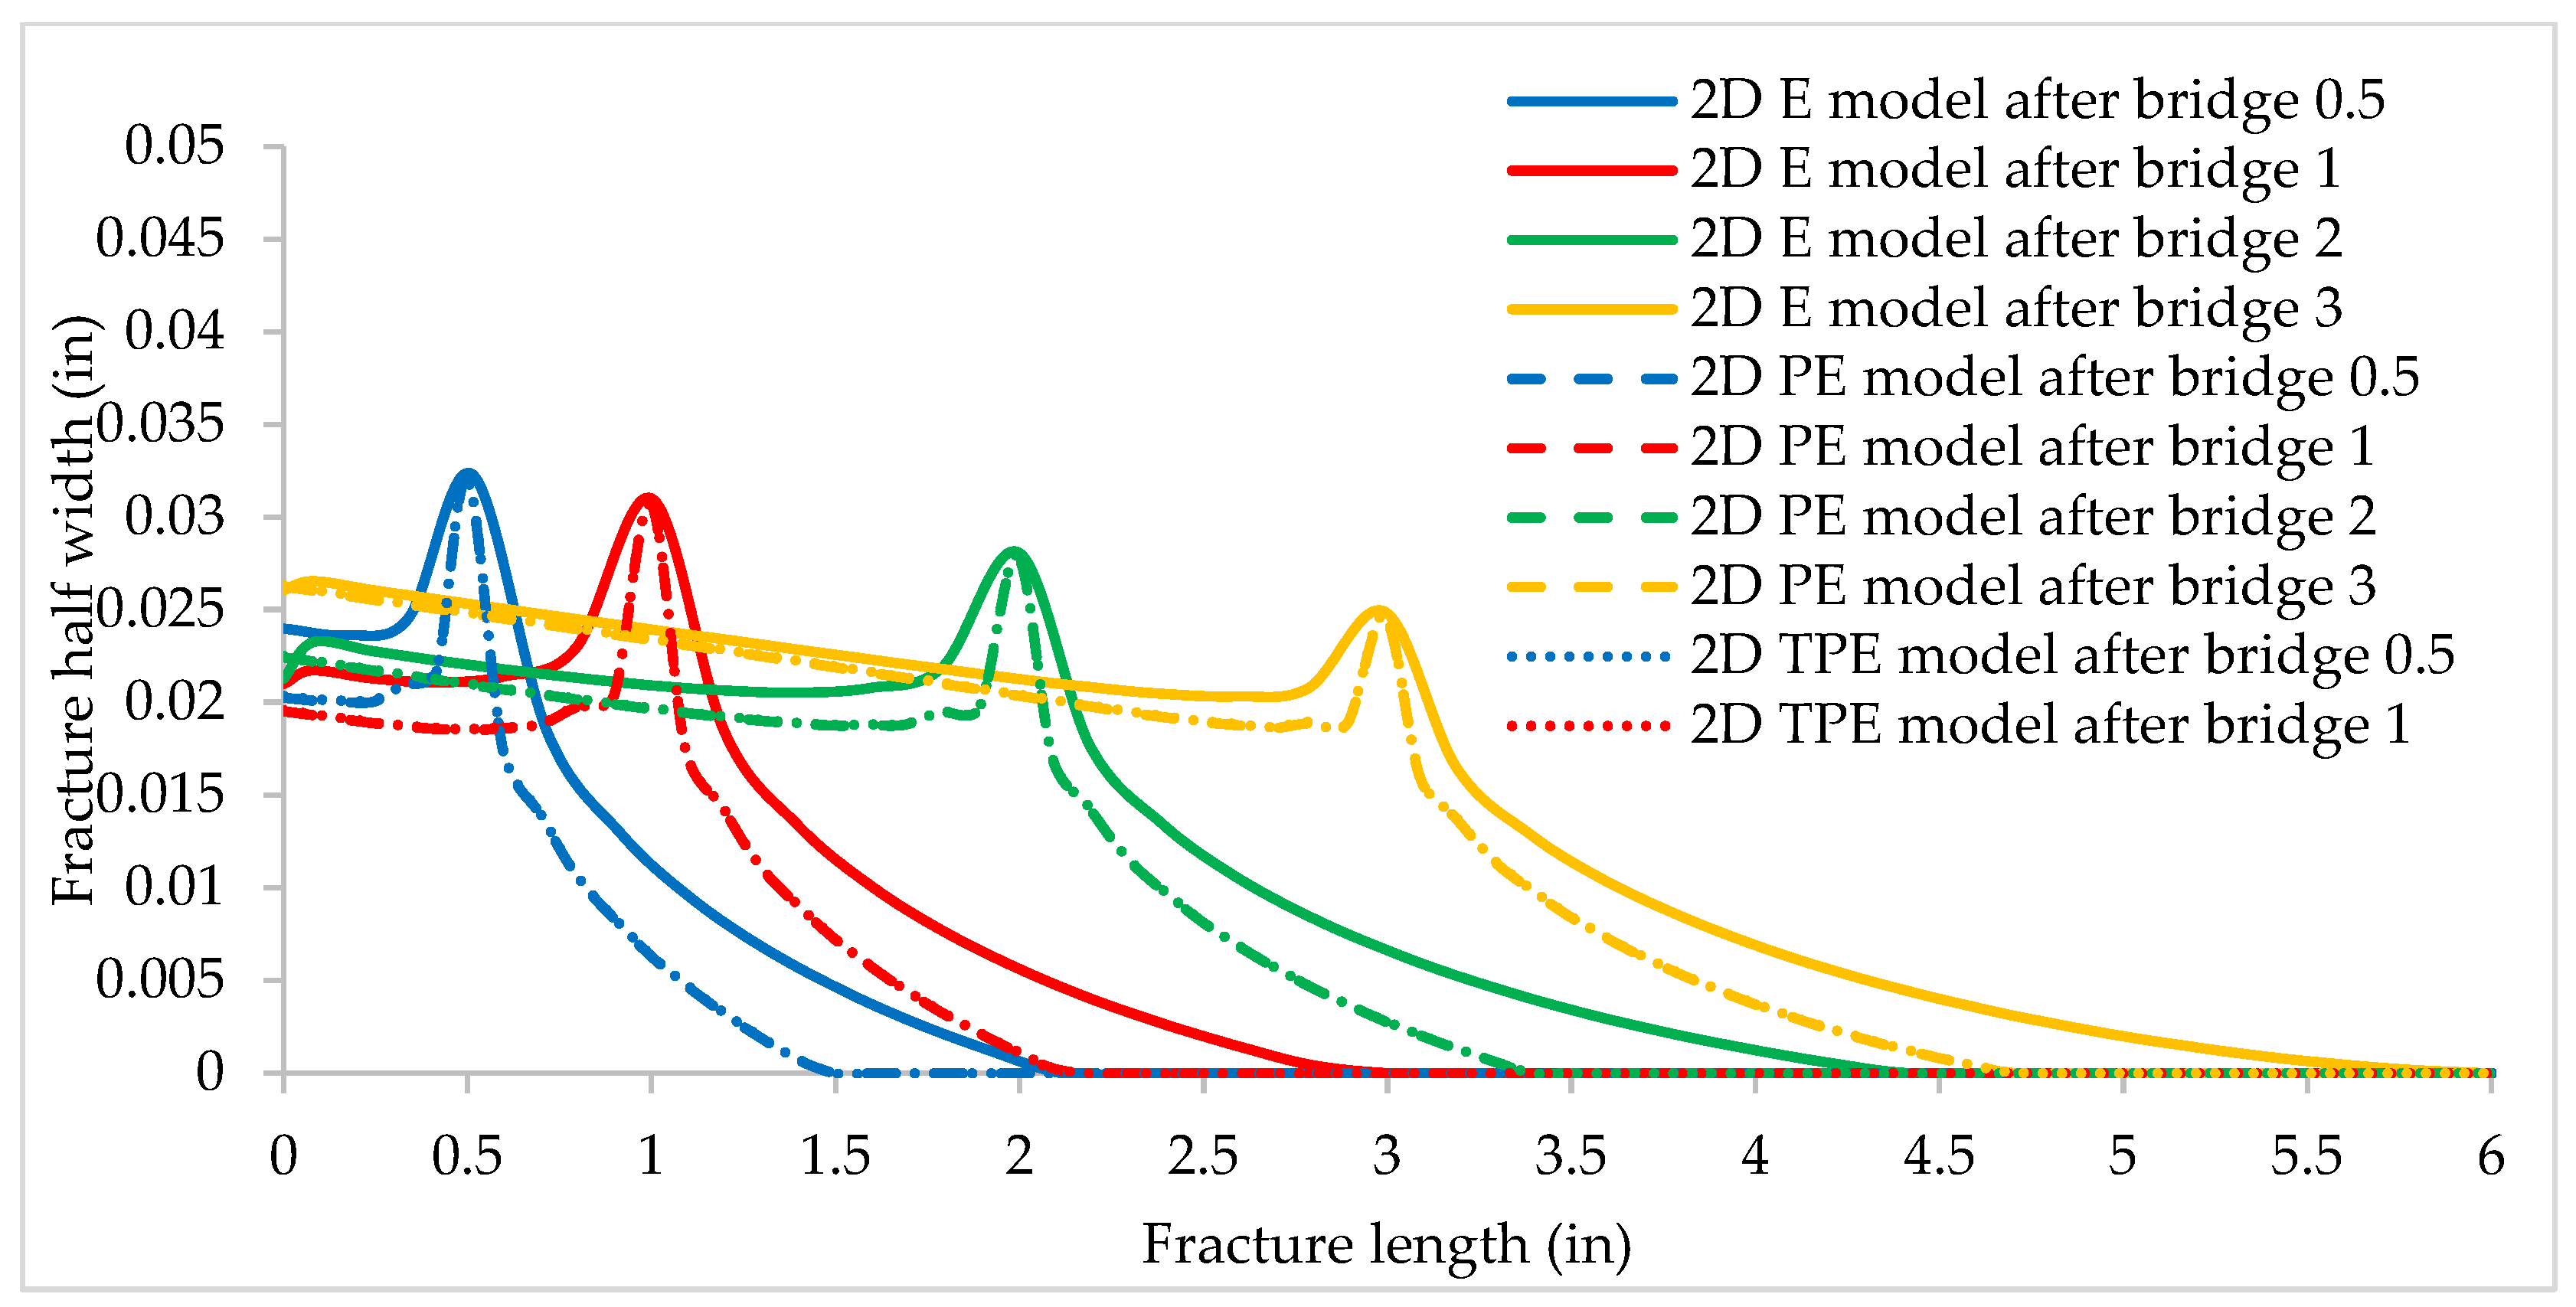
  • After bridging the fractures, the maximum hoop stress was observed at the bridging location of 0.5 inches, which confirms the results of previous studies;
  • All three models showed the hoop stress increase after bridging the fractures, which confirms the applicability of stress cage technology for wellbore strengthening purposes;
  • The maximum area under the fracture was observed for bridging location of 3 inches from the aperture;
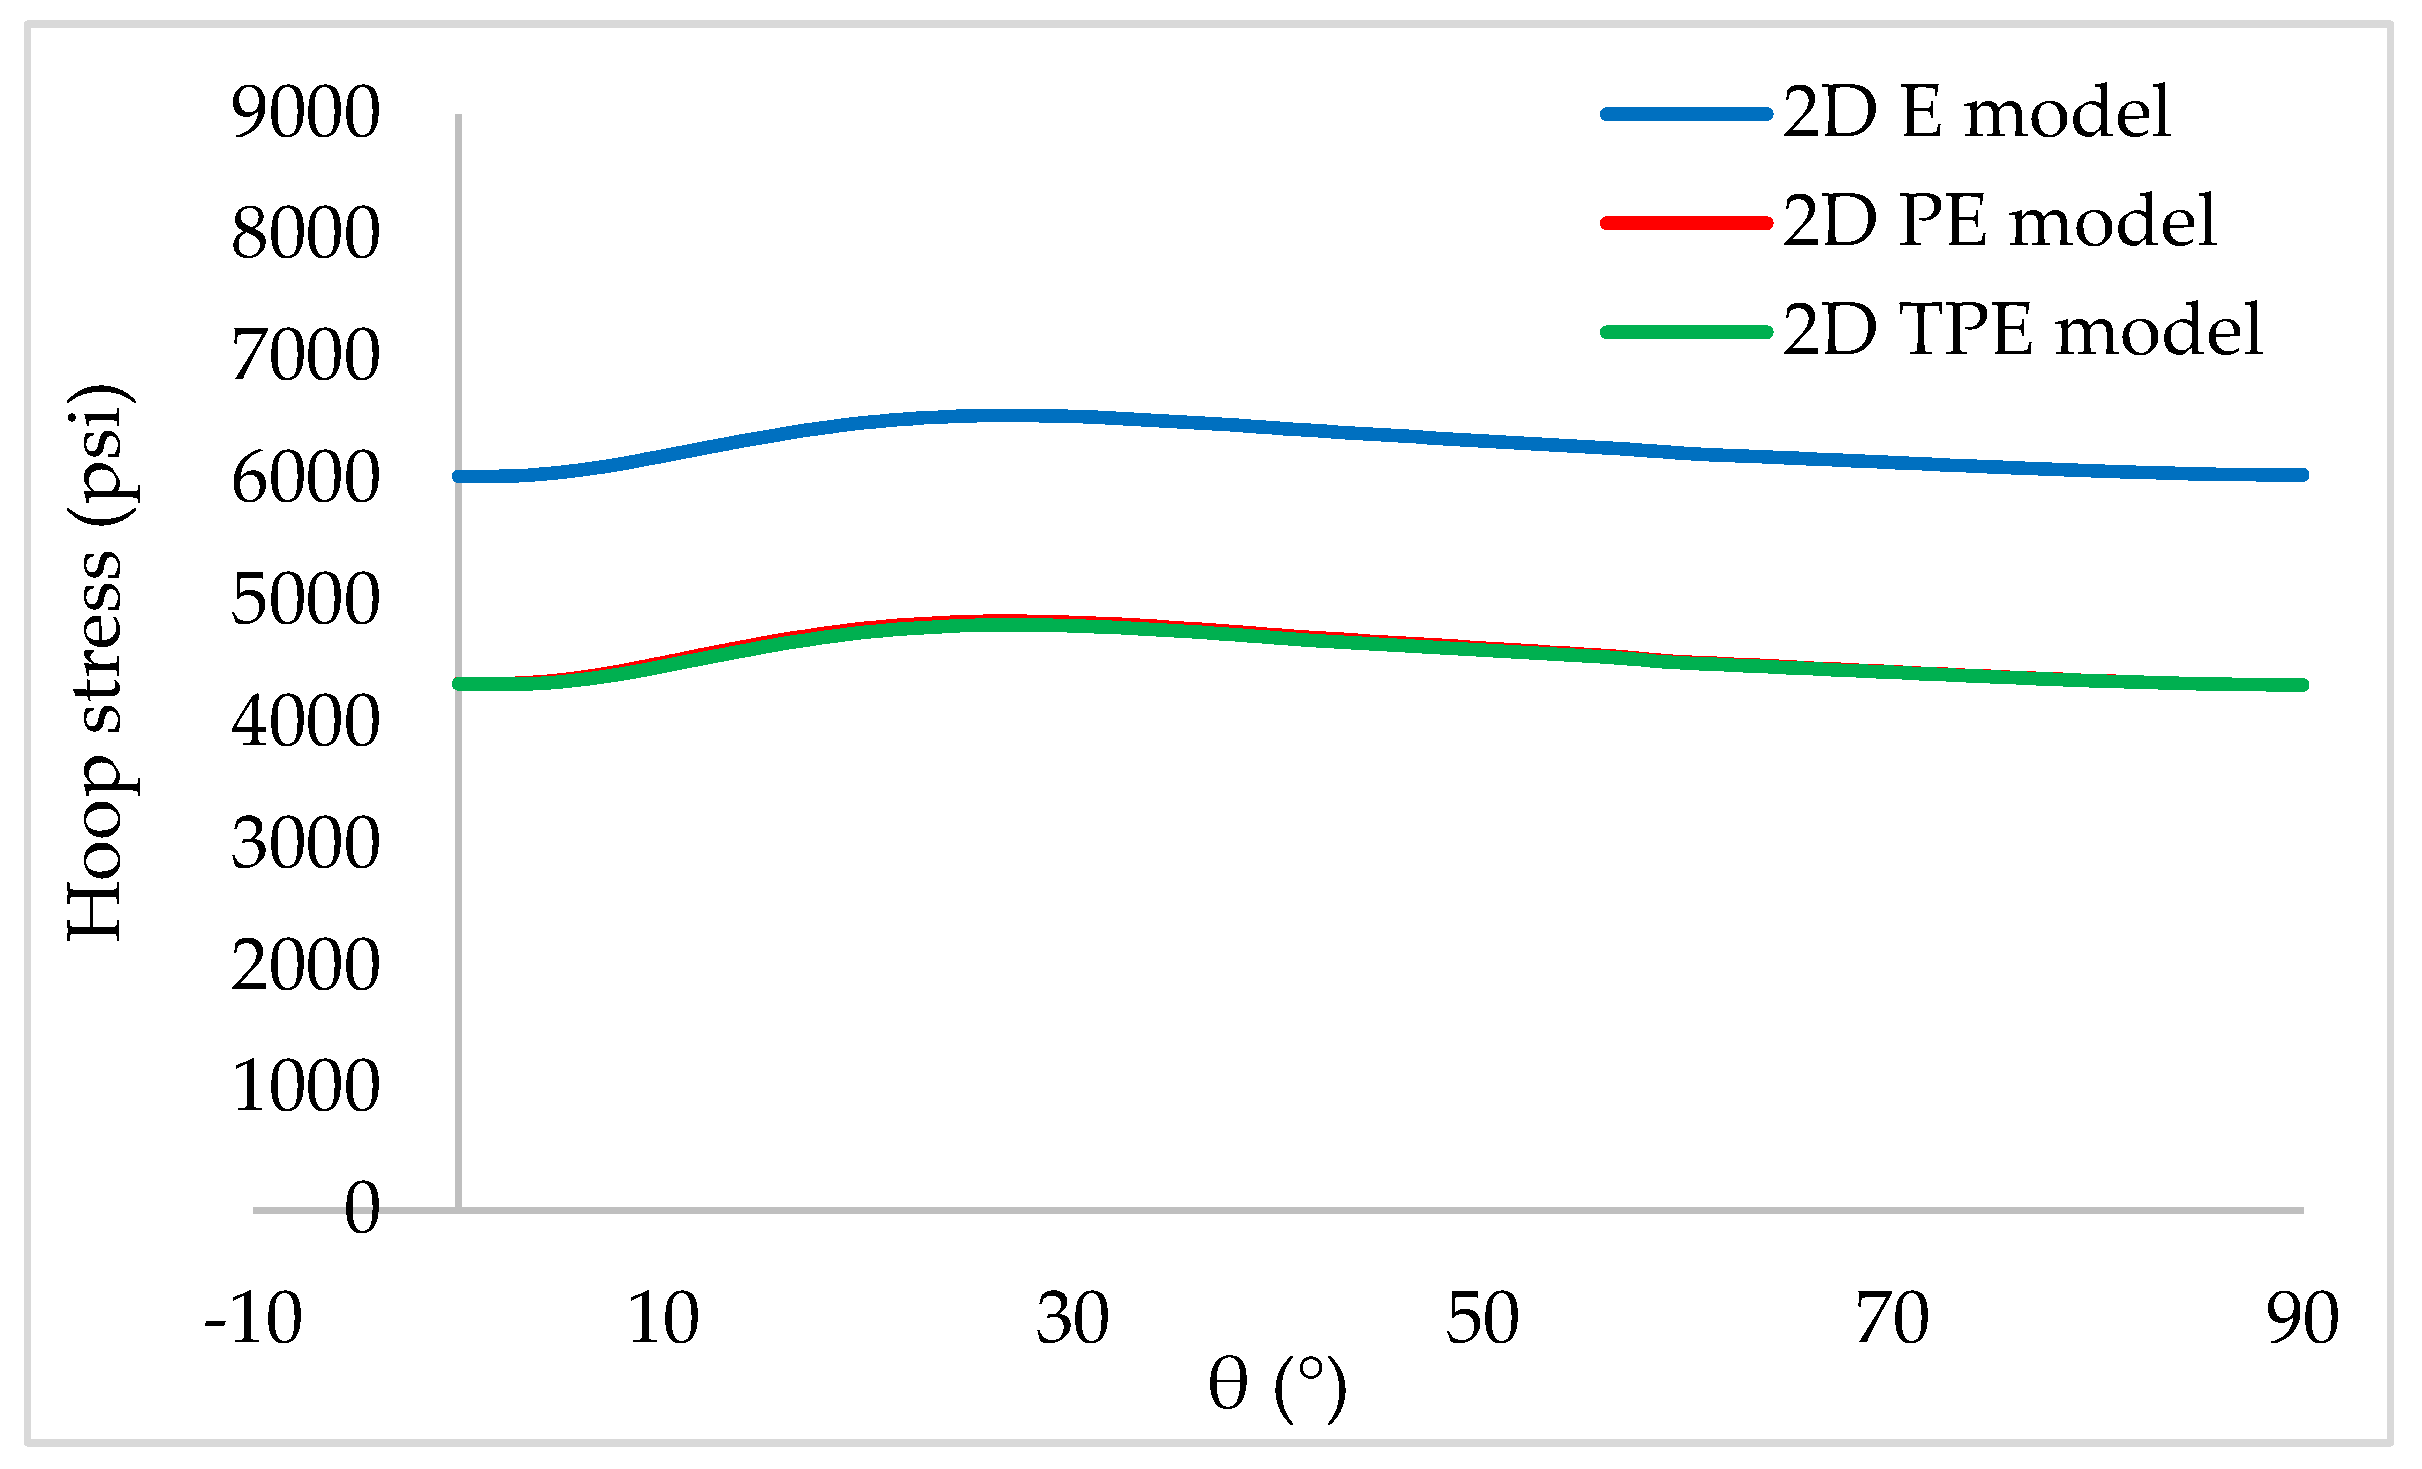
  • The difference between the elastic, poro-elastic and thermo-poro-elastic models is slightly visible. However, at high-temperature conditions, i.e., when a significant temperature difference between mud and formation is anticipated, the effect of thermal stresses should be investigated.

Author Contributions

Conceptualization, S.S.T.M.; methodology, P.A., E.L.; software, P.A.; validation, S.S.T.M., V.M.; formal analysis, V.M.; investigation, P.A., E.L.; resources, V.M., E.L.; data curation, P.A., S.S.T.M.; writing—original draft preparation, P.A., E.L.; writing—S.S.T.M., V.M.; visualization, E.L.; supervision, V.M.; project administration, S.S.T.M.; All authors have read and agreed to the published version of the manuscript.

Funding

This research received no external funding.

Data Availability Statement

Not applicable.

Acknowledgments

Authors would like to express their gratitude for the support of Sahand University of Technology and Saint Petersburg Mining University.

Conflicts of Interest

The authors declare no conflict of interest.

References

  1. Yili, K.A.; Chengyuan, X.U.; Long, T.A.; Song, L.I.; Daqi, L.I. Constructing a tough shield around the wellbore: Theory and method for lost-circulation control. Pet. Explor. Dev. 2014, 41, 520–527. [Google Scholar]
  2. Berkay, H. Finite Element Analysis of Wellbore Strengthening. Ph.D. Thesis, University of Texas, Austin, TX, USA, 2011. [Google Scholar]
  3. Salehi, S.; Nygaard, R. Numerical study of fracture initiation, propagation, sealing to enhance wellbore fracture gradient. In Proceedings of the 45th US Rock Mechanics/Geomechanics Symposium, San Francisco, CA, USA, 26 June 2011. [Google Scholar]
  4. Hussain, R. Well Engineering & Construction; Entrac Consulting Limited: London, UK, 2002. [Google Scholar]
  5. Feng, Y.; Gray, K. Review of fundamental studies on lost circulation and wellbore strengthening. J. Pet. Sci. Eng. 2017, 152, 511–522. [Google Scholar] [CrossRef]
  6. Litvinenko, V.; Dvoinikov, M. Methodology for determining the parameters of drilling mode for directional straight sections of well using screw downhole motors. J. Min. Inst. 2020, 241, 105–112. [Google Scholar] [CrossRef]
  7. Dvoynikov, M.V.; Sidorkin, D.I.; Kunshin, A.A.; Kovalev, D.A. Development of Hydraulic Turbodrills for Deep Well Drilling. Appl. Sci. 2021, 11, 7517. [Google Scholar] [CrossRef]
  8. Cook, J.; Growcock, F.; Guo, Q.; Hodder, M.; van Oort, E. Stabilizing the wellbore to prevent lost circulation. Oilfield Rev. 2011, 23, 26–35. [Google Scholar]
  9. Wang, H.; Soliman, M.Y.; Towler, B.F. Investigation of Factors for Strengthening a Wellbore by Propping Fractures. SPE Drill. Completion 2008, 24, 441–451. [Google Scholar] [CrossRef]
  10. Yao, Z.; Alberty, M. Thermal Effect on Fracture Width for Wellbore Strengthening Applications. In Proceedings of the IADC/SPE International Drilling Conference and Exhibition, Galveston, TX, USA, 25 February 2020. [Google Scholar] [CrossRef]
  11. Fan, G.; Li, M.; Chen, X.; Palyanitsina, A.; Timoshin, A. Polymer-Nanosilica-assisted to evaluate oil recovery performances in sandstone reservoirs. Energy Rep. 2021, 7, 2588–2593. [Google Scholar] [CrossRef]
  12. Rogachev, M.K.; Van, T.N.; Aleksandrov, A.N. Technology for Preventing the Wax Deposit Formation in Gas-Lift Wells at Offshore Oil and Gas Fields in Vietnam. Energies 2021, 14, 5016. [Google Scholar] [CrossRef]
  13. Aston, M.S.; Alberty, M.W.; McLean, M.R.; De Jong, H.J.; Armagost, K. Drilling fluids for wellbore strengthening. In Proceedings of the IADC/SPE Drilling Conference, Dallas, TX, USA, 2 March 2004. [Google Scholar]
  14. Alberty, M.W.; McLean, M.R. A physical model for stress cages. In Proceedings of the SPE Annual Technical Conference and Exhibition, Houston, TX, USA, 26 September 2004. [Google Scholar]
  15. Mirabbasi, S.M.; Ameri, M.J.; Biglari, F.R.; Shirzadi, A. Thermo-poroelastic wellbore strengthening modeling: An analytical ap-proach based on fracture mechanics. J. Pet. Sci. Eng. 2020, 195, 107492. [Google Scholar] [CrossRef]
  16. Islamov, S.; Grigoriev, A.; Beloglazov, I.; Savchenkov, S.; Gudmestad, O. Research Risk Factors in Monitoring Well Drilling—A Case Study Using Machine Learning Methods. Symmetry 2021, 13, 1293. [Google Scholar] [CrossRef]
  17. Liagov, I.; Liagov, A.; Liagova, A. Optimization of the Configuration of the Power Sections of Special Small-Sized Positive Displacement Motors for Deep-Penetrating Perforation Using the Technical System “Perfobore”. Appl. Sci. 2021, 11, 4977. [Google Scholar] [CrossRef]
  18. Petrakov, D.G.; Penkov, G.M.; Zolotukhin, A.B. Experimental study on the effect of rock pressure on sandstone permeability. J. Min. Inst. 2022, 254, 1–8. [Google Scholar] [CrossRef]
  19. Blinov, P.A. Saint Petersburg Mining University determining the stability of the borehole walls at drilling intervals of loosely coupled rocks considering zenith angle. J. Min. Inst. 2019, 236, 172–179. [Google Scholar] [CrossRef] [Green Version]
  20. Grigoriev, B.S.; Peter the Great St. Petersburg Polytechnic University; Eliseev, A.A.; Pogarskaya, T.A.; Toropov, E.E.; Rubin, J.C.M. Mathematical modeling of rock crushing and multiphase flow of drilling fluid in well drilling. J. Min. Inst. 2019, 235, 16–23. [Google Scholar] [CrossRef]
  21. Gil, I.; Roegiers, J.C. New wellbore strengthening method for low permeability formations. In Proceedings of the Golden Rocks 2006, The 41st US Symposium on Rock Mechanics (USRMS), Golden, CO, USA, 17 June 2006. [Google Scholar]
  22. Wang, H.; Towler, B.F.; Soliman, M.Y. Near wellbore stress analysis and wellbore strengthening for drilling depleted formations. In Proceedings of the Rocky Mountain Oil & Gas Technology Symposium, Denver, CO, USA, 16 April 2007. [Google Scholar]
  23. Wang, H.; Towler, B.F.; Soliman, M.Y.; Shan, Z. Wellbore strengthening without propping fractures: Analysis for strengthening a wellbore by sealing fractures alone. In Proceedings of the International Petroleum Technology Conference, Kuala Lumpur, Malaysia, 3 December 2008. [Google Scholar]
  24. Salehi, S.; Nygaard, R. Finite-element analysis of deliberately increasing the wellbore fracture gradient. In Proceedings of the 44th US Rock Mechanics Symposium and 5th US-Canada Rock Mechanics Symposium, Salt Lake City, UT, USA, 27 June 2010. [Google Scholar]
  25. Shahri, M.P.P.; Oar, T.T.; Safari, R.; Karimi, M.; Mutlu, O. Advanced Semianalytical Geomechanical Model for Wellbore-Strengthening Applications. SPE J. 2015, 20, 1276–1286. [Google Scholar] [CrossRef]
  26. Arlanoglu, C.; Feng, Y.; Podnos, E.; Becker, E.; Gray, K.E. Finite element studies of wellbore strengthening. In Proceedings of the IADC/SPE Drilling Conference and Exhibition, Fort Worth, TX, USA, 4 March 2014. [Google Scholar]
  27. Zhong, R.; Miska, S.; Yu, M. Parametric study of controllable parameters in fracture-based wellbore strengthening. J. Nat. Gas Sci. Eng. 2017, 43, 13–21. [Google Scholar] [CrossRef]
  28. Liu, Y.; Chen, P.; Ma, T.S.; Wu, B.S.; Zhang, X.; Wu, B.L. A transient pressure analysis for wellbore strengthening. In Proceedings of the ARMA-CUPB Geothermal International Conference, Beijing, China, 5 August 2019. [Google Scholar]
  29. Li, J.; Qiu, Z.; Zhong, H.; Zhao, X.; Huang, W.; Yang, Y. Parametric study on near-wellbore fracture geometry for wellbore strengthening in anisotropic formation. J. Pet. Sci. Eng. 2019, 184, 106549. [Google Scholar] [CrossRef]
  30. Tabatabaee Moradi, S.S.; Nikolaev, N.I. Uncertainty assessment of wellbore stability analysis in horizontal sections. SN Appl. Sci. 2020, 2, 437. [Google Scholar] [CrossRef] [Green Version]
  31. Aslannezhad, M.; Manshad, A.K.; Jalalifar, H. Determination of a safe mud window and analysis of wellbore stability to minimize drilling challenges and non-productive time. J. Pet. Explor. Prod. Technol. 2015, 6, 493–503. [Google Scholar] [CrossRef] [Green Version]
  32. Leusheva, E.; Morenov, V.; Tabatabaee Moradi, S. Effect of Carbonate Additives on Dynamic Filtration Index of Drilling Mud. Int. J. Eng. 2020, 33, 934–939. [Google Scholar] [CrossRef]
  33. Bozorgi, M.J.; Parham, M.; Rahmani, O.; Piroozian, A.; Gebretsadik, H.T.; Ibad, S.M. A Three-Dimensional Finite-Element Model in ABAQUS to Analyze Wellbore Instability and Determine Mud Weight Window. Energies 2022, 15, 3449. [Google Scholar] [CrossRef]
  34. Zhang, J.J. Applied Petroleum Geomechanics; Gulf Professional Publishing: Houston, TX, USA, 2019. [Google Scholar] [CrossRef]
  35. Aadnøy, B.; Looyeh, R. Wellbore instability analysis. In Petroleum Rock Mechanics; Gulf Professional Publishing: Houston, TX, USA, 2019. [Google Scholar]
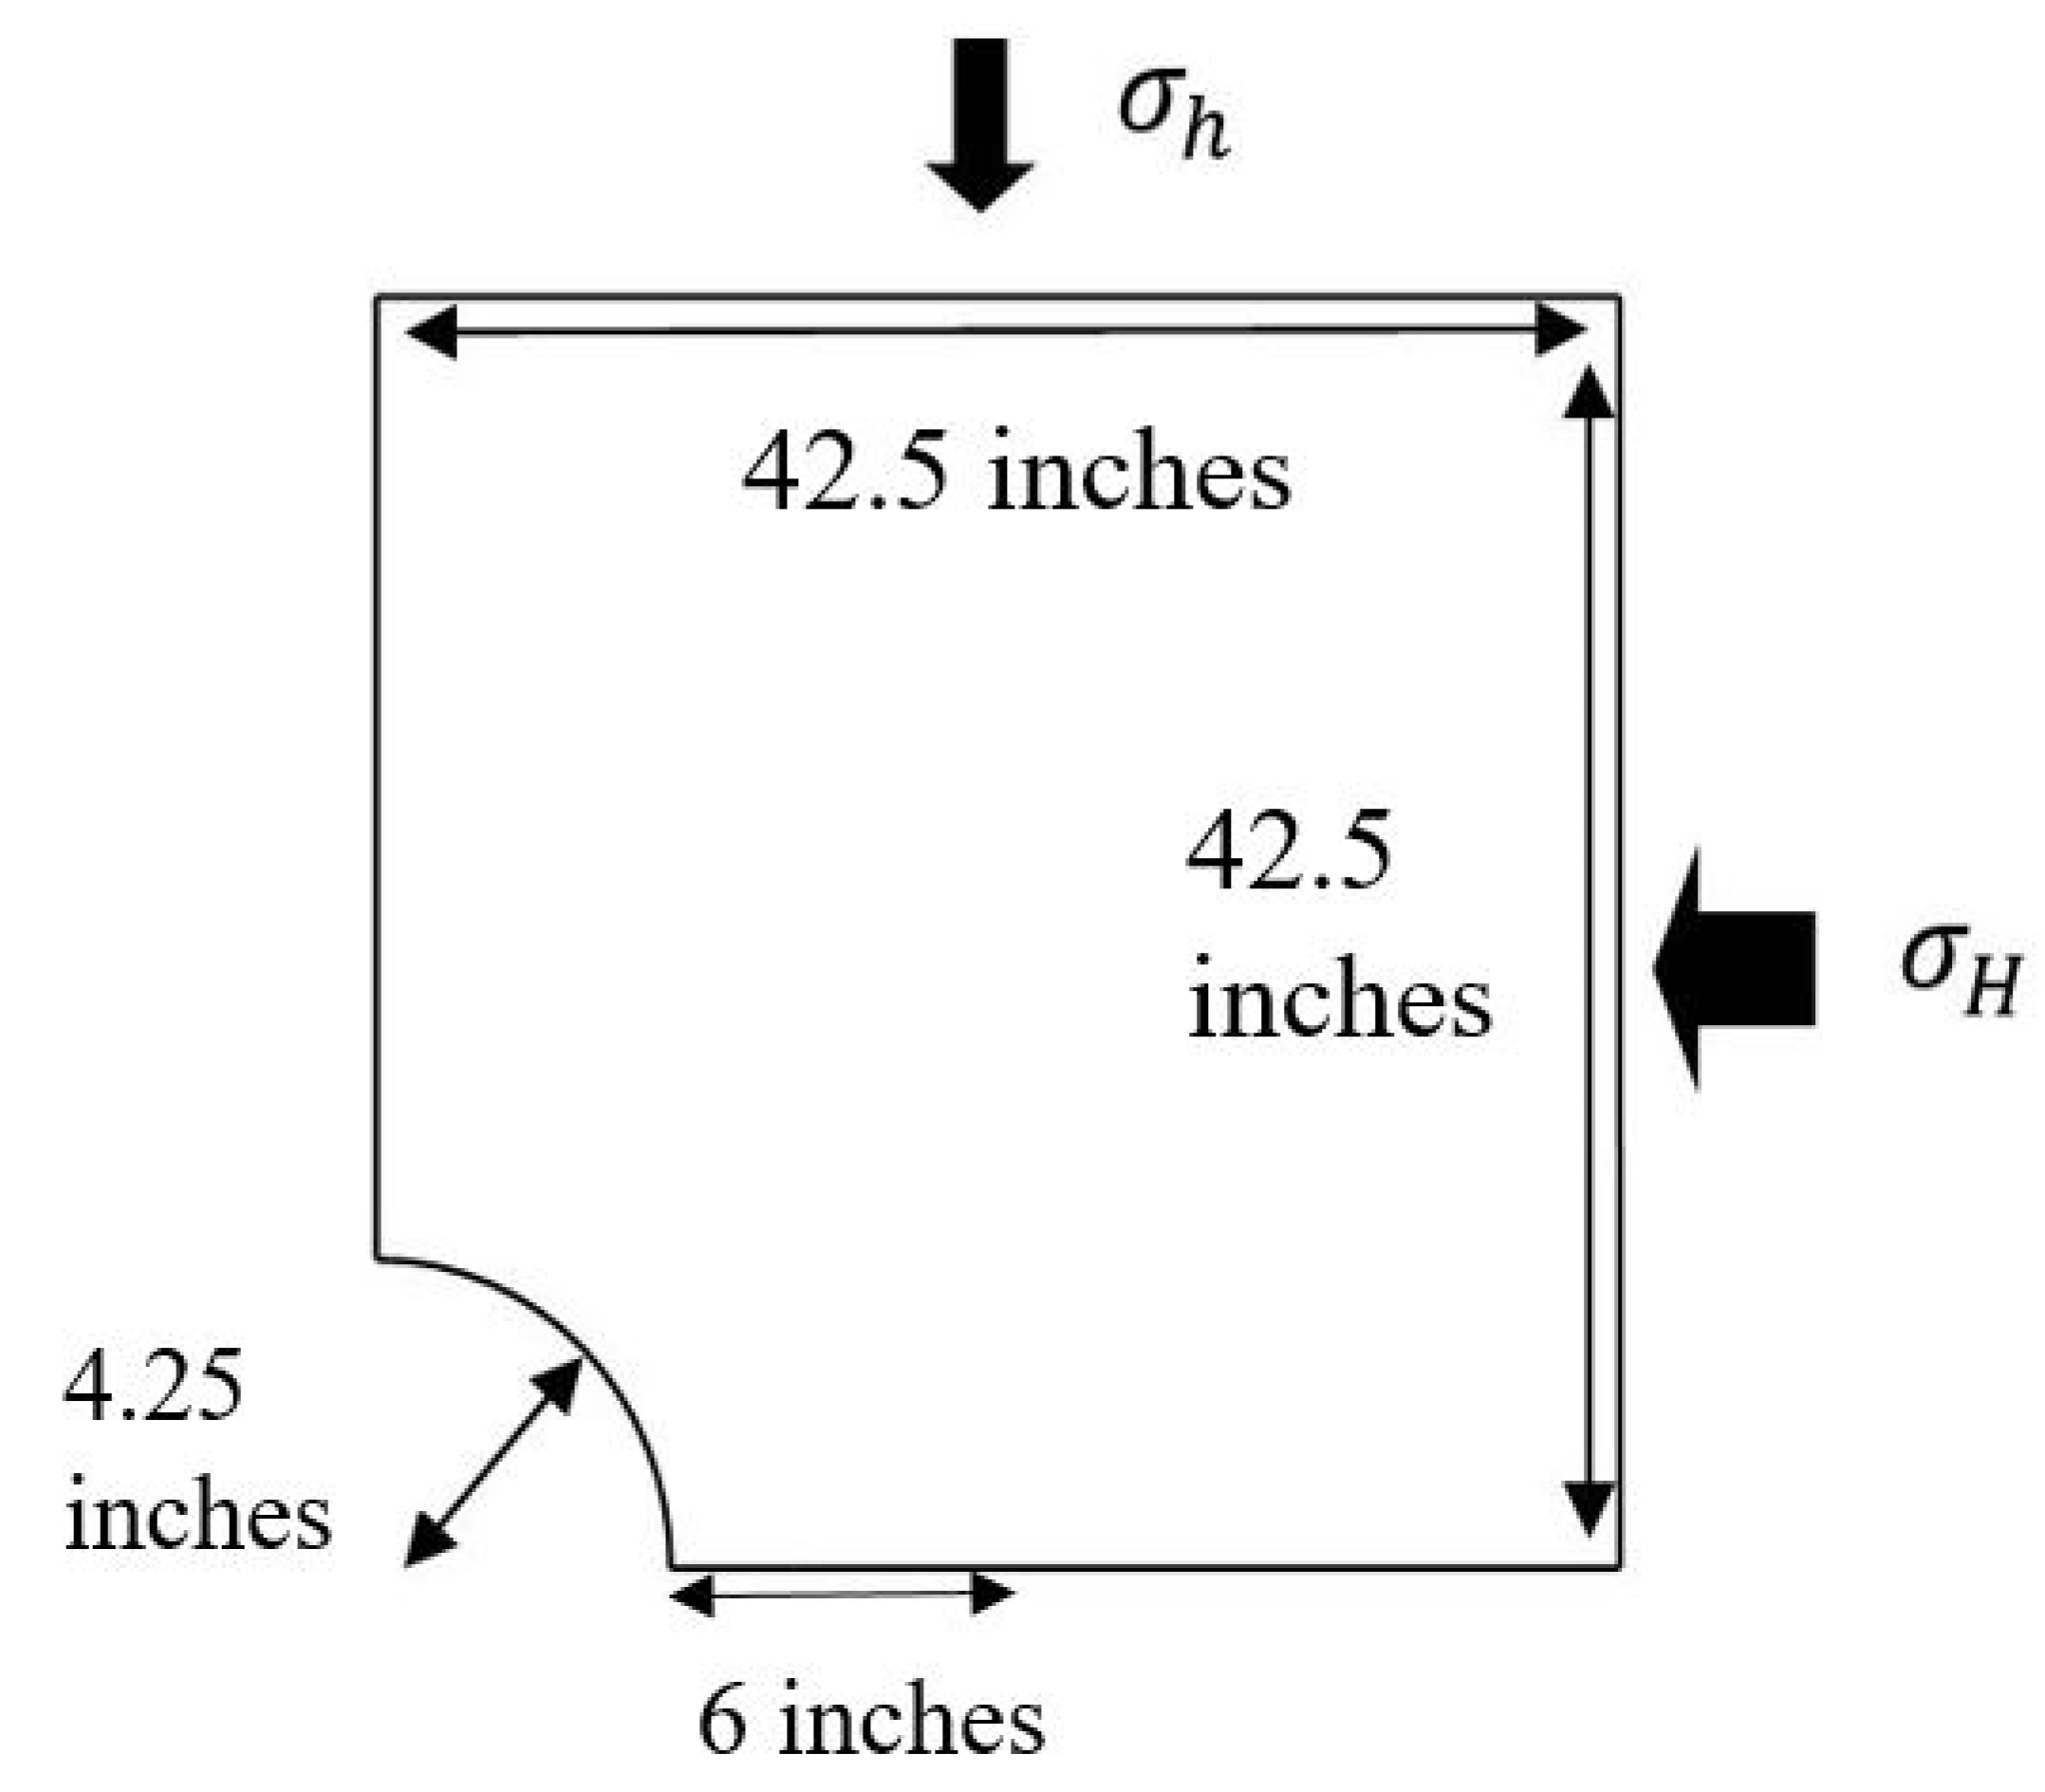
Figure 1. Investigation workflow.
Energies 15 05439 g001
Figure 2. The geometry of used 2D models.
Energies 15 05439 g002
Figure 3. In situ stresses and boundary conditions.
Energies 15 05439 g003
Figure 4. In situ stresses and boundary conditions.
Energies 15 05439 g004
Figure 5. Comparison of 2D elastic model and analytical model before fracture creation.
Energies 15 05439 g005
Figure 6. Comparison of 2D poro-elastic model and analytical model before fracture creation.
Energies 15 05439 g006
Figure 7. Comparison of 2D thermos-poro-elastic model and analytical model before fracture creation.
Energies 15 05439 g007
Figure 8. Hoop stress values in the wellbore wall for all 2D models before bridging state.
Energies 15 05439 g008
Figure 9. Hoop stress at the wellbore wall for four bridging locations (elastic model).
Energies 15 05439 g009
Figure 10. Hoop stress at the wellbore wall for four bridging locations (poro-elastic model).
Energies 15 05439 g010
Figure 11. Hoop stress at the wellbore wall for four bridging locations (thermo-poro-elastic model).
Energies 15 05439 g011
Figure 12. Hoop stress at three stages (before fracturing, after fracturing, and after bridging the fracture).
Energies 15 05439 g012
Figure 13. Fracture half-width in 2D numerical models and analytical models before bridging condition.
Energies 15 05439 g013
Figure 14. Fracture geometry at four locations of bridging along the fracture length for numerical models.
Energies 15 05439 g014
Table 1. The input values of 2D models.
ParameterValuesUnits
Model length42.5in
Model width42.5in
Wellbore radius4.25in
Fracture length6in
Young’s modulus1,500,000psi
Poisson’s ratio0.25-
Maximum horizontal stress5000psi
Minimum horizontal stress3575psi
Overburden stress6000psi
Wellbore pressure5725, 6025psi
Formation breakdown pressure5725psi
Pore pressure1700psi
Void ratio0.3-
Permeability100md
Rock thermal expansion coefficient1.1 × 10−61/°F
Specific heat1000J/(kg·K)
Conductivity4.5W/(m·K)
Bulk formation density2g/cm3
Formation temperature120°F
Drilling fluid temperature100°F
Publisher’s Note: MDPI stays neutral with regard to jurisdictional claims in published maps and institutional affiliations.

