Article

Study on Morphological Identification of Tight Oil Reservoir Residual Oil after Water Flooding in Secondary Oil Layers Based on Convolution Neural Network

1
College of Computer and Information Technology, Northeast Petroleum University, Daqing 163318, China
2
Key Laboratory of “Continental Shale Oil and Gas Accumulation and Efficient Development” of Ministry of Education, Northeast Petroleum University, Daqing 163318, China
3
Information Technology Center, Daqing Oilfield Design Institute Co., Ltd., Daqing 163712, China
*
Author to whom correspondence should be addressed.
Energies 2022, 15(15), 5367; https://doi.org/10.3390/en15155367
Submission received: 28 April 2022 / Revised: 9 July 2022 / Accepted: 11 July 2022 / Published: 25 July 2022

Abstract

:
In this paper, a microscopic oil displacement visualization experiment based on the glass etching model to simulate the tight oil reservoir of underground rocks is carried out. At present, water flooding technology is widely used in the development of oil and gas fields, and the remaining oil content is still very high after water flooding. It is the key to improving oil recovery to identify and study the remaining oil form distribution after water flooding. The experiment result shows there are five types of residual oil after water flooding: columnar residual oil, membranous residual oil, oil droplet residual oil, blind terminal residual oil and cluster residual oil. A convolution neural network is suitable for complex image characteristics with good robustness. In recent years, it has made a breakthrough in a set of small and efficient neural networks with SqueezeNet, Google Inception and the flattened network method put forward. In order to solve the problems of low automation, low efficiency and high error rate in the traditional remaining oil form recognition algorithm after water flooding in tight oil reservoirs, an image recognition algorithm based on the MobileNets convolutional neural network model was proposed in this paper to achieve accurate recognition of the remaining oil form. Based on traditional image processing methods which, respectively, extracted the whole picture of the different types of remaining oil in the image block, it uses the MobileNets network structure to classify different types of image block and realizes the layered depth convolution neural network system. The experiment result shows that the model can accurately identify the remaining oil forms, and the overall recognition accuracy is up to 83.8% after the convergence of the network model, which infinitely identifies the remaining oil forms in the morphological library, proving the strong generalization and robustness of the model.

1. Introduction

Oil is at the heart of a country’s industrial development. At present, China’s oil production, to a large extent, has not reached the industrial demand, and the development of oil is facing challenges. Therefore, it is urgent to enhance oil recovery technology. Most of China’s oil fields adopt water injection. [1] After water injection, the water content of the oil field is up to 90%, and 60% to 70% of crude oil remains underground. Water flooding technology is widely used in the development of oil and gas fields. It is of great significance for the following oil displacement technologies such as polymer flooding, complex ternary flooding, microbial flooding and so on [2,3,4] to study the distribution of the remaining oil after water flooding. The theoretical basis for improving oil recovery is to strengthen the identification and study of residual oil distribution. The significance of this paper is to apply the prediction method to the remaining oil distribution prediction in order to improve the prediction accuracy and speed up the prediction. It makes a difference in the exploration and development of oil fields and oil recovery.
The method to identify the remaining oil after polymer flooding is as follows:
  • Physical simulation method:
    (1)
    Indoor oil displacement experiment. The cores were separately isolated to carry out water flooding. When the content of water reached 98%, with the injected polymer solution, the molecular weight of the polymer, PV number of the solution and the concentration of polymer solution as the control variable, the following water flooding was conducted until the water content reached 98% again.
    (2)
    Nuclear magnetic resonance technology. At present, NMR is an advanced nondestructive, multifunctional and quantitative measurement method. In 1986, the Boldwin magnetic resonance imager was used for the first time to study the oil displacement process of sandstone core. Since then, new MRI technologies have attracted widespread attention in the oil industry. Water and polymer flooding were performed on four different sections of natural cores. For the same core, the part profile and middle longitudinal profile were photographed after the completion of water injection, polymer flooding and subsequent water flooding. The residual oil was determined according to the distribution of remaining oil saturation [3,4,5,6].
    (3)
    Fluorescence analysis of grinding disc. The two cores were subjected to a water flooding test and then placed under sealing conditions for 15 days. The two cores uniformly intercepted the three sections and the fluorescence analysis technology of G was used to make sections of each section. The plate was rinsed to create an abrasive disc. Five lines were selected evenly on each piece; scan imaging was used to generate continuous images and one of them was selected. The distribution of residual oil was studied with several pictures.
  • Closed core analysis and Logging interpretation method. This method is an explanation of the distribution law of residual oil in the main reservoir after polymer flooding. This method was used to study the distribution law of residual oil and analyze it in horizontal and vertical directions. In addition, the factors affecting the difference in the residual oil distribution were also analyzed.
  • Numerical simulation method and relative permeability characteristic curve method. These methods establish the relative permeability curve equation, through which the relative permeability curve of each grid block is calculated so as to improve the accuracy of reservoir numerical simulation.
Deep learning is often understood as a sub-domain of the interdisciplinary field [7,8], which can be defined as an algorithm for the abstract analysis of data. At the same time, it can be understood as a machine multi-level learning algorithm based on representational learning for the purpose of simulating complex relations between data. The basic purpose of this algorithm is to find a more effective representation and to model it better to learn these representations. Among the high-level description information of deep learning, it can be implemented in two main aspects: On the one hand, the description model must be composed of periodic or multi-level non-linear information. On the other hand, the unsupervised or supervised learning in the characteristics will become more abstract with the continuous improvement of the depth. It can be said that deep learning is an organic application of hierarchical abstract theory. That is, high-level concepts need to be acquired through the learning process of low-level concepts.
At present, the application of deep learning algorithms in recognition technology can be mainly implemented into three basic contents: (1) the processing capacity of modern electronic chips has been greatly increased, which can organically support the organic realization of common graphics processing units. (2) The cost of hardware algorithm is relatively reduced. (3) The progress of theoretical research on machine learning and the development of practical experience. By analyzing the structure, deep learning can be divided into many types, most of which are branches of some original structures. Furthermore, the conditions and scope of use have some differences due to the same data set. Therefore, we are unable to evaluate the performance of various structural algorithms. With the development of modern image recognition technology, deep learning technology has been widely used, which is of great significance for improving the recognition rate and speed of image recognition technology.
The application of deep learning algorithms in modern image recognition technology is conducive to improving its recognition rate and speed [7], and it has outstanding positive significance for the application of image recognition technology in daily life, work and study. In this regard, based on the theoretical basis of deep learning, the image recognition algorithm should be scientifically optimized to optimize the practicability, security and reliability of image recognition technology.
The deep learning model has a strong learning ability and efficient feature representation ability [8,9,10,11], where the parameters can be learned automatically from big data, avoiding manual adjustment of parameters. Therefore, compared with the traditional pattern recognition method, it does not need to rely too much on the experienced knowledge of the designer, and the model learned through big data has strong generalization ability and robustness [12,13]. At the same time, the deep learning model extracts data information from pixel level to abstract concept, so it has more prominent advantages in extracting image information and global features.

2. Method Introduction

This paper combines traditional image processing methods and a convolutional neural network to construct a residual oil morphological recognition system and constructs the remaining oil morphological library [14,15,16,17]. The method aimed to use the image data of the remaining oil shape database to train the system and complete the recognition test. In the residual oil morphological recognition system, image edge monitoring and image segmentation techniques are used for preprocessing and deep learning is used for image recognition. In the process of testing, image binarization, removing small connected regions, contour extraction, clipping and adding edges are used to complete the whole preprocessing process. The specific design of the remaining oil identification system is shown in Figure 1.
The remaining oil images were pretreated in the training stage. The entire image was divided into a sub-graph according to the connected region by the method of image edge detection and image segmentation. Then, the processed partial images were used as the training and testing sets of the deep learning recognition module.
Traditional image processing methods, including the canny edge operator, adaptive threshold, maximum connected region and so on, were used in the preprocessing stage.
The deep learning identification module adopted the MobileNets network structure, MobileNets, an architecture based on a streamlined, which uses deep separable convolution to build a lightweight deep neural network.
Based on deeply decomposable convolution, the MobileNets model can decompose the standard convolution into a deep convolution and a point convolution (1 by 1 convolution kernel). Whereas 1 by 1 convolution is used to combine the output of channel convolution, this decomposition can effectively reduce the computation and reduce the model size. The specific convolution decomposition is shown in Figure 2
Intuitively, this decomposition is indeed equivalent in effect. For example, to code the figure above into actual numbers, the input image dimension is 11 by 11 by 3, and the standard convolution is 3 by 3 by 16 (assuming the stride is 2 and the padding is 1). In this case, you obtain an output of 6 by 6 by 16. Now the input picture is the same, first through a deep convolution of 3 by 3 by 1 by 3 dimensions (input is 3 channels, there are 3 convolution cores here, corresponding to the calculation, understood as a for loop) and then by the intermediate output of 6 by 6 by 3, Additionally, through a dimension that is 1 by 1 by 1 by 3 by 16 convolved with 1 by 1, you obtain the same output of 6 by 6 by 16.
The testing phase is similar to the training phase [18]. First, the test images are preprocessed and divided into connected subgraphs. Then, the trained MobileNets model is used for identification [19,20,21,22,23]. The flow chart for identifying residual oil is shown in Figure 3.

3. Data and Methods

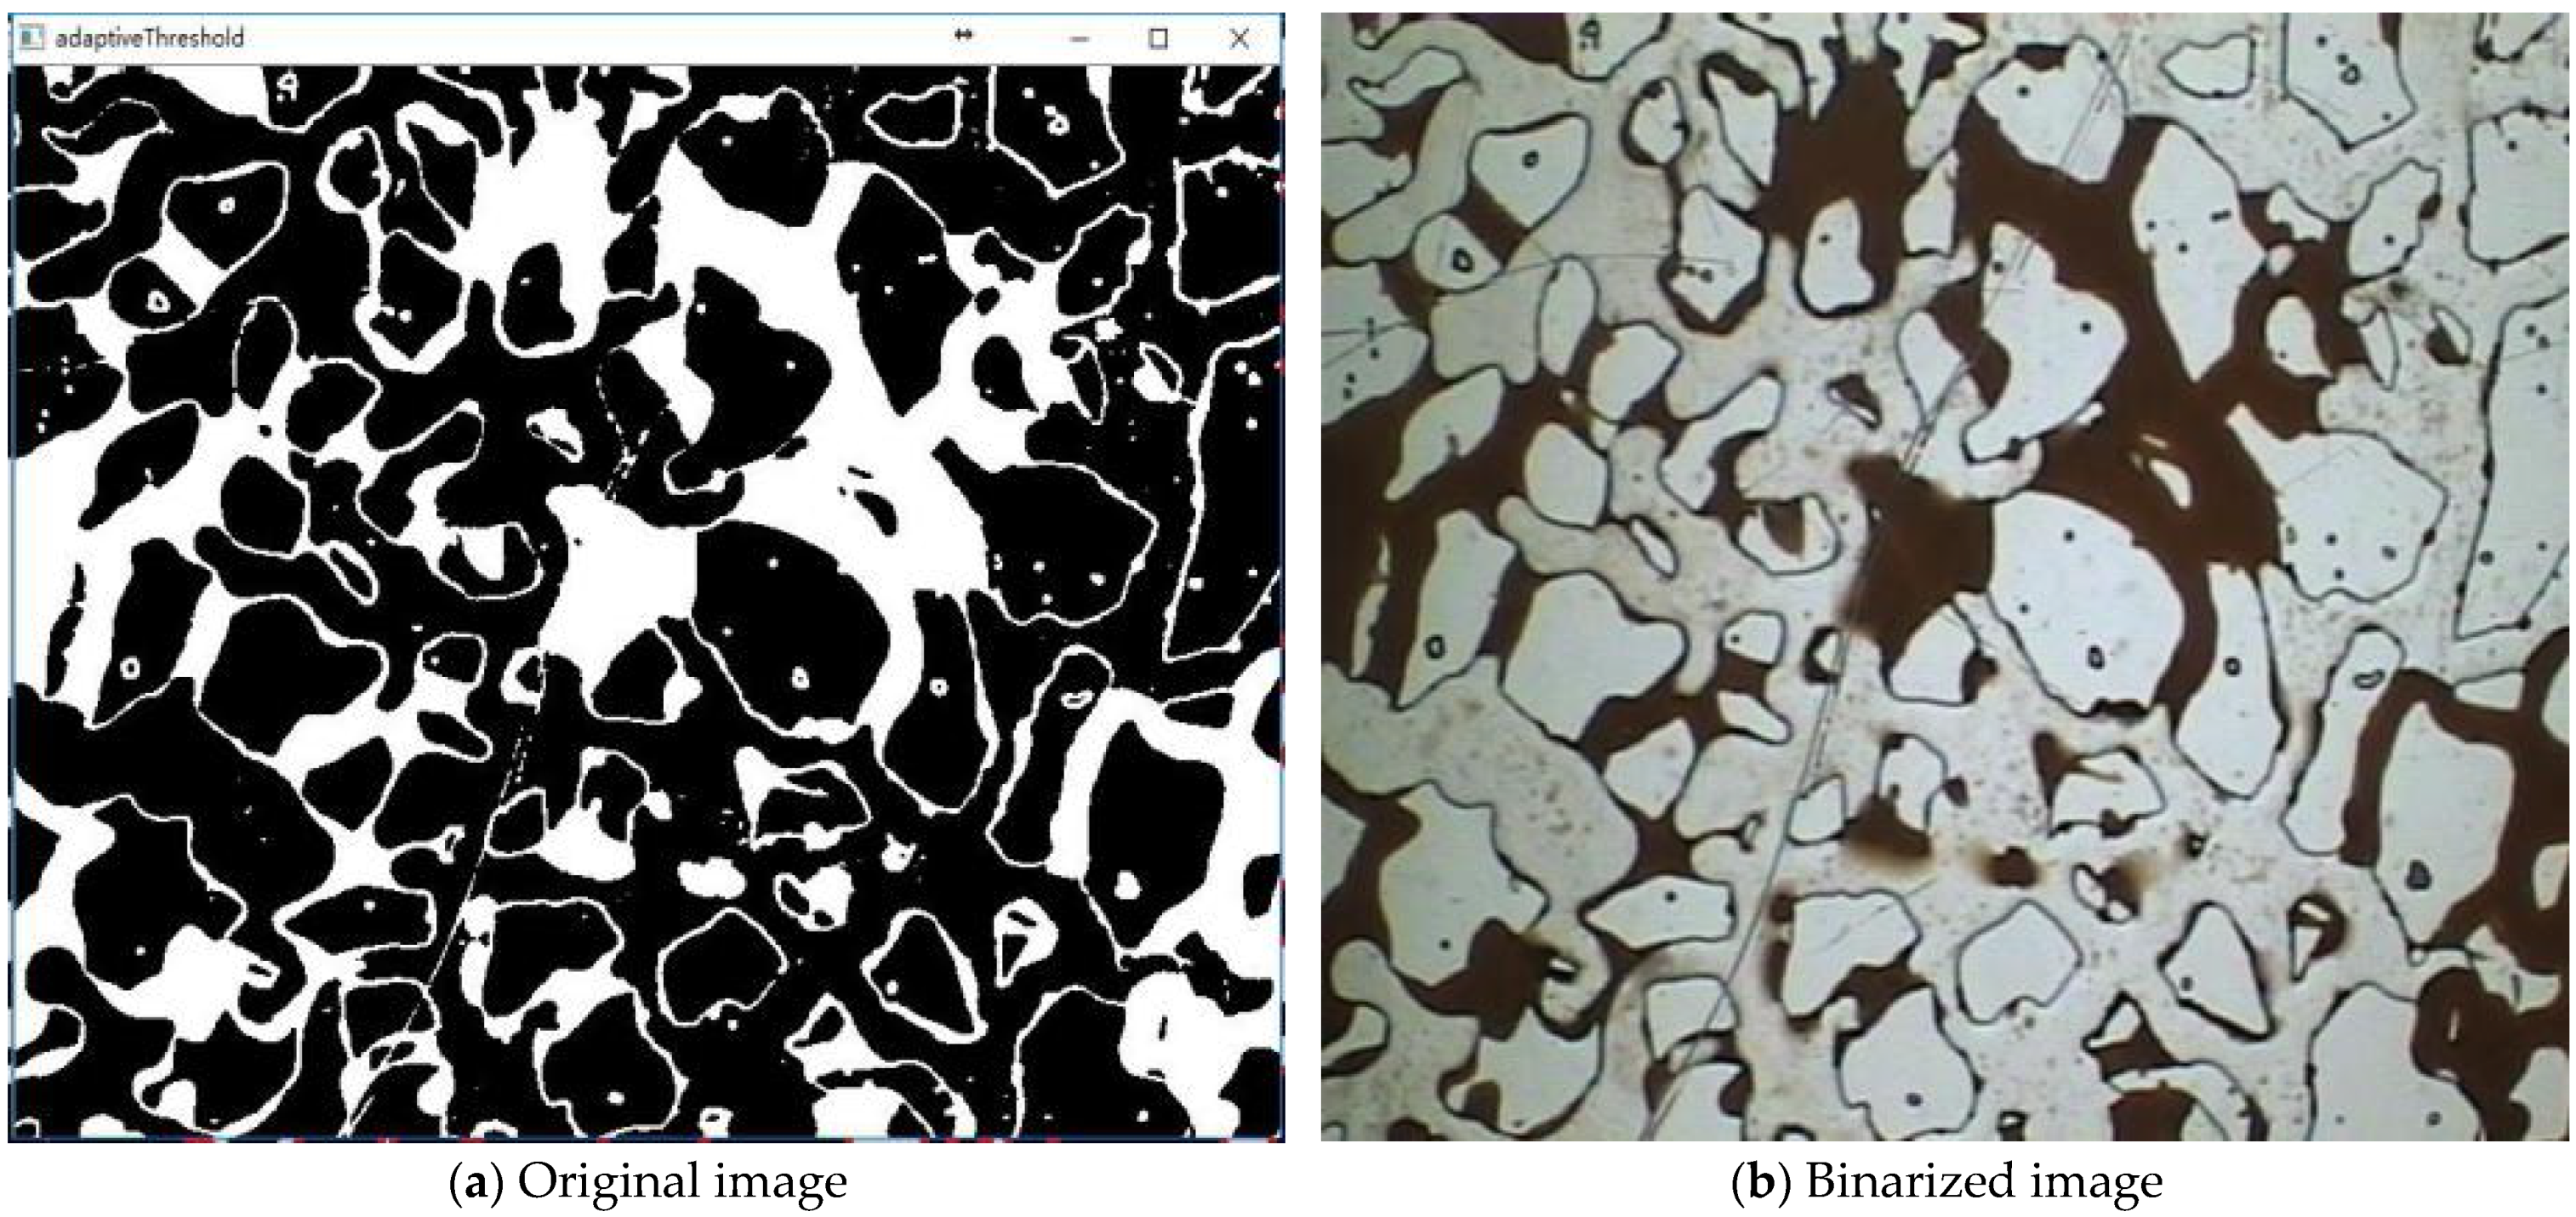
3.1. Binarization Processing

Due to the uneven color of the image, the Binarization method with a fixed threshold cannot be used to separate the oil block area from the background. Therefore, this paper uses a better adaptive threshold method to binarize images [23,24,25,26]. The relevant parameters are set as follows, as shown in Figure 4 after processing:
(1)
The maximum and minimum values of grayscale images are set to 255 and 0, respectively;
(2)
The threshold calculation method based on Gauss is adopted (the Gaussian threshold method is a kind of density estimation method. Its basic principle is to estimate the probability distribution function of the sample set and set a density threshold. When the density of the area where the test sample is located is higher than the threshold, it is judged as normal; otherwise, it is judged as abnormal);
(3)
The binvalue graph is reversed (set 255 for pixels less than the threshold and 0 for pixels greater than the threshold);
(4)
The calculation threshold block size parameter is set as 401.

3.2. Remove Small Connected Regions

The background pixel value is 0, and the oil block region pixel value is 255 after binarization. In order to remove the noise points, this method collects the sum of the number of pixels in each white-connected region of the image and removes the connected regions whose sum is less than 300. The effect is shown in Figure 5.

3.3. Contour Extraction and Cropping

The contour of the oil block area is extracted by OpenCV, the external rectangle of each contour is calculated and the binary image is cropped [27,28,29,30,31,32,33]. A fixed size boundary with a pixel value of 0 is added for each external rectangle when clipping, as shown in Figure 6. The red line in the left figure is the extracted contour, and the right one is the sample effect after clipping.

3.4. Add the Edge

Since the edge information plays a very important role in the classification of oil blocks [34], this method uses a canny operator to calculate the edge information in each original image and appends the corresponding position information to the cropped image block. After adding the edge, the preprocessing phase of the image is ended [35,36], and the original image is divided into multiple sub-images, as shown on the right of Figure 7.

4. Results and Analysis

4.1. Identification Type of Remaining Oil

According to a large number of microscopic water flooding experiments, the remaining oil can be divided into two categories: (1) remaining oil unaffected: due to water injection and limited volume, remaining oil remains far from the main line. (2) remaining oil in water-flooded area: under the effect of wetting, the capillary force is injected into this area, and the remaining oil still forms residual oil, which cannot be extracted by water injection. Different oil types are indicated by the red arrow in Figure 8.
After water flooding, crude oil that has not been displaced can be divided into five types according to different displacement effects: oil droplet, column, cluster, blind end and film remaining oil. In this experiment, the remaining oil of these five types was detected by analyzing and processing images [37].

4.2. MobileNet Model Training

4.2.1. Dataset Information

After the extraction operation above, a total of 1779 original images of the four categories were obtained. Additionally, after data augmentation, this number increased to 7116 sheets. This data was divided into a training set, validation set and test set, which consisted of 5568, 1384 and 346, respectively. This data set was used to train the MobileNet classification model.
In order to carry out data amplification, the following operations were performed on each image for data expansion:
(a)
randomly rotate an angle less than 20 clockwise or counterclockwise;
(b)
scale the picture by multiplying a random number between 0.5 and 1;
(c)
translate the image randomly, with the displacement of 0 to 0.1 times the corresponding length and width.
The enhancement effect is shown in Figure 9.

4.2.2. Training Parameter

Training parameters are as follows: the basic learning rate is 0.01, the learning rate update policy is a poly method, poly can find the characteristic polynomial of an equation or square matrix with a vector as the solution, which makes the learning rate decrease during the training 100 epochs. The training accuracy for validation data and the test accuracy for the test dataset with the training epoch are shown in Figure 10.

4.3. Test Dataset

With the method of random selection, 346 images were selected as the test pictures from the total data set except the verification set of the training set.

4.4. Test Results

4.4.1. Test Dataset and Results

Of the 346 test images, 56 were identified incorrectly, so the accuracy rate was 83.8%. The results of test accuracy showed that the accuracy rate improved during the first 90 epochs, and in the subsequent epoch, the accuracy began to stabilize, oscillating between 90–100.
A confusion matrix was used for the statistical calculation of samples. Each column of the confusion matrix represents the predicted category, the total of each column represents the number of data predicted to be in this category, the sum of each row represents the number of real samples in this category and the sum of each row represents the number of samples predicted to be in this category. The details of the confusion matrix are shown in the following Table 1.

4.4.2. Ablation Test Dataset and Results

In order to further validate the precision of the proposed method, a glass etching model to simulate underground dense oil reservoir rock and pore structure was carried out by the micro displacement visualization experiment, obtaining 20 visual images. The images of the remaining oil were manually labeled and all types of remaining oil and its related area were marked in the image. Then, using the processing method mentioned above to process the 20 images, respectively, the classification model was used to classify the processed 20 images. As a result, the remaining oil types and their corresponding image areas were classified. The recall metric was calculated with an IoU greater than 0.5. As shown in Table 2, the recall rate and accuracy rate had a trade-off relationship. The recall rate of the columnar was relatively higher than the others. The accuracy rate of all the five oil forms was higher than 80%.
The test results shown in Figure 11a–c were correctly identified, while Figure 11d,e misidentified clusters into blind ends and columnar clusters into clusters.

5. Conclusions

This paper combines the traditional image processing method with a convolutional neural network to build a learning system for remaining oil shape recognition in a tight oil reservoir. It uses an adaptive threshold method to facilitate image binarization, allowing the oil block area to be well separated from the background and provides relevant parameter settings. A denoising operation was carried out on the binarization image, and OpenCV was used to extract the contour of the oil block area. Additionally, after the outer rectangle of the contour was calculated, it was time to clip. Then, a canny operator was used to calculate the edge information in the original image and attach it to the clipped image block. After the preprocessing of the image, data augmentation operation was carried out on the image, and the data were divided into a training set, test set and verification set, and the MobileNet classification model was trained with these data. The accuracy of the model was 83.8% using the test set data. With the development of convolutional neural networks, computer ability and computer vision, image recognition based on deep learning has far surpassed traditional images in accuracy and real-time. Its working speed is about 40% faster than that of traditional products. It has been proved that it is feasible to identify the remaining oil form using pictures through experiments. In addition, this paper describes in detail the construction process of the system and the features that should be retained in the pretreatment process, which are of great importance to classify and recognize through residual image preprocessing and image edge detection and image segmentation methods, using local images after processing to build a deep learning recognition module residual oil form database and taking advantage of the MobileNets model to train the data set. As a result, the final recognition result is more accurate; the accurate oil obtained form filled the blank in the research of remaining oil identification work, providing some reference for subsequent research work.
This paper adopts the MobileNets network structure. It can effectively reduce the amount of calculation, reduce the size of the model and better identify the oil form. MobileNets network structure is adopted to classify different types of image blocks to recognize the residual oil morphology of the layered deep convolutional neural network, but the achieved accuracy is still not high enough. However, judging from the current development of neural networks, 83.8% can be said to be a very accurate recognition rate. At present, there are many new methods of convolutional neural network research, such as SqueezeNet, Google Inception and Flattened network, all of which are very promising. However, these methods have not been widely applied to the study of residual oil morphology recognition. At the same time, image segmentation processing can still be regarded as one of the key points of future research.

Author Contributions

Data curation, X.S.; Formal analysis, X.S. and P.W.; Funding acquisition, L.Z.; Methodology, L.Z.; Software, L.C.; Visualization, F.L.; Writing—original draft, L.Z.; Writing—review & editing, L.Z. All authors have read and agreed to the published version of the manuscript.

Funding

National Natural Science Foundation: 61402099.

Institutional Review Board Statement

Not applicable.

Informed Consent Statement

Not applicable.

Conflicts of Interest

The authors declare no conflict of interest.

References

  1. Cheng, J.; Wu, J.; Hu, J. The key theory and technology of enhanced oil recovery by ASP flooding. Chin. J. Pet. 2014, 02, 310–318. [Google Scholar]
  2. Cai, Z. Study on the relationship between reservoir pore structure and oil displacement efficiency. Pet. Explor. Dev. 2000, 27, 45–49. [Google Scholar]
  3. Jamaloei, B.Y.; Kharrat, R.; Asghari, K.; Torabi, F. The influence of pore wettability on the microstructure of residual oil in surfactant-enhanced water flooding in heavy oil reservoirs: Implications for pore-scale flow characterization. J. Pet. Sci. Eng. 2011, 77, 121–134. [Google Scholar] [CrossRef]
  4. Yang, K. The Simulation Model Study of Microcosmic Remaining Oil; China University of Petroleum: Beijing, China, 2009. [Google Scholar]
  5. Zhang, W. Distribution of Remaining Oil after Polymer Flooding and Analysis of the Influencing Factors; Daqing Petroleum Institute: Daqing, China, 2010. [Google Scholar]
  6. Zhou, Z. Research on Object Recognition Based on Shape; National University of Defense Technology: Changsha, China, 2005. [Google Scholar]
  7. Yang, J. Practical Course in Artificial Neural Network; Zhejiang University Press: Hangzhou, China, 2001. [Google Scholar]
  8. Lin, Y.; Chen, X. BP neural network learning algorithm and its software implementation. Appl. Mech. Mater. 2014, 513–517, 738–741. [Google Scholar] [CrossRef]
  9. Chen, C.; Ji, G.; Wang, H.; Huang, H.; Baud, P.; Wu, Q. Geology-engineering integration to improve drilling speed and safety in ultra-deep clastic reservoirs of the Qiulitage structural belt. Adv. Geo-Energy Res. 2022, 6, 347–356. [Google Scholar] [CrossRef]
  10. Girshick, R.; Donahue, J.; Darrell, T.; Malik, J. Rich Feature Hierarchies for Accurate Object Detection and Semantic Segmentation. In Proceedings of the Computer Vision and Pattern Recognition (CVPR), 2014 IEEE Conference on IEEE, Columbus, OH, USA, 23–28 June 2014; pp. 580–587. [Google Scholar]
  11. Tang, Y.; Wang, Y.; Cooper, K.M.; Li, L. Owards Big Data Bayesian Network Learning-An Ensemble Learning Based Approach. In Proceedings of the 2014 IEEE International Congress on Big Data, Anchorage, AK, USA, 27 June–2 July 2014; pp. 355–377. [Google Scholar]
  12. Yan, Y.; Wang, B.; Sheng, Q.Z.; Mahmood, A.; Feng, T.; Xie, P. Modelling the Publishing Process of Big Location Data Using Deep Learning Prediction Methods. Electronics 2020, 9, 420. [Google Scholar] [CrossRef] [Green Version]
  13. Redmon, J.; Divvala, S.; Girshick, R.; Farhadi, A. You only look once: Unified, real-time object detection. In Proceedings of the Computer Vision & Pattern Recognition, Las Vegas, NV, USA, 27–30 June 2016; pp. 779–788. [Google Scholar]
  14. Szegedy, C.; Liu, W.; Jia, Y.; Sermanet, P.; Reed, S.; Anguelov, D.; Erhan, D.; Vanhoucke, V.; Rabinovich, A. Going deeper with convolutions. In Proceedings of the 2015 IEEE Conference on Computer Vision and Pattern Recognition (CVPR). IEEE Computer Society, Boston, MA, USA, 7–12 June 2015; pp. 1–9. [Google Scholar]
  15. He, K.; Zhang, X.; Ren, S.; Sun, J. Spatial Pyramid Pooling in Deep Convolutional Networks for Visual Recognition. IEEE Trans. Pattern Anal. Mach. Intell. 2015, 8691, 1904–1916. [Google Scholar] [CrossRef] [Green Version]
  16. Wang, X.; Guo, Y.; Qi, Z. The influence of activation function on the performance of BP network and its simulation research. Autom. Technol. Appl. 2002, 21, 15–17. [Google Scholar]
  17. Uijlings, J.R.; Van De Sande, K.E.; Gevers, T.; Smeulders, A.W. Selective Search for Object Recognition. Int. J. Comput. Vis. 2013, 104, 154–171. [Google Scholar] [CrossRef] [Green Version]
  18. Zeiler, M.; Fergus, R. Visualizing and Understanding Convolutional Networks. In Computer Vision–ECCV 2014.Springer International Publishing; Springer: Cham, Switzerland, 2014; pp. 818–833. [Google Scholar]
  19. Wang, L. Research and Discussion on Object Recognition Methods in Machine Vision; Fudan University: Shanghai, China, 2009. [Google Scholar]
  20. Lowe, D. Distinctive image fearures from scale-invariant keypoints. Int. J. Comput. Vis. 2004, 60, 91–110. [Google Scholar] [CrossRef]
  21. Xu, F.; Chen, Q.; Ma, M.; Wang, Y.; Yu, F.; Li, J. Displacement mechanism of polymeric surfactant in chemical cold flooding for heavy oil based on microscopic visualization experiments. Adv. Geo-Energy Res. 2020, 4, 77–85. [Google Scholar] [CrossRef] [Green Version]
  22. Zhou, D. Research on the application of BP neural network sample data preprocessing. World Sci. Technol. Res. Dev. 2012, 34, 27. [Google Scholar]
  23. Hu, B.; Guan, K. An improved neural network data preprocessing method and its application in construction management. Chin. J. Civ. Eng. 2004, 37, 106–110. [Google Scholar]
  24. Li, W. Research and Application of Deep Learning in Image Recognition; Wuhan University of Technology: Wuhan, China, 2014. [Google Scholar]
  25. Liu, J.; Ma, S.; Shen, W.; Zhou, J.; Hong, Y. Image feature recognition and gas permeability prediction of Gaomiaozi bentonite based on digital images and machine learning. Adv. Geo-Energy Res. 2022, 6, 314–323. [Google Scholar] [CrossRef]
  26. Schölkopf, B.; Platt, J.; Hofmann, T. Efficient sparse coding algorithms. In Advances in Neural Information Processing Systems 19: Proceedings of the 2006 Conference; MIT Press: Cambridge, MA, USA, 2007; pp. 801–808. [Google Scholar]
  27. David, V.; Sanchez, A. Advanced support vector machines and kernel methods. Neurocomputing 2003, 55, 5–20. [Google Scholar]
  28. Campbell, C. Kernel methods: A survey of current techniques. Neurocomputing 2002, 48, 63–84. [Google Scholar] [CrossRef]
  29. Na’Imi, S.; Shadizadeh, S.; Riahi, M.; Mirzakhanian, M. Estimation of reservoir porosity and water saturation based on seismic attributes using support vector regression approach. J. Appl. Geo-Phys. 2014, 107, 93–101. [Google Scholar] [CrossRef]
  30. Alanazi, A.; Gates, I. Support vector regression to predict porosity and permeability: Effect of sample size. Comput. Geosci. 2012, 39, 64–76. [Google Scholar] [CrossRef]
  31. Kong, D.; Gao, J.; Lian, P.; Zheng, R.; Zhu, W.; Xu, Y. Characteristics of gas-oil contact and mobilization limit during gas-assisted gravity drainage process. Adv. Geo-Energy Res. 2022, 6, 169–176. [Google Scholar] [CrossRef]
  32. Krizhevsky, A.; Sutskever, I.; Hinton, G. Imagenet classification with deep convolutional neural networks. Adv. Neural Inf. Processing Syst. 2012, 25, 50–52. [Google Scholar] [CrossRef]
  33. Deng, L.; Li, J.; Huang, J.-T.; Yao, K.; Yu, D.; Seide, F.; Seltzer, M.; Zweig, G.; He, X.; Williams, J.; et al. Recent advances in deep learning for speech research at Microsoft. In Proceedings of the IEEE International Conference on Acoustics, Vancouver, BC, Canada, 26–31 May 2013; pp. 8604–8608. [Google Scholar]
  34. Li, F. Convolutional Neural Network and Its Applications; Dalian University of Technology: Dalian, China, 2014. [Google Scholar]
  35. Glorot, X.; Bengio, Y. Understanding the difficulty of training deep feedforward neural networks. J. Mach. Learn. Res. 2010, 9, 249–256. [Google Scholar]
  36. Yang, P.; Guo, H.; Yang, D. Determination of Residual Oil Distribution during Waterflooding in Tight Oil Formations with NMR Relaxometry Measurements. Energy Fuels 2013, 27, 5750–5756. [Google Scholar] [CrossRef]
  37. Zhou, Z.; Slaný, M.; Kuzielová, E.; Zhang, W.; Ma, L.; Dong, S.; Zhang, J.; Chen, G. Influence of reservoir minerals and ethanol on catalytic aquathermolysis of heavy oil. Fuel 2022, 307, 121871. [Google Scholar] [CrossRef]
Figure 1. Design diagram of residual oil shape recognition system.
Energies 15 05367 g001
Figure 2. (a) Standard convolution. (b) Depthwise convolutional layers. (c) Point convolution: 1 × 1 convolution layer in depthwise separable convolution.
Energies 15 05367 g002
Figure 3. Flowchart for identifying residual oil.
Energies 15 05367 g003
Figure 4. Effect comparison before and after binarization.
Energies 15 05367 g004
Figure 5. The effect map before and after removing the connected regions whose sum of the number of pixels is less than 300.
Energies 15 05367 g005
Figure 6. Extracting outline and cutting effect diagram.
Energies 15 05367 g006
Figure 7. Preprocessing effect diagram.
Energies 15 05367 g007
Figure 8. The different types of remaining oil.
Energies 15 05367 g008
Figure 9. Data augmentation effect diagram, (a) Original image, (b) Rotation (c), Translation, (d) Zoom.
Energies 15 05367 g009
Figure 10. MobileNet neural network training accuracy and loss function change.
Energies 15 05367 g010
Figure 11. Test results examples.
Energies 15 05367 g011
Table 1. Confusion matrix of the test result.
Oil DropletColumnarTuftedBlind EndMembranous
Oil droplet583423
Columnar273613
Tufted236244
Blind end251583
Membranous132238
Table 2. Test result.
Recall RateAccuracy Rate
Oil droplet60%80%
Columnar70%84%
Tufted67%83%
Blind end67%82.4%
Membranous64%84%
Publisher’s Note: MDPI stays neutral with regard to jurisdictional claims in published maps and institutional affiliations.

