Article

Promoting the Diffusion of New Energy Vehicles under Dual Credit Policy: Asymmetric Competition and Cooperation in Complex Network

1
School of Economics and Management, Wuhan University, Wuhan 430072, China
2
Beibu Gulf Ocean Development Research Center, Beibu Gulf University, Qinzhou 535011, China
*
Author to whom correspondence should be addressed.
Energies 2022, 15(15), 5361; https://doi.org/10.3390/en15155361
Submission received: 24 June 2022 / Revised: 21 July 2022 / Accepted: 21 July 2022 / Published: 24 July 2022
(This article belongs to the Section E: Electric Vehicles)

Abstract

:
This study aims to investigate the impact of dual credit policy on the diffusion of new energy vehicles (NEVs) from the perspective of complex interactions among heterogeneous manufacturers. Thus, the market competition and credit cooperation relationships, constituting the complex interrelated system in NEV diffusion, are considered in this paper. To this end, we established a double-layer complex network to depict the asymmetric competition and cooperation structure, and developed an evolution game model on network, revealing the diffusion rule and trend of NEVs among manufacturers. Simulation results show that the existence of credit cooperation relationship can effectively improve the diffusion of NEVs, especially when implementing cooperative strategy that prioritizes helping manufacturers with low sale profits. Such a cooperative strategy is effective for maintaining high diffusion of NEVs even under low NEV credit’s trading price. Meanwhile, the monopoly competitive structure characterized by scale free is harmful to NEV diffusion. However, credit cooperation can eliminate the by-effect of monopoly structure greatly by adopting the strategy of distributing by sale profits. In addition, manufacturers are advised to learn from their competitors during the evolutionary process, which should be the focus of manufacturers to maximize the NEV diffusion under small world competitive structure.

1. Introduction

The prevalence of fuel consumption vehicles (FVs) has brought great challenges to greenhouse gases’ control and environmental pollution’s governance [1]. Transportation became the main contributor to the total pollutant emissions in 2019, where the emissions of carbon monoxide, hydrocarbons, nitrogen oxides, and particulate matter reached 16.038 million tons [2]. Thus, new energy vehicles (NEVs), which are powered by clean energy, have captured the interest of the governments and manufacturers recently [3]. As an increasingly attractive transportation option, NEVs are considered to be beneficial to mitigating carbon emissions and air pollution [4], and have achieved burgeoning development over the past decade [5]. However, manufacturers engaged in the production of NEVs are mostly newly founded enterprises, like Tesla and NIO. The electrical transition among traditional manufacturers still remains in its infancy.
Existing researches unanimously recognize the main role played by policy in stimulating the diffusion of NEVs [6,7,8]. In China, the government issued “The Passenger Cars Corporate Average Fuel Consumption and New Energy Vehicle Credit Regulation” in 2017 (i.e., dual credit policy) [9]. As a new dominant motivator, the policy restricts manufacturers’ production strategy by changing the cost composition of producing FVs and NEVs owing to additional expenditures for credit compliance. Producing NEVs will be rewarded, whereas producing FVs with high fuel consumption will be punished, which are driven by a credit trading market. This study, therefore, is interested in modeling the impact of the dual credit policy on the diffusion of NEVs among manufacturers.
In addition, complex interaction relationships play a critical role in determining the economic consequences of policy regulation [10]. The complex interrelated system composed of heterogeneous agents makes the behavior of internal members highly interconnected, where the agent’s micro behavior externally influences the behaviors of others, thus determining the evolution direction of the system [11]. Previous literatures mainly focused on policy effect, while ignoring the interconnections arising from the complex interactions among heterogeneous manufacturers in the analysis of NEV diffusion.
For the NEV diffusion system, the interactions between vehicle manufacturers present complex and diversiform characteristics. On the one hand, owing to the limited market demand and substitution effect among vehicle products, a competition relationship exists between heterogeneous manufacturers [12]. Policy incentives can increase the profit gap between manufacturers with different production strategies, which becomes a key driving force for manufacturers to change their strategies under the influence of market competition. This then contributes to the faster spread of a certain dominant strategy in the whole industry. Therefore, embedding the industrial competition relationship into the analysis of NEV diffusion analysis is greatly significant. On the other hand, previous researches related to dual credit policy usually choose a simplified dual credit model, among which the affiliated transfer mechanism has seldom been taken into account when analyzing the dual credit policy. However, due to the affiliated transfer mechanism, where affiliated manufacturers can transfer or accept positive corporate average fuel consumption credits between one another [13], a wide range of cooperation relationship exists among manufacturers, namely, they are credit cooperators. The cooperation in credits not only affects the final expenditures on credit compliance, but also complicates the interactive structure among manufacturers. To date, there has been little knowledge on the impact of this interaction relationship. Furthermore, competitors and cooperators of each vehicle manufacturer may differ from one another, thus forming an asymmetric competitive and cooperative relationship among heterogeneous manufacturers.
Consequently, this paper aims to investigate the impact of dual credit policy on the diffusion of NEVs considering the complex interactions among multiple heterogeneous manufacturers. Specifically, this paper develops a network evolutionary game model to explore the evolution of a manufacturer’s production decision under the impact of dual credit policy, and analyzes the law that promotes the diffusion of NEVs at the supply side focusing on the interaction of competition and cooperation. To this end, a double-layer complex network is established to depict the interactive relationships among manufacturers, and the dynamic evolution of manufacturer’s decisions based on their learning behaviors on the network is presented. Therefore, this paper mainly makes two new contributions. First, based on previous analysis, this paper explores the asymmetric competition and cooperation interactions in the NEV diffusion system, and clarifies manufacturers’ best responses under different competition strengths and cooperation strategies, which provides a reference for exploring more interactive relationships in future. Additionally, this paper develops a double-layer complex network to depict this complex interactive structure, providing a basis for analyzing a heterogeneous interactive relationship and structure among multiple agents. Second, the complex interactions among manufacturers are further introduced into the analysis of manufacturers’ production decisions. On the basis of policy and a manufacturer’s production factors, this paper further explores the evolutionary law of NEV diffusion from industry interactive relationships and structures. Thus, managerial implications are provided on the diffusion of NEVs on the supply side from multiple perspectives.
The remaining sections of this paper are arranged as follows. Section 2 reviews the previous related studies. Section 3 introduces the methodology and establishes a two-stage asymmetric competitive and cooperative double-layer network dynamic model to expound the diffusion rules of NEV. Furthermore, a Monte Carlo simulation is used to solve the network dynamic model and analyze the sensitivity of some key factors in Section 4. Finally, main conclusions and managerial implications are summarized in Section 5. The analytical framework is shown in Figure 1.

2. Literature Review

2.1. Research on Incentive Policy

In recent years, the development of NEVs in China is mostly backed with the incentive of the government’s policy [5]. In particular, the implementation of financial subsidies has dominated the emergence and development of NEV production over the past few years [14,15]. Shao et al. found that the government prefers subsidy incentive rather than price discount under the monopoly market [16]. Although the subsidy mechanism prospered the NEV industry especially from 2013 to 2016 [17], local and central governments gradually realized that massive subsidies bring tremendous financial pressure to them at the same time. Therefore, drawing lessons from Corporate Average Fuel Economy policy and California’s Zero Emission Vehicle program, the Chinese government issued the dual credit policy to substitute the subsidy mechanism in 2017. Dual credit policy sets NEV credit targets and CAFC credit targets for every vehicle manufacturer. Only positive NEV credit can be traded among manufacturers and offset the negative NEV credit [13]. Moreover, the deficit in CAFC credit can be offset through purchasing positive NEV credits or accepting positive CAFC credits from affiliated manufacturers [13].
Compared with the subsidy mechanism, the dual credit policy is more economic and efficient for the Chinese government to achieve the goal of reducing fuel consumption, promoting the transformation to NEV production of vehicle manufacturers, and improving market penetration of NEVs [5]. For example, Ou et al. found that the sale of plug-in electric vehicles increases under CAFC credit rules alone [18]. Additionally, battery electric vehicles’ sale is the highest under the dual credit scenario. Hsieh et al. argued that the implementation of dual credit policy will promote the growth of NEV sales until 2030 [19]. Meanwhile, some researchers paid attention to the decision making and strategy optimization of manufacturers under the influence of the dual credit policy. Luo et al. investigated the optimal production and fuel economy improvement level of FVs under the dual credit policy [20]. The model results show that the dual credit policy helps FV manufacturers to reduce the average fuel consumption level and production of high fuel consumption vehicles only in certain conditions, including the year-end dual credit meeting of NEV and FV standard, and a higher NEV accounting multiple discounts. Li et al. established a MILP model to solve the optimal production and pricing for NEV–FV double supply chain and determine the profits under the intervention of the dual credit policy [21]. The NEV supply chain’s profits increase, whereas the profits of FV and whole supply chain decline. However, the literature mentioned above ignored the complex interaction among heterogeneous manufacturers.

2.2. Research on Interactive Relationship among Multiple Agents

Some existing studies consider the interaction between different agents in the analysis of NEV diffusion. Li et al. considered the interactions of the government, manufacturers, and consumers using a complex network evolutionary game model and investigated the dynamic impacts of different incentive policies on NEV diffusion [22]. Similarly, Hu et al. introduced the strategic learning behaviors between manufacturers and established a small world network evolutionary game model to explore the diffusion rules of NEV under different policies [23]. However, these studies do not consider the specific interactive relationship between multiple heterogeneous manufacturers and most of them only consider the learning behaviors as the way a manufacturer interacts in network dynamic context. Moreover, in the analysis of low carbon production, some scholars incorporated the competitive relationship between supplier or retailer. For example, different from the previous assumption of monopolistic market, Bian and Zhao established a three-tier supply chain including one manufacturer and two competitive retailers to investigate the impact of taxes and subsidy on social welfare and manufacturers’ profits [12]. Yang et al. developed a game model with a government and two competing firms to investigate the equilibrium strategy of technology improvement for green products [24]. They found that government subsidy can effectively solve the prisoner’s dilemma between the two competing firms. Unlike previous studies, the present work further extends the competition relationship to N heterogenous vehicle manufacturers and develops the duopoly game into multi-agent game using a complex network. Additionally, besides the competition relationship this paper firstly considers, due to the specific policy environment in NEV diffusion, the credit cooperation relationship among affiliated manufacturers is also considered. Then, the industry’s complex competitive and cooperative structure are further developed in this paper.
In summary, studies listed above make a comparative and comprehensive discussion on the diffusion of NEVs and effectiveness of dual credit policy. However, existing literatures lack in-depth investigations on complex interactions among heterogeneous manufacturers under the impact of dual credit policy. This study develops a complex network evolutionary game model considering the asymmetric market competition and credit cooperation interactions among manufacturers to access the implications on NEV diffusion from industry interactive relationships.

3. Methodology and Modeling

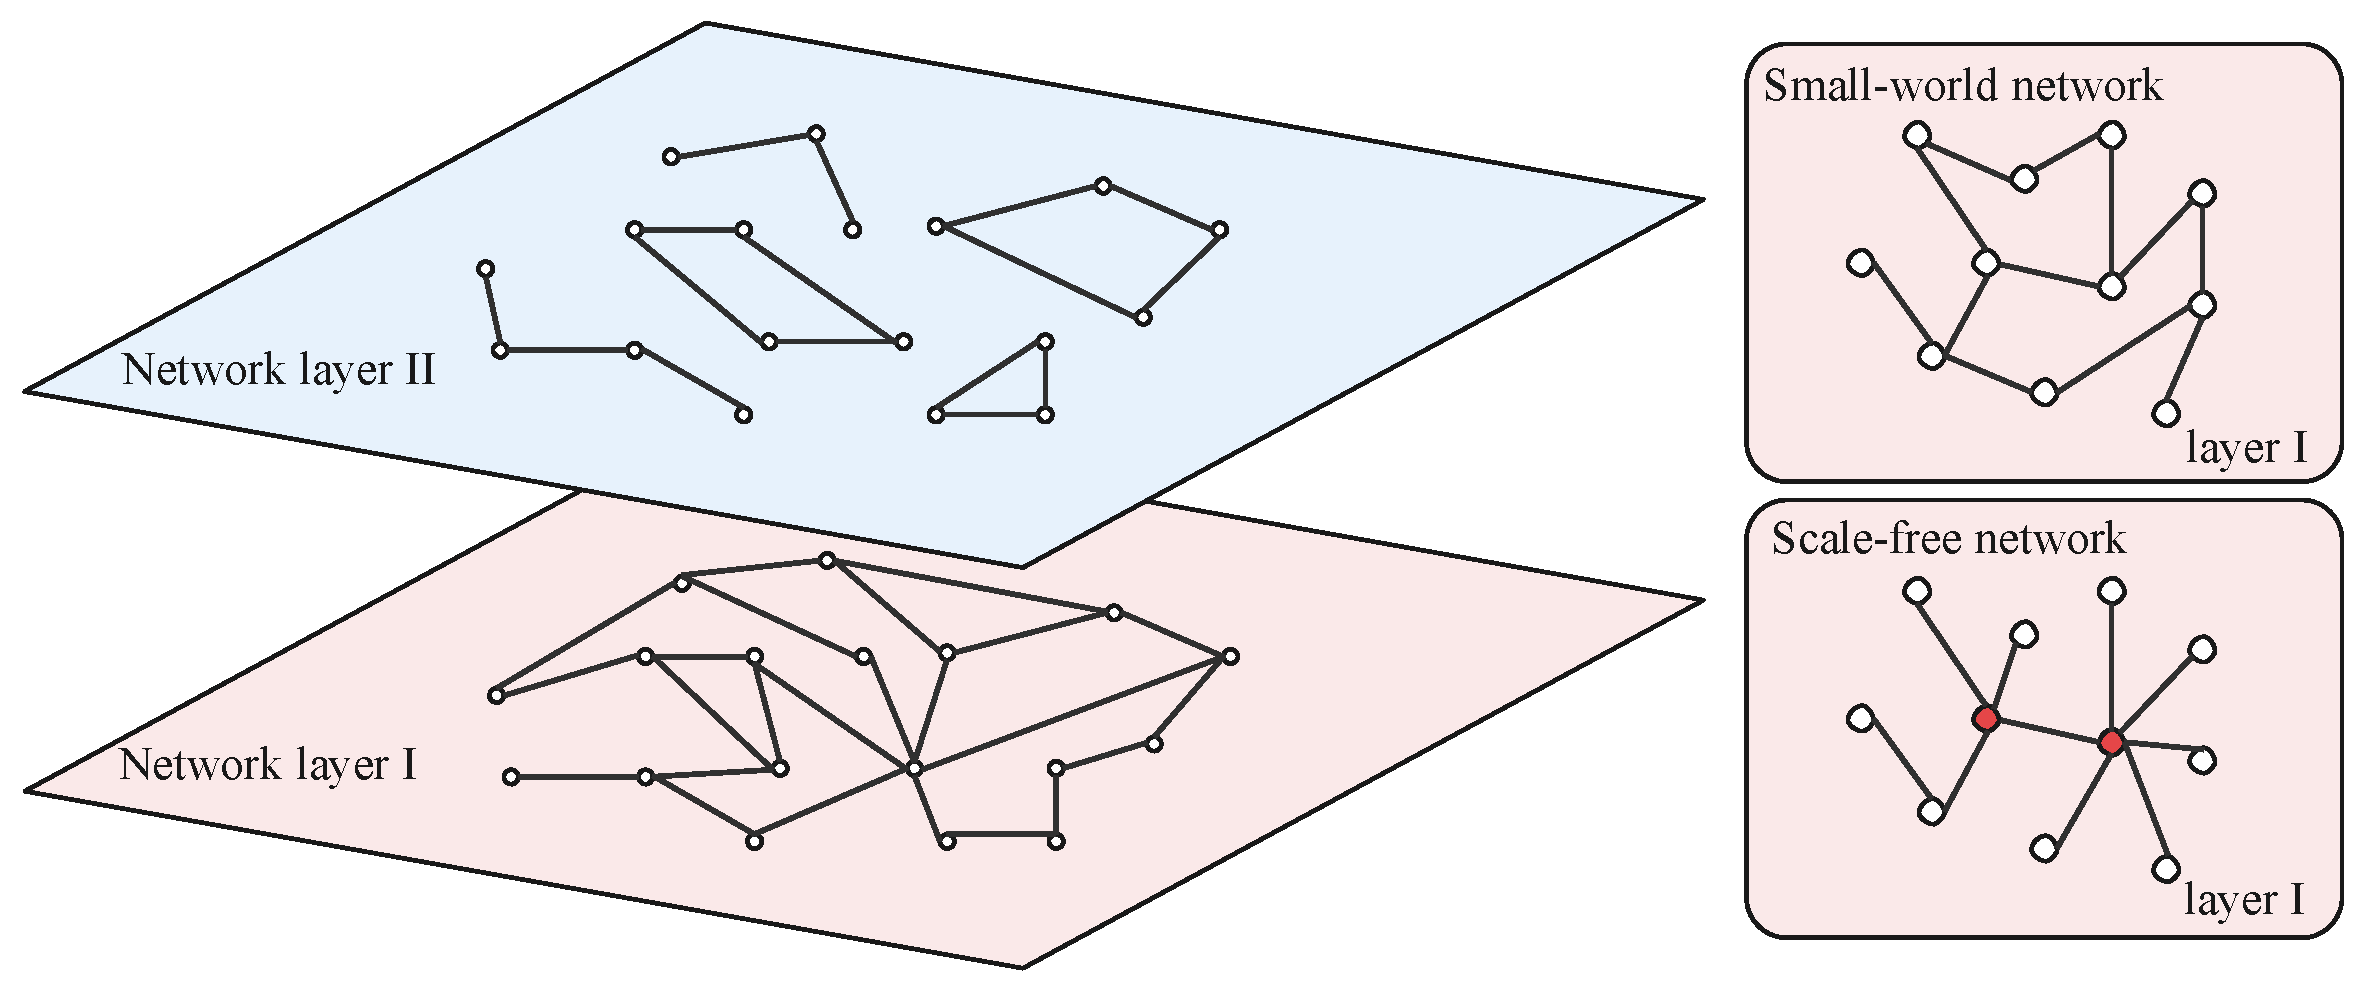
3.1. Interaction Structure on Complex Network

To depict the complex co-existence system of cooperation and competition, a double-layer complex network is developed to show the interactive structure and relationship among N vehicle manufacturers. The network includes competition structure in network layer I and cooperation structure in network II (see Figure 2). Nodes in network denote manufacturers and present one-to-one correspondence in the two layers. At network layer I, if the products of two manufacturers have a substitution effect for customers, an edge between them is attached, thus forming a complex network describing the competition relationship among N manufacturers. This study uses a small world network [25] and scale free network [26] to describe two common competitive structures. The competitive structure between manufacturers in a small world network is more well-distributed, whereas a few manufacturers have an impact on most manufacturers and assume a monopoly competitive position in a scale free network. At network layer II, the connection between nodes indicates that the manufacturers are affiliated manufacturers, which means that the positive CAFC credits can be transferred among them for free. The connection structure differs between the two layers.
Let the adjacency matrix of network layer I be A = [ A 1 , A 2 , , A N ] T , and A i = [ a i 1 , a i ( i 1 ) , 0 , a i ( i + 1 ) , , a i N ] , in which a i j = 1 ( i j ) denotes a connection between node i and node j. Let set of nodes that connected with node i in network layer I be Ω i , 1 . For network layer II, it is a disconnected network because at least two manufacturers belong to different affiliated groups, as shown in Figure 3. Therefore, in the specific credit cooperation among affiliated manufacturers, the point is figuring out the transfer priority and quota allocation because of direct and indirect affiliates. As shown in Figure 3, if manufacturer H has positive CAFC credits, as manufacturer G is directly connected with manufacturer H and manufacturer I indirectly, the credits would be transferred to G firstly instead of I. Meanwhile, manufacturer K is directly connected with H too, so the point is how to allocate the credits of H to G and K, which is further discussed below.
For the cooperative network, we have two representations. Firstly, we describe network layer II with weighted adjacency matrix B = [ B 1 , B 2 , , B N ] T , and B i = [ b i 1 , , b i ( i 1 ) , 0 , b i ( i + 1 ) , , b i N ] , in which b i j = 0 denotes no connection between nodes i and j and b i j 0 denotes that the connection exists. The specific value of b i j denotes the affiliated rate, which is mainly the proportion of shareholdings between manufacturers i and j according to the definition of the affiliated manufacturer. Let the set of nodes connected with node i in network layer II be Ω i , B . Secondly, we use bipartite network to describe network layer II, in which nodes are divided into two types: manufacturer nodes and group nodes, as shown in Figure 4. Let the adjacency matrix of bipartite network be G = [ G 1 , G 2 , G N ] T , and G i = [ g i 1 , , g i ( i 1 ) , 0 , g i ( i + 1 ) , , g i N ] , in which g i j = 0 denotes that manufacturer j does not belong to group j, whereas g i j = 1 denotes that manufacturer j belongs to group i. Let set of nodes belong to group i in network layer II be Ω i , G . Further, let manufacturers that do not have affiliated manufacturers be a group of their own. In Figure 3 and Figure 4, balls of same color indicate that they belong to the same group.

3.2. Manufacturer’s Behavior Analysis

In a vehicle industry consisting of N heterogeneous manufacturers, manufacturers can produce FVs and NEVs with varying costs of production given their different R&D, production, and management capabilities. Moreover, the NEVs or FVs produced are partially substitutive to customers. Thus, a multi-agent Bertrand game model, which is always used in the analysis of manufacturers’ price war [27], is adopted to depict this substitutive effect among N manufacturers in this study.

3.2.1. Model Assumptions

  • A three-stage model is established based on the manufacturer’s behavior, including market competition, credit cooperation, and strategy updating. At the stage of market competition, N vehicle manufacturers make their optimal pricing decision in the competitive environment of network layer I according to the multi-agent Bertrand game model, obtaining their market profits and initial CAFC credits. At the stage of credit cooperation, according to the affiliated structure of network layer II, final CAFC credit of each vehicle manufacturer are calculated, so they incur extra expenditure of credit compliance. At the stage of strategy updating, the total revenue of each vehicle manufacturer is obtained by synthesizing their market profits and expenditure of credit compliance, and the production strategy is updated based on related updating rule;
  • The positive CAFC credits transferred are assumed free because they are cooperators, so FV manufacturers are willing to seek for help from their affiliated manufacturers at first. For the part that cannot be eliminated through credit transfer, purchasing NEV credits in the market is the only way to meet the requirement of dual credit policy. Meanwhile, the positive CAFC credits cannot be traded, thus generating no profit for manufacturers. The fuel consumption level of manufacturers is assumed to remain stable, that is, the positive or negative of year-end CAFC credit generated will not change. The CAFC credits carried forward from previous years do not require the elimination of negative CAFC credits generated this year. Therefore, the carry-forward of positive CAFC credits from previous years is not considered in this study.

3.2.2. Model Analysis

1.
Competitive analysis
The alternative strategy of manufacturer i is x i { 0 , 1 } , where x i = 1 means choosing to produce NEV and x i = 0 equals to produce FV. According to the multi-agent Bertrand model, the market demand of each manufacturer is affected by the product price of other manufacturers. Let the influence coefficient matrix of market demand be [ M 1 , M 2 , , M N ] T , and M i = [ m i 1 , , m i ( i 1 ) , 0 , m i ( i + 1 ) , , m i N ] , where m i j { m i j 1 , m i j 2 ,   m i j 3 , m i j 4 } . The specific value of m i j is determined by their production strategy, and m i j 1 means that manufacturer i and j all produce NEV. m i j 2 means that manufacturer i produces NEV while j produces FV. m i j 3 means that manufacturer i produces FV but j produces NEV, and m i j 4 means that manufacturer i and j all produce FV. Let the vehicle’s price matrix of N manufacturers be P = [ P 1 , P 2 , , P N ] T , where P i means the vehicle’s price produced by manufacturer i . P i { P i 1 , P i 2 } , which is determined by the strategy chosen by manufacturer i , where P i 1 matches NEV and P i 2 matches FV. Consumers’ sensitivity of price of vehicles produced by manufacturer i is set to h i { h i 1 , h i 2 } , where h i 1 stands for NEV and h i 2 stands for FV. m i j < h i , which means that the effect of price sensitivity is bigger than that of product substitution. Therefore, let the market demand of vehicles produced by manufacturer i be D i , then the expression of D i is as follows:
D i = Q i h i P i + j Ω i m j i P j = Q i h i P i + A i M i P
Q i represents the maximum demand of vehicles of manufacturer i , and is Hadamard product, which denotes the multiplication of elements of the corresponding position in two matrices. The profit of the manufacturer is calculated below. In the context of subsidy mechanism and dual credit policy, the production cost of manufacturer is changed given the subsidy given by government and compliance requirements of dual credit. Specifically, each NEV produced can obtain subsidy and generate positive NEV credits, which can be traded in credit market with price P 3 . Let positive NEV credits generated by a single NEV be f 1 . Additionally, negative CAFC credit and certain proportion (t) negative NEV credit are generated with each FV produced. Let the production cost of manufacturer i be C i { C i 1 , C i 2 } , where C i 1 = C i N S f 1 P 3 stands for the cost of NEV and C i 2 = C i F + t P 3 stands for the cost of FV.
Therefore, the profit of manufacturer i is as follows:
K i = ( P i C i ) × D i = ( P i C i ) × ( Q i h i P i + A i M i P )
K i is a convex function of P i . The maximum profit is obtained when the derivative of K i is zero. Let K i P i = 0 , and the reaction function of i can be obtained:
P i = F ( P j ) = Q i + h i C i + A i M i P 2 h i .
The reaction function of other manufacturers can be obtained in the same way. The optimal price of N manufacturers can be solved through combining these N reaction functions.
To facilitate the calculation, let W = [ W 1 , W 2 , , W N ] T , and W i = Q i + h i C i 2 h i ,
H = [ 1 2 h 1 ,   1 2 h 1 , , 1 2 h 1 1 2 h 2 ,   1 2 h 2 , , 1 2 h 2 1 2 h N ,   1 2 h N , , 1 2 h N ] N × N ,   A = [ a 11 ,   a 12 , , a 1 N a 21 ,   a 22 , , a 2 N a N 1 ,   a N 2 , , a N N ] N × N , M = [ m 11 ,   m 12 , , m 1 N m 21 ,   m 22 , , m 2 N m N 1 ,   m N 2 , , m N N ] N × N .
Subsequently, the optimal price matrix of N manufacturers is P # = ( E H A M ) 1 W , namely, [ P 1 # , P 2 # , , P N # ] T = ( E H A M ) 1 W .
Proof: According to the analysis above, P = W + H A M P   ( E H A M ) P = W . In addition,
E H A M = [ a 11 m 11 2 h 1 + 1 , a 12 m 12 2 h 1 , , a 1 N m 1 N 2 h 1 a 21 m 21 2 h 2 , a 22 m 22 2 h 2 + 1 , , a 2 N m 2 N 2 h 2 a N 1 m N 1 2 h N , a N 2 m N 2 2 h N , , a N N m N N 2 h N + 1 ] N × N = [ 1 , a 12 m 12 2 h 1 , , a 1 N m 1 N 2 h 1 a 21 m 21 2 h 2 ,   1 , , a 2 N m 2 N 2 h 2 a N 1 m N 1 2 h N , a N 2 m N 2 2 h N , , 1 ] N × N
If matrix above is irreversible, at least two column vectors of matrix are correlated. Let α i ,   α j be correlated, then a proportion β satisfies α i = β × α j , so the following formula is given:
{ 1 = β × a i j m i j 2 h i a j i m j i 2 h j = β a i j m i j a j i m j i 4 h i h j = 1 .
However, because 0 < m i j < h i ,   0 < m j i < h j , so a i j m i j a j i m j i 4 h i h j < a i j a j i 4 < 1 .
Therefore, the solution of the formula above does not exist, meaning that the matrix ( E H A M ) is reversible.
Therefore, the optimal price matrix of N manufacturers is as follows:
[ P 1 # , P 2 # , , P N # ] T = ( E H A M ) 1 W .
Then, the demand and profit of N manufacturers can be obtained by substituting the optimal price. Let demand matrix of N manufacturers be D = [ d 1 , d 2 , , d N ] and profit matrix be K C O = [ K 1 , K 2 , , K N ] . To facilitate the calculation, let sets G = d i a g ( h 1 , h 2 , , h N ) , Q = [ Q 1 , Q 2 , , Q N ] T , and C = [ C 1 , C 2 , , C N ] T . Then, the demand matrix is
D = Q + ( E + A ) ( G + M ) P = Q + ( E + A ) ( G + M ) ( E H A M ) 1 W  
The profit of manufacturer i is
K i ( t ) = ( P i # ( t ) C i ( t ) ) × ( Q i h i P i # ( t ) + j = 1 N ( A i M i ) j P j # ( t ) ) .
Therefore, the profit matrix of N manufacturers is
K c o = ( P C ) D = ( ( E H A M ) 1 W C ) ( Q + ( E + A ) ( G + M ) ( E H A M ) 1 W ) .
2.
Cooperative analysis
This section focuses on the cooperative strategy of positive CAFC credits among affiliated manufacturers. To figure out the distribution rules in consideration of priority in transferring and quota allocation mentioned above, this section puts forward two credit cooperative strategies (allocation methods). One is seeking an absolute fairness in allocation from the perspective of each manufacturer, and the other is maximizing the group profits from the perspective of an affiliated group.
(1)
Cooperation based on affiliated rate
If the credit cooperative strategy of seeking absolute fairness is pursued in the allocation of positive CAFC credit, a natural solution is to allocate according to affiliated relationship and rate among affiliated manufacturers strictly. Considering the coexistence of direct and indirect affiliate relationship and the difference in affiliated rate, manufacturers directly affiliated with those with positive CAFC credit will take precedence in allocating over manufacturers that are indirectly affiliated. The positive CAFC credits are allocated according to the proportion of affiliated rate among manufacturers that are directly affiliated. The specific calculation of allocating is as follows.
The calculation of distribution can be divided into two steps, namely, before transferring and after transferring.
Step 1: Before the transfer among affiliated manufacturers, the CAFC credit of manufacturer i is
C R C A F C , 1 , i = ( C A F C T C A F C ) × D i = ( F C i , T × D i D i F C i × D i D i ) × D i .
F C i represents the actual fuel consumption per 100 km (L/100 km) of vehicles produced by manufacturer i. F C i , T represents the standard fuel consumption per 100 km (L/100 km) of vehicles produced by manufacturer i . Let F = [ f 1 , f 2 , , f N ] T , where f i = F C i , T F C i V i , which means the fuel consumption level of manufacturer i .
Step 2: After obtaining the CAFC credit of each manufacturer, the positive CAFC credits are transferred according to the affiliated structure in network layer II. Assume that G affiliated groups exist, so the calculation should run for G times. To be specific in one calculation, the sum of CAFC credit of all manufacturers in group g needs to be calculated first. If the sum of CAFC credit is nonnegative, namely, j g C R C A F C , 1 , j 0 , then all manufacturers in group i can meet the requirement of CAFC credit rule through credit cooperation. Thus, extra expenditure on offsetting the negative CAFC credit of each manufacturer is zero. However, if the sum of CAFC credit is negative, namely, j g C R C A F C , 1 , j < 0 , there must be some manufacturers in group g that fail to fill up the vacancy of negative CAFC credit. They incur extra expenditure even after transferring. At this moment, what needs to be decided is which manufacturers should pay the extra expenditure and how much they will pay. For manufacturers whose CAFC credit is positive before transfer, the CAFC credit transferred will not exceed what they have originally. Therefore, these manufacturers will not incur any additional expenses after transfer. By contrast, because j g C R C A F C , 1 , j < 0 , the CAFC credit of manufacturers with positive ones before transfer will return to zero after sufficient transfer. For manufacturers whose CAFC credit is negative before transfer, the calculation of final CAFC credit after transfer is explained in detail below.
With respect to the allocation of positive CAFC credit among manufacturers with negative CAFC credit before transfer, we can dissect it into two aspects, one is the transfer logic of manufacturers with positive CAFC credit, and the other is the accept logic of manufacturers with negative CAFC credit. For manufacturer j whose CAFC credit in step 1 is positive, the weighted adjacent matrix of j is B j = [ b j 1 , , b j ( j 1 ) , 0 , b j ( j + 1 ) , , b j N ] . Additionally, let the set of neighbor manufacturers of j with negative CAFC credit be Ω j , . For manufacturer k whose CAFC credit in step 1 is negative, the weighted adjacent matrix of k is B k = [ b k 1 , , b k ( k 1 ) , 0 , b k ( k + 1 ) , , b k N ] . Let the set of neighbor manufacturers of k with positive CAFC credit be Ω k , + . Then, if the set Ω j , is a null set, manufacturer j still needs to transfer its positive CAFC credit because the total CAFC credit of group g is less than zero. We assume that the positive CAFC credit of j will be transferred to a neighbor manufacturer at random. If manufacturer k with negative credit exists in the neighbor of j , the transfer amount of positive CAFC credit from j to k is ( C R C A F C , j × b j k l Ω j , b j l , | C R C A F C , k | ) , namely, the smaller one between distribution amount according to the proportion of affiliated rate and actual demand amount of k . The accept amount of positive CAFC credit of k from j is ( | C R C A F C , k | × b k j l Ω k , + b k l , C R C A F C , j ) , namely, the smaller one between distribution amount according to the proportion of affiliated rate and maximum amount that can actually be supplied by j . Hence, the quota of positive CAFC credit transferred between k and j is determined by the minimum value of ( C R C A F C , j × b j k l Ω j , b j l , | C R C A F C , k | × b k j l Ω k , + b k l ) . Consequently, after one round transfer, all manufacturers’ CAFC credit are updated. At this time, if there still exists manufacturer with positive CAFC credit, a new round of transfer process above is needed until there is no positive CAFC credits for transferring.
For manufacturer k with negative CAFC credit, let the CAFC credit of k after t rounds of transfer be C R C A F C , k , t , and the set of neighbor manufacturers of k with positive CAFC credit after t rounds of transfer be Ω k , + , t . Thus, its iterative formula is
C R C A F C , k , t = C R C A F C , k , t 1 + Δ C R k , t 1 = C R C A F C , k , t 1 + j Ω k , + , t 1 ( C R C A F C , j , t 1 × b j k l Ω j , , t 1 b j l , | C R C A F C , k , t 1 | × b k j l Ω k , + , t 1 b k l )
For manufacturer j with positive CAFC credit, let the CAFC credit of j after t rounds of transfer be C R C A F C , j , t , and the set of neighbor manufacturers of j with negative CAFC credit after t rounds of transfer is Ω j , , t . Thus, its iterative formula is
C R C A F C , j , t = C R C A F C , j , t 1 Δ C R j , t 1 = C R C A F C , j , t 1 k Ω j , , t 1 ( C R C A F C , j , t 1 × b j k l Ω j , , t 1 b j l , | C R C A F C , k , t 1 | × b k j l Ω k , + , t 1 b k l )
For affiliated group g , the final CAFC credit of manufacturer k after T i round of transfer is
C R C A F C , 2 , k = C R C A F C , 1 , k + t = 1 T i j Ω k , + , t ( C R C A F C , j , t × b j k l Ω j , , t b j l , | C R C A F C , k , t | × b k j l Ω k , + , t b k l ) .
The final CAFC credit of manufacturer j is
C R C A F C , 2 , j = 0
(2)
Cooperation based on sales profit
For the credit cooperative strategy of maximizing group benefit in the allocation of positive CAFC credit, objectively speaking, the benefits generated by transferring the same CAFC credit to different affiliated manufacturers are equal. However, for affiliated manufacturers with different sale profits, the utility caused by extra expense in purchasing positive NEV credit varies. The higher the sale profit of manufacturers, the smaller the impact of NEV credit expenditure is. Specifically, under the loss aversion effect and reference effect, the sensitivity of manufacturers with different sale performances to expenses on NEV credit is quite different. On the one hand, manufacturers with higher sale profit have stronger ability to bear extra cost, thus the utility loss by extra cost is much lower. On the other hand, losses on utility caused by NEV credit expenditure of manufacturers with negative sale profit are higher than those with positive sale profit.
Therefore, in pursuit of maximizing benefits of an affiliated group, a simple principle of distributing positive CAFC credit is to prioritize manufacturers with smaller sale profit, which is in line with the preferential assistance for weak affiliated manufacturers in reality. For affiliated group g , first, the sum of all positive CAFC credit that can be transferred is calculated, and all the sales profit of manufacturers with negative CAFC credit is obtained. The positive CAFC credit is then allocated in descending order of sales profit, that is, manufacturers with smaller sales profit are prioritized to accept positive CAFC credit to fill their deficiency. For manufacturers with the same sales profit, the priority and amount of positive CAFC credit distributed are the same.

3.2.3. Asymmetric Competition and Cooperation Analysis

After two stages of market competition and CAFC credit cooperation, the sales profit and credit expense are obtained, so the total profit of manufacturer i is derived as follows:
K i = ( P i C i ) × D i + ( C R C A F C , 2 , i , 0 ) × P 3 = ( P i C i ) × ( Q i h i P i + A i M i P ) + 𝟙 { C R C A F C , 2 , i < 0 } × C R C A F C , 2 , i × P 3 ,
where 𝟙 is indicator function.
To facilitate the calculation of profit matrix, let matrix C R C A F C = [ C R C A F C , 2 , 1 , C R C A F C , 2 , 2 , , C R C A F C , 2 , N ] T . All elements in C R C A F C are substituted into indicator function to derive value matrix ε = [ ε 1 , ε 2 , , ε N ] T , where ε i = 𝟙 { C R C A F C , 2 , i < 0 } . Therefore, the profit matrix of N manufacturers is
K = K C O + K C R = ( ( E H A M ) 1 W C ) ( Q + ( E + A ) ( G + M ) ( E H A M ) 1 W ) + P 3 × ε C R C A F C .
Furthermore, accompanied with the uninterrupted interaction, manufacturers are incentivized to readjust their production strategies to adapt to policy requirements and external competitive pressure. Different from the assumption in previous studies [22] manufacturers change their strategies only by imitating the strategies of other manufacturers with higher profits in a certain probability, which can be measured by Femi rule [28]. Manufacturers compare their profits with their neighbor manufacturers and decide to learn to a neighbor at Femi probability. Neighbors may come from competitors in network layer I or cooperators in network layer II. In fact, manufacturers are different from individuals in terms of changes in strategies. In addition to the influence of external neighbor manufacturers, manufacturers will make further decisions according to their own characteristics. Therefore, this study divides the motivation of strategy update into internal innovation spirit and external imitation behavior based on the principle of Bass model. Bass model is widely used for describing the diffusion of innovative technology among enterprises [29]. Let ρ depict manufacturers’ innovative characteristic, and ρ [ 0 , 1 ] means the tendency of manufacturers to choose NEV. Consequently, the probability of changing production strategy after one round interaction is
P x i x j = x j × ρ + ( 1 x j ) × ( 1 ρ ) 1 + exp [ ( K i K j ) / δ ]
P x i x j represents the probability that manufacturer i chooses imitating strategy from neighbors j . K i and K j represent the profit of manufacturers i and j , respectively. δ ϵ [ 0 , + ] shows the irrational degree of manufacturers.
Moreover, the diffusion rate γ of NEV among N manufacturers is set as
γ = 1 N × i = 1 N x i .

4. Numerical Simulation

4.1. Parameter Initialization Settings

To enhance the validity of the simulation results, the initial values of parameters are set as follows. According to the statistics of Table of Accounting for Average Fuel Consumption and New Energy Vehicle Credits of Chinese Passenger Car Manufacturers [30], the number of domestic vehicle manufacturers in China is 144. So let N = 144 , among which there are roughly 33 manufacturers mainly engaged in the production of NEV, so the initial diffusion rate is 23%. For NEV manufacturers, the maximum and minimum positive average CAFC credit are 6.67 generated by Tesla Vehicle Co., Ltd., Beijing, China, and 4.91 generated by Jiangxi JMC Group NEV Co., Ltd., Jiangling, China, respectively, so let the average CAFC credit generated by a NEV manufacturer take value from the interval [4.91, 6.67] randomly. As for FV manufacturers, the maximum positive and negative average CAFC credit are 4 generated by Anhui Jianghuai Vehicle Group Corp., Ltd., Jianghuai, China, and −5.31 generated by McLaren Automotive Sales Ltd., Shanghai, China, respectively, so let the average CAFC credit generated by an FV manufacturer randomly take value from the interval [−5.3, 4.0]. The average NEV credit generated by one unit of NEV is set as 3.36 [31]. The affiliated rate among manufacturers is higher than 25% [32] and lower than 50% normally in reality, so let the affiliated rate take value from the interval [0.25, 0.49] randomly.
The minimum and maximum average prices of FVs common in the market are approximately 46,000 and 500,000 yuan, respectively, according to the statistics in CPAC, an authoritative data sharing platform for the Chinese vehicle industry. The cost takes up more or less 40–50% of the price [33], so the FV cost of N manufacturers are set within the range [18,400, 250,000]. The extra cost for manufacturing a NEV is 20,000 higher for the investment on battery on average [21,34]. The average range of NEV is up to 391.4 km according to the statistics of recommended directory issued by MIIT in 2020 [32], so the average subsidy for NEV is set to 13,000 yuan according to Table A1 in Appendix A. The price sensitivity of consumers is assumed within the range [0, 1]. Let m i j be within the range [ 0 ,   h i j ] because m i j < h i j . The maximum sale amount is nearly 500,000 in 2019 according to the statistics of CPAC. To make the demand of each manufacturer nonnegative, Q is set within the range [500,000, 1,000,000]. Moreover, the NEV credit proportion is set to 14% [32]. The average degree of small world and scale free network are set to 16.8 according to the analysis in Appendix A.
Based on the initial value set above, the simulation is carried out 100 times independently, and the average value is taken as the final result because there are random parameters in the evolution process. The simulation runs on the platform of python/PyCharm.

4.2. Results and Discussion

4.2.1. Impact of Different Incentive Policies and Cooperative Strategies

This section aims to explore the impact of different incentive policies and cooperative strategies, including subsidy, dual credit policy without credit cooperation, and dual credit policy considering credit cooperation on the diffusion of NEVs under different cooperative strategies.
1.
Cooperation based on affiliated rate
Results in Figure 5 and Figure 6 show that the effect of dual credit policy is better than subsidy, which is consistent with previous conclusions, certificates that the substitution of the subsidy mechanism with the dual credit policy in reality from 2017 in China is rational and efficient. Meanwhile, under the cooperation strategy based on affiliated rate, the addition of cooperation mechanism has contributed a certain elevation in NEV equilibrium diffusivity, where the diffusivity can be elevated by 3–5%. The result shows that cooperation relationship meets the government’s expectation toward dual credit policy in reality. Credit cooperation has promoted the flexibility of dual credit policy and exhibited positive role in stabilizing credit market. Nowadays, the identification condition of affiliated manufacturers has been further relaxed in dual credit policy, which makes credit cooperation more available. However, it is noticeable that the effect is limited when implementing the cooperation strategy based on affiliated rate.
Furthermore, results show that the equilibrium diffusivities under small world competitive network are always higher than that under scale free competitive network, which means that the competitive structure of small world is more conductive to the diffusion of NEVs. The competition among manufacturers in small world network is more sufficient; thus, if the NEV production is a dominant strategy, it has potential to spread to the whole network through competitive strength and manufacturers’ learning behavior. Oppositely, the impact of core manufacturers in scale free network plays a leading role in the industry development. Once they adopt the strategy of producing FVs, it will be unfavorable to the diffusion of NEVs considering their influence power. Hence, sufficient competition provides more possibility for innovation product’s proliferation.
2.
Cooperation based on sale profit
If the credit cooperative strategy is distributing by sale profits, the diffusion results become quite different, as shown in Figure 7 and Figure 8.
Figure 7 shows the results in small world network, whereas Figure 8 shows the results in scale free network. The equilibrium diffusivity of NEV is significantly improved when the cooperative strategy of distributing by sale profit is adopted, especially in the competitive structure of scale free network. Specifically, the equilibrium diffusivity under the dual credit policy with ATM is 35% higher than that under dual credit policy only in small world network and 70% higher in scale free network. The effectiveness of cooperation mechanism is greatly stimulated by changing the credit cooperative strategy. It means that the purpose of setting dual credit policy is not to blindly increase the burden of FV manufacturers but to guide them to shift to the production of NEVs in a safe and smooth environment. In fact, in dual credit policy, there exists preferential measures for small vehicle manufacturers in credit calculation. Thereby, the preferential assistance for weak affiliated manufacturers is more beneficial to the transformation of FV manufacturers to NEV production. Compared results in Figure 6 and Figure 8, it implies that the existence of cooperation can eliminate the by-effect of monopoly structure greatly by adopting the strategy of distributing by sale profits, where some manufacturers can effectively eliminate the negative influence of monopoly manufacturers through credit cooperation.

4.2.2. Impact of Different Cooperative Strategies and Learning Strategies

This section aims to discuss the joint impact of cooperative strategy and learning strategy. Figure 9 shows the comparative results under small world network, whereas Figure 10 shows the comparative results under scale free network.
Under small world network, the optimal strategy combination is distributing by sale profit and learning from competitors because its equilibrium diffusivity reaches approximately 85%, which is 40–60% higher than that under other situations. From the perspective of single strategy, learning from competitors is always in a dominant position for the diffusion of NEVs, in which the equilibrium diffusivity is 60% or 20% higher than that under learning from cooperators. Similarly, under scale free network, the optimal strategy combination is distributing by sale profit and learning from competitors, and learning from competitors is always one of the dominant strategies.
Meanwhile, comparing the results shown in Figure 9 and Figure 10, the changing of learning strategy has a greater impact on the diffusion of NEVs under small world network. The adoption of learning from competitors can ensure that the equilibrium diffusivity reaches 50%. However, in scale free network, only with the joint implementation of learning from competitors and distributing by sale profit can diffusivity reach higher than 50%. Therefore, when the competitive structure is characterized by small world, the learning strategy should be the focus of manufacturers to maximize the diffusion of NEVs. In a monopoly competitive structure, requirements must be met not only for the learning strategy of manufacturers but also for credit cooperative strategy of affiliated groups.

4.2.3. Impact of Different NEV Credits Trading Price

This section aims to investigate the impact of NEV credit’s trading price on the diffusion of NEVs. The credit cooperative strategy directly affects the demand of NEV credit, which in turn affects the trading price of NEV credit, and the optimal learning strategy is learning from competitors according to Section 4.2.2. Therefore, this section investigates the impact of NEV credit’s trading price under four situations considering different competitive structures and credit cooperative strategies under learning from competitors.
Results in Figure 11, Figure 12, Figure 13 and Figure 14 show that the higher the NEV credit price, the higher the equilibrium diffusivity. At the early stage of the issuance of dual credit policy, one of the reasons for the ineffectiveness of policy is the low trading price of NEV credits in market [5]. The NEV credit’s trading price has a positive impact on the diffusion of NEV. Comparing the results between two credit cooperative strategies, the equilibrium diffusivity is the lowest when NEV credit’s trading price is 3000 under distributing by sale profit (shown in green lines in Figure 12 and Figure 14), which is still higher than that under distributing by affiliated rate when NEV credit’s trading price is 15,000 (shown in sky blue lines in Figure 11 and Figure 13). The implementation of distributing by sale profit significantly influences the NEV credit’s trading price’s effectiveness. Even if the NEV credit’s trading price is the lowest, it can maintain a high equilibrium diffusivity with the implementation of distributing by sale profit. When implementing the strategy of distributing by affiliated rate, the NEV credit’s trading price should maintain at high value to promoting the NEV diffusion. Comparing the results in small world network and scale free network, the equilibrium diffusivity increases more in small world network than in scale free network. This finding implies that the monopoly competitive structure has a negative impact on the effectiveness of NEV credit’s trading price. Therefore, the optimal composition that maximizes the effectiveness of NEV credit’s trading price is distributing by sale profit and small world competitive structure.

5. Conclusions

With the iteration of the NEV incentive policy in China, the dual credit policy has become the dominant motivator for promoting the production of NEVs in recent years. Thus, many researchers attached great interest on the analysis of the dual credit policy and published a series of investigations on the policy’s effectiveness and optimizations. However, existing research ignores the complex interaction relationships among heterogeneous manufacturers. To this end, this study develops a network evolutionary game model to reveal the vehicle manufacturers’ strategy game and strategy update process, where the asymmetric market competition and credit cooperation interaction relationships are established in a double-layer complex network. The main conclusions and managerial implications are summarized as follows.
  • The effectiveness of the dual credit policy is always better than that of the subsidy mechanism. However, the consideration of credit cooperation is not always outstanding for the diffusion of NEVs, which mainly depends on the credit cooperative strategy within affiliated groups. Only under the cooperative strategy that assists weak manufacturers first can the diffusion of NEVs be maximized;
  • To enhance the diffusion of NEVs, the optimal competitive structure for the vehicle industry is small world network. The optimal credit cooperative strategy for affiliated groups is distributing by sale profit, and the optimal learning strategy for vehicle manufacturers is learning from competitors. Therefore, the optimal composition is distributing by sale profit and learning from competitors in small world competitive structure. Additionally, in the competitive structure of small world, learning strategy is the focus of manufacturers to maximize the NEV diffusivity. Moreover, in the monopoly competitive structure, learning from competitors and distributing by sale profit should be implemented simultaneously to ensure high NEV diffusivity;
  • The higher the NEV credit’s trading price, the higher the NEV’s equilibrium diffusivity. The credit cooperative strategy greatly influences the effectiveness of NEV credit’s trading price. When the strategy of distributing by sale profit is implemented, the diffusion of NEVs under different NEV credit’s trading price becomes more stable and higher, which is beneficial to reduce the risk caused by the instability of NEV credit’s trading market. The competitive structure of small world is more conductive to the effectiveness of NEV credit’s trading price, where the NEV diffusivity becomes higher than in the monopoly competitive structure.
On the basis of the main conclusions, the following managerial implications can be put forward. First, the government should promote the credit cooperation among manufacturers, and relax the definition conditions of affiliated manufacturers. However, attention should be paid to the results of credit cooperation, for the small-scale or low profitability manufacturers, preferential accounting treatment can be given to relieve their credit compliance pressures, such as reducing their credit’s compliance standards. Second, the monopoly competitive structure is against the NEV diffusion. The government should prevent the formation of a competitive market with 2–8 distribution characteristics. Additionally, the government should actively guide the NEV credit’s trading and raise the market trading price. Through the prediction of NEV development, the government should adjust the calculation rules in advance to keep the balance of NEV credit’s supply and demand. Third, it is suggested for vehicle manufacturers to learn from their excellent competitors in the evolutionary process. At the same time, the affiliated groups should give priority to manufacturers with lower sale profits in credit cooperation, especially when NEV credit’s trading price is high. The affiliated group is suggested to properly prioritize weak manufacturers to accept positive CAFC credit in affiliated transferring. Doing so maximizes the incentive effect of dual credit policy.

Author Contributions

L.Y.: Writing—Original Draft, Formal analysis, Visualization, Methodology, Software. X.J.: Methodology, Writing—Original Draft, Data Curation, Supervision. Y.H.: Writing—review and editing, Visualization. Y.J.: Methodology, Writing—Original Draft. All authors have read and agreed to the published version of the manuscript.

Funding

This research was supported by National Natural Science Foundation of China, grant number 72171180.

Institutional Review Board Statement

Not applicable.

Informed Consent Statement

Not applicable.

Data Availability Statement

Not applicable.

Acknowledgments

The authors would like to acknowledge the financial support from the key research base of Humanities and Social Sciences in Guangxi Universities “Beibu Gulf Ocean Development Research Center”, China, grant number BHZXSKY2012.

Conflicts of Interest

The authors declare no conflict of interest.

Appendix A. Introduction to Dual Credit Policy

Dual credit policy sets new energy credit (NEV) targets and corporate average fuel consumption credit (CAFC) targets for every vehicle manufacturer. The specific calculations of CAFC credit and NEV credit are as follows:
C A F C c r e d i t = C A F C r e q u i r e d C A F C a c t u a l = i = 1 n ( f i ,   s t a n d a r d Q i ) i = 1 n Q i i = 1 n ( f i , a c t u a l Q i ) i = 1 n Q i K ,
where i stands for a different vehicle model,
f i , s t a n d a r d is the standard fuel consumption of vehicle i ,
f i , a c t u a l is the actual fuel consumption of vehicle i ,
Q i is the production of vehicle i , and
K is a multiplier that takes 100% in the next year.
N E V c r e d i t = N E V a c t u a l N E V r e q u i r e d = j = 1 m ( R j Q j ) ρ l g Q l ,
where j stands for a different NEV model,
l stands for a different FV model,
R j is the positive NEV credit generated by vehicle i ,
Q j is the production of vehicle j , and
ρ is the NEV credit proportion.
Moreover, in June 2020, the MIIT jointly issued “Decision on Amending ‘The Passenger Cars Corporate Average Fuel Consumption and New Energy Vehicle Credit Regulation’” with multiple departments. The decision modifies the qualification of affiliated manufacturers to three situations. (1) A domestic vehicle manufacturer indirectly or directly holds shares exceeding 25% of other domestic vehicle manufacturers. (2) Domestic vehicle manufacturers who indirectly or directly hold shares exceeding 25% of the same third party. (3) Imported auto supply manufacturers authorized by overseas vehicle manufacturers and domestic manufacturers indirectly or directly hold shares exceeding 25% of the overseas vehicle manufacturer.
Table A1. Subsidy scheme for NEV vehicles in 2021.
Vehicle TypePure Electric Cruising Range (R/km)
Pure electric vehicleR ≥ 300R ≥ 400R ≥ 50
1.31.8/
Plug-in hybrid vehicle/0.68
To acquire the specific network’s parameter, we take cars as an example, collecting relevant data to build the specific competitive network among manufacturers. Volkswagen firstly proposed the classification standard of automobiles, which divide automobiles into six levels, namely, A00, A0, A, B, C, and D, according to parameters such as wheelbase, displacement, weight, and so on. A00 is a miniature passenger car, A0 is a small passenger car, Class A is a compact passenger car, Class B is a medium-sized passenger car, Class C is a medium-sized passenger car, and Class D refers to a large passenger car. As this standard becomes widely accepted, we use it to depict the competitive relationship among autos, that is, substitution between autos that belong to the same level occurs. Table A2 shows the auto models on sale at all levels. The data come from GAIN price index analysis in April 2021 published by CPAC. Among which, A00 and D are not considered.
Table A2. Autos on sale at each level.
A0ABCRemarks
Yaris XExcelle XTSantanaBMW 3LAvalon HybridAudi A6LThe auto models selected mainly come from Anluqin price monitoring system.
ViosSylphy ClassicRalinkMagotanLacrosseBMW 5L
Polo HBBoraRoewe i5Honda AccordInspire Fuel versionBenz EL
Fit HBCorollaMonzaAudi A4LMazda 6 AtenzaVolvo S90
YuenaLavidaMazda 3 Axela NBCamryRaeton CCCadillac CT6The selection criteria for all levels are that the total sales volume of the car in the last quarter accounted for more than 90% of the total sales volume of the market segment.
YarisEmgrand EC7 NBMercedes ALAltimsVolvo S60
Vios FSSagitarLingke 03Benz CLMondeo
Yaris LCivicGolfRegal
YuexiangEado PlusBinruiPassat
TiidaCorolla HybridAvalon
Jetta VA3Ralink HybridCadillac CT5
CelestaAudi A3 LimousineHong Qi H5
LamandoBMW 1 NBMalibu XL
The above data come from the GAIN price index analysis in April 2021, Accessed at: http://www.cpcaauto.com/newslist.php?types=bgzl&id=983, accessed on 8 June 2021.
By sorting out the manufacturers of each auto model, we can determine the vehicle manufacturers participating in the auto production at all levels, as is shown in Table A3.
Table A3. Manufacturers participating in the auto production at each level.
A0ABC
Gac ToyotaShanghai GM BuickSAIC-GM ChevroletBrilliance BMWSaic VolkswagenBrilliance BMW
Faw ToyotaDongfeng NissanChangan MazdaBenzSAIC-GM ChevroletBenz
Saic VolkswagenFaw VolkswagenLYNK&COFaw VolkswagenFaw ToyotaFAW-Volkswagen Audi
Guangqi HondaFaw ToyotaFAW-Volkswagen JettaGuangqi HondaFaw MazdaCadillac
Beijing HyundaiSaic VolkswagenBeijing HyundaiFAW-Volkswagen AudiChangan automobileVolvo
Changan automobileGeely automobileFAW-Volkswagen AudiCadillacChangan Ford
Dongfeng HondaBrilliance BMWVolvo
Changan automobileBenzFaw hongqi
Gac ToyotaSaic MotorShanghai GM Buick
Thereafter, we input the data in Table A2 into Gephi, a famous software for social network analysis, acquiring the specific competitive network among these manufacturers (see Figure A1). Through the calculation of Gephi, the average degree of network is 16.8.
Figure A1. Competitive network.
Energies 15 05361 g0a1

References

  1. Wang, X.; Li, C.; Shang, J.; Yang, C.; Zhang, B.; Ke, X. Strategic Choices of China’s New Energy Vehicle Industry: An Analysis Based on ANP and SWOT. Energies 2017, 10, 537. [Google Scholar] [CrossRef] [Green Version]
  2. MEE (Ministry of Ecology and Environment of the People’s Republic of China). China Mobile Source Environmental Management Annual Report. 2020. Available online: http://www.mee.gov.cn/xxgk2018/xxgk/xxgk15/202008/t20200810_793252.html (accessed on 10 August 2020).
  3. Goel, P.; Sharma, N.; Mathiyazhagan, K.; Vimal, K. Government is trying but consumers are not buying: A barrier analysis for electric vehicle sales in India. Sustain. Prod. Consum. 2021, 28, 71–90. [Google Scholar] [CrossRef]
  4. Xu, B.; Sharif, A.; Shahbaz, M.; Dong, K. Have electric vehicles effectively addressed CO2 emissions? Analysis of eight leading countries using quantile-on-quantile regression approach. Sustain. Prod. Consum. 2021, 27, 1205–1214. [Google Scholar] [CrossRef]
  5. Wu, Y.A.; Ng, A.W.; Yu, Z.; Huang, J.; Meng, K.; Dong, Z. A review of evolutionary policy incentives for sustainable development of electric vehicles in China: Strategic implications. Energy Policy 2020, 148, 111983. [Google Scholar] [CrossRef]
  6. Kong, D.; Xia, Q.; Xue, Y.; Zhao, X. Effects of multi policies on electric vehicle diffusion under subsidy policy abolishment in China: A multi-actor perspective. Appl. Energy 2020, 266, 114887. [Google Scholar] [CrossRef]
  7. Bishop, J.D.; Martin, N.P.; Boies, A.M. Quantifying the role of vehicle size, powertrain technology, activity and consumer behaviour on new UK passenger vehicle fleet energy use and emissions under different policy objectives. Appl. Energy 2016, 180, 196–212. [Google Scholar] [CrossRef] [Green Version]
  8. Das, P.K.; Bhat, M.Y. Global electric vehicle adoption: Implementation and policy implications for India. Environ. Sci. Pollut. Res. 2022, 29, 40612–40622. [Google Scholar] [CrossRef]
  9. MIIT. The Passenger Cars Corporate Average Fuel Consumption and New Energy Vehicle Credit Regulation. 2017. Available online: https://www.miit.gov.cn/jgsj/zbys/qcgy/art/2020/art_f09be90b302f4875928ac1c05a5c3bbc.html (accessed on 28 September 2017).
  10. Anand, K.S.; Giraud-Carrier, F.C. Pollution Regulation of Competitive Markets. Manag. Sci. 2020, 66, 4193–4206. [Google Scholar] [CrossRef]
  11. Li, K.; Ji, L.; Zhang, C.; Li, H. Fully distributed event-triggered pinning group consensus control for heterogeneous multi-agent systems with cooperative-competitive interaction strength. Neurocomputing 2021, 464, 273–281. [Google Scholar] [CrossRef]
  12. Bian, J.; Zhao, X. Tax or subsidy? An analysis of environmental policies in supply chains with retail competition. Eur. J. Oper. Res. 2019, 283, 901–914. [Google Scholar] [CrossRef]
  13. MIIT. Decision on Amending. 2020. Available online: https://www.miit.gov.cn/jgsj/zfs/bmgz/art/2020/art_bb9aff09c02d44cf87dfce83fc5df7d5.html (accessed on 29 June 2020).
  14. Wang, S.; Li, J.; Zhao, D. The impact of policy measures on consumer intention to adopt electric vehicles: Evidence from China. Transp. Res. Part A: Policy Pract. 2017, 105, 14–26. [Google Scholar] [CrossRef]
  15. Chen, K.; Zhao, F.; Hao, H.; Liu, Z. Synergistic Impacts of China’s Subsidy Policy and New Energy Vehicle Credit Regulation on the Technological Development of Battery Electric Vehicles. Energies 2018, 11, 3193. [Google Scholar] [CrossRef] [Green Version]
  16. Shao, L.; Yang, J.; Zhang, M. Subsidy scheme or price discount scheme? Mass adoption of electric vehicles under different market structures. Eur. J. Oper. Res. 2017, 262, 1181–1195. [Google Scholar] [CrossRef]
  17. Zhang, X.; Bai, X. Incentive policies from 2006 to 2016 and new energy vehicle adoption in 2010–2020 in China. Renew. Sustain. Energy Rev. 2017, 70, 24–43. [Google Scholar] [CrossRef]
  18. Ou, S.; Lin, Z.; Qi, L.; Li, J.; He, X.; Przesmitzki, S. The dual-credit policy: Quantifying the policy impact on plug-in electric vehicle sales and industry profits in China. Energy Policy 2018, 121, 597–610. [Google Scholar] [CrossRef]
  19. Hsieh, I.-Y.L.; Pan, M.S.; Green, W.H. Transition to electric vehicles in China: Implications for private motorization rate and battery market. Energy Policy 2020, 144, 111654. [Google Scholar] [CrossRef]
  20. Lou, G.; Ma, H.; Fan, T.; Chan, H.K. Impact of the dual-credit policy on improvements in fuel economy and the production of internal combustion engine vehicles. Resour. Conserv. Recycl. 2020, 156, 104712. [Google Scholar] [CrossRef]
  21. Li, Y.; Zhang, Q.; Tang, Y.; Mclellan, B.; Ye, H.; Shimoda, H.; Ishihara, K. Dynamic optimization management of the dual-credit policy for passenger vehicles. J. Clean. Prod. 2019, 249, 119384. [Google Scholar] [CrossRef]
  22. Li, Y.; Zhang, Q.; Li, H.; Tang, Y.; Liu, B. The impact of dual-credit scheme on the development of the new energy vehicle industry. Energy Procedia 2019, 158, 4311–4317. [Google Scholar] [CrossRef]
  23. Hu, Y.; Wang, Z.; Li, X. Impact of policies on electric vehicle diffusion: An evolutionary game of small world network analysis. J. Clean. Prod. 2020, 265, 121703. [Google Scholar] [CrossRef]
  24. Yang, R.; Tang, W.; Zhang, J. Technology improvement strategy for green products under competition: The role of government subsidy. Eur. J. Oper. Res. 2021, 289, 553–568. [Google Scholar] [CrossRef]
  25. Watts, D.J.; Dodds, P.S.; Newman, M.E.J. Identity and Search in Social Networks. Science 2002, 296, 1302–1305. [Google Scholar] [CrossRef] [PubMed] [Green Version]
  26. Barabási, A.-L.; Albert, R. Emergence of Scaling in Random Networks. Science 1999, 286, 509–512. [Google Scholar] [CrossRef] [PubMed] [Green Version]
  27. Adler, N.; Brudner, A.; Proost, S. A review of transport market modeling using game-theoretic principles. Eur. J. Oper. Res. 2020, 291, 808–829. [Google Scholar] [CrossRef]
  28. Taylor, P.D.; Jonker, L.B. Evolutionary stable strategies and game dynamics. Math. Biosci. 1978, 40, 145–156. [Google Scholar] [CrossRef]
  29. Bass, F.M. A New Product Growth for Model Consumer Durables. Manag. Sci. 1969, 15, 215–227. [Google Scholar] [CrossRef]
  30. MIIT. Table of Accounting for Average Fuel Consumption and New Energy Vehicle Credits of Chinese Passenger Car Manufacturers. 2019. Available online: https://ythxxfb.miit.gov.cn/ythzxfwpt/hlwmh/zcwj/xzxk/clsczr/art/2020/art_a14a402f2b5b4ac6addad2998f845fd0.html (accessed on 2 July 2020).
  31. Jiao, Y.; Yu, L.; Wang, J.; Wu, D.; Tang, Y. Diffusion of new energy vehicles under incentive policies of China: Moderating role of market characteristic. J. Clean. Prod. 2022, 353, 131660. [Google Scholar] [CrossRef]
  32. MIIT. Notice of Further Improving the Financial Subsidy for the Promotion of NEV. 2021. Available online: https://www.miit.gov.cn/xwdt/gxdt/sjdt/art/2021/art_a42ae2cf64d34e0a9c4bf97a37b71c64.html (accessed on 1 January 2021).
  33. Li, J.; Ku, Y.; Yu, Y.; Liu, C.; Zhou, Y. Optimizing production of new energy vehicles with across-chain cooperation under China’s dual credit policy. Energy 2020, 194, 116832. [Google Scholar] [CrossRef]
  34. CATARC. Blue Book of Power Battery; Social Science Academic Press: Beijing, China, 2018. (In Chinese) [Google Scholar]
Figure 1. Analytical framework.
Energies 15 05361 g001
Figure 2. Asymmetric competitive and cooperative double-layer network.
Energies 15 05361 g002
Figure 3. Disconnected network.
Energies 15 05361 g003
Figure 4. Bipartite network.
Energies 15 05361 g004
Figure 5. Results in small world network.
Energies 15 05361 g005
Figure 6. Results in scale free network.
Energies 15 05361 g006
Figure 7. Results in small world network.
Energies 15 05361 g007
Figure 8. Results in scale free network.
Energies 15 05361 g008
Figure 9. Results in small world network.
Energies 15 05361 g009
Figure 10. Results in scale free network.
Energies 15 05361 g010
Figure 11. Affiliated rate, Small world.
Energies 15 05361 g011
Figure 12. Sale profit, Small world.
Energies 15 05361 g012
Figure 13. Affiliated rate, Scale free.
Energies 15 05361 g013
Figure 14. Sale profit, Scale free.
Energies 15 05361 g014
Publisher’s Note: MDPI stays neutral with regard to jurisdictional claims in published maps and institutional affiliations.

