
Influence of Different Ambient Temperatures on the Discharge Performance of Square Ternary Lithium-Ion Batteries

 ,
, 
Abstract
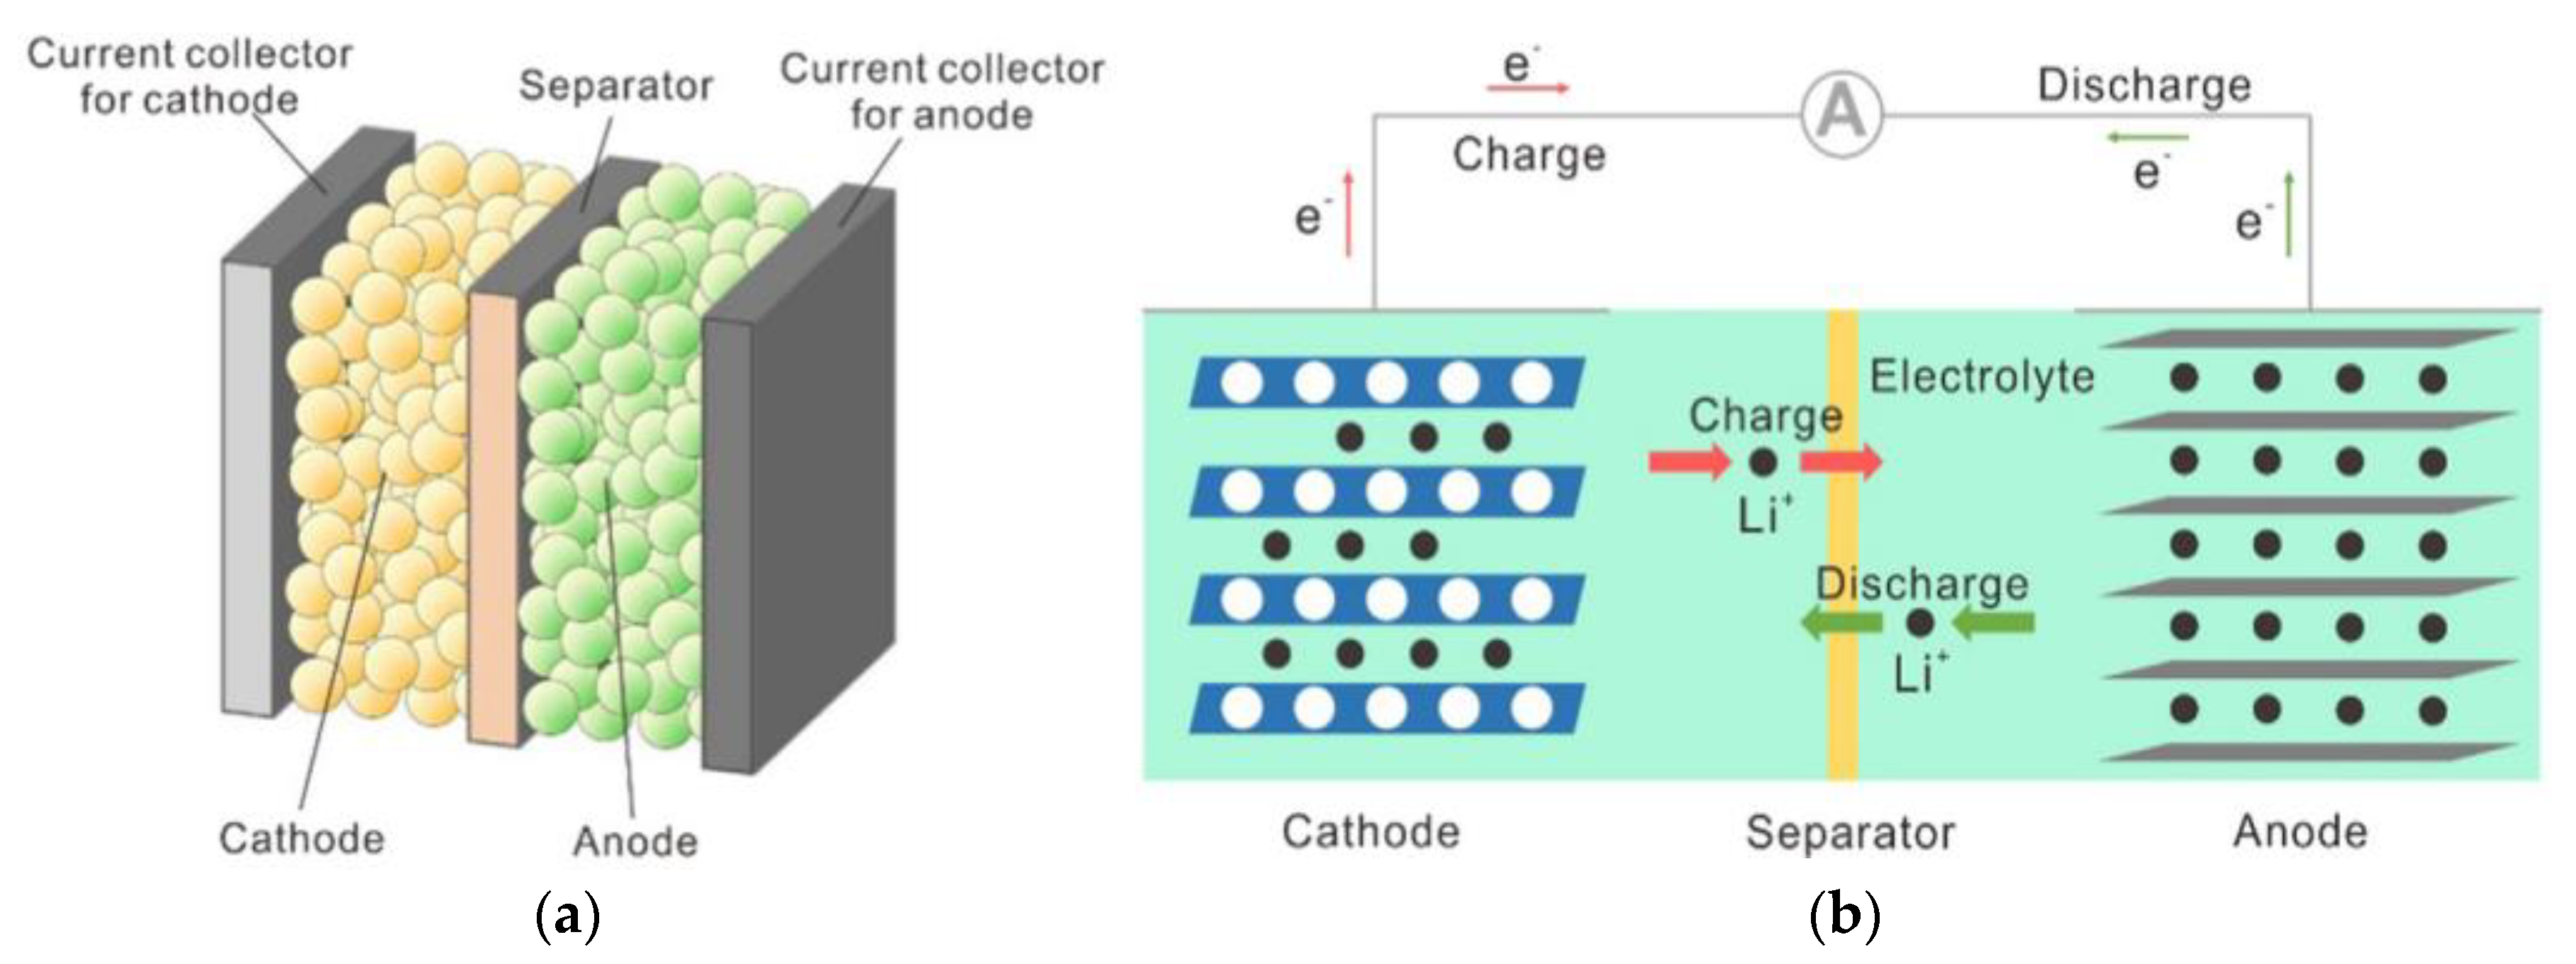
:1. Introduction
2. Materials and Methods
2.1. Object
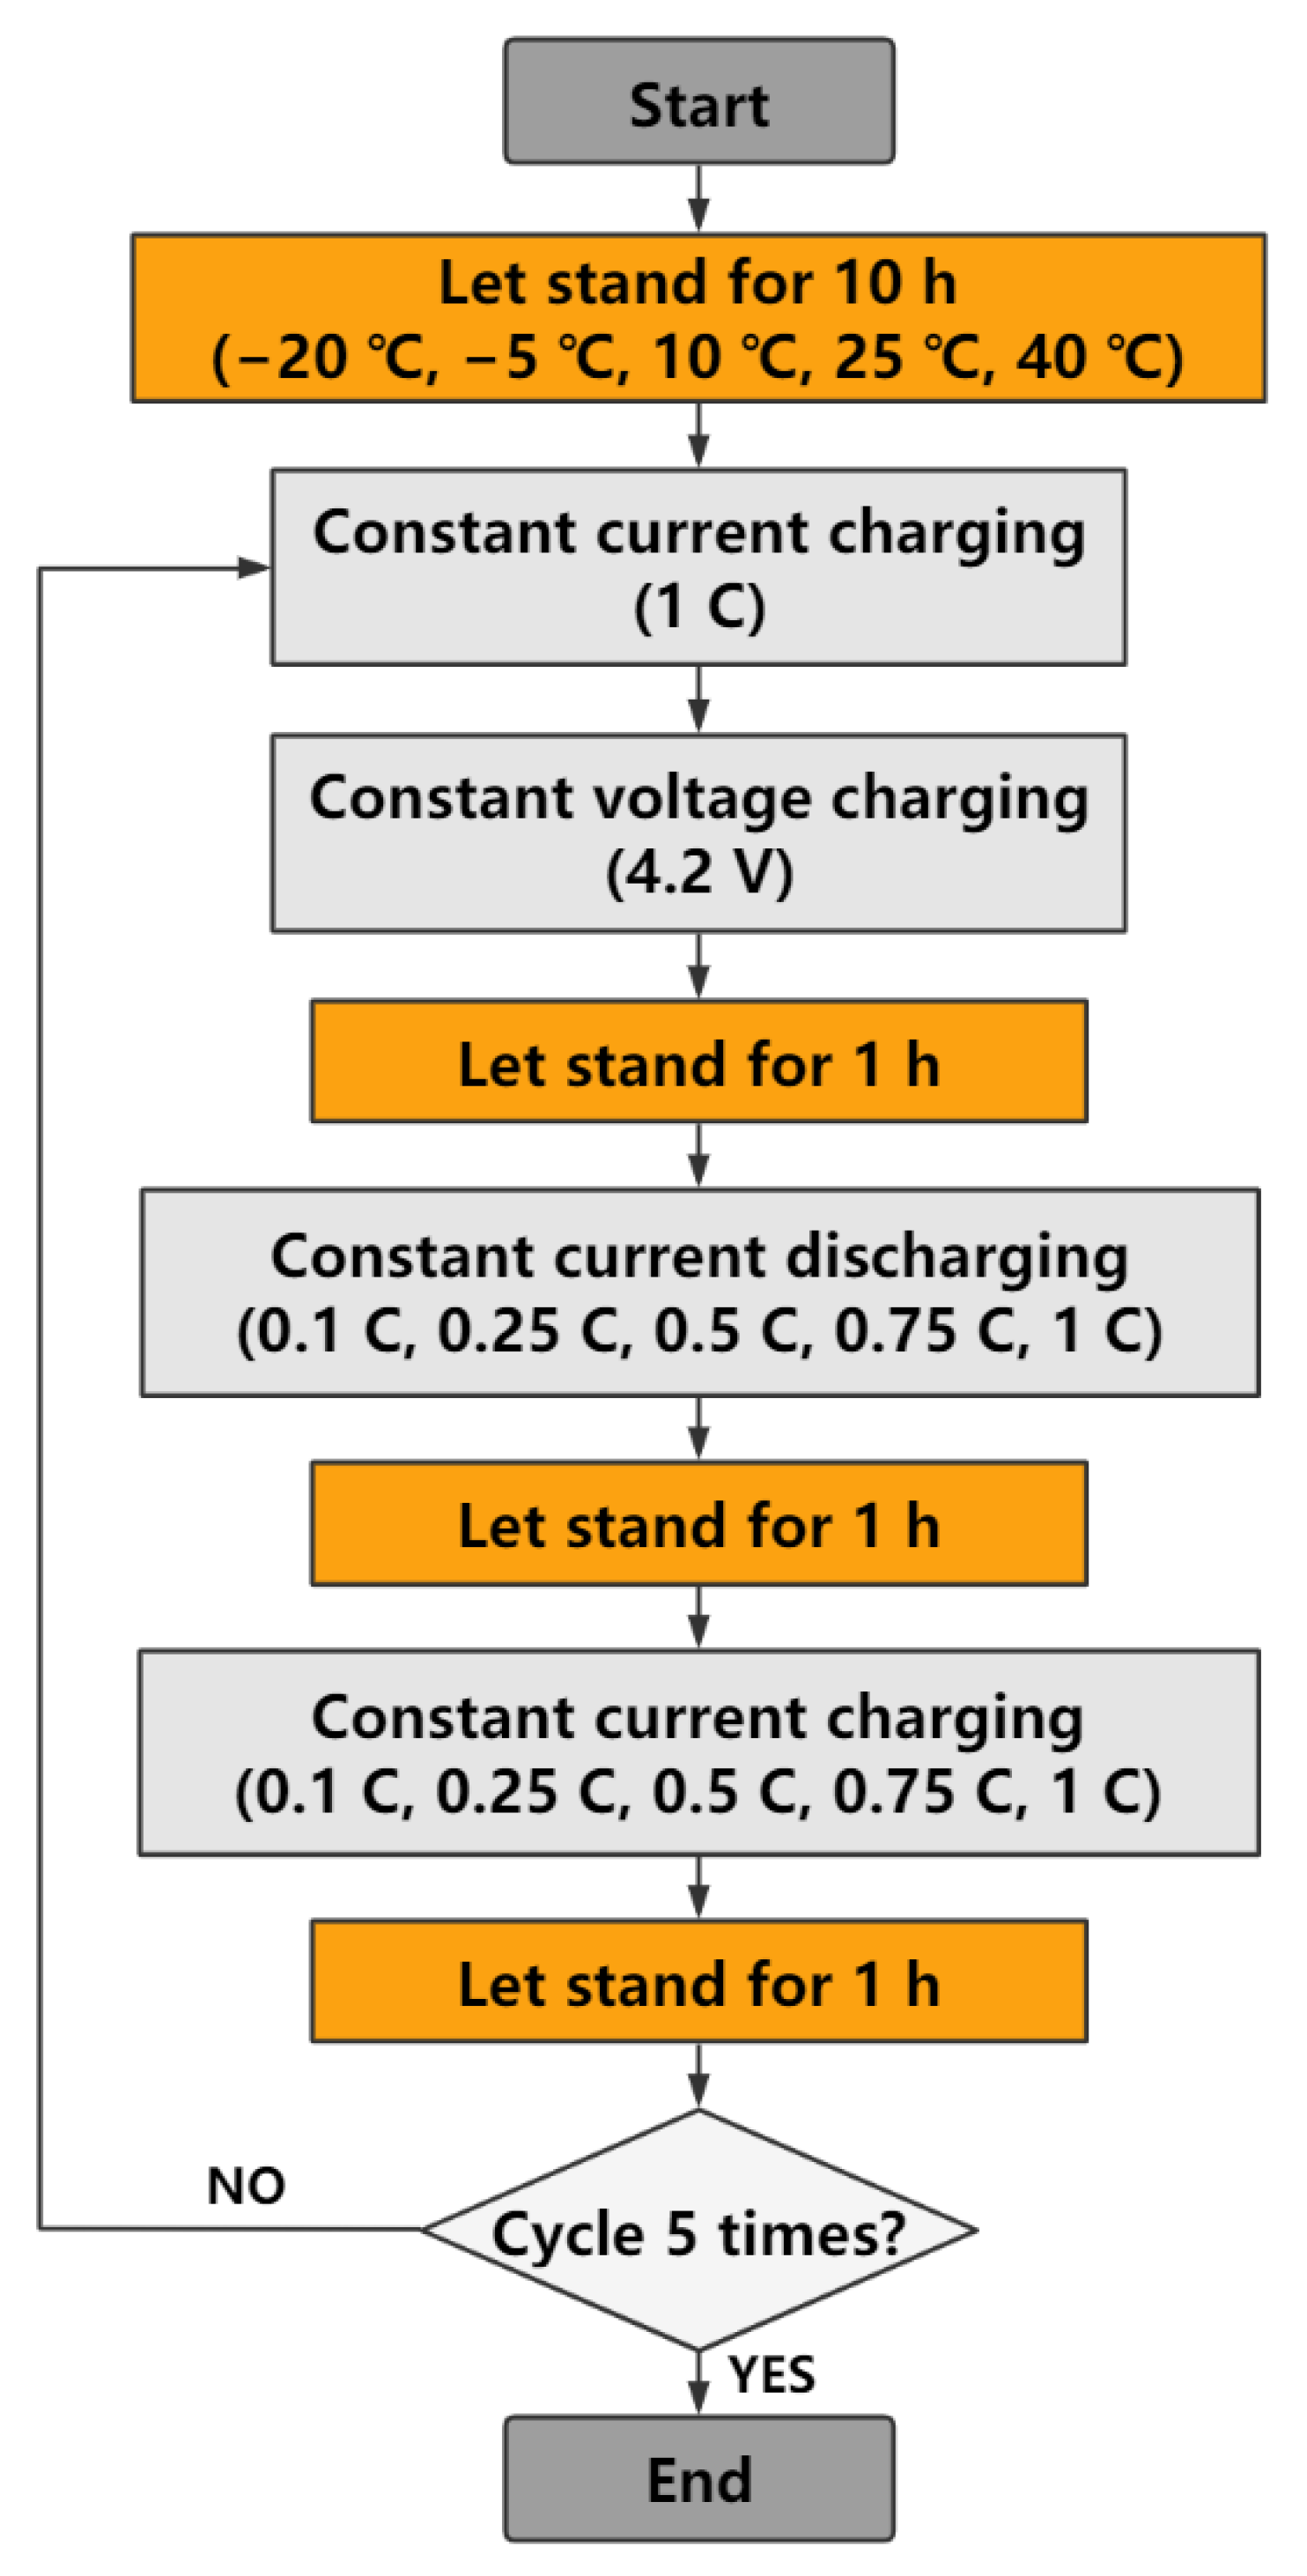
2.2. Method
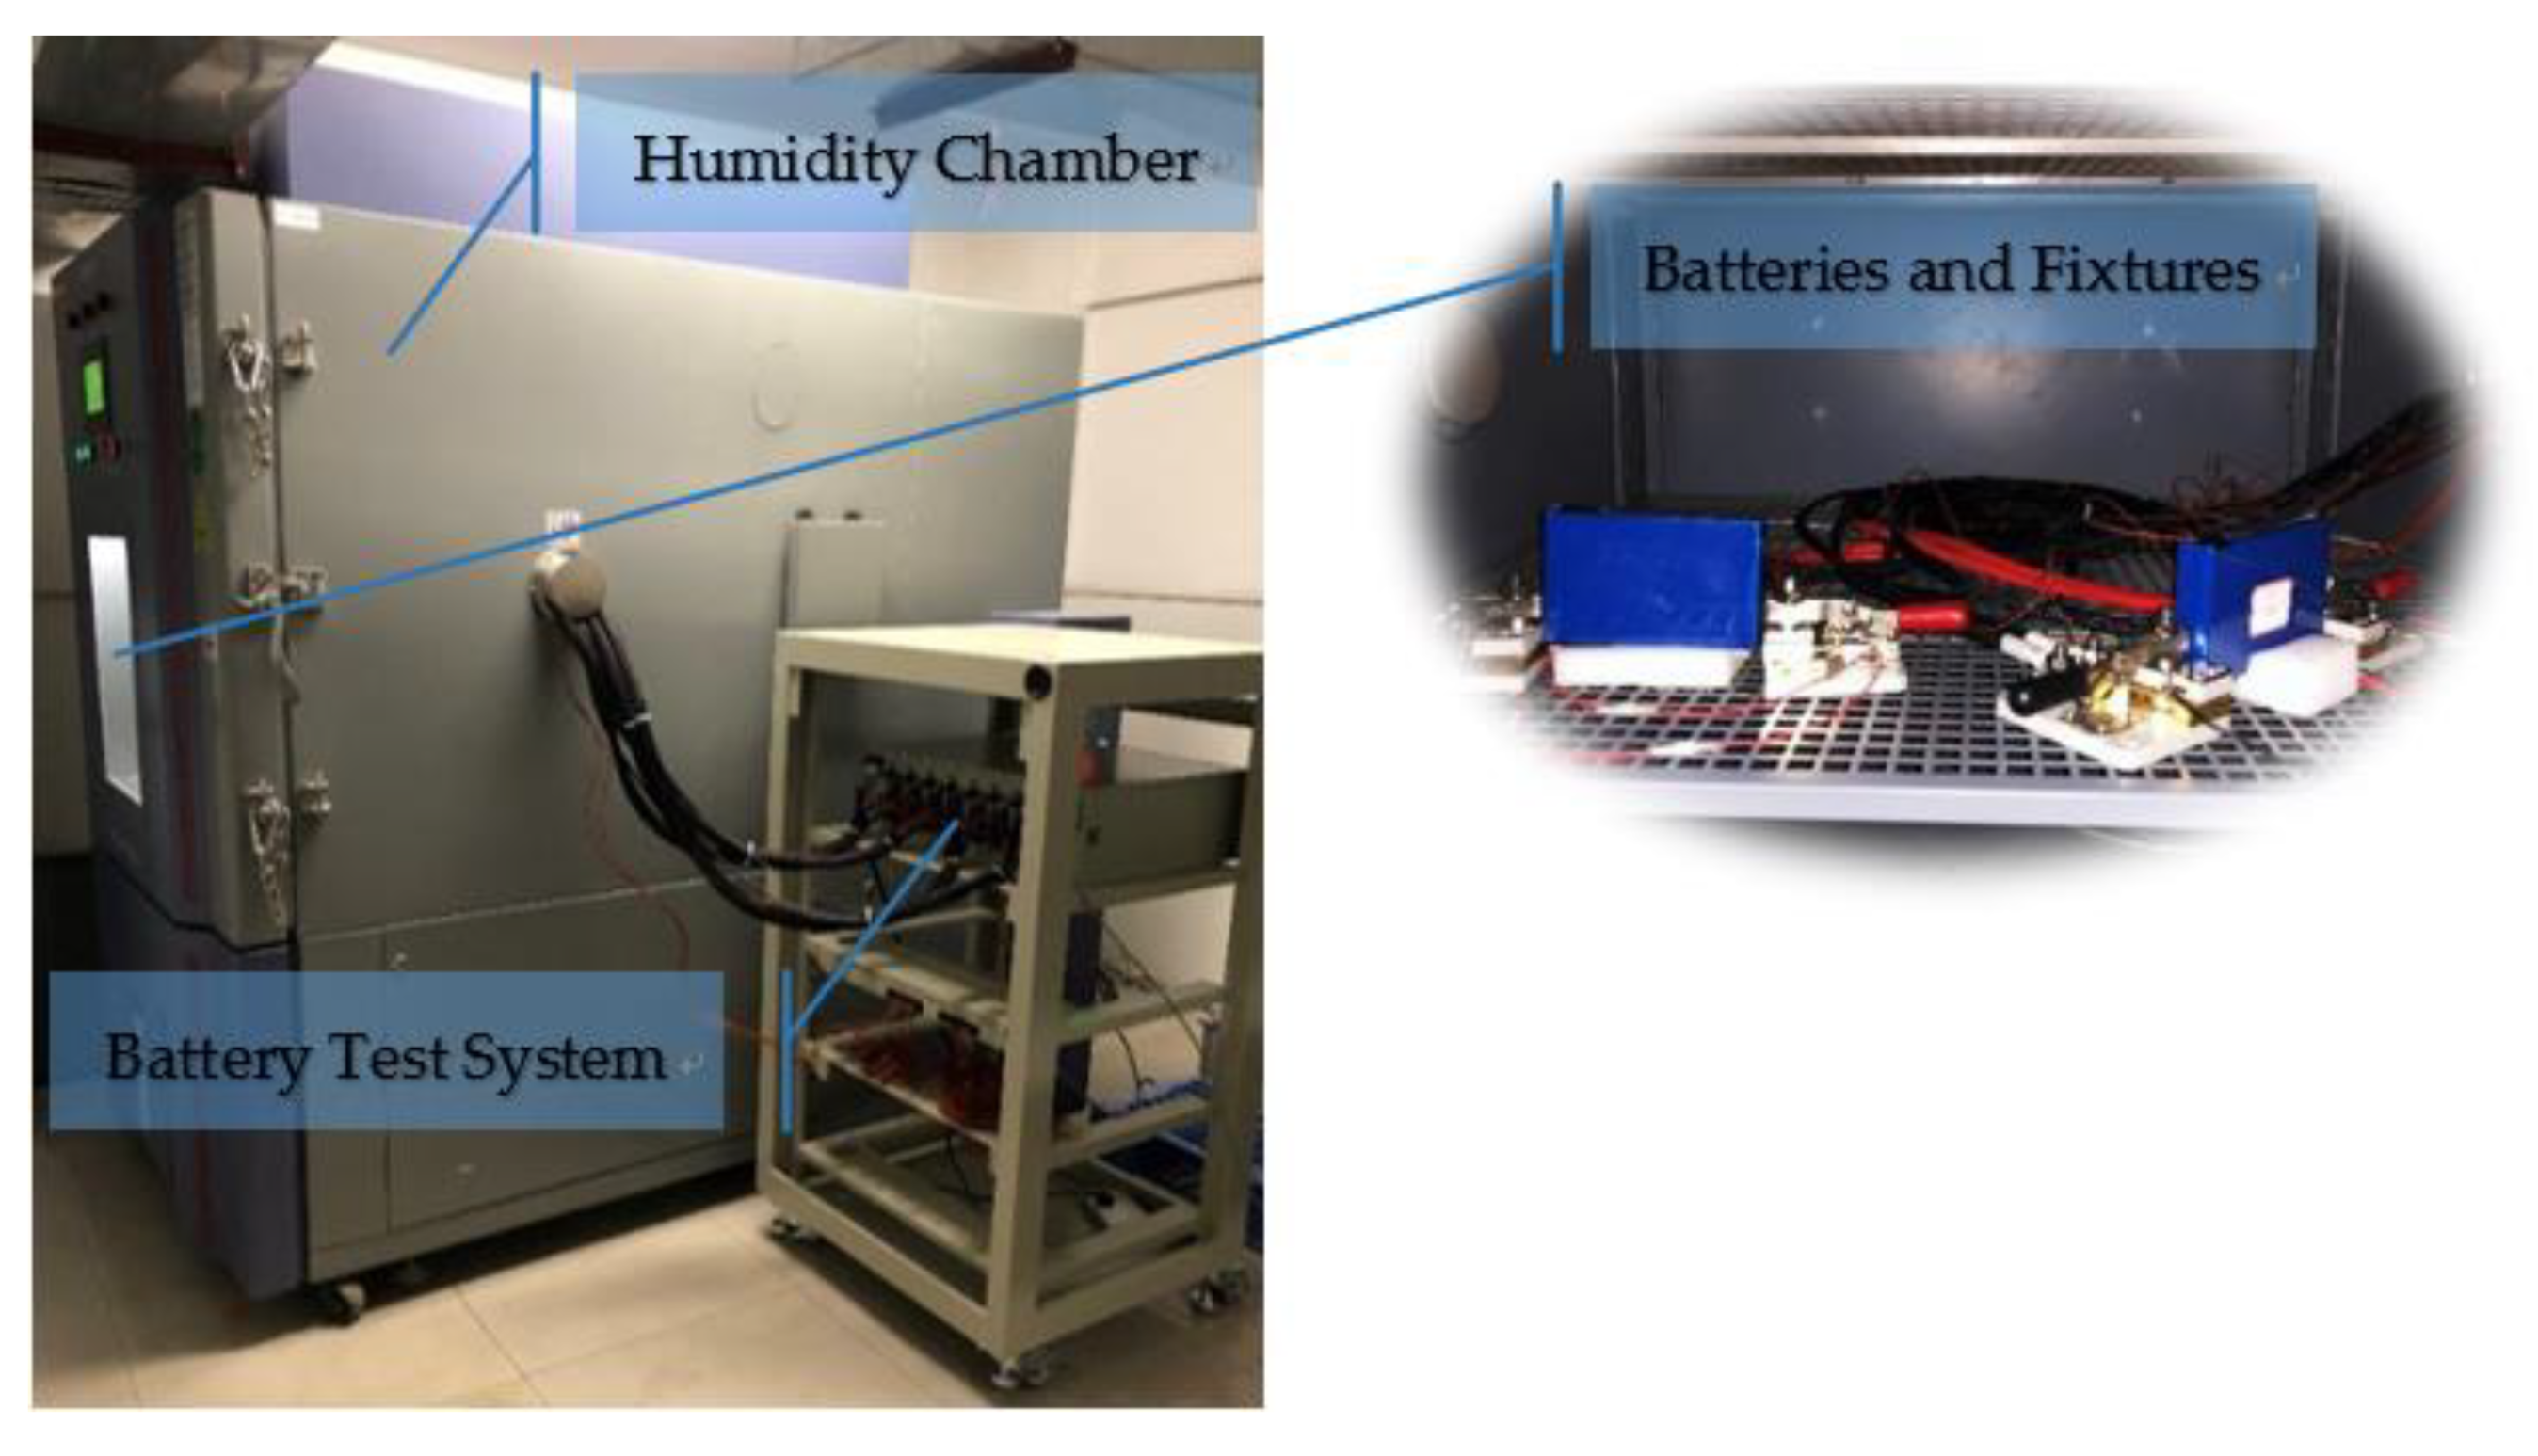
2.3. Platform
3. Results
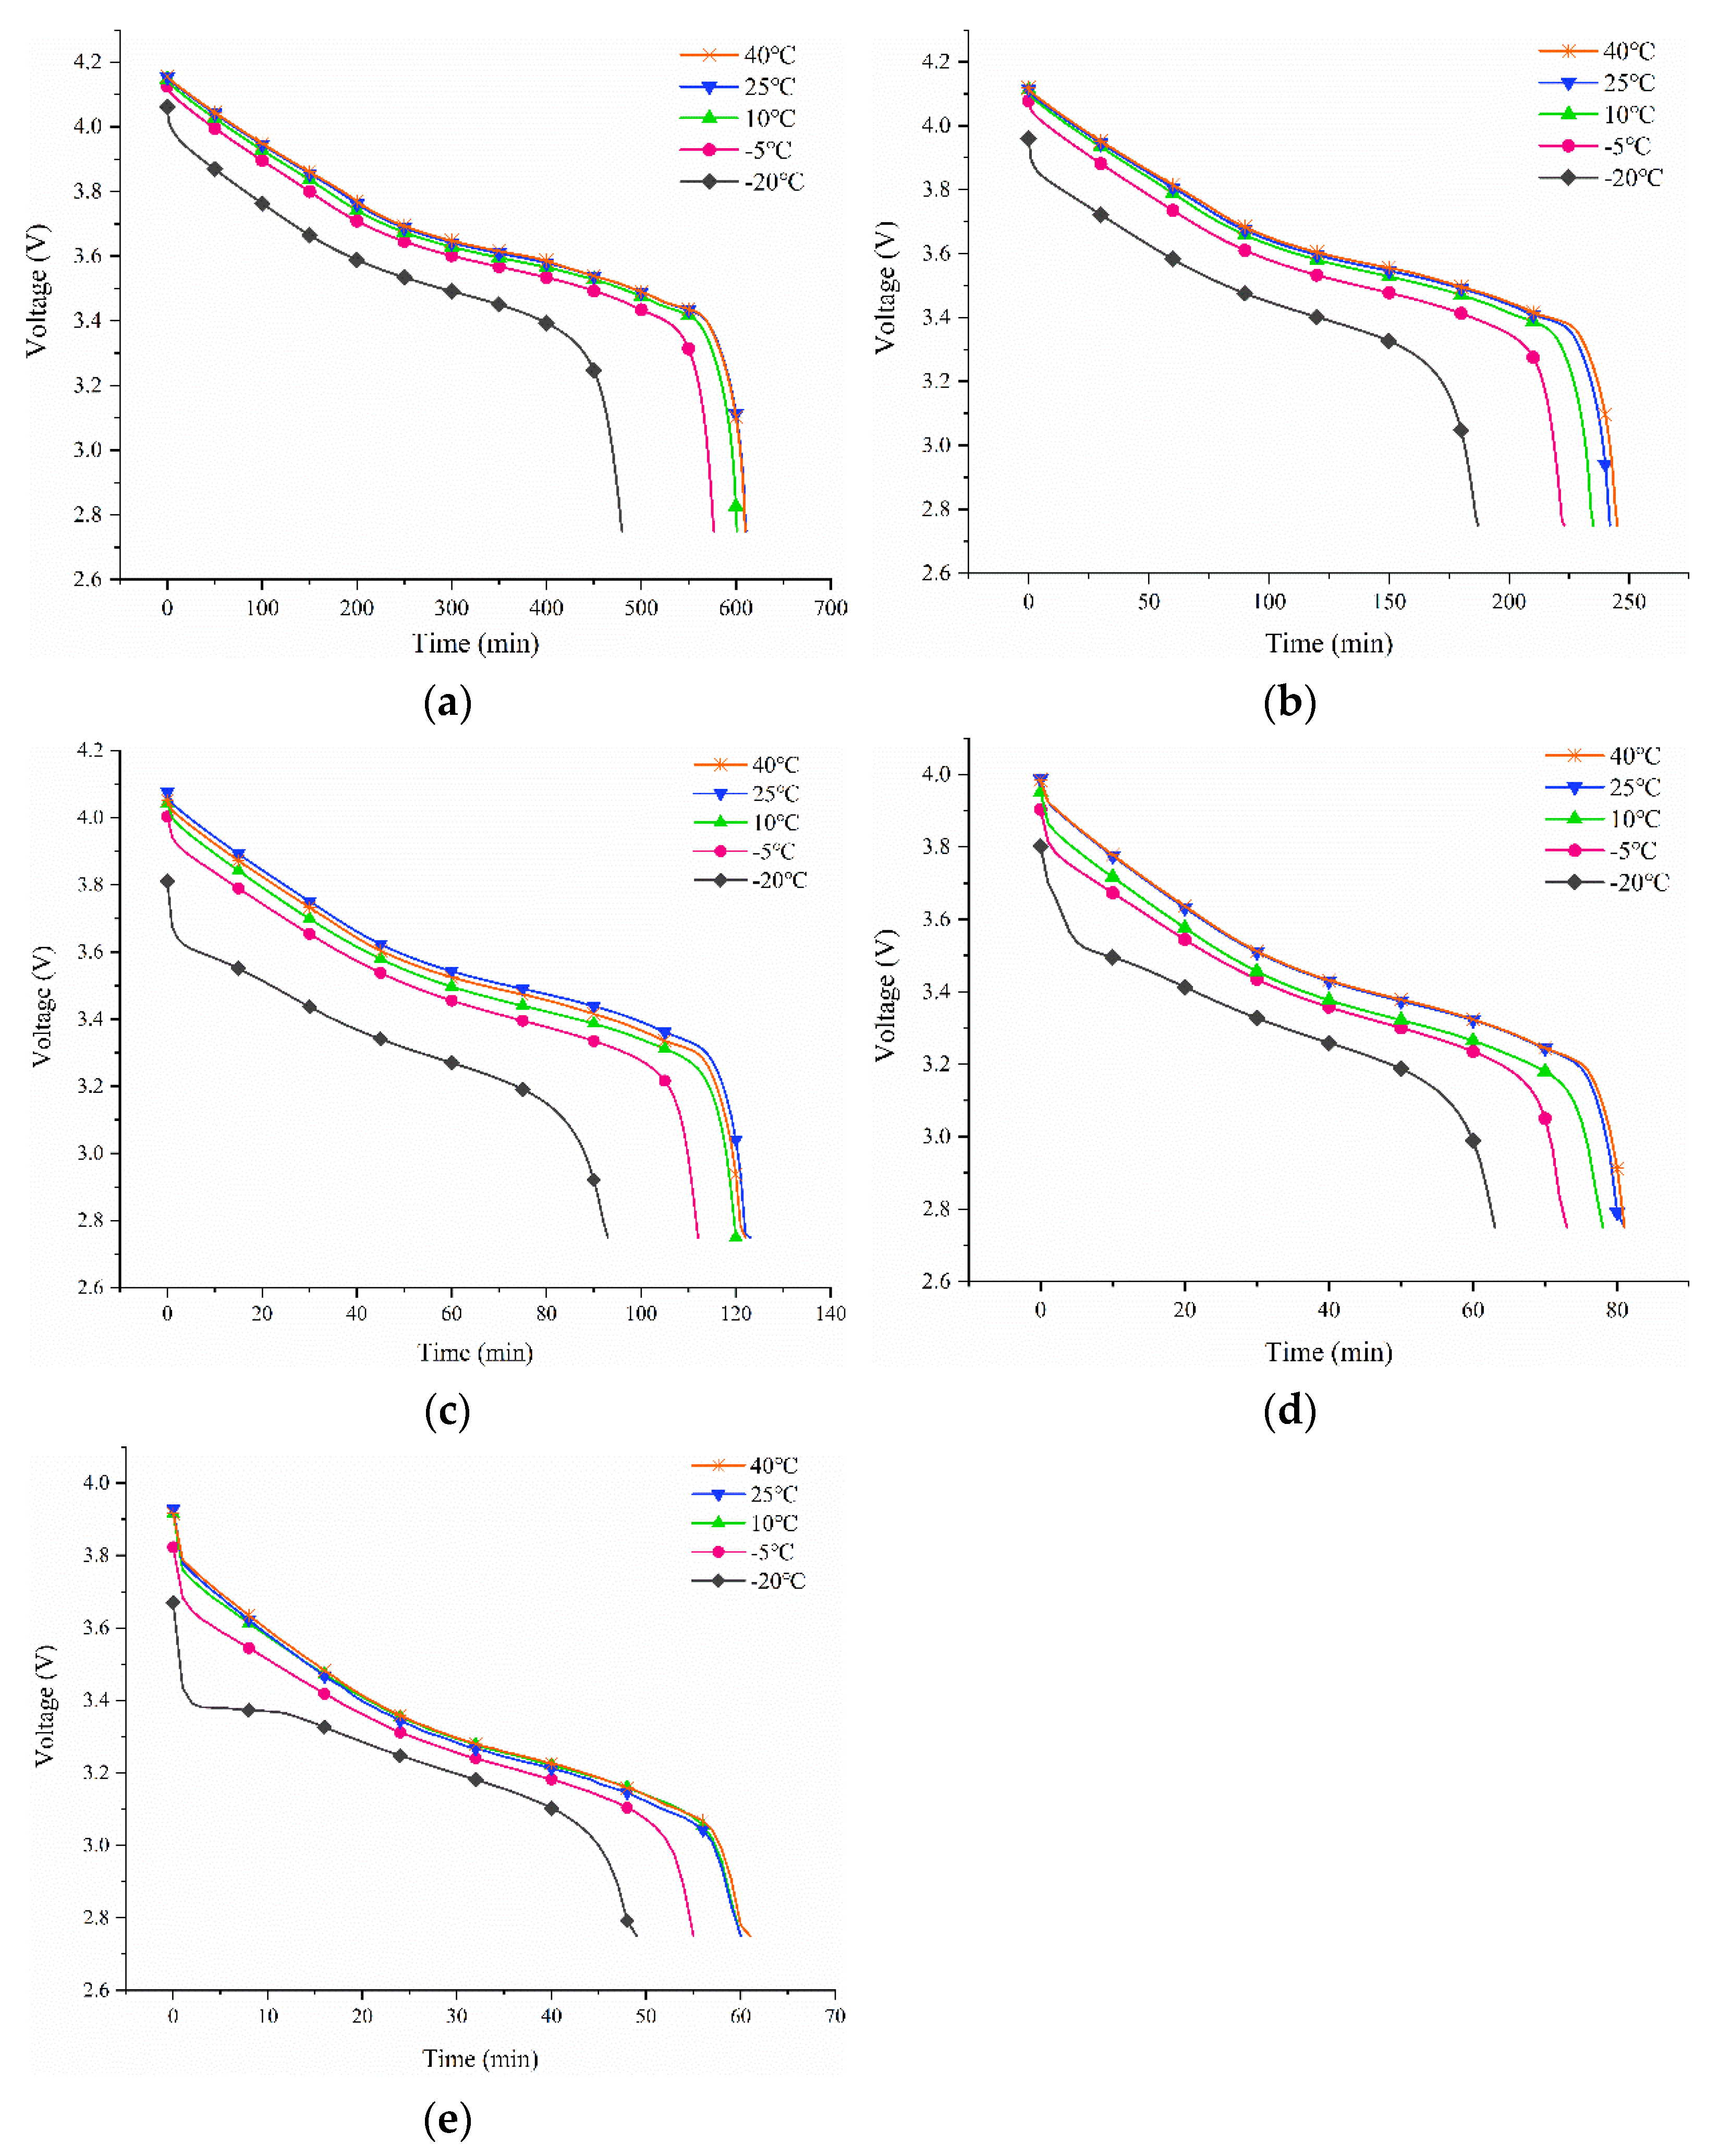
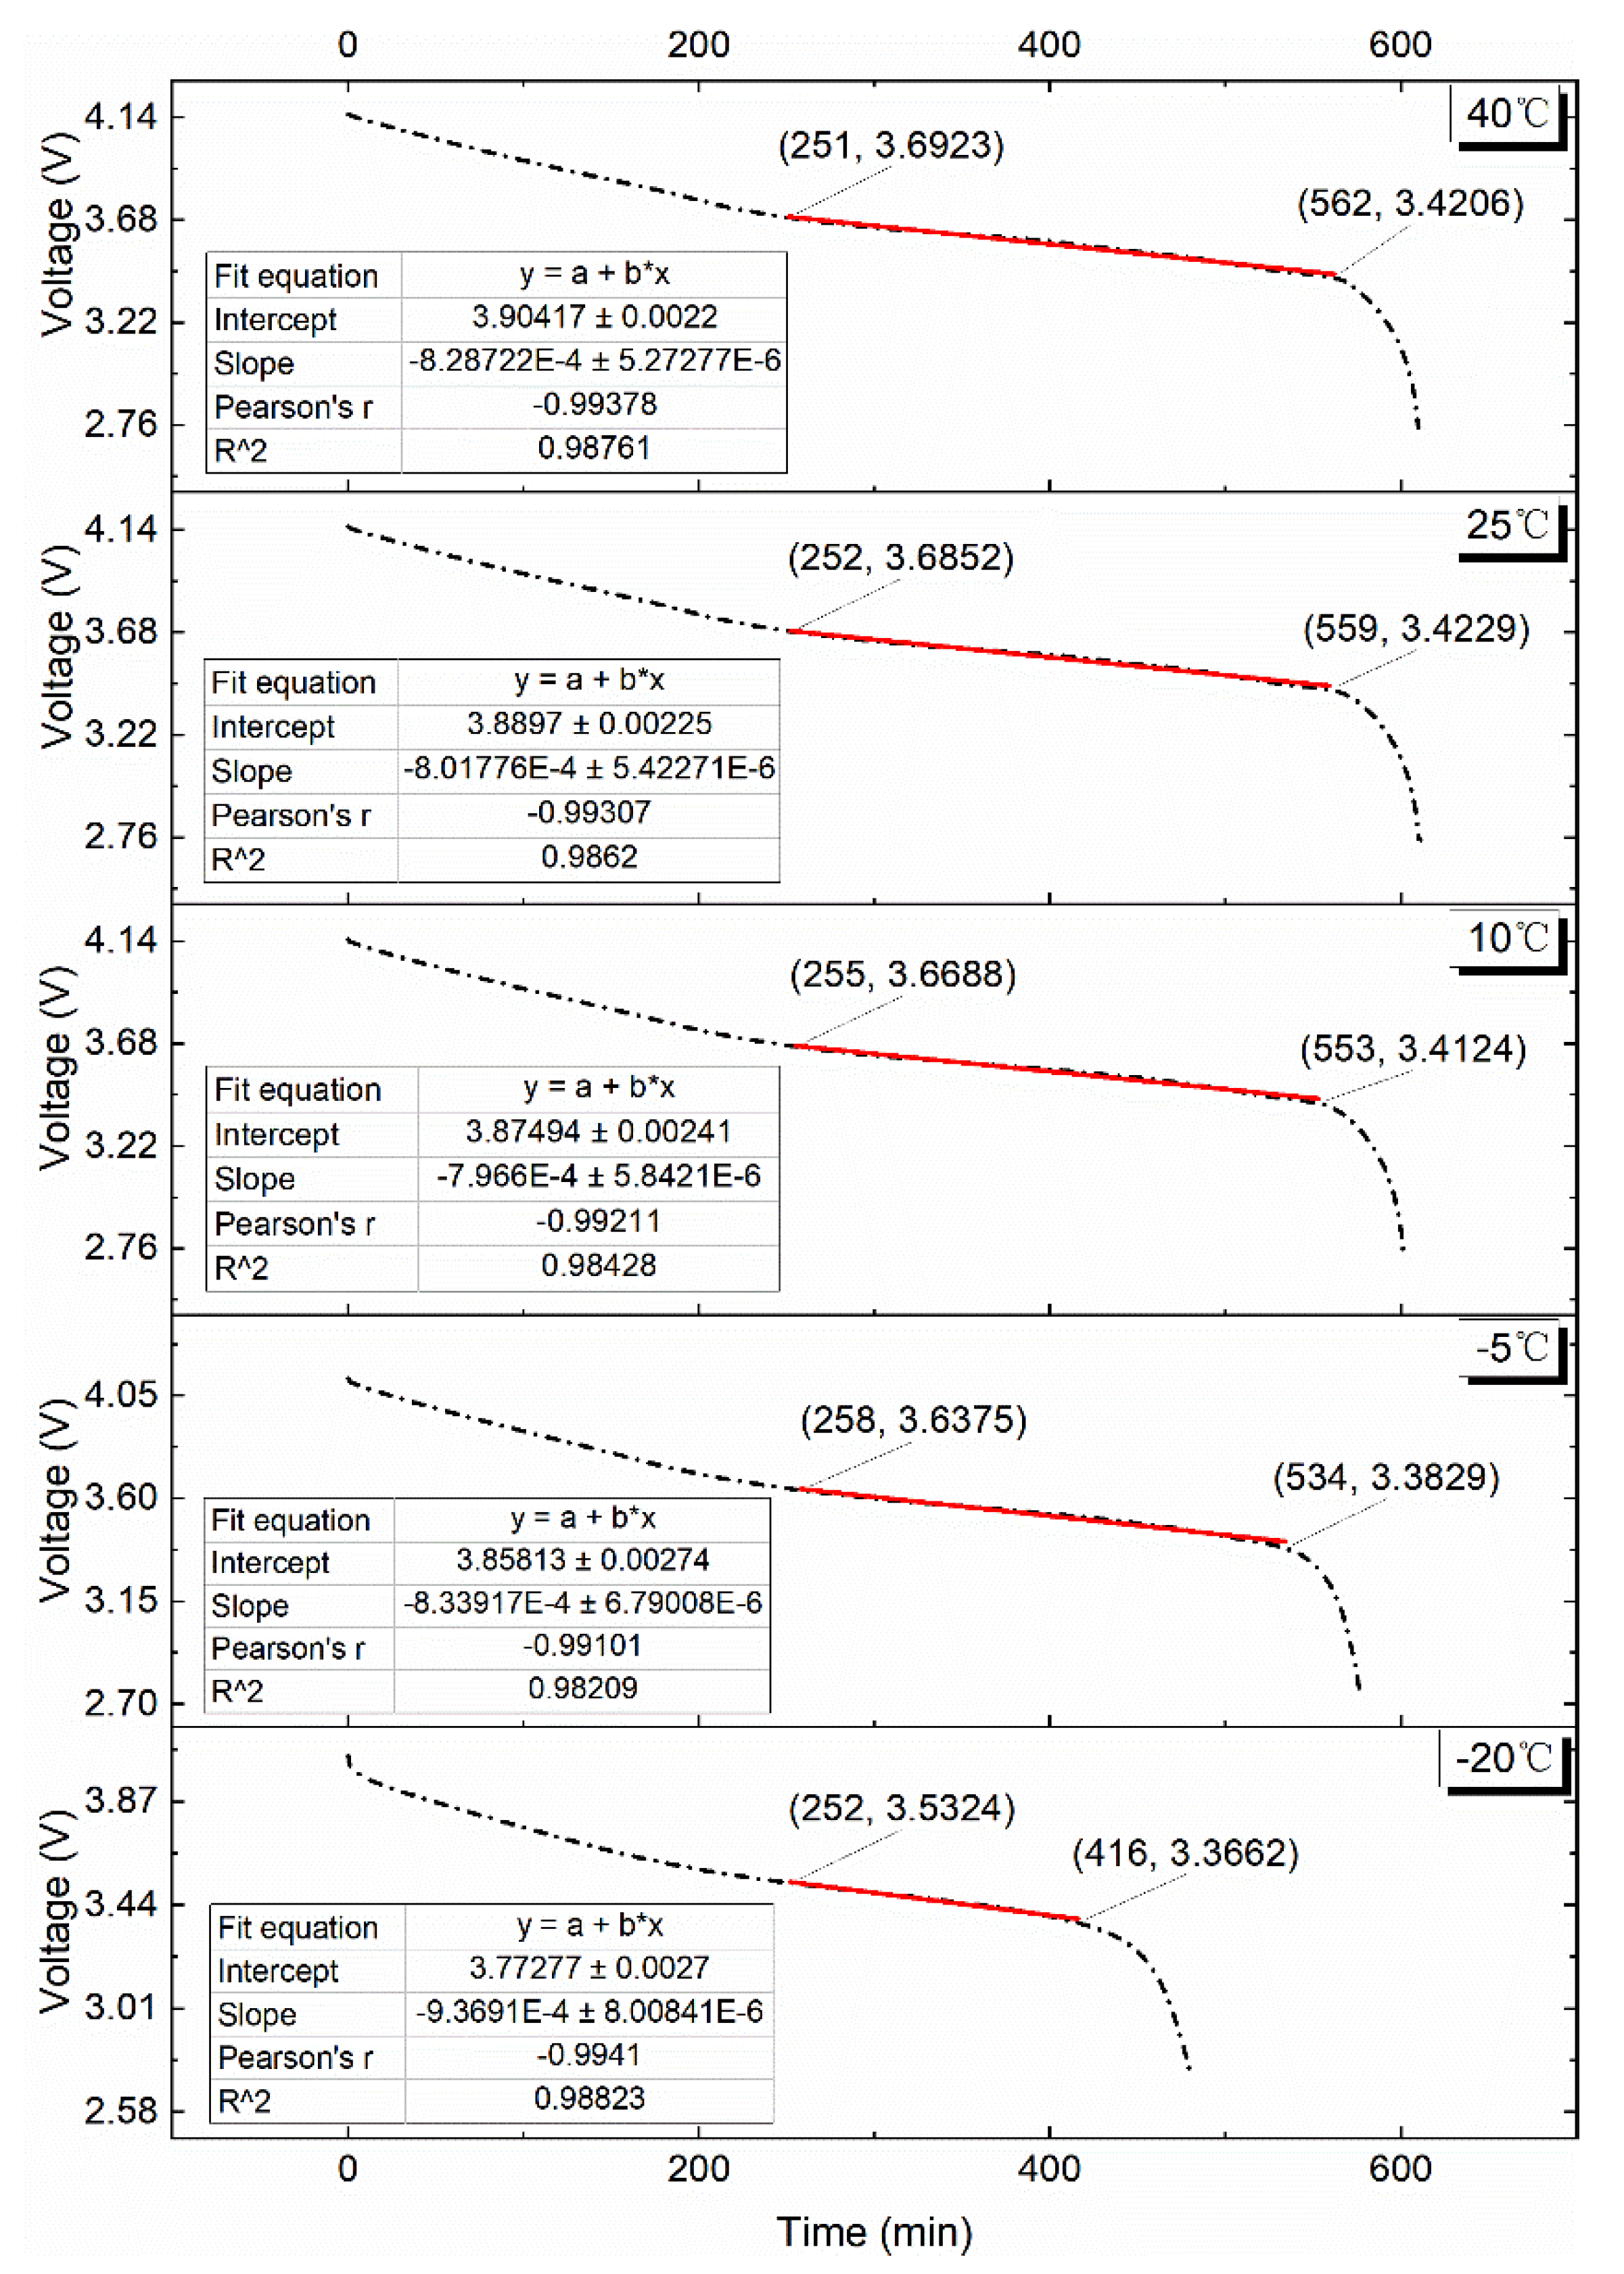
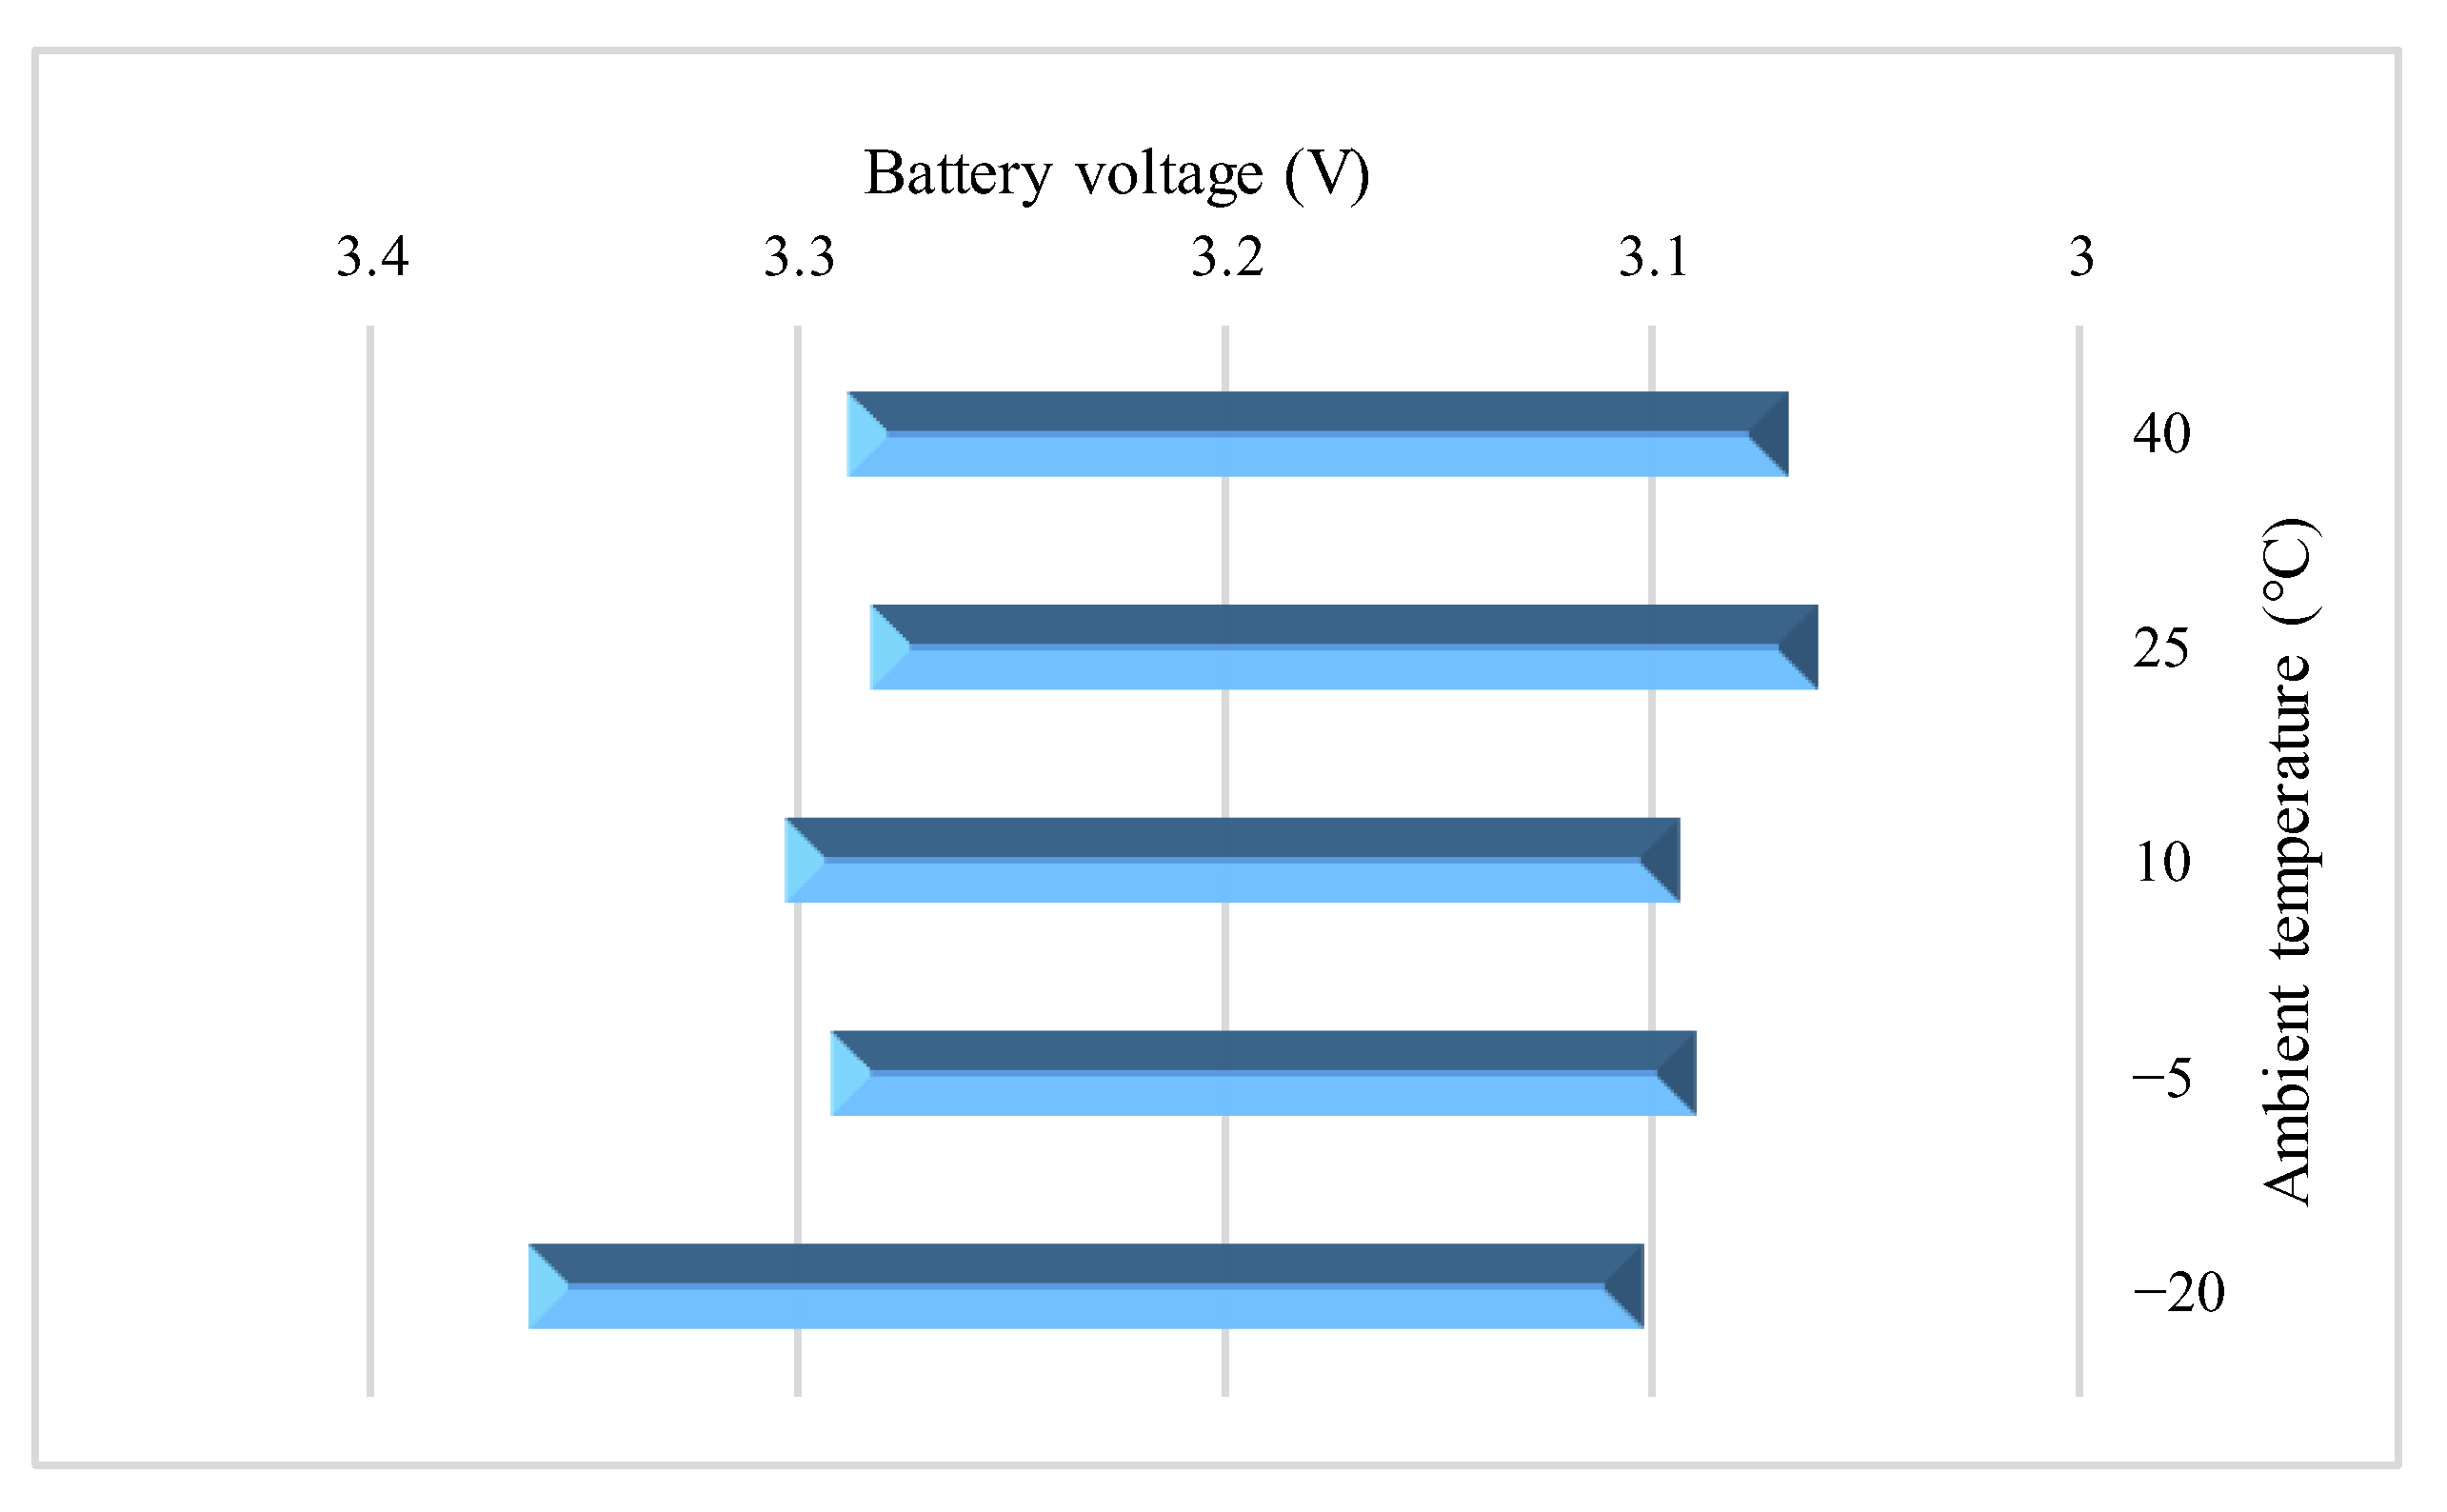
3.1. Influence of Different Ambient Temperatures on Battery Discharge Voltage
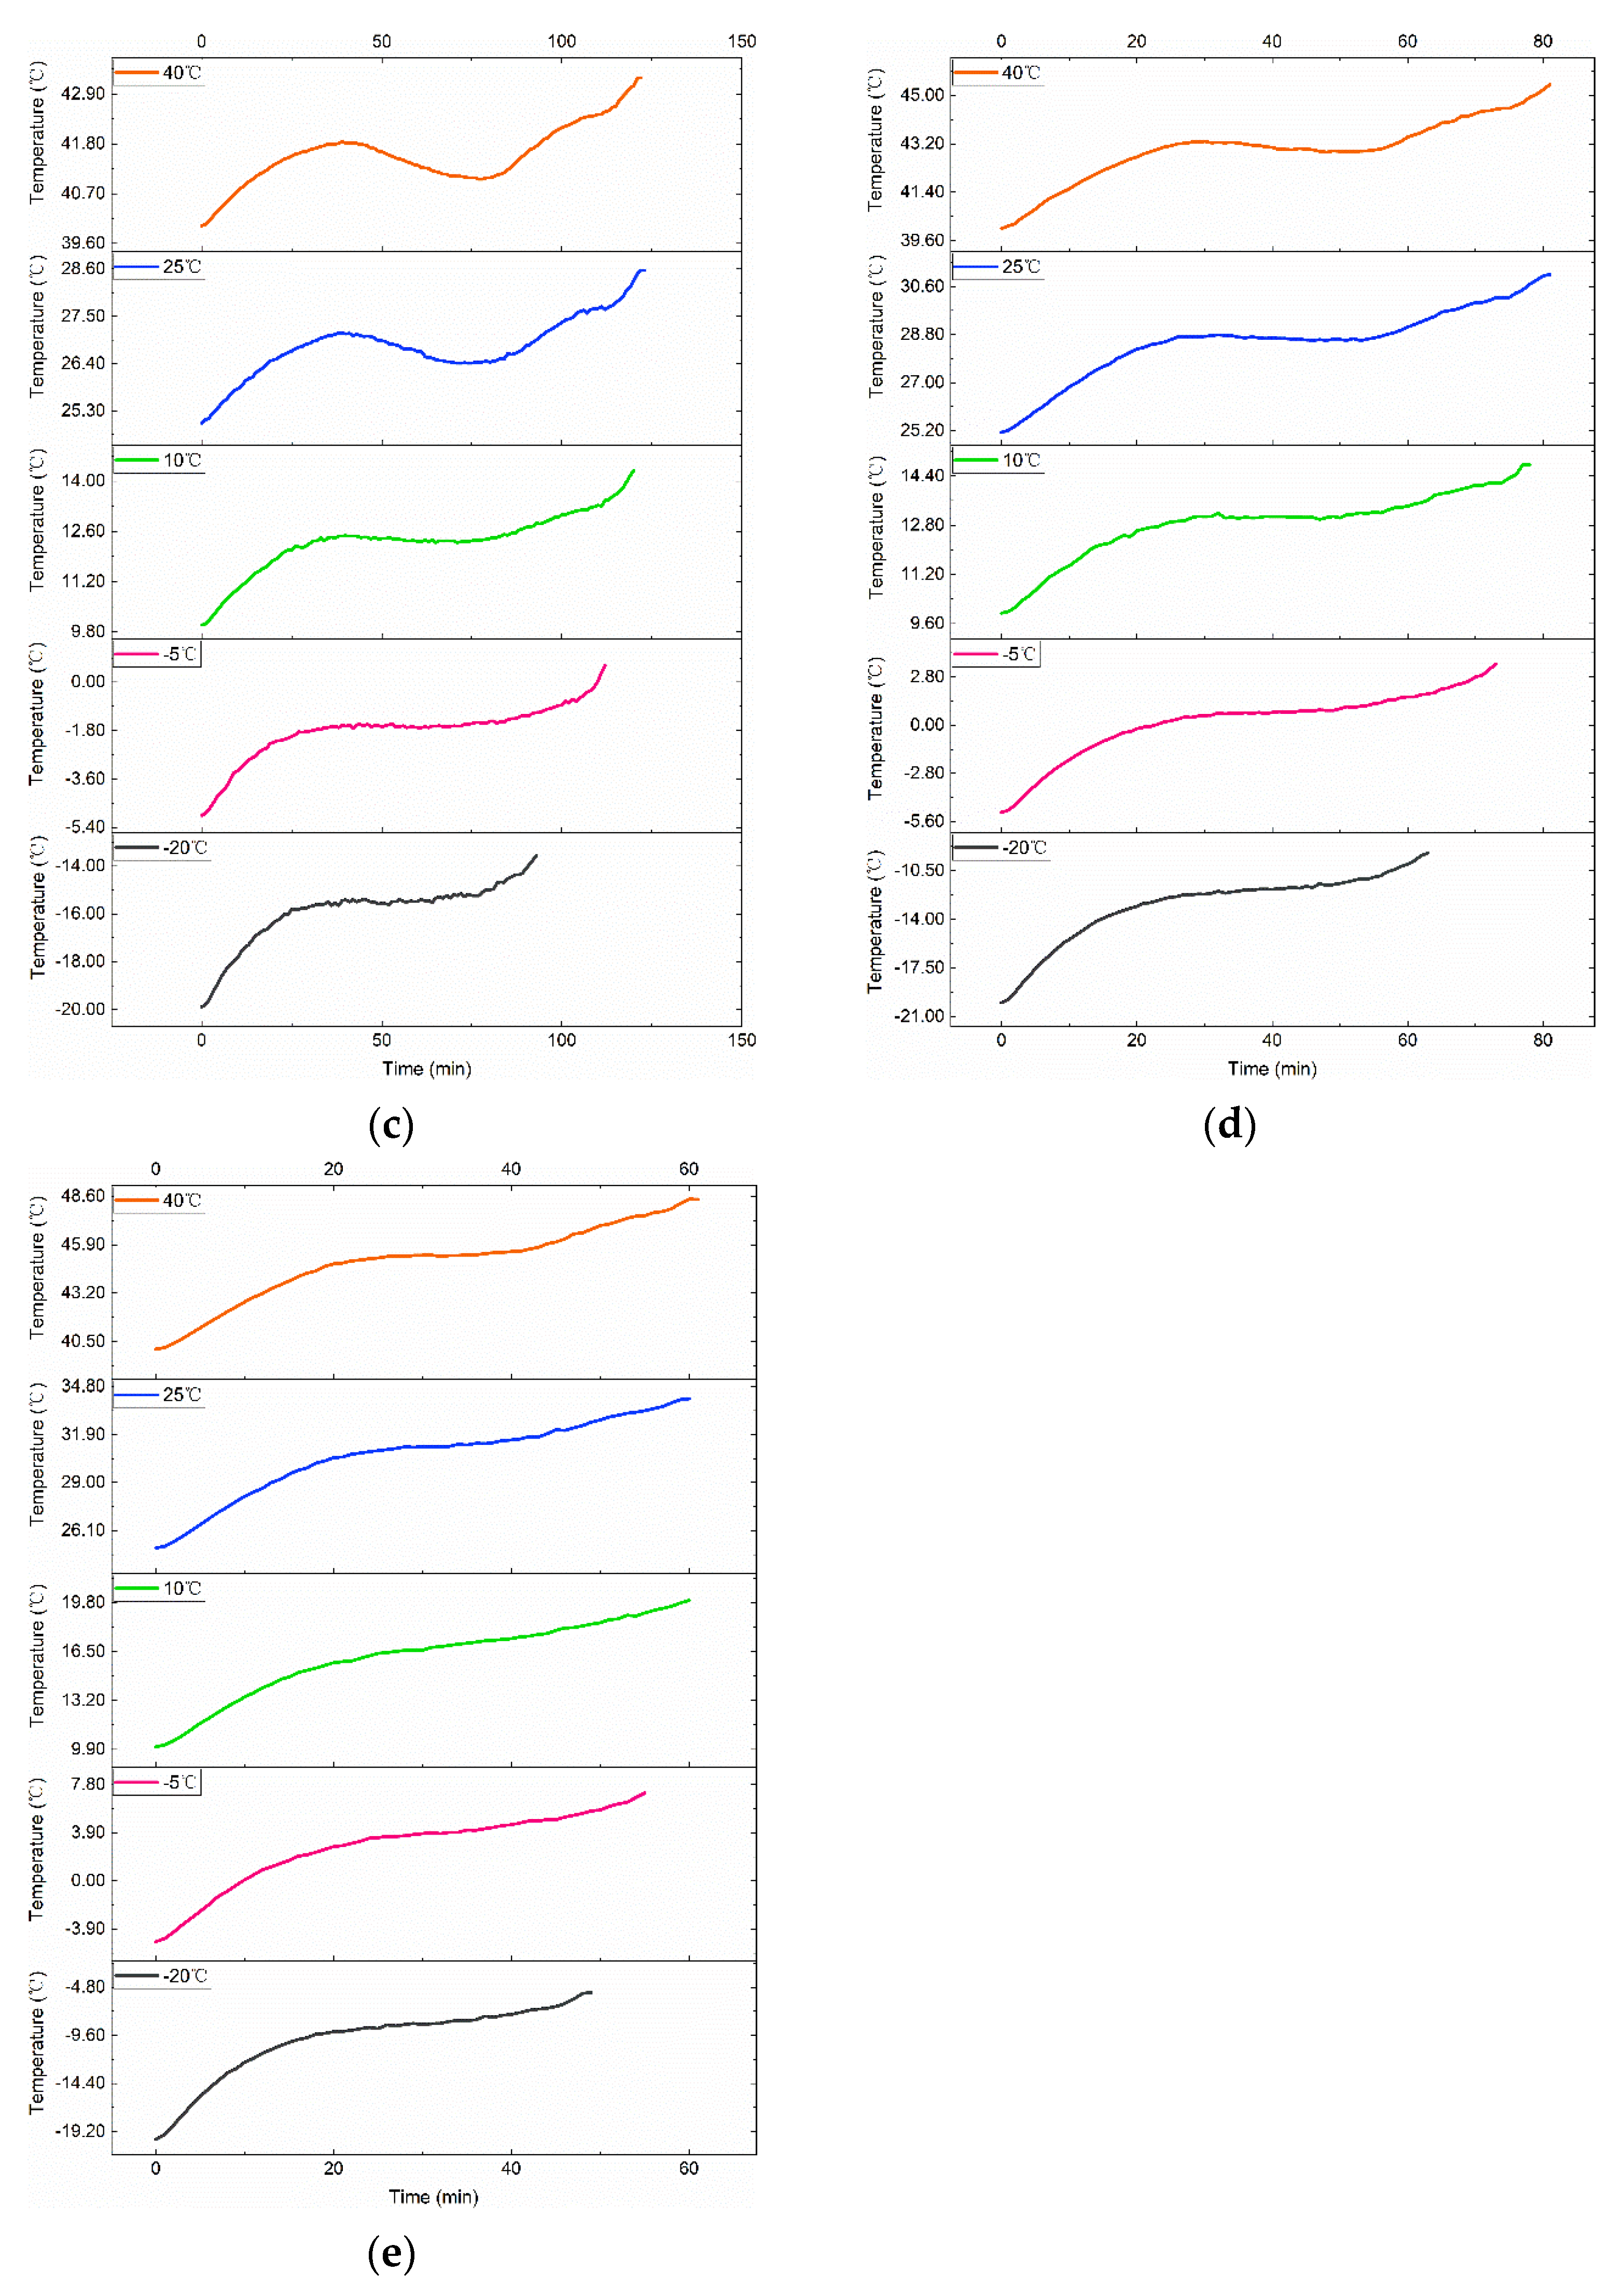
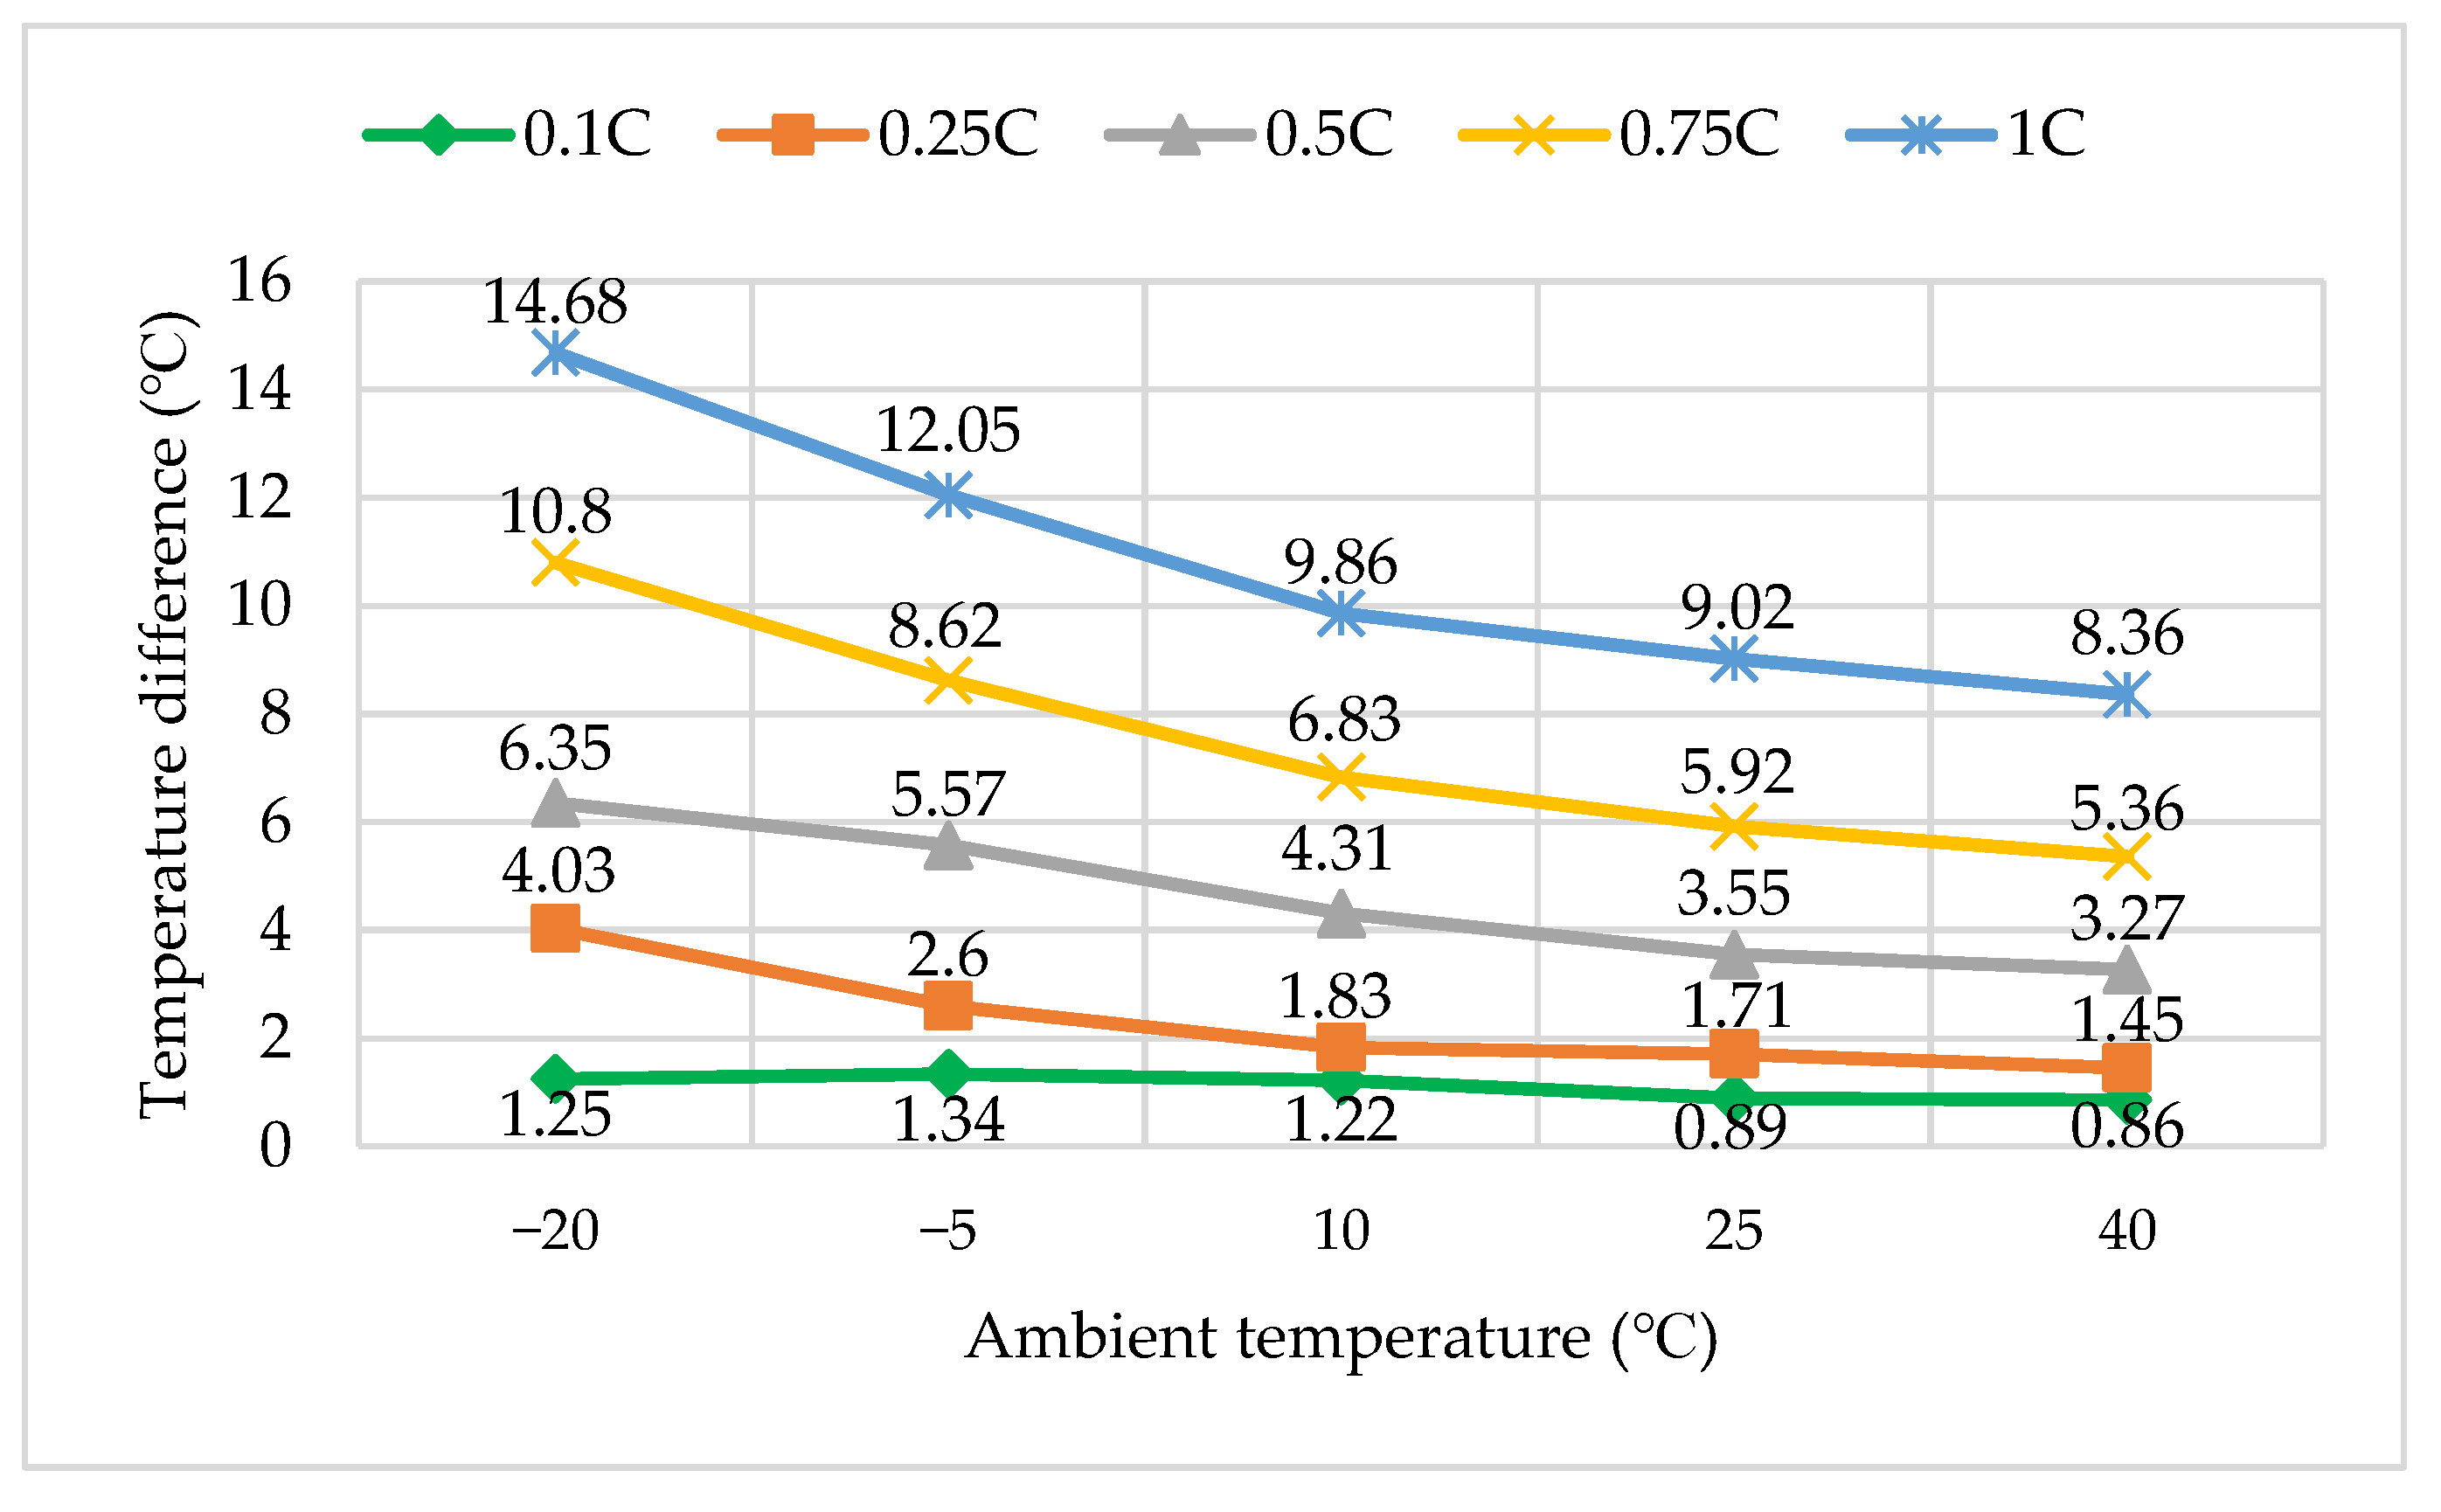
3.2. Influence of Different Ambient Temperatures on the Temperature Rise during Battery Discharge
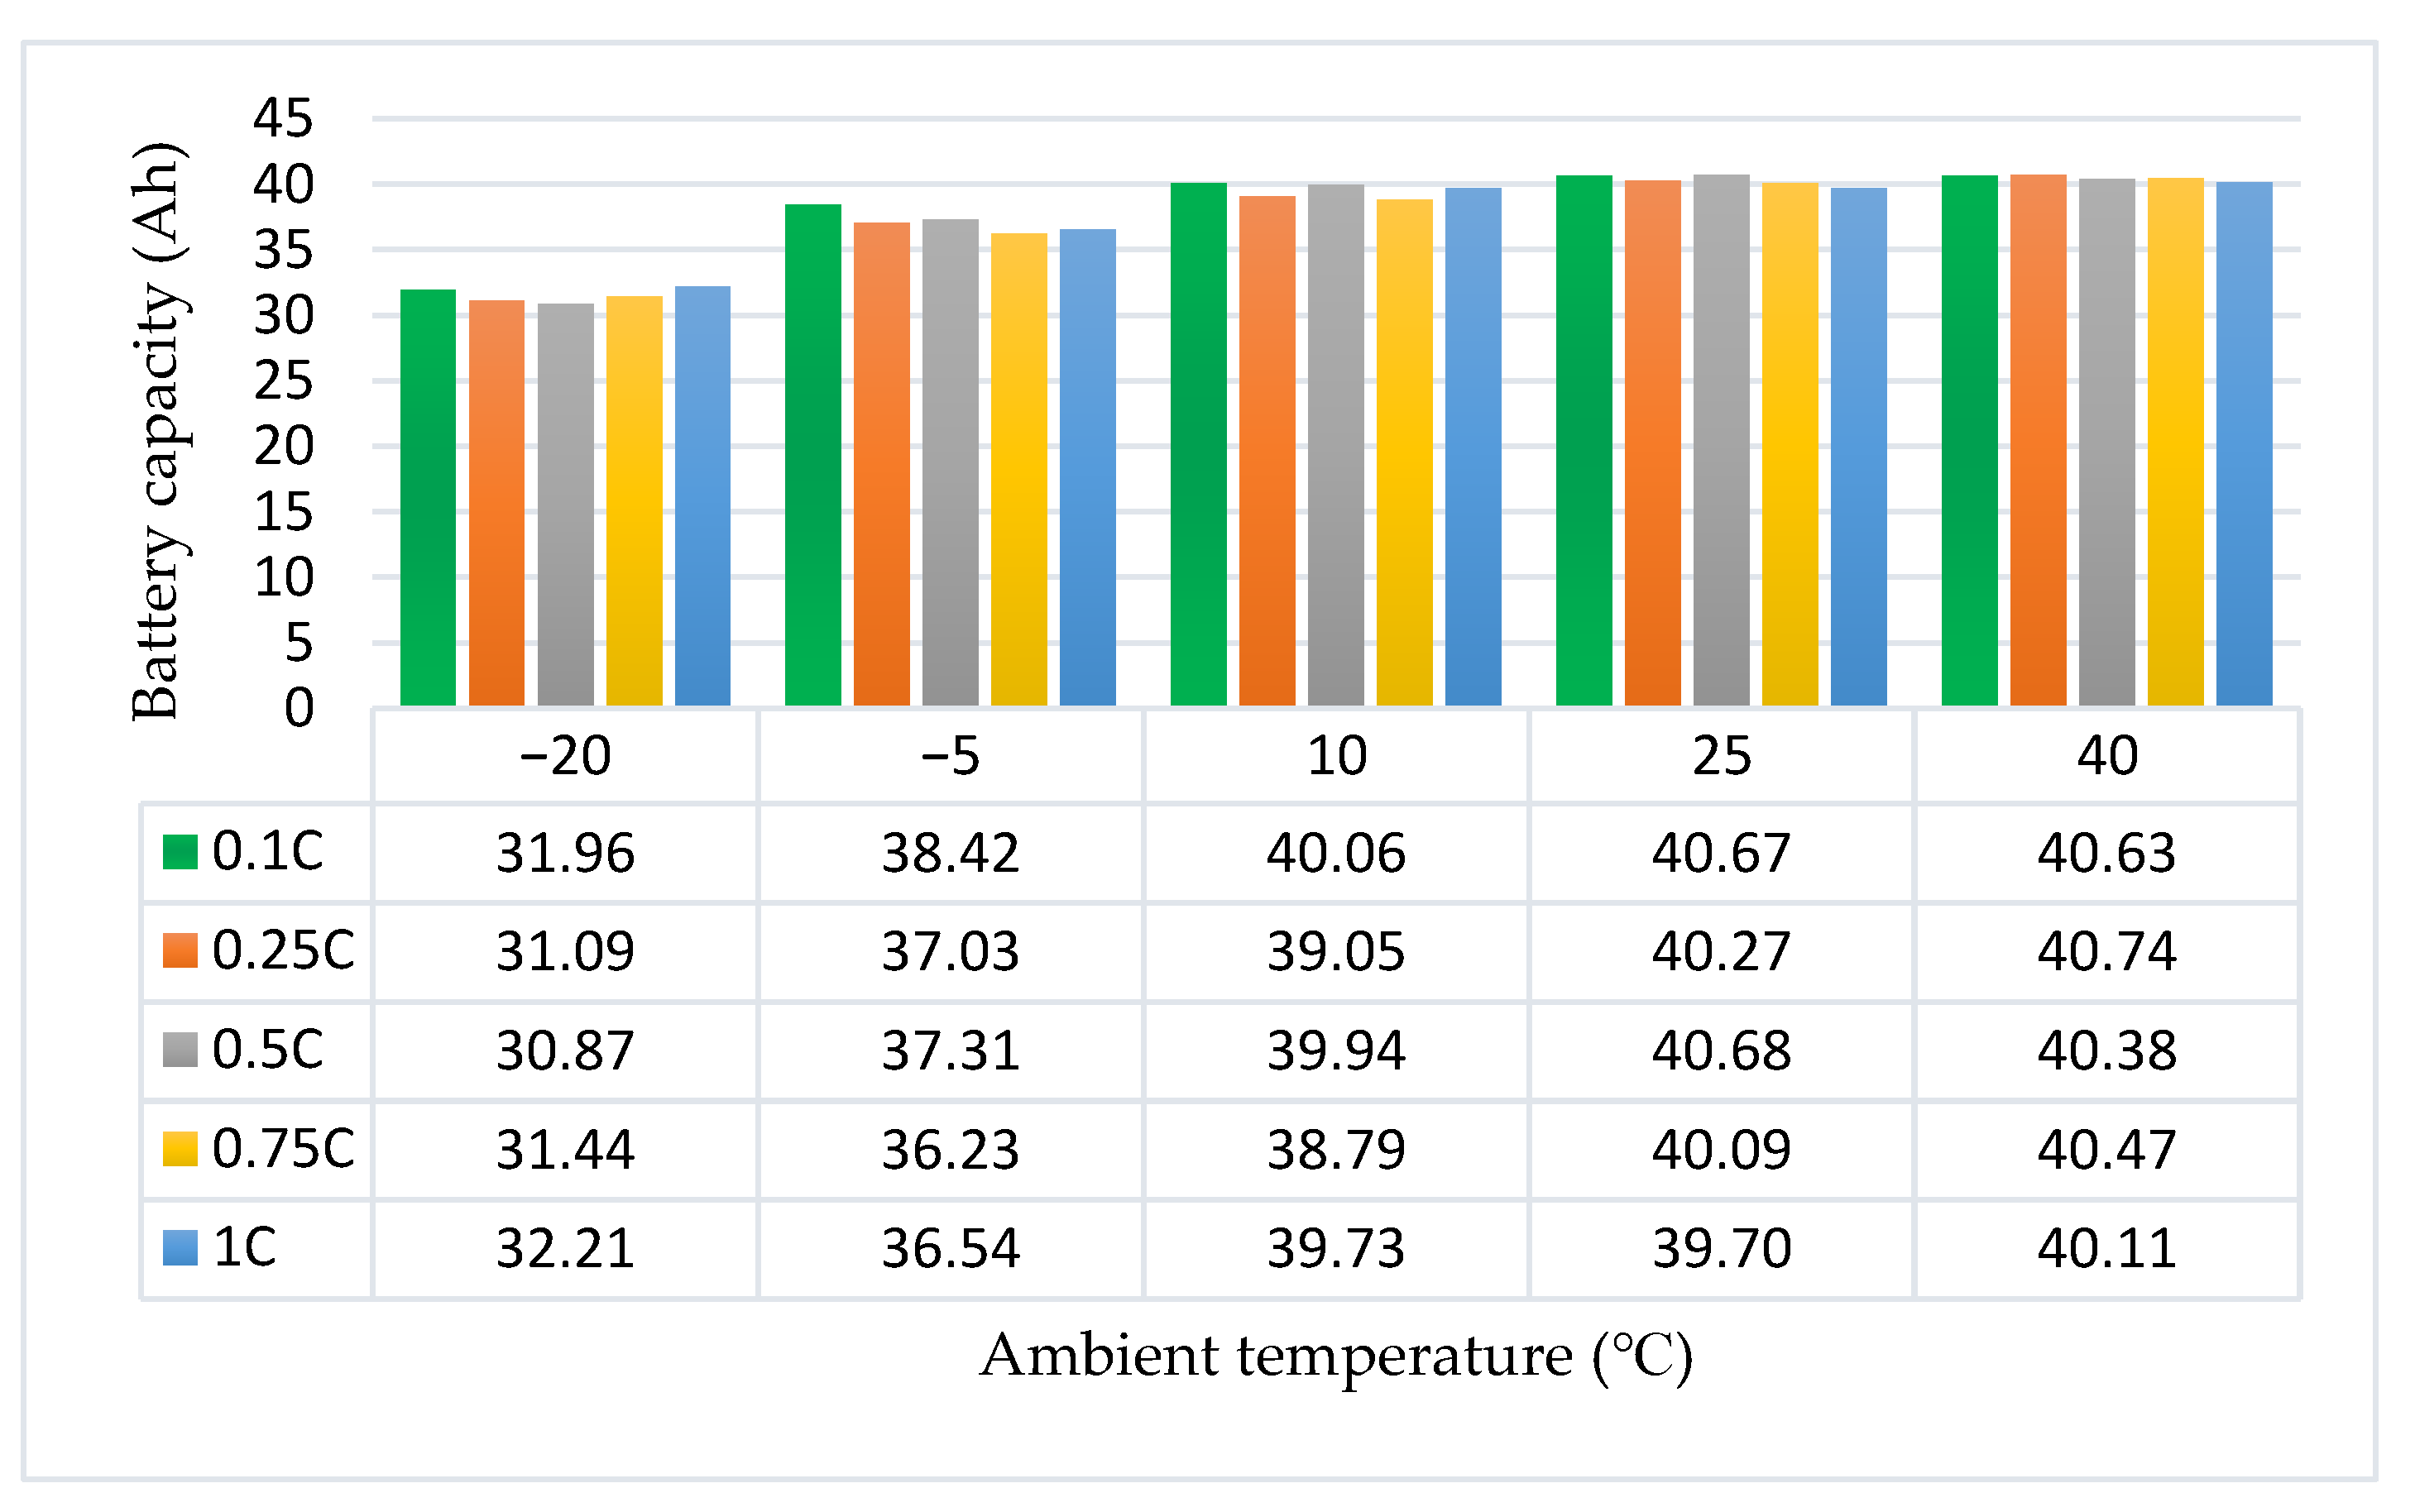
3.3. Influence of Different Ambient Temperatures and Discharge Rates on Battery Capacity
4. Discussion
4.1. Overview and Division Method of Voltage Plateau Period
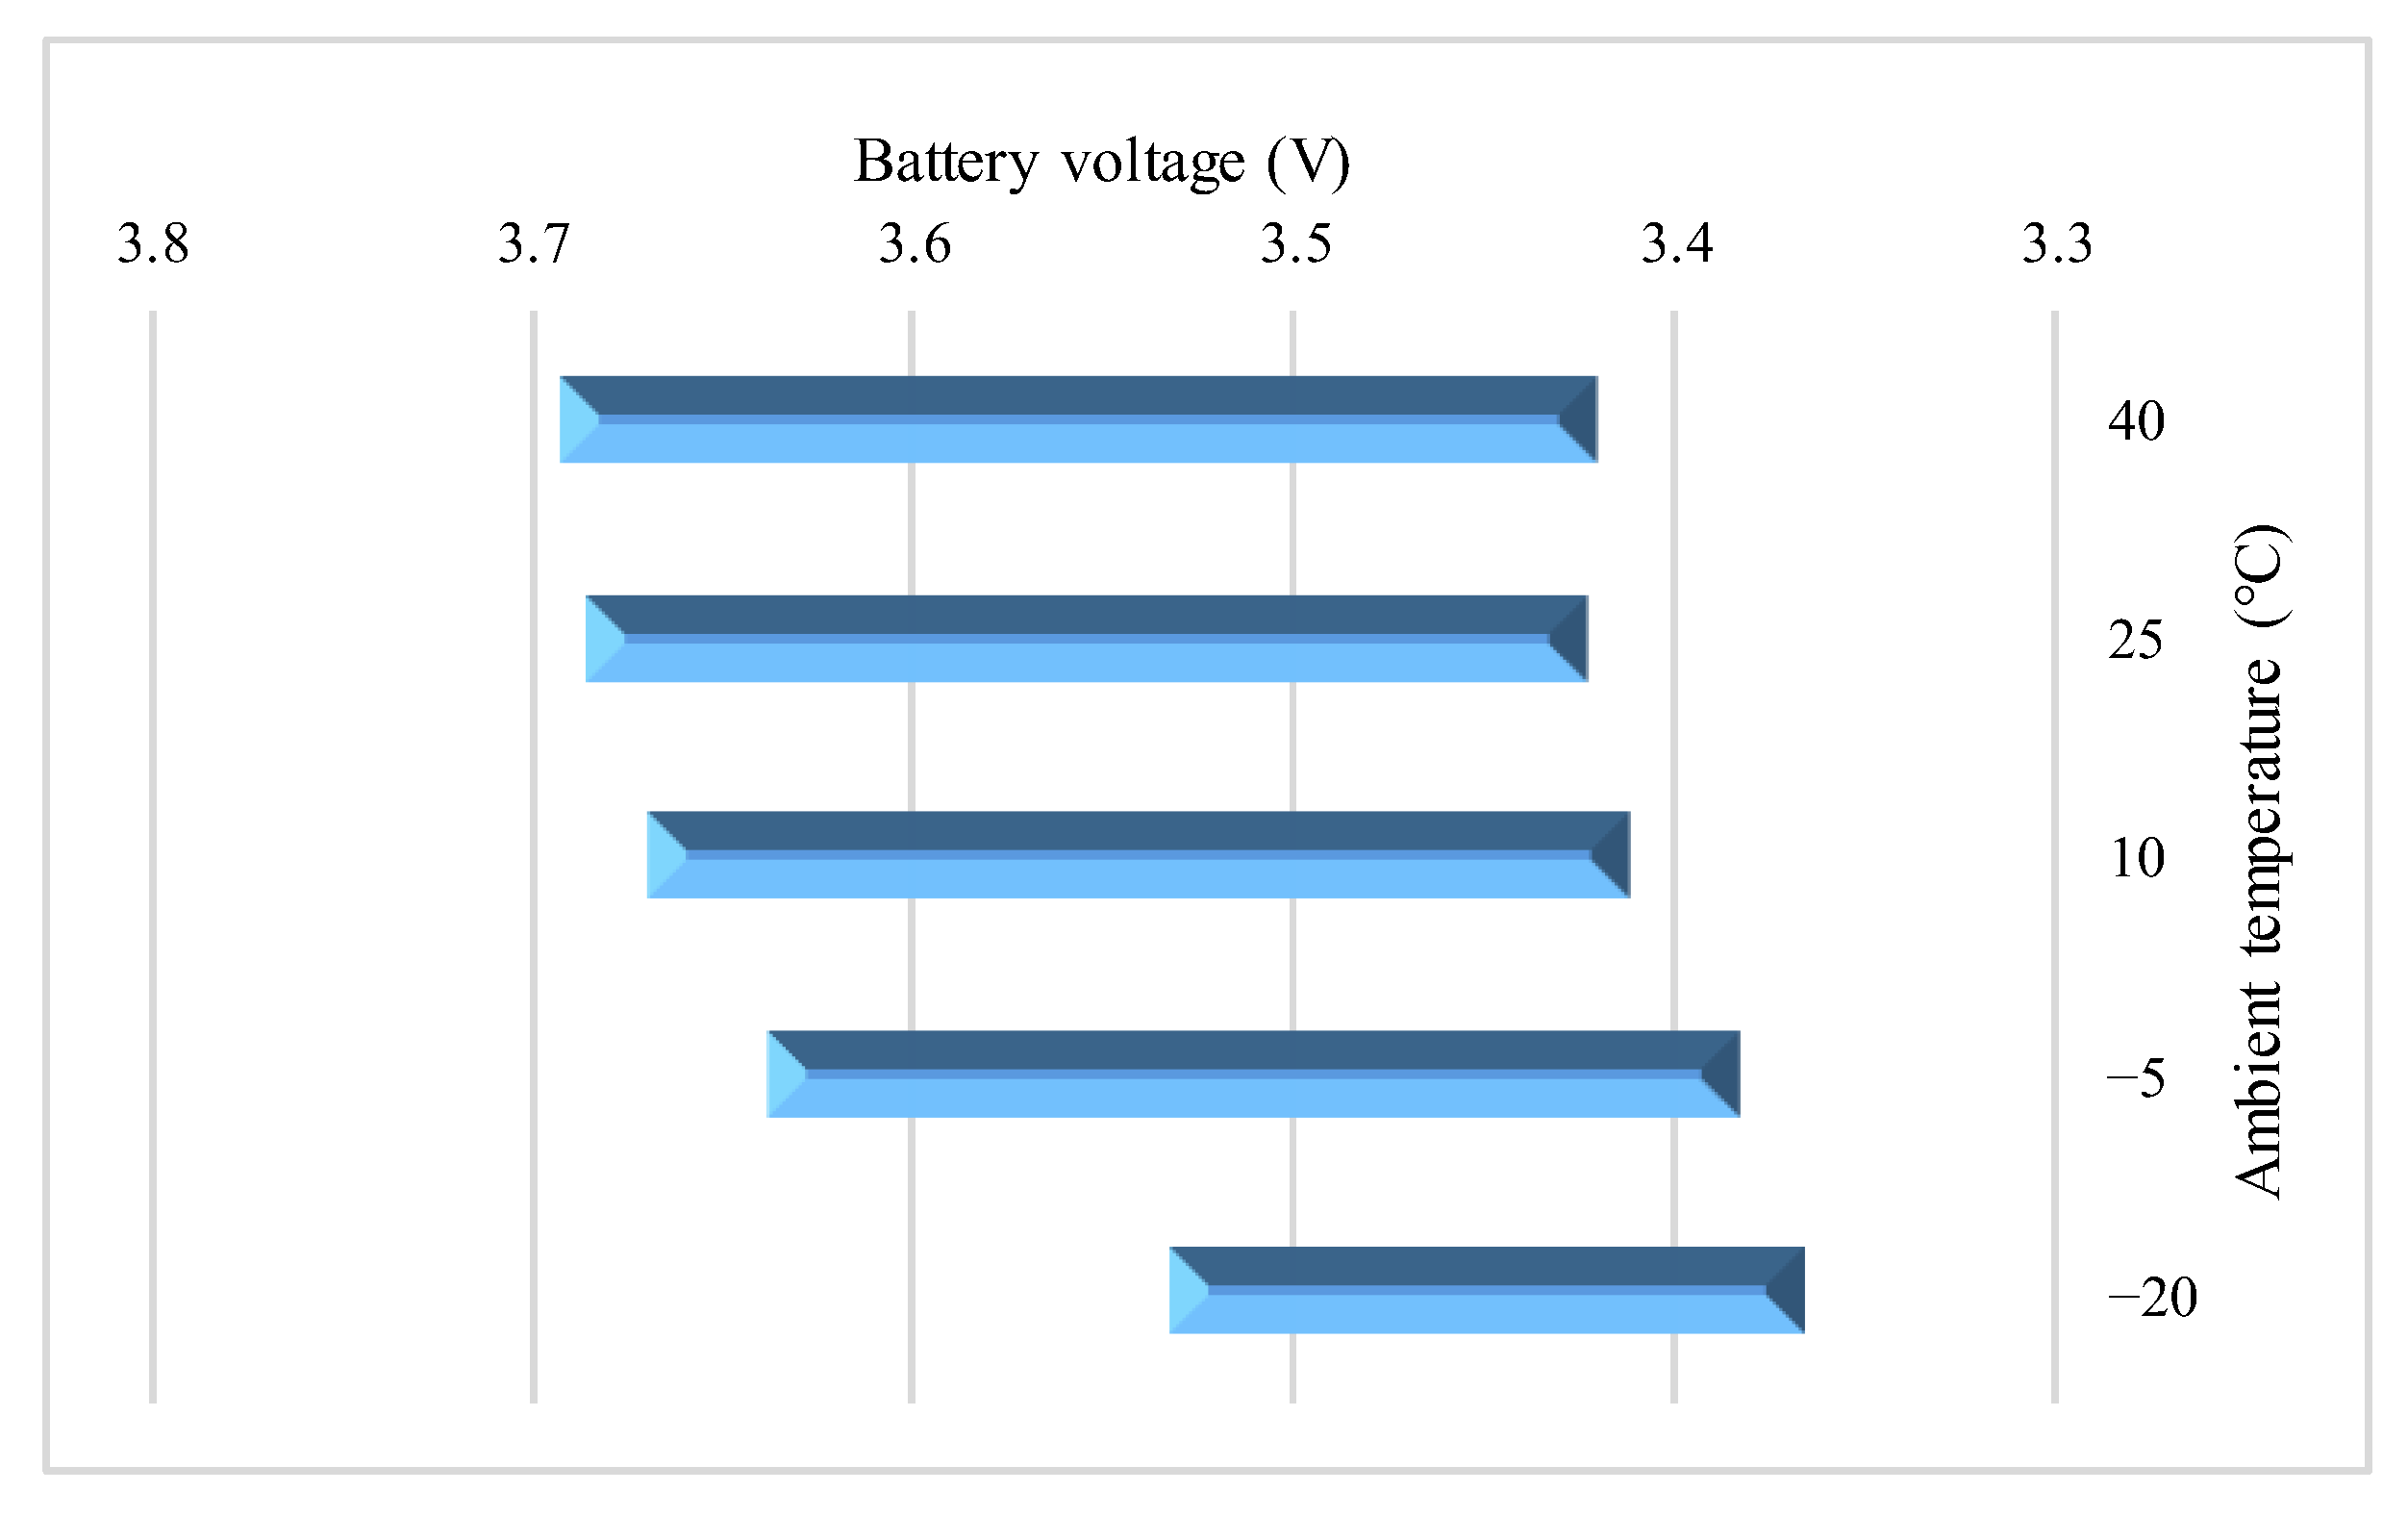
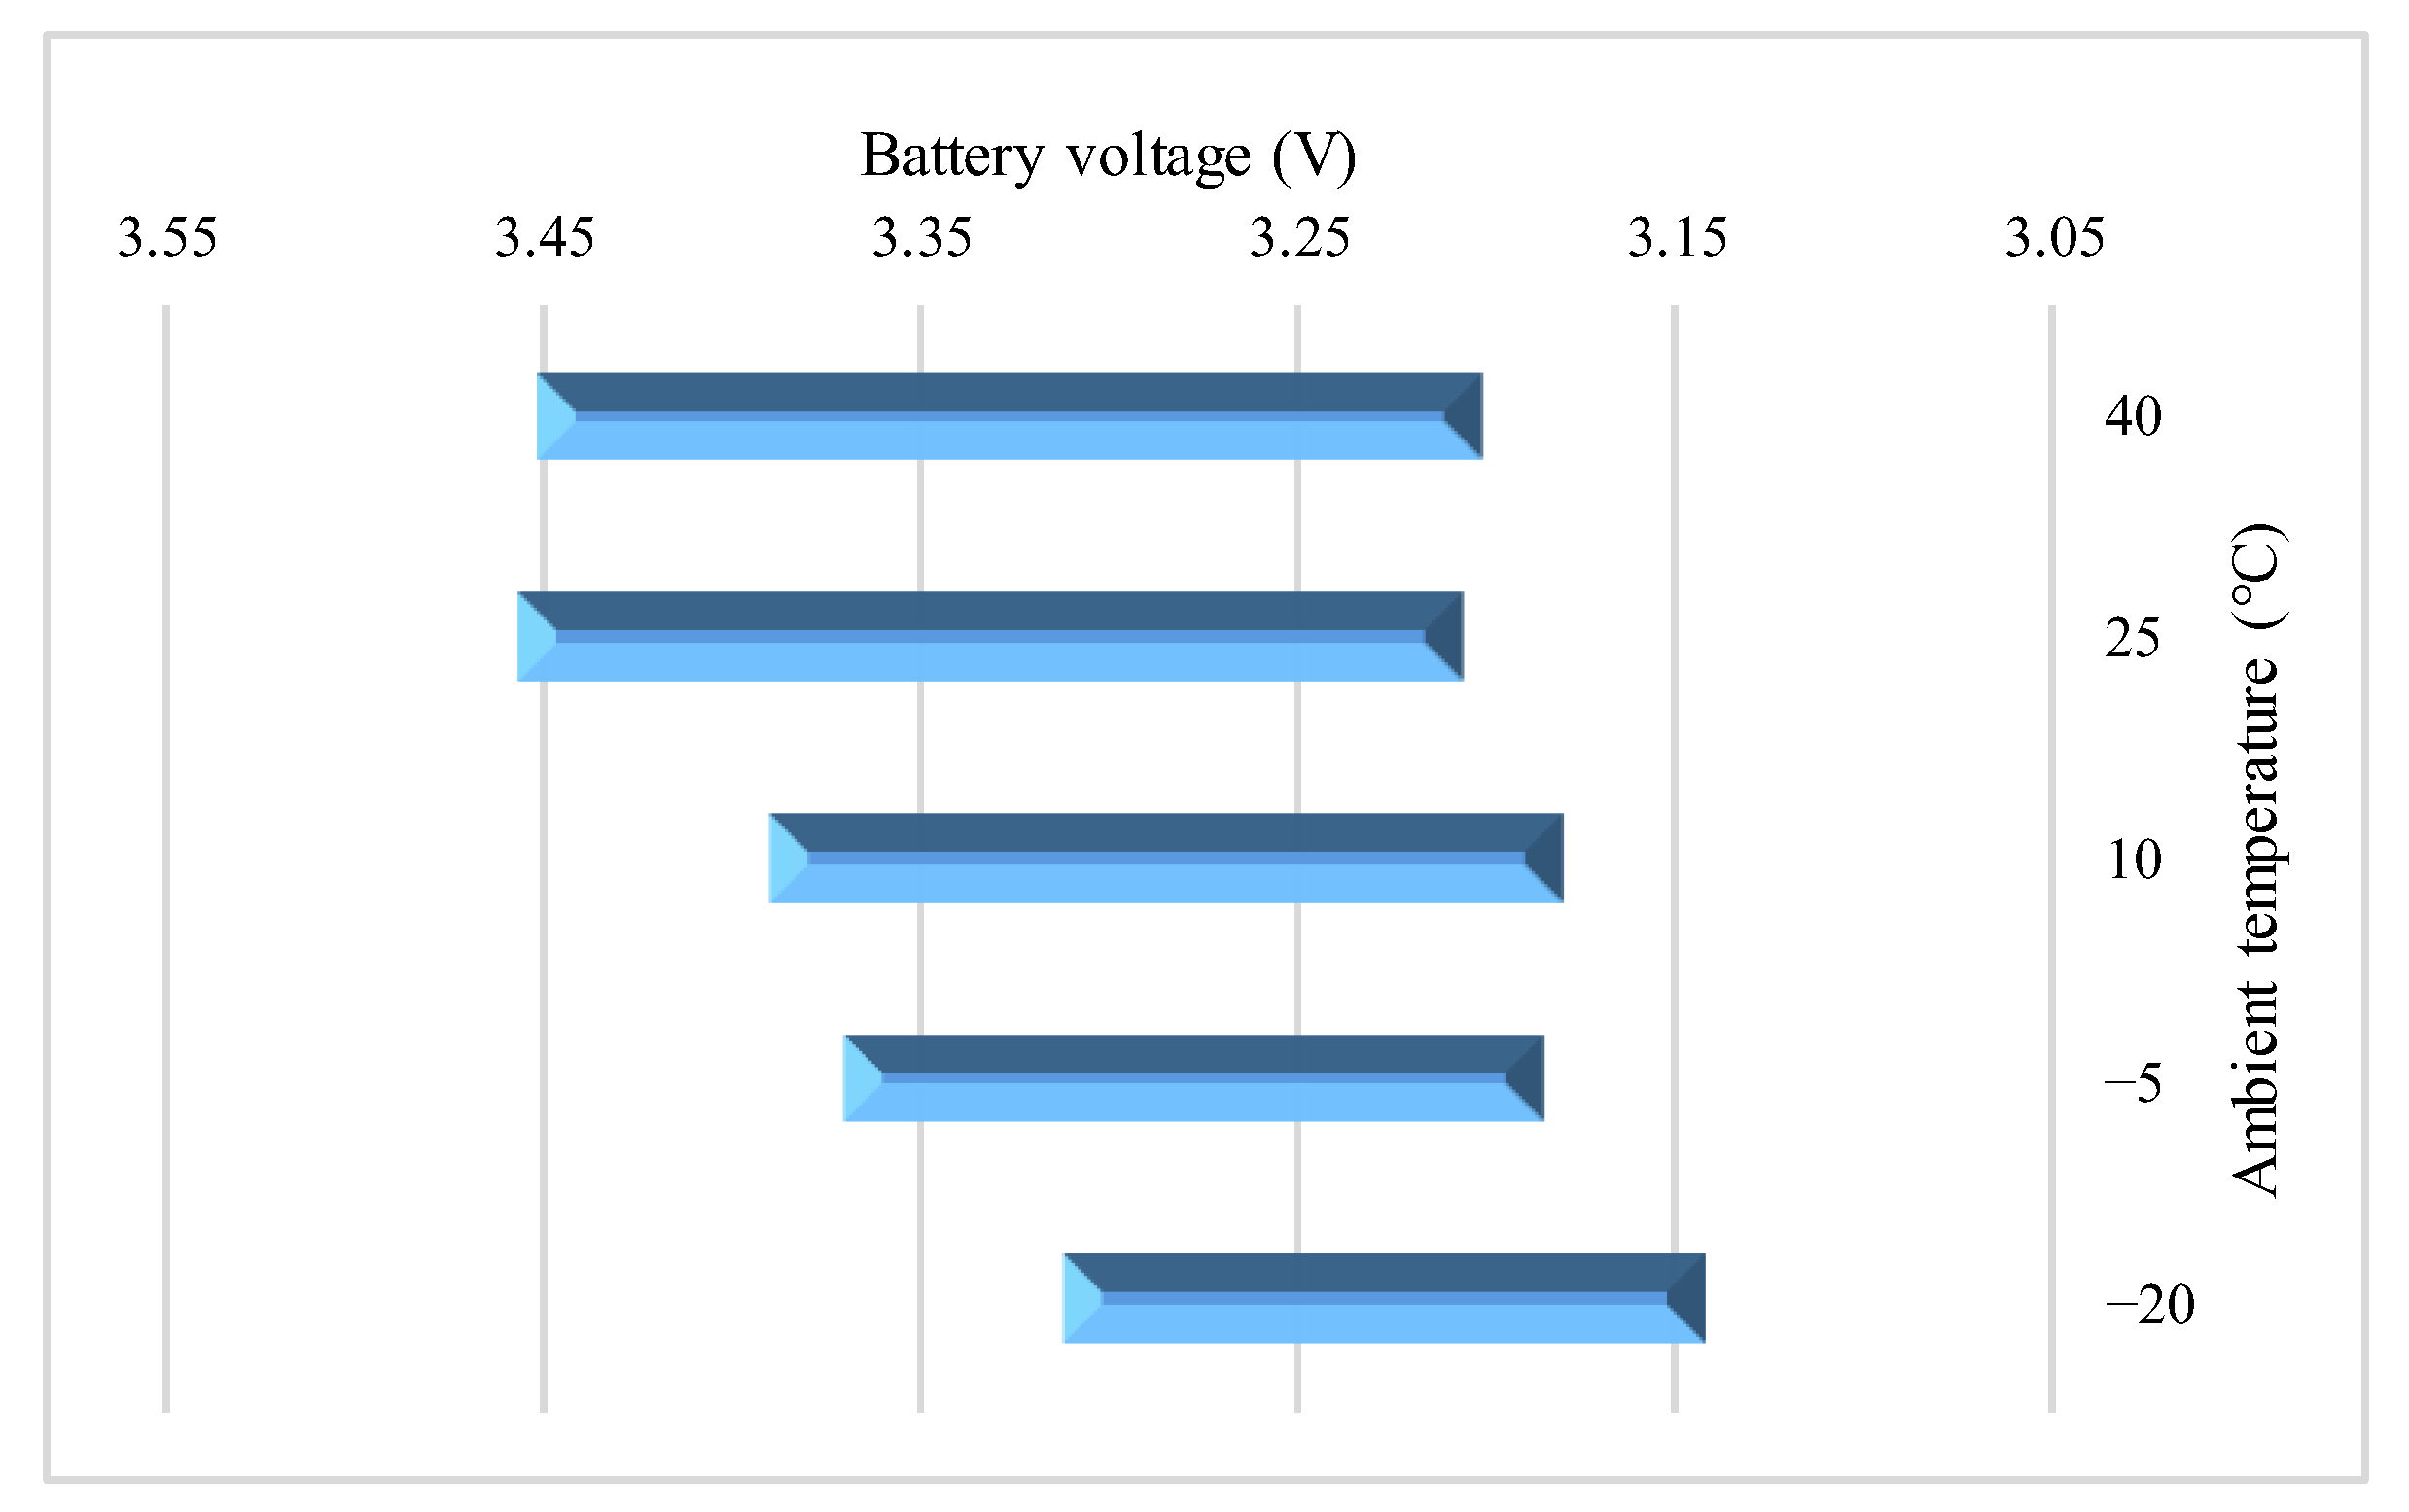
4.2. Influence Rule of Different Ambient Temperatures on Voltage Plateau Period
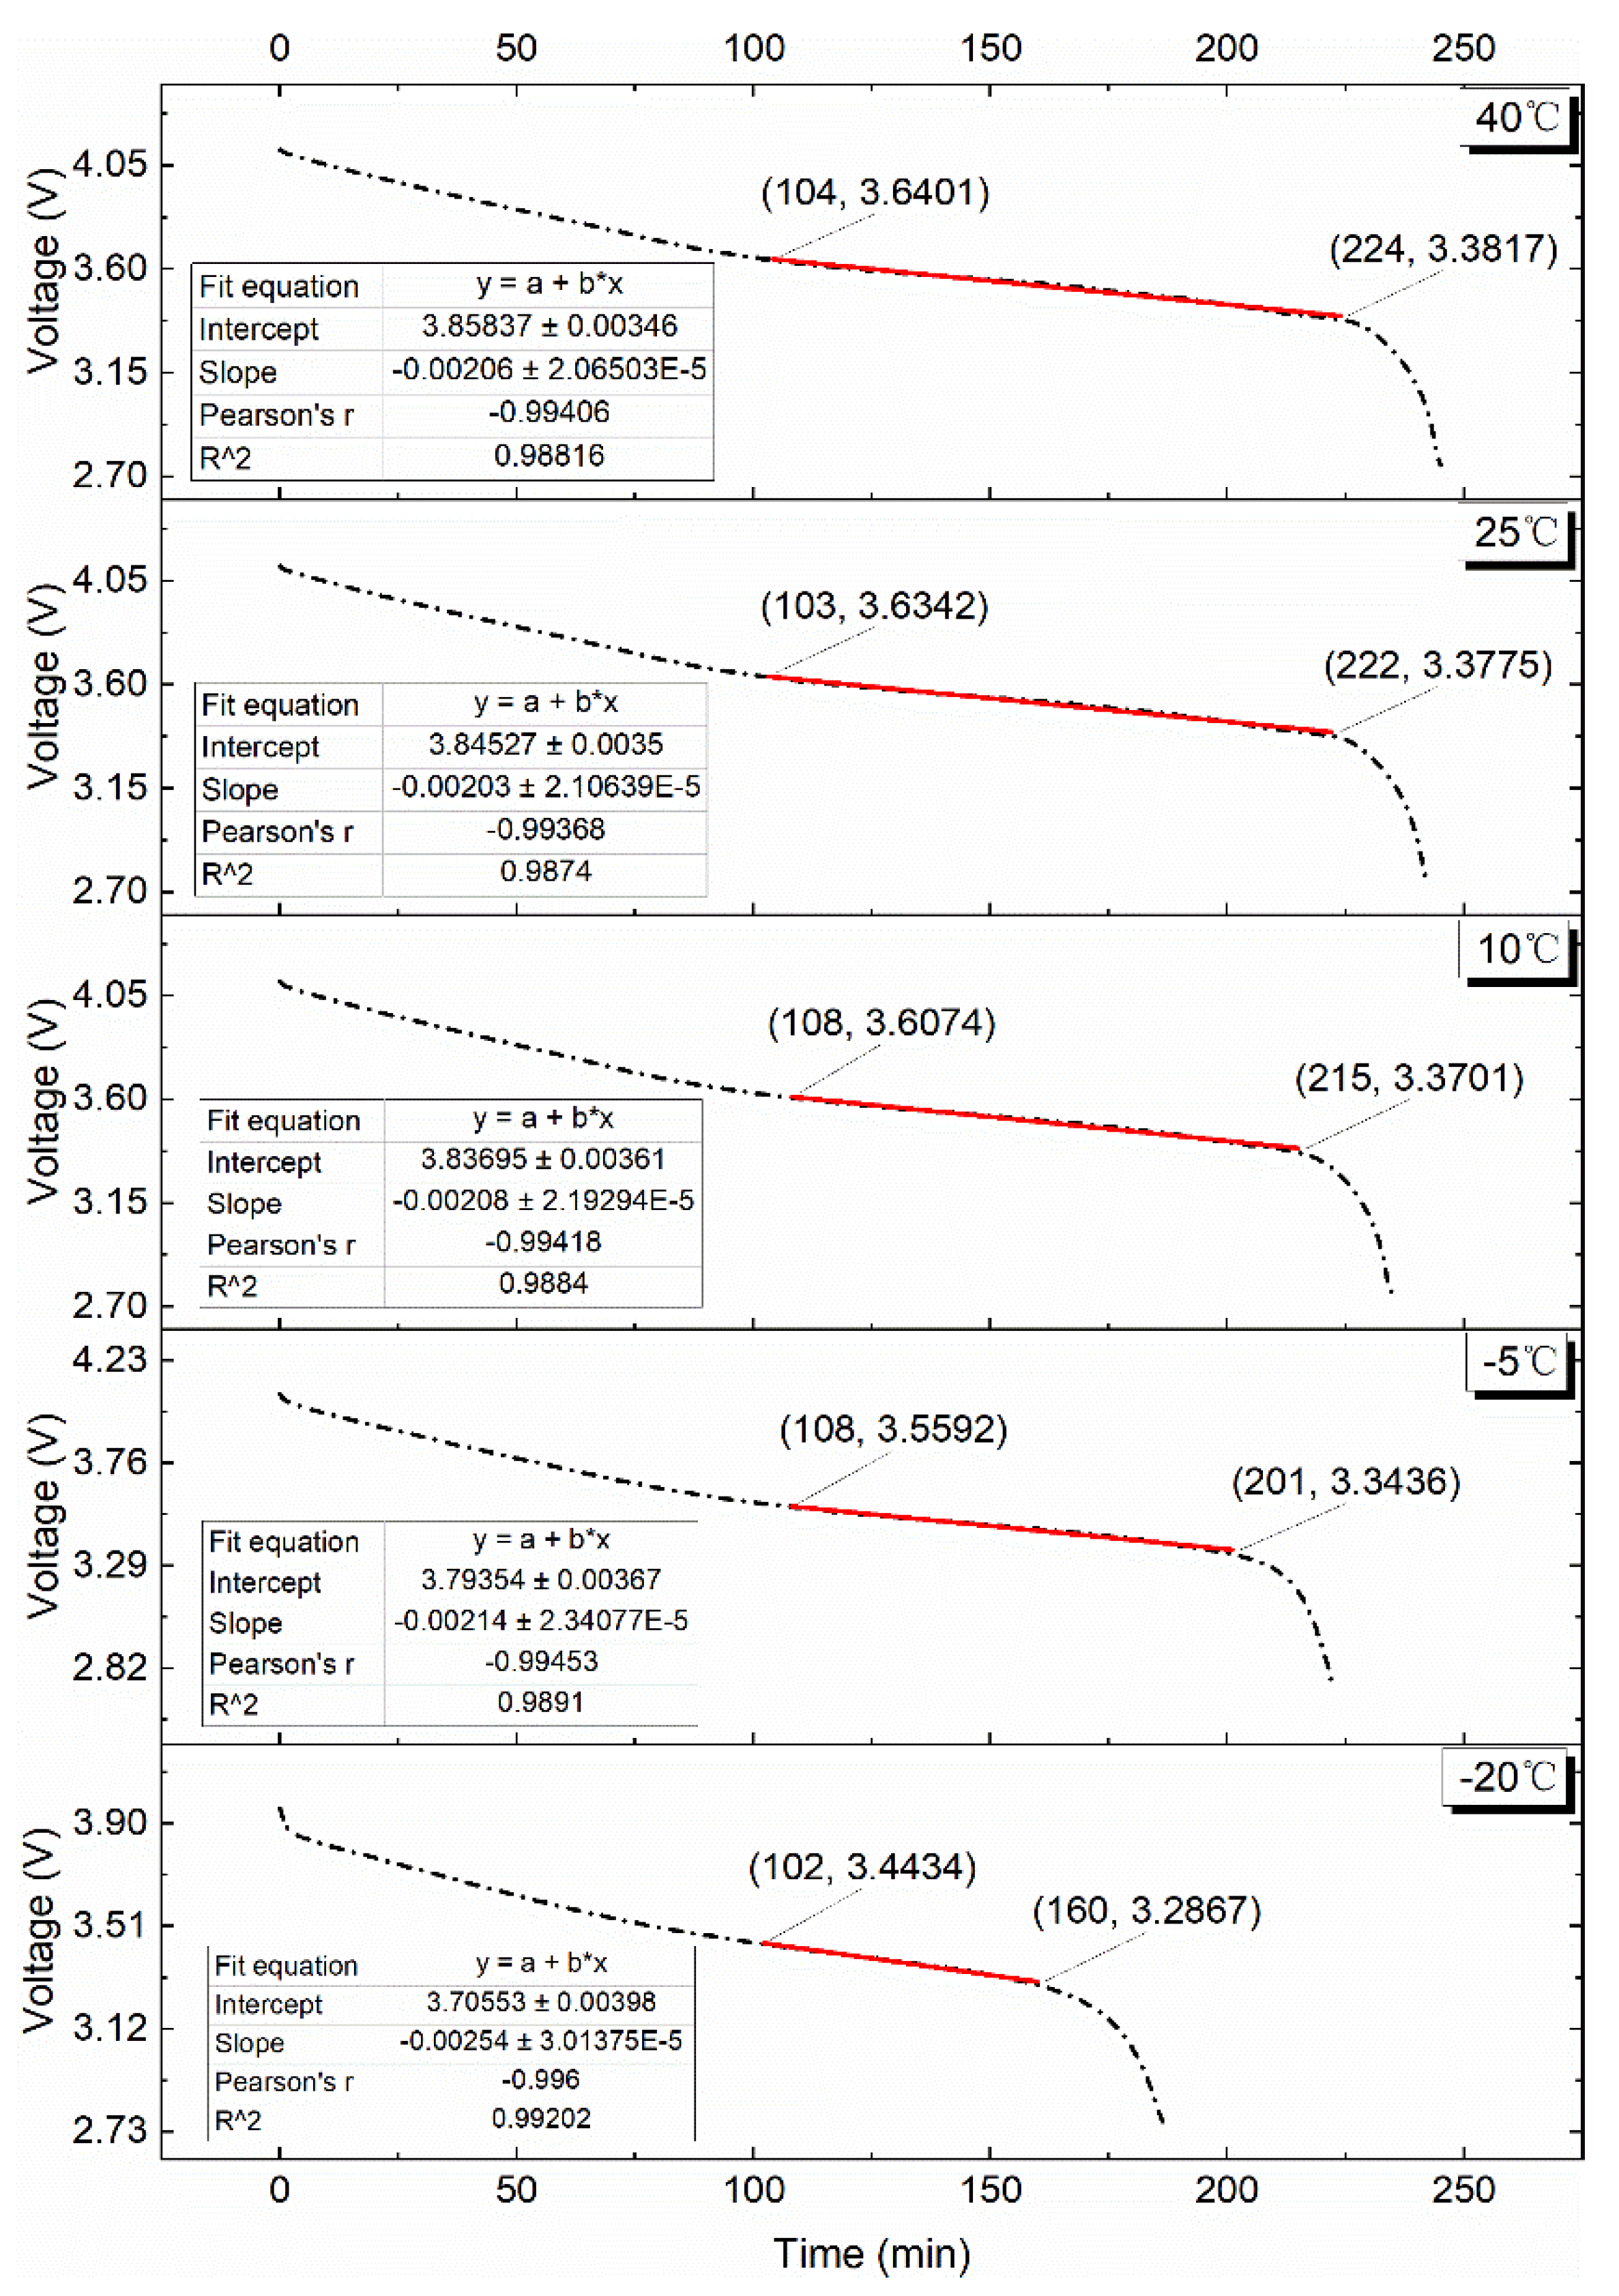
4.2.1. 0.1C Discharge
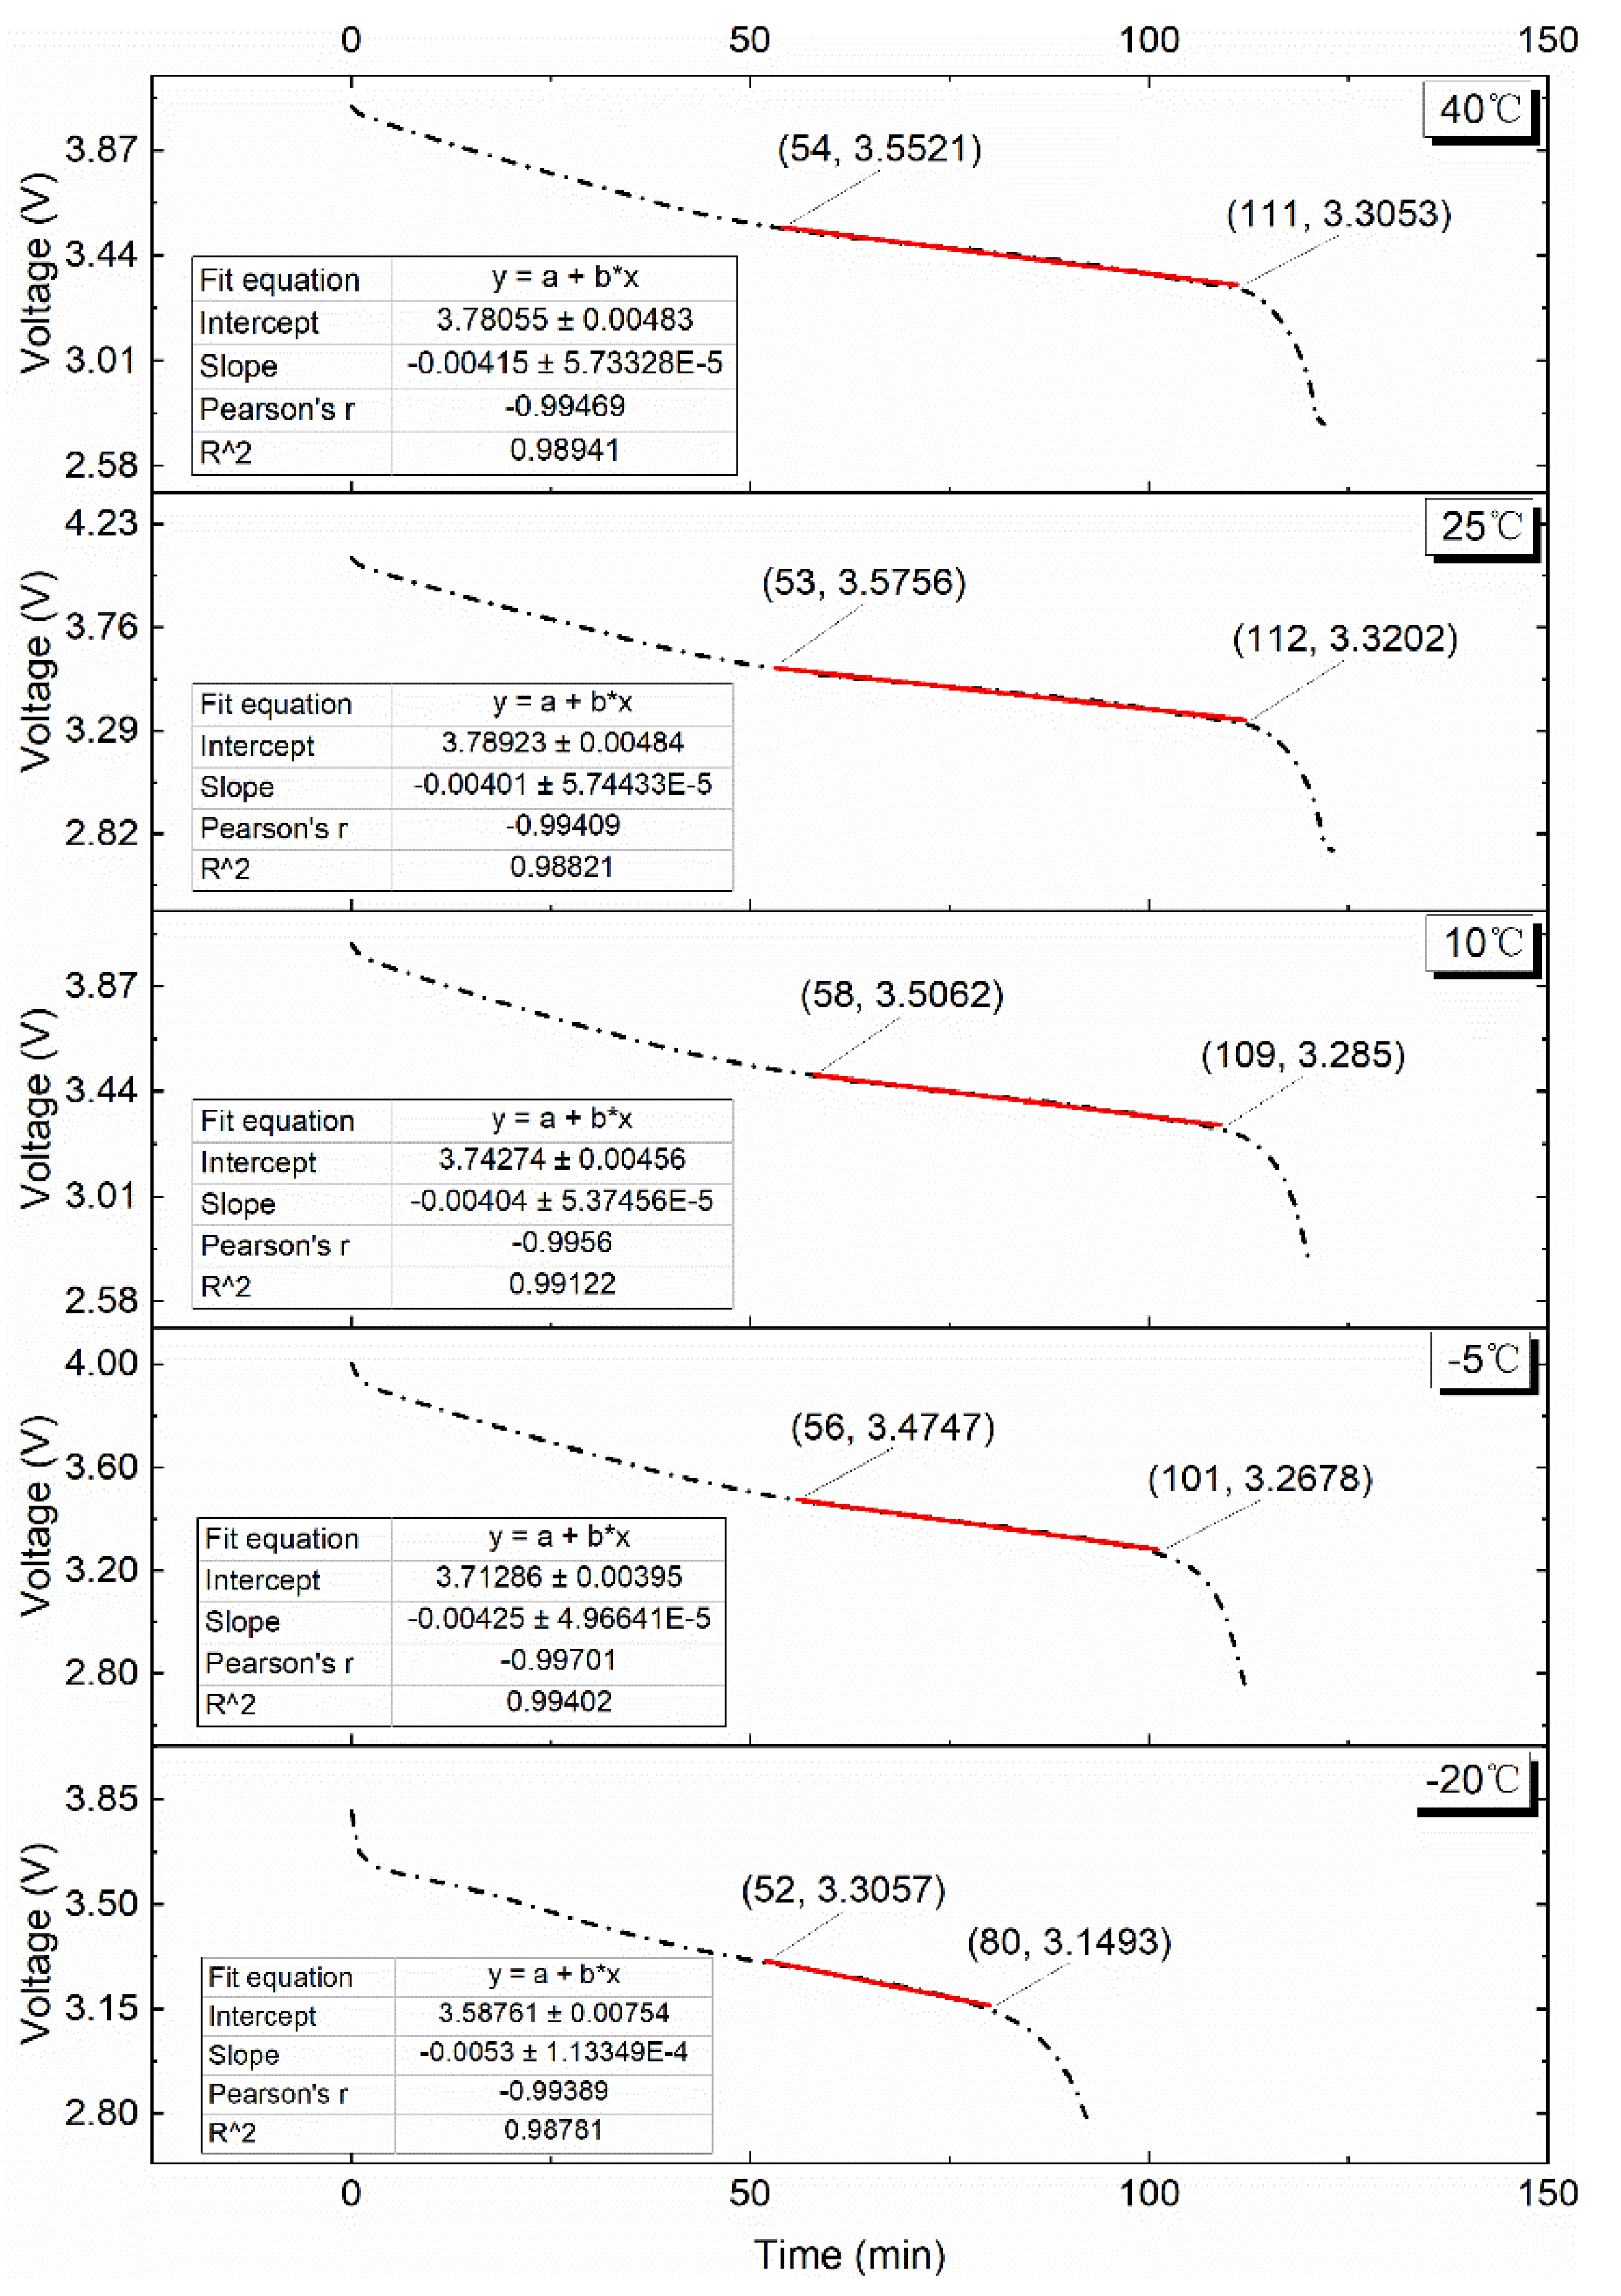
4.2.2. 0.25C Discharge
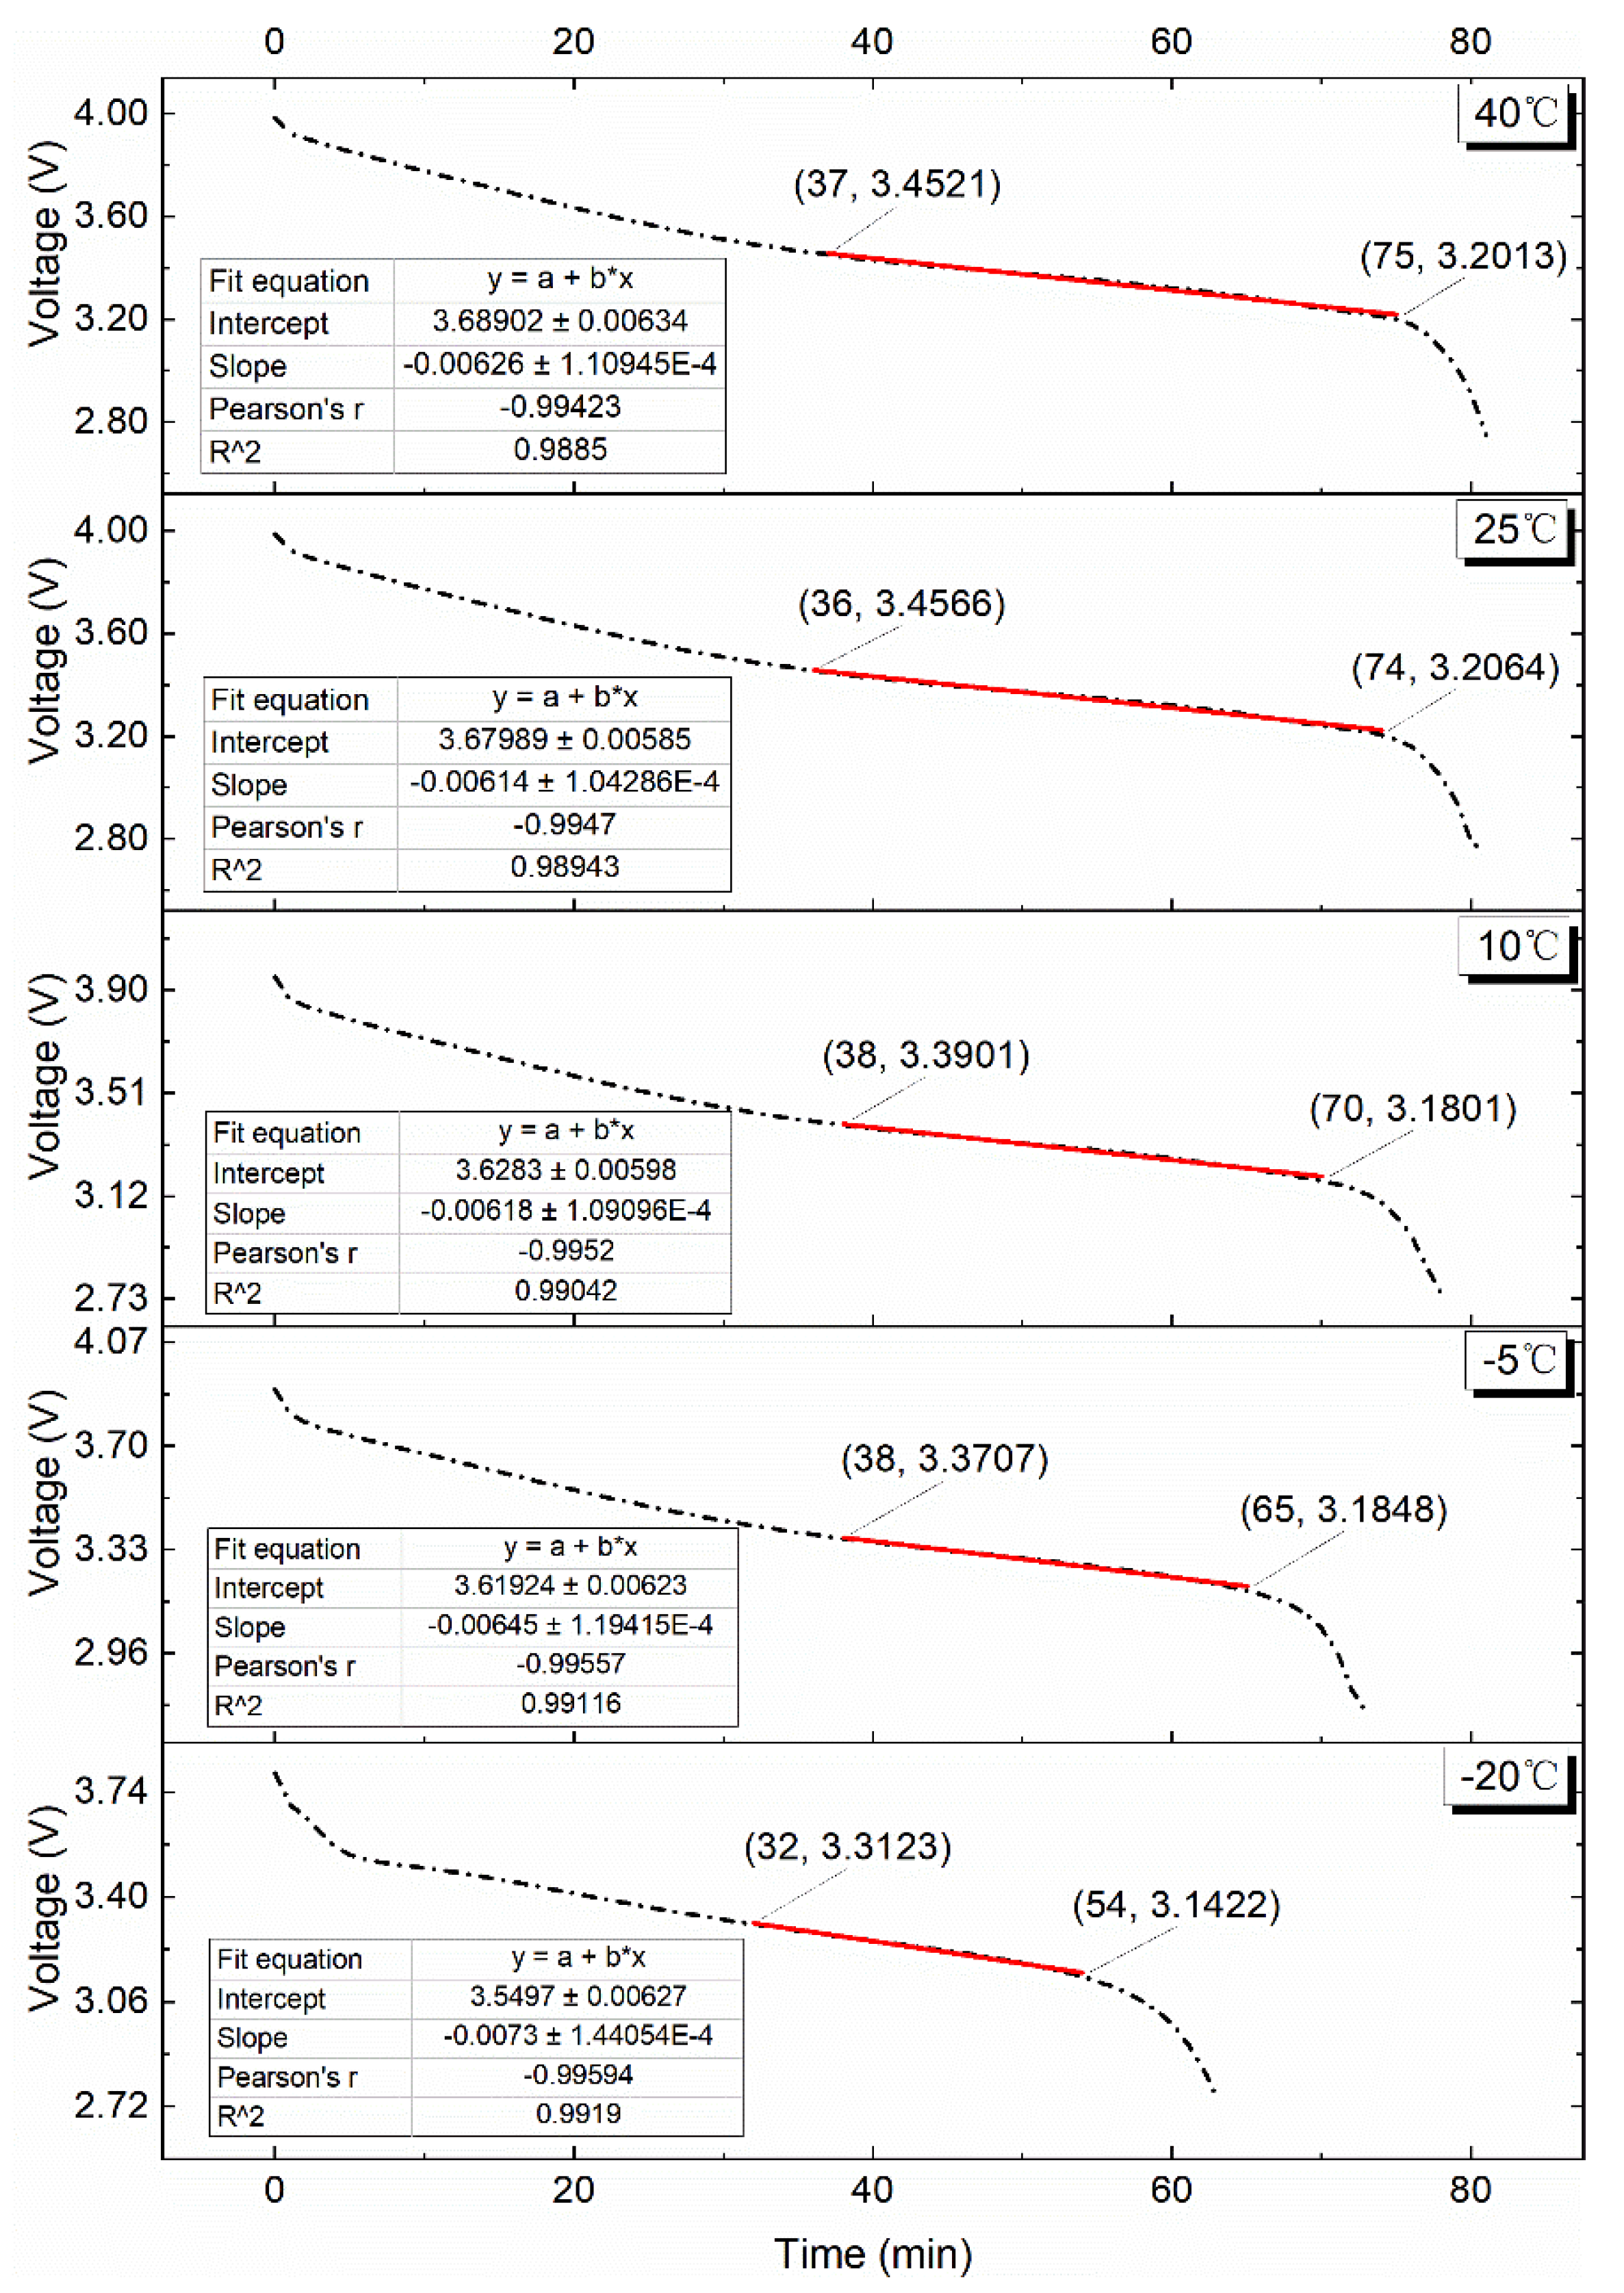
4.2.3. 0.5C Discharge
4.2.4. 0.75C Discharge
4.2.5. 1C Discharge
4.3. Research on Battery Temperature Rise during Voltage Plateau
4.4. Comparison of Discharge Energy in Voltage Plateau Period
5. Conclusions
Author Contributions
Funding
Institutional Review Board Statement
Informed Consent Statement
Data Availability Statement
Acknowledgments
Conflicts of Interest
References
- Li, Z.H.; Khajepour, A.; Song, J.C. A comprehensive review of the key technologies for pure electric vehicles. Energy 2019, 182, 824–839. [Google Scholar] [CrossRef]
- Nian, V.; Hari, M.P.; Yuan, J. A new business model for encouraging the adoption of electric vehicles in the absence of policy support. Appl. Energy 2019, 235, 1106–1117. [Google Scholar] [CrossRef]
- Harper, G.; Sommerville, R.; Kendrick, E.; Driscoll, L.; Slater, P.; Stolkin, R.; Walton, A.; Christensen, P.; Heidrich, O.; Lambert, S.; et al. Recycling lithium-ion batteries from electric vehicles. Nature 2019, 575, 75–86. [Google Scholar] [CrossRef] [PubMed] [Green Version]
- Lai, X.; Chen, Q.W.; Tang, X.P.; Zhou, Y.Q.; Gao, F.R.; Guo, Y.; Bhagat, R.; Zheng, Y.J. Critical review of life cycle assessment of lithium-ion batteries for electric vehicles: A lifespan perspective. eTransportation 2022, 12, 100169. [Google Scholar] [CrossRef]
- Yang, Z.G.; Zhang, J.L.; Kintner-Meyer, M.C.W.; Lu, X.C.; Choi, D.; Lemmon, J.P.; Liu, J. Electrochemical energy storage for green grid. Chem. Rev. 2011, 111, 3577–3613. [Google Scholar] [CrossRef] [PubMed]
- Goodenough, J.B.; Kim, Y. Challenges for rechargeable Li batteries. Chem. Mater. 2010, 22, 587–603. [Google Scholar] [CrossRef]
- Liu, L.; Lin, C.J.; Fan, B.; Wang, F.; Lao, L.; Yang, P.X. A new method to determine the heating power of ternary cylindrical lithium ion batteries with highly repeatable thermal runaway test characteristics. J. Power Sources 2020, 472, 228503. [Google Scholar] [CrossRef]
- Wu, X.G.; Lv, S.Y.; Chen, J.Z. Determination of the optimum heat transfer coefficient and temperature rise analysis for a lithium-ion battery under the conditions of Harbin city bus driving cycles. Energies 2017, 10, 1723. [Google Scholar] [CrossRef] [Green Version]
- Graham, J.D.; Rupp, J.A.; Brungard, E. Lithium in the green energy transition: The quest for both sustainability and security. Sustainability 2021, 13, 11274. [Google Scholar] [CrossRef]
- Ohzuku, T.; Brodd, R.J. An overview of positive-electrode materials for advanced lithium-ion batteries. J. Power Sources 2007, 174, 449–456. [Google Scholar] [CrossRef]
- Xiao, Z.L.; Liu, P.; Song, L.B.; Cao, Z.; Du, J.L.; Zhou, C.F.; Jiang, P. The correlation between structure and thermal properties of nickel-rich ternary cathode materials: A review. Ionics 2021, 27, 3207–3217. [Google Scholar] [CrossRef]
- Shao, Y.J.; Huang, B.; Liu, Q.B.; Liao, S.J. Preparation and modification of Ni-Co-Mn ternary cathode materials. Prog. Chem. 2018, 30, 410–419. [Google Scholar]
- Williard, N.; He, W.; Hendricks, C.; Pecht, M. Lessons learned from the 787 Dreamliner issue on lithium-ion battery reliability. Energies 2013, 6, 4682–4695. [Google Scholar] [CrossRef] [Green Version]
- Iqbal, N.; Lee, S. Mechanical failure analysis of graphite anode particles with PVDF binders in Li-ion batteries. J. Electrochem. Soc. 2018, 165, A1961–A1970. [Google Scholar] [CrossRef]
- Yu, D.; Ren, D.S.; Dai, K.R.; Zhang, H.; Zhang, J.M.; Yang, B.Q.; Ma, S.J.; Wang, X.F.; You, Z. Failure mechanism and predictive model of lithium-ion batteries under extremely high transient impact. J. Energy Storage 2021, 43, 103191. [Google Scholar] [CrossRef]
- Fleischhammer, M.; Waldmann, T.; Bisle, G.; Hogg, B.; Wohlfahrt-Mehrens, M. Interaction of cyclic ageing at high-rate and low temperatures and safety in lithium-ion batteries. J. Power Sources 2015, 274, 432–439. [Google Scholar] [CrossRef]
- Panchal, S.; Dincer, I.; Agelin-Chaab, M.; Fraser, R.; Fowler, M. Experimental and theoretical investigations of heat generation rates for a water cooled LiFePO4 battery. Int. J. Heat Mass Transf. 2016, 101, 1093–1102. [Google Scholar] [CrossRef]
- Chen, X.; Lv, S.S.; Pei, Y.; Chen, L.; Ni, H.J. Influence of temperature on the LiFePO4 power batteries’ discharge voltage values. New Chem. Mater. 2015, 43, 202–203. [Google Scholar]
- Wang, C.X. Study on Internal Thermal Strain Characteristics of Lithium Batteries at High C Rates under Low Temperature. Master’s Thesis, Civil Aviation Flight University of China, Guanghan, China, 2020. [Google Scholar]
- An, Z.J.; Jia, L.; Ding, Y.; Dang, C.; Li, X.J. A review on lithium-ion power battery thermal management technologies and thermal safety. J. Therm. Sci. 2017, 26, 391–412. [Google Scholar] [CrossRef]
- Gu, Y.J.; Sun, X.F.; Li, Z.L.; Xu, X.M.; Chen, Y.C.; Huang, X.W.; Jiang, H.F.; Li, B.Y. Study of high and low temperature property of 10 Ah Li-ion battery. Chin. Battery Ind. 2009, 14, 223–226. [Google Scholar]
- Liu, Z.W.; Liu, X.L.; Hao, H.; Zhao, F.Q.; Amer, A.A.; Babiker, H. Research on the critical issues for power battery reusing of new energy vehicles in China. Energies 2020, 13, 1932. [Google Scholar] [CrossRef] [Green Version]
- Gantenbein, S.; Schönleber, M.; Weiss, M.; Ivers-Tiffée, E. Capacity fade in lithium-ion batteries and cyclic aging over various state-of-charge ranges. Sustainability 2019, 11, 6697. [Google Scholar] [CrossRef] [Green Version]
- Situ, W.F.; Yang, X.Q.; Li, X.X.; Zhang, G.Q.; Rao, M.M.; Wei, C.; Huang, Z. Effect of high temperature environment on the performance of LiNi0.5Co0.2Mn0.3O2 battery. Int. J. Heat Mass Transf. 2017, 104, 743–748. [Google Scholar] [CrossRef]
- Bloom, I.; Walker, L.K.; Basco, J.K.; Abraham, D.P.; Christophersen, J.P.; Ho, C.D. Differential voltage analyses of high-power lithium-ion cells. 4. Cells containing NMC. J. Power Sources 2010, 195, 877–882. [Google Scholar] [CrossRef]
- Jia, X.L. The Study on Estimation Method about the Capacity of Power Lithium-Ion Battery. Master’s Thesis, Shenzhen Graduate School, Harbin Institute of Technology, Shenzhen, China, 2016. [Google Scholar]
- Zhang, Y.P.; Wu, L.L.; Zhao, J.B.; Yu, W.Y. A facile precursor-separated method to synthesize nano-crystalline LiFePO4/C cathode materials. J. Electroanal. Chem. 2014, 719, 1–6. [Google Scholar] [CrossRef]
- Erdinc, O.; Vural, B.; Uzunoglu, M. A dynamic lithium-ion battery model considering the effects of temperature and capacity fading. In Proceedings of the 2009 International Conference on Clean Electrical Power IEEE, Capri, Italy, 9–11 June 2009; pp. 383–386. [Google Scholar]
- Gholami, J.; Barzoki, M.F. Electrochemical modeling and parameter sensitivity of lithium-ion battery at low temperature. J. Energy Storage 2021, 43, 103189. [Google Scholar] [CrossRef]
- Li, C.L.; Cui, N.X.; Wang, C.Y.; Zhang, C.H. Simplified electrochemical lithium-ion battery model with variable solid-phase diffusion and parameter identification over wide temperature range. J. Power Sources 2021, 497, 229900. [Google Scholar] [CrossRef]
- Minato, T.; Abe, T. Surface and interface sciences of Li-ion batteries: Research progress in electrode electrolyte interface. Prog. Surf. Sci. 2017, 92, 240–280. [Google Scholar] [CrossRef] [Green Version]
- Ma, S.; Jiang, M.D.; Tao, P.; Song, C.Y.; Wu, J.B.; Wang, J.; Deng, T.; Shang, W. Temperature effect and thermal impact in lithium-ion batteries: A review. Prog. Nat. Sci. Mater. Int. 2018, 28, 653–666. [Google Scholar] [CrossRef]
- Jiang, C.; Wang, S.L.; Wu, B.; Fernandez, C.; Xiong, X.; Coffie-Ken, J. A state-of-charge estimation method of the power lithium-ion battery in complex conditions based on adaptive square root extended Kalman filter. Energy 2021, 219, 119603. [Google Scholar] [CrossRef]
- Wang, S.L.; Stroe, D.; Fernandez, C.; Yu, C.M.; Zou, C.Y.; Li, X.X. A novel energy management strategy for the ternary lithium batteries based on the dynamic equivalent circuit modeling and differential Kalman filtering under time-varying conditions. J. Power Sources 2020, 450, 227652. [Google Scholar] [CrossRef]
- Liu, X. Test Bench Establishing and Nonlinear Modeling of Lithium-Ion Battery and Supercapacitor. Master’s Thesis, Wuhan University of Technology, Wuhan, China, 2019. [Google Scholar]
- Li, B.; Xia, D.G. Anionic redox in rechargeable lithium batteries. Adv. Mater. 2017, 29, 1701054. [Google Scholar] [CrossRef] [PubMed]
- Lv, S.S.; Wang, X.X.; Lu, W.F.; Zhang, J.Q.; Ni, H.J. The influence of temperature on the capacity of lithium ion batteries with different anodes. Energies 2021, 15, 60. [Google Scholar] [CrossRef]
- Lux, S.F.; Schmuck, M.; Appetecchi, G.B.; Passerini, S.; Winter, M.; Balducci, A. Lithium insertion in graphite from ternary ionic liquid–lithium salt electrolytes: II. Evaluation of specific capacity and cycling efficiency and stability at room temperature. J. Power Sources 2009, 192, 606–611. [Google Scholar] [CrossRef]
- Wang, X.X.; Zhang, Y.J.; Zhu, Y.; Lv, S.S.; Ni, H.J.; Deng, Y.L.; Yuan, Y.N. Effect of different hot-pressing pressure and temperature on the performance of titanium mesh-based MEA for DMFC. Membranes 2022, 12, 431. [Google Scholar] [CrossRef]
- Lei, Z.G.; Zhang, Y.W.; Lei, X.G. Temperature uniformity of a heated lithium-ion battery cell in cold climate. Appl. Therm. Eng. 2018, 129, 148–154. [Google Scholar] [CrossRef]
- Wang, X.X.; Liu, S.R.; Zhang, Y.J.; Lv, S.S.; Ni, H.J.; Deng, Y.L.; Yuan, Y.N. A review of the power battery thermal management system with different cooling, heating and coupling system. Energies 2022, 15, 1963. [Google Scholar] [CrossRef]
- Lai, X.; Huang, Y.F.; Gu, H.H.; Han, X.B.; Feng, X.N.; Dai, H.F.; Zheng, Y.J.; Ouyang, M.G. Remaining discharge energy estimation for lithium-ion batteries based on future load prediction considering temperature and ageing effects. Energy 2022, 238, 121754. [Google Scholar] [CrossRef]


| Type | Specific Energy | Platform Voltage | Advantage | Shortcoming |
|---|---|---|---|---|
| Lithium iron phosphate battery | 140 Wh/kg | 3.2 V | High temperature resistance, low cost, impact resistance | Poor consistency, poor low temperature performance |
| Ternary lithium battery | 220 Wh/kg | 3.7 V | High specific energy, low temperature resistance, good discharge linearity | Poor thermal stability |
| Performance | Parameter |
|---|---|
| Rated voltage (V) | 3.65 |
| Operating voltage (V) | 2.75–4.2 |
| Rated capacity (Ah) | 40 |
| Standard internal resistance (mΩ) | 0.7 |
| Specific energy (Wh/kg) | 206 |
| Size (mm) | 148 × 91 × 27 |
| Weight (kg) | 0.7 |
| Discharge Rate | Ambient Temperature (°C) | ΔEt (Wh) | ΔEf (Wh) | σ (Wh) | Fitting Accuracy (%) |
|---|---|---|---|---|---|
| 0.1C | 40 | 73.89 | 73.87 | 0.0141 | 99.9729 |
| 25 | 73.02 | 72.96 | 0.0424 | 99.9178 | |
| 10 | 70.56 | 70.49 | 0.0495 | 99.9007 | |
| −5 | 64.88 | 64.95 | 0.0495 | 99.8922 | |
| −20 | 37.83 | 37.80 | 0.0212 | 99.9206 | |
| 0.25C | 40 | 70.53 | 70.44 | 0.0636 | 99.8722 |
| 25 | 69.75 | 69.82 | 0.0495 | 99.8997 | |
| 10 | 62.39 | 62.49 | 0.0707 | 99.8400 | |
| −5 | 53.66 | 53.62 | 0.0283 | 99.9254 | |
| −20 | 32.61 | 32.65 | 0.0283 | 99.8775 | |
| 0.5C | 40 | 65.38 | 65.31 | 0.0495 | 99.8928 |
| 25 | 67.94 | 68.03 | 0.0636 | 99.8677 | |
| 10 | 57.91 | 57.85 | 0.0424 | 99.8963 | |
| −5 | 50.72 | 50.65 | 0.0495 | 99.8618 | |
| −20 | 30.22 | 30.24 | 0.0141 | 99.9339 | |
| 0.75C | 40 | 63.40 | 63.45 | 0.0354 | 99.9212 |
| 25 | 63.48 | 63.50 | 0.0141 | 99.9685 | |
| 10 | 52.69 | 52.74 | 0.0354 | 99.9052 | |
| −5 | 44.37 | 44.39 | 0.0141 | 99.9549 | |
| −20 | 35.60 | 35.60 | 0.0000 | 100.0000 | |
| 1C | 40 | 53.22 | 53.12 | 0.0707 | 99.8117 |
| 25 | 53.14 | 53.15 | 0.0071 | 99.9812 | |
| 10 | 53.45 | 53.38 | 0.0495 | 99.8689 | |
| −5 | 48.99 | 49.10 | 0.0778 | 99.7760 | |
| −20 | 60.27 | 60.38 | 0.0778 | 99.8178 |
Publisher’s Note: MDPI stays neutral with regard to jurisdictional claims in published maps and institutional affiliations. |
© 2022 by the authors. Licensee MDPI, Basel, Switzerland. This article is an open access article distributed under the terms and conditions of the Creative Commons Attribution (CC BY) license (https://creativecommons.org/licenses/by/4.0/).
Share and Cite
Wang, X.; Zhang, Y.; Ni, H.; Lv, S.; Zhang, F.; Zhu, Y.; Yuan, Y.; Deng, Y. Influence of Different Ambient Temperatures on the Discharge Performance of Square Ternary Lithium-Ion Batteries. Energies 2022, 15, 5348. https://doi.org/10.3390/en15155348
Wang X, Zhang Y, Ni H, Lv S, Zhang F, Zhu Y, Yuan Y, Deng Y. Influence of Different Ambient Temperatures on the Discharge Performance of Square Ternary Lithium-Ion Batteries. Energies. 2022; 15(15):5348. https://doi.org/10.3390/en15155348
Chicago/Turabian StyleWang, Xingxing, Yujie Zhang, Hongjun Ni, Shuaishuai Lv, Fubao Zhang, Yu Zhu, Yinnan Yuan, and Yelin Deng. 2022. "Influence of Different Ambient Temperatures on the Discharge Performance of Square Ternary Lithium-Ion Batteries" Energies 15, no. 15: 5348. https://doi.org/10.3390/en15155348
APA StyleWang, X., Zhang, Y., Ni, H., Lv, S., Zhang, F., Zhu, Y., Yuan, Y., & Deng, Y. (2022). Influence of Different Ambient Temperatures on the Discharge Performance of Square Ternary Lithium-Ion Batteries. Energies, 15(15), 5348. https://doi.org/10.3390/en15155348