Article

Implementation of the Bio-Inspired Metaheuristic Firefly Algorithm (FA) Applied to Maximum Power Point Tracking of Photovoltaic Systems

by
Rodrigo Bairros Watanabe
1,
Oswaldo Hideo Ando Junior
2,3,
Paulo Gabriel Martins Leandro
2,
Fabiano Salvadori
2,
Marlon Felipe Beck
1,
Katiane Pereira
1,
Marcelo Henrique Manzque Brandt
1 and
Fernando Marcos de Oliveira
1,*
1
University Center Dynamics of the Cataratas (UDC), Foz do Iguaçu 85867-000, PR, Brazil
2
Smart Grid Laboratory (LREI), Center for Alternative and Renewable Research (CEAR), Federal University of Paraiba (UFPB), João Pessoa 58051-900, PB, Brazil
3
Academic Unit of Cabo de Santo Agostinho (UACSA), Federal Rural University of Pernambuco (UFRPE), Cabo de Santo Agostinho 54518-430, PE, Brazil
*
Author to whom correspondence should be addressed.
Energies 2022, 15(15), 5338; https://doi.org/10.3390/en15155338
Submission received: 16 May 2022 / Revised: 16 June 2022 / Accepted: 16 June 2022 / Published: 22 July 2022
(This article belongs to the Section A2: Solar Energy and Photovoltaic Systems)

Abstract

:
In this paper, an algorithm for the maximum extraction of energy generated by photovoltaic (PV) systems was presented. The tracking of the global maximum point of the system is complex due to the non-linearity of the current-voltage (I-V) characteristic curve of the photovoltaic modules, as they vary according to the temperature and solar irradiation in the module. To obtain the best energy efficiency in these systems, it is important that the generation is delivering the maximum power available through the arrangement. In order to solve such problems, in this work an efficient MPPT-FA method was proposed, which showed good traceability when compared to traditional methods. Most traditional MPPT techniques are not able to find the global maximum point to extract the maximum power provided by the PV system. Finally, the Firefly Metaheuristic MPPT method proved to be robust against several partial shading scenarios. Simulations were presented to demonstrate the effectiveness of the proposal when compared to the traditional MPPT-PO method.

1. Introduction

Photovoltaic (PV) Systems are a source of renewable and clean energy, free of pollutant gas emissions and easy to install in all parts of the world and with great potential for growth in the Brazilian energy matrix [1]. With the growth of PV’s participation, it is necessary to search for performance optimization and solve classic problems such as loss of efficiency by temperature and efficiency due to partial shading [2,3,4,5,6].
Therefore, in order to mitigate these anomalies, it is essential to use control methods that perform the tracking of the maximum power transfer point to find the Maximum Power Point Tracking (MPPT) [7]. The MPPT algorithms are widely used with the objective of maximizing the instantaneous power generated by the PV arrangement, and this point undergoes great variation according to the irradiation levels and temperature in each module [8]. Such variations are demonstrated and explained in the studies [9,10] where it is notable that both a change in temperature and in the irradiation of the modules have a great impact on the characteristic curves of the PV [11].
A very applied and widespread MPPT technique is Perturbation and Observation (P&O) which has the disadvantage of generating loss caused by variations around the maximum power point in the case of partial shading and variations in temperature in PV modules [1,12]. Several works present detailed information about the P&O algorithm, and the implementation principle aimed at tracking the Maximum Power Point (MPP) in PV systems [13,14,15,16].
Therefore, this research presents an alternative to the state of the art of traditional maximum power algorithms where an MPPT based on the Firefly bioinspired metaheuristic technique (FA—Firefly Algorithm) is proposed, aiming to reduce the steady-state error making the arrangement of the PV operate as close as possible to the global maximum power point [17].
This article presents the MPPT-PO and MPPT-FA methods applied to a SF consisting of three 215 W Soltech 1STH-215-P PV modules connected in series so that there is an adequate voltage level for the system. For validation purposes, the presence of partial shading will be emulated, making the methods perform the MPP search and demonstrate its effectiveness according to the attached shading problem. Finally, the two MPPT methods will be compared in different operating scenarios and analyzed in order to demonstrate the gains of the Firefly bioinspired metaheuristic technique in relation to the MPPT currently used.

2. Algorithm MPPT-P&O and MPPT-FA

In this section, the MPPT algorithms based on P&O technique and PSO method are discussed.

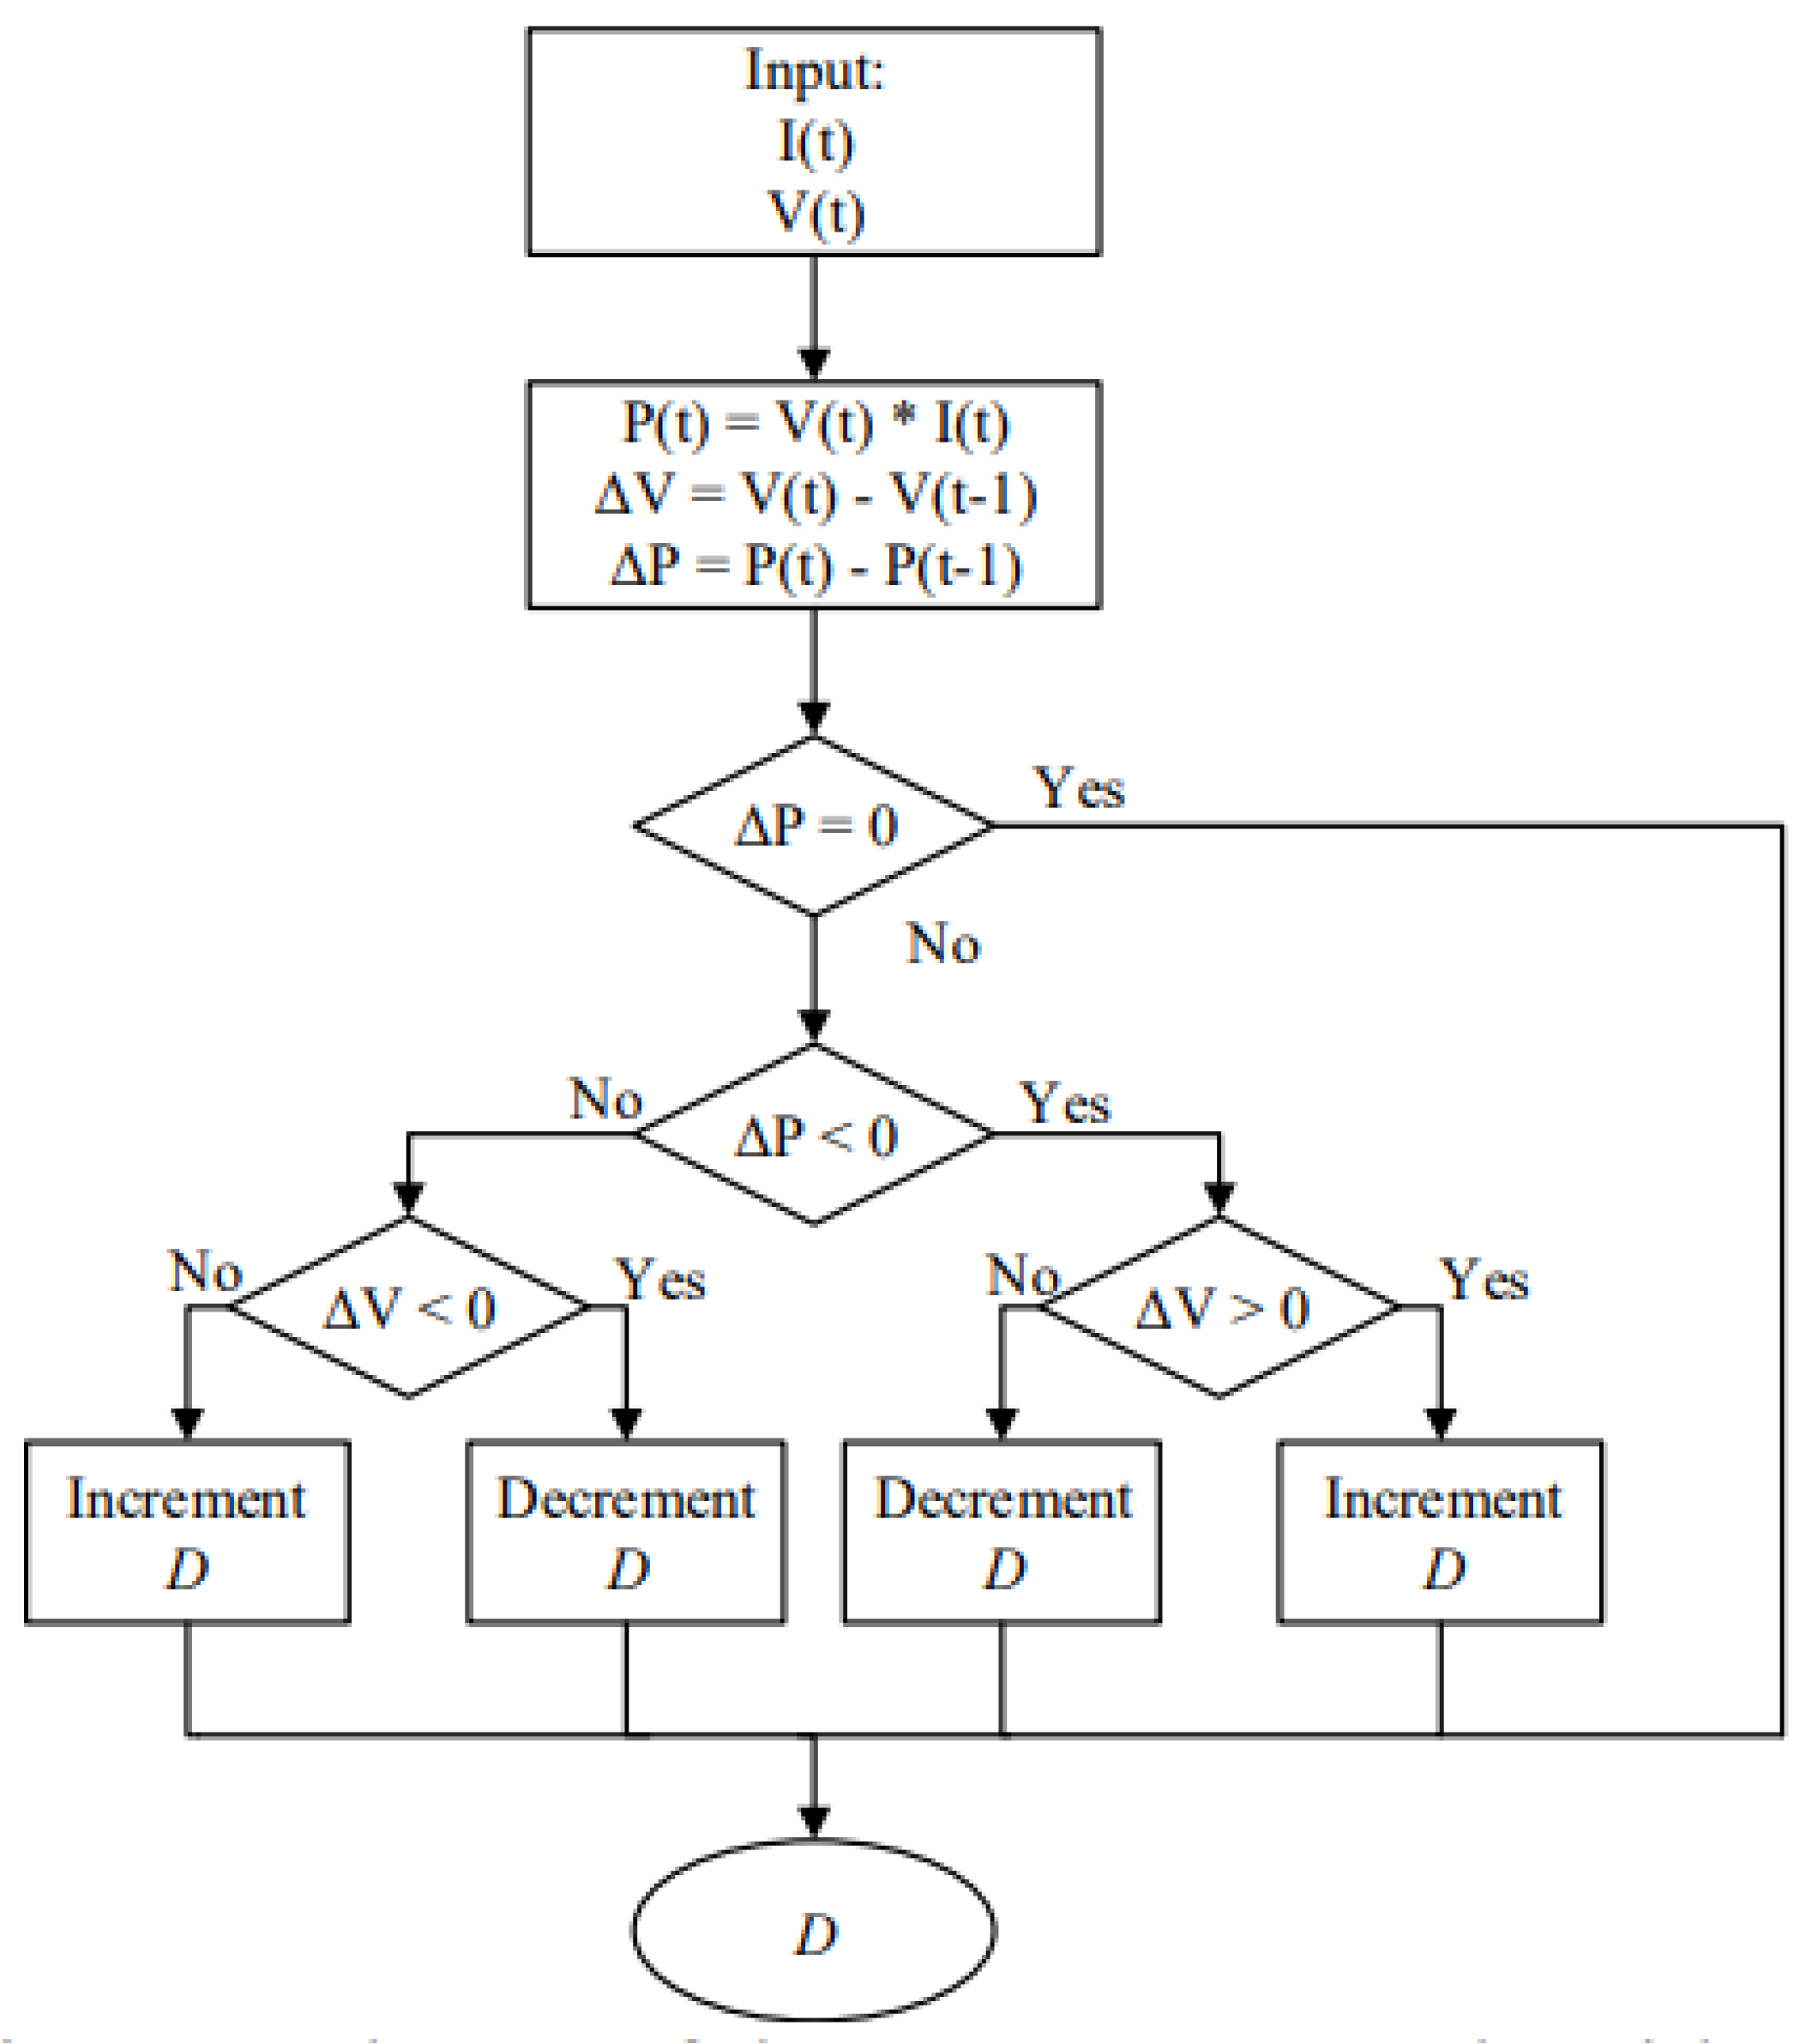
2.1. MPPT-P&O Optmization Method

P&O method is based on periodical increment or decrement of the output terminal voltage of the PV cell and comparing the power obtained in the present cycle with the power of the previous one. If the voltage varies and the power increases, the control system changes the operating point in that direction. Otherwise, it changes the operating point in the opposite direction. Since the direction of the voltage change is known, the voltage is varied at a constant rate. The constant rate parameter should be adjusted to ensure the balance between faster response and less fluctuation in steady state. A scheme of the MPPT-P&O algorithm is shown in Figure 1. It can be observed that the changing of power and voltage varies the duty cycle (D) of the Boost converter. The increment or decrement of D should be adjusted to reduce the oscillations of the system and optimize the MPPT operation.

2.2. MPPT-FA Optmization Method

This method developed by Xin-She Yang is especially used in the search for the MPP of PV systems and also to optimize the search for global minimums and maximums of the system [18].

2.2.1. Development of the Method

The FA was based on observing the light emitted by fireflies [17]. The light emitted by them occurs due to the presence of enzymes called luciferases, these enzymes produce bioluminescence through the catalysis of the oxidation reaction of the luciferin protein, which is a fluorescent molecule that, when oxidized, acts as a light emitter [19].
Fireflies use their bio-illumination to attract prey and other nearby fireflies, signaling danger and as a mating ritual, naturally the intensity of the glow of each firefly can vary according to its characteristics and the greater the intensity of the light emitted more advantages the firefly has [17].

2.2.2. Light Intensity and Attractiveness

According to [17], light intensity is inversely proportional to the square of the distance. Therefore, even if fireflies are attracted to the most intense light, if there is a relatively large distance between the firefly near the global maximum and other attractable fireflies, the detection of light from these more intense fireflies distant will be limited, causing them not to be attracted efficiently. The Equation (1) is about the intesity of the ligth L ( r ) , where r is the distance and L o is the luminous intensity of the reference.
L ( r ) = L o r 2
When considering an absorption coefficient by the medium where the light source is and a fixed distance from it, the equation can be written according to the Equation (2)
L = L o e γ r
where γ represents the absorption coefficient by the medium and L the light intensity. The Equation (1), presents a singularity when the value of r is equal to zero, when we combine the Equations (1) and (2), we can approximate them by a Gaussian form according to the Equation (3).
L = L o e γ r 2
It is known that the attractiveness of one firefly to another is proportional to the intensity of light seen by the firefly that will be attracted, thus, the equation of attractiveness β , can be described according to the Equation (4).
β = β o e γ r 2
where we have β o being the attractiveness when r = 0 . The calculation of the distance between two random fireflies, i and j, can be expressed using the Euclidean distance in a three-dimensional space according to the Equation (5).
S i = S i + β o e γ r i j 2 ( S i S j ) + α
In the first term of this equation we have S i , which is the rectangular coordinate of the firefly to be attracted by j, in other words, its the position on the axes x, y, z and, being added to the second term that corresponds to the attractiveness between fireflies i and j the third term of the equation, on the other hand, refers to a randomness added to the movement of fireflies, being α the randomness parameter referring to the weight, and ∈ a random number taken from the Gaussian distribution. In this equation, when the parametere α is equal to zero, we have that the movement has no randomness, since β o result in zero, each and every move will present a random factor [20].

2.2.3. Parameters

The literature presents some suggestions of parameters that can be applied to most problems [13]. β   =   1 , α     [ 0 , 1 ] , γ [ 0 , 1 ; 10 ] , the parameter γ is important in determining the speed of convergence and the behavior of the FA, in theory its value can vary from 0 to ∞, however, in most applications, its value normally varies from 0.1 to 10. It is important to note that when γ 0 attractiveness becomes constant β   =   β o , that is, the light emitted by the firefly is not absorbed by the medium, and can be seen from anywhere in the domain, making it easier to see the best point for generation [17].
When we have γ , attractiveness becomes almost zero β 0 , in other words, fireflies are wandering randomly in a region with poor visibility, making them unattractive to each other. Therefore, in the case where we have this peculiarity, the search method becomes completely random [17].
The FA can find the global maximums and the local maximums simultaneously, having a great efficiency during the search, as it is normally used when, γ 0 and γ , it’s possible to simplify the algorithm by adopting three precepts:
  • Fireflies will be attracted to each other no matter their sexuality, making attractiveness wider and more effective.
  • Firefly that has a light with intense brightness, will have a greater attractiveness, however, the emitted brightness will decrease according to the increase of the distance between the fireflies, due to the absorption factor by the medium.
  • The intensity of a firefly’s glow varies according to its objective function, with a brighter glow the better the function value.

2.2.4. Application of the Algorithm in Tracking the Maximum Power Point

Fireflies that have a lower brightness are attracted to others with a more intense brightness, being the objective function, the benchmark to determine which firefly is closer to the maximum [17,18]. In short, the FA algorithm will search for the maximum global power point, causing the local maximums to be taken out of focus, since the global maximum will be the point where the brighter fireflies will be present [17,18]. The FA flowchart described is shown in Figure 2.
The fireflies and their positions will be linked to a work cycle, making a cycle change with each movement and consequently changing the value of current and voltage in the circuit. Three fireflies will be used for the composition of the algorithm, with their initial positions being set at 0.3 for the fist firefly, 0.5 to the second firefly and 0.7 for the third firefly.
After indicating the initial position of the fireflies, the algorithm will calculate the luminosity and attractiveness using the equations presented above for each of the fireflies, according to the power level that the firefly position presents. Then, the random movement of the three fireflies is started, having the reference of the α randomness parameter to change their position.
The algorithm increases the luminosity of the fireflies closest to the MPP and decreases those that are further away, which are attracted by the most brighter, causing all the fireflies and the system to focus on the point where the luminosity is more intense, in this case, MPP, optimizing the area where the maximum point is located quickly and efficiently.
As the α randomness parameter of motion must be initially high for fast tracking, it needs to be reduced over the iterations so that upon arrival at the maximum point, the fireflies do not move to another distant point, because this displacement generates large power fluctuations, which impairs the efficiency of generation.
According to [17], the parameter α can have its value varying between 0 and 1, so, for α that the search rate is high at the beginning, a value of 0 was chosen, 7 to, which will be reduced by 30% at each iteration by a delta variable, where this variable can be changed to the optimal range of stabilization. Figure 3 demonstrates the representation of the convergence of fireflies to the point of maximum power of the photovoltaic system and Figure 4 the effect of the attraction of luminosity according to its intensity.
In Figure 4 its possible observe the illustrated operation of FA tracking. After the algorithm calculate the luminous intensity of fireflies, they will be attracted to each other’s, being that, due to absorption of light by the medium and the attractiveness function, the firefly that has the highest luminous intensity will be the most attractive. Consequently, this Firefly will be closer to the GMPP, doing the other fireflies to be attracted to it and gradually increase their brightness during the convergence process, triggering a sequence of attractiveness between the more distant fireflies for the fireflies closer to the GMPP.
The work that will be presented will compare the MPPT-P&O and the MPPT-FA in order to observe the best efficiency when applied to an arrangement affected by partial shading. The results, analyzes and comparison between the methods will be presented in the next section through a simulation environment, where the two methods will be implemented in a photovoltaic array having its generation in normal state in the first phase of simulations and later being applied different levels of partial shading.

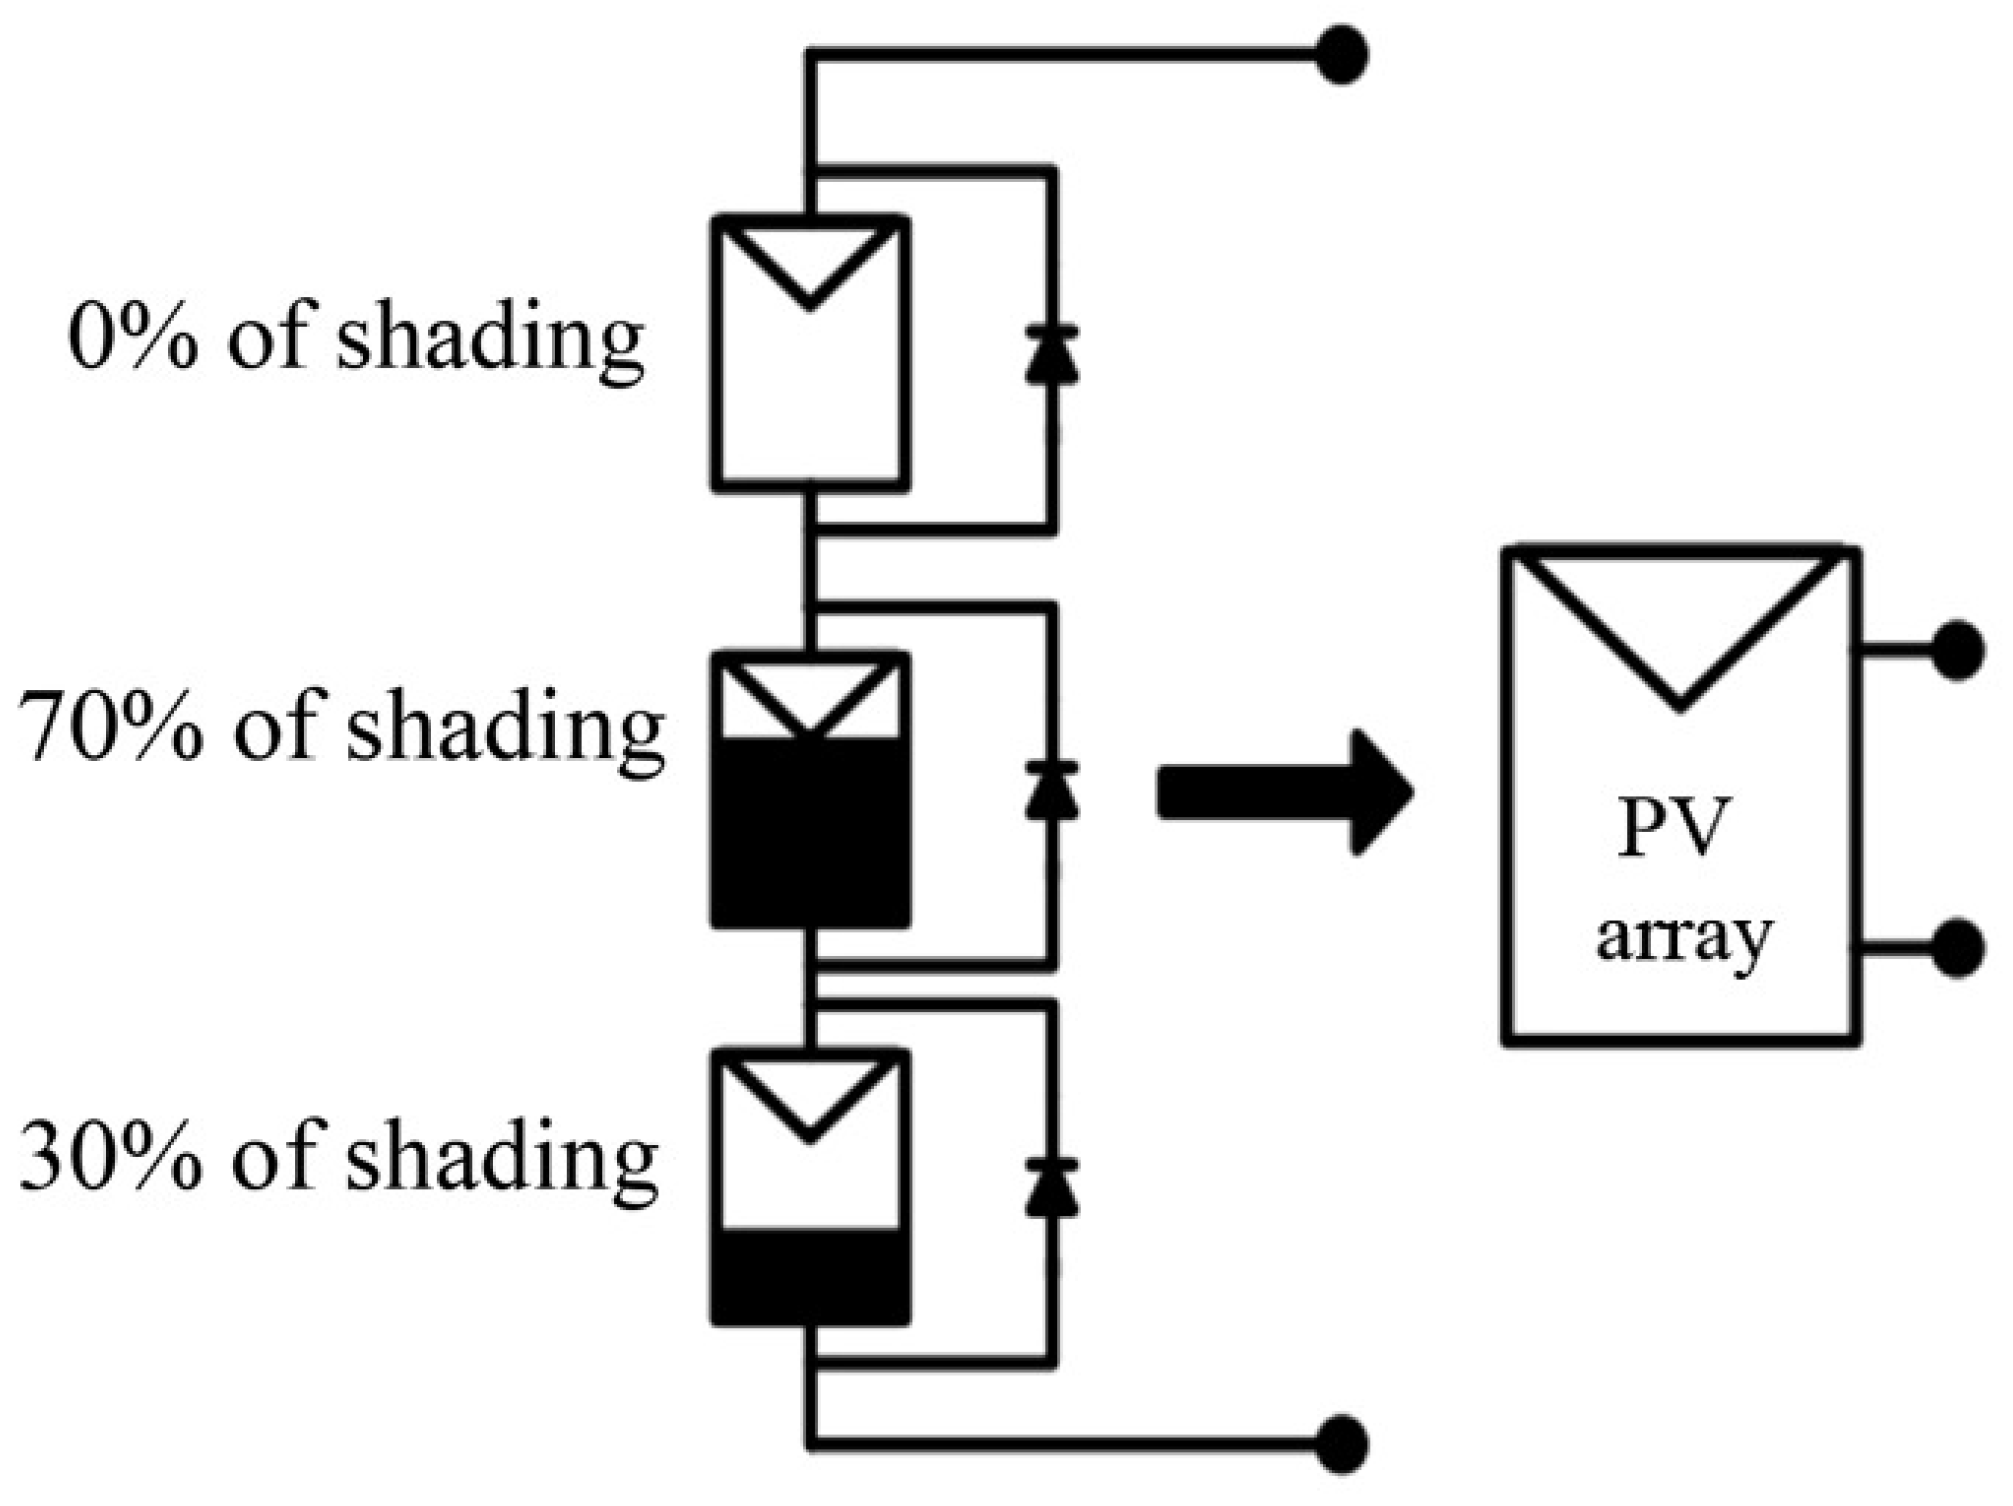
2.3. PV System Model

In Figure 5, the circuit model used for the implementation of the MPPT-P&O and MPTT-FA algorithms is presented.
For the sizing of the boost voltage boost converter, the equations provided in the works were used [1,12]. The main relationship between the converter and the tracking algorithm is given by the duty cycle (D), the algorithm performs the analysis of the voltage and current values provided by the array and adapts the duty cycle in order to maximize the extracted power [1]. The Table 1 presents the parameters of the PV model used.
The simulations will be carried out from a photovoltaic array with 3 connected modules, where in Stage 1 the array will be free of partial shading, in Stage 2 only 1 module will be shaded at 20% and in Stage 3 it will have 1 module shaded at 30% and another module with 70% shading, aiming to analyze the performance of each algorithm according to the shading level. The Figure 6 indicates array shading in Step 3.
First, the traditional P&O algorithm will be used. The simulations will be divided according to the flowchart in Figure 7.
Each simulation step will be carried out equally for the P&O method and the Firefly method, where the results and differences between the two techniques will be presented at the end. The data that will be analyzed are the voltage, current and output power of the array. All simulations, for both algorithms, will be performed using the Matlab/Simulink computational environment.

3. Results and Discussion

In this section will be presented the results of computer simulation. The Figure 8 shows the model implemented in Matlab/Simulink.
  • A. Step 1—Even distribution of solar radiation
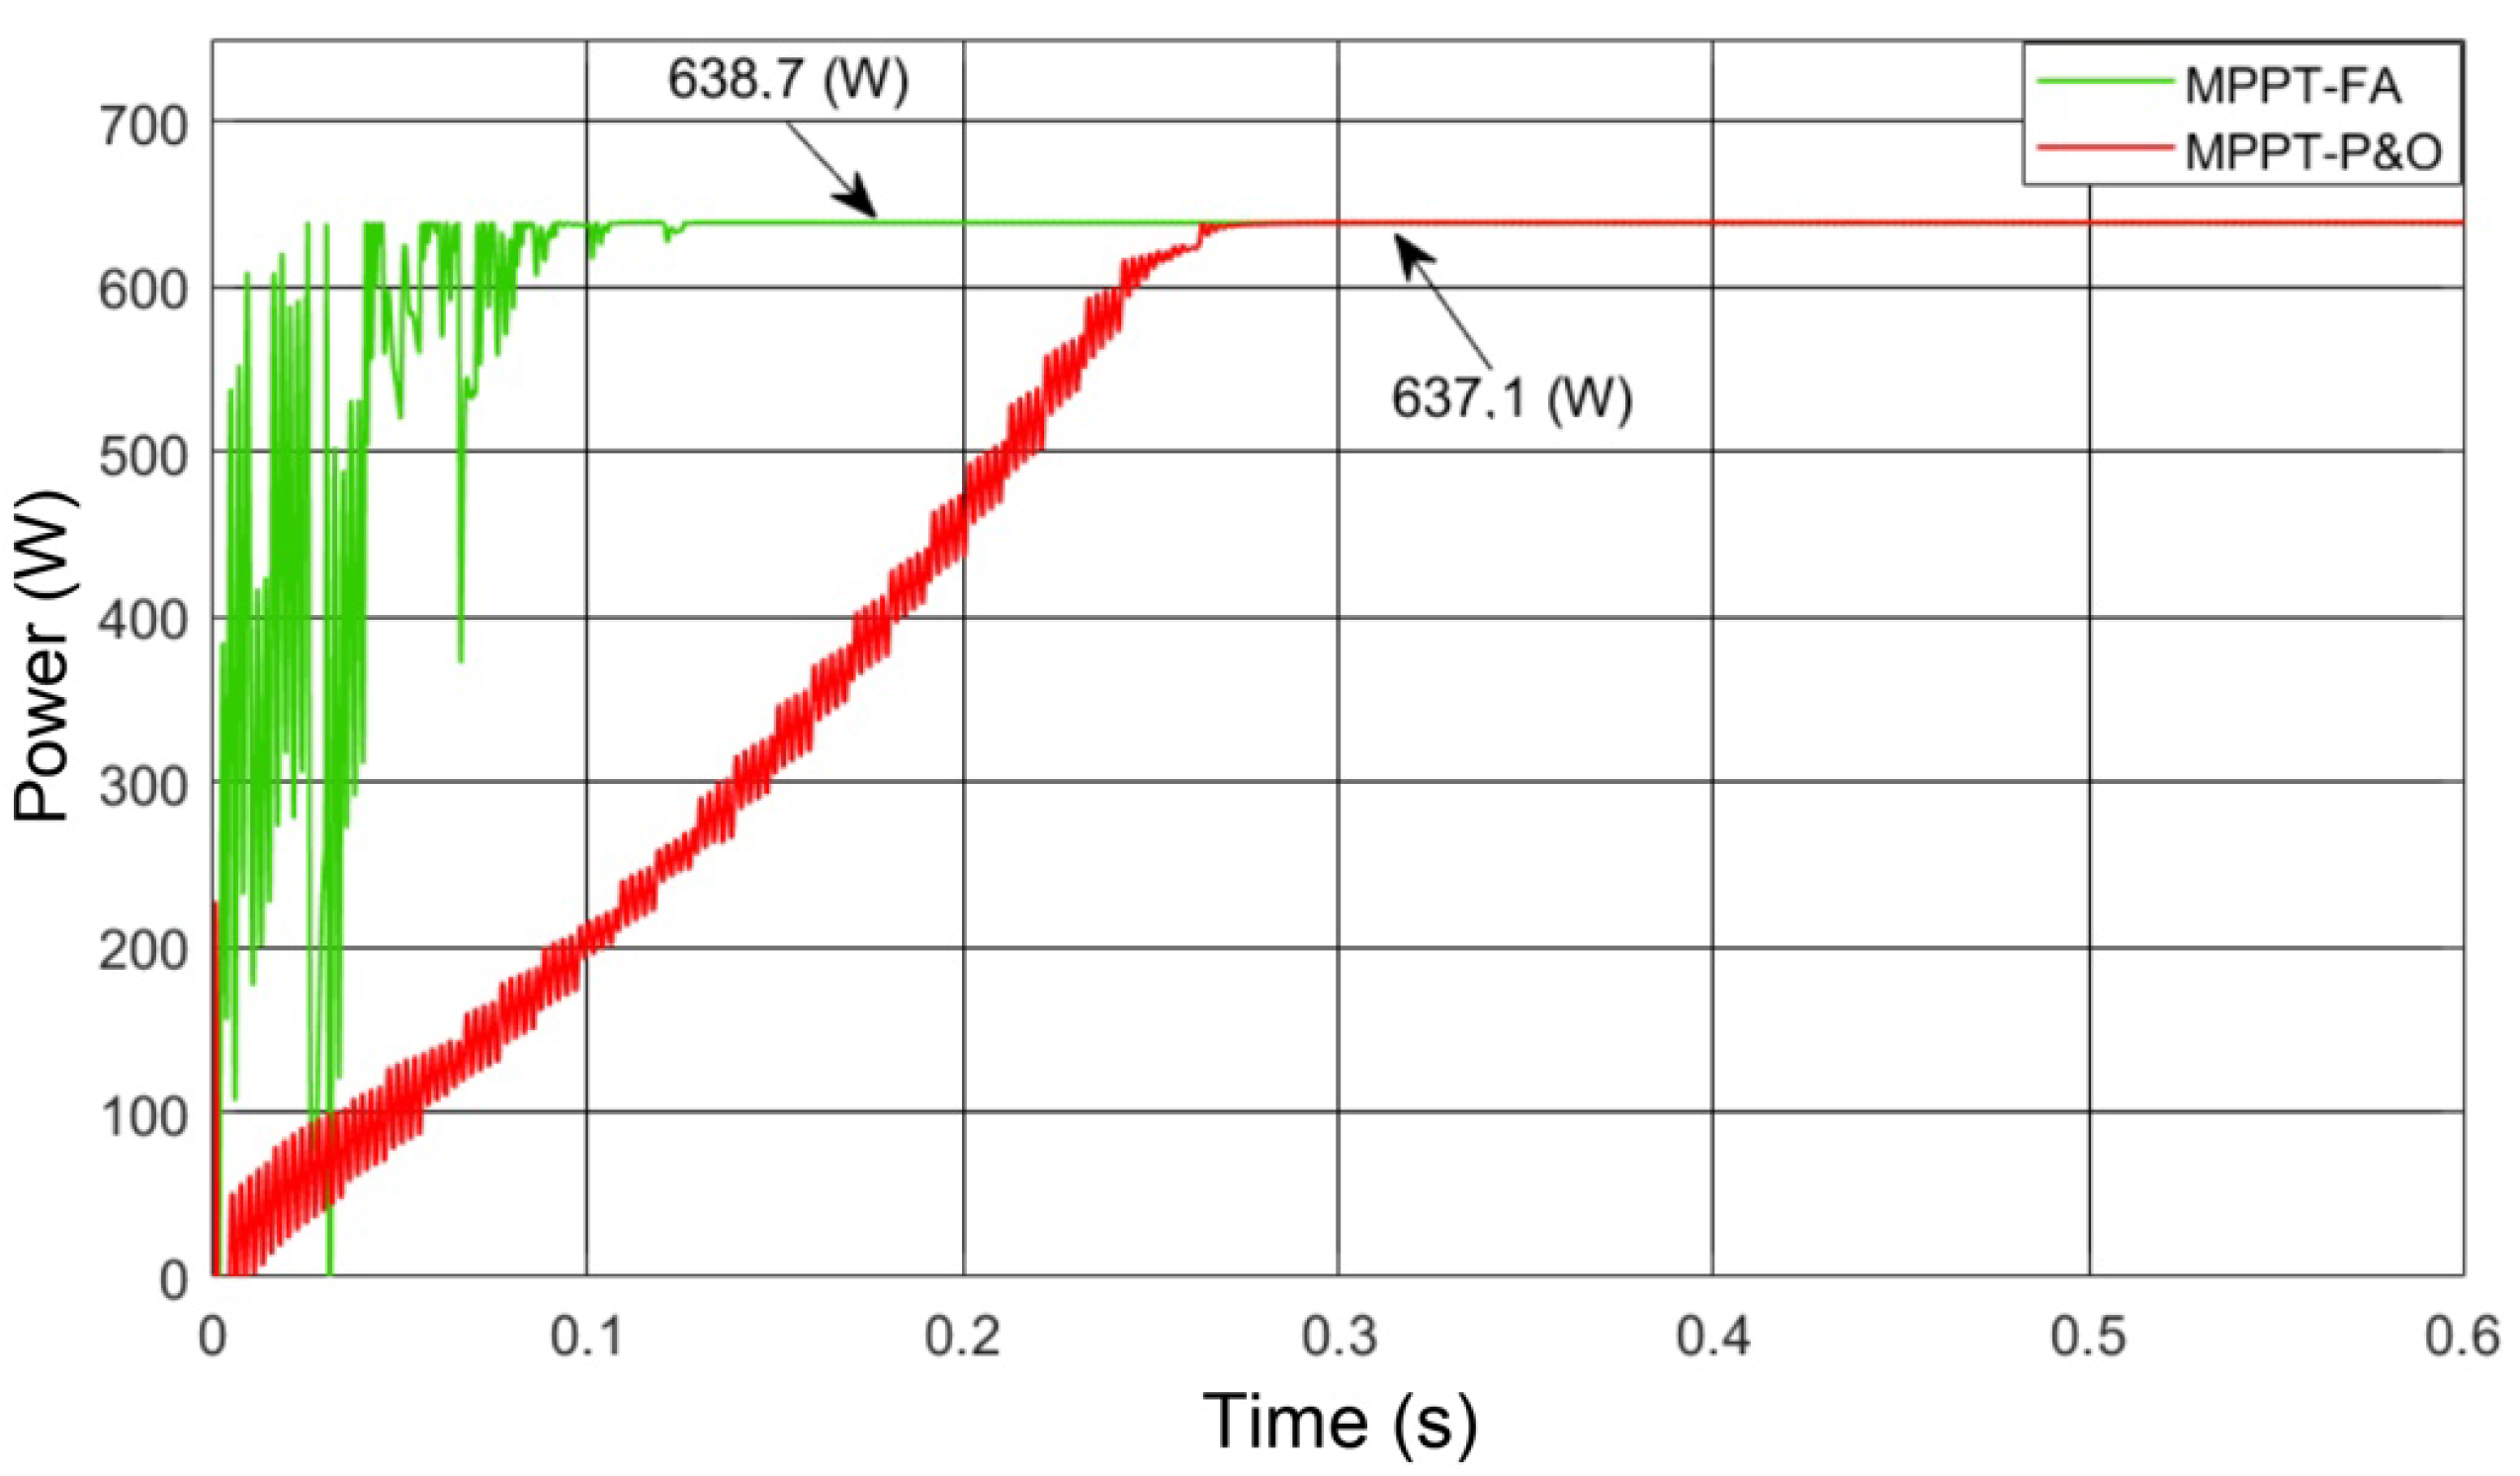
In this step, the arrangement is free of partial shading interference. The power supply data of the array will be constant having the solar irradiation with a value of 1000 W/m2 with a temperature of 25 °C for the 3 modules. As a reference, a P-V characteristic curve is shown Figure 9, shaped using data from the modules in Table 1 where the maximum power point produced by the array can be observed.
  • Simulation—Step 1
After the simulation using the P&O method and the FA method, it can be seen in Figure 10 the power extracted from the PV array in each of the implementations, as well as the peculiarity of the tracking performed by the methods.
The results demonstrate that the P&O algorithm tracked the maximum power point, reaching the peak of power generation 0.3 s, proving that the algorithm is able to efficiently track the maximum power point when the array is free of partial shading. The Firefly Algorithm tracked the maximum power point in a time lower than the P&O method, in approximately 0.18 s. Even with small steady-state power fluctuations and a wide search area for the maximum power point, due to the range provided by the value of α at the beginning of the tracking, the FA algorithm had a higher efficiency in the first step of simulation.
It is possible to observe that the search area has a high oscillation in the initial search stage, and that with the tracking being effective, bringing the fireflies closer to the maximum power point, the delta variable begins to reduce the randomness parameter α which consequently reduces the search area, stabilizing the generation in a short period of time, demonstrating the accuracy and effectiveness of the algorithm.
Another important detail to be observed is the magnitude of power reached by each of the algorithms. While the P&O algorithm found a value 99.63% of the global maximum value, the FA algorithm managed to raise this magnitude to 99.89%. Thus achieving results closer to the global maximum.
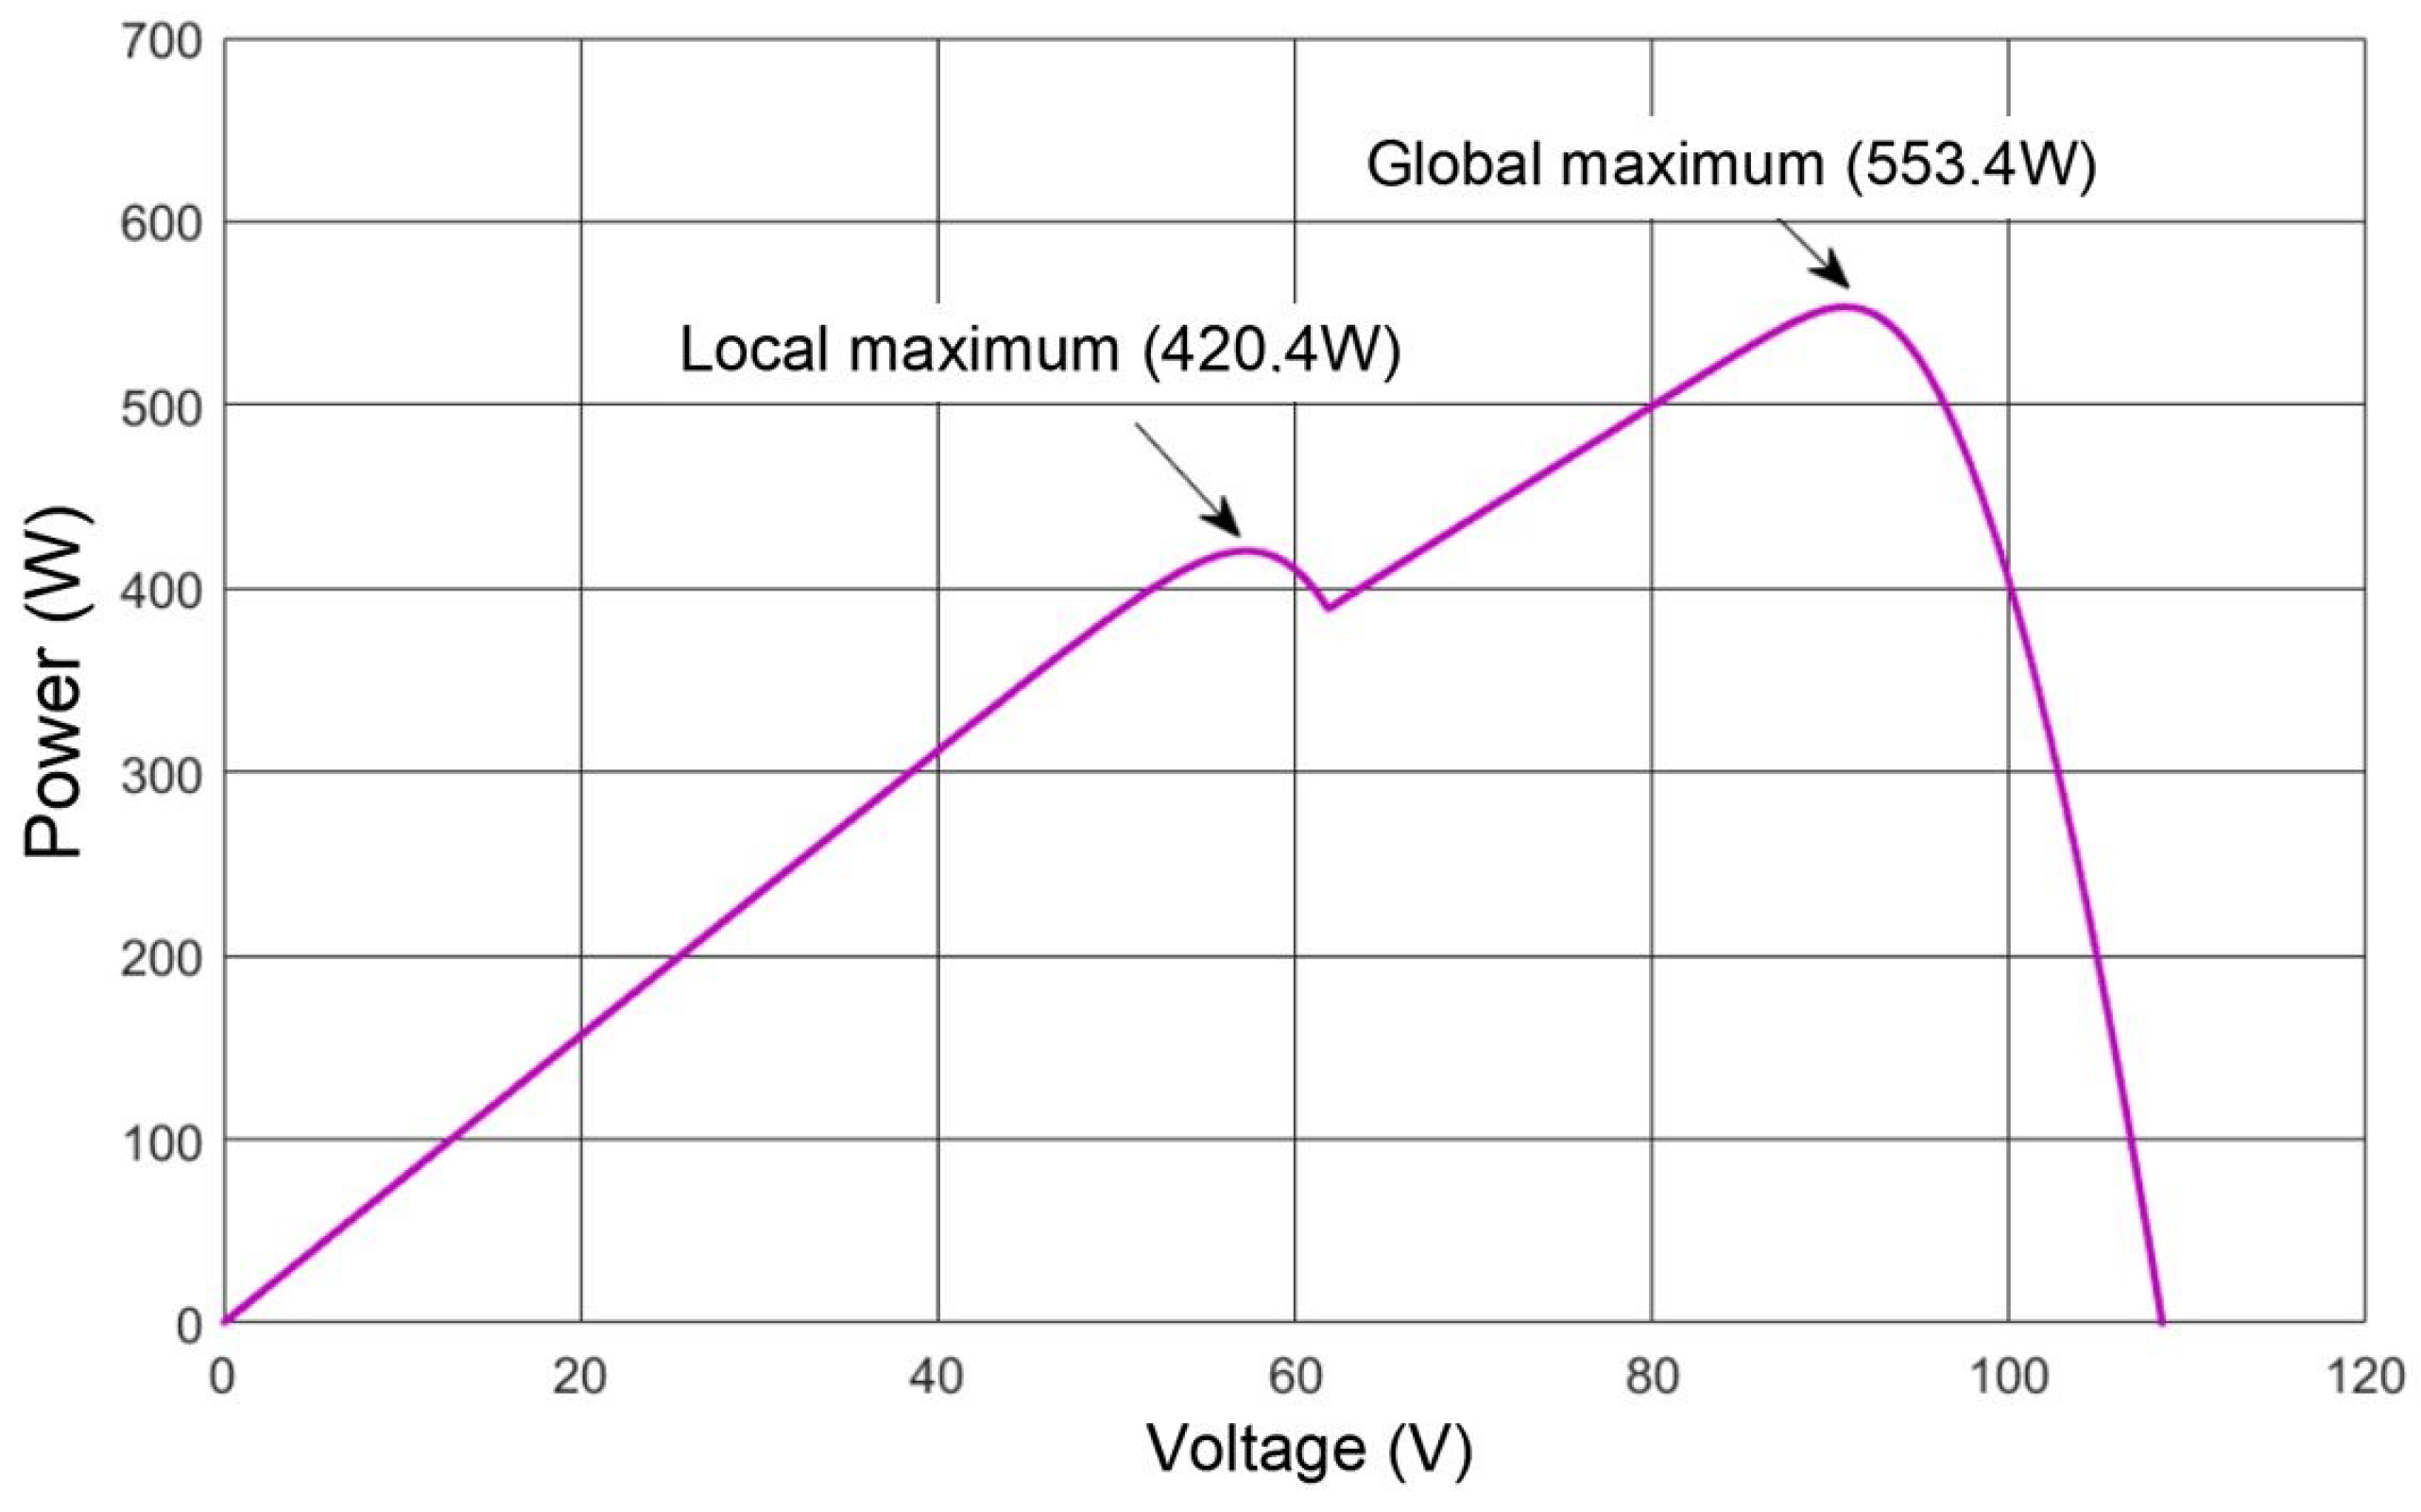
  • B. Step 2—Partial shading (two power peaks)
Figure 11 shows the P-V characteristic curve when the array is under the effect of the shading of Step 2.
In this step, a partial shading will be adopted in one of the PV modules, represented by the decrease in irradiation applied to the module, the arrangement will have two modules with an applied irradiation of 1000 W/m2 and a module with 800 W/m2, symbolizing a shading of 20% of the panel. In this configuration, the array will present two points of maximum power, a local one with a value of 420.4 W, and a global one with a value of 553.4 W.
  • Simulation—Step 2
The results of the implementation of the P&O algorithm for Step 2 are presented in Figure 12, where the convergence process of P&O and FA techniques is observed.
The simulation results of Step 2 for the P&O algorithm are not satisfactory since it reached the local maximum, so it is visible that the generation efficiency suffers a great loss being focused on the local maximum.
Observing the power extraction, it is notable that the Firefly algorithm does not have the problem of traditional stabilization algorithms at a local maximum point, performing the tracking of the global maximum point in a satisfactory time of 0.22 s.
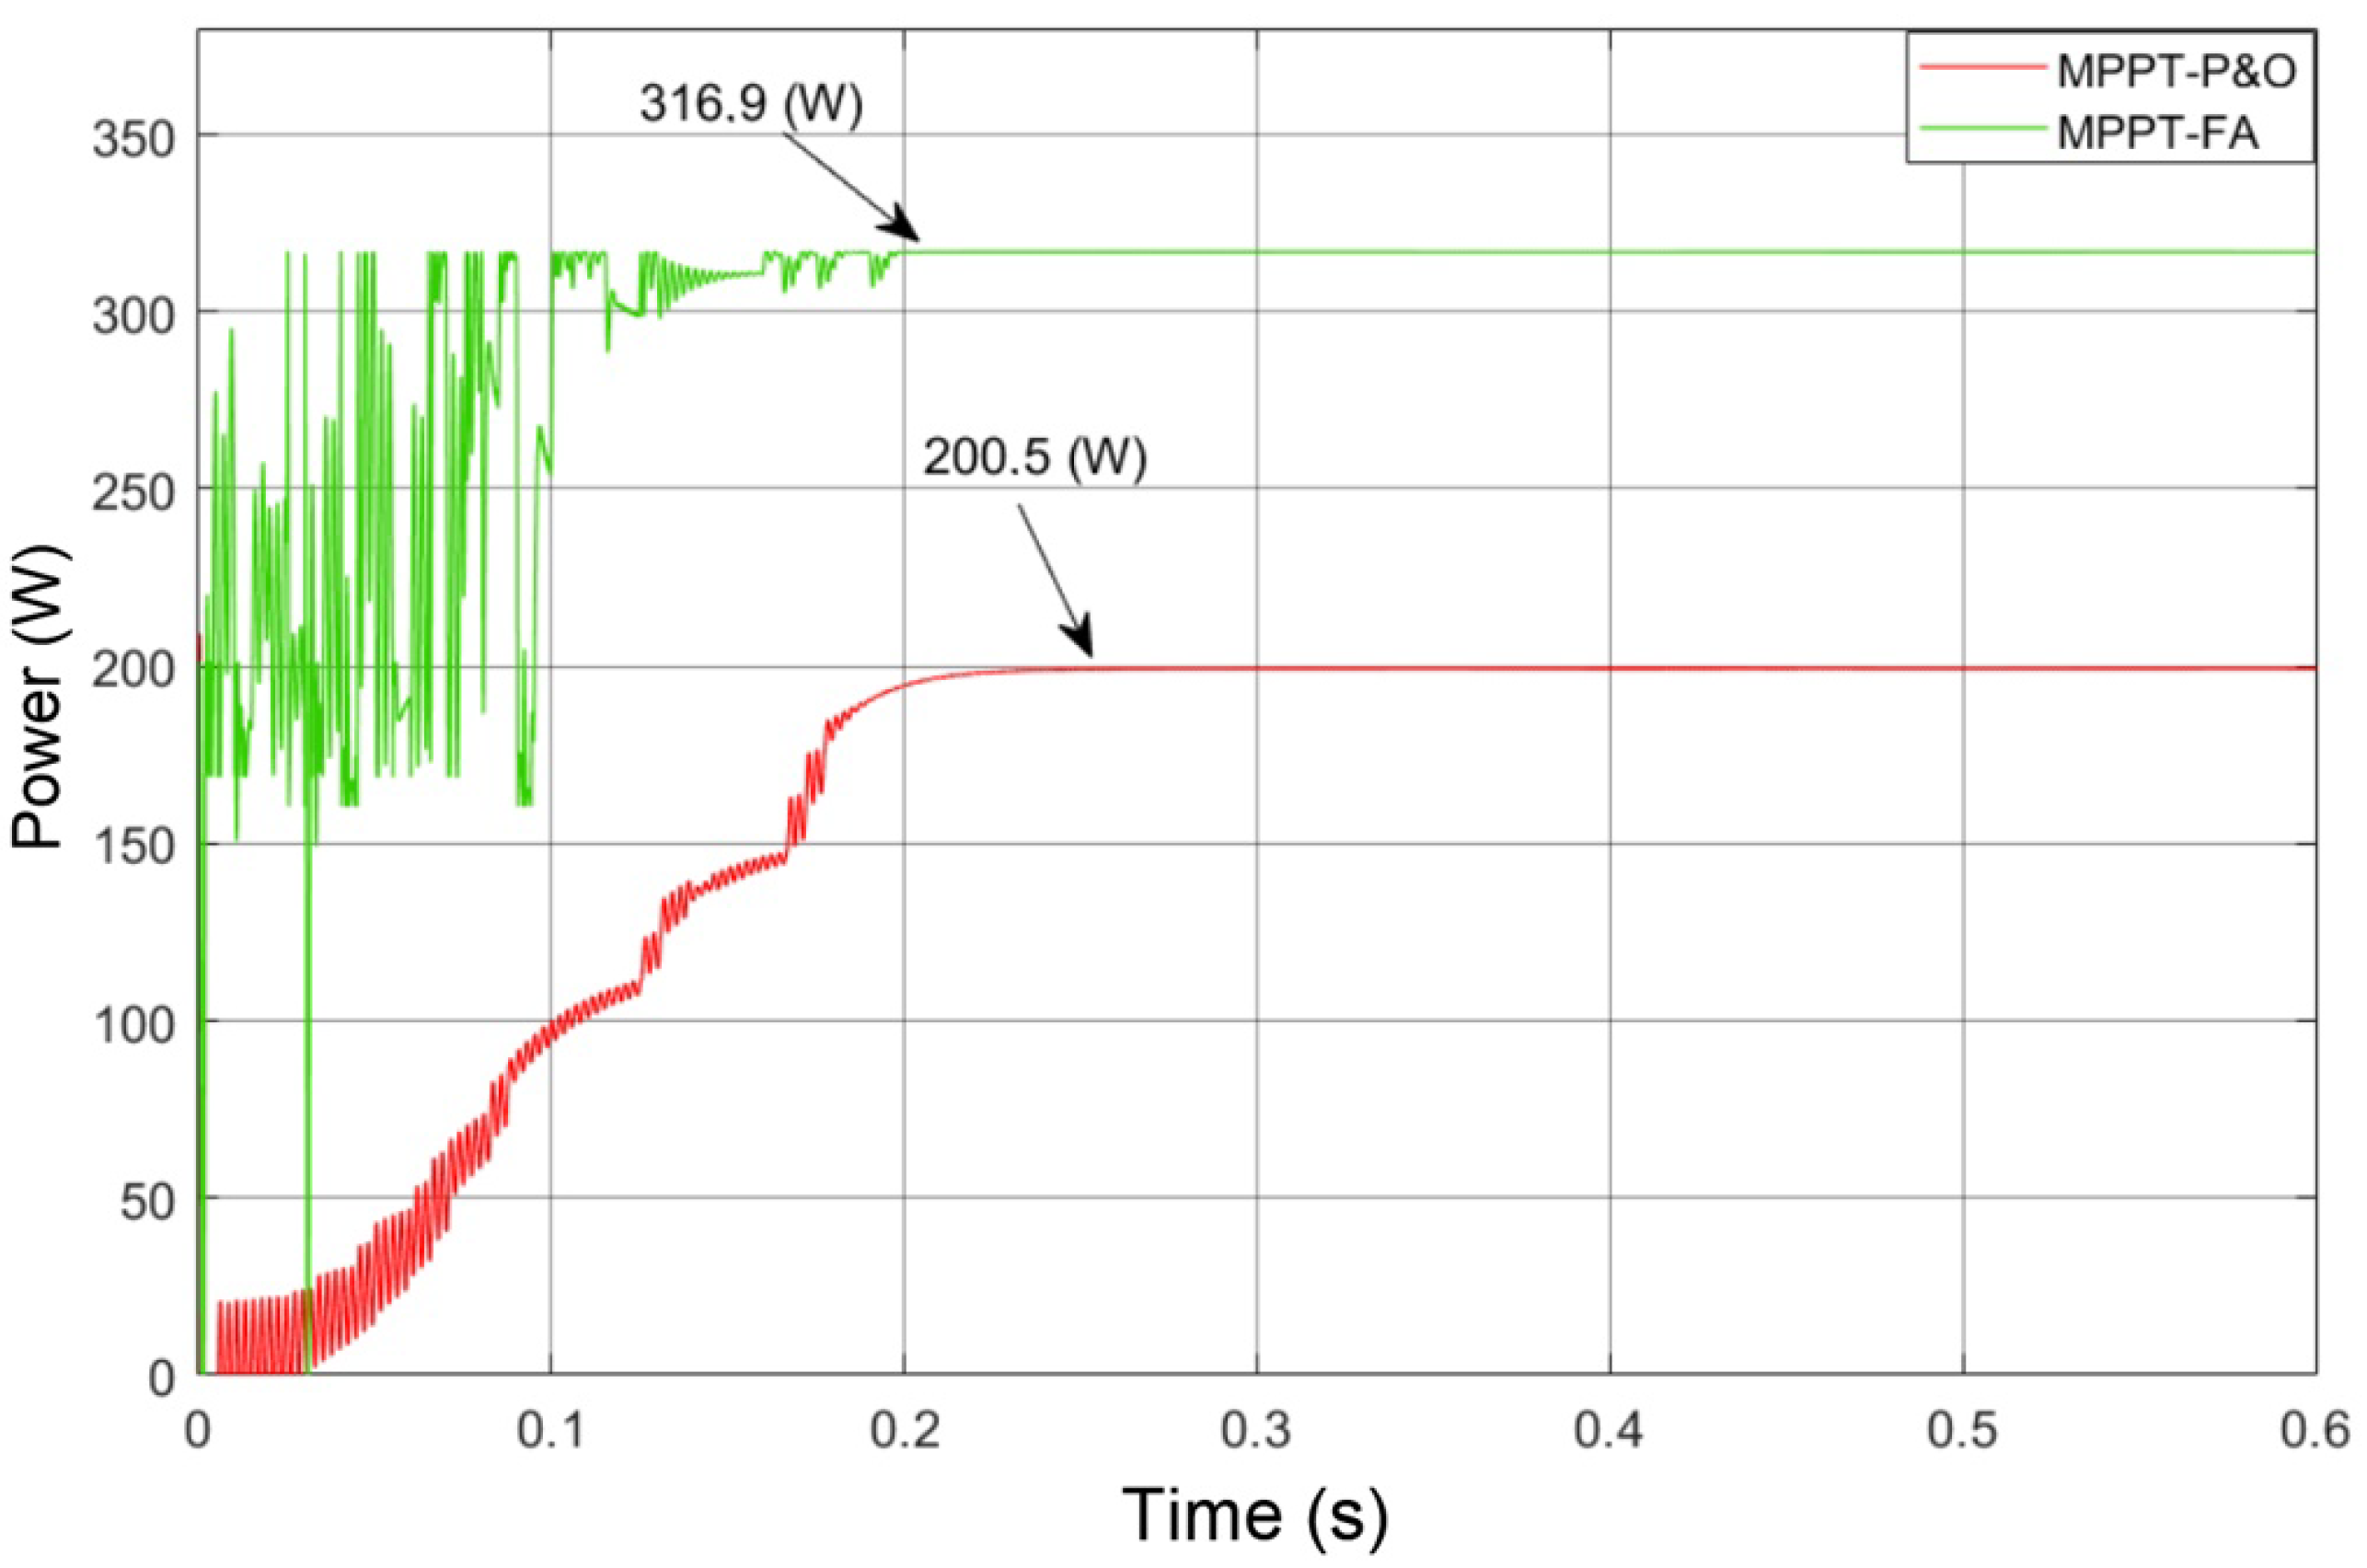
  • C. Step 3—Partial shading (three power peaks)
Figure 13 shows the P-V curve of the array with the multiple shading in the modules.
In this step, the array will have a module with an applied irradiation of 1000 W/m2, one with 700 W/m2, symbolizing a shading of 30% of the panel and the last with 300 W/m2, which represents a shading of 70% of the panel.
  • Simulation—Step 3
In this last step, the P&O algorithm obtained the same peculiarity in obtaining the power during the tracking process of Step 2, whereas the FA proved to be effective and accurate in tracking the global maximum. The results of implementing the P&O and FA algorithm for Step 3 are shown in Figure 14.
Observing the simulation results of Step 3 for the P&O algorithm, it is seen that the local maximum point with the lowest value was reached, this is due to the stagnation of the algorithm at the first maximum point found, which in this case was the one of lower value.
As the P&O works by adding or subtracting the duty cycle according to the voltage and power measured, when a maximum peak is tracked by it, it understands that it must operate using the duty cycle that provided this maximum point, since in the next iterations, the power level will suffer a reduction both to the left of the curve and to the right before reaching another peak that is close, which can be either global or local.
With this, it is shown that the P&O algorithm loses a large part of its efficiency in the configuration of Step 3 of the simulation, consequently causing the PV generation to be greatly impaired when the array is under the effect of partial shading with the characteristics presented.
Unlike P&O, the Firefly algorithm has reached the global maximum point. It is possible to observe that the curves, before the stability point, have more distinct variation characteristics compared to the other two stages, because in Step 3 there is a second local point and the maximum global power has a distant value in relation to the point of maximum with the free shading arrangement.
The Table 2 summarizes the results obtained in the three simulation stages using MPPT-P&O and MPPT-FA.
It can be noted in Step 1 that the Firefly method presented better results in all the main comparison parameters, having a time to reach the maximum point 41% smaller than the P&O method and a power variation in the steady state 89% smaller, proving superior even with the arrangement free of partial shading.
The results of the simulations of Step 2 show the great difference that the Firefly algorithm has in relation to the traditional P&O algorithm, where its efficiency reached a value of 99.94% while the P&O method, for being stagnant at most local, showed an efficiency of 75.78%, with a difference in power generated between the methods being 133.7 W. Finally, in Step 3 the results show a great difference in efficiency between the algorithms, with Firefly reaching 99.93% and the P&O obtaining 63.12% efficiency. Finally, a Table 3 shows a comparative summary between the bioinspired methods other authors related to the purpose of this paper.

4. Conclusions

This work presented an analysis relating two MPPT methods, P&O and FA, where they were applied in a PV system with different configurations. In order to compare the two techniques, 3 different stages of simulations were assigned in a PV system composed of 3 modules connected in series.
For Step 1, the 3 modules received the same solar irradiation, with a value of 1000 W/m2, without shading in this system. In the second step, 2 modules continued to receive solar irradiation of 1000 W/m2 and only one received an irradiation of 800 W/m2, indicating partial shading in the system. As for the last simulation stage, the 1st module received a solar irradiation of 1000 W/m2, the 2nd module received a solar irradiation of 700 W/m2 and the 3rd module received a solar irradiation of 300 W/m2, having always at constant temperature with a value of 25 °C in all phases of the simulation.
In the 3 steps, simulations of the two proposed techniques were performed simulating the traceability of the highest power point through MPPT-P&O and MPPT-FA. The MPPT-P&O technique presented an excellent result in Step 1, where there was no shading in the modules, however in the second and third steps, with the application of partial shading, the technique presented great difficulties, as it stagnated at the local maximum points, harming the generation of the system.
The tracking of the global maximum point, reached through the MPPT-FA technique, presented an effective result in the 3 steps of the simulation, being demonstrated that both for systems free of shading, as for systems partially shaded, Firefly performs the tracking efficiently and need.
It can be concluded that, through the results presented by the simulations, the MPPT-FA technique is clearly superior to the MPPT-P&O technique, being the best solution as MPPT in systems with or without partial shading.

5. Discussion

The proposed MPPT-FA technique achieved better use of the available energy provided by the presented PV system. It was possible the extracting of the global maximum power from the PV array considering partial shading conditions. In addition, it was observed a smaller power oscillation around the power drained from the PV array at the MPP in steady state. In real conditions, it is not feasible to disregard the effect of partial shading in PV arrangements, which can cause significant impacts on the PV array power extraction. Thus, the MPPT-FA technique proposed in this work proved to be robust and efficient in relation to the extracting of the maximum power in PV arrays submitted to partial shading conditions.
The following are proposals for the continuation of this work:
  • Use other high-gain DC-DC converter topologies to to evaluate the proposed MPPT-FA method;
  • Carry out a comparison with other bioinspired MPPT methods;
  • Test other parameters of the PSO algorithm in order to improve the dynamic performance of the proposed method.

Author Contributions

Conceptualization: R.B.W. and F.M.d.O. investigation and simulation: R.B.W. and F.M.d.O. wrote and final editing: R.B.W., O.H.A.J., P.G.M.L., F.S., M.F.B., K.P., M.H.M.B. and F.M.d.O. All authors have read and agreed to the published version of the manuscript.

Funding

This research was funded by PROPESQ/UFPB research edit N°001/2022 of the Federal University of Paraiba (UFPB). The O.H.A.J. was funded by the Brazilian National Council for Scientific and Technological Development (CNPq), grant number 407531/2018-1 and 303293/2020-9. The F.S. was funded by the Brazilian National Council for Scientific and Technological Development (CNPq), grant number 307588/2020-3. This research was funded by University Center Dynamics of the Cataratas (UDC).

Institutional Review Board Statement

Not applicable.

Informed Consent Statement

Not applicable.

Data Availability Statement

Not applicable.

Acknowledgments

The authors would like to thank to the University Center Dynamics of the cataratas (UDC) Federal University of Latin American Integration (UNILA), Federal Rural University of Pernambuco (UFRPE) and Federal University of Paraiba (UFPB) for financial supporting and facilities, Coordination for the Improvement of Higher Education Personnel (CAPES) and the Brazilian Council for Scientific and Technological Development (CNPq) for financial support.

Conflicts of Interest

The authors declare no conflict of interest.

References

  1. Oliveira, F. Rastreamento da Máxima Potência em Arranjos Fotovoltaicos sob Efeito de Sombreamento Parcial Baseado no Método de Otimização por Enxame de Partículas. Master’s Thesis, Universidade Tecnológica Federal do Paraná, Curitiba, Brazil, 2015. [Google Scholar]
  2. Crepaldi, J.; Amoroso, M.; Ando, O. Analysis of the topologies of power filters applied in distributed generation units-Review. IEEE Lat. Am. Trans. 2018, 16, 1892–1897. [Google Scholar] [CrossRef]
  3. Maciel, J.; Ledesma, J.; Junior, O. Forecasting Solar Power Output Generation: A Systematic Review with the Proknow-C. IEEE Lat. Am. Trans. 2021, 19, 612–624. [Google Scholar] [CrossRef]
  4. Junior, O.; Bretas, A.; Leborgne, R. Methodology for calculation and management for indicators of power quality energy. IEEE Lat. Am. Trans. 2015, 13, 2217–2224. [Google Scholar] [CrossRef]
  5. Emery, K.; Hishikawa, Y.; Warta, W. Solar cell efficiency tables (Version 39). Prog. Photovolt. Res. Appl. 2012, 20, 346–352. [Google Scholar]
  6. Ishaque, K.; Salam, Z. A review of maximum power point tracking techniques of PV system for uniform insolation and partial shading condition. Renew. Sustain. Energy Rev. 2013, 19, 475–488. [Google Scholar] [CrossRef]
  7. Rocha, M.; Sampaio, L.; Silva, S. Maximum power point extraction in PV array under partial shading conditions using GWO-assisted beta method. Renew. Energy Power Qual. J. 2018, 1, 450–455. [Google Scholar] [CrossRef]
  8. Seguel, J. Projeto de um Sistema Fotovoltaico Autônomo de Suprimento de Energia Usando Técnica MPPT e Controle Digital. Master’s Thesis, Universidade Federal de Minas Gerais, Horizonte, Brazil, 2009. [Google Scholar]
  9. Rocha, N.; Brighenti, L.; Passos, J.; Martins, D. Photovoltaic Cell Cooling as a Facilitator for MPPT. IEEE Lat. Am. Trans. 2019, 17, 1569–1577. [Google Scholar] [CrossRef]
  10. Spaduto, R.; Freitas, L. Estudo de técnicas de MPPT em sistemas fotovoltaicos. In Proceedings of the Conferência De Estudo Em Engenharia Elétrica, XI, Uberlândia, Brazil, 2013. [Google Scholar]
  11. Oliveira, F.; Silva, S.; Durand, F.; Sampaio, L.; Bacon, V.; Campanhol, L. Grid-tied photovoltaic system based on PSO MPPT technique with active power line conditioning. IET Power Electron. 2016, 9, 1180–1191. [Google Scholar] [CrossRef]
  12. Walker, L. Sistemas Fotovoltaicos de Geração Distribuída de Único e Dois Estágios em Conexão com a Rede de Distribuição de Energia Elétrica. Bachelor’s Thesis, Universidade Tecnológica Federal do Paraná, Curitiba, Brazil, 2016. [Google Scholar]
  13. Figueiredo, S.; Silva, R. Hybrid MPPT Technique PSO-P&O Applied to Photovoltaic Systems under Uniform and Partial Shading Conditions. IEEE Lat. Am. Trans. 2021, 19, 1610–1617. [Google Scholar]
  14. Brito, M. Inversores Integrados Monofásicos e Trifásicos para Aplicações Fotovoltaicas: Técnicas para Obtenção de MPPT, Detecção e Proteção de Ilhamento, Sincronização e Paralelismo com a Rede de Distribuição de Energia Elétrica. Ph.D. Thesis, Universidade Estadual Paulista (UNESP), Sao Paulo, Brazil, 2013. [Google Scholar]
  15. Mendonça, B.; Rocha, O.A.T.; Ribeiro, R.; Costa, F. Algoritmo MPPT P&O com Perturbação Variável Aplicado a um Sistema de Geração PV Conectado à Rede Elétrica Trifásica. In Proceedings of the SEPOC 2019: 12th Seminar on Power Electronics and Control, Natal, Brazil, 27 October 2019. [Google Scholar]
  16. Femia, N.; Petrone, G.; Spagnuolo, G.; Vitelli, M. Optimization of perturb and observe maximum power point tracking method. IEEE Trans. Power Electron. 2005, 20, 963–973. [Google Scholar] [CrossRef]
  17. Yang, X.; Press, L. Nature-Inspired Metaheuristic Algorithms, 2nd ed.; Luniver Press: Cambridge, UK, 2010. [Google Scholar]
  18. Sundareswaran, K.; Peddapati, S.; Palani, S. MPPT of PV systems under partial shaded conditions through a colony of flashing fireflies. IEEE Trans. Energy Convers. 2014, 29, 463–472. [Google Scholar]
  19. Viviani, V.; Simões, A.; Bevilaqua, V.; Gabriel, G.; Arnoldi, F.; Hirano, T. Glu311 and Arg337 stabilize a closed active-site conformation and provide a critical catalytic base and countercation for green bioluminescence in beetle luciferases. Biochemistry 2016, 55, 4764–4776. [Google Scholar] [CrossRef] [PubMed]
  20. Fister, I.; Fister, I., Jr.; Yang, X.; Brest, J. A comprehensive review of firefly algorithms. Swarm Evol. Comput. 2013, 13, 34–46. [Google Scholar] [CrossRef] [Green Version]
  21. Li, G.; Jin, Y.; Akram, M.; Chen, X.; Ji, J. Application of bio-inspired algorithms in maximum power point tracking for PV systems under partial shading conditions–A review. Renew. Sustain. Energy Rev. 2018, 81, 840–873. [Google Scholar]
  22. Saad, W.; Hegazy, E.; Shokair, M. Maximum power point tracking based on modified firefly scheme for PV system. SN Appl. Sci. 2022, 4, 1–15. [Google Scholar] [CrossRef]
  23. Sagonda, A.F.; Folly, K.A. A comparative study between deterministic and two meta-heuristic algorithms for solar PV MPPT control under partial shading conditions. Syst. Soft Comput. 2022, 4, 200040. [Google Scholar] [CrossRef]
  24. Rajkumar, K.; Kumar, K. Application of firefly algorithm for power estimations of solar photovoltaic power plants. Energy Sources Part A Recover. Util. Environ. Eff. 2021, 19. [Google Scholar] [CrossRef]
  25. Abo-Khalil, A.; Alharbi, W.; Al-Qawasmi, A.; Alobaid, M.; Alarifi, I. Maximum power point tracking of PV systems under partial shading conditions based on opposition-based learning firefly algorithm. Sustainability 2021, 13, 2656. [Google Scholar] [CrossRef]
  26. Zhang, M.; Chen, Z.; Wei, L. An immune firefly algorithm for tracking the maximum power point of PV array under partial shading conditions. Energies 2019, 12, 3083. [Google Scholar] [CrossRef] [Green Version]
  27. Huang, Y.; Chen, X.; Ye, C. A hybrid maximum power point tracking approach for photovoltaic systems under partial shading conditions using a modified genetic algorithm and the firefly algorithm. Int. J. Photoenergy 2018, 2018, 7598653. [Google Scholar] [CrossRef] [Green Version]
  28. Louzazni, M.; Khouya, A.; Amechnoue, K.; Gandelli, A.; Mussetta, M.; Crăciunescu, A. Metaheuristic algorithm for photovoltaic parameters: Comparative study and prediction with a firefly algorithm. Appl. Sci. 2018, 8, 339. [Google Scholar] [CrossRef] [Green Version]
  29. Ajiatmo, D.; Robandi, I. A hybrid Fuzzy Logic Controller-Firefly Algorithm (FLC-FA) based for MPPT Photovoltaic (PV) system in solar car. In Proceedings of the 2016 IEEE International Conference On Power And Renewable Energy (ICPRE), Shanghai, China, 21–23 October 2016; pp. 606–610. [Google Scholar]
Figure 1. Scheme of the MPPT-P&O algorithm.
Energies 15 05338 g001
Figure 2. Flowchart of the FA optimization method.
Energies 15 05338 g002
Figure 3. Convergence of fireflies method.
Energies 15 05338 g003
Figure 4. Effect of firefly attraction according to luminosity.
Energies 15 05338 g004
Figure 5. Circuit model used for the implementation of the MPPT-P&O and MPPT-FA algorithms.
Energies 15 05338 g005
Figure 6. Representation of partial shading application in Simulation Step 3.
Energies 15 05338 g006
Figure 7. Flowchart of the implemented simulation steps.
Energies 15 05338 g007
Figure 8. Circuit model implemented in Matlab/Simulink.
Energies 15 05338 g008
Figure 9. P-V characteristic curve of the PV array without shading.
Energies 15 05338 g009
Figure 10. Simulation results Step 1: P&O output power (637.10 W), FA output power (638.7 W).
Energies 15 05338 g010
Figure 11. P-V characteristic of the PV array with partial shading from Step 2.
Energies 15 05338 g011
Figure 12. Simulation Results Step 2: Output Power P&O (419.4 W), Output Power FA (553.4 W).
Energies 15 05338 g012
Figure 13. P-V characteristic curve of the PV array with partial shading of Step 3.
Energies 15 05338 g013
Figure 14. Simulation Results Step 2: Output Power P&O (200.5 W), Output Power FA (316.9 W).
Energies 15 05338 g014
Table 1. PV Arrangement Data.
ParameterValue
Photovoltaic module model1 string with 3 panels 1 Soltech 1STH-215-P 639.45 W
Input current MPP I p v 7.3 A
Boost converter output voltage V o 250 V
Dutty cycle (design)0.65
Inductance L 1 1.282 mH
Capacitance C 1 100 μF
Capacitance C 2 286.6 μF
Load resistance R o u t 97.75 Ω
Table 2. Comparison data obtained by the algorithm simulations P&O and FA.
Operation ConditionsStep 1Step 2Step 3
Implemented MethodP&OFAP&OFAP&OFA
Range time MPP [s]0.310.180.290.220.240.21
Maximum power [W]637.1638.7419.4553.1200.5316.9
Method efficiency [%]99.6399.8975.7899.9463.2299.93
Power variation [ΔW]4.80.140.70.140.90.1
Table 3. Comparison with others methods MPPT bio-inspired.
Ref.MethodAlgorithm Compared withContribuition
[18]FAPSO and P&OFA presented a more efficiency and very fast speed compared to the algorithms PSO and P&O.
[21]FAPSO and P&OFA outperform P&O on convergence time and maximum power, PSO on convergence time.
[22]MFAP&O and FAThe modifications on MFA resulted in a great improvement in all compared parameters. The reduce number of fireflies it’s the primary responsible for improving.
[23]FAPSO and P&OFA outperform P&O and had relatively equal efficiency to PSO due to FA receive few adaptation.
[24]FANo comparedEfficient for generation estimations of high-power PV systems. Capability of parameter extraction without any prior knowledge about variables of system.
[25]OFAFA and P&OOFA outperform P&O and FA, the OBL technique accelerates the tracking process of FA calculating the fittest solution from initial population of fireflies.
[26]IFAFAThe main improvements of IFA compared to FA is the great reduce convergence time and the steps of iterations.
[27]FA+GAP&O, ABC, Cuckoo, FPA, FA and GAConsidering all parameters, FA + GA performs better than all algorithms presents.
[28]FAN-R, OS, GA and SAFA outperforms the compared algorithms for the parameter extraction errors.
[29]FLC-FAP&O and FLCFLC-FA outperform P&O and FLC. The method proposed presents a high efficiency and accuracy when the irradiation changing fast.
Publisher’s Note: MDPI stays neutral with regard to jurisdictional claims in published maps and institutional affiliations.

