1. Introduction
For a long time, transport has been globally recognized as one of the main polluters of the environment. The steady increase in the level of transport sector emissions, which has been observed since 2013, slowed down somewhat in the years 2019–2020 due to the decline in transportation activities caused by the COVID-19 pandemic; however, the next period shows a resumption of increase in transport emissions [
1]. The fastest-growing segment of the freight shipments, the road transport (and particularly heavy-duty vehicles), emits nearly a quarter of total EU carbon dioxide (CO
2) emissions [
2]. Moreover, in the USA, the transportation sector is responsible for almost a third of all greenhouse gas emissions (GHG) in the industry, agriculture, residential and commercial sectors [
3].
In addition to CO
2, which is a primary GHG (nearly three-quarters of the total amount), the road transport releases large quantities of carbon monoxide (CO), nitrogen oxides (NO
x), volatile organic compounds, particulate matter (PM), metals, and other pollutants [
4,
5], which affects the deterioration of the environment and threatens severe consequences for human health and welfare [
6]. Especially, such harmful effects of transport (and particularly diesel-powered vehicles [
7]) could be observed in the dense city centers, where a concentrated road network causes the greatest damage to the population. Therefore, most of the research is aimed at finding ways to improve the socio-economic and environmental conditions of the urban areas. The results of the studies conducted on sustainable transport systems are used to develop new strategies and substantiate and introduce novel policies and innovative solutions that aim to combat transport-related impact.
Due to technological improvements and the relatively recent popularity of the use of cargo bicycles in commercial transportation, there are gaps in studies that investigate the impact of such green vehicles on the environment. Most of the research focuses on analyzing technical, operational, economic, and societal aspects of using cargo bicycles in urban deliveries [
8,
9,
10]. For example, the agent-based simulation framework, which evaluates the potential of the automation bicycle sharing system, was proposed in the research [
11]. Such a tool could be used by various stakeholders engaged in transportation decisions for analysing the possibilities of innovative technologies. Cost aspects and emission calculations were performed by [
12] to determine the least environmentally harmful delivery vehicle among the electric cargo bikes, electric and fuel-powered vans, and the light-duty trucks. The Life Cycle Assessment methodology, the SimaPro software, and the Ecoinvent database were used for environmental assessment, and the economic part of the calculations was performed using the cost price simulator. As expected, the cargo bikes showed the lowest level of emissions, although the cost of vehicle kilometers traveled for such green transport was the highest. The freight transportation model was designed to investigate the possibilities of cargo bikes in a last-mile segment of the urban deliveries by the authors of the study [
13]. The MITO demand model and MATSim simulator were used at the stage of the traffic assignment, and various scenarios of deliveries were simulated with different percentages of cargo bicycles in the fleet. In addition to reducing total emissions, the authors emphasize the operational feasibility of introducing cargo bikes into delivery chains. In addition, the calculation of CO
2 for the mixed fleet solution (with a different share of cargo bikes in the scheme) was performed by the authors of the manuscript [
14] using a simplified method Tier 1. Firstly, the simulated annealing algorithm was applied to solve the vehicle routing problem, and the results were further used to calculate economic and environmental effects. According to the study results, the optimal ratio of truck-cargo bikes turned out to be 29:9 for the examined case study.
On the other hand, the number of scientific studies devoted to the analysis of the environmental effects of transport activities has grown significantly in recent years. The main technique for assessing and predicting such problems is the application of various model-based approaches. Oftentimes, the whole composition of models is used: traffic flow simulations are combined with transport emission models, and the pollution dispersion modeling is further performed.
For instance, a wide set of models, which includes the transport model DEMO, the scenario analysis model VECTOR21, the HBFA database, and the SMOKE emission model, was used to calculate current and predict future emissions of NO
x and PM by 2040 [
15]. The main innovation of this approach is the ability to estimate emissions for different simulation scenarios: the possibility to change traffic parameters and expand the fleet with sustainable modes of transport. Another comprehensive model, which connects a traffic model, emission model, and Lagrangian dispersion model with a boundary layer flow model, was presented in the study [
16]. The results obtained from that model were compared with those calculated using the COPERT model, showing that the emission level is twice as high. Moreover, by estimating the scenario with a reduction of 20% of private vehicles and increasing public transport twice, the level of pollutants significantly reduced (up to 41% of CO
2 and 65% of NO
x). A methodology for the evaluation of the environmental impact of the public transport renewal was the goal of the authors of the paper [
17]. In the presented research, the direct emissions were calculated using the HBEFA database for emission factors of the transport and the indirect emissions were obtained by applying the regression analysis. The significant CO
2 savings over the four-year period of use of the renewed public fleet amounted to EUR 1.3 million tons.
The most popular among the EU member states is the MS Windows program COPERT used to estimate the level of air pollution caused by road transport for reporting in official annual emission inventories [
18]. Moreover, this methodology is also widely used for emission modeling for research purposes. The combination of the dynamic traffic simulator SymuVia and the emission models COPERT and PHEM were used to evaluate NO
x emissions and fuel consumption and after all to compare the results of emission calculation [
19]. Another emission model was implemented using COPERT software to assess the levels of the following pollutants: CO, NO
x, PM, and benzene [
20]. The research has demonstrated that the highest concentrations of pollutants are observed on the slowest sections of roads.
However, despite the high popularity of the COPERT model, some authors point to such a shortcoming as sensitivity to variations in travel duration and speed [
21]. By varying the input parameters, uncertainties in the emission calculations were obtained, which could lead to a serious under- or overestimation of emission outputs. Consequently, traffic flow characteristics are essential for further vehicle-related emission modeling.
Many scientists are dealing with issues related to the negative impact of transport on the environment and looking for solutions to correct and prevent it. Nevertheless, there are very few studies on the environmental effects of using green solutions (cargo bikes) for freight deliveries. The variety of the methodologies, tools, and approaches, which could be used to assess such problems, provides researchers with an instrument for conducting the studies on the topic. The broad description of such practices is comprehensively covered in our previous review manuscript [
22].
The current study aims to propose the simulation-based methodology of assessing the positive impact of the cargo bikes used for last-mile deliveries in terms of carbon dioxide reduction. This methodology is used as the main tool for estimations of CO2 savings obtained as the result of the actions conducted by the partners of the CityChangerCargo-Bike (CCCB) project.
The paper has the following structure: the second section describes the model proposed by the authors to evaluate the impact of cargo bikes in the given city district in terms of CO2 reduction; the third part contains the results of computer simulations for the selected partner cities of the CCCB project; the fourth part discusses the obtained results of simulations; and the last section proposes brief conclusions and directions of further research.
2. Model for Estimating Emissions
The model we propose to use for estimations of the emissions reduction is based on the approach to generate the transport demand proposed in the paper [
23]. By simulating the demand with the use of the dedicated software, we obtain samples of the total distance covered by the vehicles that are used as the initial data for estimations of the emissions. The ecological effect of using cargo bikes for the last mile deliveries is estimated as the difference between the emissions generated in the delivery system where traditional vehicles are used as the means of transport and the emissions generated in the delivery system where conventional vehicles are partly replaced by cargo bicycles [
24].
2.1. Simulations of the Demand for Deliveries
The transport demand is simulated based on the model of a transport network that represents the road network in the considered area. The mathematical model of a transport network is usually represented by a graph
, where the vertices correspond to the road intersections (or other objects—e.g., clients or loading hubs) and the edges describe the sections of the road network:
where
is a set of the graph nodes;
is a set of the graph edges;
is a set of traffic analysis zones defined in the analyzed area.
The
-th vertex
of the graph
can be characterized by the following attributes:
where
is an identification code of the
-th vertex,
;
and
are the geographic coordinates of the
-th vertex;
is a set of the graph edges, for which the
-th vertex is the outlet,
;
is a set of the graph edges that have the
-th vertex as the inlet node,
;
is a type of the
-th vertex (e.g., a client, a loading hub, or a road intersection);
is a reference to a traffic analysis zone that contains the
-th vertex,
(this attribute should be defined only for the vertices that represent clients);
is the graph node that represents the intersection closest to the
-th vertex,
;
and
are Boolean variables that specify if the
-th vertex represents an inlet or an outlet in the considered area (the attributes should be defined only for the vertices that represent intersections of the road network);
is the total number of vertices defined within the graph model.
We propose to describe an edge
in the graph
by using the following set of parameters:
where
and
are the begin and the end vertices for the
-th edge,
;
is the numeric characteristic describing the
-th edge (e.g., a link length or the delivery costs);
is the number of edges defined within the graph model.
The
-th traffic analysis zone
, as the element of the demand model, can be characterized by the following set of attributes:
where
is an identification code of the
-th zone,
;
and
are the coordinates of the
-th zone centroid;
is a set of the nodes contained by the
-th zone;
is the number of traffic analysis zones defined within the demand model.
The travel demand model
in case of cargo deliveries within the given area can be presented as a set of requests ordered in time [
23]:
where
is the
-th request in a flow of requests for deliveries:
if
,
is the time moment when the
-th request appears;
is the total number of requests in the flow.
We propose to define the spatial distribution of requests inside of the simulated city district by assuming that vehicles departing to the considered area from the given inlet serve those clients who are located closest to the inlet. If this assumption is considered, it can be stated that drivers behave rationally and are eager to minimize the covered distance inside the delivery area.
A request
for the delivery of cargo to a client located inside the considered city district can be represented by the following parameters:
where
and
are the vertices that represent an inlet to the city district and a client location (origin and destination nodes for the
-th request);
is the probability that the
-th request will appear (the probability value is defined by the type of a client which generates the request);
is the weight of a consignment for the
-th request [kg].
It should be noted that the consignment weight is deterministic for the given request, but when a flow of requests is considered, this parameter is represented by a random variable (a set of the values for the consignment weights in the flow constitutes the sample representing the random variable).
In practice, while planning the deliveries of cargo by bikes, the combined consignments are usually prepared by transport operators: to minimize the total delivery distance, the routing procedures are used to combine the requests for deliveries during the given time window (the vehicle capacity must be considered in such cases as the model constraint to prevent the overload of vehicles). The transport demand model should reflect the real-world rational behavior of operators; it could be approximated by the implementation within the model of vehicle routing procedures (the example of such implementation is described in [
25]).
The matrix of the shortest distances should be determined as input data for the routing algorithms. To estimate such a matrix, different algorithms for searching the shortest paths can be applied (Floyd–Warshall algorithm, Dijkstra algorithm, and A* heuristics are the most popular methods). For the given set of requests for deliveries, the task of routing these requests is usually solved as the traveling salesman problem; for these purposes, the entry to the considered city district defines the location of a sender, and the locations of the clients inside the area represent the locations of recipients. Various heuristic methods can be used to solve the routing problem (the most widely used are the Clarke–Wright savings algorithm, the simulated annealing heuristic, or approaches based on genetic algorithms). The result of running the routing heuristics is a set of delivery routes, where the -th route contains the ordered set of requests (the order of the graph vertices represents the trace of a delivery route).
Thus, the
-th delivery route
can be described by the following attributes:
where
is the set of the requests for delivery serviced by the
-th route;
is the
-th route length (total distance covered by a vehicle on the route) [km];
is the total weight of cargo transported by the
-th route [kg];
is the number of delivery routes obtained by applying the routing heuristics.
The route distance is the shortest (or close to the shortest) distance covered by a vehicle while servicing the set of requests .
It should be noted that all the requests serviced by the set
of the delivery routes constitute the demand
for deliveries:
The numeric characteristics of the delivery routes are used as initial data to evaluate the efficiency of the routing heuristics and the efficiency of the whole transport system, including the transport emissions that are considered one of the most important indicators used to evaluate the sustainability of the transportation processes.
2.2. Software Implementation of the Model
The proposed model of a delivery system was implemented in the Python programming language; the source code is available for free access and can be downloaded from the repository
https://github.com/naumovvs/transport-demand-model (accessed on 22 June 2022). The developed software for simulations of cargo deliveries in the considered city district contains the following core classes:
: a transportation network model;
: a graph vertex as an element of the transport network;
: a graph edge defined within the road network;
: a traffic analysis zone within the transport model;
: a request for cargo delivery;
: a delivery route that services a set of requests.
The structure of the proposed basic classes as the UML-diagram is shown in
Figure 1.
To initialize the transport system model, the instance of the class should be created. For that instance, the network architecture should be defined; the most convenient way to achieve it is to prepare the datafiles with the information about nodes and edges of the net and to upload them by using the corresponding method of the class. According to the provided demand parameters (the vector of probabilities of the request appearance for the defined types of clients, average traffic flows for commercial traffic at the inlets to the serviced area), the requests for cargo deliveries are generated at the next stage. If transport operators behave rationally, for the generated flow of requests for deliveries, the delivery routes are estimated by using the selected routing heuristics. For the obtained set of routes, the following parameters needed to estimate the emissions are calculated: the number of vehicles of each type (or the number of routes), the total distance covered by each vehicle, and the total time of delivery.
Fields of the classes , , and correspond to the attributes of the mathematical model described in the previous subsection. The main methods dedicated to the generation of transport demand and the estimation of demand characteristics are implemented in the class.
The method is used to load the configuration of a road network from csv-files containing attributes of vertices and edges. If the provided file with the edges’ configuration does not contain the data on the edge weights, the lengths of the links may be estimated by using the method of the class. The method allows for defining the traffic analysis zones by setting the references to the instances that represent the zones as the attributes of the vertices that represent clients.
To generate demand for cargo deliveries inside the considered city district, the method of the class should be used. As the input parameters, the procedure uses the stochastic variable representing the consignment weight, the dictionary of probabilities of the request appearance defined for all types of clients, and the collection of vertices that represent clients within the transport model.
To calculate the rational delivery routes, the
method of the
class should be applied. The Python implementation of other routing heuristics may be found in the repository
https://github.com/naumovvs/cargo-bikes-system (accessed on 22 June 2022). This procedure uses the shortest distances matrix (estimated by launching the
method of the
class; as the alternative, the
method of the same class may be used for small and middle-sized networks) as the initial data to run the savings routing algorithm. As the result of running the
procedure, the collection of instances of the
type will be obtained. To evaluate the distance covered at the route, the
property of the
class should be called.
2.3. Estimations of the Transport Emissions Based on the Simulation Results
To estimate the reduction of transport emissions as the result of using bikes for cargo deliveries in the selected city area, we propose to use the integrated approach that combines the transport processes simulation and the COPERT model. The reduction of emissions can be calculated based on the results of simulations as the difference in the emissions’ volume for the base scenario (when all requests are serviced by conventional vehicles) and the scenario when cargo bikes replace traditional vans in the case of the requests with the weight of the consignment up to the bike load capacity.
Among the available alternative approaches, the COPERT methodology was chosen to estimate the amount of transport pollution. COPERT is one of the most popular approaches used in Europe. In opposition to most alternative approaches, this methodology does not require precise data on driving behavior. In the COPERT method, the emission of transport pollutants is calculated as the total emission from two sources—emissions of pollutants from vehicles in motion when the engine is warm (so-called hot emissions) and emissions from the vehicle launching when the engine is cold (known as cold emissions). Additionally, for the vehicles that use petrol as a fuel, the evaporative emissions should be estimated.
Therefore, according to the COPERT methodology, the total emission
caused by transport should be evaluated as the sum of hot, cold, and eventually—evaporate emissions:
where
is the value of hot emissions [g];
is the value of cold start excess emissions [g];
is the estimated value of evaporative emissions (estimated for petrol vehicles only) [g].
The road category in the considered city area influences the results of the transport emission estimations. In the COPERT methodology, three categories of roads are distinguished: urban roads, rural roads, and highways. If the vans are considered as the mean of transport, the emissions for the following pollutants should be estimated: NOx, CO, volatile organic compounds, and suspended dust (for these pollutants, the emission coefficients depend on the average vehicle speed), as well as CH4, N2O and NH3 (the coefficients for these pollutants depend on the driving mode). For N2O and NH3 pollutants, the total distance covered by a vehicle from the beginning of its use should be provided additionally as input data to determine the emission coefficients (the average mileage of vehicles in the studied region may be used for these purposes).
3. Simulation Results
The simulation experiment to estimate the emissions reductions due to the use of bikes for cargo deliveries was carried out for four partner cities that participated in the CityChangerCargoBike project: Vitoria-Gasteiz (Spain), San Sebastian (Spain), Dubrovnik (Croatia), and Mechelen (Belgium).
For each of the partner cities, the area in the central part was chosen according to the following criteria:
There is restricted traffic in the area;
inside the area, the commercial objects are located that potentially have demand for cargo deliveries (restaurants, cafes, grocery shops, hotels, etc.);
all the inlets and outlets to the area can be simultaneously covered by counting persons (the city has enough human resources to conduct traffic counts).
As the initial data to evaluate the commercial traffic inside the selected city areas, the traffic counts were conducted by the city-partners as part of research activities within the CCCB project. The methodology used for conducting traffic counts may be described as follows:
for each inlet and inlet, the counts of traffic were made manually by filling the count form (six types of vehicles were considered in the form: large goods vehicles, light commercial vehicles, private cars, taxicabs, vehicles of special services, and cargo bikes);
the counts were conducted during the peak period (during the time window, when the commercial traffic is allowed inside the area);
the period when the observations were conducted was the same for each day of counts;
the counts were performed on the workdays only;
the counts were carried out for at least five days to enable calculating the average values to reduce the variability of data;
to ensure representative results, the counts were performed simultaneously (for this, the number of persons conducting counts was equal to the total number of inlets and outlets in the area);
for further validation of the simulation model, the additional traffic counts were conducted inside the selected area (3–5 places with the highest traffic).
The results of traffic counts (average intensities of incoming and outgoing traffic flows) were used as initial data for transport demand simulations. Additionally, to perform the traffic assignment inside the studied area, the demand structure was considered based on the data available on Google Maps: for potential clients in the area, the locations and types of the commercial objects were determined (as the alternative, the OpenStreetMap API can be used to obtain data on the structure of potential demand).
The set of potential clients was divided into five groups according to their type [
23]:
restaurants, cafes, and bars;
hotels, hostels, and apartments to rent;
grocery stores;
other (than groceries) types of shops;
all the other types of clients (e.g., museums, theatres, or universities).
The structure of potential clients obtained based on the Google Maps data is presented in
Table 1.
As shown in
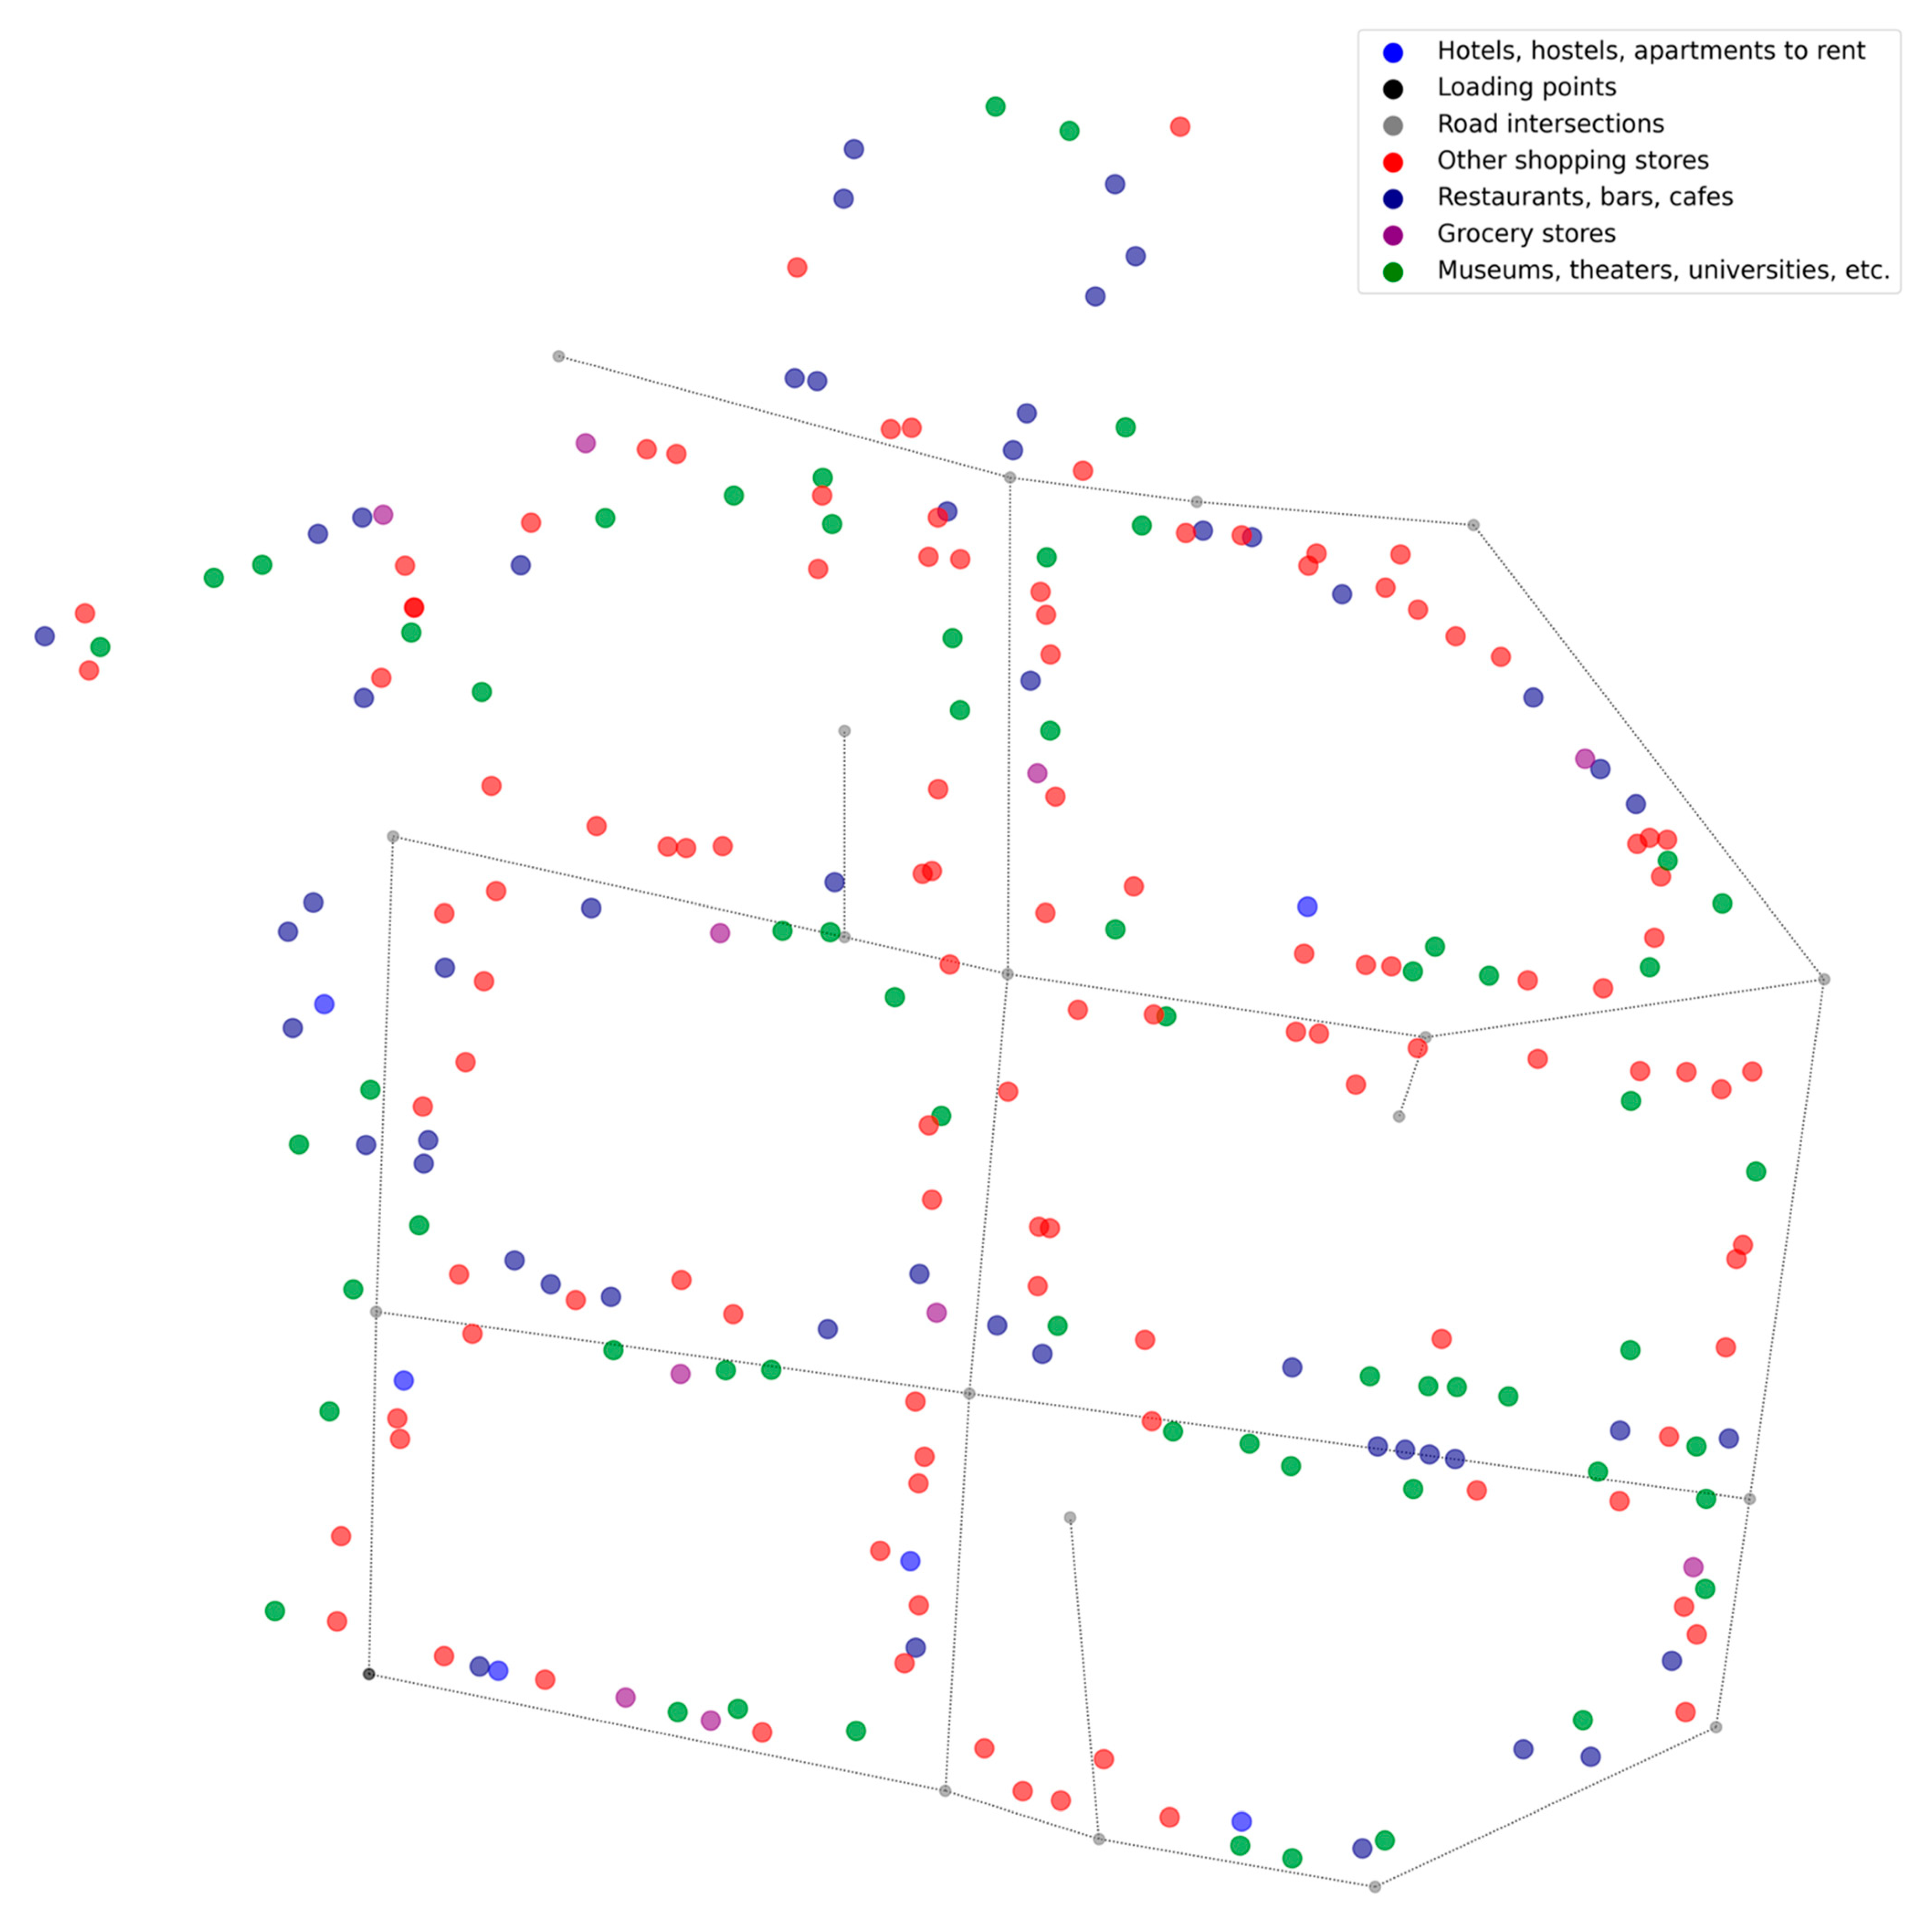
Table 1, the biggest group of potential clients in the central district of Vitoria-Gasteiz is non-grocery shops (46.2% of all clients); the significant part constitutes the restaurants and cafes (21.4% in total number), whereas hotels and hostels make the smallest group of potential clients (just 2.5%). As can be seen from
Figure 2, the location of commercial objects inside the studied area of Vitoria-Gasteiz is distributed evenly along the streets: there are no concentrations of objects of the same type. Not all the clients have comfortable access to the road infrastructure: in the north part and the northwest corner, there are groups of clients located at distance from roads.
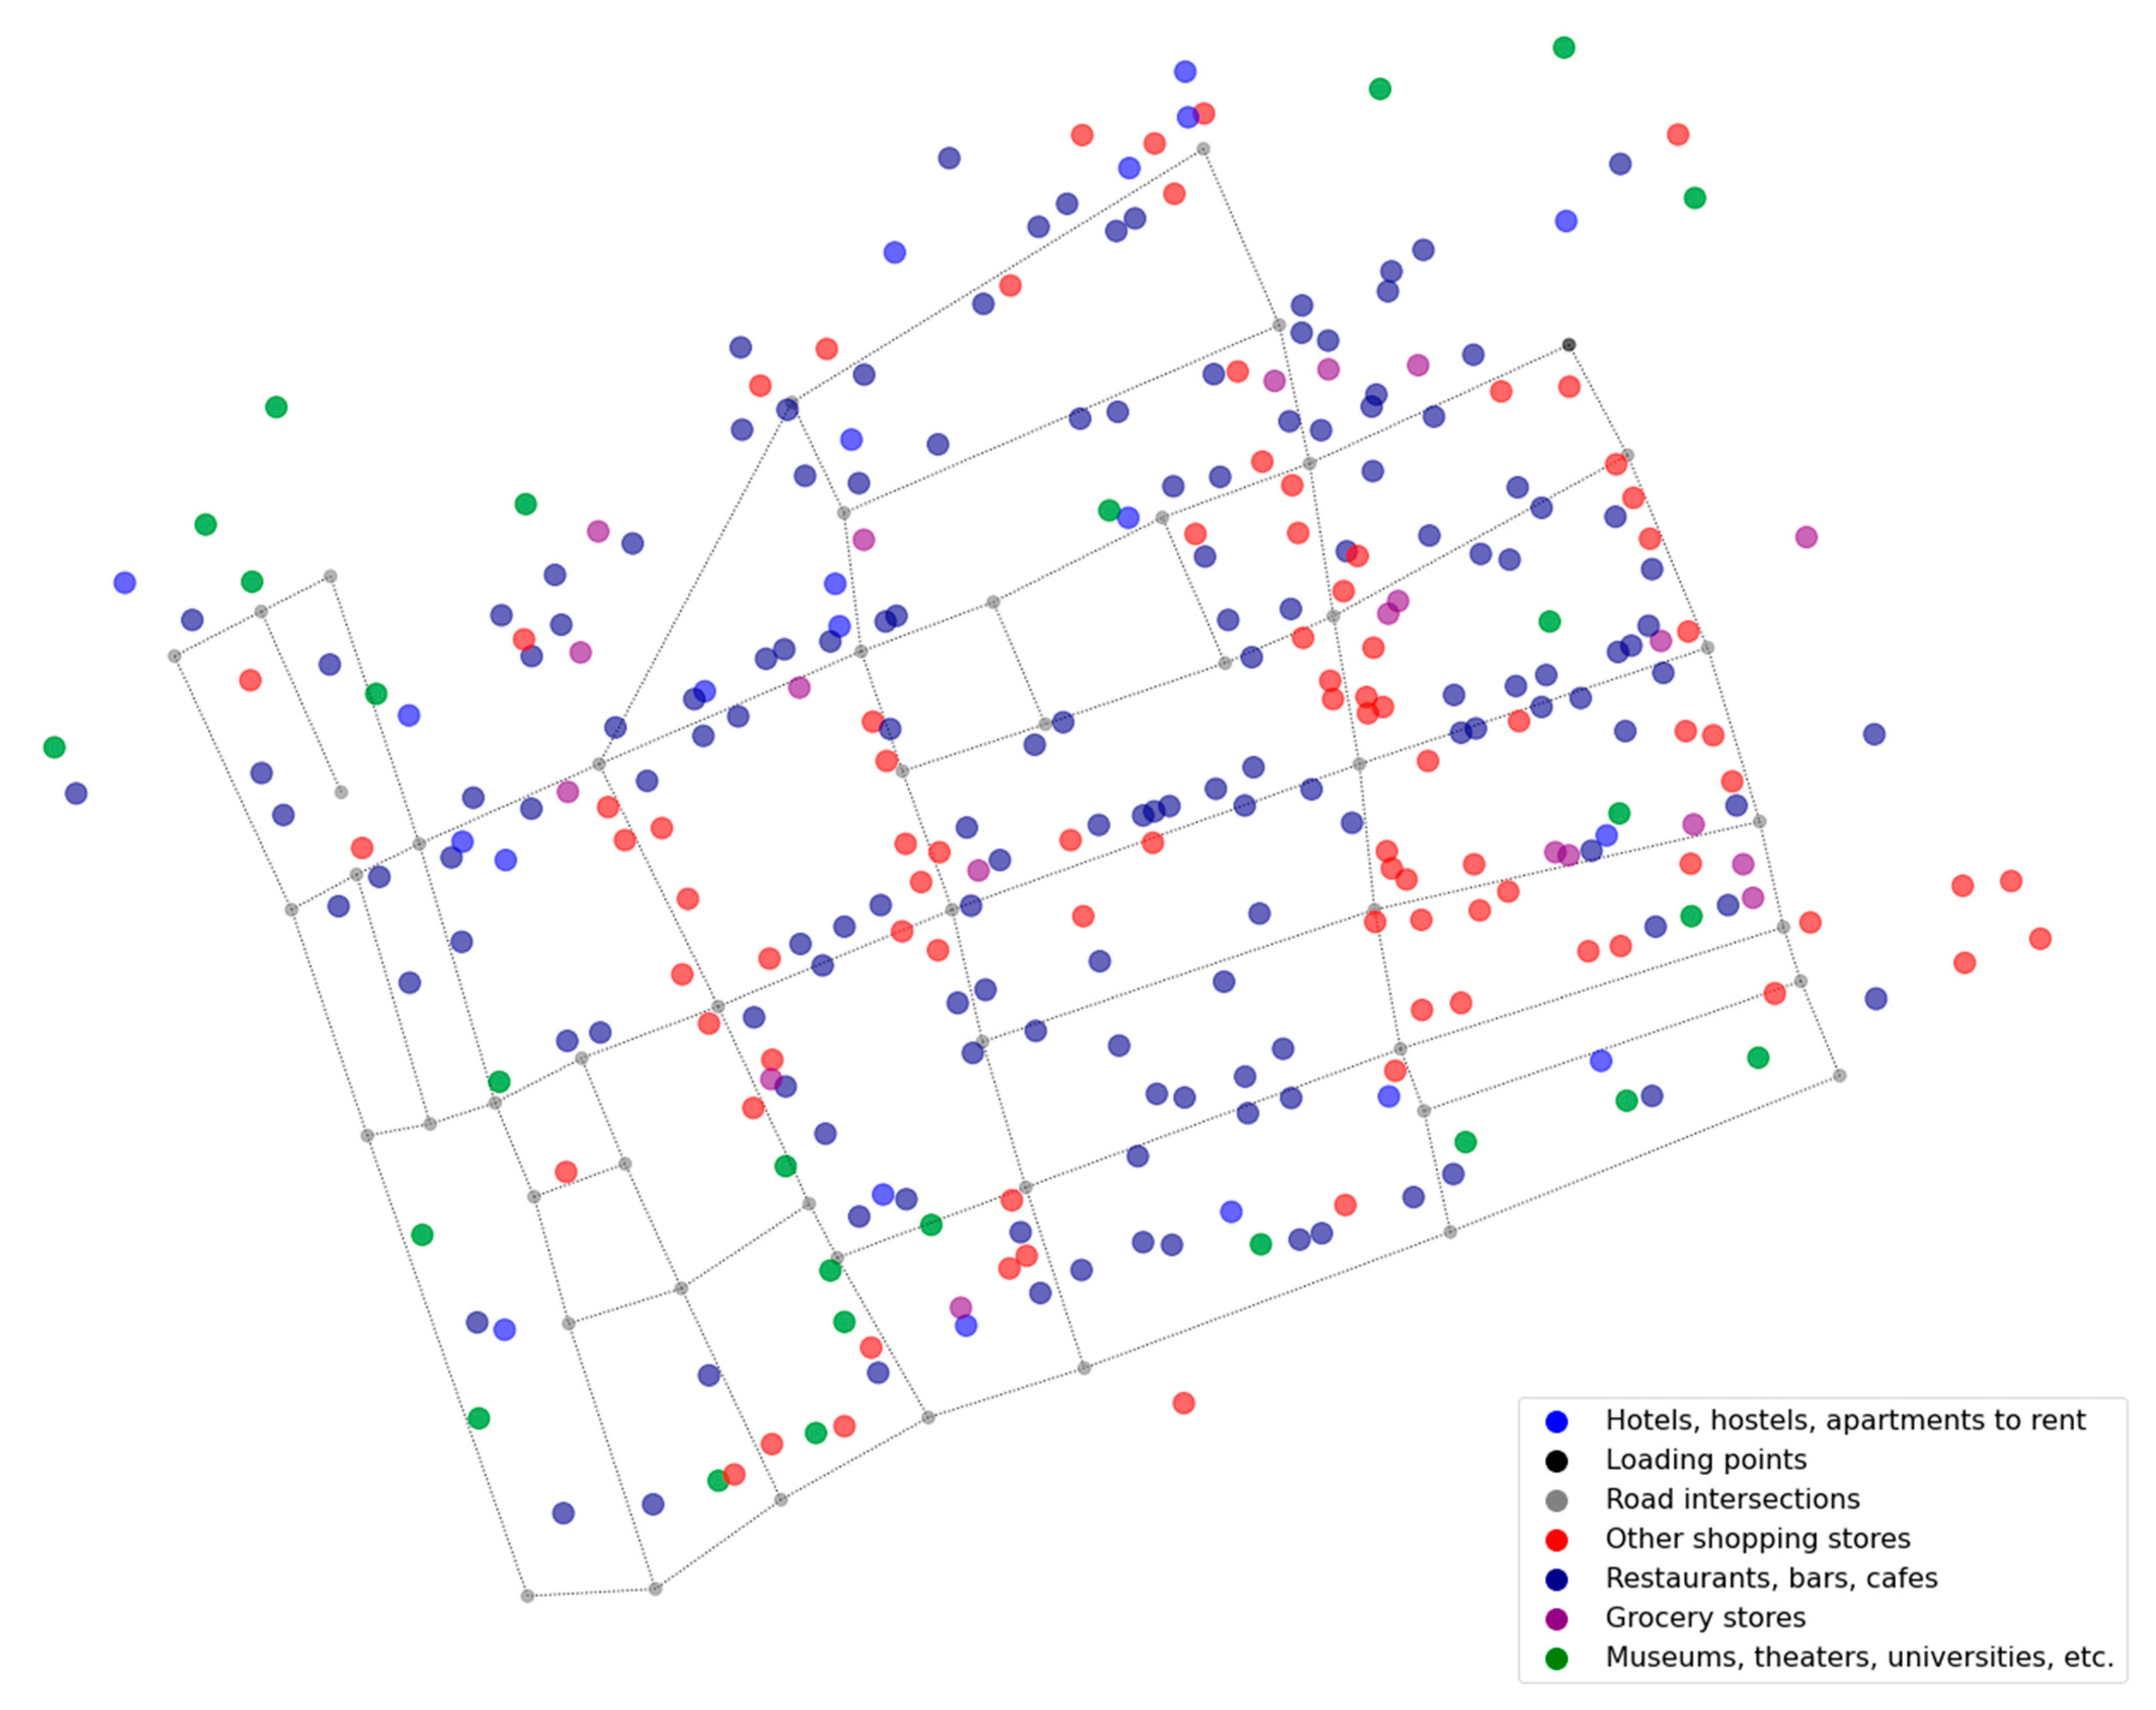
The structure of potential clients in the studied area of San Sebastian (Old Town district) differs from the demand structure in the Vitoria-Gasteiz central district: the biggest group of clients in San Sebastian constitutes restaurants and cafes (almost half—48.8%). The second place has the group of non-grocery stores (28.1), whereas other types of clients have less than 10% part in number: 7.3% for hotels and hostels, 6.6% for grocery stores, and 9.2% for all other types of businesses. As in the case of Vitoria-Gasteiz, commercial objects are located evenly along the streets, and the availability of the roads is good (see
Figure 3). Objects located in the northeast and northwest corners of the selected area may look as if they have worse road availability, but it is not so, as they are located around city squares. The concentration of stores may be noted in the east part of the studied district, which has a significant impact on the results of the routing procedures (in terms of savings of the total distance covered by vehicles), as the group of stores is characterized by a high probability of the appearance of a request for load deliveries.
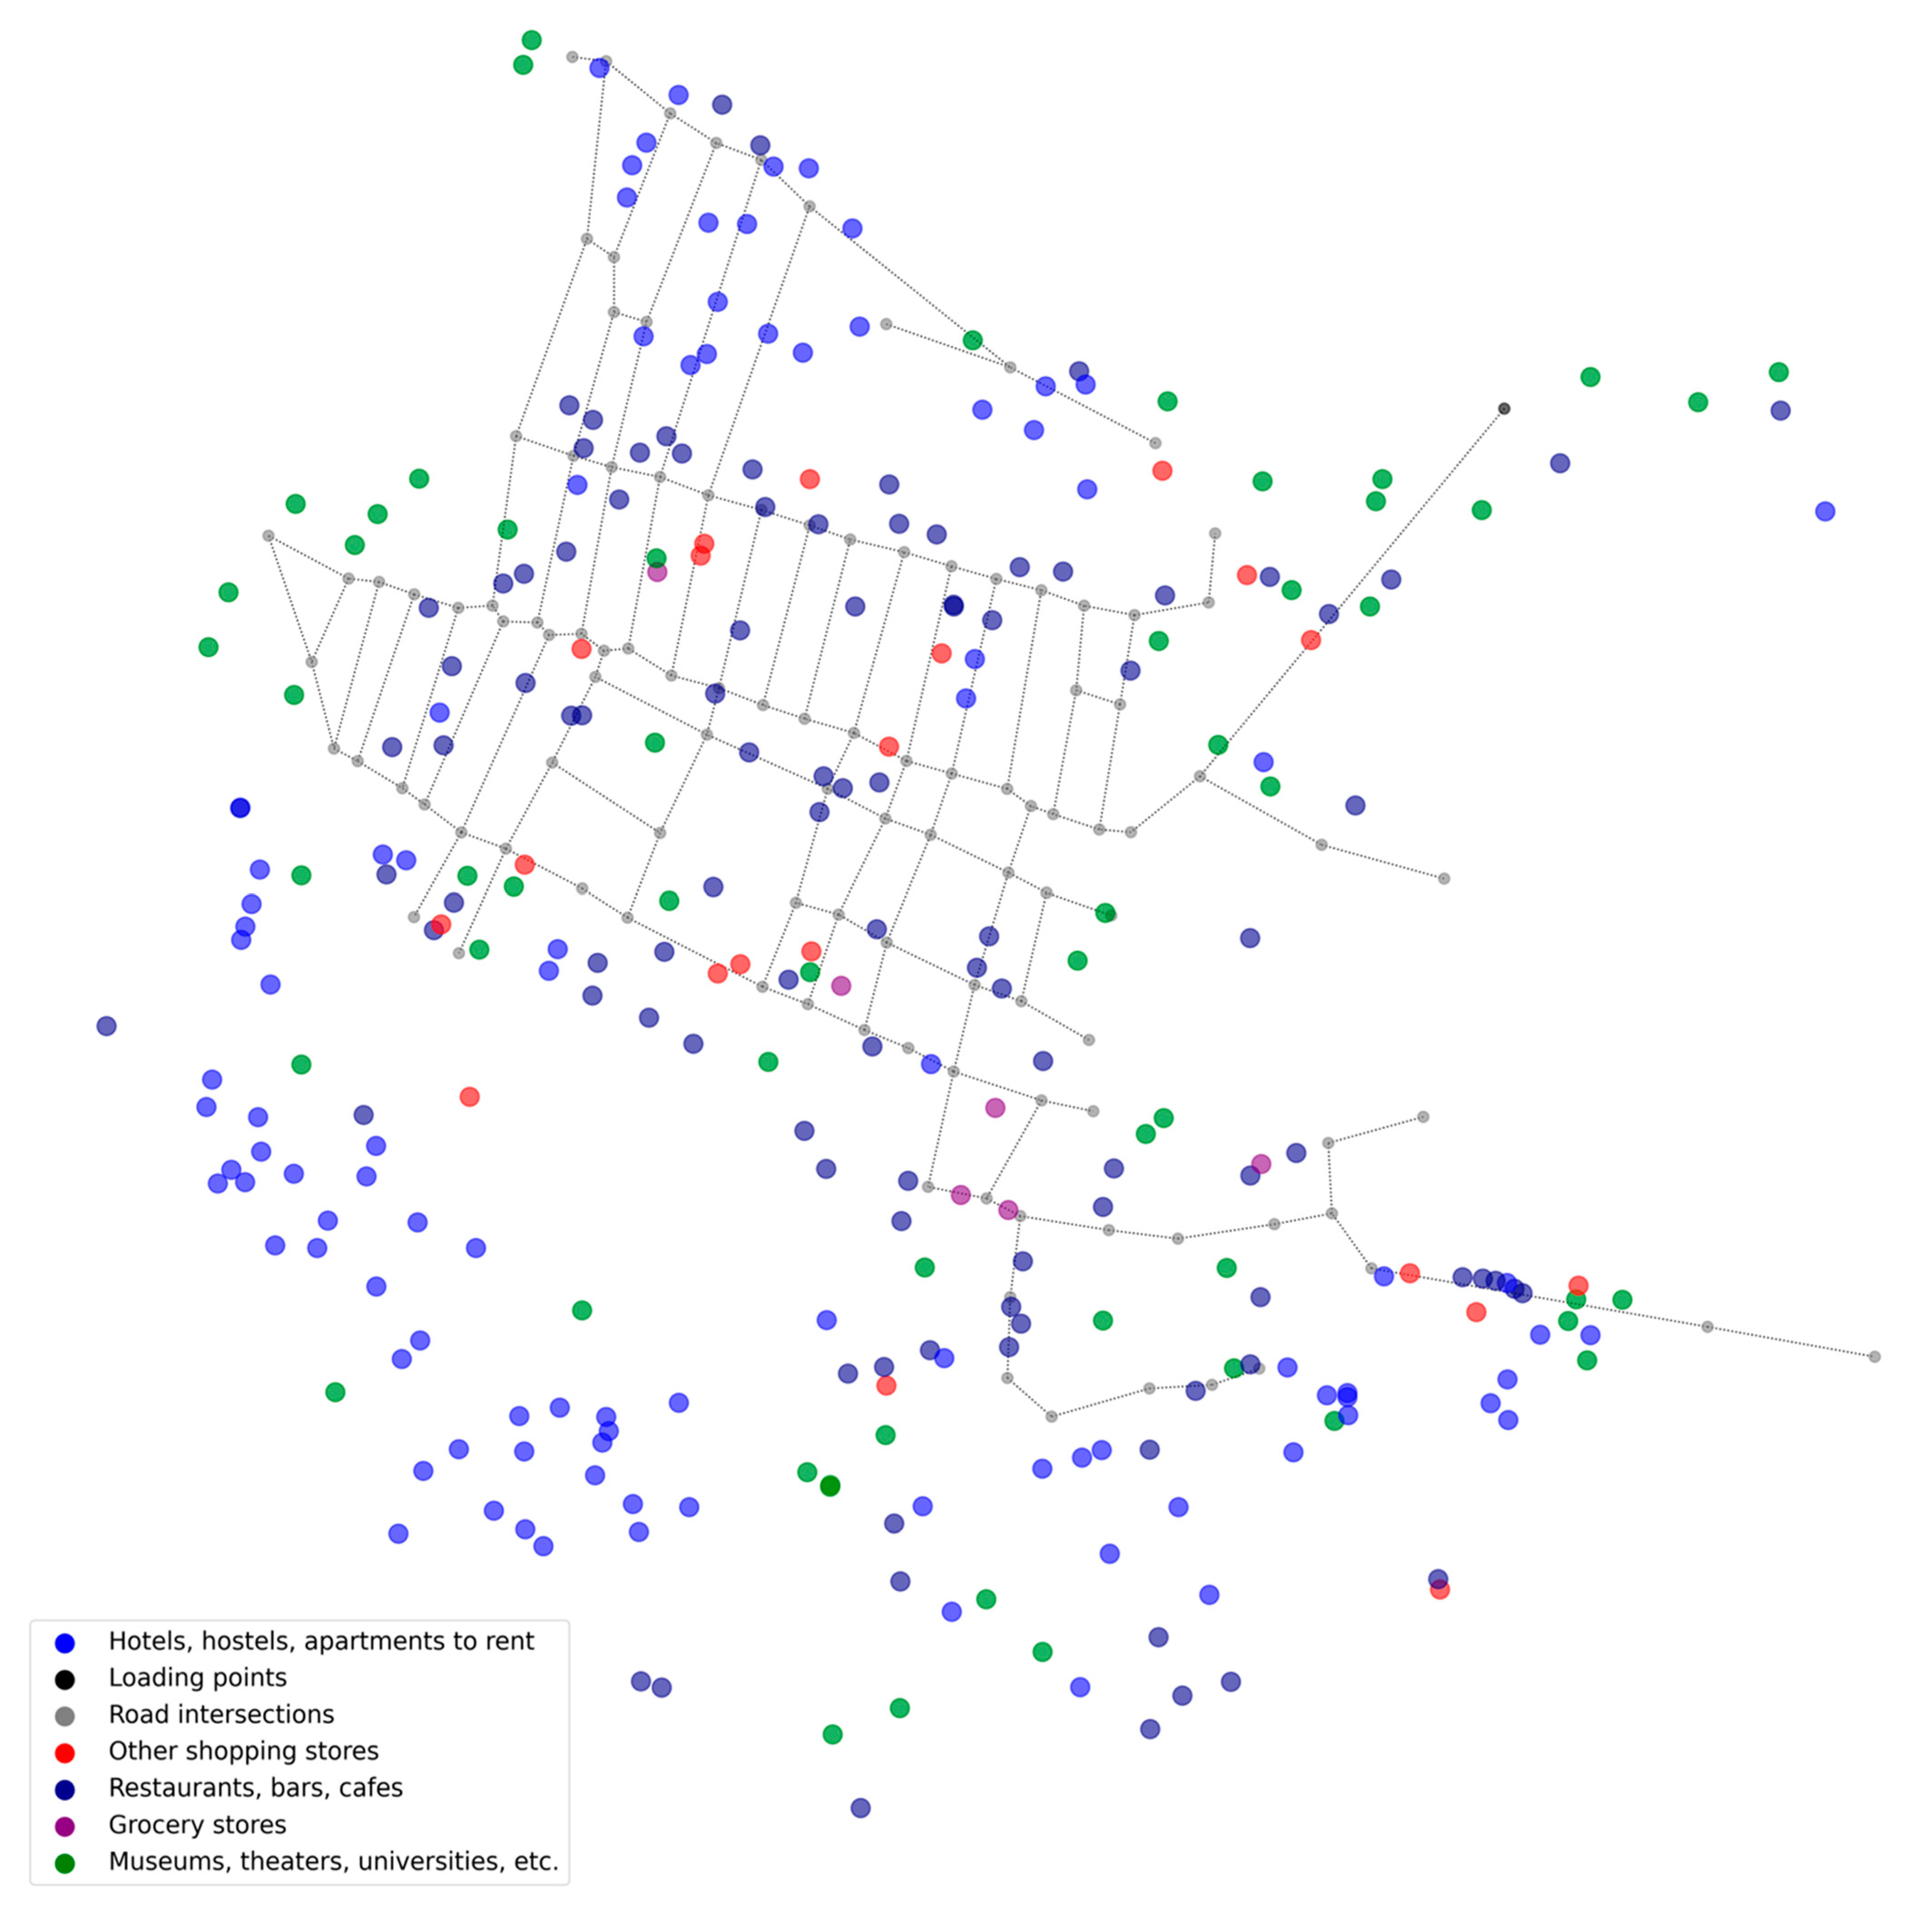
The structure of potential clients and the road network in Dubrovnik are conditioned by the unique location of the studied city area, which is the touristic Old Town district rounded by city walls. The most numerous groups of clients in Dubrovnik are restaurants and cafes (35.8% of the total number) along with hotels and hostels (34.8% of businesses). The part of stores and shops in the area is minor: just 2.1% of grocery stores and 7.1% of other types of stores. The lack of transport roads may be observed in the southern part of the Old Town of Dubrovnik: due to the terrain relief and peculiarities of medieval urban architecture, the streets in that part have stairs available only for pedestrians. The other feature of the transport network of the studied area is a single inlet to the district available for transport (main city gate). As may be observed in
Figure 4, shops and stores in the Old Town district of Dubrovnik are located near the roads, as their supply in other locations would be quite problematic.
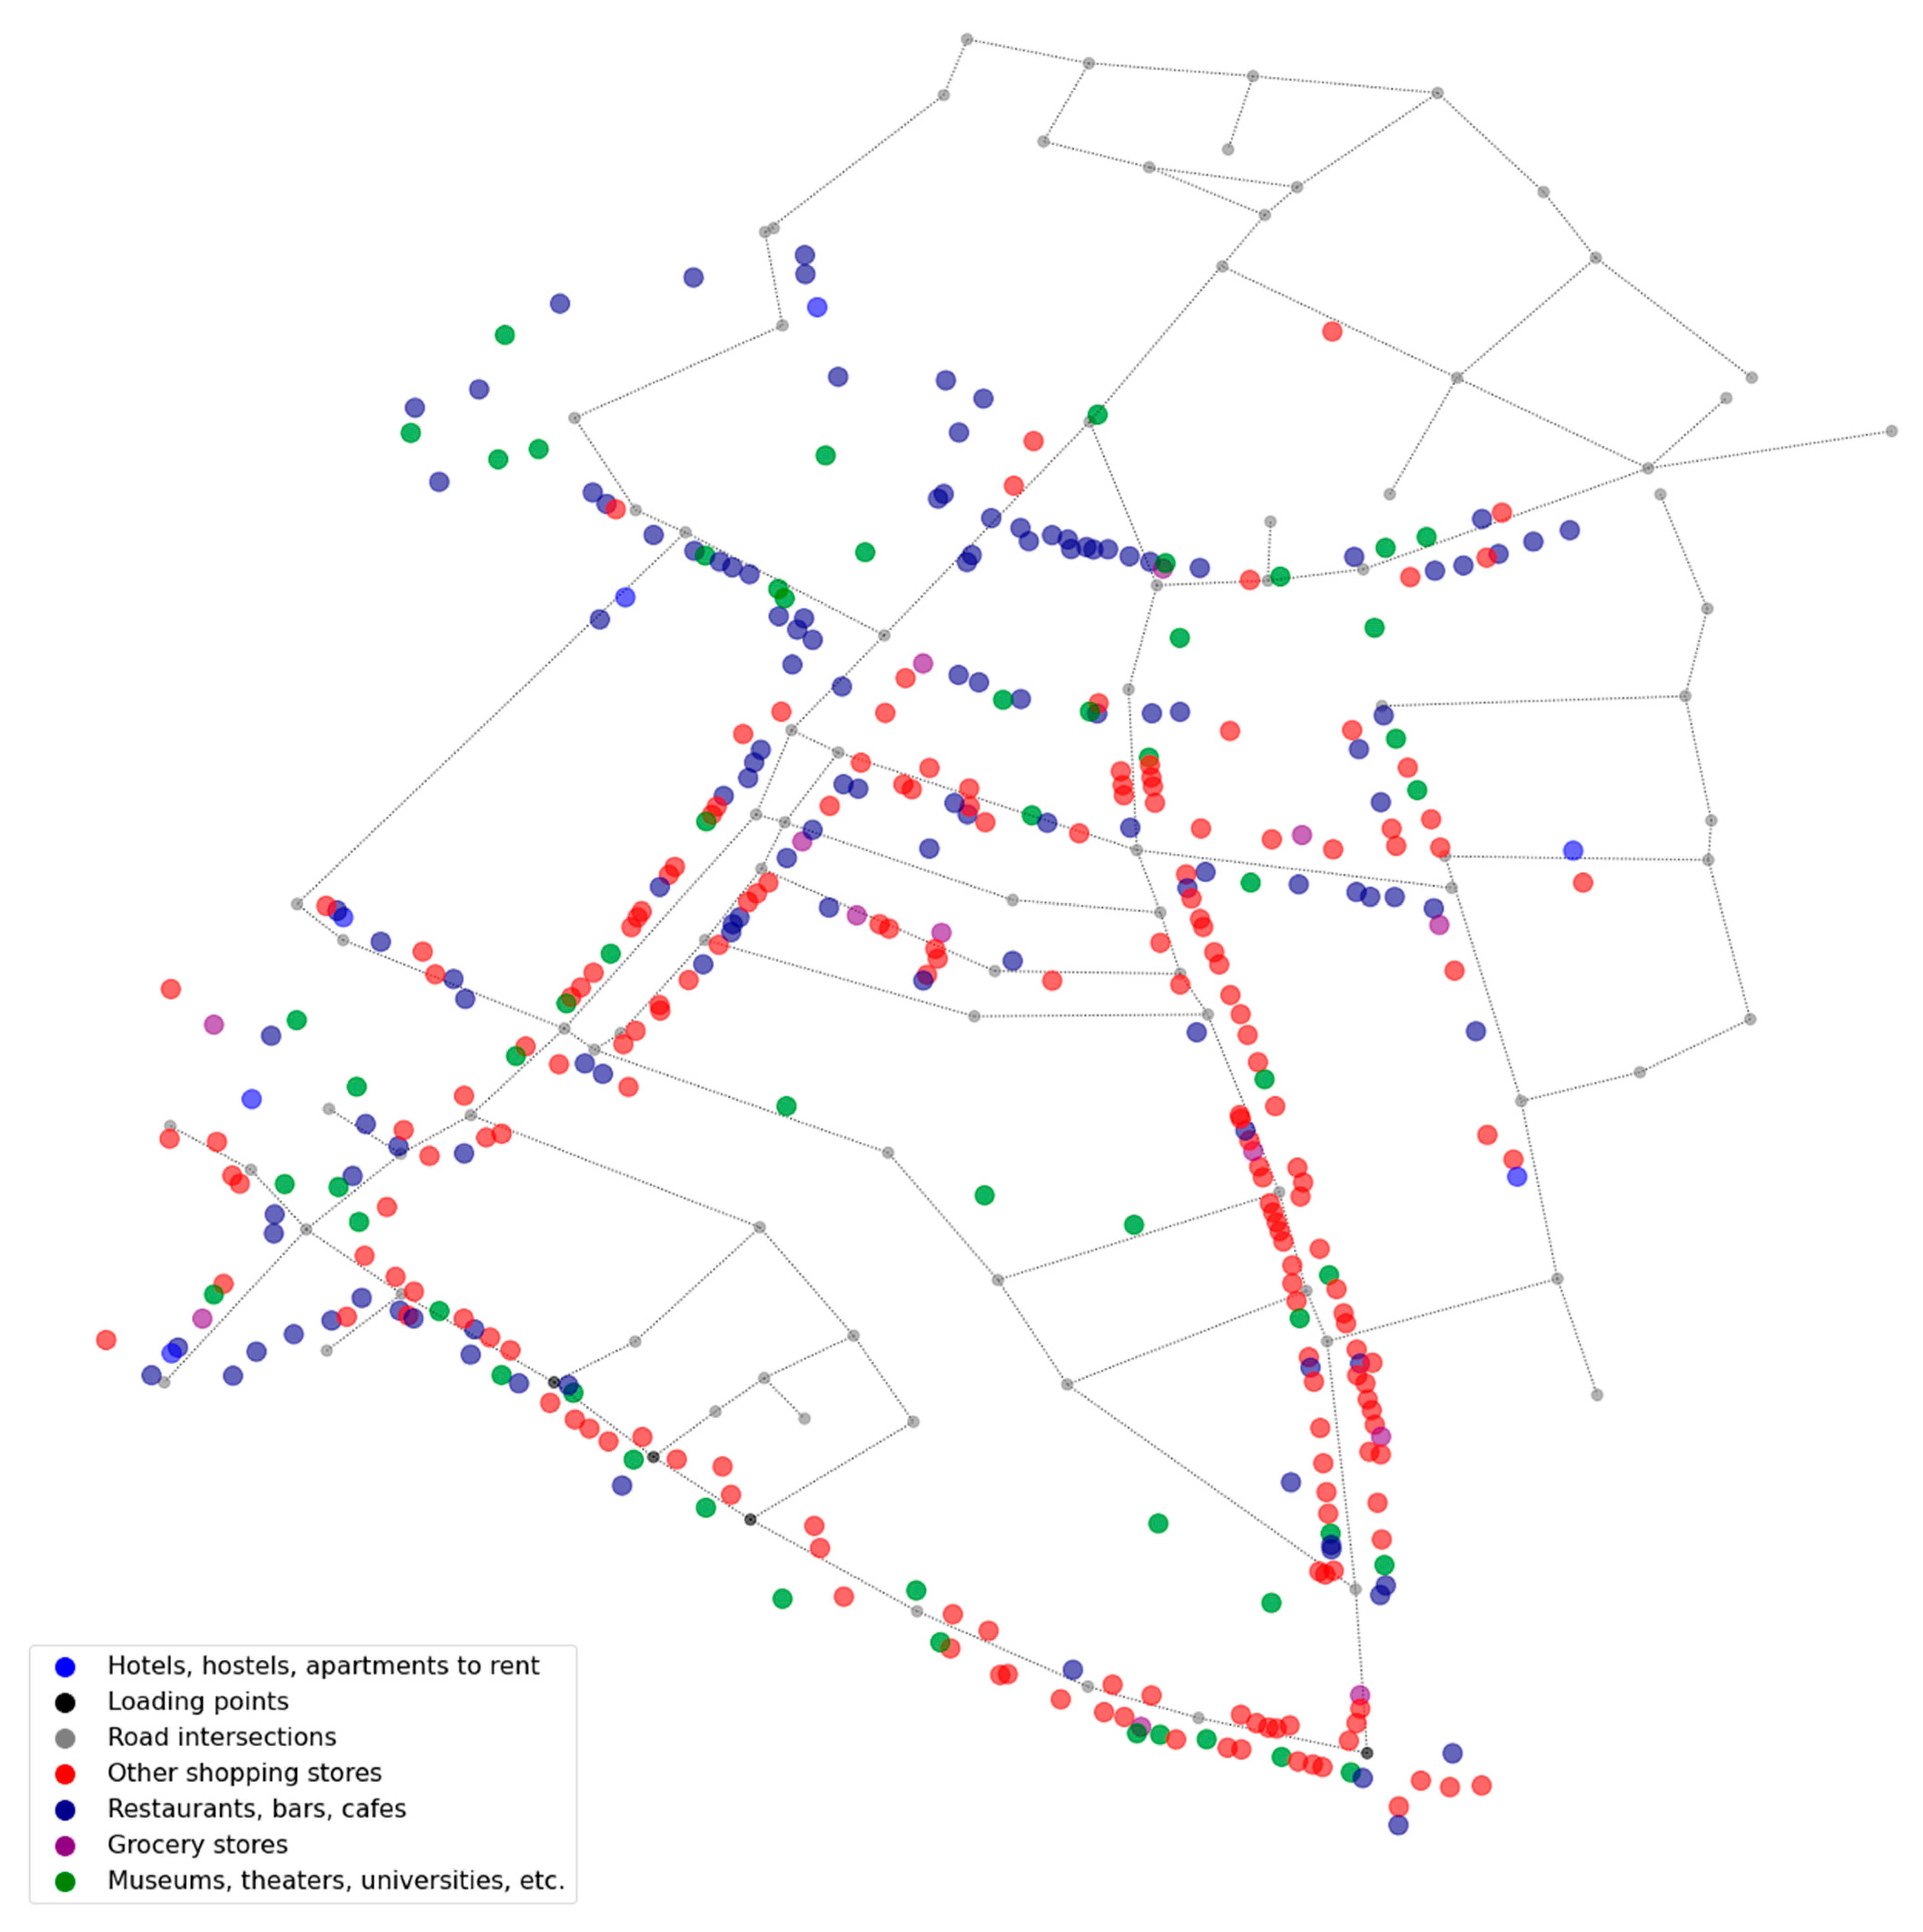
The structure of potential clients in the central part of Mechelen is a standard picture for commercial areas of contemporary cities with the prevalence of non-grocery stores (48.1% of clients). The second place has the group of restaurants and cafes (32.4%), whereas the parts of hotels (1.8%) and grocery stores (3.3%) are minor. The density of the locations of potential clients in the studied area of Mechelen is not even (see
Figure 5): the trade businesses are located alongside the streets that shape a triangle with no commercial objects inside of that triangle. Restaurants and cafes are concentrated in the northern part of the area, closer to the market square.
For each of the studied areas, the computer simulations of the delivery processes were carried out with the use of the developed software. The pseudocode for the conducted simulation experiment may be presented in the following way (Algorithm 1):
| Algorithm 1. Simulation of a delivery processes. |
Input:Output:
Collection of tuples containing parameters of delivery routes servicing the requests for deliveries in the area
Procedure:Create the instance of the class; Load the net architecture from csv-files by using the method; Generate requests for deliveries by using the method; Calculate the rational delivery routes by using the method; For each obtained route: calculate covered distance and delivery time; Return distances and delivery times for the set of routes.
|
Two alternative scenarios were considered in the simulation experiment:
basic scenario: potential clients located inside the selected area are serviced by conventional vehicles,
scenario with cargo bikes: clients are serviced both with the use of traditional transport and cargo bicycles, where consignments with a weight of less than 150 kg are delivered by bikes.
For each scenario, 100 runs of the simulation model were conducted. As the result, two samples of the random variable of the total distance covered by commercial vehicles were obtained for each of the cities. The parameters of the obtained samples along with the sufficient number of observations are shown in
Table 2 (for the basic scenario) and
Table 3 (for the scenario with cargo bikes used).
For the obtained samples, the statistical significance of the results of simulations was checked: a sufficient number of observations was estimated for the significance level of 5%. The values of standard normal distribution were used, as this distribution was confirmed for each of the samples of the total distance with Pearson’s chi-square test. As the obtained sufficient sample size is less than the conducted number of the model runs (less than 100), we can conclude that the results of observations are statistically significant with the probability of confidence equal to 95%.
4. Discussion
Based on the total distance covered by vehicles while servicing the clients located inside the considered areas, the CO
2 transport emissions were estimated with the use of the COPERT methodology for each of the considered scenarios. Parameters of the obtained samples of carbon dioxide emissions are presented in
Table 4 (basic scenario) and
Table 5 (scenario with cargo bikes).
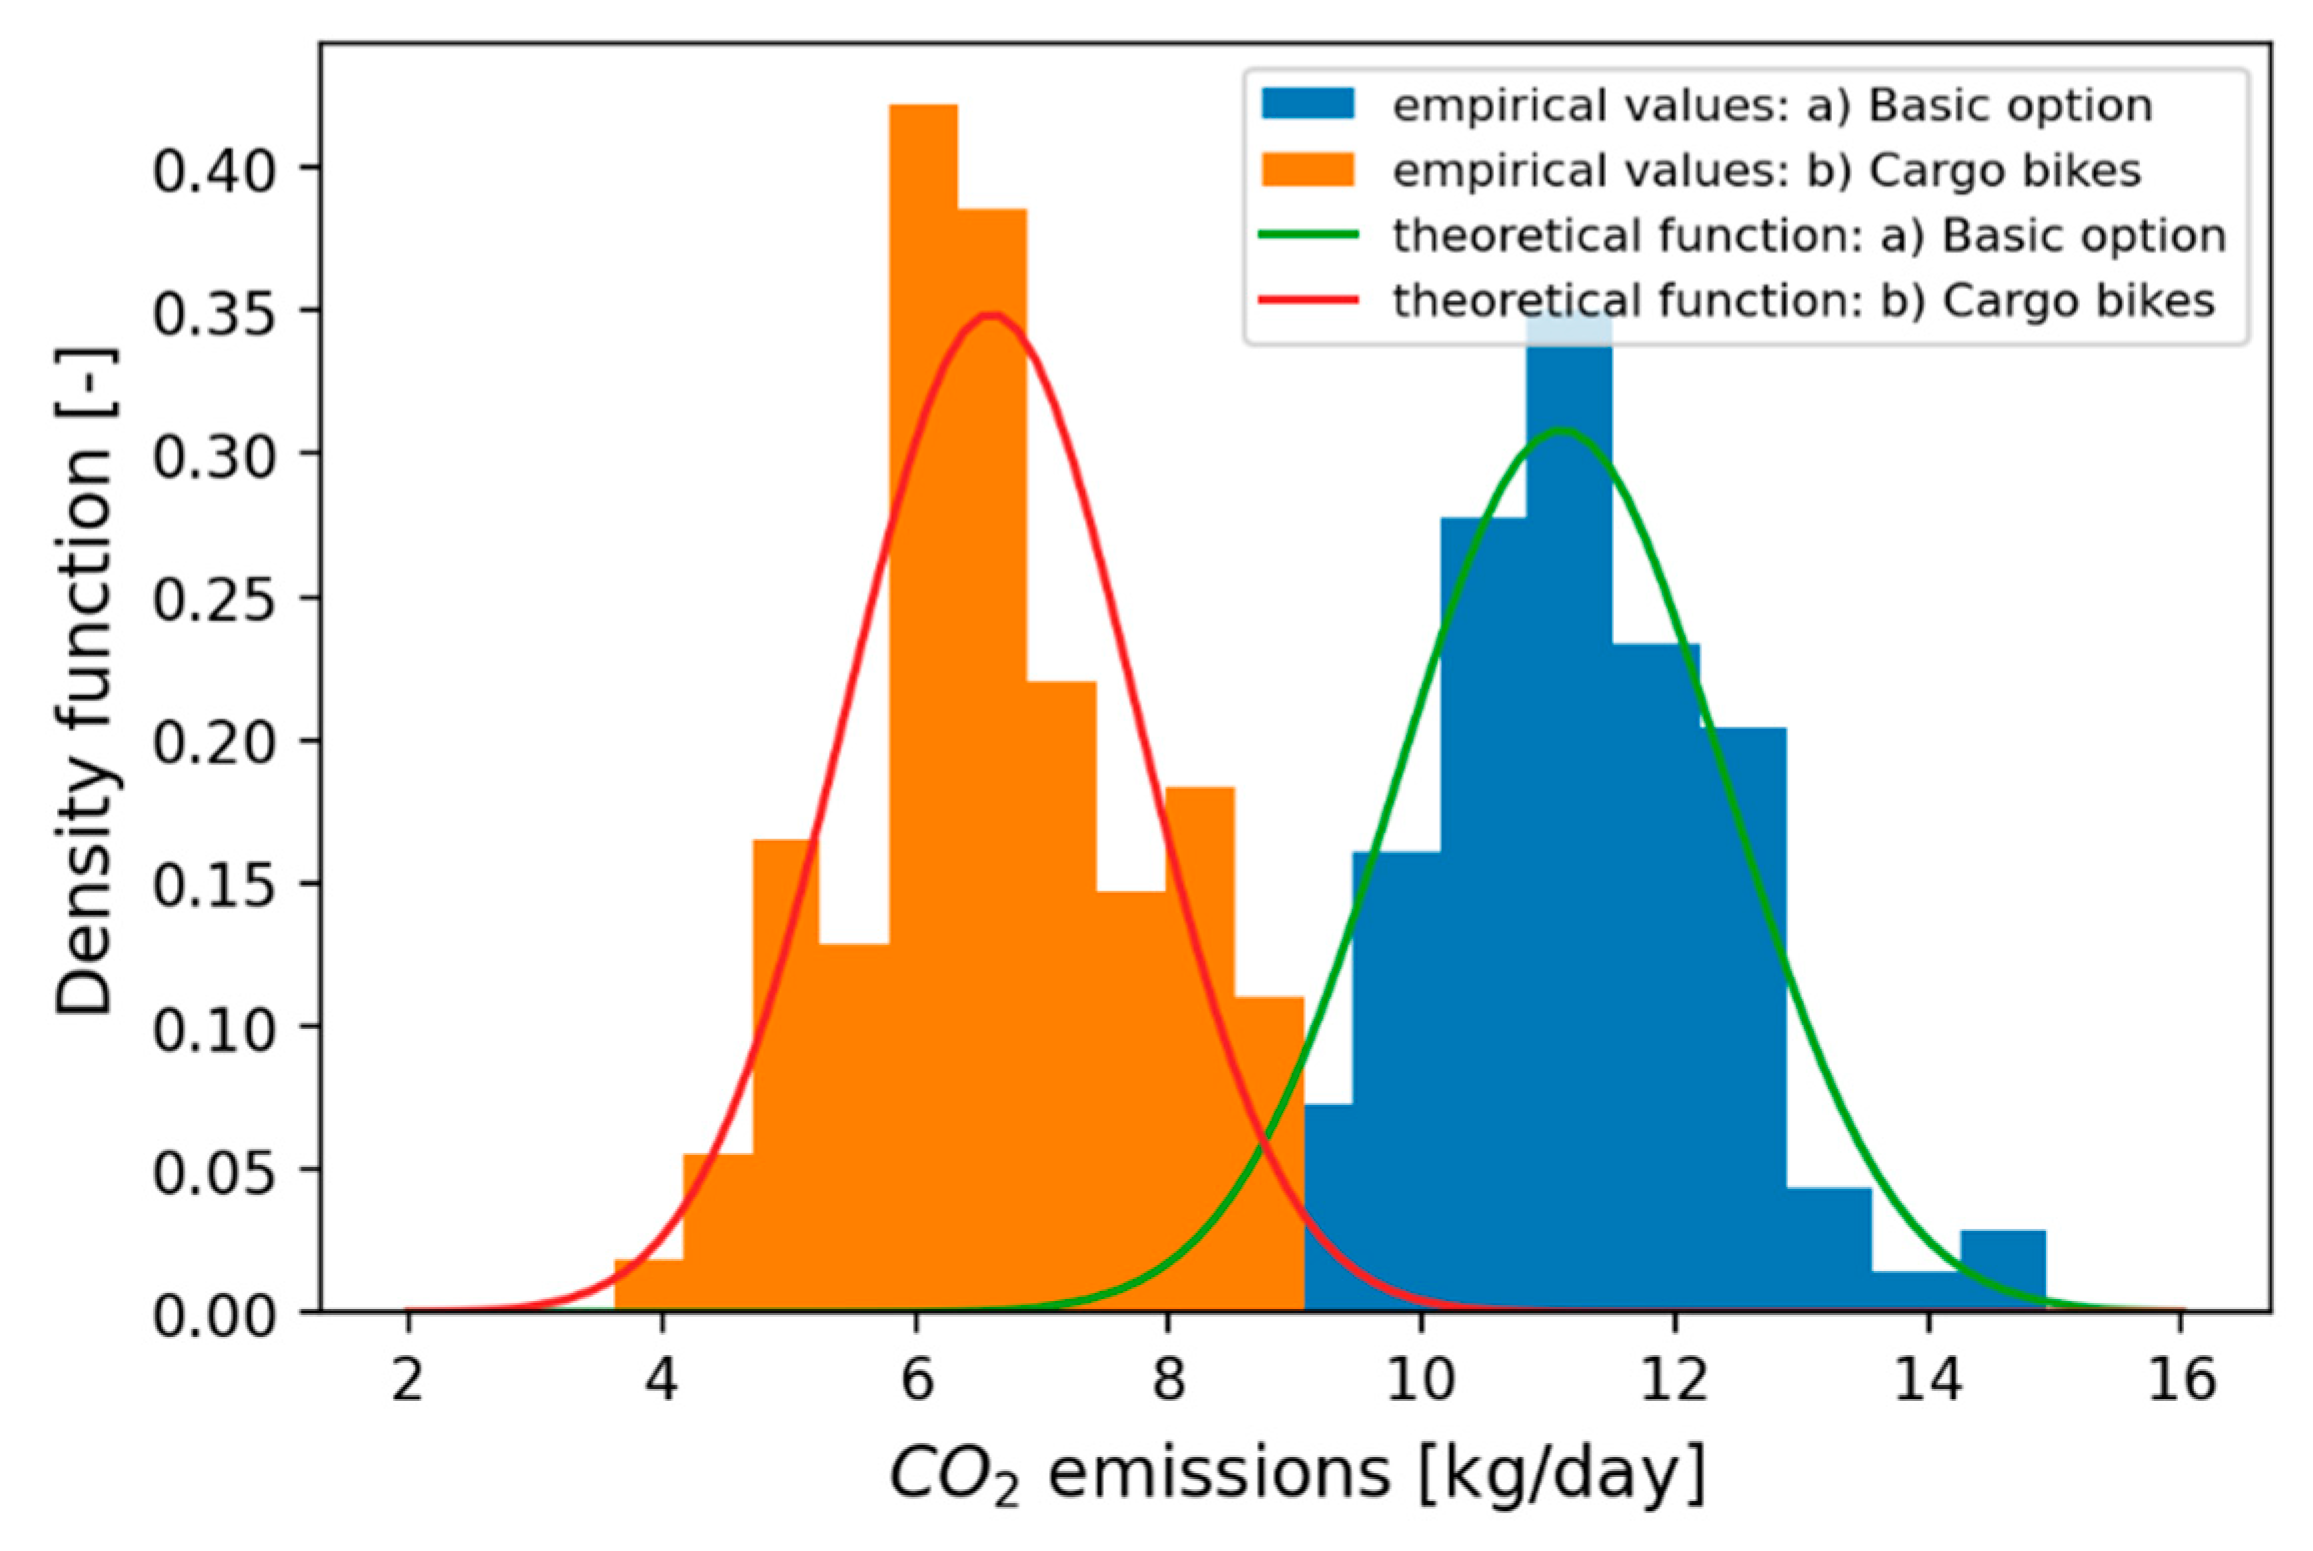
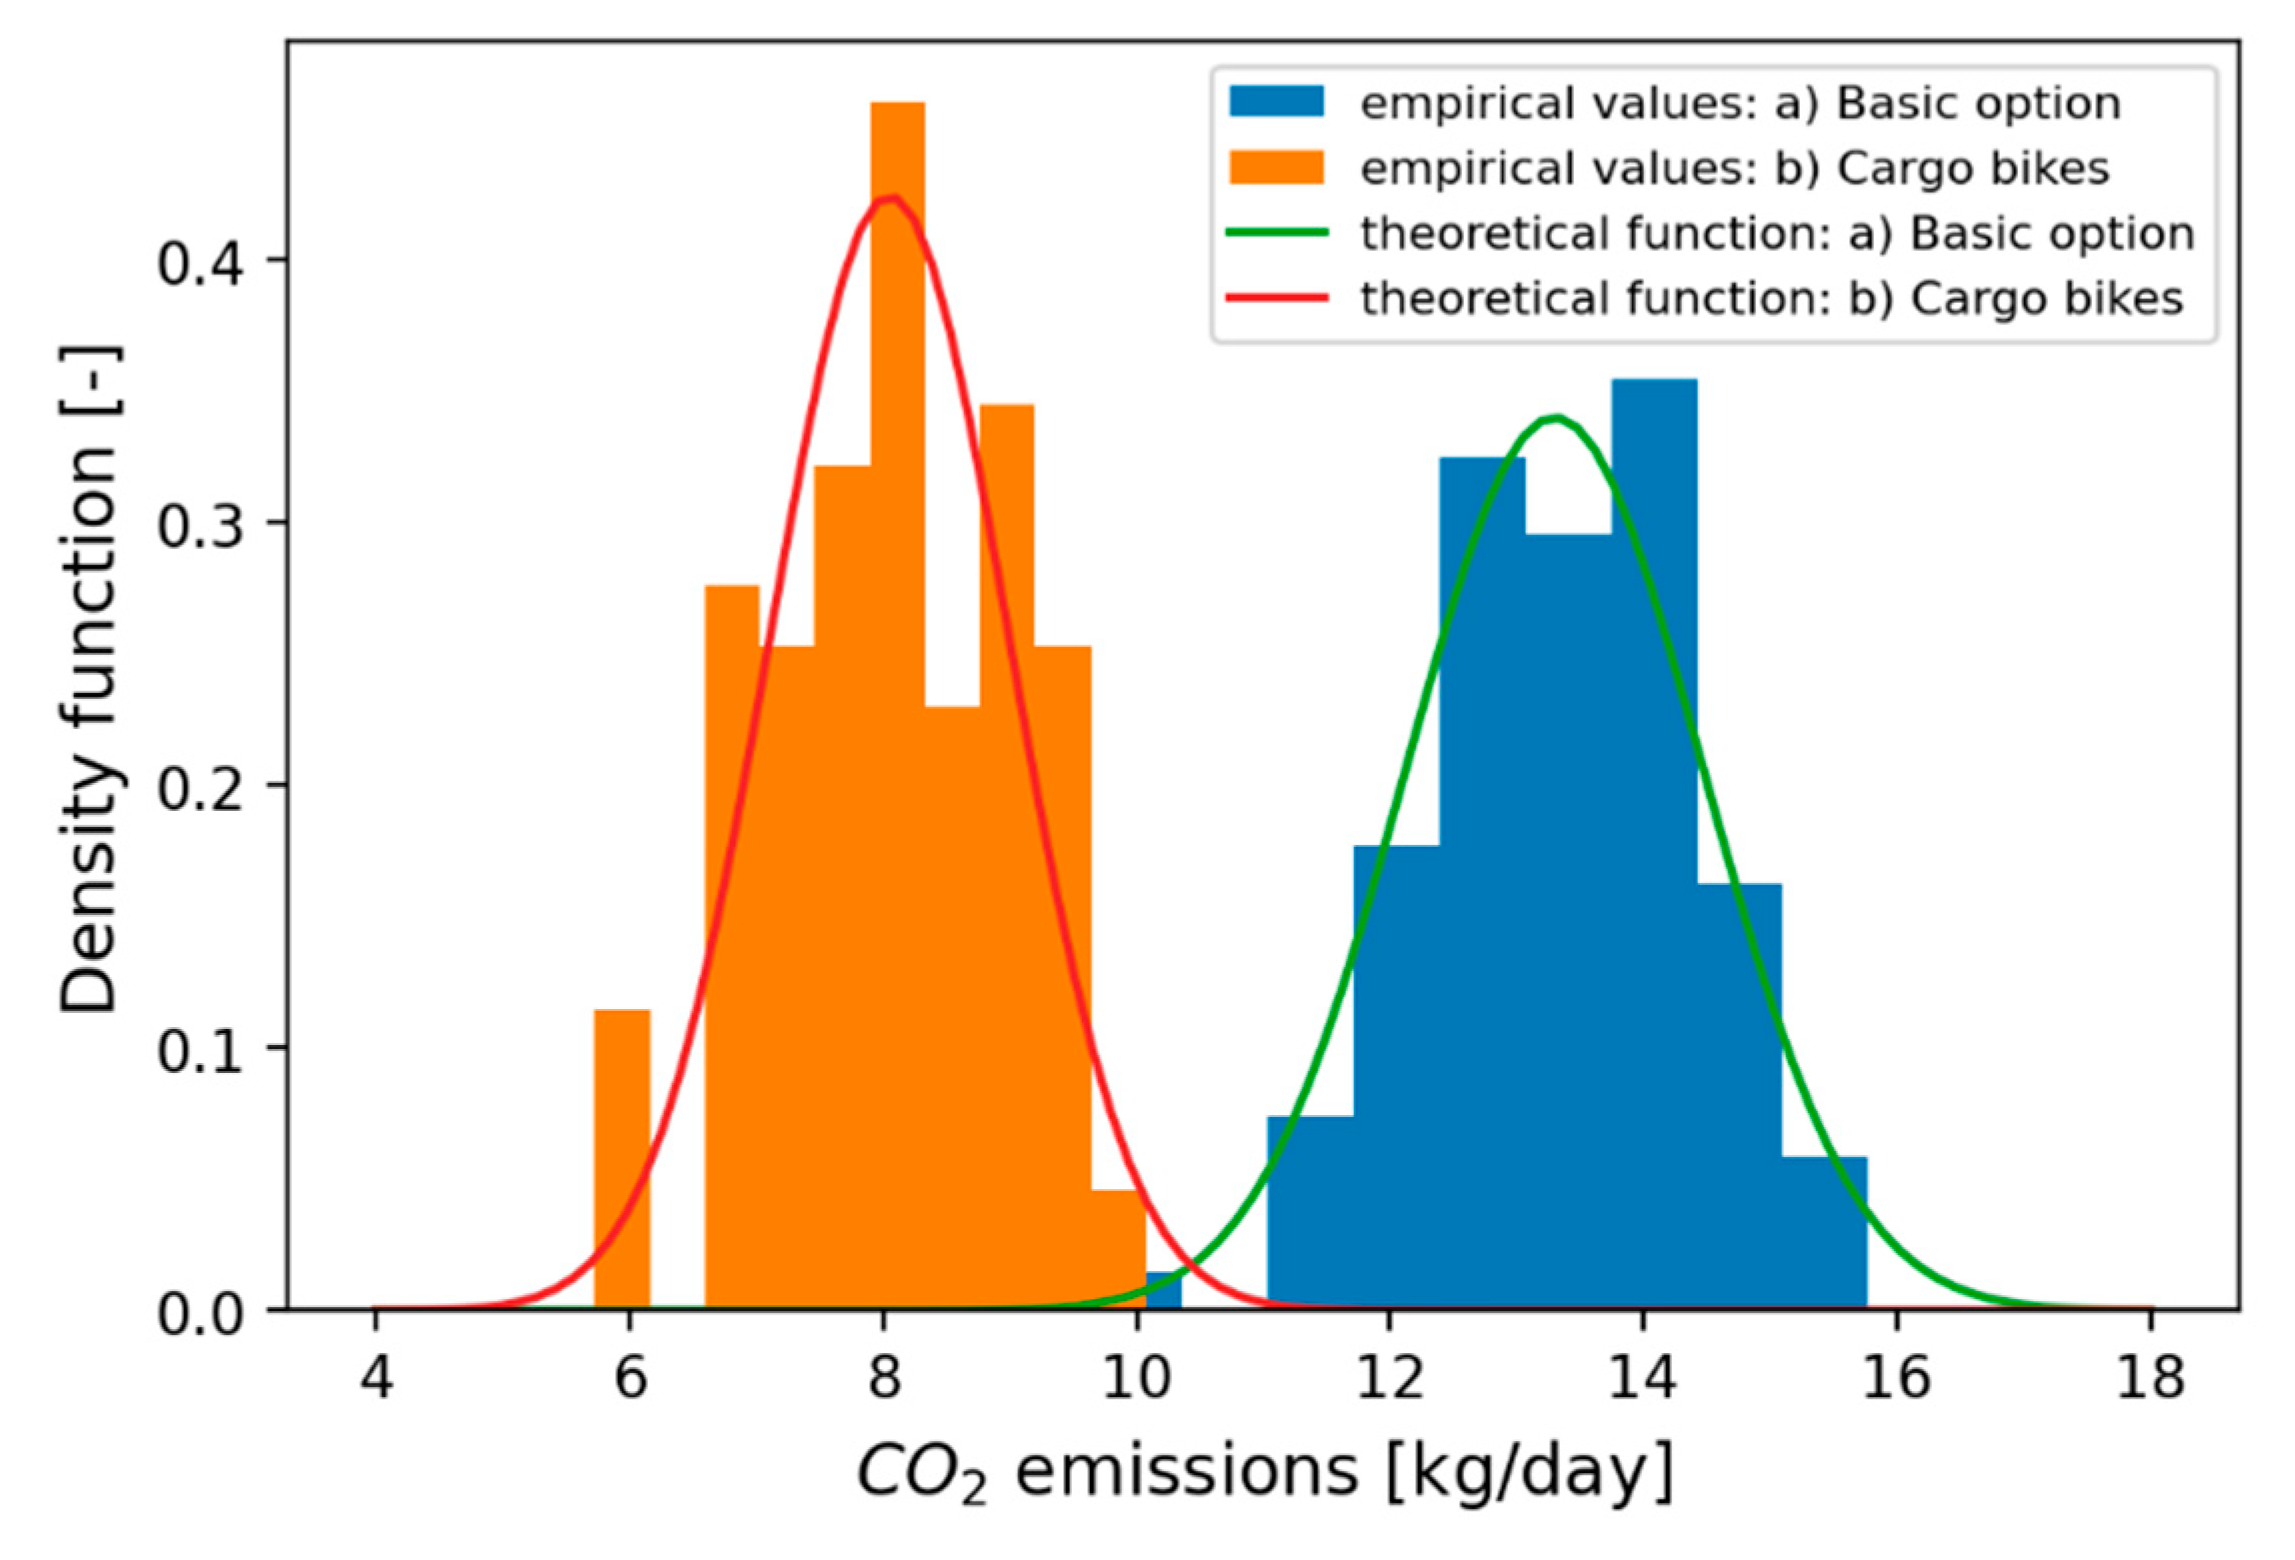
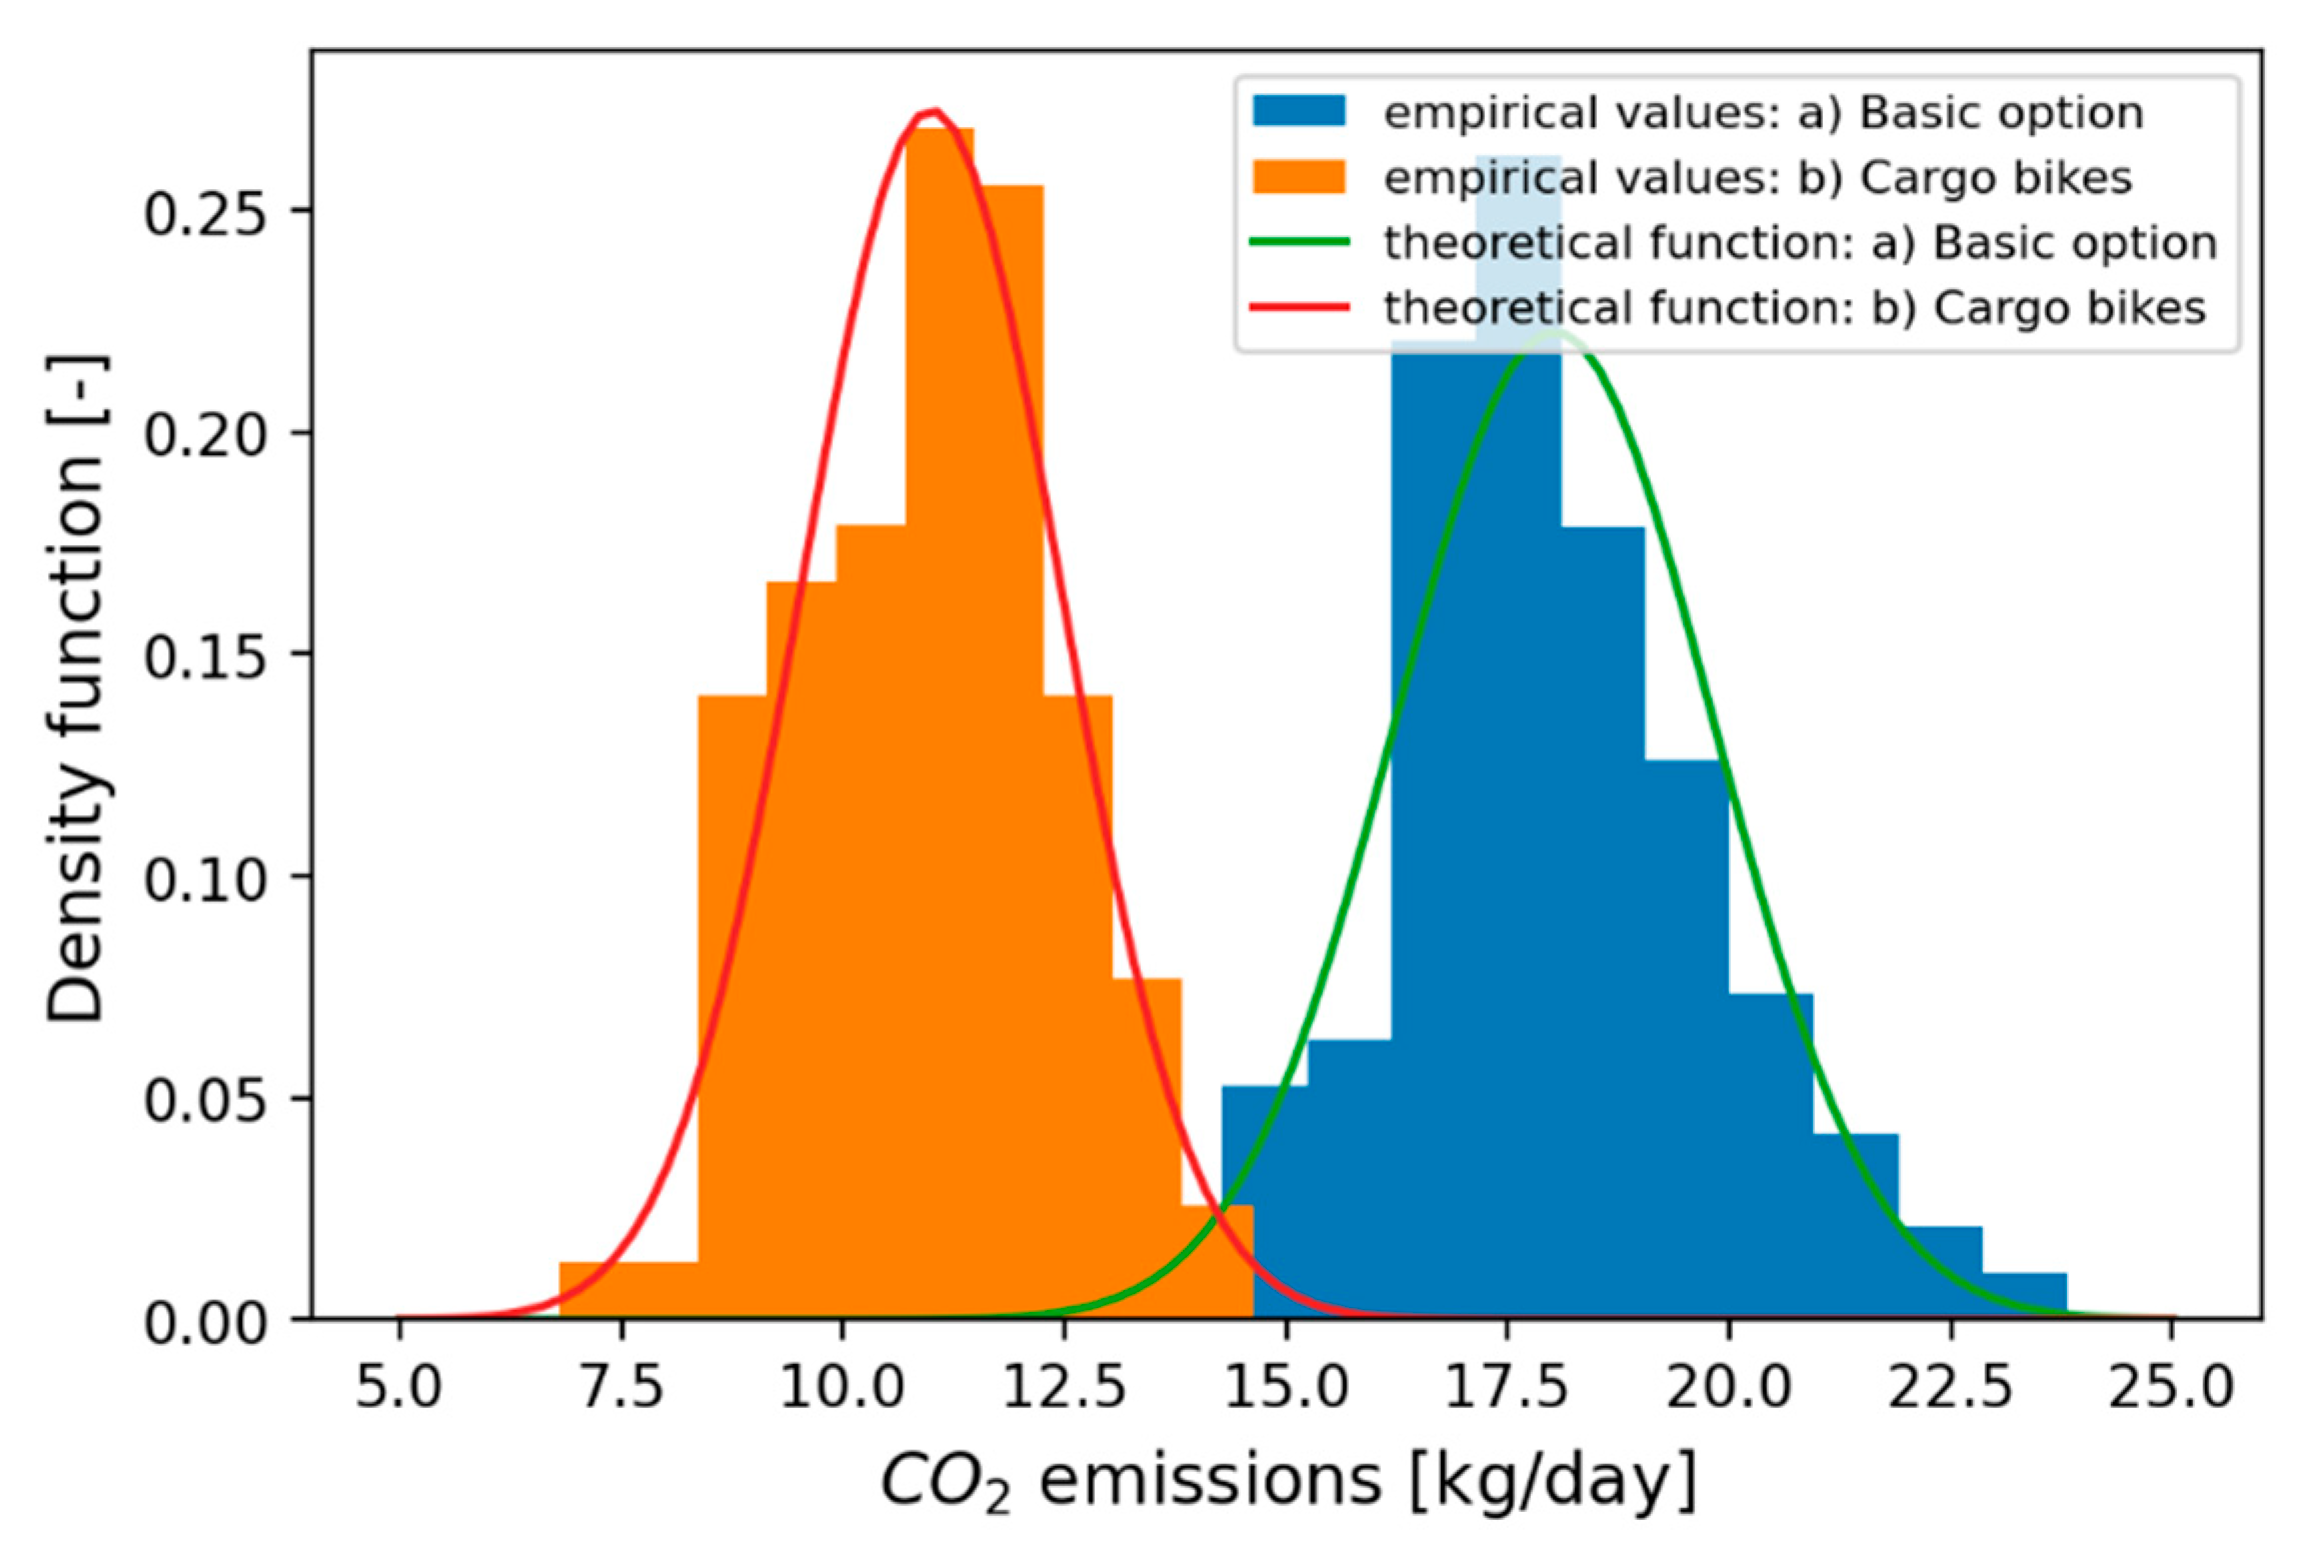
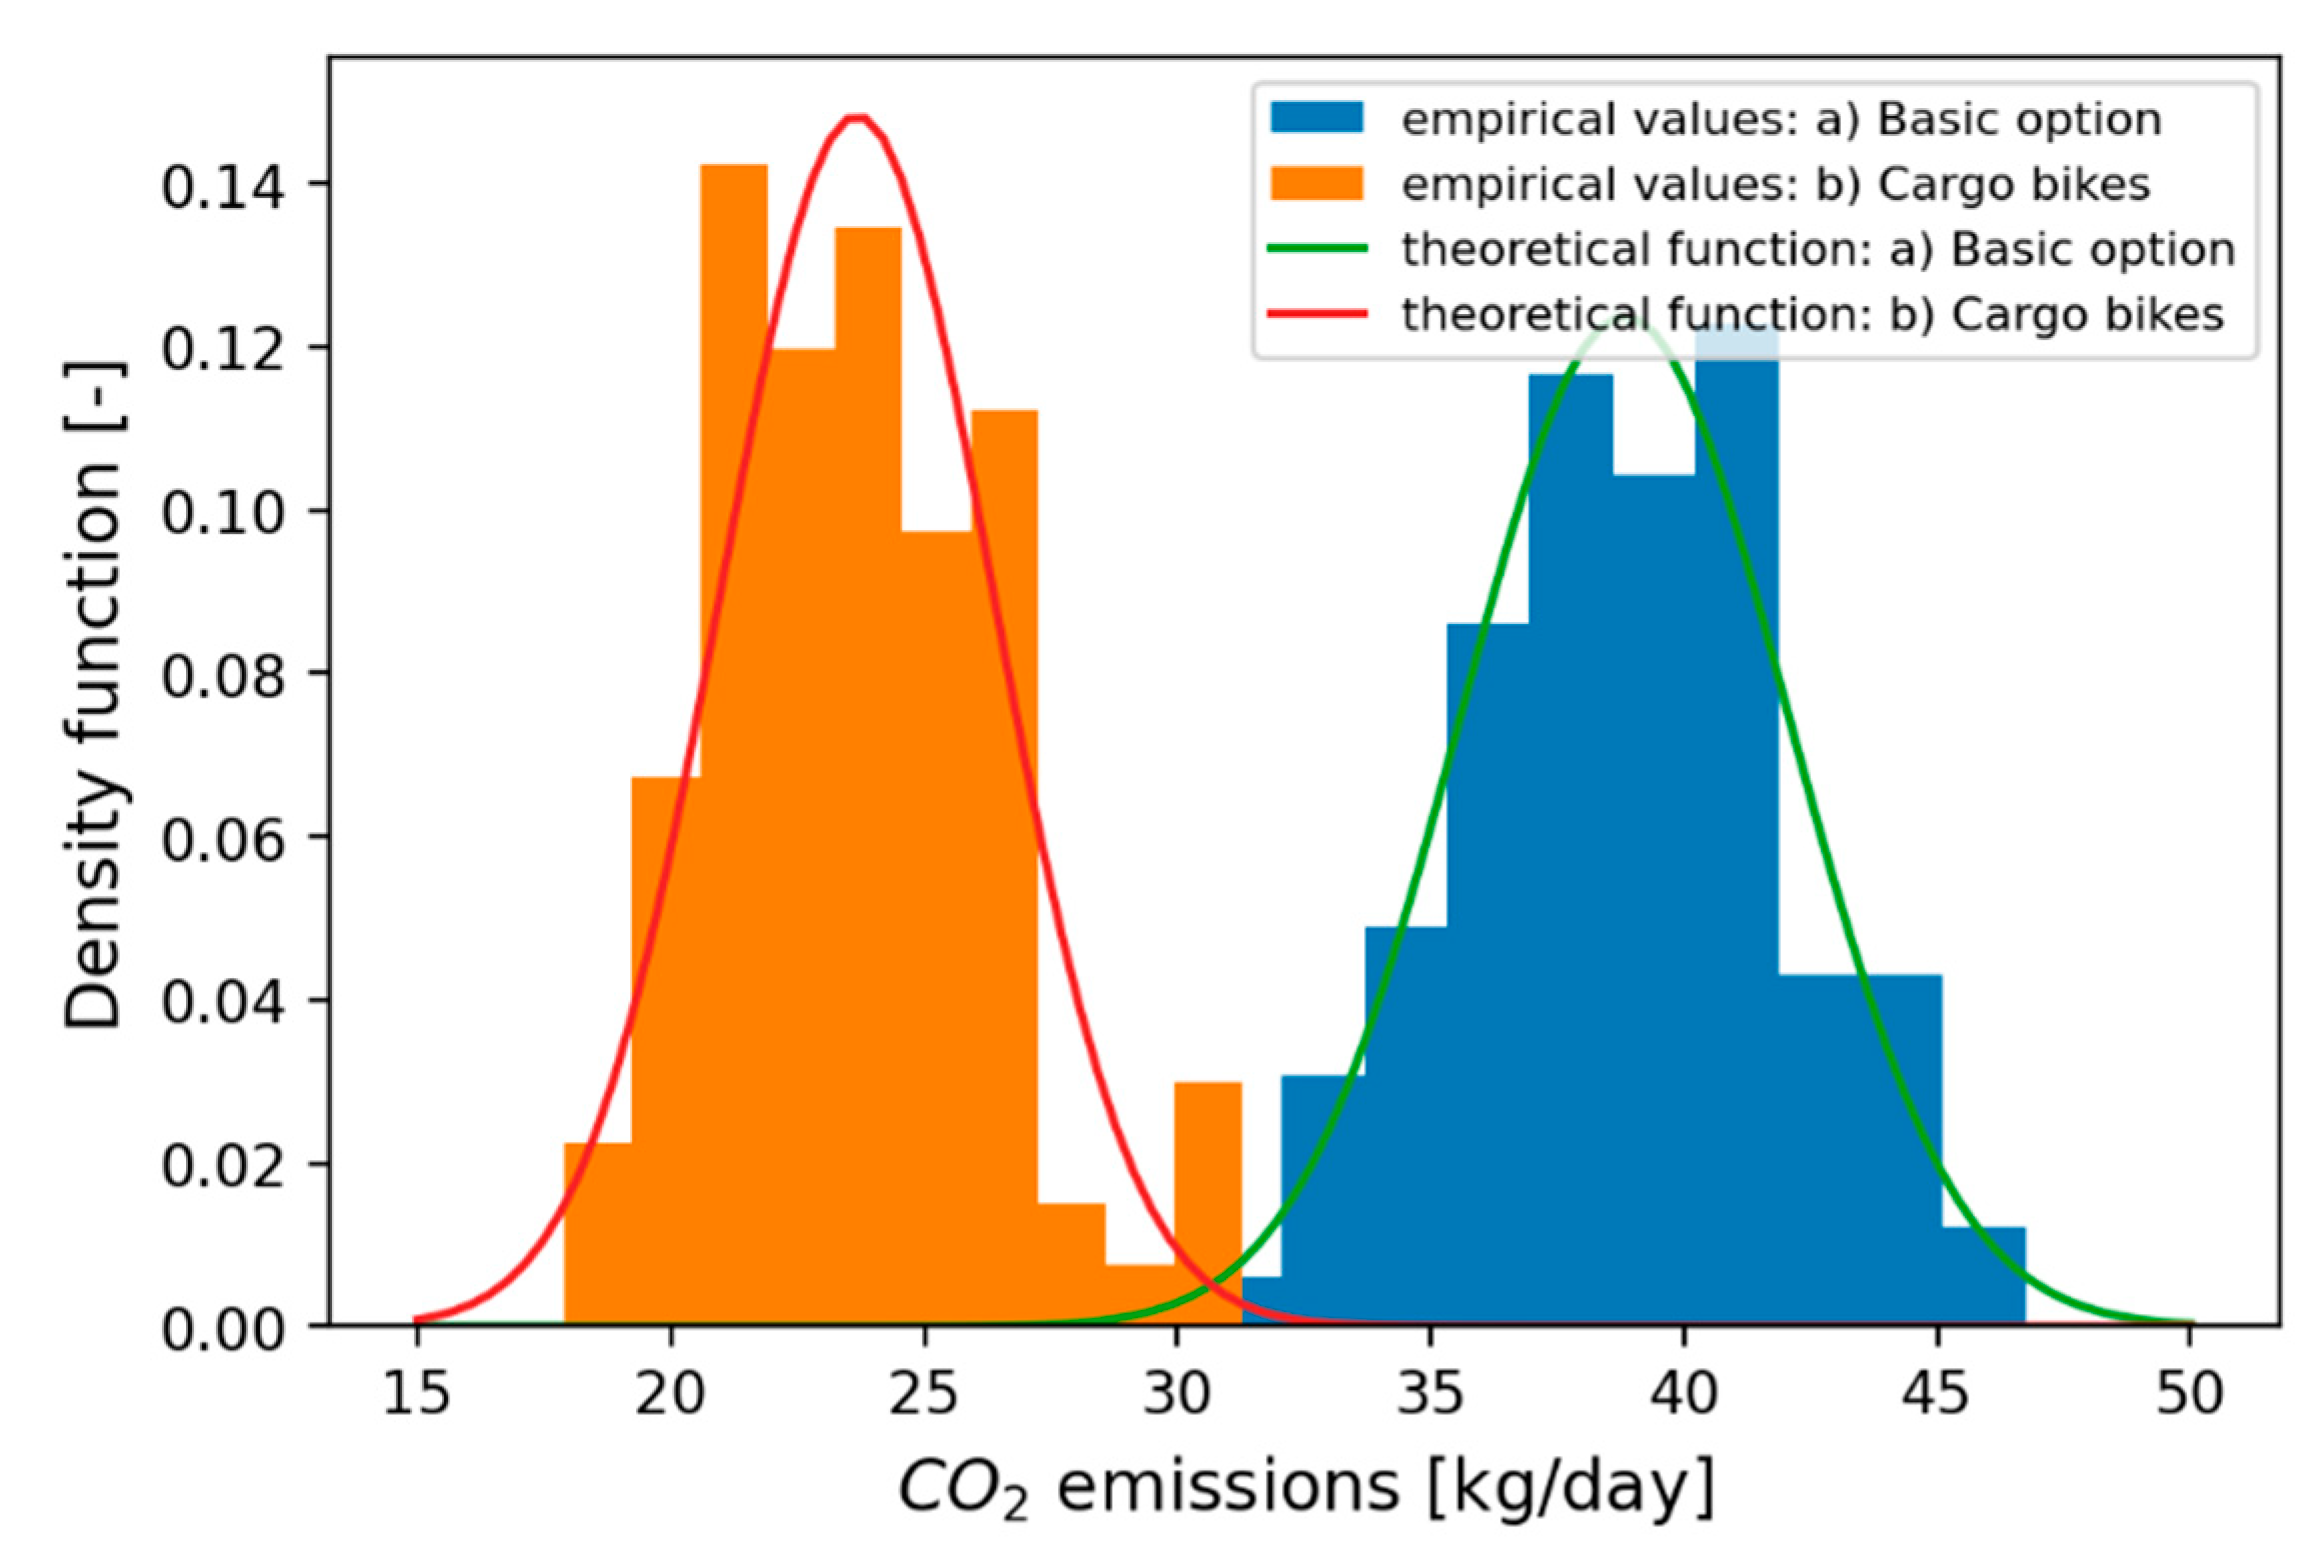
The results of simulations show numerically how much CO2 transport caused emissions may be reduced when cargo bikes are used as the auxiliary mean of transport for last-mile deliveries. For the Vitoria-Gasteiz central district, the reduction of CO2 transport emissions on average is 59.4%—from 11.103 to 6.601 kg/day. A similar level of carbon dioxide reduction is obtained for the central district of San Sebastian (60.5%). Despite the significant difference in the demand structure and the transport network configuration, for the Old Town of Dubrovnik and the central part of Mechelen, the results are the same—the transport caused CO2 emissions may be reduced on average by 61.0% if cargo bikes are used for the goods deliveries in the district.
The distributions of the random variable of CO
2 emissions for the CCCB partner cities are shown in
Figure 6,
Figure 7,
Figure 8 and
Figure 9. As the carbon dioxide emissions are derivative values of the total distance covered by vehicles, the distribution of the values of CO
2 emissions is normal as well (which could be observed in the graphs below).
It should be noted that, in the obtained samples of the values of carbon dioxide emissions, a part of the values for the scenario with cargo bikes are greater than the minimum value of CO2 emissions for the scenario with only conventional vehicles used for deliveries: for Vitoria-Gasteiz, the sample for the second scenario contains 13% of such values; for San Sebastian, this subset constitutes 17% of the sample; however, in the case of Dubrovnik and Mechelen, the number of such value is very small. These results can be explained by the bigger variance (relative to the average values) of the CO2 emissions for the scenario with cargo bikes used for last-mile deliveries.
5. Conclusions and Future Scope
The proposed methodology allows numerical estimation of the ecological effect of the cargo bikes use for deliveries in the selected city area. The developed approach considers the stochastic nature of demand for transport services (by generating random requests for deliveries) and the rational behavior of transport operators (by shaping delivery routes). The methodology and the corresponding software may be used by decision-makers and transport planners to substantiate the environmental efficiency of cargo bicycles as an alternative and innovative means of transport.
The developed approach to simulations of demand for deliveries is dedicated to modeling the processes of freight deliveries in a closed city area. The initial data for the proposed simulation procedure (the road network configuration and the structure of potential demand) can be obtained from the data of free-of-charge services provided by Google Maps or OpenStreetMap. However, additional observations are mandatory to estimate the traffic flows in the inlets to the considered city area (such data may be obtained from direct traffic counts or the devices for automatic traffic registrations).
The methodology to evaluate the environmental effect of cargo bicycles may be improved in the direction of ensuring the model’s adequacy, considering the wider range of the types of potential clients, and expanding the set of parameters that characterize requests for deliveries.
As the directions of further research, we consider the following tasks. The substantiation of values for the probabilities of requests’ appearance for different types of potential clients located in the serviced city area may be useful to develop practical recommendations for using the proposed methodology. Running the simulation experiment for different routing heuristics (the developed software implements only the Clarke–Wright algorithm) may help to obtain knowledge about the efficiency of the routing procedures in case of deliveries by cargo bikes. The assessment of functional dependencies of the distance covered by vehicles from the demand parameters (including probabilities of the requests’ appearance) for alternative routing heuristics may contribute to the evaluation of the areas of the most effective (from the perspective of the ecological effect) use of routing procedures for deliveries of goods by cargo bikes. Finally, the development of recommendations for the justification of the cargo bicycles use for last-mile deliveries in selected city areas will be useful for practitioners to decide on replacing the conventional vehicles with bikes.


