Article

Ultra-Cheap Renewable Energy as an Enabling Technology for Deep Industrial Decarbonization via Capture and Utilization of Process CO2 Emissions

1
Laboratory for Energy and NanoScience (LENS), Khalifa University, Abu Dhabi P.O. Box 127788, United Arab Emirates
2
Department of Mechanical and Industrial Engineering, NTNU Trondheim, 7491 Trondheim, Norway
3
R&D Center, Dubai Electricity and Water Authority (DEWA), Dubai P.O. Box 564, United Arab Emirates
4
Arctic Renewable Energy Center (ARC), Department of Physics and Technology, UiT, 9037 Tromsø, Norway
*
Author to whom correspondence should be addressed.
Energies 2022, 15(14), 5181; https://doi.org/10.3390/en15145181
Submission received: 24 May 2022 / Revised: 11 July 2022 / Accepted: 15 July 2022 / Published: 17 July 2022
(This article belongs to the Section B3: Carbon Emission and Utilization)

Abstract

:
Rapidly declining costs of renewable energy technologies have made solar and wind the cheapest sources of energy in many parts of the world. This has been seen primarily as enabling the rapid decarbonization of the electricity sector, but low-cost, low-carbon energy can have a great secondary impact by reducing the costs of energy-intensive decarbonization efforts in other areas. In this study, we consider, by way of an exemplary carbon capture and utilization cycle based on mature technologies, the energy requirements of the “industrial carbon cycle”, an emerging paradigm in which industrial CO2 emissions are captured and reprocessed into chemicals and fuels, and we assess the impact of declining renewable energy costs on overall economics of these processes. In our exemplary process, CO2 is captured from a cement production facility via an amine scrubbing process and combined with hydrogen produced by a solar-powered polymer electrolyte membrane, using electrolysis to produce methanol. We show that solar heat and electricity generation costs currently realized in the Middle East lead to a large reduction in the cost of this process relative to baseline assumptions found in published literature, and extrapolation of current energy price trends into the near future would bring costs down to the level of current fossil-fuel-based processes.

1. Introduction

While the falling costs of renewable energy sources [1], particularly solar photovoltaics and onshore wind, promise rapid and accelerating decarbonization of the electricity sector in the near future, there remain many other sources of carbon dioxide (CO2) and other greenhouse gas (GHG) emissions that must be mitigated in order to achieve deep decarbonization. At present, the technological capability exists to electrify much of the ground transportation and building heating sectors, along with many industrial processes that currently rely on on-site combustion for process heat. However, there remain large “stubborn” sources of emissions associated with activities central to the modern economy that cannot be addressed via renewable electrification alone. Most of these emissions are associated with heavy industry, including the production of metals (mainly iron and steel), petroleum products, chemicals, and cement. Direct emissions from industrial facilities account for about 20% of global CO2 emissions [2]. Of these, the most stubborn are process emissions that are released from chemical reactions central to a given process, rather than from energy production. These emissions inherently cannot be reduced by switching to alternative energy sources, and they account for about 6% of global GHG emissions [3]. Hence, the scale of the process emissions “problem” compares to that of fuel consumption in buildings and far exceeds that of air transportation, despite the substantially greater awareness of both emission sources in the popular discourse.
The persistent problem of industrial process emissions presents perhaps the strongest case for the implementation of carbon capture technology in the age of cheap renewable energy. While studies increasingly indicate the declining viability of carbon capture and sequestration (CCS) relative to renewable energy deployment as an approach to decarbonizing electricity generation [4], it likely represents the most cost-effective and practical means of decarbonizing industries that are large sources of process emissions, as it avoids the need to fundamentally reinvent widely used processes to reduce their carbon emissions. The feasibility of retrofitting industrial process units with carbon capture (CC) units employing mature and commercially deployed amine scrubbing technology has been demonstrated in numerous studies [5,6].
Due to the additional capital, operating, and energy costs, implementing carbon capture will inevitably raise the cost of the process in which it is deployed. The implementation of a carbon tax or price has been widely discussed in policy circles as a means of incentivizing this additional investment by appropriately counting the externalized cost of industrial pollution [7]. However, implementing this concept on a sufficiently large scale has proven more difficult as a political matter [8]. The currently dominant paradigm of carbon capture and sequestration involves injecting captured CO2 into underground reservoirs, where it is “sequestered” over long timescales. As injection alone represents a cost which provides no economic benefit in the absence of a carbon price or carbon capture credit, most captured CO2 is presently directed to the high-value application of enhanced oil recovery (EOR), where CO2 is injected into oil reservoirs to enable additional oil extraction and subsequently sequestered in the reservoir. However, this application will inevitably decrease dramatically in scale and value if deep decarbonization pathways, which depend on the near-elimination of fossil fuels as energy sources, are pursued [9]. Hence, it can be argued that the reprocessing of CO2 into useful products presents a clearer opportunity to gain economic value from captured emissions over the longer term.
We turn, therefore, to another, potentially more sustainable and more far-reaching approach to mitigating the cost of carbon capture, which has an element of thermodynamic elegance on its side: the reuse of captured CO2 in carbon capture and utilization (CCU) processes as a feedstock for the production of industrially useful substances including chemicals and fuels, which at present are primarily produced from fossil sources with considerable lifecycle emissions [10]. Implementing CCU for industrial process emissions on a large scale, based on concepts of industrial symbiosis that are increasingly being considered in the planning of industrial parks, could lead ultimately to the creation of a circular carbon economy or “industrial carbon cycle” where industrial carbon sources are balanced by a combination of industrial and natural sinks [11].

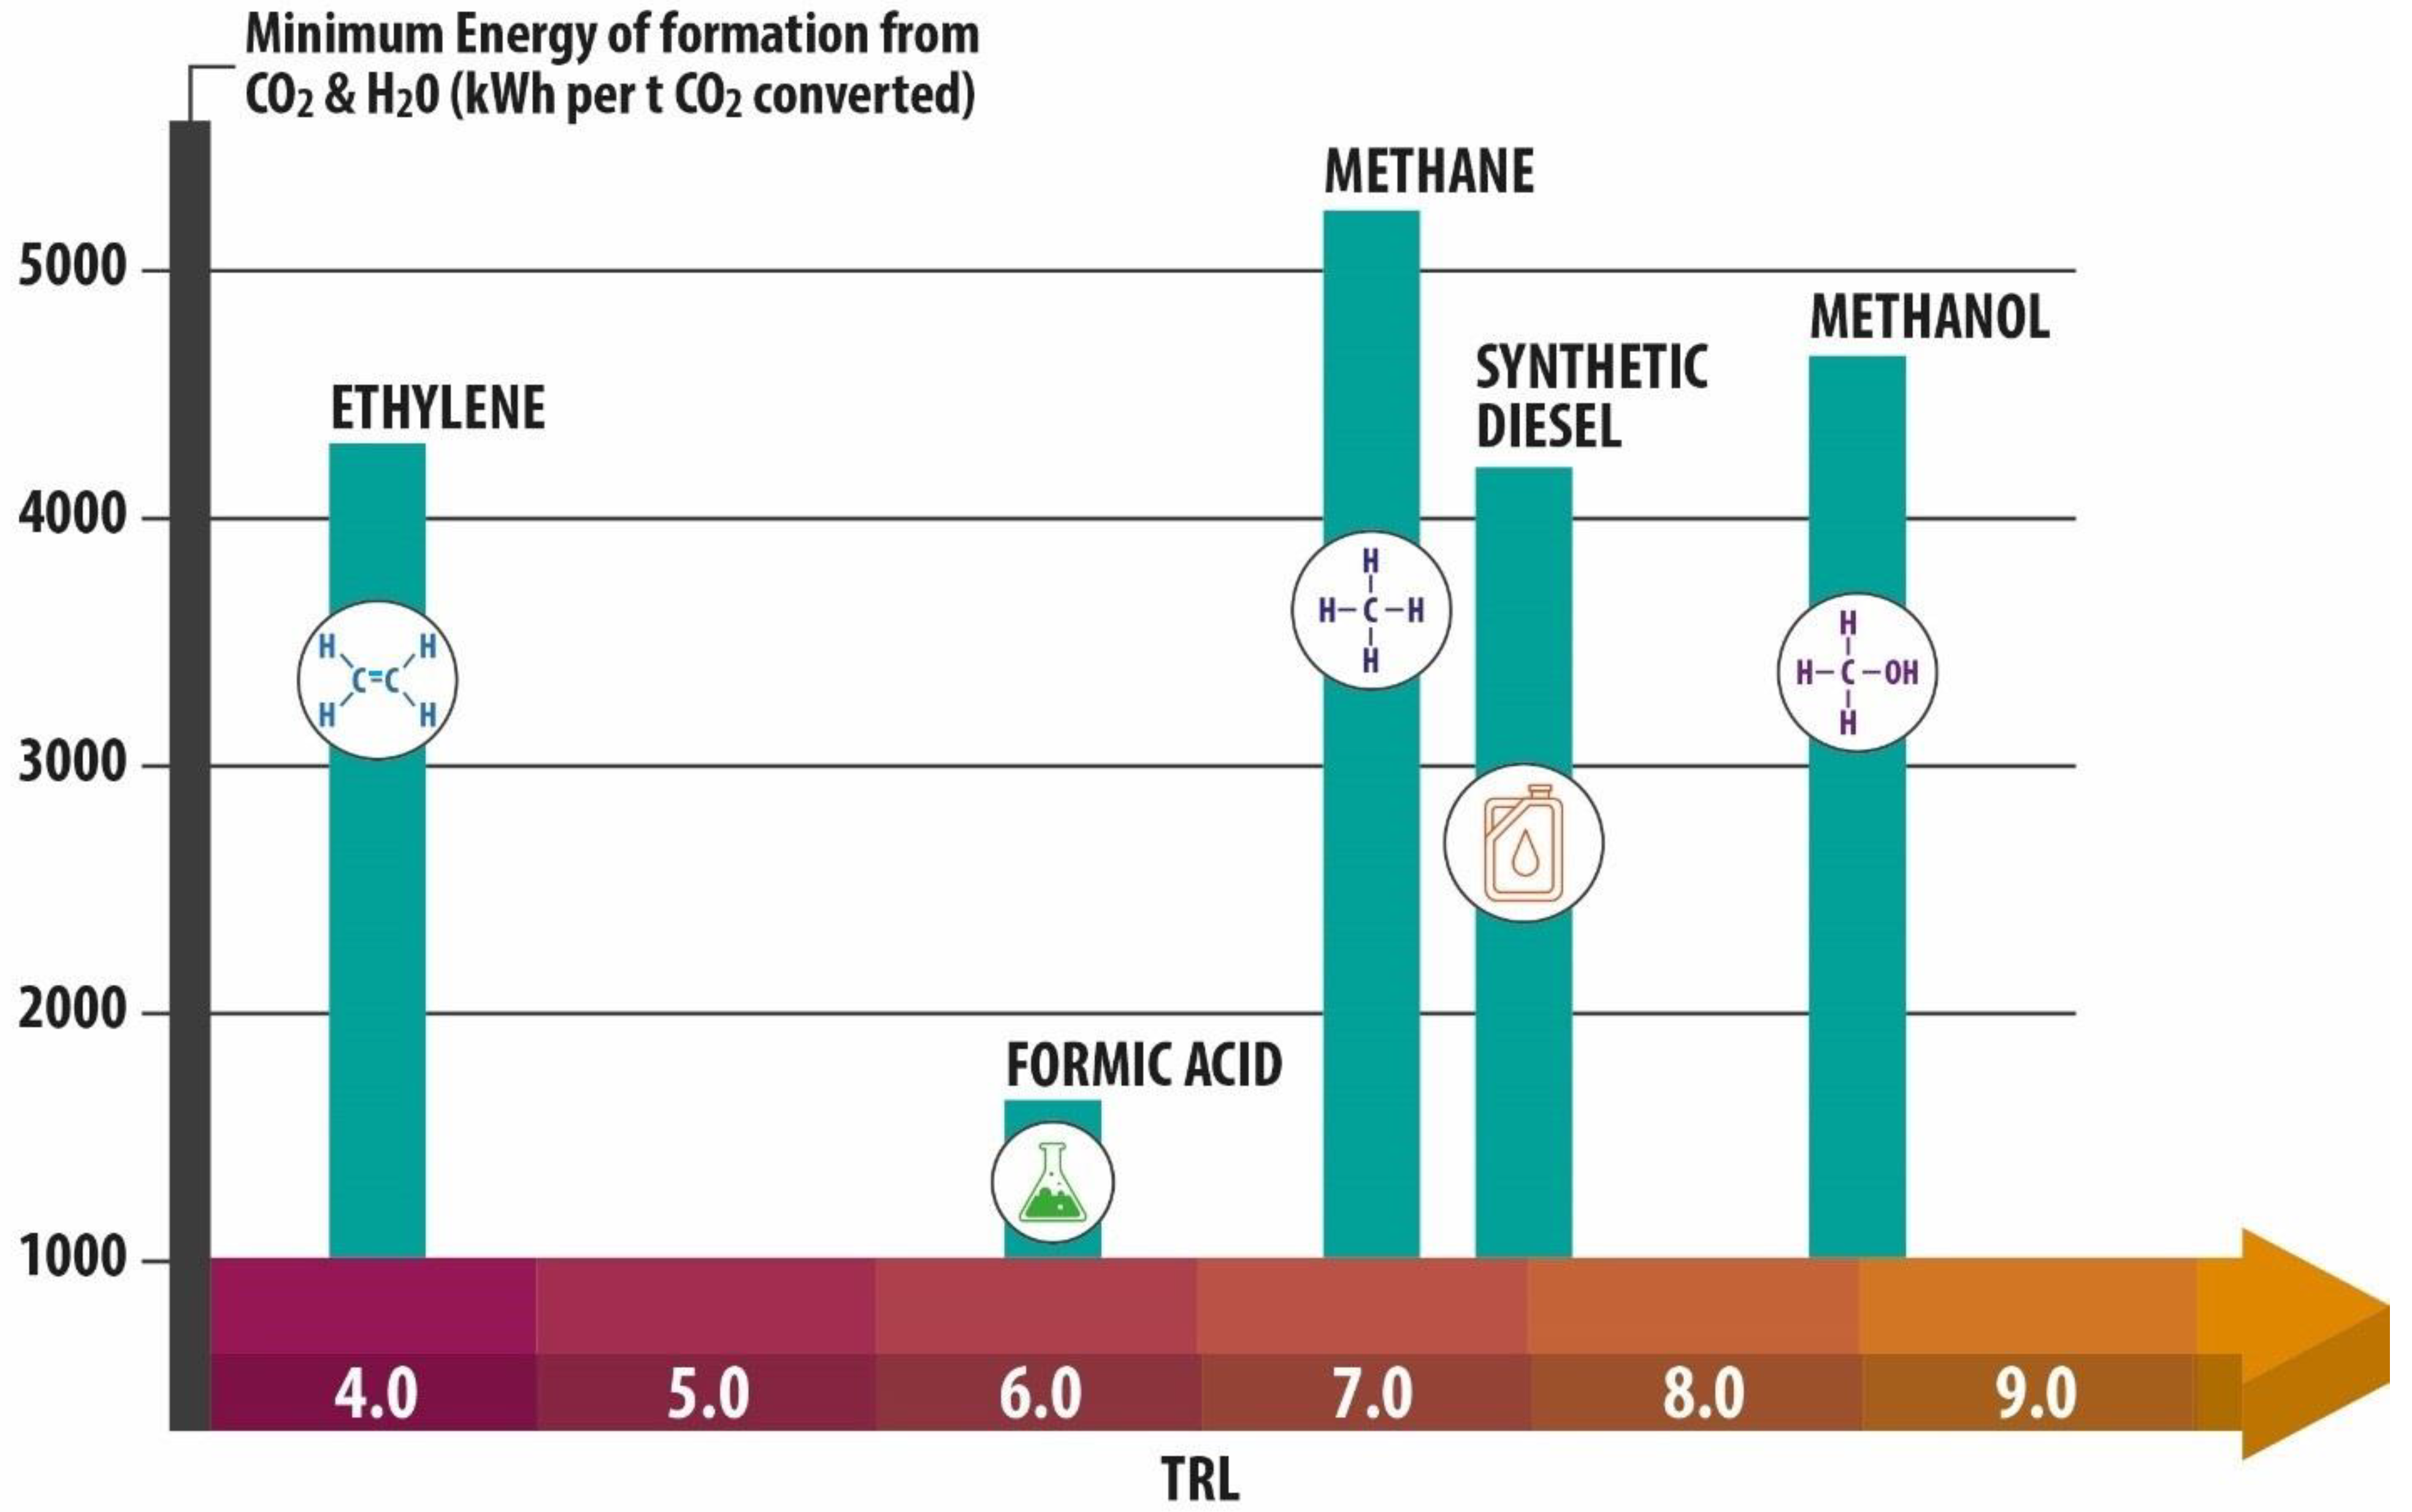
2. Capture and Industrial Utilization Pathways for Industrial CO2

The pathways via which CO2 is captured and utilized in industrial processes have been heavily discussed by other authors and are summarized here without attempting an exhaustive overview. In Figure 1, global industrial process emissions are broken down by source. Process emissions can be defined as direct emissions from an industrial facility that do not result from the combustion of fuel. A small number of industries are responsible for the majority of process emissions. The iron and steel industry, a major global emitter, is responsible for approximately 5% of all global CO2 emissions, although the majority of these are from combustion primarily in blast furnaces [12]. The largest source of process emission is the cement industry [13], accounting for approximately one-quarter of the total industrial carbon emissions, of which around two-thirds are process emissions from the transformation of CaCO3 to CaO to produce clinker (Figure 1) [13].
Oil refineries have the third highest industrial CO2 emission contribution [23]; however, as all decarbonization pathways include dramatic reductions in the use of fossil fuels in the near future, emissions from oil and gas processing should be expected to decline over the near term if decarbonization targets are met. Overall global CO2 emissions from hydrogen production via steam reforming of methane are estimated at 830 Mt/year; H2 is primarily used as a feedstock in the chemical industry today but has widely discussed potential as an energy carrier [24]. Lastly, ethanol produced by fermentation of sugar releases a pure CO2 stream, which does not require any separation step, accounting for ~45 MtCO2/year in the US alone [25]. There are differences in the concentration of CO2 in the emissions streams from each process, which directly effects the energy requirement for CO2 separation (Figure 1).
Post-combustion CO2 capture from exhaust gas via amine absorption/regeneration is mature carbon capture technology applied to power plants, and numerous studies have been undertaken to evaluate its application to industrial processes [26]. Industrial reuse pathways for captured CO2 include production of building materials via mineral carbonation [27], CO2-to-fuel processes, and CO2-to-chemical pathways ranging from highly mature processes such as the production of urea for synthetic fertilizers [10] to a variety of experimental processes only now being developed in laboratories [28]. CO2-to-fuel pathways provide an indirect reduction in CO2 emissions if they are used to displace fossil fuels; if the produced fuels are used for stationary combustion, the emissions can also be directly sequestered via CCS at the combustion facility. Methanol has received particular interest as a stable liquid chemical which can be used as fuel and as feedstock for obtaining ethylene, dimethyl ether, and other industrial chemicals.
The data shown in Table 1 illustrate the demand for different chemicals and the potential to capture and utilize carbon dioxide if those chemicals are made using captured emissions. However, projections indicate that these applications could expand to have combined utilization potential of more than 5 GtCO2/year by 2050, offsetting essentially all current industrial process emissions [29]; as many of the applications are fuels, these products would need to replace fossil fuels in order to realize an overall reduction in CO2 emissions. Taking into account CO2 capture, synthesis of the final product, and the production of other inputs such as hydrogen, the energy requirements of a circular carbon economy would be substantial. Figure 2 displays the energy of formation of various end-products, representing the absolute minimum energy requirement; the technology readiness level (TRL) for each product is also indicated.
Table 1. CO2 utilization potential for different reuse pathways [30].
ChemicalProduction YearMt of Product/YearTon CO2 Required/Ton of ProductCO2 Utilization Potential Mt CO2/Year
Urea2019 [31]180.90.735132.9
Methanol2020 [32]83.81.373115
Methane20171100–15002.753000–4000
Calcium carbonate2020 [33]900.43939.51
Ethanol2018801.911152.8
Sodium carbonate2018620.41525.73
Dimethyl ether2020 [34]91.91117.2

3. Carbon Capture and Utilization with Low-Cost Renewable Energy

3.1. Carbon Capture and Utilization

To gain a clearer picture of the energy requirements of the industrial carbon cycle, we consider an exemplary CCU pathway consisting of a particular “stubborn” emission source and a nearly mature process for its reuse. For good measure, we consider a product than can, in principle, be fed back into the original “source” process, in this case as a fuel for combustion. We consider possibly the most stubborn emissions source, the cement industry. With consumption stable, two-thirds of emissions coming from the process [5], fairly high CO2 concentrations in the exhaust streams and major process modifications unlikely in the conservative and cost-sensitive construction industry, emissions from cement production are an ideal target for carbon capture. We consider the capture of CO2 emissions via amine scrubbing of cement plant exhaust gas, for which technical analysis was performed in depth by previous authors [6,37]. We assume the use of solar thermal energy to meet the requirements of the amine regeneration process [38]. CO2 capture cost is based on the inputs shown in Table 2, which were obtained using data presented in [5], and the captured CO2 is directed to the production of methanol [39]. Methanol and its derivatives can work as fuel on existing engines with little or no modification and can play an important role in the adoption of carbon-neutral fuels for transportation and aviation sector [40]. Methanol′s stability at ambient conditions, with a higher energy content per unit volume when compared to H2 and favorable logistics, gives it an advantage as an energy storage medium; existing global supply chains for conventional fuels can be used for methanol storage and transportation [41]. Methanol is produced by catalytic hydrogenation of CO2, a process consisting of three reactions; in reaction (R1), methanol is formed by hydrogenation of CO2; the CO formed in reaction (R2), which is not desired, is then reacted with H2 to produce more methanol (R3) [42,43].
CO2 + 3H2 ⇌ CH3OH + H2O.
CO2 + H2 ⇌ CO + H2O.
CO + 2H2 ⇌ CH3OH.
A total of 41,000 std·m3/h CO2 is supplied at ambient temperature and pressure, and H2 is fed at a pressure of 25 bar and ambient temperature with a flow rate of 123,000 std·m3/h to the reactor. The temperature and pressure in the reactor are kept at 76 bar and 210 °C; in this catalytic hydrogenation process, Cu/ZnO/Al2O3 is used as a catalyst [43]. This process requires H2, which we assume to be “green” hydrogen produced by solar-powered electrolysis (Table 3). This introduces additional cost and energy consumption inputs, which we posit according to the current state of the art. A more thorough assessment of the economic prospects of green hydrogen production can be found elsewhere [44,45,46] and will be further addressed in future work.

3.2. Determining Renewable Energy Cost

We now consider the impact of current solar energy prices in the United Arab Emirates, one of the leading markets for low-cost, large-scale solar energy projects, which is increasingly expanding into solar fuel production and a solar-driven industry. All thermal energy or steam requirements are assumed to be provided from the solar heat system; electricity requirements are provided by a mix of photovoltaic (PV) and concentrated solar power (CSP). This recognizes that the facilities being considered are expected to run at high capacity factors (>90%), whereas the AC capacity factor for solar photovoltaics in the region is only 30–35% (as modeled at 32% in a previous study) [47]. CFPV and CFProcess are the capacity factors of the PV power facility and the process being powered, respectively. P P V and P C S P represent prices of photovoltaic (PV) and concentrated solar power (CSP) electricity. CSP with overnight thermal storage is used to cover any energy demand that cannot be covered by PV. We assume that the plant operates at full capacity when PV is available to take advantage of the cheapest electricity. The overall electricity price can, in principle, be lowered by reducing operations at night; in this case, there will be a tradeoff between lower electricity prices and slower payback of capital costs.
Therefore, we rely on a mix of PV and concentrated solar thermal power plant with thermal energy storage (CSP + TES) electricity, where the electricity price ( P e l ) is given by
P e l = C F P V P P V + ( C F p r o c e s s C F P V ) P C S P C F p r o c e s s
In the models used in this study, capacity factors of 90% are initially assumed for all components of the system (cement, hydrogen, and methanol plants). In setting solar thermal and electric prices, we use the power purchase agreement (PPA) prices as benchmarks for most recently awarded contracts in two solar technologies: 1.35 US cents/kWh for daytime electricity from photovoltaics (Abu Dhabi’s 2GW Al Dhafrah project) and 7.3 US cents/kWh for overnight electricity from CSP + TES in Dubai’s Mohammed bin Rashid Al Maktoum solar park [48]. We can also make an estimate of the cost of 24 h solar heat collected from a parabolic trough array and stored by noting that the power block at present represents about 25% of the total cost of a CSP + TES plant, according to the latest available data, and that solar-to-thermal efficiency under local conditions is about 3× greater than solar-to-electric efficiency, giving a cost of solar heat of 1.8 US cents/kWh. Bottom-up analysis by Widyolar et al. suggested that lower-temperature solar heat could be provided by a non-imaging collector array coupled to a thermal storage block at <1.5 US cents/kWh [49]. We carry these values through the carbon capture, hydrogen, and methanol process models.
Taking the PV plant capacity factor as 32%, we have a weighted average electricity cost using Equation (1).
P e l = 0.32 × 1.35 + ( 0.90 0.32 ) 7.3 0.9 = 5.18   US   cents / kWh .
In the first scenario, energy costs for all the models are set to an electricity cost of 7 US cents/kWh and a steam/heat cost of 3 US cents¢/kWh. In the second case, electricity costs of 5.2 US cents/kWh and 1.8 US cents/kWh for solar steam are assumed (case 2). We subsequently apply our cross-model harmonization to financing costs as well, considering a discount rate (r) of 4%, close to that estimated for solar energy projects in the UAE, across the entire project (case 3). The discount rate can be taken as internal rate of return (IRR) or weighted average cost of capital (WACC) for a project with known financing terms. We then consider possible future scenarios as renewable technology costs continue to fall as the overall electricity price drops to 1.5 US cents/kWh and heat price drops to 0.5 US cents/kWh (Table 4).

3.3. Levelized Cost of CO2 Capture and Methanol

To model the dependence of methanol production costs on energy costs, we implement an integrated model of CO2 capture via amine scrubbing from a Portland cement production facility, hydrogen production by PEM electrolysis, and methanol synthesis via the pathway described by Van-Dal and Bouallou [42]. The capital and operational costs of the methanol synthesis process are taken from the work of Perez-Fortes et al. [43], and those for CO2 capture are taken from the CEMCAP technoeconomic model first presented by Gardarsdottir et al. [5]. These cost components were implemented in a levelized cost model where the levelized cost of captured CO2 is given by
L C O C O 2 = C a p E x + i = 1 N O & M i ( 1 + r ) i + i = 1 N E i ( 1 + r ) i i = 1 N C i ( 1 + r ) i ,  
where O&Mi is the operation and maintenance cost, Ei is the total energy cost, r is the discount rate, and i represents the year, ranging from 1 to N, where N is the life of project in years, and Ci represents CO2 captured in year i.
The levelized cost of methanol is given by
L C O M = C a p E x + i = 1 N O i ( 1 + r ) i + i = 1 N H 2 i ( 1 + r ) i + i = 1 N C O 2 i ( 1 + r ) i + i = 1 N E i ( 1 + r ) i i = 1 N M i ( 1 + r ) i ,
where Oi is the operating cost, H2i the cost of hydrogen inputs, and CO2i is the cost of CO2 inputs in year i. Ei is the total energy cost in year i, which can be further divided into an electrical and thermal component. Mi represents the total methanol production in year i, and r is the discount rate. Thermal energy dominates the energy consumption of CO2 capture, while both thermal and electrical energy inputs are significant in the methanol synthesis process. Both electrical energy and thermal energy are assumed to derive from thermal sources, and the price per kWh of each of these energy components is set according to real-world experience with large-scale solar projects in the United Arab Emirates. The discount rate r encompasses financing costs and can be understood as the interest rate on a debt-financed project, the internal rate of return on an equity-financed project, or the weighted average cost of capital combined debt and equity financing. The studies used for our base case described uses a discount rate of 8%; however, we reduce this to 4% in later cases in keeping with recent global experience in renewable energy finance. The cost of H2 production is separately determined using an NREL model for a PEM electrolysis system producing 250 metric tons of H2 per day [50], for which model inputs are listed in Table 5, and the full set for model input methanol production and carbon capture is listed in Table 2 and Table 3.

4. Results and Discussion

4.1. Declining Cost of Renewable Methanol

In order to establish a baseline case, we harmonize the energy costs of the CC, H2, and methanol synthesis models to an electricity cost of 7 US cents/kWh and a steam cost of 3 US cents/kWh; carrying these values through the model gives baseline costs for CO2 capture, H2, and CH3OH of 69, 4776, and 1173 USD/ton respectively, at a discount rate of 8%. For methanol, this compares to a market price of 300–500 USD/ton as of March 2021 [51].
In the second case, the discount rate is kept the same, but energy costs are matched to what is currently being seen in UAE; an electricity cost of 5.2 US cents/kWh and a steam cost of 1.8 US cents/kWh are applied to the model, giving costs for CO2 capture, H2, and CH3OH of 54, 3743, and 937 USD/ton respectively. To take into account the current state in renewable energy finance, especially in the Middle East, the discount rate is brought down to 4%, while energy costs are kept at the same level as previous case. With these parameters applied to the model, the costs achieved for CO2 capture, H2, and CH3OH are 54, 3743, and 937 USD/ton, respectively; with both energy and finance parameters comparable to what is seen in UAE, this case can be seen as representing the current situation.
In the last scenario with a decline in the cost of renewable energy electricity cost to 1.5 US cents/kWh and a steam cost of 0.5 US cents/kWh, the cost of CO2 capture falls to 31 USD/ton, and the cost of methanol synthesis falls to 416.99 USD/ton, comparable to current market prices. This is without considering likely future reductions in capital and operating costs for carbon capture, electrolysis, and methanol synthesis in the future as these technologies become more mature. The model outputs for the different conditions above are displayed in Table 6.
The National Energy Technology Laboratory (USA) reported methanol production costs using coal and natural gas within the range of 396–469 USD/t for coal and 311–345 USD/t for natural gas (NG at 6 USD/MMBtu). They also noted, through a detailed breakdown of methanol production costs, that the fuel costs account for ~60% of the selling price of methanol [52]. Another notable study [53] established the production cost of methanol in different geographies (Europe, Middle East, and America) and also noted the significant contribution of feedstock costs to the overall methanol production cost [54]. We consider natural gas-based SMR production of methanol as our point of comparison. We note the historic ranges of natural gas prices over the last 25 years (2–12 USD/MMBtu) and consider a median price of 8 USD/MMBtu, which was observed in 2022. This corresponds to a methanol price in the range of 400–450 USD/t. Several other technoeconomic studies also used this range as the benchmark price range for economic viability when making comparisons for alternative production routes [43,55].
It is worth noting that that largest single contributor to methanol production cost is actually the price of hydrogen. This is expected as 1 kg of CH3OH requires 0.199 kg of H2 and 1.49 kg of CO2 to produce, giving a ratio of ~7.5 between CO2 and H2 for producing methanol, whereas the unit cost of H2 production is ~70× greater than that for CO2 capture. In Figure 3, we show the breakdown of methanol synthesis cost for fixed (Capex + maintenance/upkeep + financing), H2, CO2, and direct electric and direct heat costs. This makes clear the impact of hydrogen production costs on the viability of this pathway for CO2 reuse. Briefly, considering a scenario in which all electricity comes from PV and the electrolysis facility is operated only when electricity is available (CF = 32%), the H2 production cost climbs to 2.42 USD/kg H2 and the MeOH cost climbs to 611 USD/ton, when the electricity price is 1.35 US cents/kWh. In a possible near-future scenario where the electricity price falls to 1 US cents/kWh and the capacity factor climbs to 40%, for example by the inclusion of short-term battery storage in the PV plant, the H2 and MeOH costs would become 1.90 USD/kg and 504 USD/ton, respectively. This benchmark is already being approached in the Middle East, with Saudi Arabia’s recent announcement of a 0.0104 USD/kWh price for a 600 MW PV project [56].

4.2. Energy and Hydrogen Costs in the Circular Carbon Economy

In this analysis, we considered the production of methanol from captured CO2 as it is a mature process with a high technology readiness level of 9; the process of methanol production using captured CO2 is well understood and can be rigorously modeled on the basis of real-world experience. CRI (Carbon Recycling International) successfully set up an industrial-scale CO2-to-methanol plant in Iceland, where captured CO2 from a geothermal plant is converted to methanol. The annual CO2 recycling capacity from this plant is 5500 MT. A similar setup is being designed by CRI for coke oven gas production facility in Henan Province, China. Once completed, the plant is estimated to recycle 160,000 MT of CO2 every year [57]. The strong dependence on the cost of hydrogen production slightly obscures the CO2-related aspects of the study; however, this itself is instructive and can be straightforwardly removed if desired. Figure 4 shows the breakdown of MeOH, CO2, and H2 costs for “baseline”, current, and near-future target renewable energy costs as modeled above. The CO2 and H2 capture/production costs themselves have strong dependence on the heat and electricity costs, respectively, and the direct dependence of the methanol synthesis process on energy cost is substantially less. Approximately 83% of total cost in production of green hydrogen is spent on electricity requirements, whereas 43% of total cost in the MEA-based carbon capture system for a cement plant is spent on fulfilling the thermal energy requirement. The share of direct electricity and heat in the production of methanol is around 1%, but energy costs have a strong indirect impact on methanol costs, as hydrogen accounts for 81% of the total cost of methanol.
While not the largest cost contributor in this scenario, the issue of CO2 capture costs is worth considering specifically. Previous analysis, on which the CO2 capture component of our model is based, assumed a levelized cost of steam of roughly 3 US cents/kWh, for a modeled cost of CO2 capture of 69 USD/ton (CO2). Dropping this steam price to 1.8 US cents/kWh as described previously brings the cost of capture to 54 USD/ton; lowering this further to 1 US cents/kWh (a reasonable near-future target) gives 38 USD/ton. These values can be considered in the context of carbon taxes [58]. At present, the carbon tax of Norway (one of the world’s highest) sits at about 70 USD (2021) and is expected to reach 240 USD by 2030 [59]. Capturing CO2 under the baseline assumptions would be a break-even proposition at best. However, falling energy costs stand to make the proposition far more attractive in general. This is before considering the potential to add value through reprocessing of carbon into useful products.
When considering the economics of CO2 reuse, the strong dependence on the price of hydrogen in our exemplary system is not a sidenote but in fact a common feature that must be considered in many applications. While uses of CO2 exist that do not involve hydrogen, such as carbon-curing of building materials or carbon fertilization of biomass, in addition to well-established enhanced oil recovery methods, many of the potentially most valuable applications, including production of urea, methanol, and other chemicals and fuels, depend heavily on it. Furthermore, hydrogen production by electrolysis is the primary way that electricity prices enter into the model; both CO2 capture and MeOH synthesis are primarily driven by thermal energy, which we assume in this analysis to come from solar thermal collectors. From the solar energy perspective, it should be noted that there is another potential source of solar heat, which is simply to couple electric boilers to an oversized PV array and “curtail” the excess electricity produced by running the boilers to produce heat, which is then stored for use as needed. While this requires more land area than capturing solar heat directly (due to the lower efficiency of PV modules), it has the advantage of being able to generate heat at the point of use using an on-site boiler. Current economics and the specific requirements of different projects will dictate the appropriate solution for a given system.

4.3. Effect of Electrolyzer Efficiency, Cost and Stack Life, and Electrolyzer on Cost of Methanol Production

Using our integrated CCU model, we evaluate the effects of improvement in various parameters related to H2 production on the cost of renewable methanol. PEM electrolyzer efficiency is expected to reach 70% by 2030 and close to 80% in the longer term [16]; an improvement of 20% could result in methanol cost declining by 15% assuming all other factors remain constant (see Figure S1). PEM-type electrolyzers are likely to reach a price of close to 200 USD/kW by 2050 on account of improvements in technology and use of cheaper materials [16]; a drop in electrolyzer cost from 460 USD/kW which is assumed in our integrated model to 200 USD/kW would result in a decrease in cost of methanol by 10%. Electrolyzer stack life is expected to double by 2050 [16]; an improvement in electrolyzer stack life from 70,000 h to around 150,000 h will also reduce the cost of green methanol, but not to the same extent as improvements in electrolyzer efficiency and cost, as shown in Figure S3.

5. Conclusions

The presence of “stubborn” CO2 emissions throughout the global economy, which cannot be straightforwardly mitigated by switching from fossil fuels to renewable energy sources, presents a challenge for deep decarbonization. We discussed how capture and utilization (CCU), in which CO2 is used as a carbon source for other processes, can derive additional value from the CO2, but at substantial energy cost. While a large body of work has focused on the technoeconomic analysis of specific CO2 utilization pathways, this study sought to gain a general understanding of the impact of falling energy prices on the cost of CCU. This question is gaining particular relevance as the growth of solar and wind technologies increasingly drives energy prices toward historic lows. The exemplary system studied here illustrates the various ways in which energy costs enter into the overall cost of industrial CCU, and how current energy price trends can be expected to modify these costs in the near future. Assuming solar heat produced by a parabolic trough array and 24 h solar electricity produced by a combination of photovoltaics (PV) and CSP with thermal energy storage, we find that current trends in solar energy generation costs lead toward methanol production from captured industrial CO2 and electrolytically produced hydrogen becoming economically viable, considering current market prices, in the foreseeable future. As an exemplary case of industrial carbon capture and utilization, this serves as an indication of how rapid changes in the economics of renewable energy generation have the potential to make the circular carbon economy a reality. We additionally note, however, that the strongest impact of falling energy costs is through the energy-intensive hydrogen electrolysis process. As hydrogen is a critical input of many high-value CO2 products, our results additionally point to the importance of expanding and lowering the cost of green hydrogen production, not only for the traditional reason of displacing carbon-based fuels, but also to enable the more effective capture and use of CO2 emissions from the most stubborn industrial sources.

Supplementary Materials

The following supporting information can be downloaded at https://www.mdpi.com/article/10.3390/en15145181/s1. Figure S1. Cost of methanol with change in electrolyzer efficiency (electricity—30 USD/MWh, heat—10 USD/MWh, discount rate—4%, electrolyzer cost—460 USD/kW). Figure S2. Cost of methanol with change in electrolyzer cost (electricity—30 USD/MWh, discount rate—4%, system efficiency—60%, electrolyzer cost—460 USD/kW). Figure S3. Effect of electrolyzer stack lifetime on methanol cost (PV electricity—13.5USD, CSP + storage—73 USD/MWh, heat—18 USD/MWh, discount rate—4%, system efficiency—60%, electrolyzer cost—460 USD/kW). Figure S4. Effect of capacity factor on price of electricity (PV electricity—13.5 USD/MWh, CSP + storage—73 USD/MWh). Figure S5. Effect of capacity factor on methanol (PV electricity—13.5 USD, CSP + storage—73 USD/MWh, heat—18 USD/MWh, discount rate—4%, system efficiency—60%, electrolyzer cost—460 USD/kW.

Author Contributions

M.B.A., conceptualization, methodology, software, formal analysis, investigation, data curation, writing—original draft, and validation; A.B.A., conceptualization, methodology, formal analysis, investigation, data curation, and writing—original draft; H.A., conceptualization, methodology, software, writing—review and editing, writing—original draft, and visualization; K.G., formal analysis and validation; A.D., formal analysis and validation; A.A.G., conceptualization and visualization; J.T., conceptualization and project administration; M.C., conceptualization, funding acquisition supervision, resources, and writing—review and editing. All authors have read and agreed to the published version of the manuscript.

Funding

This research was funded by the University of Tromso-the Arctic University of Norway through Grant No. 310036. The APC was funded by the University of Tromso through Grant No. 310036.

Institutional Review Board Statement

Not applicable.

Informed Consent Statement

Not applicable.

Data Availability Statement

The data that support the plots within this paper and other findings of this study are available from the corresponding author upon reasonable request.

Acknowledgments

The authors acknowledge the support from the research project “Transformation to a Renewable and Smart Rural Power System Community (RENEW)”, connected to the Arctic Center for Sustainable Energy (ARC) at UiT—the Arctic University of Norway through Grant No. 310026. We thank Maritsa Kissamitaki for designing the figures.

Conflicts of Interest

The authors declare no conflict of interest.

References

  1. Apostoleris, H.; Sgouridis, S.; Stefancich, M.; Chiesa, M. Utility solar prices will continue to drop all over the world even without subsidies. Nat. Energy 2019, 4, 833. [Google Scholar] [CrossRef] [Green Version]
  2. Climate Watch Historical GHG Emissions. 2021. Available online: https://www.climatewatchdata.org/ghg-emissions?breakBy=sector&end_year=2018&gases=co2&sectors=industrial-processes%2Ctotal-including-lucf%2Cmanufacturing-construction%2Ctotal-excluding-lucf&source=CAIT&start_year=1990 (accessed on 27 March 2021).
  3. Industrial Process Emissions. Available online: https://www.wri.org/resources/data-visualizations/world-greenhouse-gas-emissions-2016 (accessed on 27 March 2021).
  4. Sgouridis, S.; Carbajales-Dale, M.; Csala, D.; Chiesa, M.; Bardi, U. Comparative net energy analysis of renewable electricity and carbon capture and storage. Nat. Energy 2019, 4, 456. [Google Scholar] [CrossRef] [Green Version]
  5. Gardarsdottir, S.O.; De Lena, E.; Romano, M.; Roussanaly, S.; Voldsund, M.; Perez-Calvo, J.-F.; Berstad, D.; Fu, C.; Anantharaman, R.; Sutter, D. Comparison of technologies for CO2 capture from cement production Part 2: Cost analysis. Energies 2019, 12, 542. [Google Scholar] [CrossRef] [Green Version]
  6. Roussanaly, S.; Fu, C.; Voldsund, M.; Anantharaman, R.; Spinelli, M.; Romano, M. Techno-economic Analysis of MEA CO2 Capture from a Cement Kiln–Impact of Steam Supply Scenario. Energy Procedia 2017, 114, 6229. [Google Scholar] [CrossRef] [Green Version]
  7. Krahé, M.; Heidug, W.; Ward, J.; Smale, R. From demonstration to deployment: An economic analysis of support policies for carbon capture and storage. Energy Policy 2013, 60, 753. [Google Scholar] [CrossRef]
  8. A Proposal to Scale Up Global Carbon Pricing. Available online: https://blogs.imf.org/2021/06/18/a-proposal-to-scale-up-global-carbon-pricing/ (accessed on 20 June 2021).
  9. Sgouridis, S.; Csala, D.; Bardi, U. The sower’s way: Quantifying the narrowing net-energy pathways to a global energy transition. Environ. Res. Lett. 2016, 11, 94009. [Google Scholar] [CrossRef] [Green Version]
  10. Aresta, M.; Dibenedetto, A.; Quaranta, E. State of the art and perspectives in catalytic processes for CO2 conversion into chemicals and fuels: The distinctive contribution of chemical catalysis and biotechnology. J. Catal. 2016, 343, 2–45. [Google Scholar] [CrossRef]
  11. Maynard, N.J.; Subramanian, V.R.K.; Hua, C.-Y.; Lo, S.-F. Industrial Symbiosis in Taiwan: Case Study on Linhai Industrial Park. Sustainability 2020, 12, 4564. [Google Scholar] [CrossRef]
  12. Arasto, A.; Tsupari, E.; Karki, J.; Pisila, E.; Sorsamaki, L. Post-combustion capture of CO2 at an integrated steel mill-Part I: Technical concept analysis. Int. J. Greenh. Gas Control 2013, 16, 271. [Google Scholar] [CrossRef]
  13. IEA. IEA Tracking Report-Cement; IEA: Paris, France, 2020.
  14. Naims, H. Economics of carbon dioxide capture and utilization—A supply and demand perspective. Environ. Sci. Pollut. Res. 2016, 23, 22226. [Google Scholar] [CrossRef] [Green Version]
  15. Bains, P.; Psarras, P.; Wilcox, J. CO2 capture from the industry sector. Prog. Energy Combust. Sci. 2017, 63, 146. [Google Scholar] [CrossRef]
  16. IEA. The Future of Hydrogen; IEA: Paris, France, 2019.
  17. Wilcox, J. Carbon Capture; Springer Science+Business Media, LLC: New York, USA, 2012. [Google Scholar]
  18. Van der Hoeven, M. CO2 emissions from fuel combustion-highlights 2014. In International Energy Agency; IEA: Paris, Franch, 2014. [Google Scholar]
  19. Andrew, R.M. Global CO2 emissions from cement production, 1928–2018. Earth Syst. Sci. Data 2019, 11, 1675. [Google Scholar] [CrossRef] [Green Version]
  20. Fischedick, L.P.; Roy, M.J.; Abdel-Aziz, A.; Acquaye, A.; Allwood, J.M.; Ceron, J.-P.; Geng, Y.; Kheshgi, H.; Lanza, A.; Perczyk, D.; et al. Sheinbaum, Contri Bution of Working Group III to the Fifth Assessment Report of the Intergovernmental Panel on Climate Change; Edenhofer, C., Santalla, E., Pichs-Madruga, B.K.O.R., Sokona, Y., Farahani, E., Kadner, S., Seyboth, K., Adler, A., Baum, I., Brunner, S., Eickemeier, P., Savolainen, K.T.J., Schlömer, S., von Stechow, C., Zwickel, T., Minx, J.C., Eds.; IPCC, 2014.
  21. Xu, Y.; Isom, L.; Hanna, M.A. Adding value to carbon dioxide from ethanol fermentations. Bioresour. Technol. 2010, 101, 3311. [Google Scholar] [CrossRef] [PubMed]
  22. World Ethanol Production Data. Available online: https://afdc.energy.gov/data/10331 (accessed on 12 April 2021).
  23. Van Straelen, J.; Geuzebroek, F.; Goodchild, N.; Protopapas, G.; Mahony, L. CO2 capture for refineries, a practical approach. Int. J. Greenh. Gas Control 2010, 4, 316. [Google Scholar] [CrossRef]
  24. IEA. IEA Tracking Report-Hydrogen; IEA: Paris, France, 2020.
  25. Sanchez, D.L.; Johnson, N.; McCoy, S.T.; Turner, P.A.; Mach, K.J. Near-term deployment of carbon capture and sequestration from biorefineries in the United States. Proc. Natl. Acad. Sci. USA 2018, 115, 4875. [Google Scholar] [CrossRef] [Green Version]
  26. Husebye, J.; Brunsvold, A.L.; Roussanaly, S.; Zhang, X. Techno Economic Evaluation of Amine based CO2 Capture: Impact of CO2 Concentration and Steam Supply. Energy Procedia 2012, 23, 381. [Google Scholar] [CrossRef] [Green Version]
  27. Berghout, N.; McCulloch, S. Putting CO2 to Use; International Energy Agency (IEA), 2019. [Google Scholar]
  28. Quadrelli, E.A.; Centi, G.; Duplan, J.-L.; Perathoner, S. Carbon Dioxide Recycling: Emerging Large-Scale Technologies with Industrial Potential. ChemSusChem 2011, 4, 1194. [Google Scholar] [CrossRef]
  29. Hepburn, C.; Adlen, E.; Beddington, J.; Carter, E.A.; Fuss, S.; Mac Dowell, N.; Minx, J.C.; Smith, P.; Williams, C.K. The technological and economic prospects for CO2 utilization and removal. Nature 2019, 575, 87. [Google Scholar] [CrossRef] [Green Version]
  30. Chauvy, R.; Meunier, N.; Thomas, D.; De Weireld, G. Selecting emerging CO2 utilization products for short- to mid-term deployment. Appl. Energy 2019, 236, 662. [Google Scholar] [CrossRef]
  31. Urea Market, Supplier, Risk and Competitive Intelligence. Available online: https://www.beroeinc.com/category-intelligence/urea-market/ (accessed on 25 October 2021).
  32. Methanol Market-Growth, Trends, and Forecast (2021–2026). Available online: https://www.mordorintelligence.com/industry-reports/methanol-market (accessed on 25 October 2021).
  33. Calcium Carbonate Market-Growth, Trends, COVID-19 Impact, and Forecasts (2021–2026). Available online: https://www.mordorintelligence.com/industry-reports/calcium-carbonate-market (accessed on 19 February 2021).
  34. DimethylEther Annual Production. Available online: https://aboutdme.org/FAQ (accessed on 19 February 2021).
  35. Bennett, S.J.; Schroeder, D.J.; McCoy, S. Towards a Framework for Discussing and Assessing CO2 Utilisation in a Climate Context. Energy Procedia 2014, 63, 7976. [Google Scholar] [CrossRef] [Green Version]
  36. Jarvis, S.M.; Samsatli, S. Technologies and infrastructures underpinning future CO2 value chains: A comprehensive review and comparative analysis. Sustain. Energy Rev. 2018, 85, 46. [Google Scholar] [CrossRef]
  37. Laribi, S.; Dubois, L.; De Weireld, G.; Thomas, D. Study of the post-combustion CO2 capture process by absorption-regeneration using amine solvents applied to cement plant flue gases with high CO2 contents. Int. J. Greenh. Gas Control 2019, 90, 102799. [Google Scholar] [CrossRef]
  38. Mokhtar, M.; Ali, M.T.; Khalilpour, R.; Abbas, A.; Shah, N.; Alhajaj, A.; Armstrong, P.; Chiesa, M.; Sgouridis, S. Solar-assisted Post-combustion Carbon Capture feasibility study. Appl. Energy 2012, 92, 668. [Google Scholar] [CrossRef]
  39. Pérez-Fortes, M.; Bocin-Dumitriu, A.; Tzimas, E. CO2 Utilization Pathways: Techno-Economic Assessment and Market Opportunities. Energy Procedia 2014, 63, 7968. [Google Scholar] [CrossRef]
  40. Anwar, M.; Fayyaz, A.; Sohail, N.; Khokhar, M.; Baqar, M.; Yasar, A.; Rasool, K.; Nazir, A.; Raja, M.; Rehan, M.; et al. CO2 utilization: Turning greenhouse gas into fuels and valuable products. J. Environ. Manag. 2020, 260. [Google Scholar] [CrossRef]
  41. Shih, C.F.; Zhang, T.; Li, J.; Bai, C. Powering the Future with Liquid Sunshine. Joule 2018, 2, 1925. [Google Scholar] [CrossRef] [Green Version]
  42. Van-Dal, E.S.; Bouallou, C. Design and simulation of a methanol production plant from CO2 hydrogenation. J. Clean. Prod. 2013, 57, 38. [Google Scholar] [CrossRef]
  43. Pérez-Fortes, M.; Schöneberger, J.C.; Boulamanti, A.; Tzimas, E. Methanol synthesis using captured CO2 as raw material: Techno-economic and environmental assessment. Appl. Energy 2016, 161, 718. [Google Scholar] [CrossRef]
  44. Shaner, M.R.; Atwater, H.A.; Lewis, N.S.; McFarland, E.W. A comparative technoeconomic analysis of renewable hydrogen production using solar energy. Energy Environ. Sci. 2016, 9, 2354–2371. [Google Scholar] [CrossRef] [Green Version]
  45. Proost, J. Critical assessment of the production scale required for fossil parity of green electrolytic hydrogen. Int. J. Hydrogen Energy 2020, 45, 17067–17075. [Google Scholar] [CrossRef]
  46. Gandhi, K.; Apostoleris, H.; Sgouridis, S. Catching the hydrogen train: Economics-driven green hydrogen adoption potential in the United Arab Emirates. Int. J. Hydrogen Energy 2022, 47, 22285. [Google Scholar] [CrossRef]
  47. Apostoleris, H.; Sgouridis, S.; Stefancich, M.; Chiesa, M. Evaluating the factors that led to low-priced solar electricity projects in the Middle East. Nat. Energy 2018, 3, 1109. [Google Scholar] [CrossRef]
  48. Apostoleris, H.; Al Ghaferi, A.; Chiesa, M. What is going on with Middle Eastern solar prices, and what does it mean for the rest of us? Prog. Photovolt. Res. Appl. 2021, 29, 638. [Google Scholar] [CrossRef]
  49. Widyolar, B.K.; Jiang, L.; Ferry, J.; Brinkley, J.; Bhusal, Y.; Winston, R. Nonimaging Optics: Efficient Design for Illumination and Solar Concentration XVI; Winston, R., Yablonovitch, E., Eds.; SPIE: San Diego, CA, USA, 2019; Volume 11120, p. 67. [Google Scholar] [CrossRef]
  50. NREL-Current Central Hydrogen Production from Polymer Electrolyte Membrane (PEM) Electrolysis (2019) Version 3.2018. Available online: https://www.nrel.gov/hydrogen/h2a-production-models.html (accessed on 29 March 2021).
  51. Methanol Price. Available online: https://www.methanol.org/methanol-price-supply-demand/ (accessed on 9 June 2021).
  52. Blumberg, T.; Tsatsaronis, G.; Morosuk, T. On the economics of methanol production from natural gas. Fuel 2019, 256, 115824. [Google Scholar] [CrossRef]
  53. Boulamanti, A.; Moya, J.A. Production costs of the chemical industry in the EU and other countries: Ammonia, methanol and light olefins. Renew. Sustain. Energy Rev. 2017, 68, 1205. [Google Scholar] [CrossRef]
  54. Blumberg, T.; Morosuk, T.; Tsatsaronis, G. A Comparative Exergoeconomic Evaluation of the Synthesis Routes for Methanol Production from Natural Gas. Appl. Sci. 2017, 7, 1213. [Google Scholar] [CrossRef] [Green Version]
  55. Kourkoumpas, D.; Papadimou, E.; Atsonios, K.; Karellas, S.; Grammelis, P.; Kakaras, E. Implementation of the Power to Methanol concept by using CO2 from lignite power plants: Techno-economic investigation. Int. J. Hydrogen Energy 2016, 41, 16674. [Google Scholar] [CrossRef]
  56. Saudi Arabia’s Second PV Tender Draws World Record Low Bid of $0.0104/kWh. Available online: https://www.pv-magazine.com/2021/04/08/saudi-arabias-second-pv-tender-draws-world-record-low-bid-of-0104-kwh/ (accessed on 19 April 2021).
  57. Carbon Recycling International. Available online: https://www.carbonrecycling.is/projects#project-goplant (accessed on 15 October 2020).
  58. Carbon Pricing. Available online: https://carbonpricingdashboard.worldbank.org/map_data (accessed on 30 March 2021).
  59. Norway Carbon Tax. Available online: https://bellona.org/news/ccs/2021-02-norway-proposes-e200-per-ton-co2-tax-by-2030 (accessed on 9 June 2021).
Figure 1. Industrial process emissions (Mt CO2/year) and CO2 content (vol.%) from different industries: (a) [14], (b) [15], (c) [16], (d) [17], (e) [18], (g) [19], (h) [20], (f) ethanol (fermentation) emissions calculated using emission factor of 6.29 lbs CO2/gallon ethanol [21] and ethanol production data [22].
Energies 15 05181 g001
Figure 2. Minimum energy required per ton of CO2 fixed [35], and TRL for each technology [36].
Energies 15 05181 g002
Figure 3. Methanol cost break down for different electricity and heat prices and discount rates.
Energies 15 05181 g003
Figure 4. Breakdown of MeOH, CO2, and H2 costs for baseline, current, and near-future target renewable energy costs.
Energies 15 05181 g004
Table 2. Cost inputs for CO2 capture from cement plant from [5].
IRR %Clinker Production t/hCapacity FactorCO2 Captured (kg/ton of Clinker)Economic Life Years
8120.650.976125
Total Plant Cost—Carbon Capture System—Capex (M USD)91.8
Opex (M USD/year)41.5
Variable OpexElect. consumption (kWhel/kg CO2 removed)0.144Electric cost (USD/MWh)70
Therm. consumption (kWhth/kg CO2 removed)1.05Heat cost (USD/MWh)30
MEA make up (kg/kg CO2)0.001MEA solvent USD/t1740
NaOH solution for desulfurization (kg/kg CO2)0.001NaOH sol. USD/t desulfurization444
Process water make up (kg/kg CO2)0.473Process water cost USD/m38
Cooling water makeup (m3/year)1,670,995Cooling water cost USD/m30.468
Additional ammonia solution for NOx removal (kg/kg CO2)0.0002Ammonia solvent USD/t487.2
Fixed OpexAnnual labor + maintenance cost for carbon capture (M USD)4.45
Annual insurance and location taxes (M USD) (the annual insurance and location taxes, including overhead and miscellaneous regulatory fees are set to 2% of Capex)1.83
Fixed OPEX—Labor ChargesTotal Plant Cost—Carbon Capture System—Capex (USD)M USD91.8
Maintenance cost(% of TPC)2.50%
Maintenance costM USD/year2.30
Number of personsPersons20
Cost of labork USD/year per person72.48
Operating laborM USD/year1.44
Maintenance labor(% of Maintenance Cost)40%
Maintenance laborM USD/year0.92
Administrative and support labor(% Oper. and maint labor) cost)30%
Administrative and support laborM USD/year0.71
Labor cost (operating labor + administrative labor)M USD/year2.16
Total cost = labor cost + maintenance costM USD/year4.45
Table 3. Cost input for methanol production from [43].
Annual Production kt MEOH/YearCapacity FactorLevelized Cost of Methanol (LCOM) (USD/Ton CH3OH Produced)
4400.91173
H2 Required (tons/day)CO2 Required (tons/day)WACC/IRR
239.8917600.08
Capex (M USD)264
Opex (M USD/year)491.49
Variable OpexElectricity consumption (MWh/tMeOH)0.169Electricity cost (USD/MWh)70
Heating requirement (MWh/t MeOH)0.439Heat cost (USD/MWh)30
Water consumption (t H2O/t MeOH)26.39Water cost (USD/ton)0.03
Catalyst consumption per year (kg)44,500Catalyst cost (USD/kg)95.24
Consumption CO2 (t/t MeOH)1.46CO2 (USD/ton)69.3
Consumption H2 (t/t MeOH)0.199Hydrogen cost (USD/ton)4776
Fixed OpexFixed annual cost (labor, etc.) (M USD)13.2
Table 4. Different scenarios for CCU.
CaseIRRPel (USD/MWh)Ph (USD/MWh)Scenario
187030Baseline
285218
345218Current
443010
54155Future
Table 5. H2 production plant specifications.
Average production ratekg H2/day250,000
Hours per stack lifeh/life55,188
Total system input power (peak)MW653.281
Total system costM SD272.8
Discount rate%4
Operating capacity factor%0.9
Total system electrical usagekWh/kg H255.5
System efficiency%60
Total system costUSD/kW460
Table 6. Model outputs for different discount rates, as well as electricity and heat prices.
CaseCO2 Capture (USD/Ton)H2 Cost (USD/Ton)CH3OH Cost (USD/Ton)Parameters (%, USD/MWh, USD/MWh)
169.294776.161173.25r = 8, Pel = 70 Ph = 30
254.103743.08937.17r = 8, Pel = 52 Ph = 18
350.333541.92873.85r = 4, Pel = 52 Ph = 18
438.772295.38601.67r = 4, Pel = 30 Ph = 10
531.361445.46416.99r = 4, Pel = 15 Ph = 5
Publisher’s Note: MDPI stays neutral with regard to jurisdictional claims in published maps and institutional affiliations.

