1. Introduction
Despite the global efforts to reduce greenhouse gas (GHG) emissions in various sectors, the increase in emissions from the transportation sector could not be avoided in recent years. In the European Union (EU), the share of road transportation in all carbon dioxide emissions increased from 16% in 1990 to 26% in 2018, with an increase of road transportation emissions by 24% and a decrease of total emissions by 23% [
1]. As a countermeasure, several countries announced plans for all zero-emission passenger vehicle sales goals [
2] and the EU proposed an effective ban on new petrol and diesel cars from 2035 in order to accelerate the switch to zero-emission vehicles [
3]. Moreover, truck manufacturers in the EU are required to reduce the carbon dioxide emissions of newly sold trucks by 30% by 2030 compared to 2019–2020 levels [
4].
Typically, electric vehicles such as battery (BEV) and fuel cell–electric (FCEV) vehicles producing zero tailpipe emissions are classified as zero-emission vehicles. In 2020, global electric vehicle stock reached a 1% share in all vehicles surpassing 10 million vehicles [
5]. This figure is dominated by BEVs and plug-in hybrid–electric vehicles (PHEVs), the latter producing zero emissions only when operating in pure battery mode. The share of electric vehicles operating on fuel cell technology was comparatively low, with around 35,000 at the end of 2020 [
6]. Meanwhile, however, many countries have announced hydrogen strategies or plans and more are developing them, defining a critical role for hydrogen in achieving an energy system with net-zero emissions [
7]. Although the direct electrification of various sectors and thus the vehicles with the help of BEVs constitutes the most efficient pathway and shall be preferred where it is technically and practically possible, huge amounts of renewable electricity can be stored and transported in the form of green hydrogen. The renewable energy sources are unstable and intermittent during generation and the highly valuable electricity generated from renewables is difficult to apply continuously and stably for direct electrification of vehicles. This makes it necessary to employ suitable energy storage systems combined with renewable energy sources, greatly improving the utilization possibilities and stability of these [
8]. By this means, different sectors can be coupled, especially the energy and industrial, as well as transportation ones. This will require a strong ramp-up of decarbonized hydrogen production technologies from renewable and low-carbon electricity generated using water electrolysis and provide hydrogen for the transportation sector, among others. With this approach, hydrogen FCEVs can complement the battery vehicle technologies, especially in applications that require long ranges and a high power input, where current battery technologies may not fulfill user demand due to heavy battery packs and long or frequent recharging needs. From this perspective, FCEVs shall not be considered as a competitor to battery ones, but instead as a complementary technology for achieving the ambitious target of zero-emissions transportation supporting battery vehicles. It must be noted, here, that while the utilization of hydrogen produced from various sources leads to zero tailpipe emissions, the utilization of green hydrogen from renewable sources enables a complete zero-emission route from production to use. Finally, the remaining applications that are difficult to electrify, such as oceangoing ships and long-range aircraft, can be powered by decarbonized hydrogen-based synthetic fuels, enabling complete GHG-neutrality in the transportation sector [
9,
10].
The focus of this work is on fuel cell vehicles and the hydrogen refueling station (HRS) infrastructure. Trencher proposes strategies for the broader use of FCEVs based on the experience from governance strategies implemented by government and industry actors in California [
11]. These strategies include regulation, market and consumer incentives, and public–private coordination. A recent review of fuel cell–electric vehicles was published by Inci et al., focusing on vehicle configurations, system components, control, management, technical challenges, marketing, and future aspects [
12]. In another study, Trencher and Edianto focused on the German fuel cell market and identified and compared barriers and drivers influencing the production and market penetration of fuel cell passenger cars and buses [
13]. Meanwhile, Olabi et al. reviewed the current state and technological advances as well as future prospects regarding automotive fuel cells [
14]. Wang et al. report on the technology and HRS station network status as of September 2020 and targets for selected regions, together with numbers of FCEVs for California, South Korea, and Japan [
15]. Ruffini and Wei emphasize the role of fuel cells in decarbonization roadmaps, such as four million fuel cell–electric vehicles to be sold in 2030 according to the ambitious 2DS (2°) scenario of the International Energy Agency (IEA) and address the higher price of FCEVs compared to internal combustion engines (ICEs) as a key factor hampering their widespread adoption [
16]. Their lifecycle cost analysis demonstrates the importance of learning rates for cost competence. The ultimate cost target of U.S. Department of Energy is defined as 30 USD per kW
net, projected to high-volume production of 500,000 systems per year [
17]. Thompson et al. point out platinum and air compressors as the largest contributors to the stack and balance of plant cost, respectively, and recommend replacing the platinum group metals in the catalyst and finding low-cost bipolar plate materials [
18].
Khan et al. analyze the consumer preferences for FCEVs in Japan and point out that a well-designed policy incentive package including free public parking and transport can positively influence the switch to FCEVs in Japan in the long term [
19]. In turn, Kim et al. focus on hydrogen refueling network development and obtain a nationwide HRS deployment plan for the years 2022–2040 for South Korea [
20]. Rose focuses on the development of a potential HRS network for fuel cell-powered heavy-duty vehicles in Germany for the year 2050. The results of this study indicate the large size difference for HRS for heavy-duty vehicles compared to passenger car stations. Moreover, Rose found that an HRS network with 140 stations with a daily capacity of 30 tons per station, could cover all heavy-duty traffic in Germany [
21]. In a further publication, Rose and Neumann recommend aligning investment in heavy-duty vehicle HRS and the power system in order to realize cost savings via synergy effects [
22].
The main aim of this work is to spotlight the current deployment status of fuel cell vehicles in road transport and hydrogen refueling stations around the globe. For this purpose, a data collection effort was performed by the IEA Advanced Fuel Cells Technology Collaboration Programme (AFC TCP), initiated and coordinated by the authors of this paper, the methodology of which will be presented in
Section 2. The results of the newest data collection for fuel cell vehicles and hydrogen refueling stations will be presented in
Section 3. To understand the collected numbers and their associated trends,
Section 4 also reviews the available incentives in different countries for purchasing a fuel cell vehicle.
Section 5 reviews the announced roadmaps, national strategies, and objectives, as well as regional roadmaps and global visions for the future deployment of fuel cell vehicles and hydrogen refueling stations. Drawing on the broad information base discussed in the previous sections,
Section 6 presents a detailed analysis of the data. With the newest data reflecting the status as of the end of 2021, the study also analyzes development trends in the last five years, building on the results from the previous data collection efforts of the AFC TCP between 2017 and 2020 [
6,
23,
24,
25]. Afterwards, the number of vehicles per station is analyzed for selected countries and compared with future development plans and the present numbers for conventional stations. In an effort to find a correlation between fuel cell vehicle deployment numbers and the other key figures, the numbers of fuel cell vehicles are compared to the number of all registered vehicles in each country in the first step and to the gross domestic product in the second. In a further analytical step, the historical development trends are analyzed in the four countries with the highest numbers of fuel cell vehicles. This analysis is also extended into the future, where development trends are analyzed based on national plans and roadmaps to better understand them. In the final step, the development trends from other electric vehicles are compared with those from fuel cell vehicles in order to analyze any possible similarities that could be used as learning rates.
With this structure, the originality of the paper lies in its reflecting of the worldwide deployment status of fuel cell vehicles, breaking the numbers down to different countries and vehicle classes, unlike other sources and publications that focus on selected regions only. Moreover, as the data collection is performed for the fifth time under the same guidelines, the present work enables the unique possibility of comparing the data with that from the previous years and analyzing the development trends. The novelty of the present work also lies in its detailed analysis of the collected numbers, which are presented in the detailed review of national policy incentives and targets, combining the previous development trends with future plans in order to emphasize the required growth rates and annual sales volumes.
4. Incentives
In this section, a selection of the incentives for buying an FCV will be analyzed. The prices and incentives for the related countries will be presented in the currency of the respective country, and thereby the numbers can be found in the original sources for comparisons in the next years, and also do not depend on currency fluctuations. At the end of this section,
Table 3 gives a summary of selected information also in USD based on 2021 exchange rates from OECD [
76].
In South Korea, the country with the highest number of FCVs worldwide, the price of a Hyundai Nexo varies between KRW 67.65 and 70.95 million [
62]. To this price, subsidies of KRW 32.5–37.5 million apply, from which KRW 22.5 million comes from the government and the rest are variable, coming from the local governments [
77]. It is clear that the available incentives enable a very strong price reduction in this country, which reduces the final price to around 50% of the original. The commitments of the South Korean government and local governments have therefore made a very positive contribution to vehicle sales, bringing the country to number one in the rankings. The typical price for fuel cell buses is around KRW 630 million [
62], for which incentives of KRW 150–330 million are available, with KRW 150 million as a government subsidy and the additional variable subsidies coming from local governments [
77].
The U.S. features the second highest number of fuel cell vehicles on the road. Available passenger car models are the Toyota Mirai, Honda Clarity Fuel Cell, and Hyundai Nexo. The purchasing price of a Toyota Mirai varies from USD 49,500 to 66,000 based on the selected model [
78]. Similarly, the Hyundai Nexo can be purchased for prices starting at USD 59,435–62,885 based on the model [
79]. Until the end of 2021, the fuel cell vehicles received a tax credit of up to USD 8000 at the federal level, organized by the U.S. Internal Revenue Service [
80]. In addition to the federal tax credit, state level incentives apply to FCVs in different federal states. In California, all three of the models mentioned above are eligible for a rebate of USD 4500 as part of the Clean Vehicle Rebate Project [
81]. The California Air Resources Board also offers grants for the replacement of old buses with new zero-emission ones, e.g., fuel cell transit buses receive a grant of USD 400,000 [
82]. In Connecticut, the residents can receive incentives of up to USD 9500 (standard rebate: USD 7500, Rebate + New incentive USD 2000) from the Connecticut Hydrogen and Electric Automobile Purchase Rebate (CHEAPR) for all three FCV types available [
83]. Similarly, the Massachusetts Offers Rebates for Electric Vehicles (MOR-EV) program provides a rebate of USD 2500 for the purchase or lease of FCVs [
83]. It should be noted that further incentives are available in other federal states, which can be reviewed in detail in the Alternative Fuels Data Center database of the U.S. Department of Energy [
84].
China has the third highest fuel cell vehicle population and the second highest number of HRSs in operation. As mentioned previously, its market is dominated by buses, medium- and heavy-duty trucks, unlike any other country. Until the end of 2019, FCVs received government funding as part of the Financial Support Policy for New Energy Vehicles (NEVs). According to this policy, passenger cars received RMB 6000 per kW
el at a maximum of RMB 200,000 per vehicle, small buses and trucks RMB 300,000, and large buses and trucks RMB 500,000 [
85]. By the end of 2021, 556 FCV types had been added to the recommendation catalog of NEVs, demonstrating the extreme diversity of the available FCV models in the country. In 2020 alone, 284 vehicle types were added to the catalog. In the last three years, the vehicle types were dominated by trucks and buses, leaving only a 1% share to passenger cars. At the same time, a rapid increase was observed for heavy-duty trucks, from 5% in 2019 to 41% in 2021, whereas the proportion of buses decreased from 69% to 44% in this period [
59]. In September 2020, several ministries and governmental bodies jointly issued the Notice of the Pilot Application of Fuel Cell Vehicles adopting the approach of “awards instead of subsidies” to promote the industrialization of the essential core technologies for FCVs [
59]. The new policy emphasizes the challenges in core technologies, the production of key components, and the lack of HRSs in this country [
86]. It aims to focus on developing the Chinese FCV sector in four key areas instead of providing subsidies for purchasing vehicles. These areas include achieving breakthroughs in core technologies and key components along the value chain, performing demonstrations focusing on medium- and heavy-duty commercial vehicles, cost reductions, and creating economies of scale across the value chain, from hydrogen production to distribution, and finally improving the policy and institutional environment to support the adoption of vehicles across the entire value chain. Over a period of four years, the policy will provide subsidies to selected numbers of cities and clusters. Each city cluster can receive up to RMB 1.5 billion based on how well it meets the set targets and promotion of FCVs. The technical targets include power and power density, minimum ranges based on vehicle classification, and demonstration of at least 1000 vehicles. Moreover, an additional RMB 200 million has been made available for meeting hydrogen refueling infrastructure targets, which include the reduction of hydrogen costs to under 35 RMB/kg at the pump [
86]. In 2021, the three metropolitan areas of Beijing, Shanghai, and Guangdong were selected to receive funding in this program [
87]. Since 2021, hydrogen energy is one of the six future prospective industries of the 14th Five-Year Plan [
59].
Another leading country for the deployment of hydrogen technologies is Japan. Being the home country for leading FCEV OEMs Toyota and Honda, Japan has the highest number of hydrogen refueling stations and is in fourth place for fuel cell vehicle deployment. The available commercial fuel cell passenger vehicle models are the Toyota Mirai and Honda Clarity Fuel Cell [
64]. The price of the Mirai varies between JPY 6.45 and 7.82 million based on the model and the Clarity Fuel Cell has a price of JPY 7.12 million. The subsidy amounts vary between JPY 1.45 million and 2.38 million [
88].
Among the European countries, Germany has the highest FCV population on the road, as well as the highest number of hydrogen refueling stations. As passenger car models, currently the Toyota Mirai and Hyundai Nexo can be purchased. In recent years, the Mercedes-Benz GLC F-CELL was also available for selected customers based on a full-service rental model, but this vehicle is unavailable at present [
89]. Different versions of Mirai are available in Germany for EUR 63,900–73,900 [
90]. The Hyundai Nexo is available for EUR 77,290 [
91]. Fuel cell– and battery–electric vehicles are eligible for the same amount of incentives in Germany, which is called the environmental bonus. In addition, there are further funding programs for purchasing fuel cell vehicles for fleet operation. Presently, the Toyota Mirai is the only FCV model eligible for the environmental bonus and purchasers receive EUR 5000 from the government and EUR 2500 from the car manufacturer, totaling EUR 7500. The Hyundai Nexo and its predecessor model, the ix35 Fuel Cell, were also eligible for the environmental bonus in past versions. The environmental bonus can be combined with several support mechanisms [
92]. The evaluation of the applications for the environmental bonus through 1 March 2022 shows that only 241 fuel cell vehicles received support from this program, specifically 170 Hyundai Nexos, 19 Hyundai ix35 Fuel Cells and 52 Toyota Mirais [
93]. Comparing these numbers with the total number of FCEVs in Germany, it is clear that it was not the environmental bonus alone that motivated the buyers of fuel cell vehicles. Other funding possibilities from various calls within the National Innovation Programme for Hydrogen and Fuel Cell Technology (NIP), as well as from state governments and European programs also drove the deployment of fuel cell vehicles in Germany. For example, as of January 2021, 876 passenger cars, 503 light commercial vehicles, 79 buses, 35 garbage trucks, and eight street sweepers, as well as 43 public and 12 non-public HRSs, had received approval for funding from the NIP II since 2016 [
94,
95].
In France, private buyers of FCVs receive EUR 6000 in support for a maximum purchase price of EUR 45,000 and EUR 2000 for a price higher than EUR 45,000. For commercial vehicles, subsidy rates of EUR 4000 and 2000, respectively, apply [
96].
In Canada, the price of the Toyota Mirai varies between CAD 54,990 and 76,750 based on model type [
97]. A federal incentive of up to CAD 5000 applies for fuel cell vehicles [
98]. On top of this, additional incentives are available at the state level, such as CAD 8000 in Quebec [
99], CAD 5000 in Yukon [
100], and CAD 3000 in British Columbia [
101], each valid according to the vehicle manufacturer’s maximum suggested retail price.
As well as the exemption from mineral oil tax for hydrogen as a fuel in Switzerland, an additional support scheme is available for fuel cell trucks [
53]. On the one hand, fuel cell trucks are exempt from the performance-related heavy vehicle tax, which is 0.023 CHF/tkm for Euro 6 trucks. Additionally, an investment contribution of CHF 50,000 is provided or an annual subsidy paid until 2030, which covers around two-thirds of the additional rental or leasing costs of the truck compared to a diesel version. With this scheme, the operation of fuel cell trucks is a business model without subsidies or project funding in Switzerland.
In Italy, the purchase of FCEVs is supported by EUR 6000–10,000, provided that the maximum price is less than EUR 61,000 [
102].
In Austria, the Hyundai Nexo is only available for customers with a professional connection to the topic of hydrogen [
103], whereas the Toyota Mirai can be purchased for a starting price of EUR 59,900 [
104]. As in many of the other countries, the fuel cell– and battery–electric vehicles are eligible for the same incentives: private buyers of new passenger cars can save EUR 5000 (60% federal funding and 40% from car importers). Companies and organizations can save EUR 4000 (50% each from federal funding and car importers) for purchasing passenger cars and transporters with a weight of less than 2000 kg. The incentives are limited to 30% of the purchase price, whereas the gross list purchase price can be up to EUR 60,000. To profit from the funding, it must be proven that only renewable hydrogen is used as a fuel. FCVs are also exempted from the standardized consumption tax, engine-related insurance tax, and vehicle tax [
105,
106,
107].
The Hyundai Nexo and Toyota Mirai are also the only fuel cell passenger car models available in Spain, with prices of around EUR 65,000 each [
108]. FCVs receive incentives of up to EUR 6000 [
109].
In Sweden, the Hyundai Nexo can be purchased for a price of SEK 849,900 [
110], whereas the Toyota Mirai can only be rented through car-sharing company Kinto Share [
111]. SEK 70,000 is available as an incentive for buyers of fuel cell vehicles in the country [
112].
The analysis of the incentives shows that the available mechanisms provide only a limited reduction in the purchase price of an FCV. Moreover, the incentives vary within a country due to the available support schemes from local or state governments. An exception to this general trend comes from South Korea, where the incentives reduce the price by around 50%. This contrasting trend surely played an important role in bringing South Korea to the leading position in the number of fuel cell vehicles. Other important results from this section arise from the Chinese landscape. On the one hand, the unique diversity of the available fuel cell vehicle models in the country is apparent. On the other, the outcome of the recent change in the funding mechanism, which aims to provide awards to selected regions instead of general subsidies, must be monitored in the coming years.
5. Perspectives
After analyzing the subsidy schemes in
Section 4 that could have an influence on the present deployment status reported in
Section 3, this section focuses on the perspectives in the form of roadmaps, national plans, targets, and visions that can play a role in further development in the coming years.
In November 2021, the Basic Plan for Implementing the Hydrogen Economy of Korea was published by the Ministry of Trade, Industry and Energy, which was prepared by contributions from industry, academia, and experts. This report highlights the announcements of large-scale investment plans of South Korean companies to the hydrogen industry, including companies such as SK, Hyundai, POSCO, Hanwha, and Hyosung, which plan to invest approximately 43 trillion KRW by 2030. According to this plan, South Korea intends to achieve 34% self-sufficiency in clean hydrogen production by 2030 and 60% by 2050, with a hydrogen supply of 3.9 million tonnes and 27.9 million tonnes, respectively. On the utilization side, the plans foresee securing the production capacity of 100,000 passenger cars per year and 2000 commercial vehicles per year between 2020 and 2030. The plan targets 850,000 passenger cars and 30,000 commercial vehicles for 2030 and 5,150,000 passenger cars and 110,000 commercial vehicles for 2050. For commercial vehicles, the durability target is to increase the current level of 200,000 km to 500,000 km by 2025 and reach the ICE durability of above 800,000 km in 2030. For passenger cars, it is intended to achieve the equivalence of ICE durability with above 300,000 km by 2023 and more than 500,000 km by 2025. Concerning the mileage targets, the equivalence of ICE vehicles to 600 km is already considered state-of-the-art for FCEVs. At present, commercial vehicles reach 400 km, which is set to be increased to 800 km by 2025 and reach equivalence in ICE vehicles in 2030 with above 1000 km. Concerning the hydrogen refueling station infrastructure, it is planned that the public side leads the balanced deployment by region in the early stages of FCEV deployment through 2025 and the private side leads the expansion based on market demand. With that being said, the goals foresee 310 stations in 2022, 450 in 2025, 660 in 2030, 1200 in 2040, and 2000 or more in 2050. Overall, the present South Korean plan anticipates an accumulated economic ripple effect of 1319 trillion KRW and the creation of 567,000 jobs by 2050. The revenues from the hydrogen economy are reported to be 2.85 trillion KRW and employment with 150,000 jobs in 2019 was foreseen [
113].
In 2020, the Roadmap to a U.S. Hydrogen Economy was released with input from a coalition of 20 companies and organizations [
114]. The milestones of this ambitious plan include FCV sales of 30,000 units in 2022 (early scale-up), 150,000 units in 2025 (diversification) and 1,200,000 units in 2030 (broad roll-up). It is also intended to increase the number of hydrogen refueling stations to 165 in 2022, 1000 in 2025, and 4300 in 2030. According to the base scenario, fuel cell light-duty passenger vehicles will have a share of 5% in 2050 (1% in 2030), buses 18% (2%), and trucks 8% (2%). In the ambitious scenario, the share of fuel cell light-duty passenger vehicles will increase to 41% in 2050 (7% in 2030), buses to 55% (13%), and trucks to 35% (9%).
California has traditionally been the most active U.S. federal state for the deployment of FCEVs and for developing an HRS network as part of the state targets for zero-emission transport. The California Energy Commission will co-fund the development of retail HRSs until at least 100 stations are in operation in the state. In addition to the 100 station milestone, an additional target of 200 HRSs by 2025 was defined. Funding from the state and private sources will contribute to achieving the set target. It should also be noted that the California Air Resources Board reported that it was tracking 176 station development projects as of September 2021. The annual evaluation of the Board estimates 30,800 FCEVs on the road by 2024 and 61,000 by the end of 2027 in California, based on automobile manufacturer targets [
115]. Moreover, in 2018 the California Fuel Cell Partnership published its vision for 2030, reflecting the input and consensus of more than 40 partners, including automobile manufacturers, energy companies, fuel cell companies, governmental and non-governmental organizations, and universities. According to this vision, termed “The California Fuel Cell Revolution,” the Partnership will pursue a network of 1000 HRSs and one million FCEVs in California by 2030 [
116].
It has been reported that 30 provinces and cities in China have issued special policies regarding hydrogen energy, with the most comprehensive ones being from Shanghai, Beijing, Guangdong, Hebei, Jiangsu, Hubei, and Shandong, which have issued more than 70 documents specifically concerning fuel cells and hydrogen energy [
59]. It has also been reported that more than every third government-owned company has developed a layout covering the complete industry chain, including hydrogen production, storage, refueling and utilization, with the most representative companies being Sinopec, CNPC, CHN Energy, SPIC, and DEC. Among these, Sinopec set the target of building 1000 hydrogen refueling stations during the 14th Five-Year Plan and becoming the number one hydrogen energy company in China [
59]. In 2020, China SAE published the Technology Roadmap for Energy-saving and New Energy Vehicles: Version 2.0 [
117]. This roadmap defines the target of reaching 50,000–100,000 FCVs and more than 1000 hydrogen refueling stations by 2025, and one million FCVs and more than 5000 stations latest by 2035. The roadmap also includes technical targets for passenger and commercial vehicles, as well as hydrogen provision.
In March 2019, the Hydrogen and Fuel Cell Strategy Council in Japan presented an action plan developed with broad participation from industry, academia, and government representatives to realize a hydrogen society [
118]. The resulting document, “The Strategic Road Map for Hydrogen and Fuel Cells”, sets targets for the period through 2030. Accordingly, Japan will try to introduce 200,000 fuel cell electric vehicles and 320 HRSs by 2025 and 800,000 FCEVs, 1200 buses, and 900 stations by 2030. If we look back to the 2020 targets defined in this roadmap, we can see that the 40,000-vehicle target has not been achieved yet; however, the additional targets with 100 buses and 160 stations have been. The roadmap also defines the driving range target of 800 km (2019 state-of-the-art: 650 km), 6 kW/L power density (2019: 3 kW/L), over 15 years’ durability (2019: 15 years), and the amount of rare materials used to be reduced to 0.1 g/kW in 2030. The vehicle price for the Mirai class will be comparable to that of hybrid electric vehicles in the same class around 2025. Moreover, the cost of the fuel cell system will be reduced to less than 4000 JPY/kW (2019: 20,000 JPY/kW) and hydrogen storage systems capable of carrying 5 kg to 100,000–200,000 JPY (2019: 700,000 JPY) in 2030 [
118].
Although the National Hydrogen Strategy of Germany defines a critical role for hydrogen for the energy transition in the country, there are not yet any defined roadmaps concerning the broad deployment of FCVs [
119]. As part of the application of the EU directive 2014/94/EU, the target of building 400 HRSs, coupled with the actual deployment status of fuel cell vehicles, was defined [
120]. In parallel, several federal states have developed or are developing hydrogen roadmaps. For instance, similar to the example of California in the U.S., the federal state North Rhine–Westphalia (NRW) defined ambitious targets for the period through 2030 in its roadmap. These targets include a fleet of more than 400 fuel cell trucks, 20 HRSs for trucks and 60 for passenger cars, 500 fuel cell buses for public transportation, and the operation of the first inland ship operating on hydrogen by 2025. The longer-term targets through 2030 include 11,000 fuel cell trucks with more than 20 t weight, 200 stations for trucks and passenger cars, 1000 fuel cell garbage trucks, and 3800 fuel cell buses for public transportation [
121].
Similarly, the Dutch government considers the development of hydrogen as an energy carrier vital to mobility, particularly for heavy-duty transport according to the Climate Agreement from June 2019 [
122]. In this context, 15,000 passenger cars in 2025 and 300,000 cars in 2030 are anticipated. Moreover, 50 HRSs and 3000 heavy-duty vehicles are intended for 2025 as a strategic base for accelerated growth towards 2030 and 2050.
The “Hydrogen Deployment Plan for the Energy Transition” of France defined the target of 5000 light commercial vehicles and 200 heavy-duty ones and the construction of 100 stations supplied with locally produced hydrogen by 2023 [
123]. A total of 20,000–50,000 light commercial vehicles, 800–2000 heavy-duty vehicles, and 400–1000 stations are planned by 2028.
The “Hydrogen Strategy for Canada” from 2020 does not define concrete targets for FCEVs but presents the vision for hydrogen in Canada in 2050 as including more than five million on the road [
124].
Switzerland plans a fleet of 1000 fuel cell trucks by 2023, 1600 by 2025, and a nationwide HRS infrastructure with more than 33 stations by 2023 [
53].
The Italian hydrogen and fuel cell targets include 1000 fuel cell buses and 25,000 passenger cars by 2025 [
125]. Moreover, 442 HRSs, of which 346 will be for light-duty and 96 for heavy-duty vehicles, as well as 200,000 heavy-duty trucks, are targeted for 2030. Back in 2016, Italy defined the goals of 290,000 passenger cars and 3,600 buses operating on fuel cell technology by 2030 [
126,
127,
128].
The Spanish government promotes the deployment of hydrogen as a sustainable energy vector that will play a key role in achieving climate-neutrality by 2050 at the latest with the “Hydrogen Roadmap: A Commitment to a Renewable Hydrogen” [
129]. The main objectives of the roadmap include 150–200 buses, 5000–7000 light, and heavy vehicles for goods transportation with fuel cell technology, as well as 100–150 HRSs.
In addition to the national roadmaps, the Hydrogen Roadmap Europe from 2019 presents an ambitious path with significant shares of FCVs in the transportation sector [
130]. The roadmap developed by the Fuel Cells and Hydrogen Joint Undertaking was supported by Hydrogen Europe and 17 companies and organizations along the entire hydrogen value chain. Compared with the business-as-usual scenario, where hydrogen could provide 8% of the total energy demand in Europe in 2050, the ambitious scenario estimates a share of 24%, of which 30% would be used for transportation. In the ambitious vision, every 12th light commercial vehicle and every 22nd passenger vehicle sold in 2030 to operate on fuel cell technology; in 2040, the shares increase to one in five and one in seven, respectively. Totals of 45,000 trucks and buses in 2030 and 450,000 in 2040 are set as further milestones. Furthermore, the ambitious scenario aims for 300,000 vehicles sold in 2025, 1.2 million in 2030, 1.8 million in 2035, 3.1 million in 2040, 5.3 million in 2045, and 8 million in 2050. This translates to 11 times more vehicles in 2030 and 16 times more vehicles in 2050 compared to the business-as-usual scenario. Based on this development, the number of FCVs on the road may exceed to 50 million units in 2050, consisting of approximately 45 million passenger cars, 6.5 million light commercial vehicles, 250,0000 buses, and 1.7 million trucks. In parallel, the ambitious scenario requires 1500 HRSs in 2025, 3750 in 2030, 8500 in 2035, 15,000 in 2040, 23,000 in 2045, and 33,000 in 2050. Looking at the FCV share in the respective car segments, small cars will have a share of 2–22% in vehicles sold per year (2030–2050), larger cars 5–39%, taxis 14–61%, vans and light commercial vehicles 8–49%, buses 6–45%, and trucks 1–35%. The roadmap points out that more than 750 stations are either already announced or planned for 2025 in Europe.
In June 2021, a proposal for a regulation of the European Parliament and the Council on the Deployment of Alternative Fuels Infrastructure Regulation (AFIR) was published [
131], which shall replace the Alternative Fuels Infrastructure Directive (AFID) from 2014. It is proposed that the EU Member States will ensure a minimum number of public HRSs by 2030, with a minimum capacity of 2 t/d and at least one 700 bar dispenser, with a maximum distance of 150 km between two stations along the Trans-European Transport Network (TEN-T) core and TEN-T comprehensive network. In addition, liquid hydrogen will be made available at public HRSs with a maximum distance of 450 km in between sites. It is expected that the existing AFID will be reviewed in 2022. In April 2022, Hydrogen Europe, representing over 100 companies and organizations from the road transport sector and the entire hydrogen value chain, published an open letter raising concerns on an apparent lack of ambition in the proposed targets [
132]. Instead, they call for a realistic timeline for the rollout of hydrogen refueling infrastructure and argue that the current proposal would result in approximately only 1100 HRS, which would be insufficient to cover even the most basic levels of demand. Hydrogen Europe’s trajectory includes three steps. For the first, half of the network density corresponding to an HRS every 200 km will already be met by 2025. In 2027, the TEN-T core network with full density (HRSs every 100 km) will be established to match the expected large-scale rollout by manufacturers, at a minimum of 2 t/d with 700 and 350 bar dispensers. As the last step, by 2030, the full density coverage will be extended to the entire TEN-T network, with the same minimum capacities and dispenser options, liquid hydrogen being available every 300 km, and at least 2 HRS for each of the 424 TEN-T nodes, providing customers with certainty and basic reliability for users.
After discussing the regional and national roadmaps and visions for Asian, North American, and European countries, we can present an overall perspective that brings all visions together and gives a worldwide overview. The Hydrogen Council defines itself as “a global CEO-led initiative of leading companies with a united vision and long-term ambition: for hydrogen to foster the clean energy transition for a better, more resilient future”. As of March 2022, the Council had more than 130 members across the globe. The Hydrogen—Scaling Up report from 2017 defines milestones for the year 2030 as a precursor to reaching the 2050 targets. According to this roadmap, one in 12 cars in Germany, Japan, South Korea, and California are to be powered by hydrogen as 2030 milestones. Furthermore, globally, 10–15 million cars and 500,000 trucks are to be powered by hydrogen, with an annual sales volume of four million vehicles and almost 3% of new vehicle sales. The targets for 2050 consist of up to 400 million passenger vehicles, five million trucks, and more than 15 million buses operated on hydrogen technologies. These numbers correspond to a market share of 25% for passenger vehicles, 30% for trucks, 25% for buses, and about 35% of new vehicle sales in 2050. The 2017 report counted 5300 announcements for HRSs for 2030 and pointed out that roughly 15,000 stations would be needed in that year to serve the 10–15 million vehicles, according to the roadmap [
133].
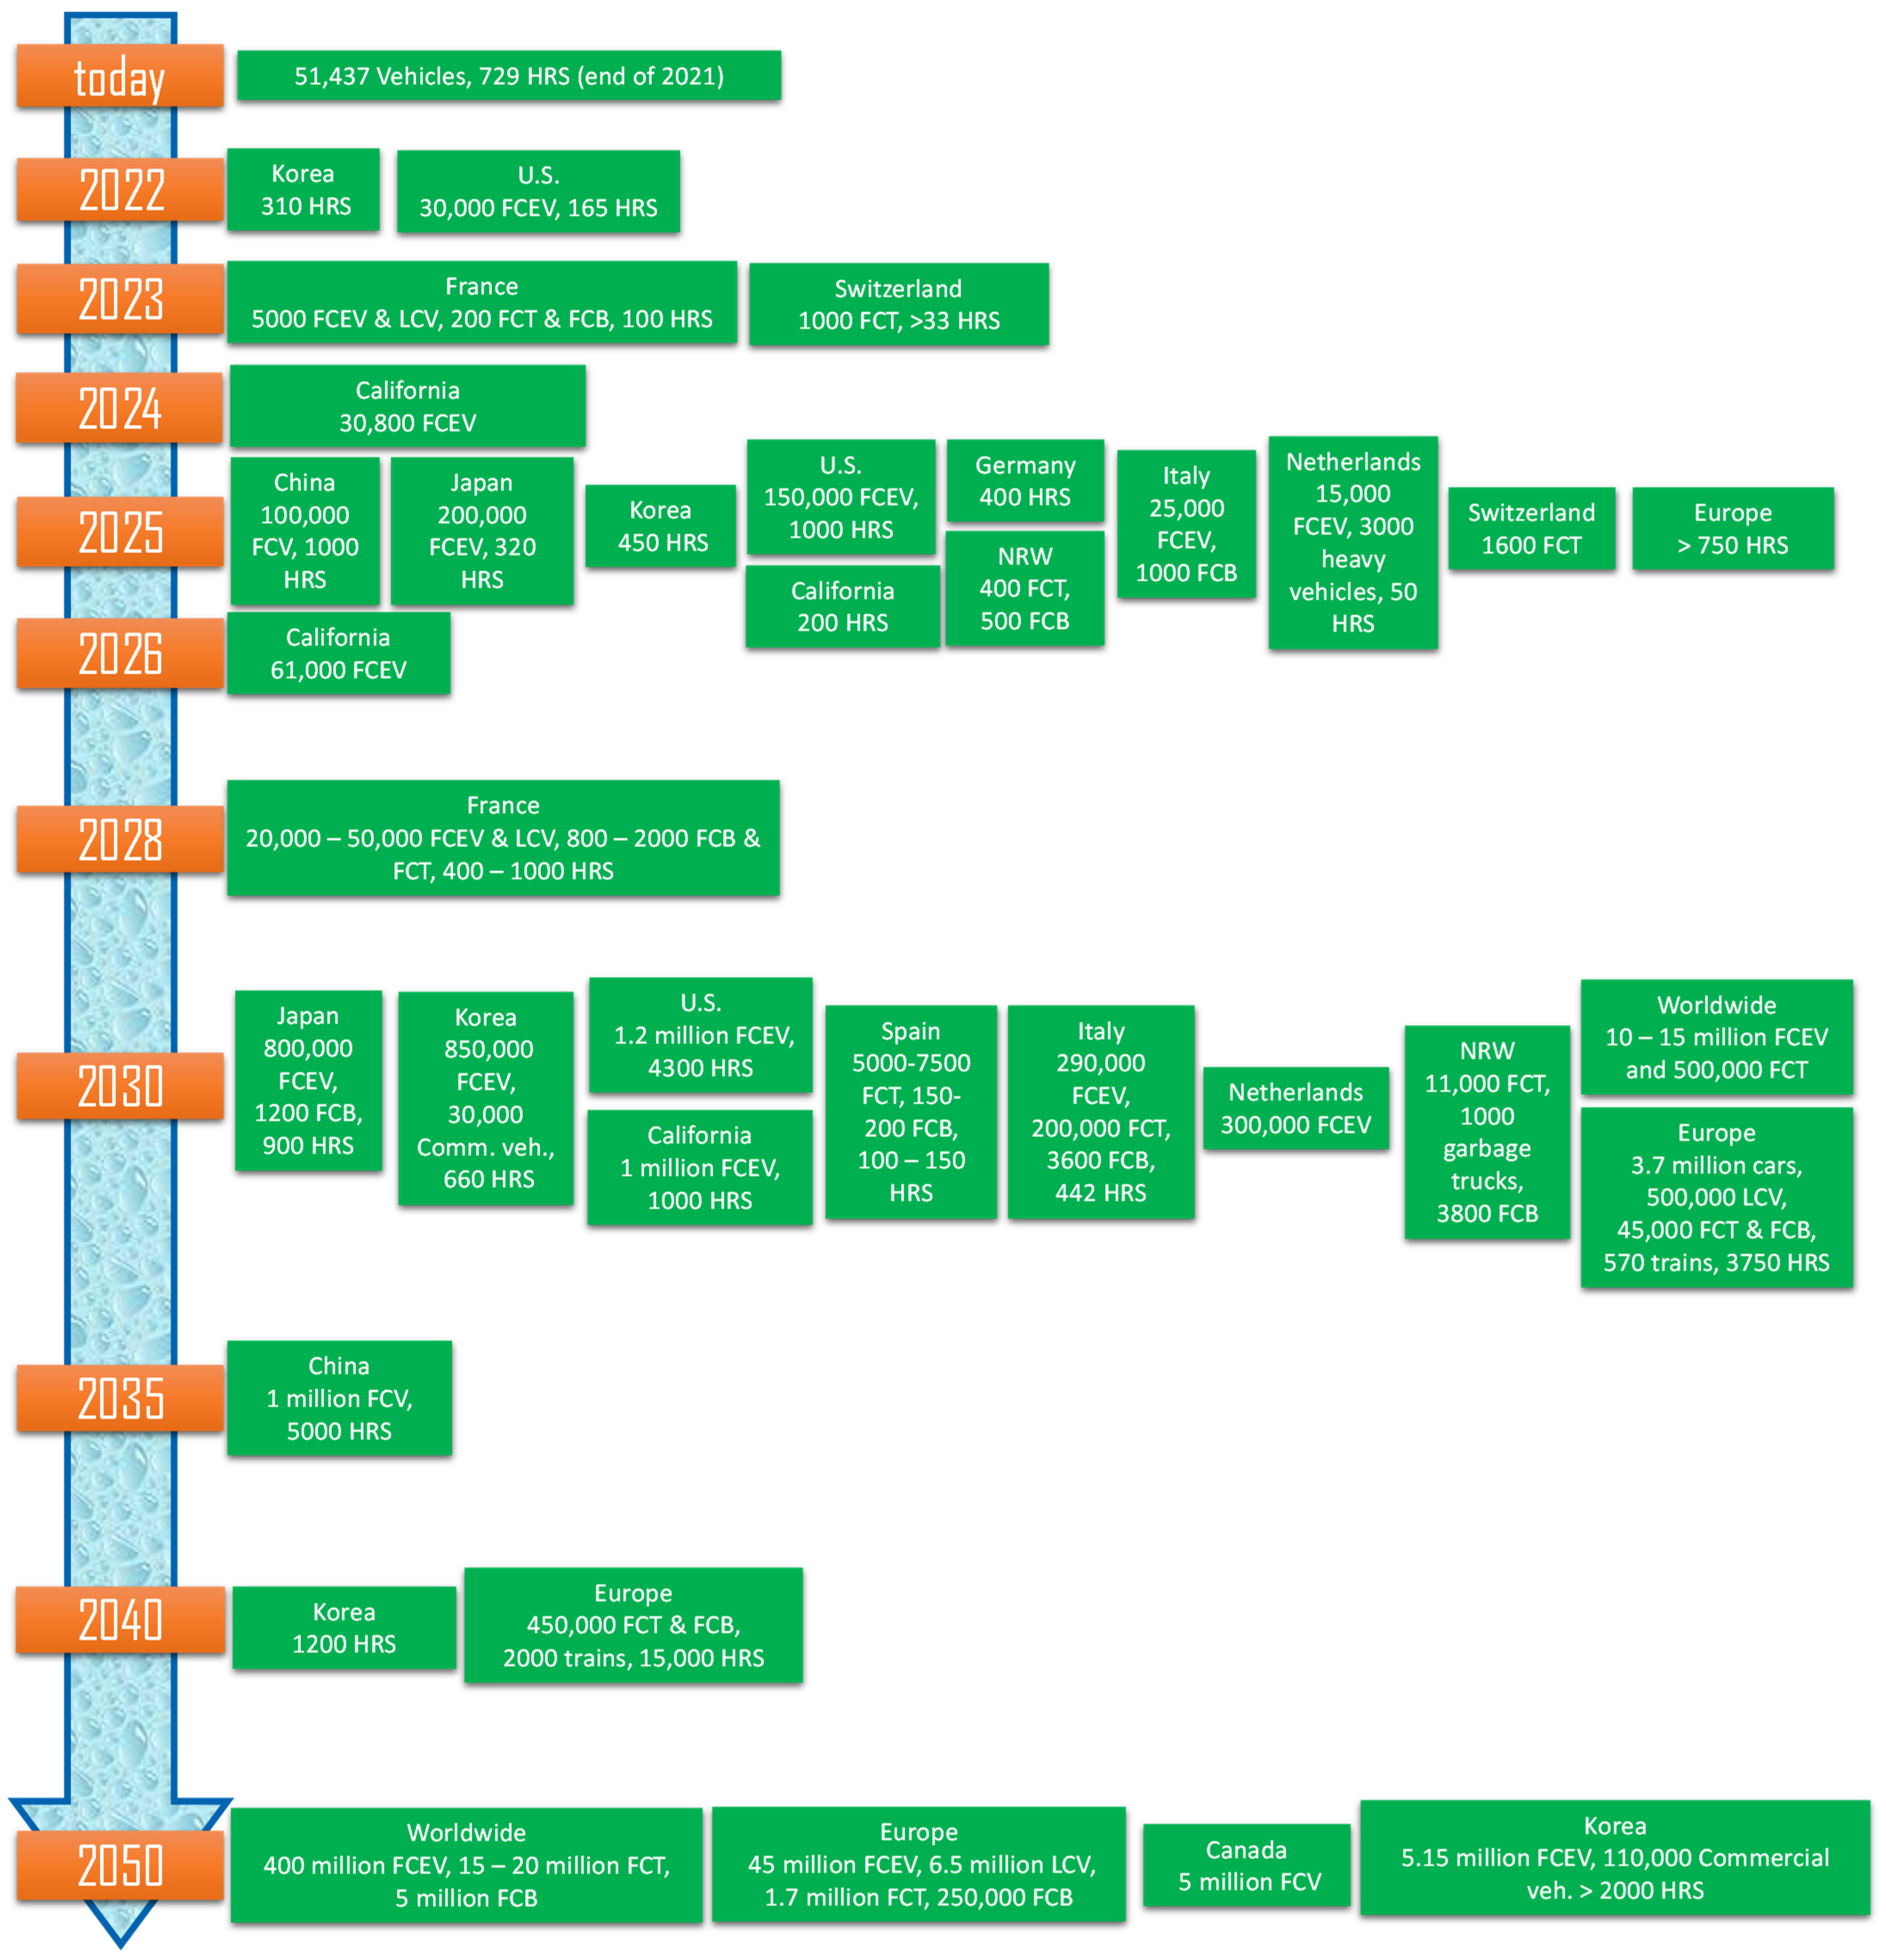
To give an overall impression of the announced targets, developed roadmaps and visions,
Figure 9 summarizes the numbers presented in this section on a timeline, starting with the current numbers from this study. In the next section, the present deployment status will first be analyzed, observing the development trend of the last five years, and then combined with the announced numbers from this section in order to predict the required development trends over time.
6. Analysis
After the detailed presentation of the numbers of FCVs and HRSs in
Section 3, the available incentives for purchasing or operating an FCV were highlighted in
Section 4.
Section 5 focused on the announced plans and roadmaps from different countries and regions, complemented by worldwide perspectives. In the present section, the available information from the previous sections will be combined for an analysis of the numbers.
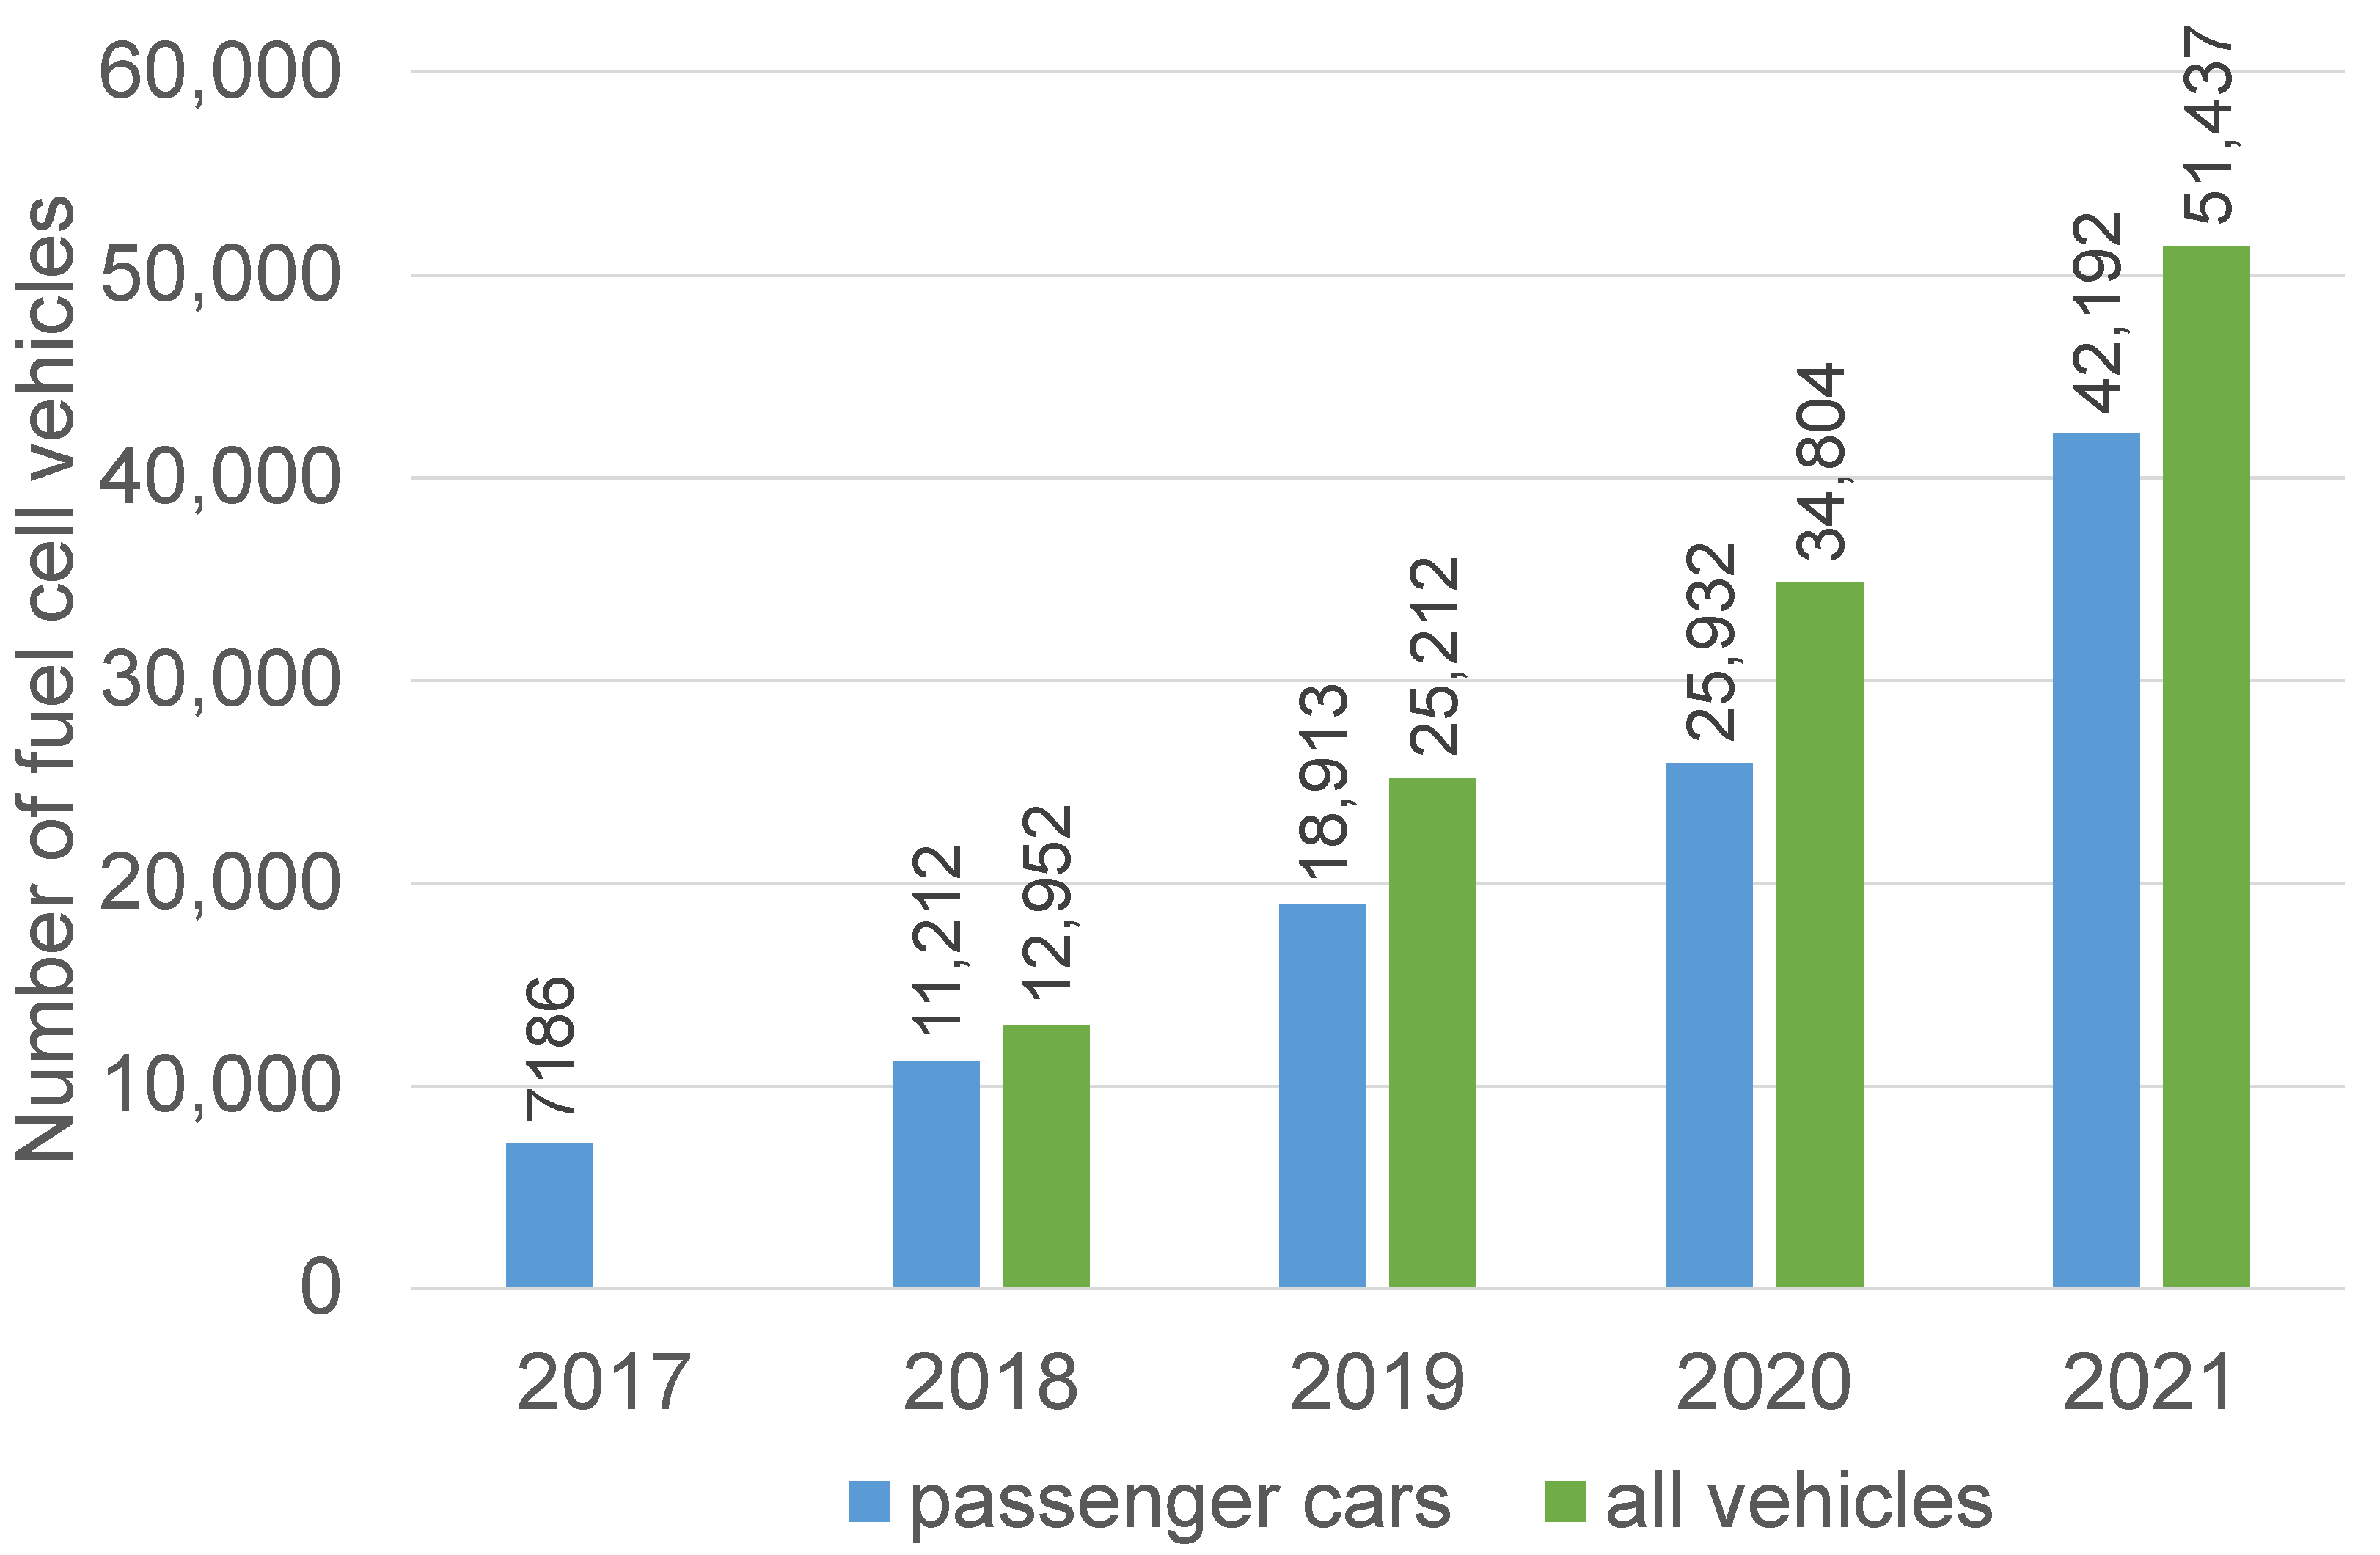
Firstly,
Figure 10 shows the development of the number of FCVs in the last five years based on our past surveys [
6,
23,
24,
25] and the present survey results from this study. The first data from passenger cars are for 2017, whereas the data collected for all vehicles started in 2018. It should be noted that Hyundai started offering the world’s first mass-produced fuel cell vehicle, the ix35 Fuel Cell, for lease in U.S. in 2014 and the Toyota Mirai was launched at the end of 2014 in Japan [
134]. For passenger cars, after a 56% increase in the annual deployment rate from 2017 to 2018, the highest increase rate of 69% was recorded from 2018 to 2019. The increase rate slowed down to 37% in 2020, which can be explained by the global economic recession caused by the COVID-19 pandemic. In 2021, the increase rate was 63% and approached the highest rate of 69% just before the pandemic, which is in accordance with the first signs of economic recovery in 2021. However, looking at the absolute numbers, it is clear that the increase in 2021, with 16,260 passenger cars, is much stronger than that in 2019, with 7701 units. As the stock of fuel cell passenger cars is steadily increasing, the annual increase rate does not reflect the progress alone, which must be complemented by the absolute increase. Looking at the development of all FCVs, it is clear that the strong increase rate of 95% from 2018 to 2019 did not continue in the subsequent years. The increase rate in 2020 was 38%, and thus comparable to the increase rate of passenger cars. In 2021, an improvement was observed with a 48% increase rate in one year.
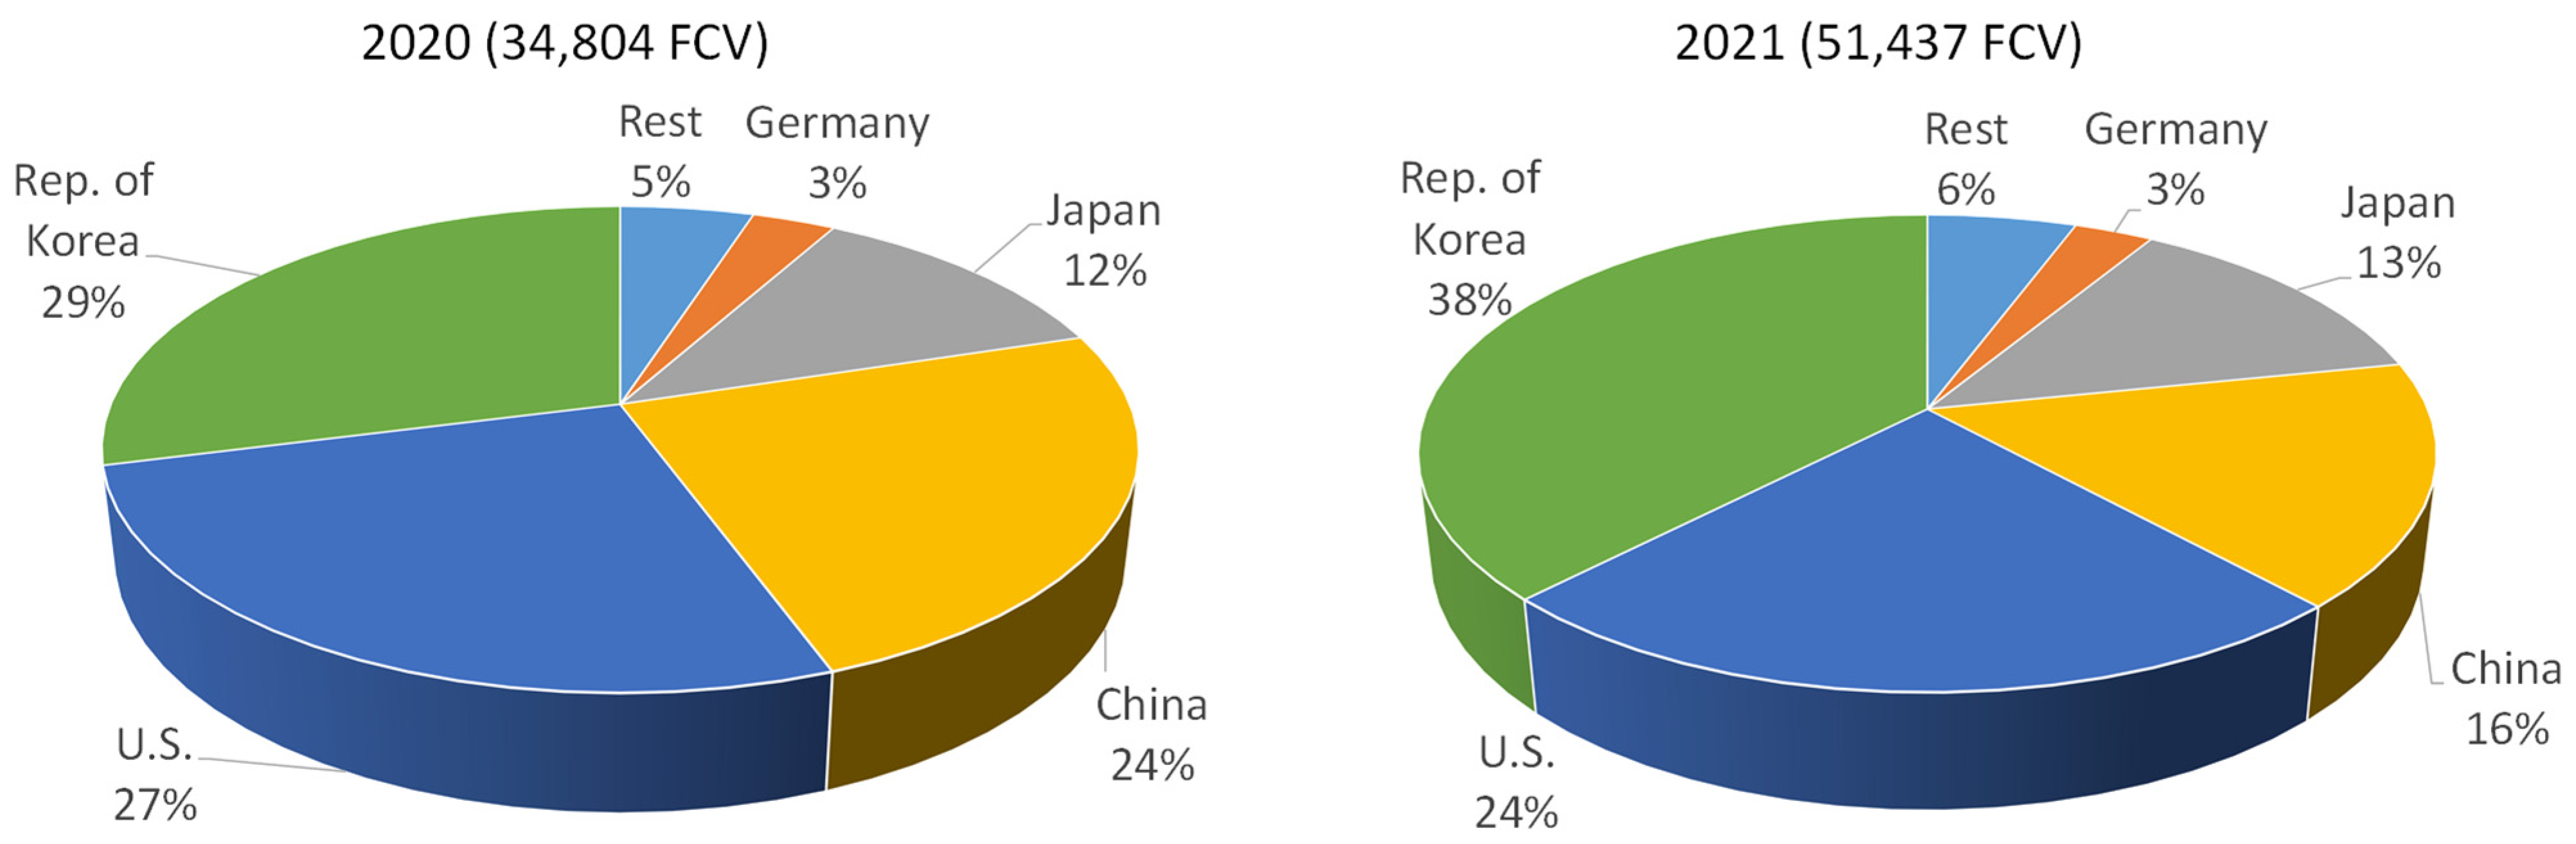
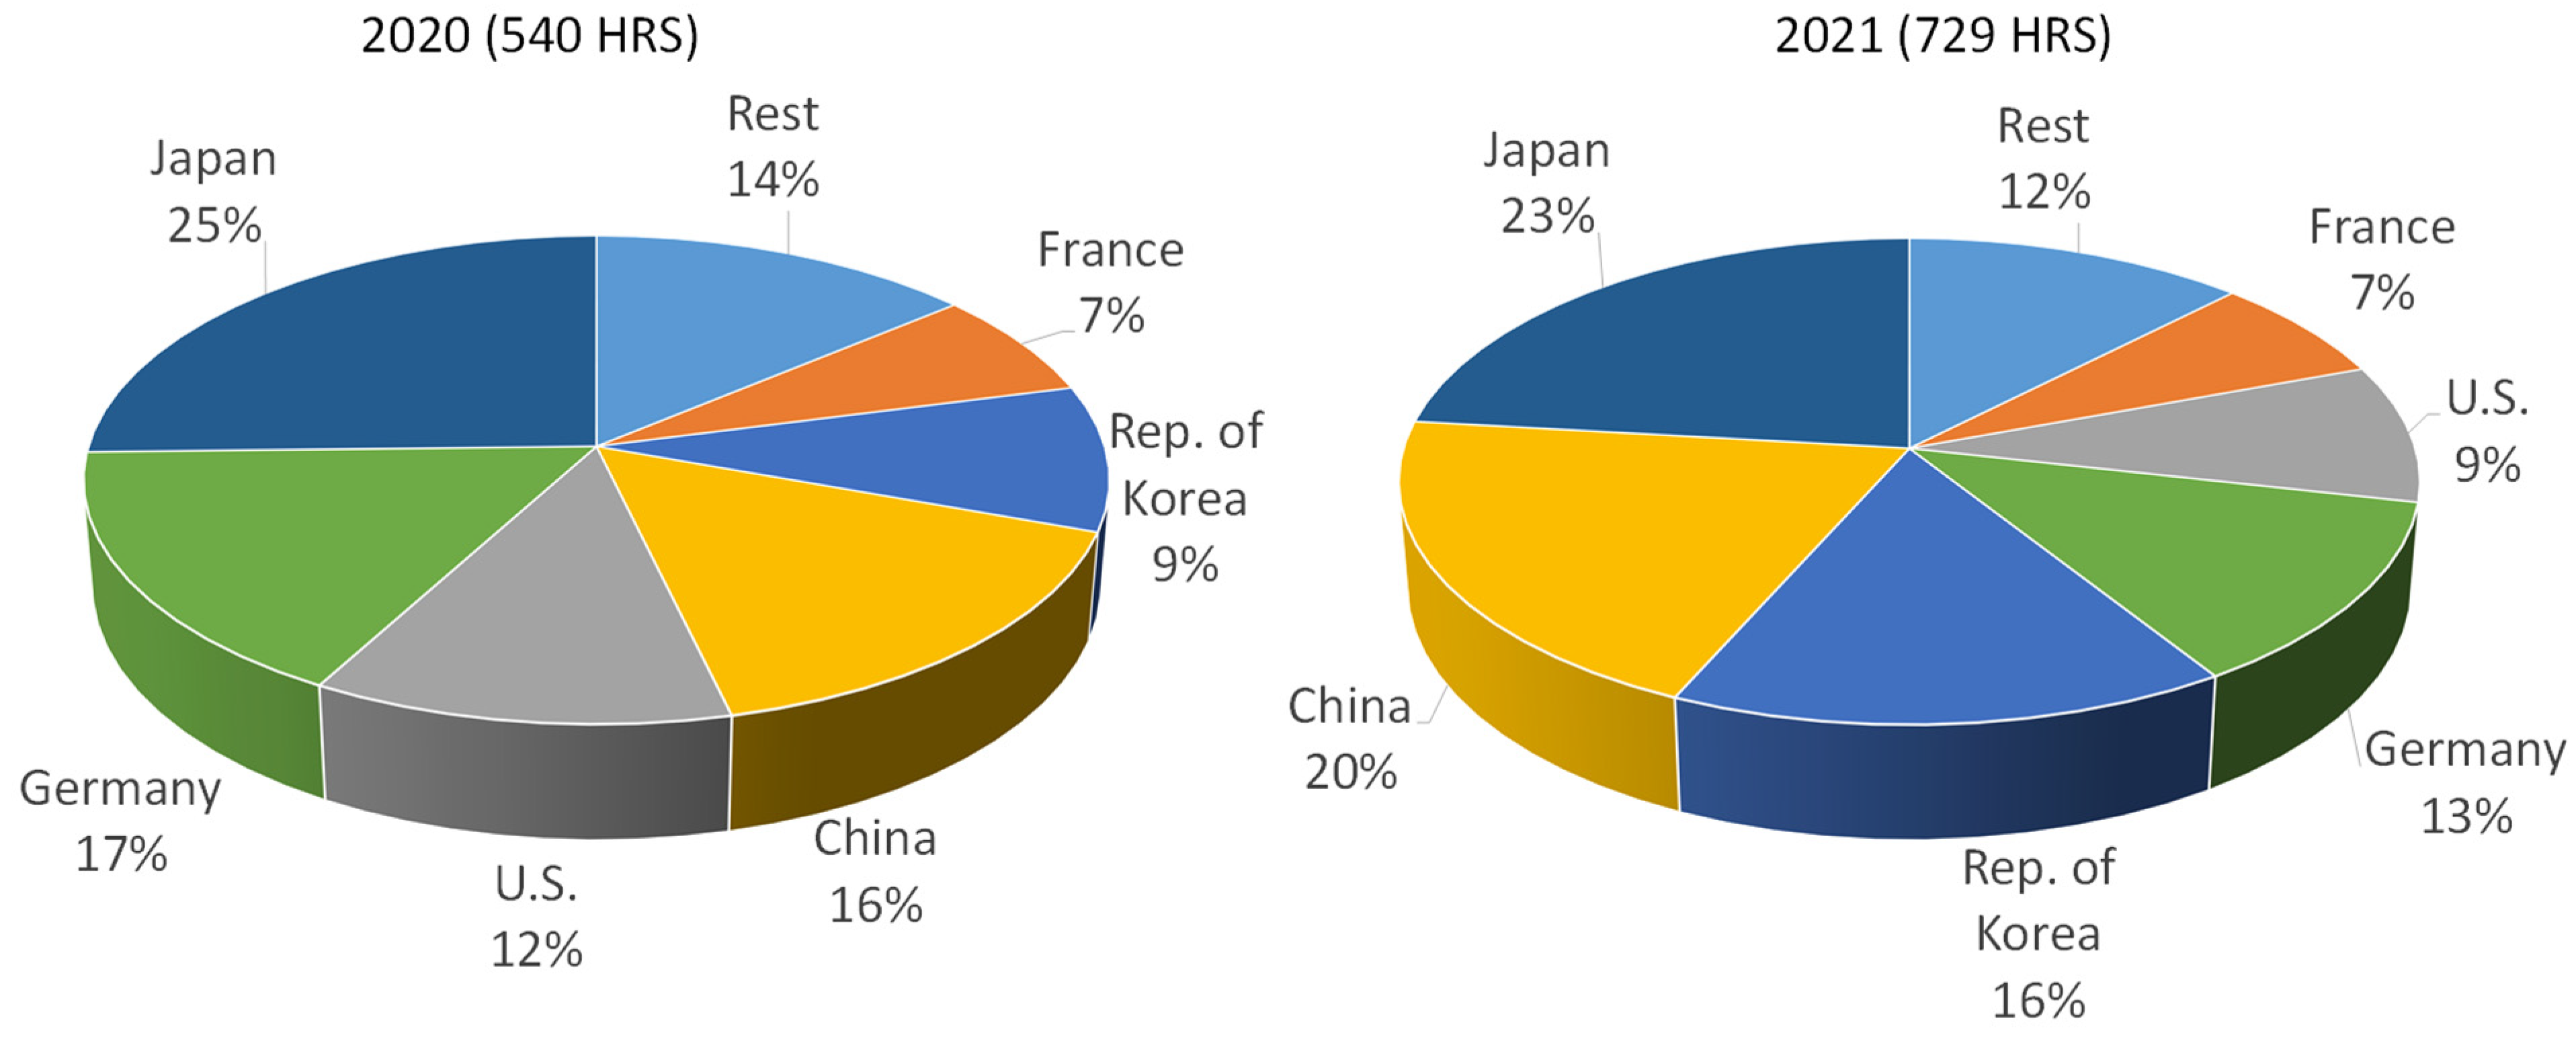
In the next analysis, the change in global shares from 2020 to 2021 is compared for the top five countries that had at least 1000 fuel cell vehicles on the road as of end of 2021. The absolute numbers are also added to
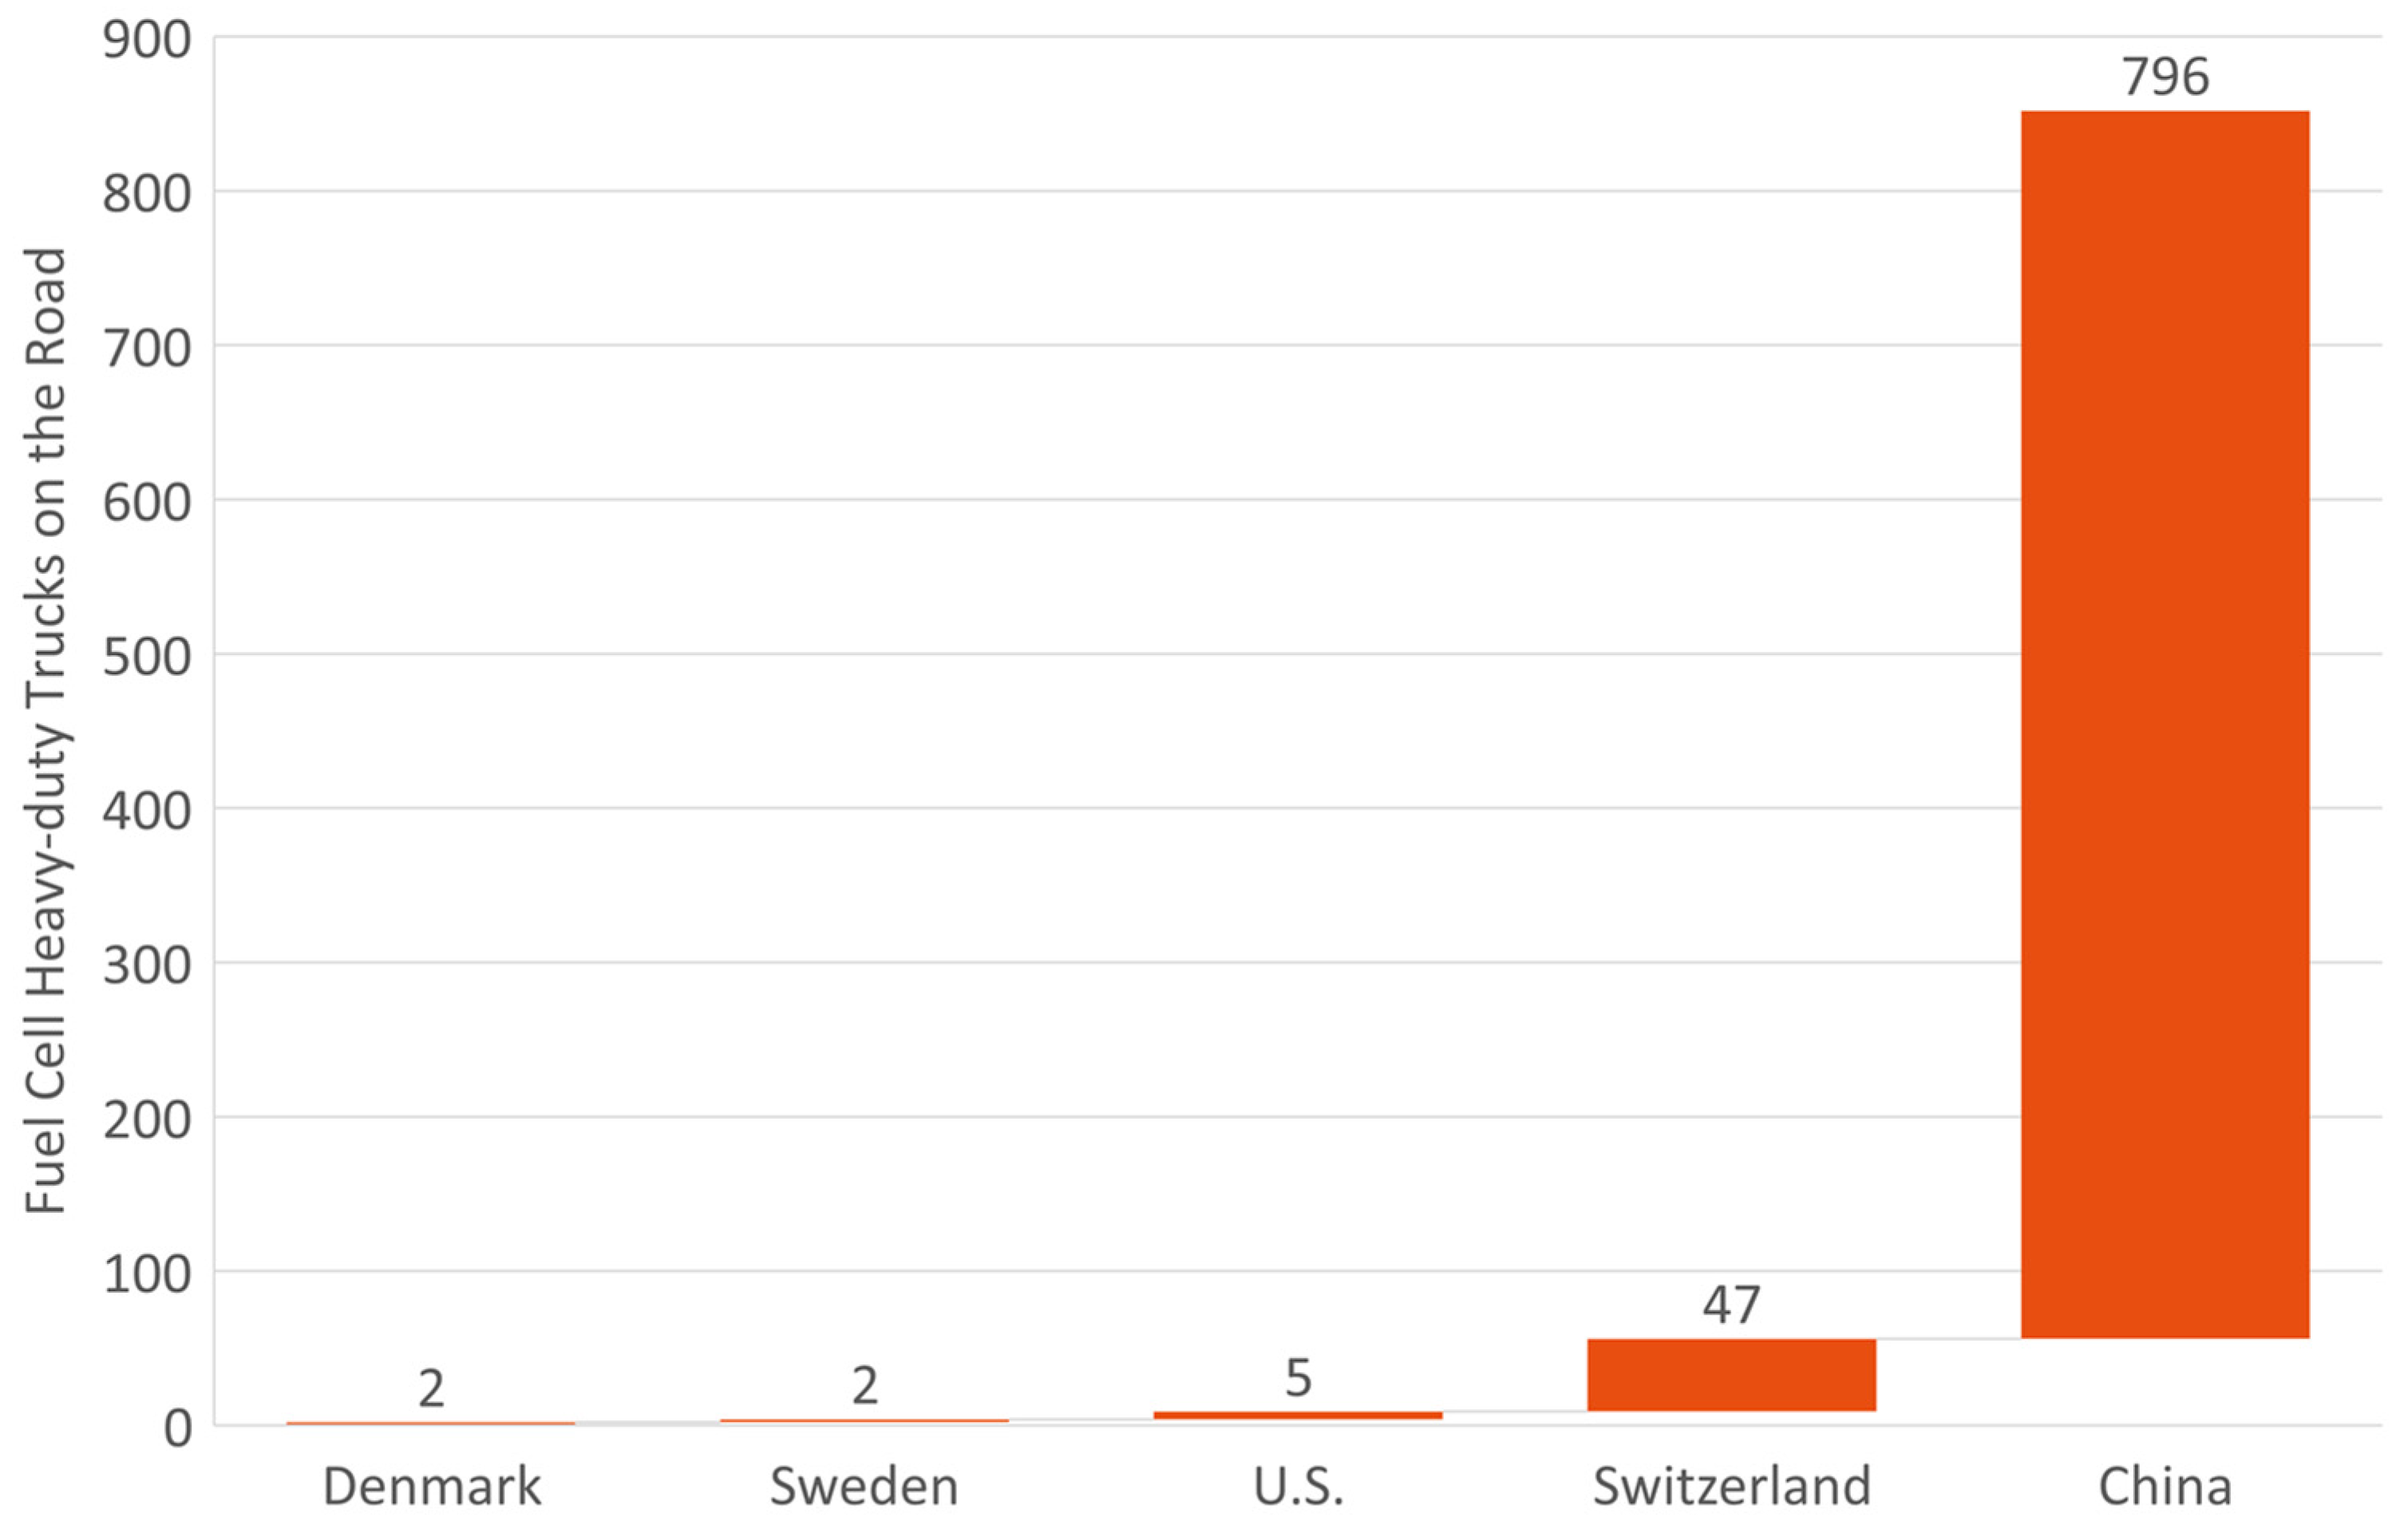
Figure 11. Although the ranking did not change in 2021, the share of vehicles in South Korea increased strongly, from 29% to 38%, leading to reductions of three percentage points for the U.S. and eight for China. The shares for Japan and the rest of the world increased slightly with one percentage point each, with Germany maintaining its share at 3%. An analysis of the absolute numbers for China shows only a slight increase in the number of FCVs in the country, with only 31 vehicles. The analysis of the numbers for different vehicle categories in China shows an increase in MD (370 new units) and HD (796 new units, all new) trucks, whereas the bus numbers decreased by 1140 in 2021. The reduction was due to an overestimation in the previous year. Although the current numbers are based on vehicle registrations in China, the previous ones were provided by vehicle manufacturers and included vehicles that were planned but not manufactured and put into operation [
31].
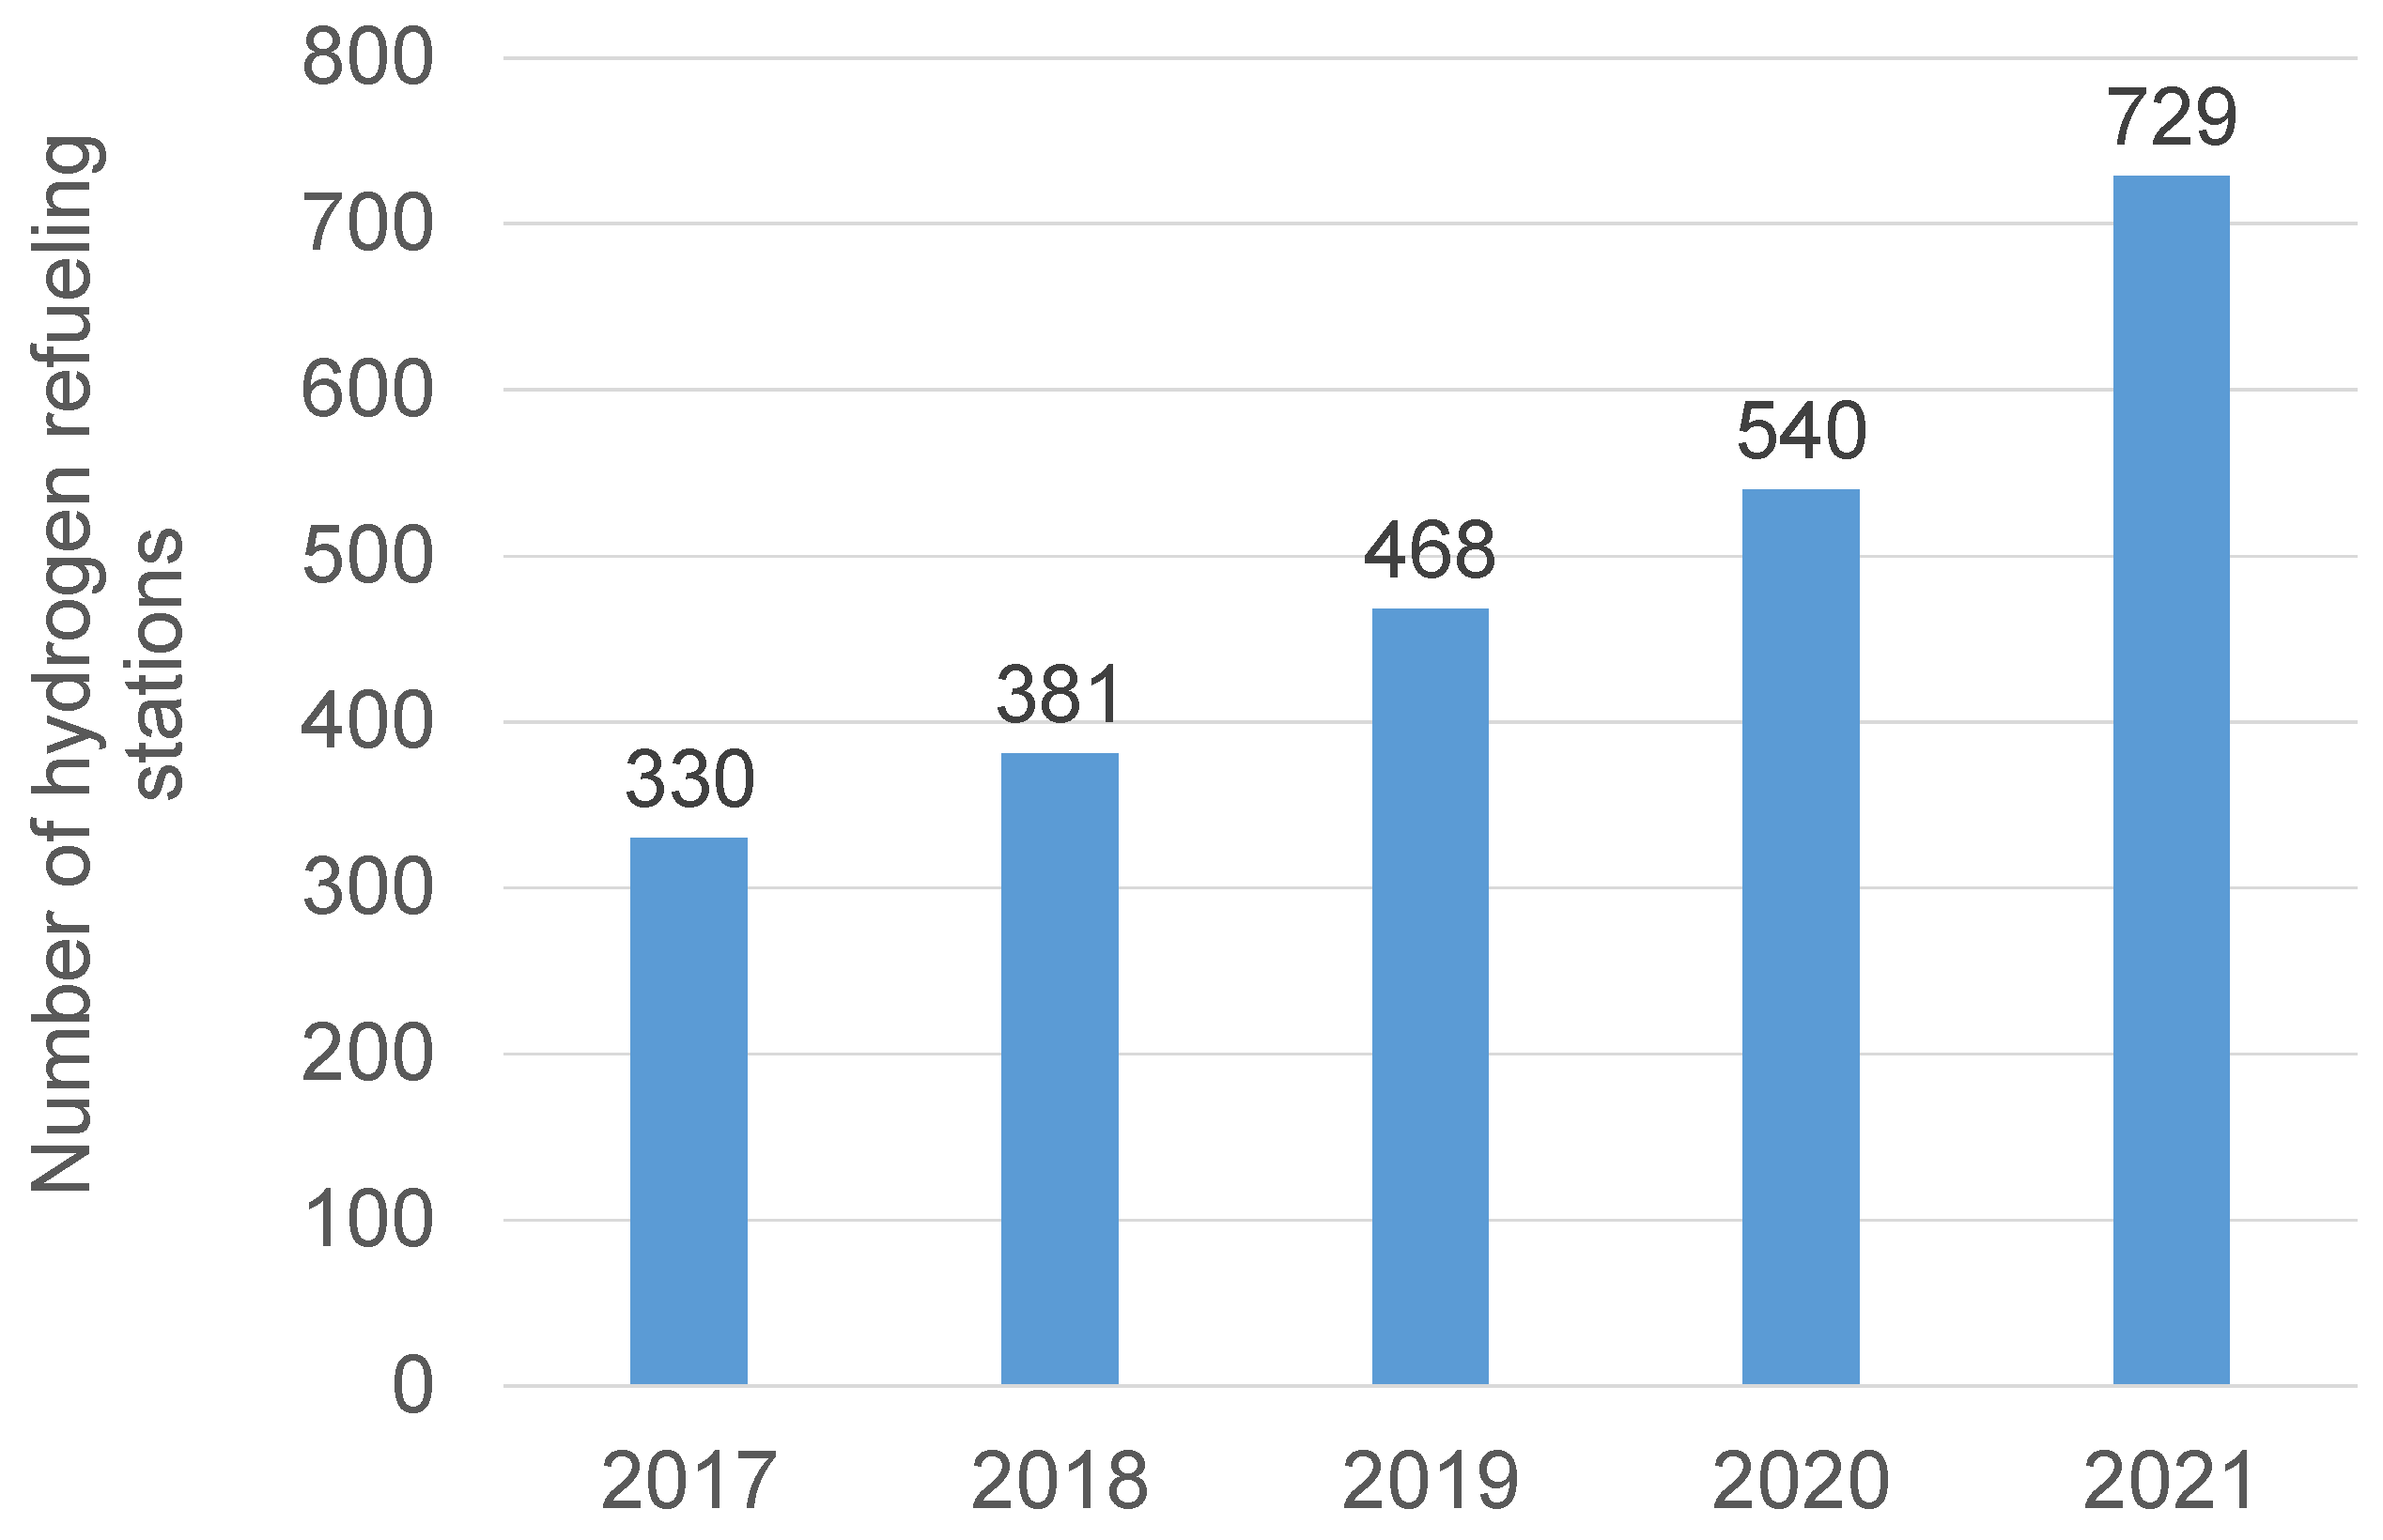
In a similar manner, the development of the HRS infrastructure will be analyzed in the next step. As can be observed in
Figure 12, 2021 exhibited the sharpest increase, both in the annual increase rate and absolute numbers. The increase rate in one year was 35%, which is even higher than that in 2019, with 23%. In absolute numbers, the number of HRSs in operation increased by 189 stations, which is more than twice the highest increase of 87 stations in 2019.
Similar to
Figure 11,
Figure 13 compares the shares of HRSs in countries that were operating more than 50 facilities at the end of 2021. Here, it is clear that not only the shares but also the ranking changed. Japan remained in first place, with a slight reduction of the share of 2 percentage points and 32 new stations. With strong increases of 73% and 120% in one year, respectively, each with 62 new stations, China and South Korea took over the second and third positions from Germany and the U.S., which showed very moderate increase rates in 2021, with one station in Germany and four in the U.S. China and South Korea increased their share by four and seven percentage points, respectively, whereas Germany had a reduction of four percentage points and the U.S. three. France kept its share constant, with 13 new HRSs and the rest of the world now has a slightly reduced share of two percentage points.
Taking a deeper look at the stagnating development status in Germany, we can see that 17 further stations were in different phases of development (four in the planning stage, one in approval, five in execution, seven in commissioning and trial operation) at the end of 2021, and this network is considered the basic network for 700 bar refueling. Starting from 2021, HRSs will be positioned in such locations, where a short-term demand for logistical vehicles is expected, and where rising demand for public stations for passenger cars seems meaningful [
70].
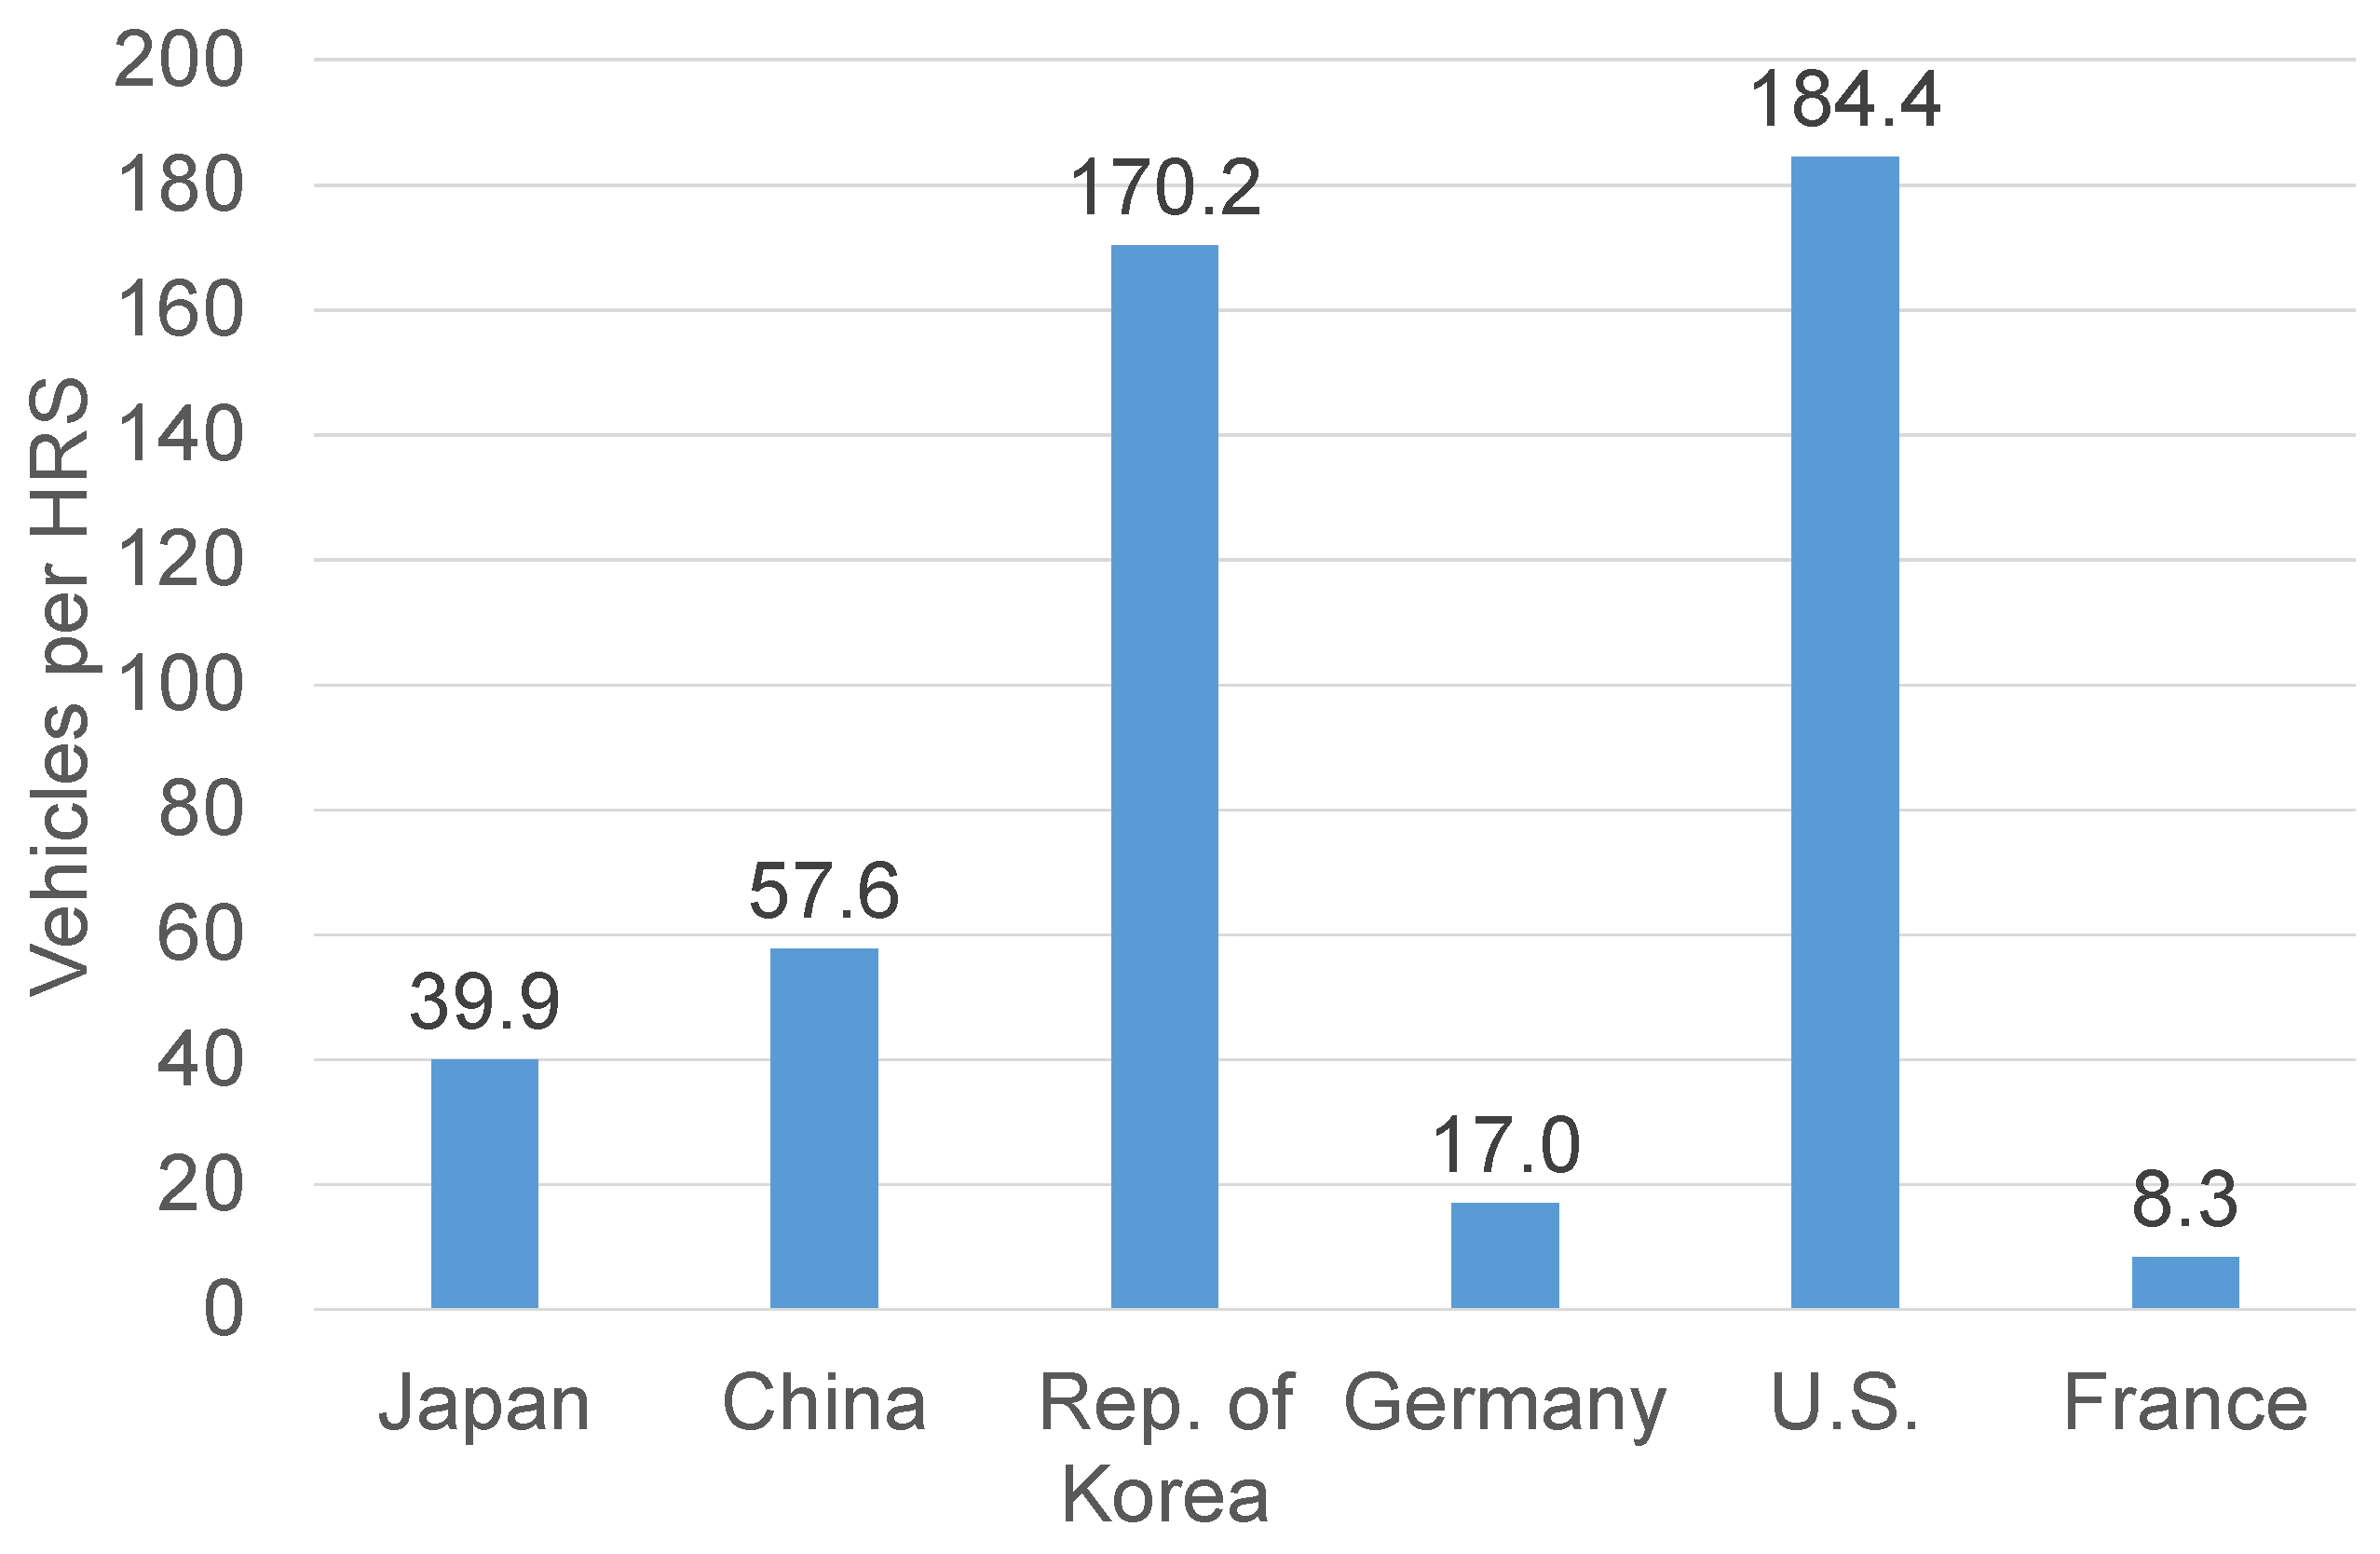
For the next analysis, the numbers of FCVs on the road are combined with the numbers of HRSs in operation for a basic analysis. The top six countries with more than 50 HRSs were selected. For each country, the number of vehicles was divided by the number of HRSs as of the end of 2021 to obtain a first figure on the number of vehicles per HRS in the particular country.
Figure 14 shows the resulting numbers, starting with Japan, featuring the highest shares of HRSs. The utilization per station seems to be the highest for South Korea and the U.S. In these countries, each station would serve 170–185 FCVs, if each vehicle were to be mathematically allocated to a certain station. Japan and China follow after a big gap, for despite the highest number of HRSs, only 40–58 vehicles are allocated to each station. In the two European countries of Germany and France, the utilization of the stations seems to be low in comparison, with each station serving 8–17 vehicles. As already mentioned, the analysis performed here is a basic one and does not enable the exact allocation of each vehicle to a station.
In the example of the U.S., most of the stations and vehicles are located in California (see
Section 3), and so each station serves a very high number of vehicles in this state. The 2021 Annual Evaluation of FCEV Deployment from the California Air Resources Board (CARB) projects 176 open stations by 2026 and 2027 in California, from which locations of 110 HRSs are already defined today. With an estimated vehicle population of 67,400 units by 2027, CARB points to a four times higher FCEV deployment opportunity with the 176 stations, which would result in more than 1500 vehicles per station [
115]. In the case of 67,400 units and 176 stations, each station will serve 383 vehicles in California in 2027, which doubles the current utilization. In the detailed analyses from CARB, the longest drive to a station for a disadvantaged community corresponds to 15 min.
In a recent conference presentation from Paquet et al., Toyota Motor Europe pointed out that HRS utilization must be significantly increased to secure the viability of the stations [
135]. They report the average number of FCEVs per station to be around 16 at present, which is in good agreement with the 17 vehicles per HRS in Germany in our analysis. Their investigation specifies a requirement of 500 passenger cars per station using blue hydrogen or 833 using green, assuming that each car consumes 0.33 kg/day on average. For taxis and vans consuming 2.7 kg/day, the numbers diminish to 67 vehicles using blue hydrogen or 111 using green. For fuel cell buses (30 kg/day), 15 vehicles are required using blue hydrogen or 41 using green and for fuel cell trucks (60 kg/day), 24 vehicles are required using blue hydrogen and 73 using green [
135].
Back in 2017, Melaina et al. from the National Renewable Energy Laboratory (NREL) published a detailed report as part of the H
2USA Locations Roadmap Working Group on the nationwide development of an HRS network in the U.S. [
136]. They developed three scenarios with different expansion cases and estimated the total FCEV stock and the numbers of HRSs for 2025, 2035, and 2050. According to the scenario analysis results, the average number of vehicles per station increases from 320 in 2025, to 1270 in 2035, and 2960 in 2050. In comparison, they report a ratio of about 2000 gasoline vehicles per gasoline station in the U.S. [
136]. For Germany, about 48,500,000 passenger cars were registered in 2022, being served by around 14,450 fuel stations and resulting in a ratio of 3350 cars per station [
137,
138].
The next question is how to interpret the numbers from a particular country. To answer this, first, the number of all registered vehicles in a country was analyzed based on input from the World Health Organization (WHO) [
139], together with the number of FCVs in that country, in order to determine if there are any clear correlations between the number of all vehicles and FCVs.
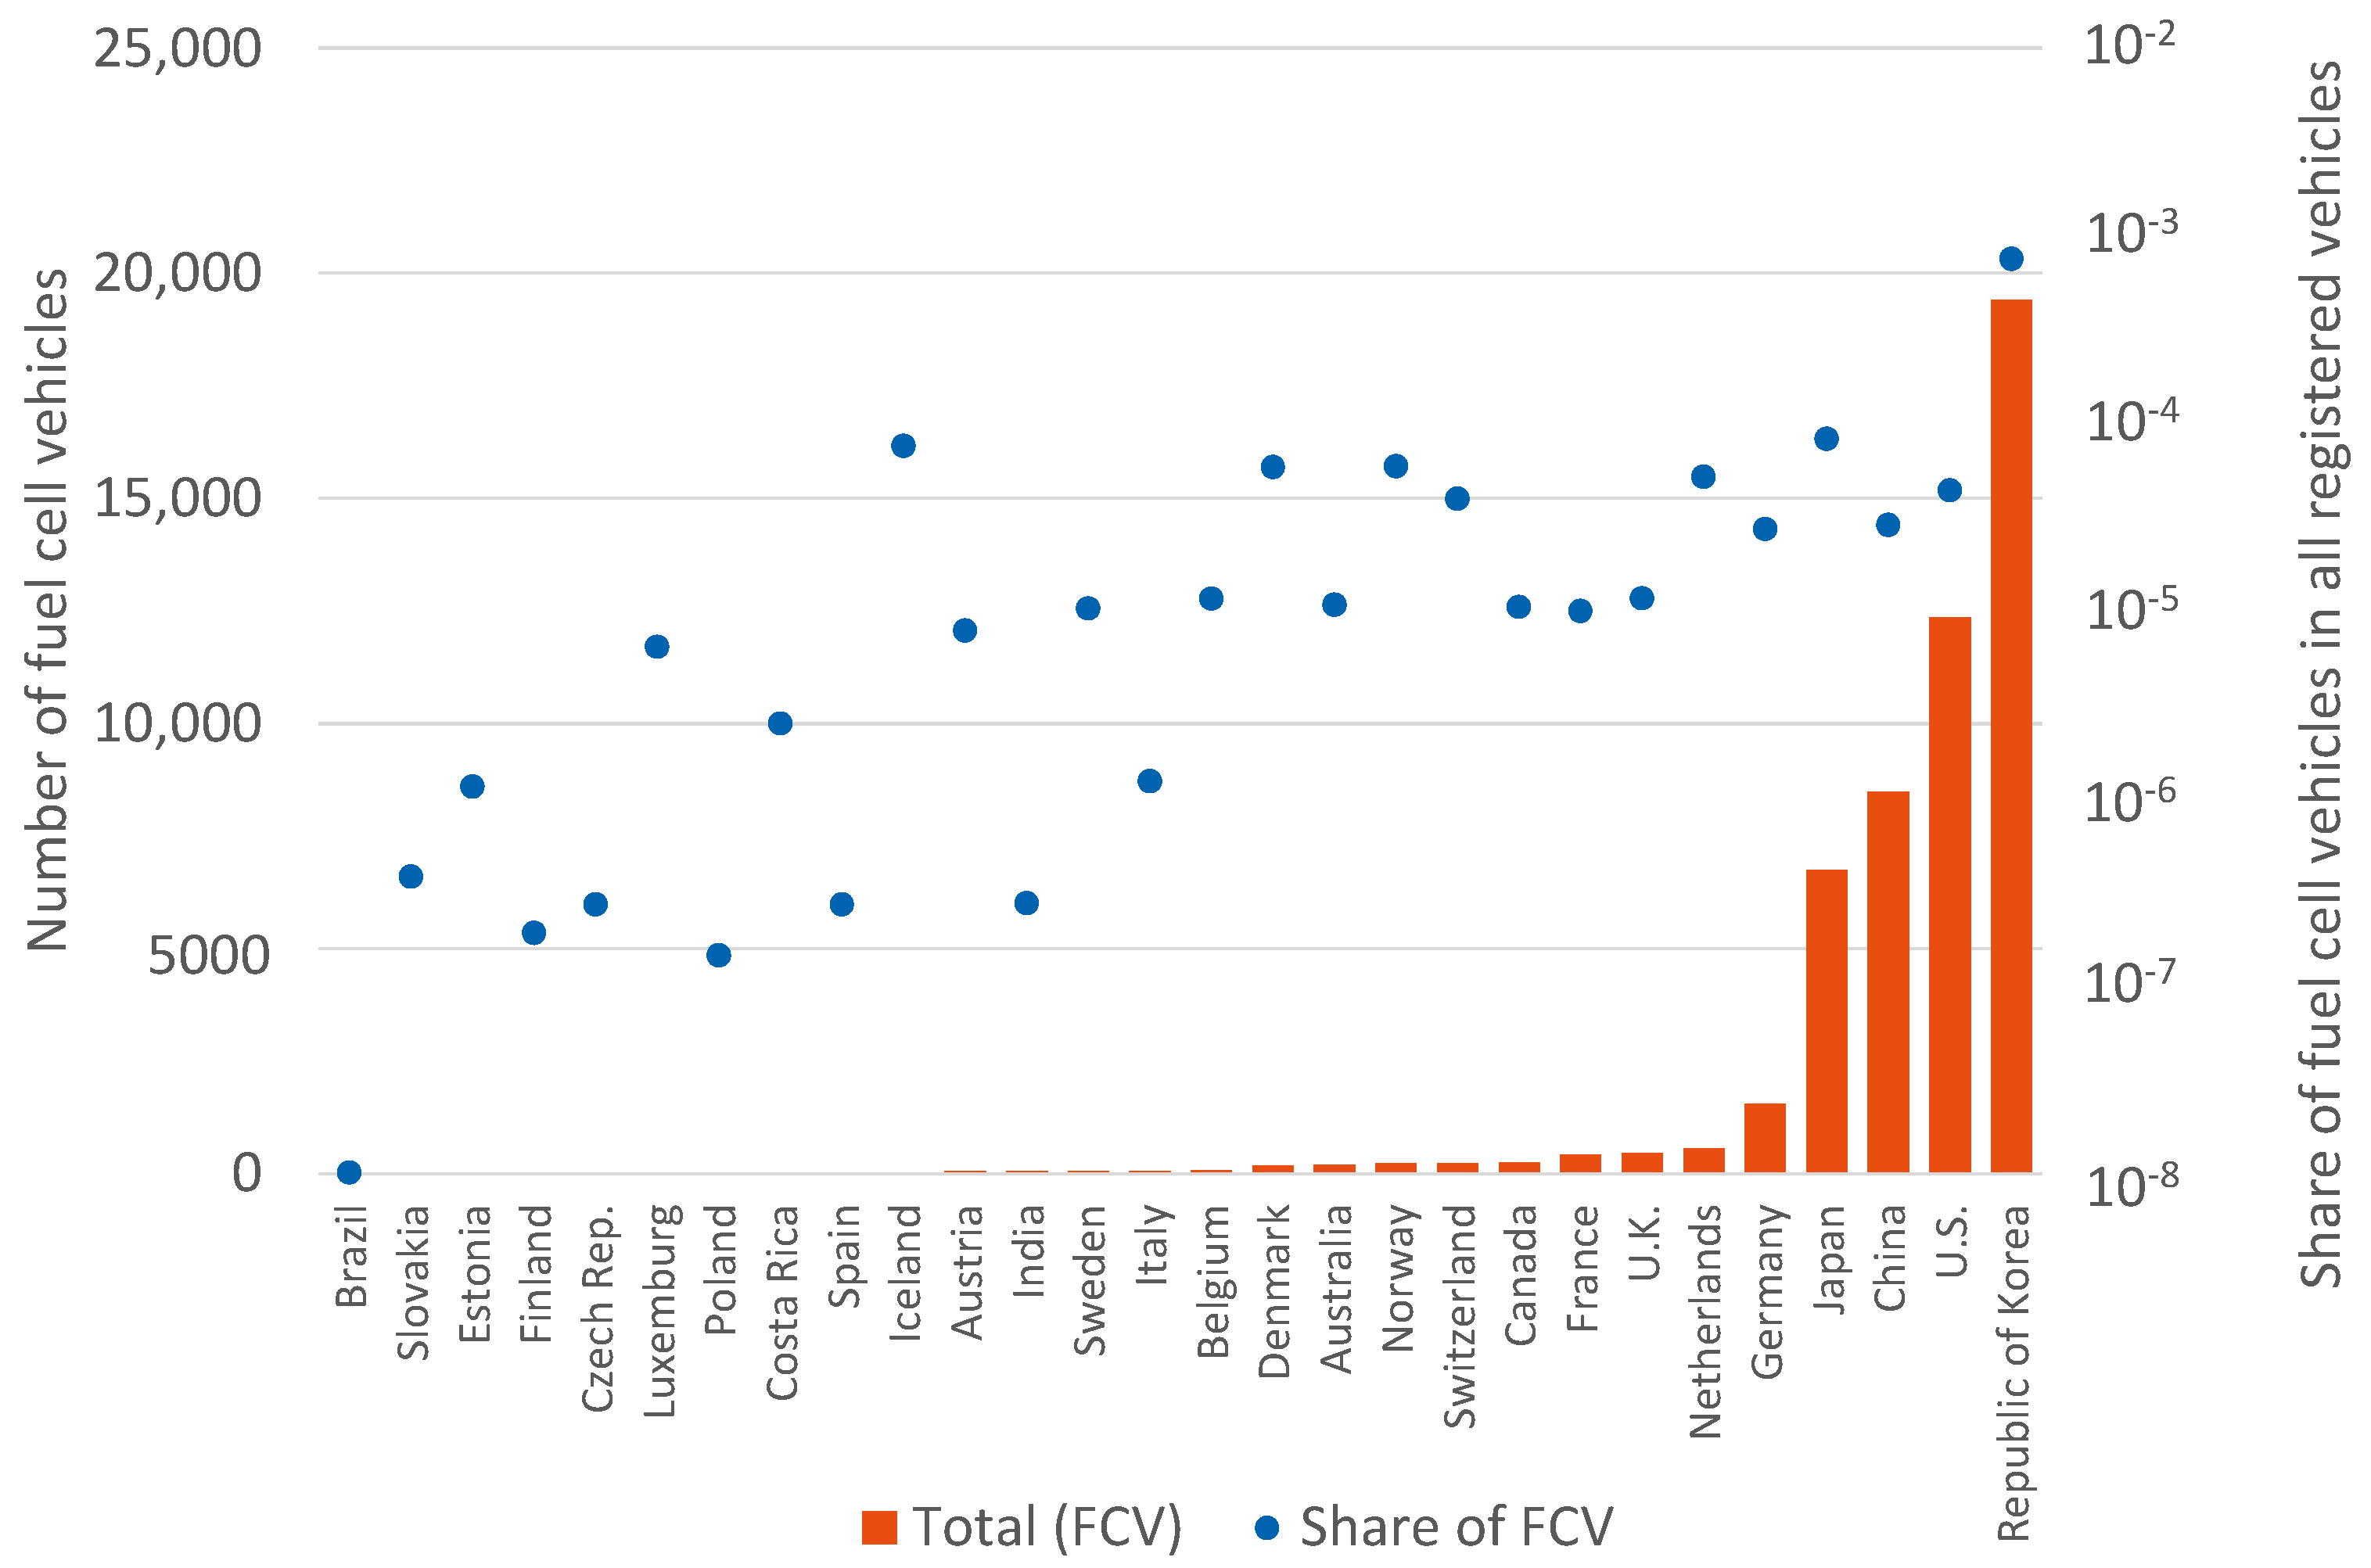
Figure 15 displays the number of FCVs from all vehicle classes in each country, together with their share in all registered vehicles in that country. With the two countries of China and the U.S. having the highest number of all registered vehicles, the numbers of FCVs are also high, with the U.S. and China being in second and third places. However, countries like India and Brazil, being in the third and fourth places for all registered vehicles, bring a very low number of FCVs to the road. Another distinction is present in the case of South Korea, as this country has the highest number of FCVs globally, despite the number of all registered vehicles being at a comparably average level, in 12th position. An analysis of the share of FCVs among all registered vehicle types supports this finding, with the share in South Korea being approximately at least an order of magnitude higher than any other country worldwide. In South Korea, every 1323th vehicle is an FCV. This exceptional ratio should be interpreted by recalling the incentive mechanism In the country outlined in
Section 4, which was also fairly different from other countries and the ambitious national plans noted in
Section 5. For the U.S., every 22,764th vehicle is a fuel cell one, and in China it is every 34,776th. Japan makes up the higher band, together with Iceland, for the remaining countries other than South Korea, with every 12,150th and 13,159th vehicle, respectively, operating on fuel cells. The shares in Germany and the Netherlands are comparable with those in the U.S., China, and Japan. In the next group of countries between the U.K. (449 FCVs) and Belgium (85 FCVs), the share varies in the window between 10
−4 and 10
−5. In the final group between Italy (65 FCVs) and Slovakia (one FCV), the shares drop further and vary in a larger window between 10
−5 and 10
−7. One exception in this group is Iceland, as already noted. It is also remarkable that the share in Brazil is the lowest due to there being only one FCV, despite the very high number of registered vehicles in this country.
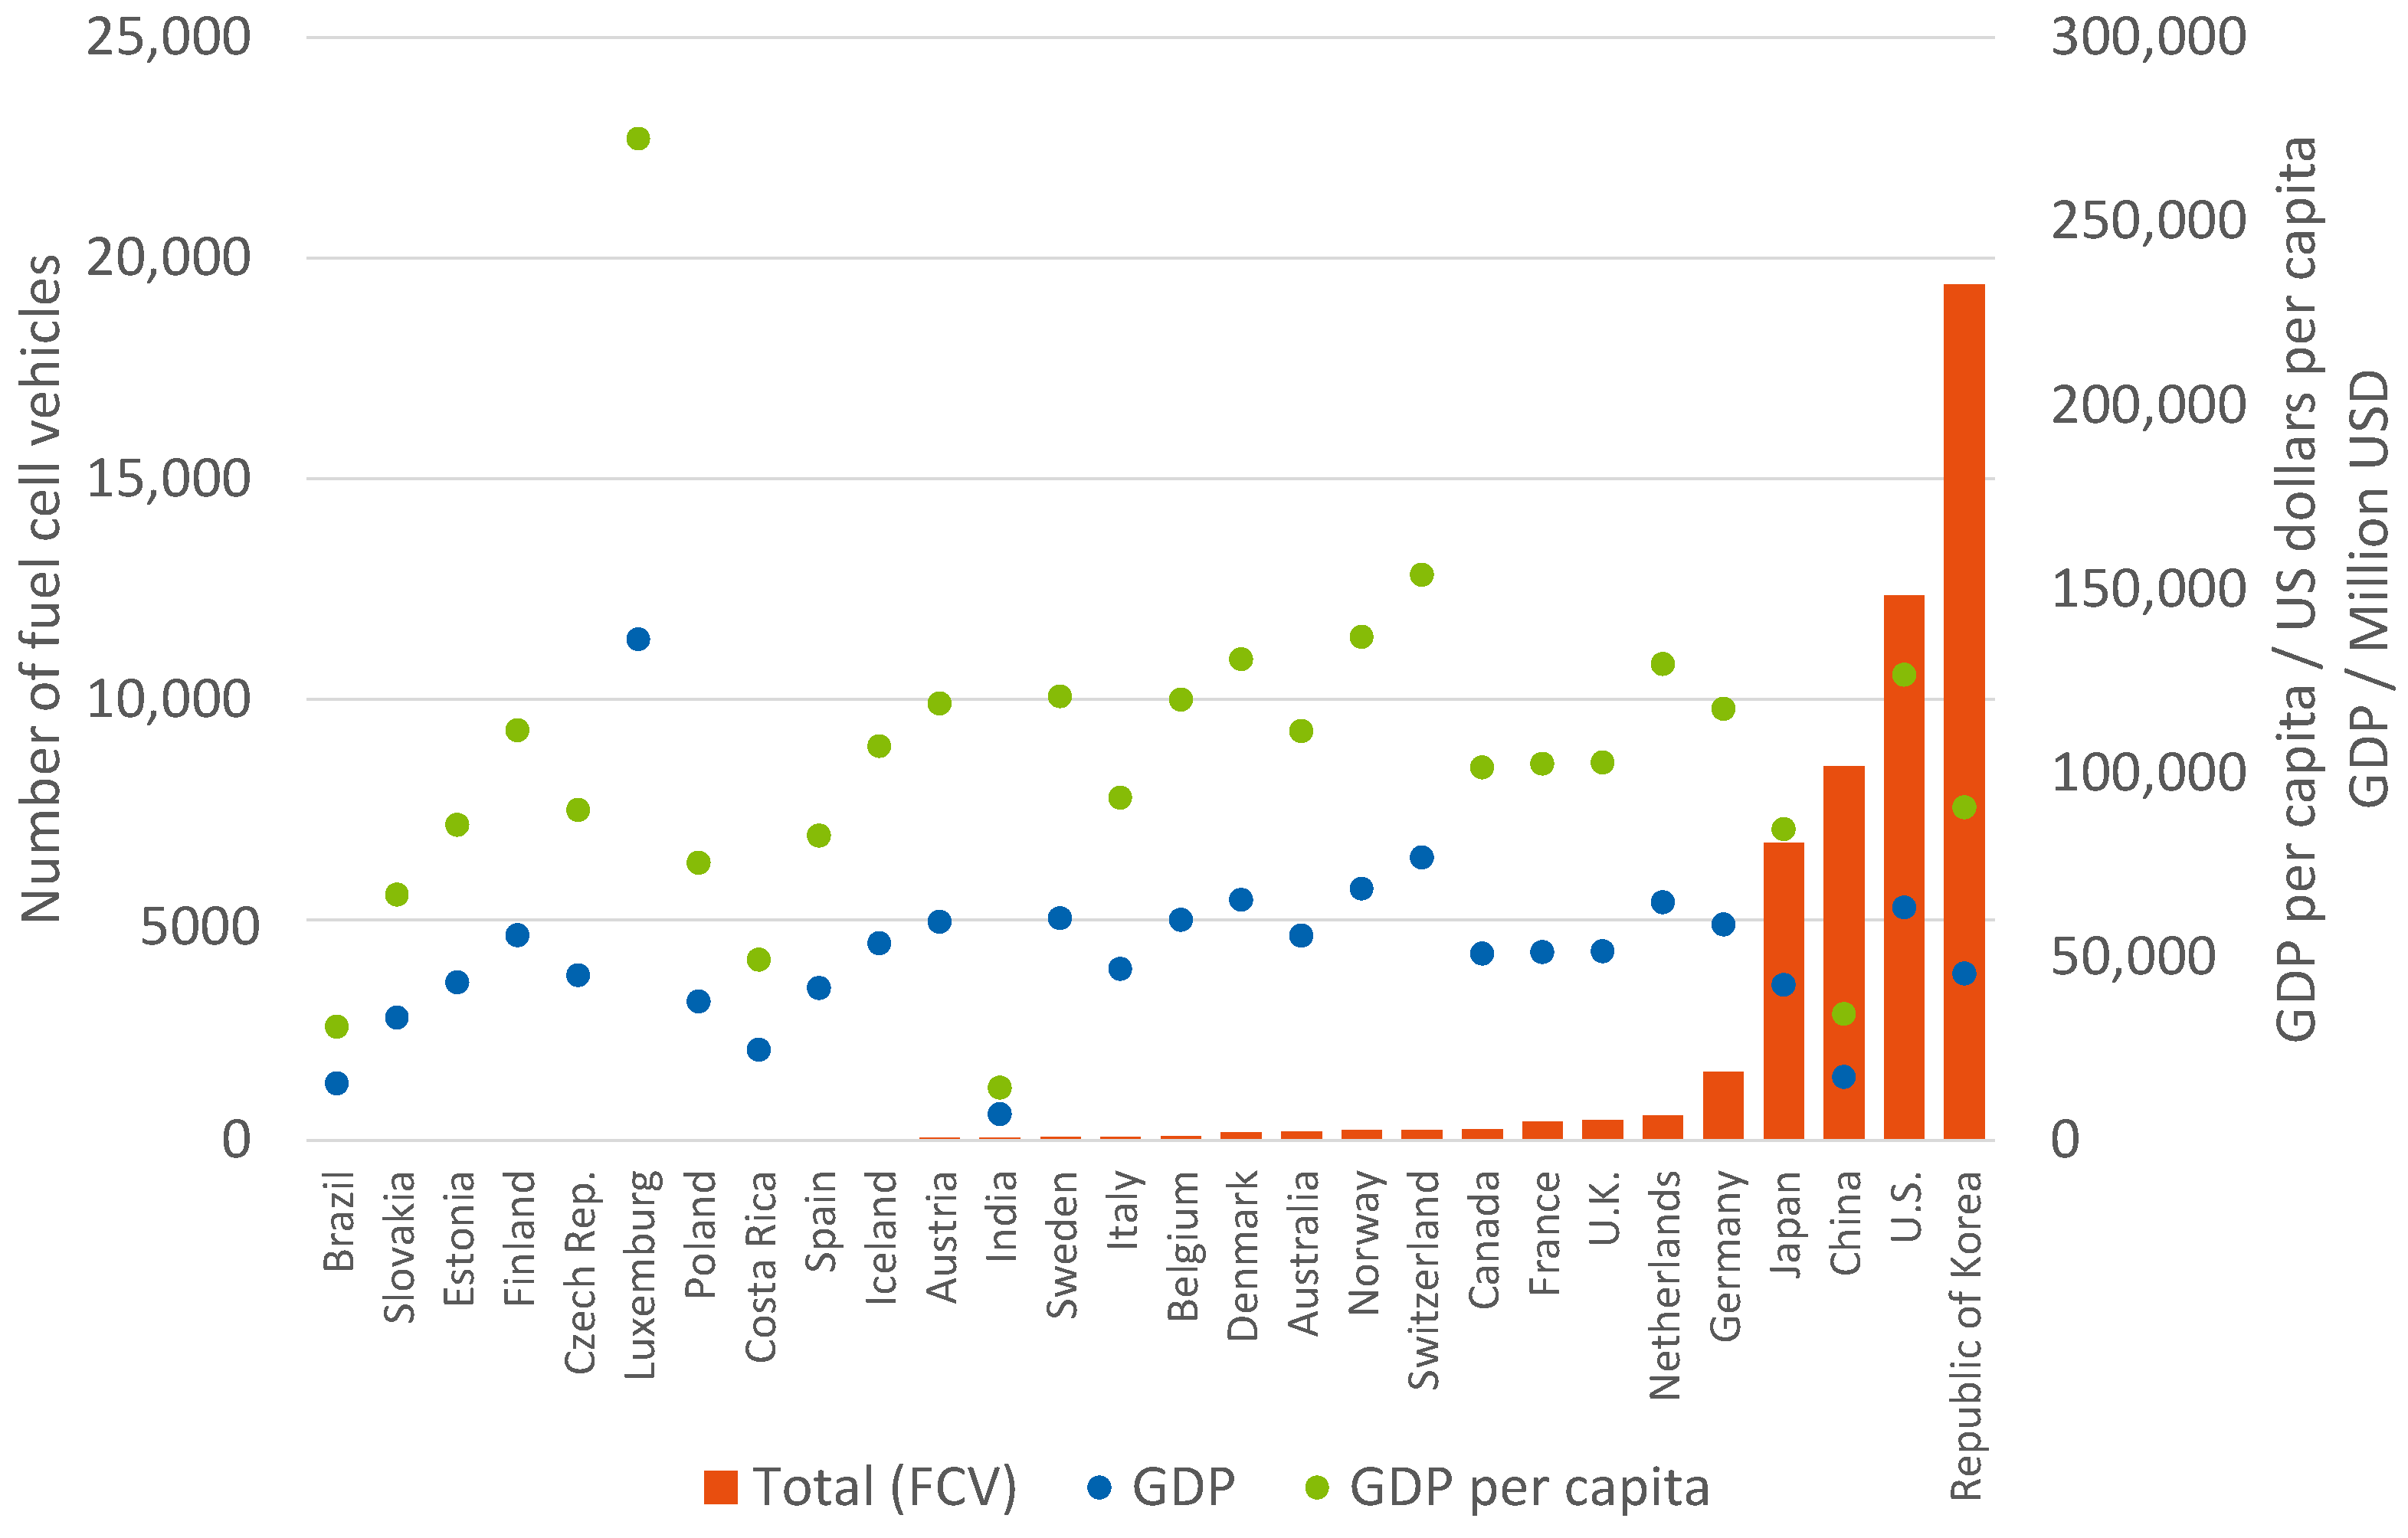
In a further analysis, gross domestic product (GDP) and gross domestic product per capita based on OECD data [
140] were related to the number of FCVs in each country. An analysis of the general trends for GDP and GDP per capita presented in
Figure 16 does not show any clear correlations between these values and the number of FCVs in the country. Among the top four countries in terms of FCV numbers, the U.S. has the highest GDP and GDP per capita, at comparable values with many European countries with lower numbers of FCVs. South Korea and Japan have similar GDPs and GDP per capita, not higher than those countries in the group having 60–1450 FCVs. However, both South Korea and Japan have much higher numbers of FCVs on their roads. China is another extreme example, with a rather low GDP and GDP per capita, but still having the third ranking in terms of the number of FCVs. This brief analysis shows that there is no relation between the GDP or GDP per capita and the number of FCVs in a country. The deployment of FCEVs appears more connected to political and industrial policies.
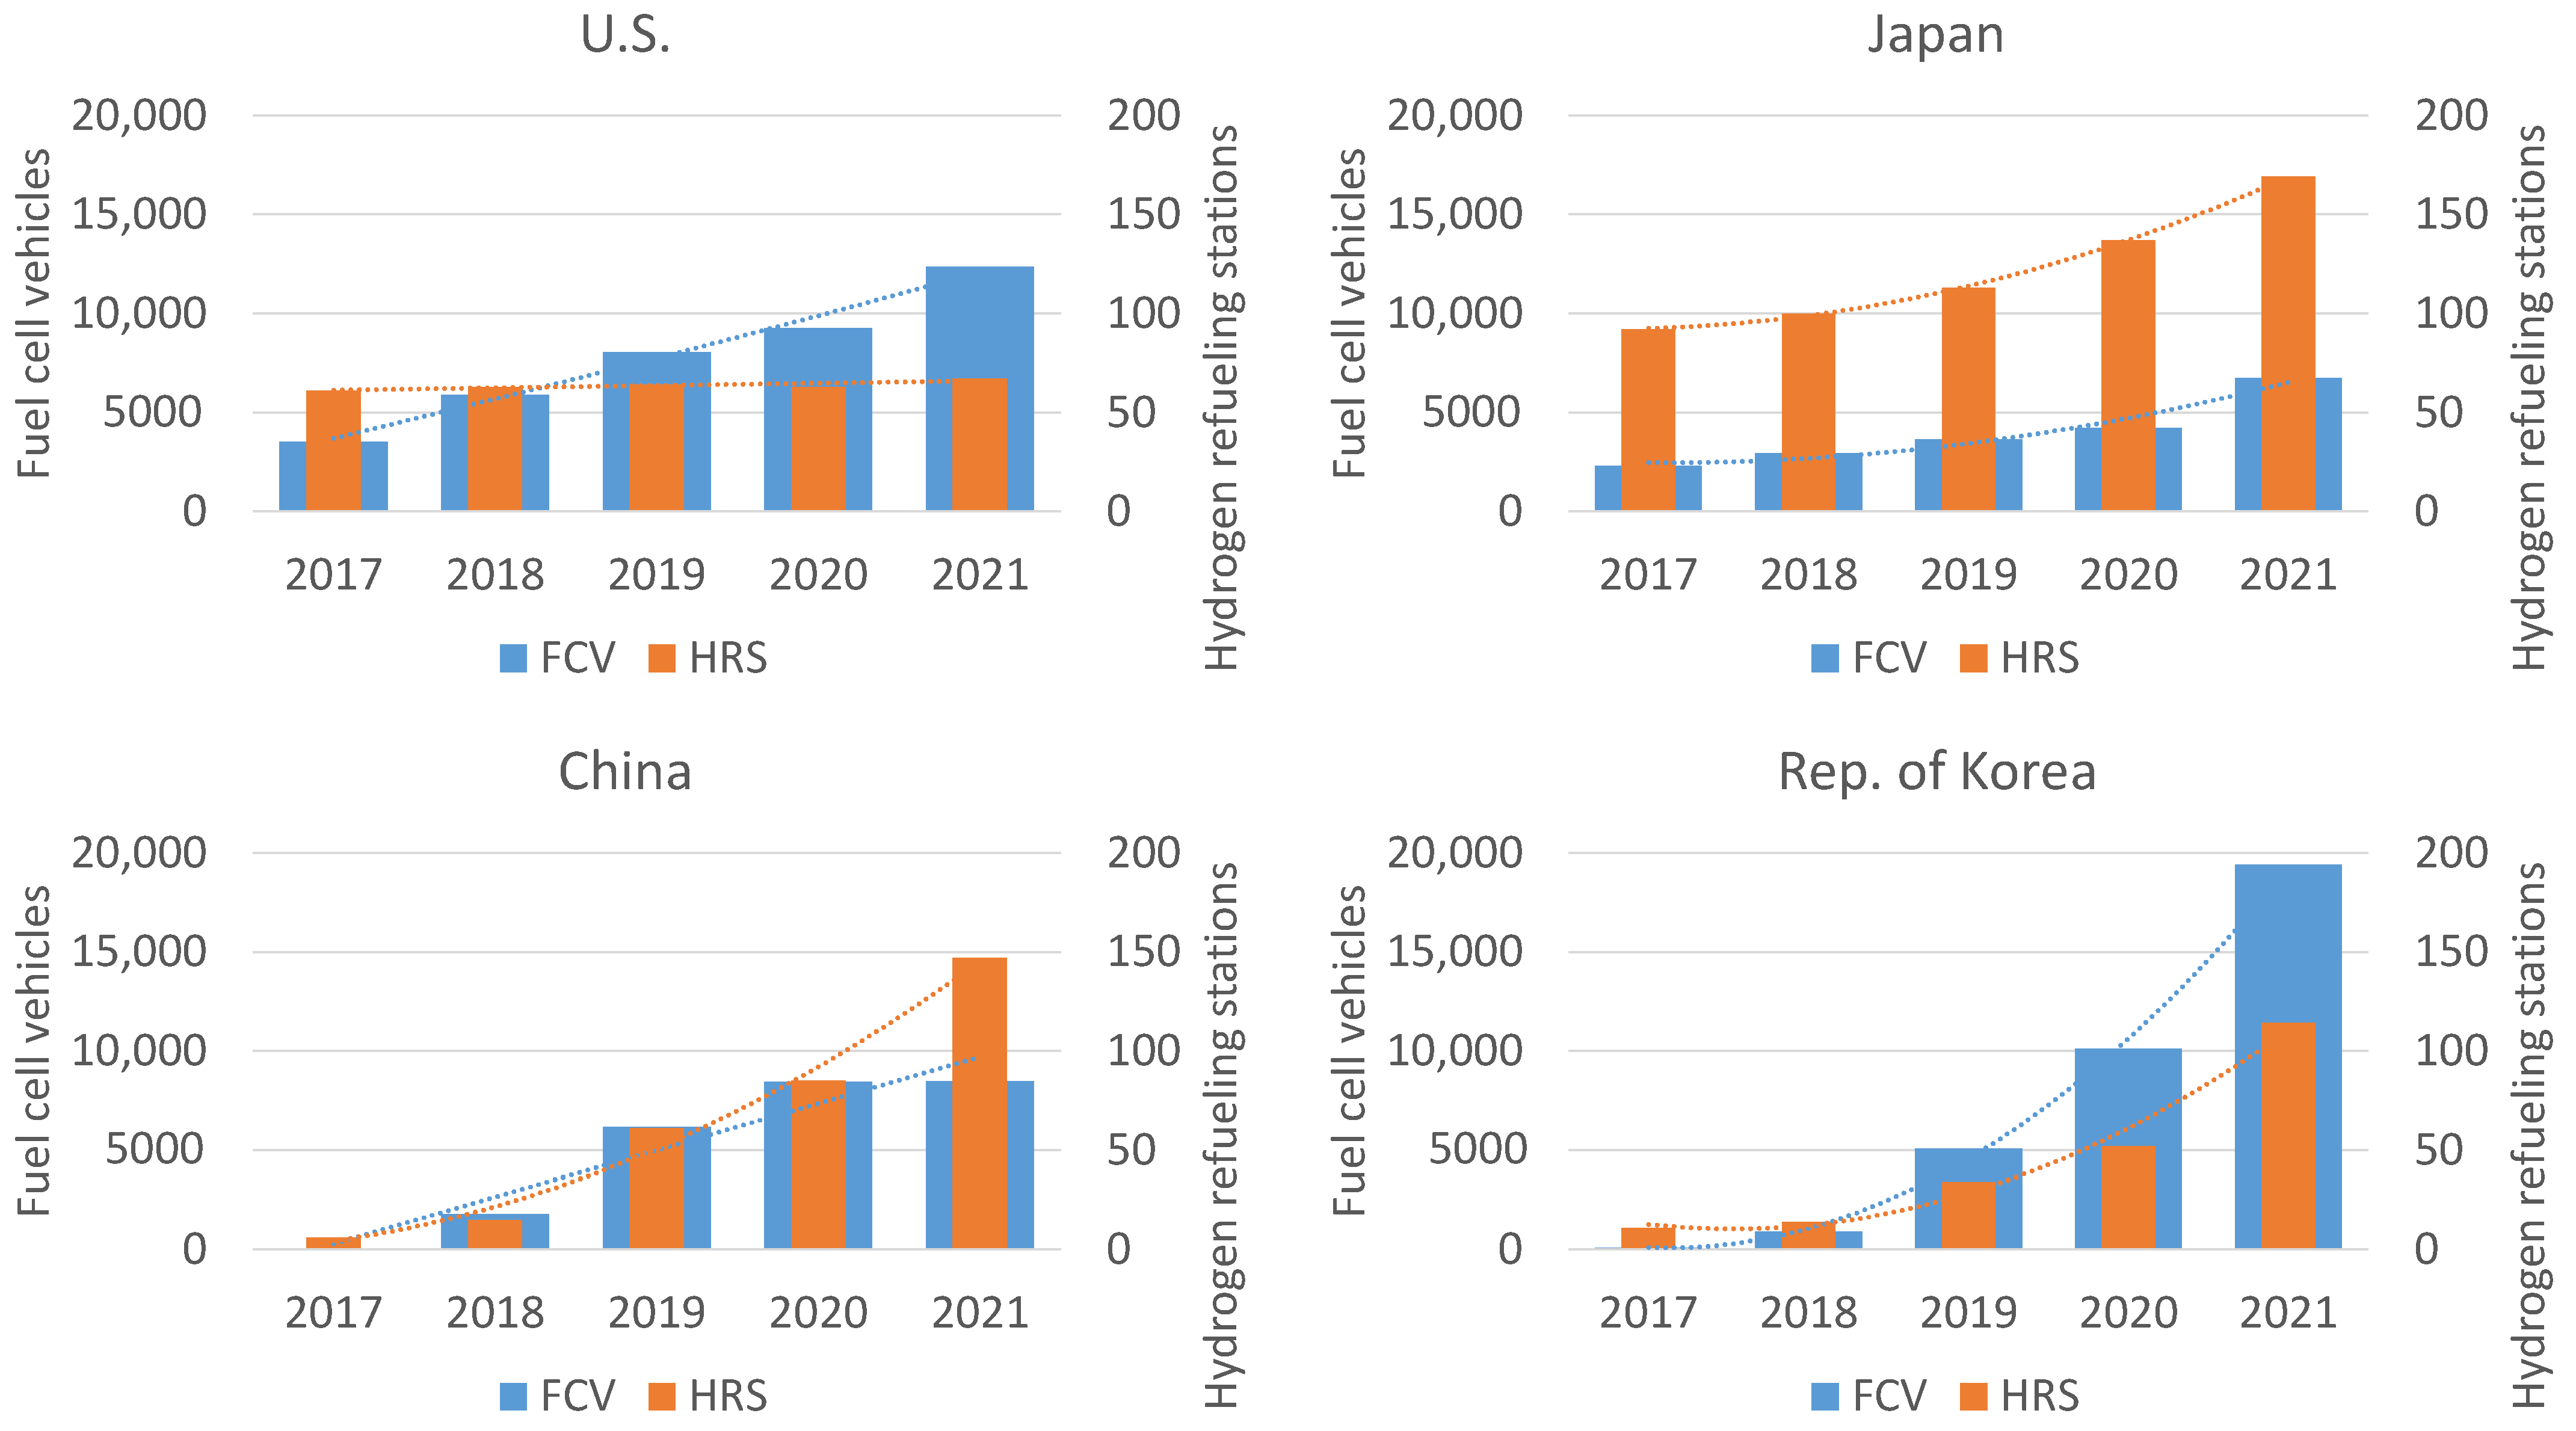
As the next analysis step, the focus is placed on the development of the numbers of FCVs and HRSs in the top four countries with the highest numbers of FCVs as of the end of 2021. For this purpose, the numbers were put on a common chart and the development trends drawn with the help of different functions in
Figure 17. All charts use the same maximum values on their y-axes for a better comparison of the trends. Starting with the U.S., the number of HRSs was already high in 2017, but showed only a slight increase over the years, which can be expressed by a linear trend. The vehicle numbers show a more dynamic trend, with the exception of the slower increase in 2020 due to the pandemic and the overall increasing trend can be defined by a polynomic trendline of the second degree. In Japan, both categories show a more dynamic trend, whereas the increase in the last year is especially remarkable, and therefore both trends are described in terms of a polynomic trend. An even stronger dynamic is observed for China, especially given that there were almost no vehicles in 2017 and the number of HRSs was very low in the first year of analysis. Due to a minimal increase in 2021, which was explained earlier in this section, the FCV development is described by a linear trend, whereas the HRS development trend uses a polynomic trendline of the second degree. South Korea exhibits from the beginning a very dynamic increase rate, which can only be described by a second-degree polynomic function. However, the trend is not an exponential one, as it would require an even higher number of vehicles in 2021.
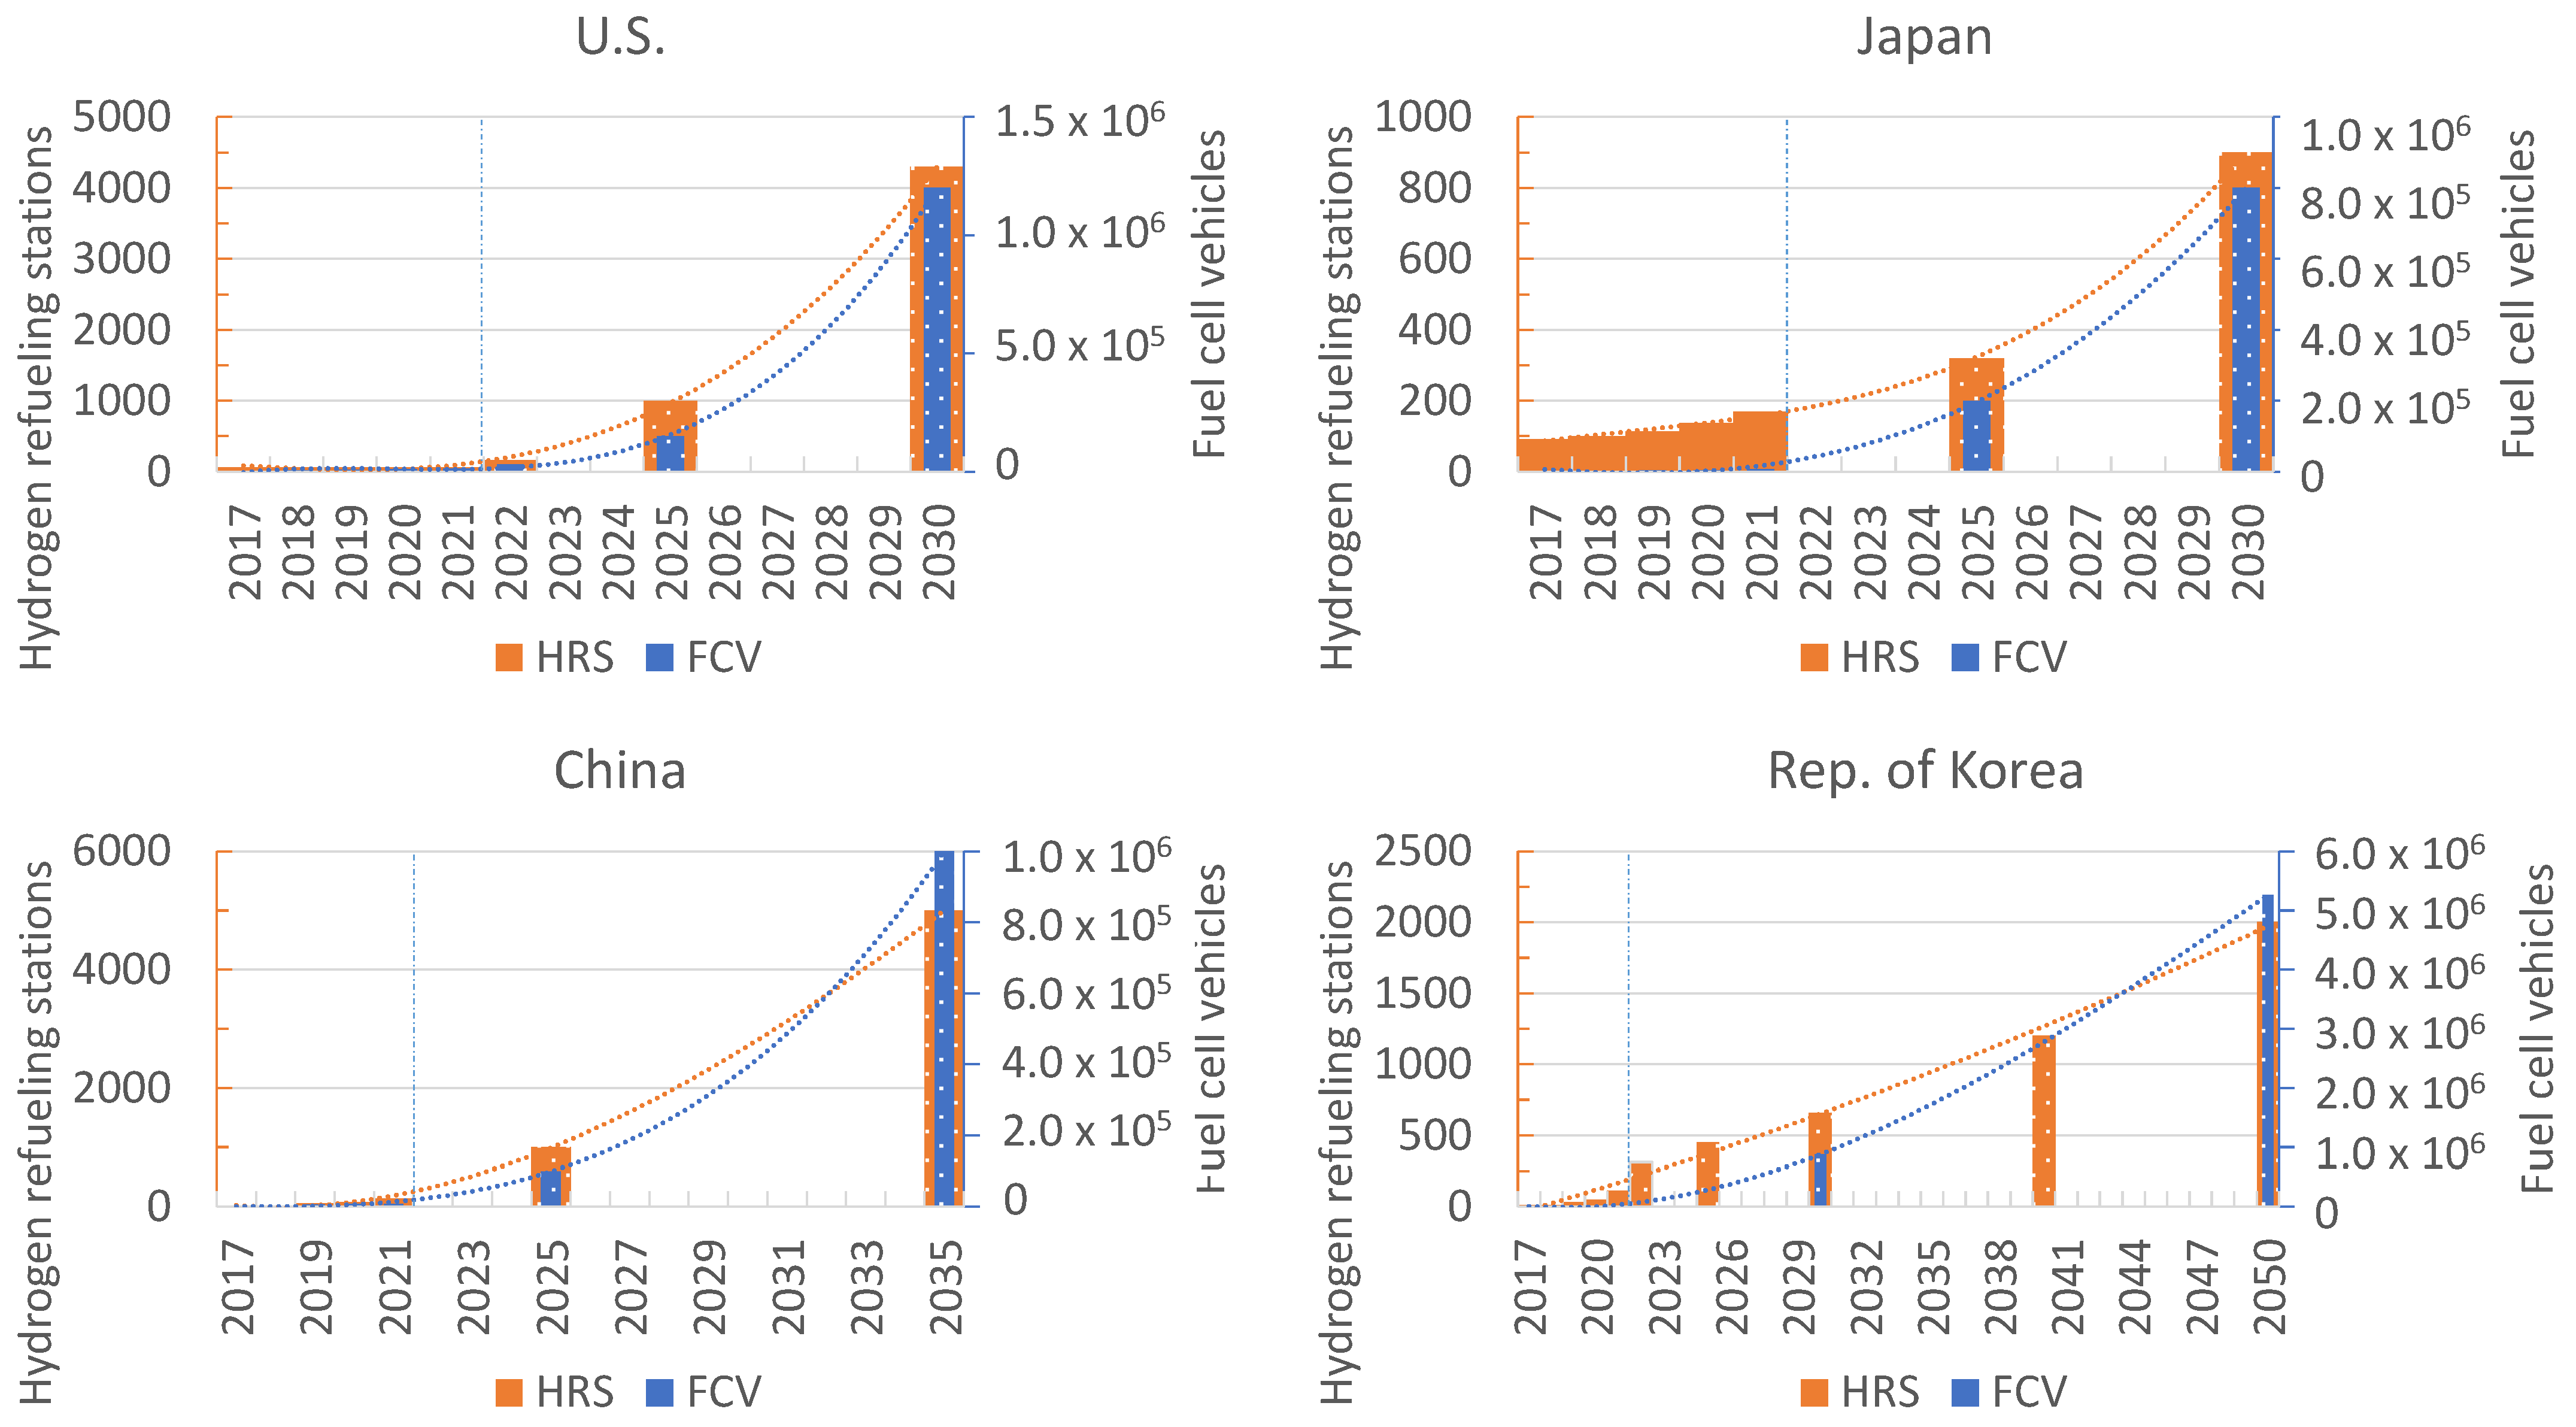
In the next analysis, the development trends in the last five years will be combined with the announced roadmaps or national targets for the same countries. The Basic Plan for Implementing the Hydrogen Economy of Korea [
113] defines targets for 2022, 2025, 2030, 2040, and 2050. The Roadmap to a U.S. Hydrogen Economy [
114] sets milestones for 2022, 2025, and 2030. The Technology Roadmap for Energy-Saving and New Energy Vehicles [
117] in China defines targets for 2025 and 2030–2035 and, similarly, the Strategic Road Map for Hydrogen and Fuel Cells [
118] in Japan defines targets for 2025 and 2030. Due to different time scales and the resulting numerical targets in each of the four countries, the axis windows could not be kept the same in each diagram in
Figure 18, which combines the achieved (2017–2021, this work and previous survey results) with the target numbers from the four sources mentioned above and discussed in detail in the previous section. To separate the realized numbers with those from the targets, the targets (2022–2050) are marked with dots in the figure. As the realized numbers are relatively low compared to the target numbers, in most of the cases third-degree polynomials are required to draw the trend lines combining the present numbers with the plans. One exception is the case for HRSs in South Korea. As the targets are defined for many more years, a second-degree polynomic function can describe the curve there well. Another remarkable deviation in the general trends is for HRSs in Japan. As the end target is already defined for 2030 and is on the same order of magnitude as the current numbers, the present HRS numbers are also fairly apparent for Japan.
To understand the dynamics of the trends, the resulting annual increase rates will be analyzed in the next step. The analysis of the annual increase rates for the development of the vehicle numbers reveals that the highest increase is seen in the first year of the development prognosis curves. The increase rate is the highest for Japan, with 533%, followed by 296% for South Korea, 209% for China, and 143% for the U.S. in the first prognosis year (2022). For the second year (2023), the increase rate already drops to 32% from 88% and becomes comparable with the values reported in recent years for FCVs. From the third year on, which corresponds to 2024, the Korean annual increase rate drops from 52% over the years to 5% in 2050. For China, the increase rate drops from a comparable value of 55% in 2024 to 18% in 2035, and for Japan from 64% to 25% in 2030. The U.S. exhibits a different behavior here, whereas the first target year is already 2022, as the roadmap was already defined earlier. Here, the increase in the first year was the lowest, as it was defined by the target and not the polynomial function. Therefore, a second strong increase in the annual increase rate is observed for the U.S. in the third year, 2024, and from then on the increase rates drop to 37% in the last target year of 2030.
As discussed earlier, a strong increase in the annual increase rate brings the stock to a higher level and further high increases in the absolute numbers are not necessarily accompanied by a high increase rate. For example, in the case of the highest increase rate in 2022 in Japan, with 533%, the stock increases by 35,900 vehicles in one year. In the following year, where the annual increase rate corresponds to 88%, the absolute increase is even higher, with 37,400 new vehicles. With this, it is clear that the number of new vehicles introduced increases every year, due to the polynomic function, despite the decreasing annual increase rates. A snapshot for 2030 for each country shows 80,000 new vehicles for China, 141,000 for Korea, 162,000 for Japan, and 322,000 for the U.S. There are a few exceptions to this trend. One is caused by the second strong increase for the U.S. in 2024, the other being for a slight reduction in the absolute stock increase in 2023 for South Korea, which is solely due to mathematical reasons. It should also be noted that approximately 130,000 FCVs must be put into operation in 2022 in these four countries for the required annual increase rates for the year 2022 to be realized. This is compared to approximately 16,500 FCVs that were registered in 2021. As a result, it can be concluded that such an increase in the annual production rate is not in sight for 2022, and this fact increases the pressure on the upcoming years and makes it challenging to reach the set targets.
If the same analysis is performed for HRS development, a similar picture appears. The highest annual increase rates arise in the beginning, with 172% for South Korea, 127% for China, and 146% for the U.S. The second-degree polynomial selected for South Korea leads to slightly lower numbers than the targets at first, which is corrected by 2030. Starting with 2024, the annual increase rate drops from 19% to 4% in 2050. For China, the increase rate drops from 55% in 2023 down to 11% in 2035. In the case of the U.S., the increase rate in the second year also remains high at 133%, but drops from 65% in the third year, to 27% in 2030. In the case of Japan, as the present number of HRSs is in the same order of magnitude as the final target in 2030, as noted above, the first-year increase rate in 2022 is only 9%, followed by 19% in 2023, then increasing slightly up to 23% between 2026 and 2029, and ending with 22% in 2030. With this, the number of new stations varies between 16 and 161 Japan, with an increasing number towards the end (2030). Due to the comparatively higher target of 4000 stations in the U.S. for the same year, the number of newly built stations should increase from 98 in 2022 to a very challenging number of 922 in 2030 in this country. For China, since the intermediate target in 2025 is the same, but the end target is higher and to be reached later (2035: 5000 HRS), 397 new stations are to be opened in the year 2030 and 494 in 2035, which is also challenging but less steep at the end. As the South Korean roadmap targets 2000 stations in 2050, the number of newly opened stations in one year in 2030 are 57 and in 2050 75 units.
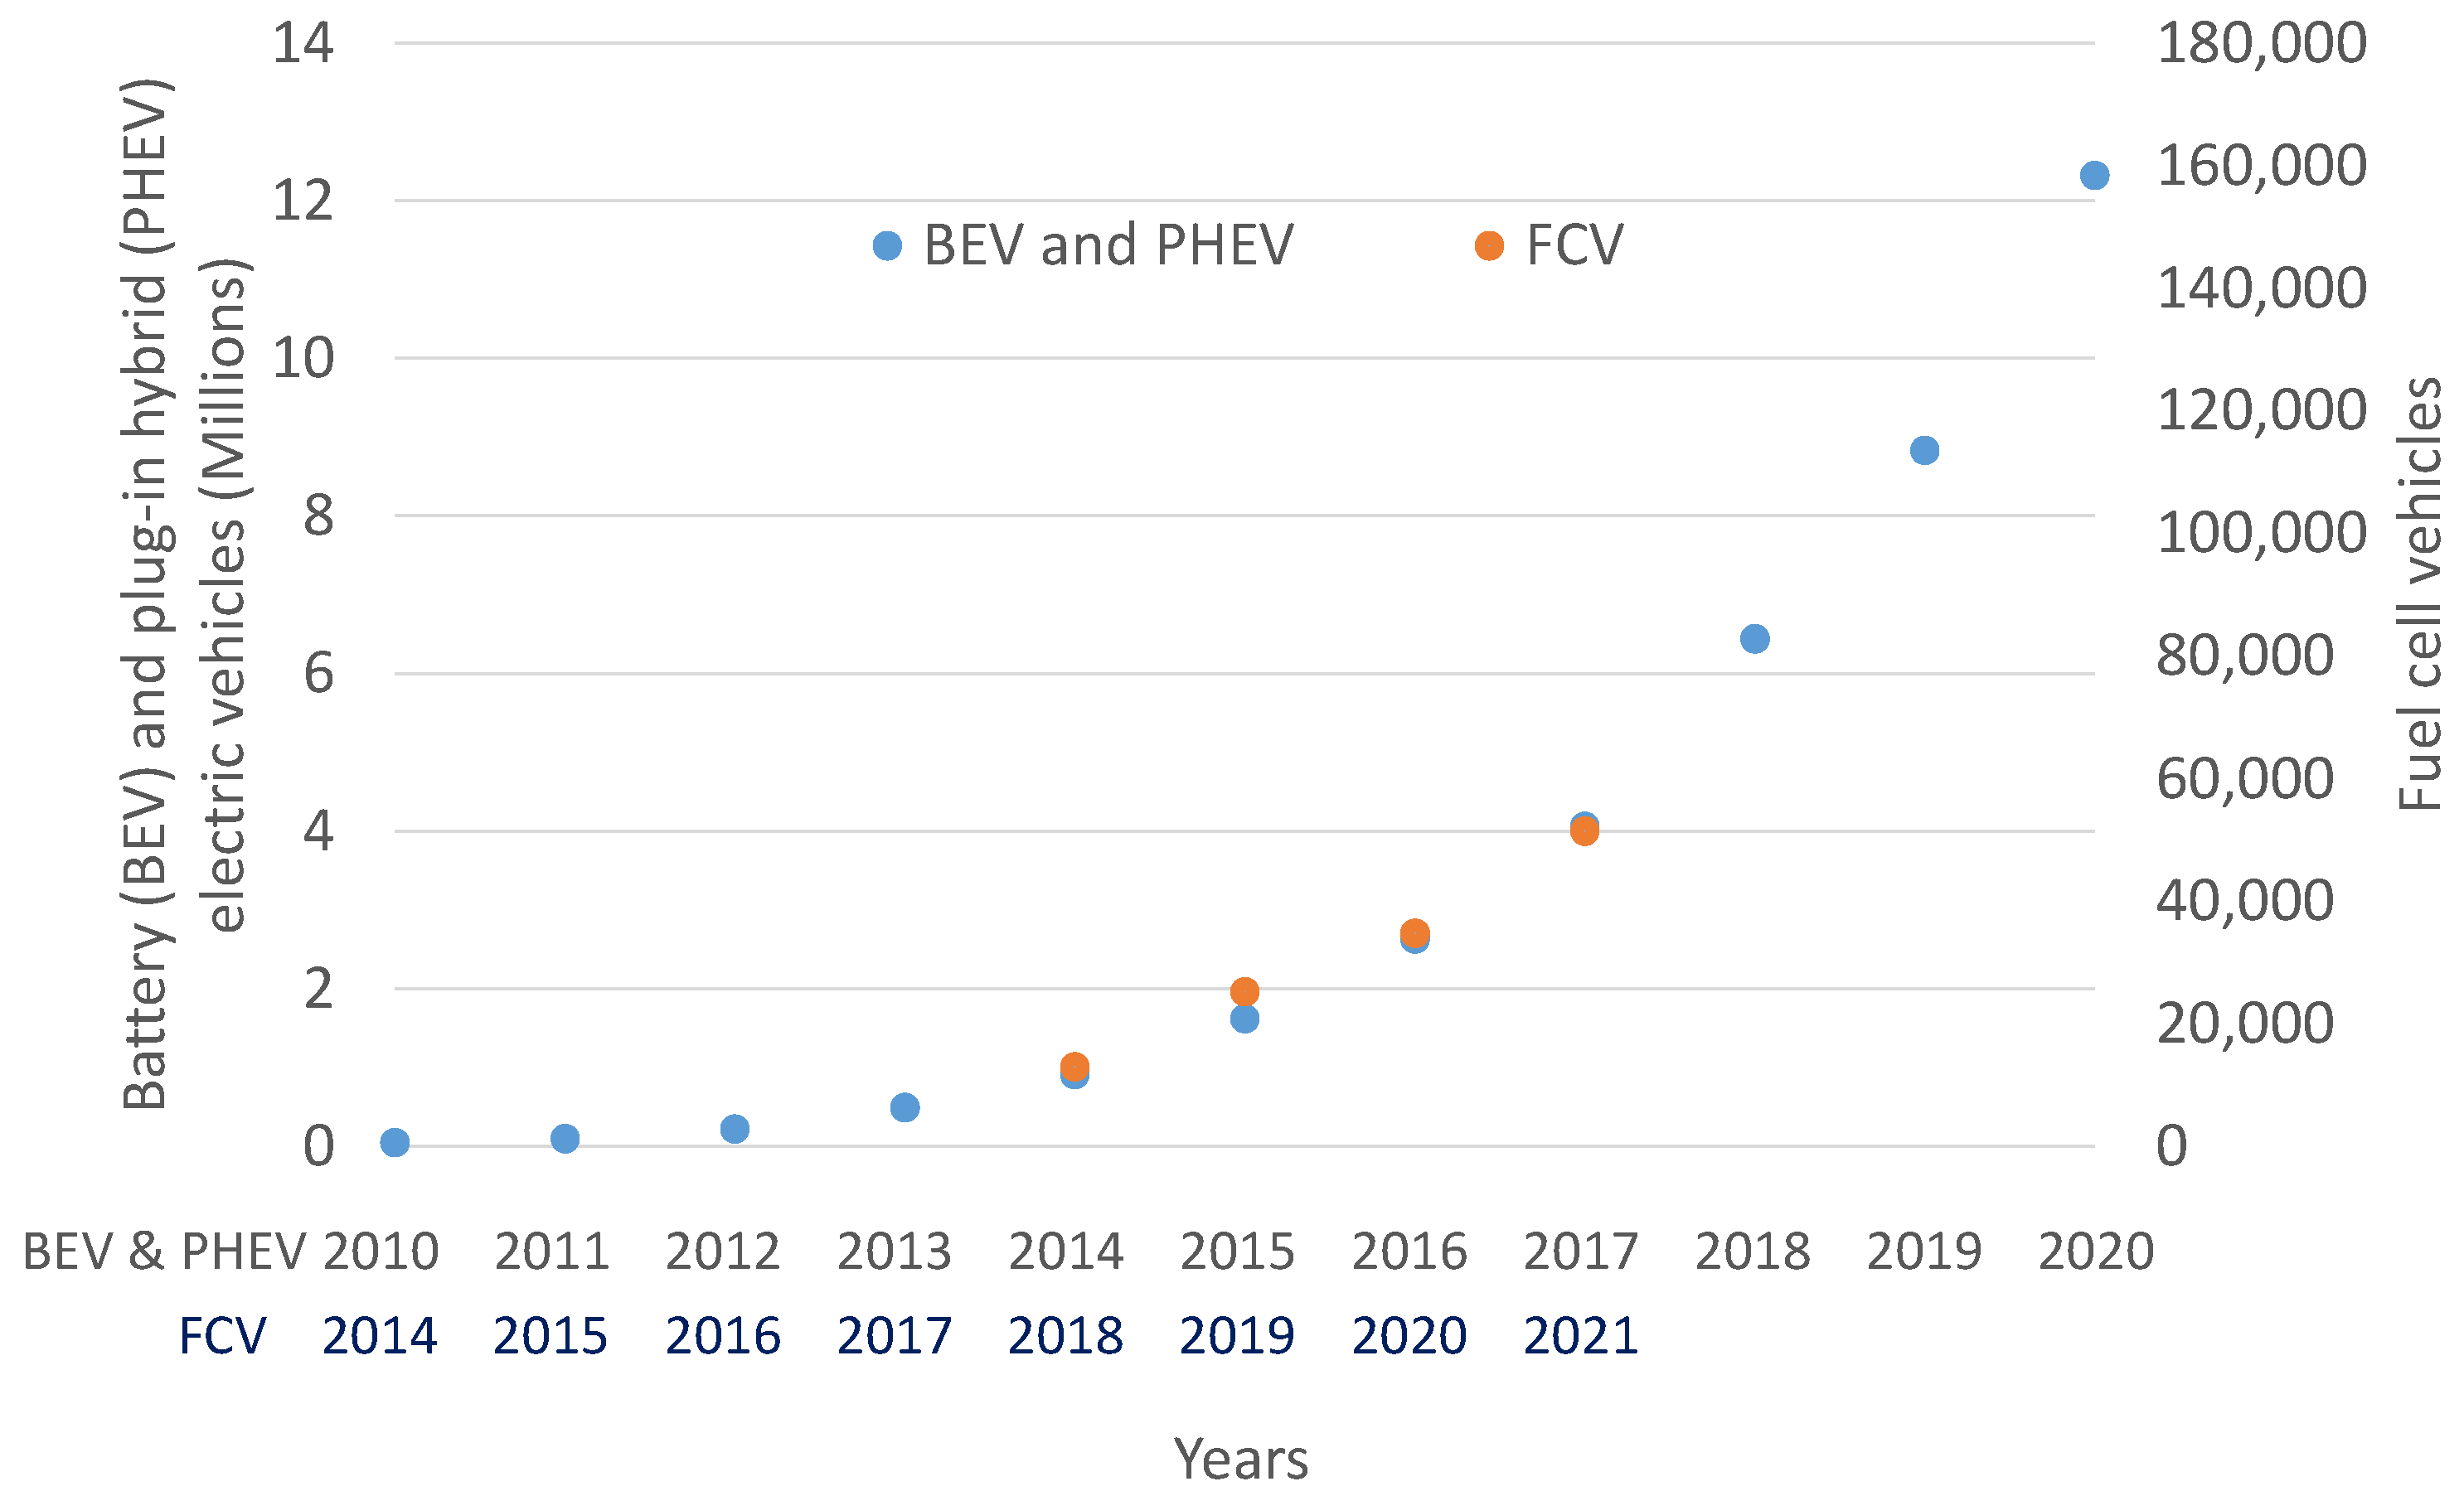
Finally, the deployment trend of all electric vehicles is compared with that of FCVs to check for possible learning curves from the wider deployment of BEV technologies thanks to their earlier market introduction.
Figure 19 shows the cumulative stock of BEVs and PHEVs from 2010 to 2020 in millions based on the IEA Global EV Outlook 2021 [
5] on the left axis. On the right axis, the deployment of all FCVs, based on this work and the previous AFC TCP data collection efforts [
6,
23,
24,
25], are displayed. As the first mass-produced FCV was introduced in 2014, the x-axis for fuel cells starts in 2014, but the first numbers are displayed for 2018, where the initial data is available for all vehicle classes. Thus, the BEV, PHEV, and FCV curves have different reference years. With that being said, the very good overlap of the complete FCV curve and the BEV and PHEV curves of 2014–2017 can be observed, with the absolute numbers lying two orders of magnitude away from each other. If the deployment trend of FCVs continues to follow an analogous trend to that of BEVs and PHEVs in the next three years as well, it can be expected that the stock reaches around 160,000 units in 2024.
This figure is only slightly higher than the 130,000 vehicles that must be put on the roads in one year, 2022, in order to achieve the set targets in national plans and roadmaps based on the developed trend functions in the present study, in the four countries that account for more than 90% of the current FCV population worldwide. Combining both analysis results, we can conclude that FCV deployment must follow a more ambitious development trend in the future and the production capacities must be ramped up quickly so that the calculated high annual increase rates are able to open the path to higher deployment numbers instead of shifting the pressure to later years. It can, moreover, be predicted that the expected and required high annual increase rate to initiate the more ambitious increase in the momentum of FCV deployment will be shifted towards 2024 and beyond, as an eight-fold increase in newly registered FCVs compared to 2021 is not realistic for 2022.
7. Conclusions
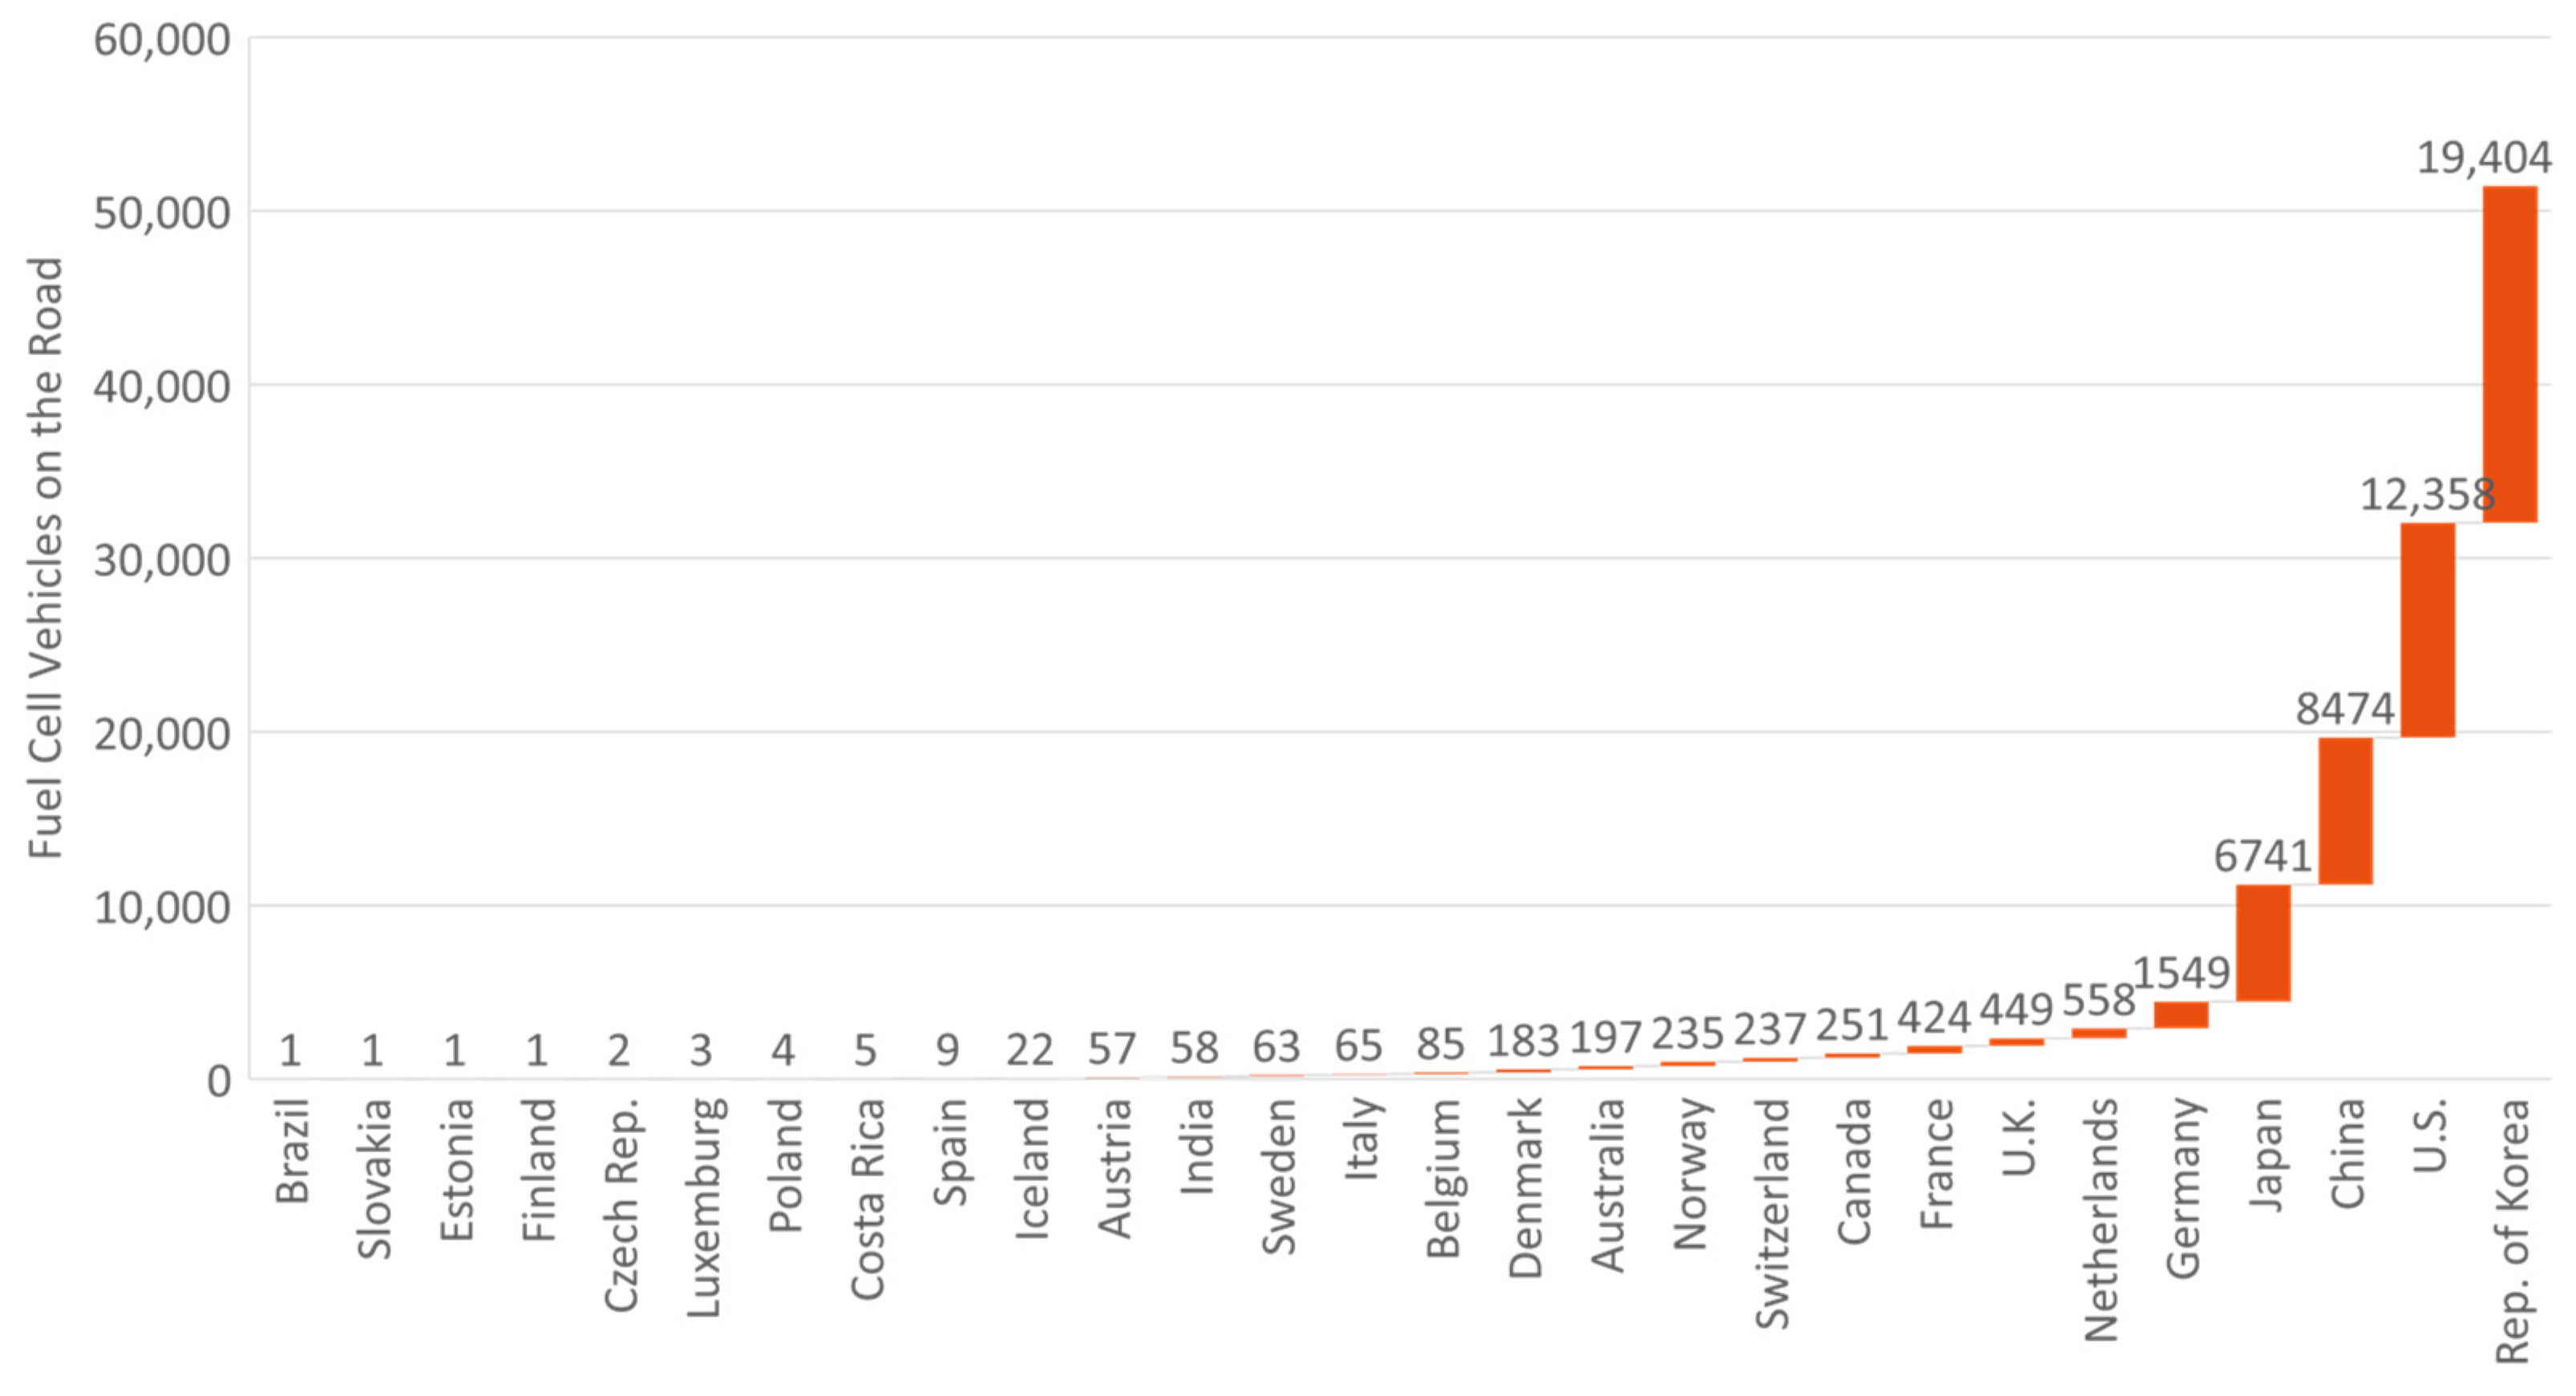
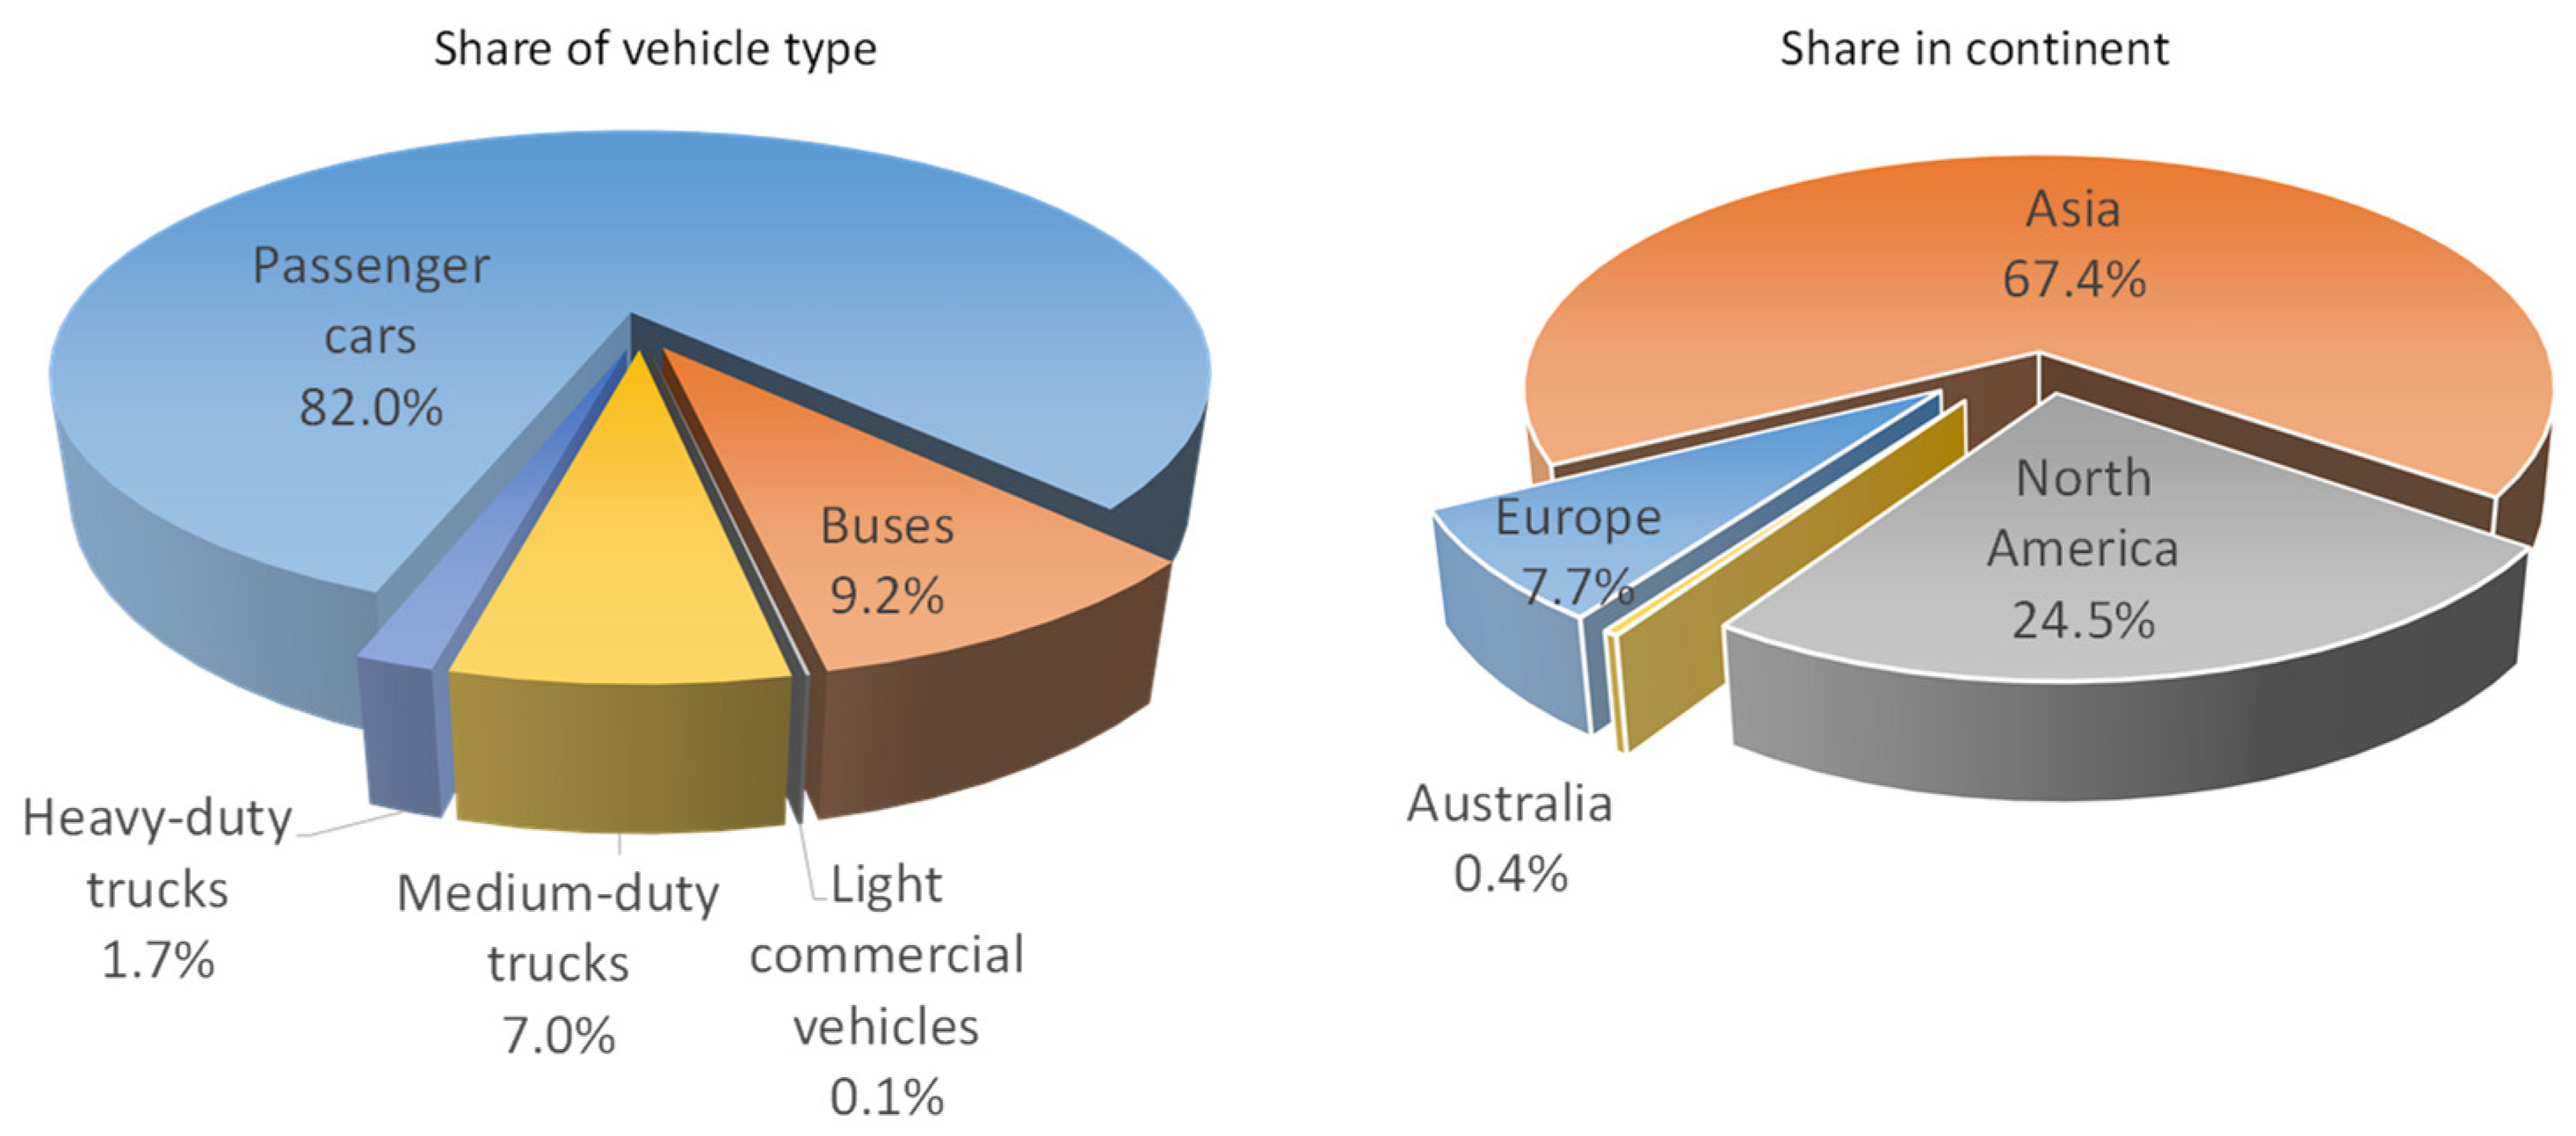
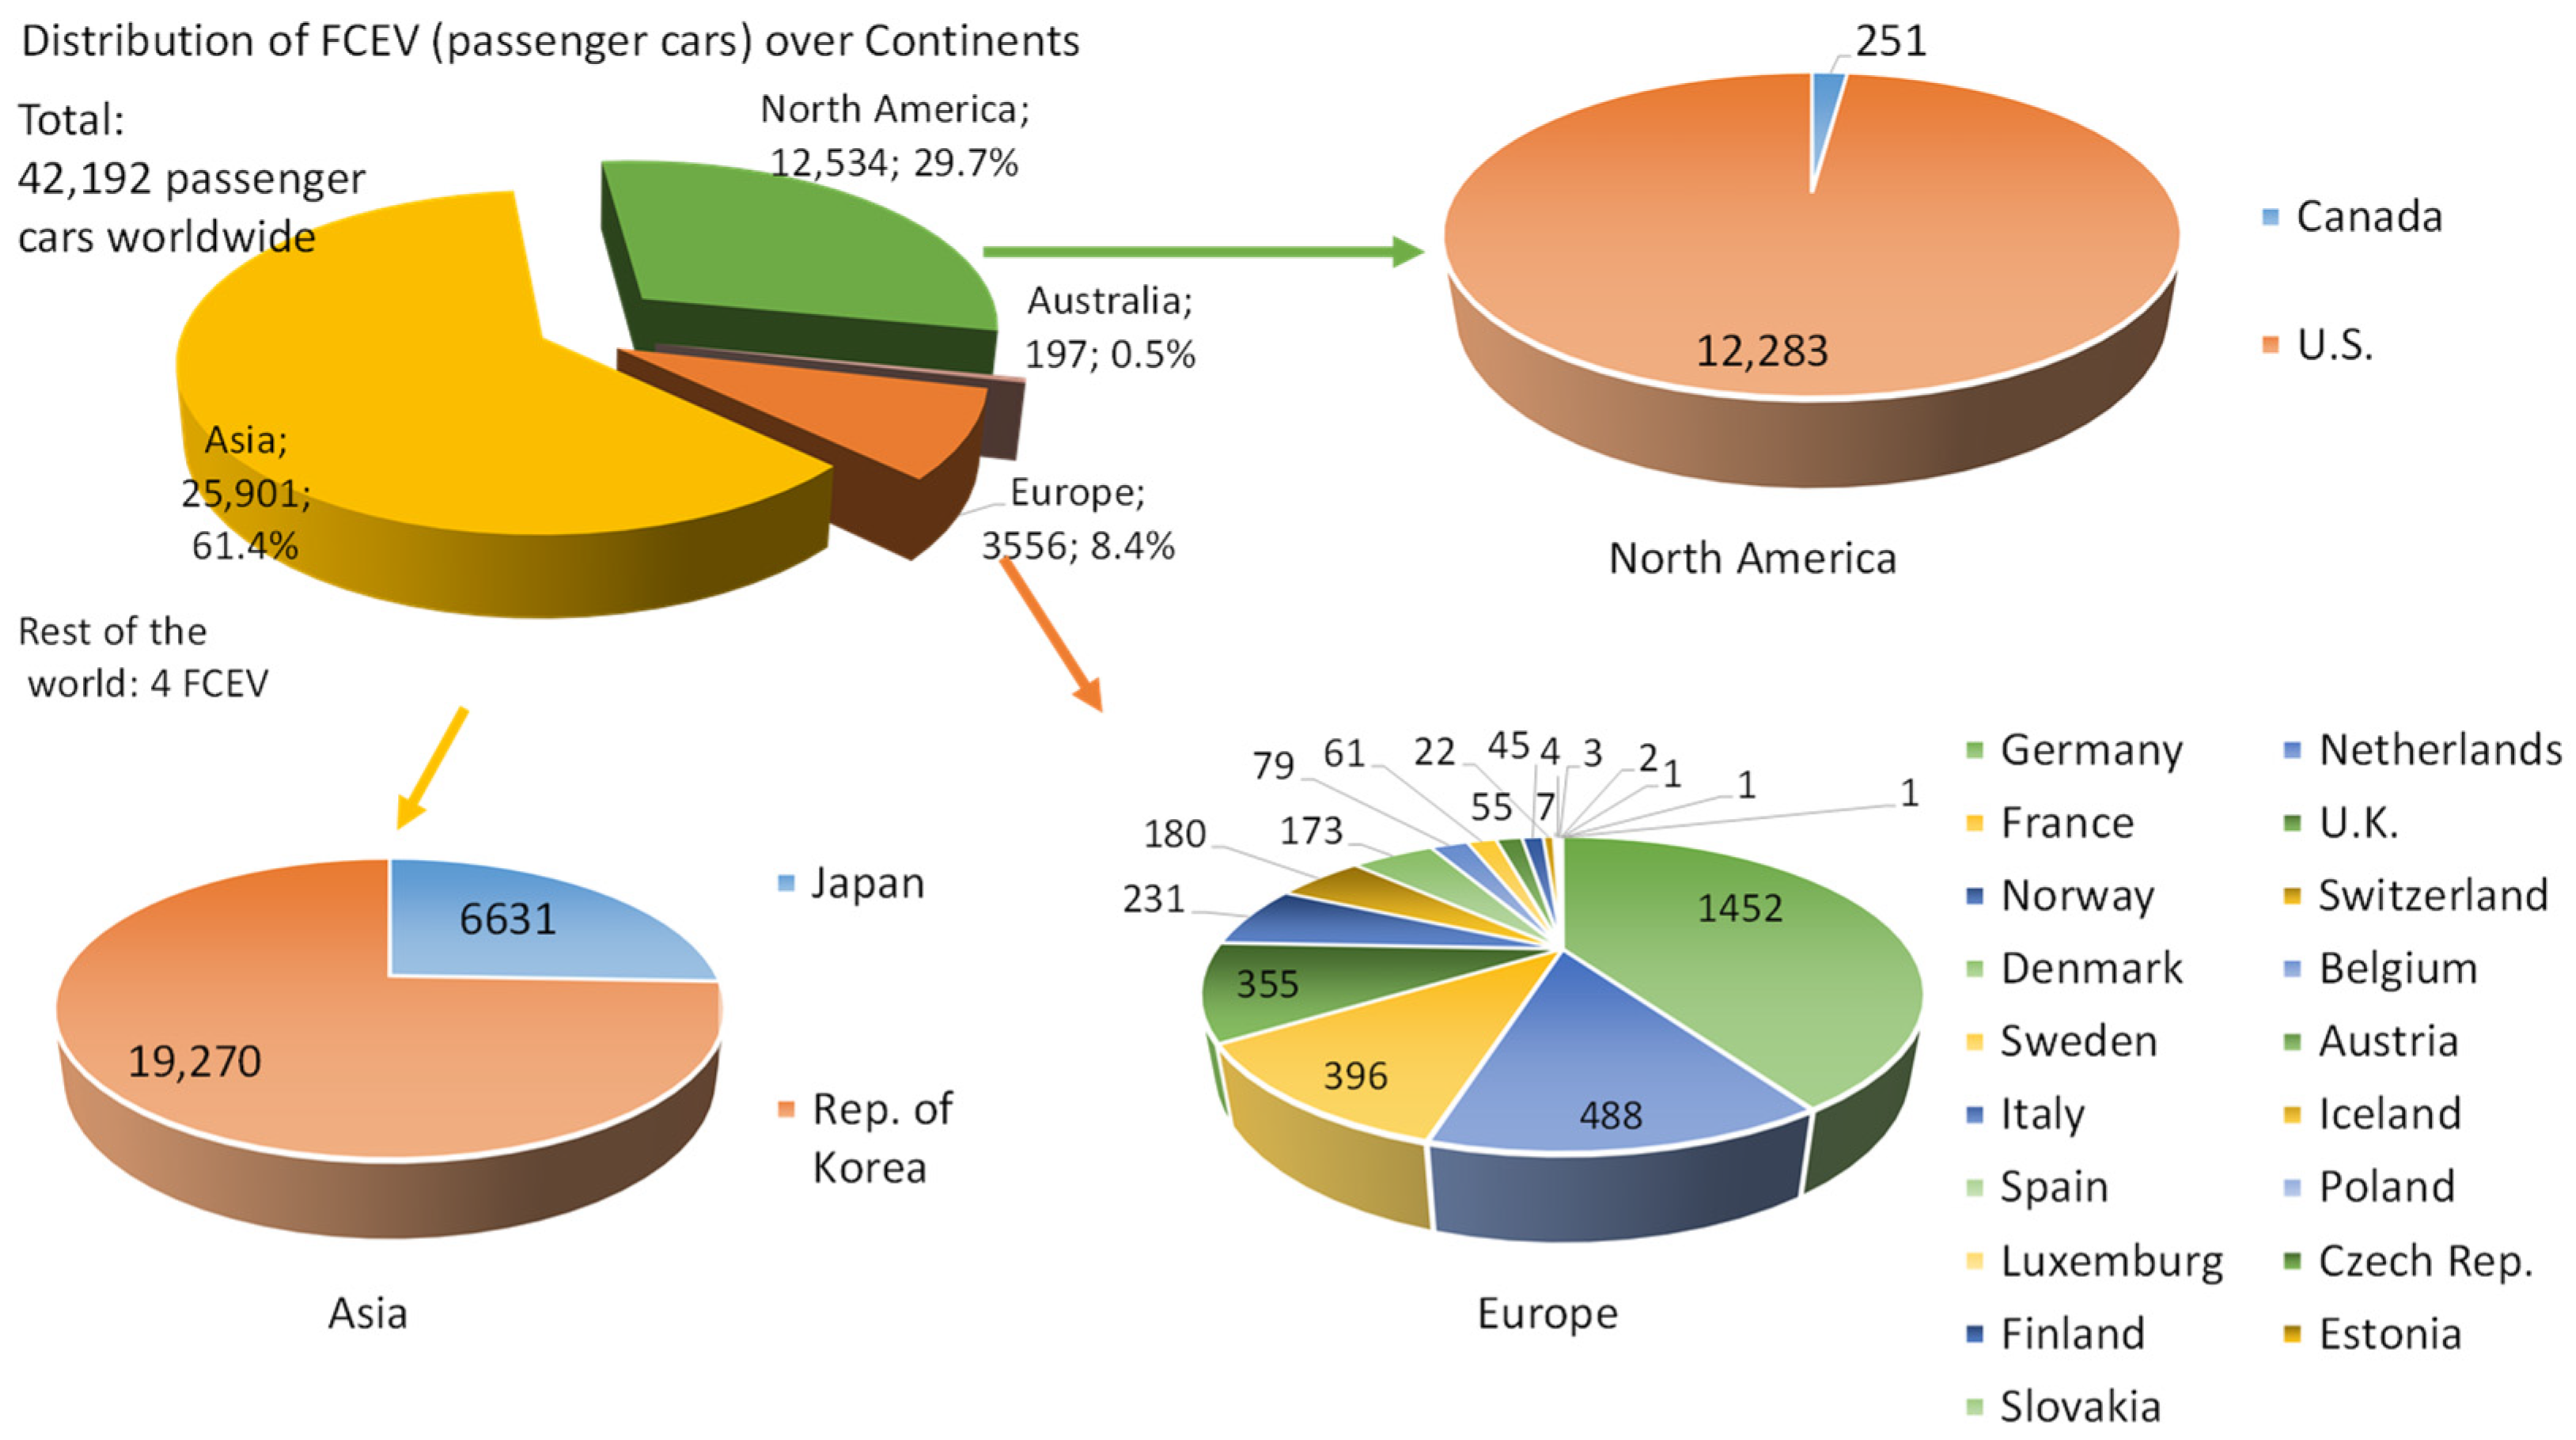
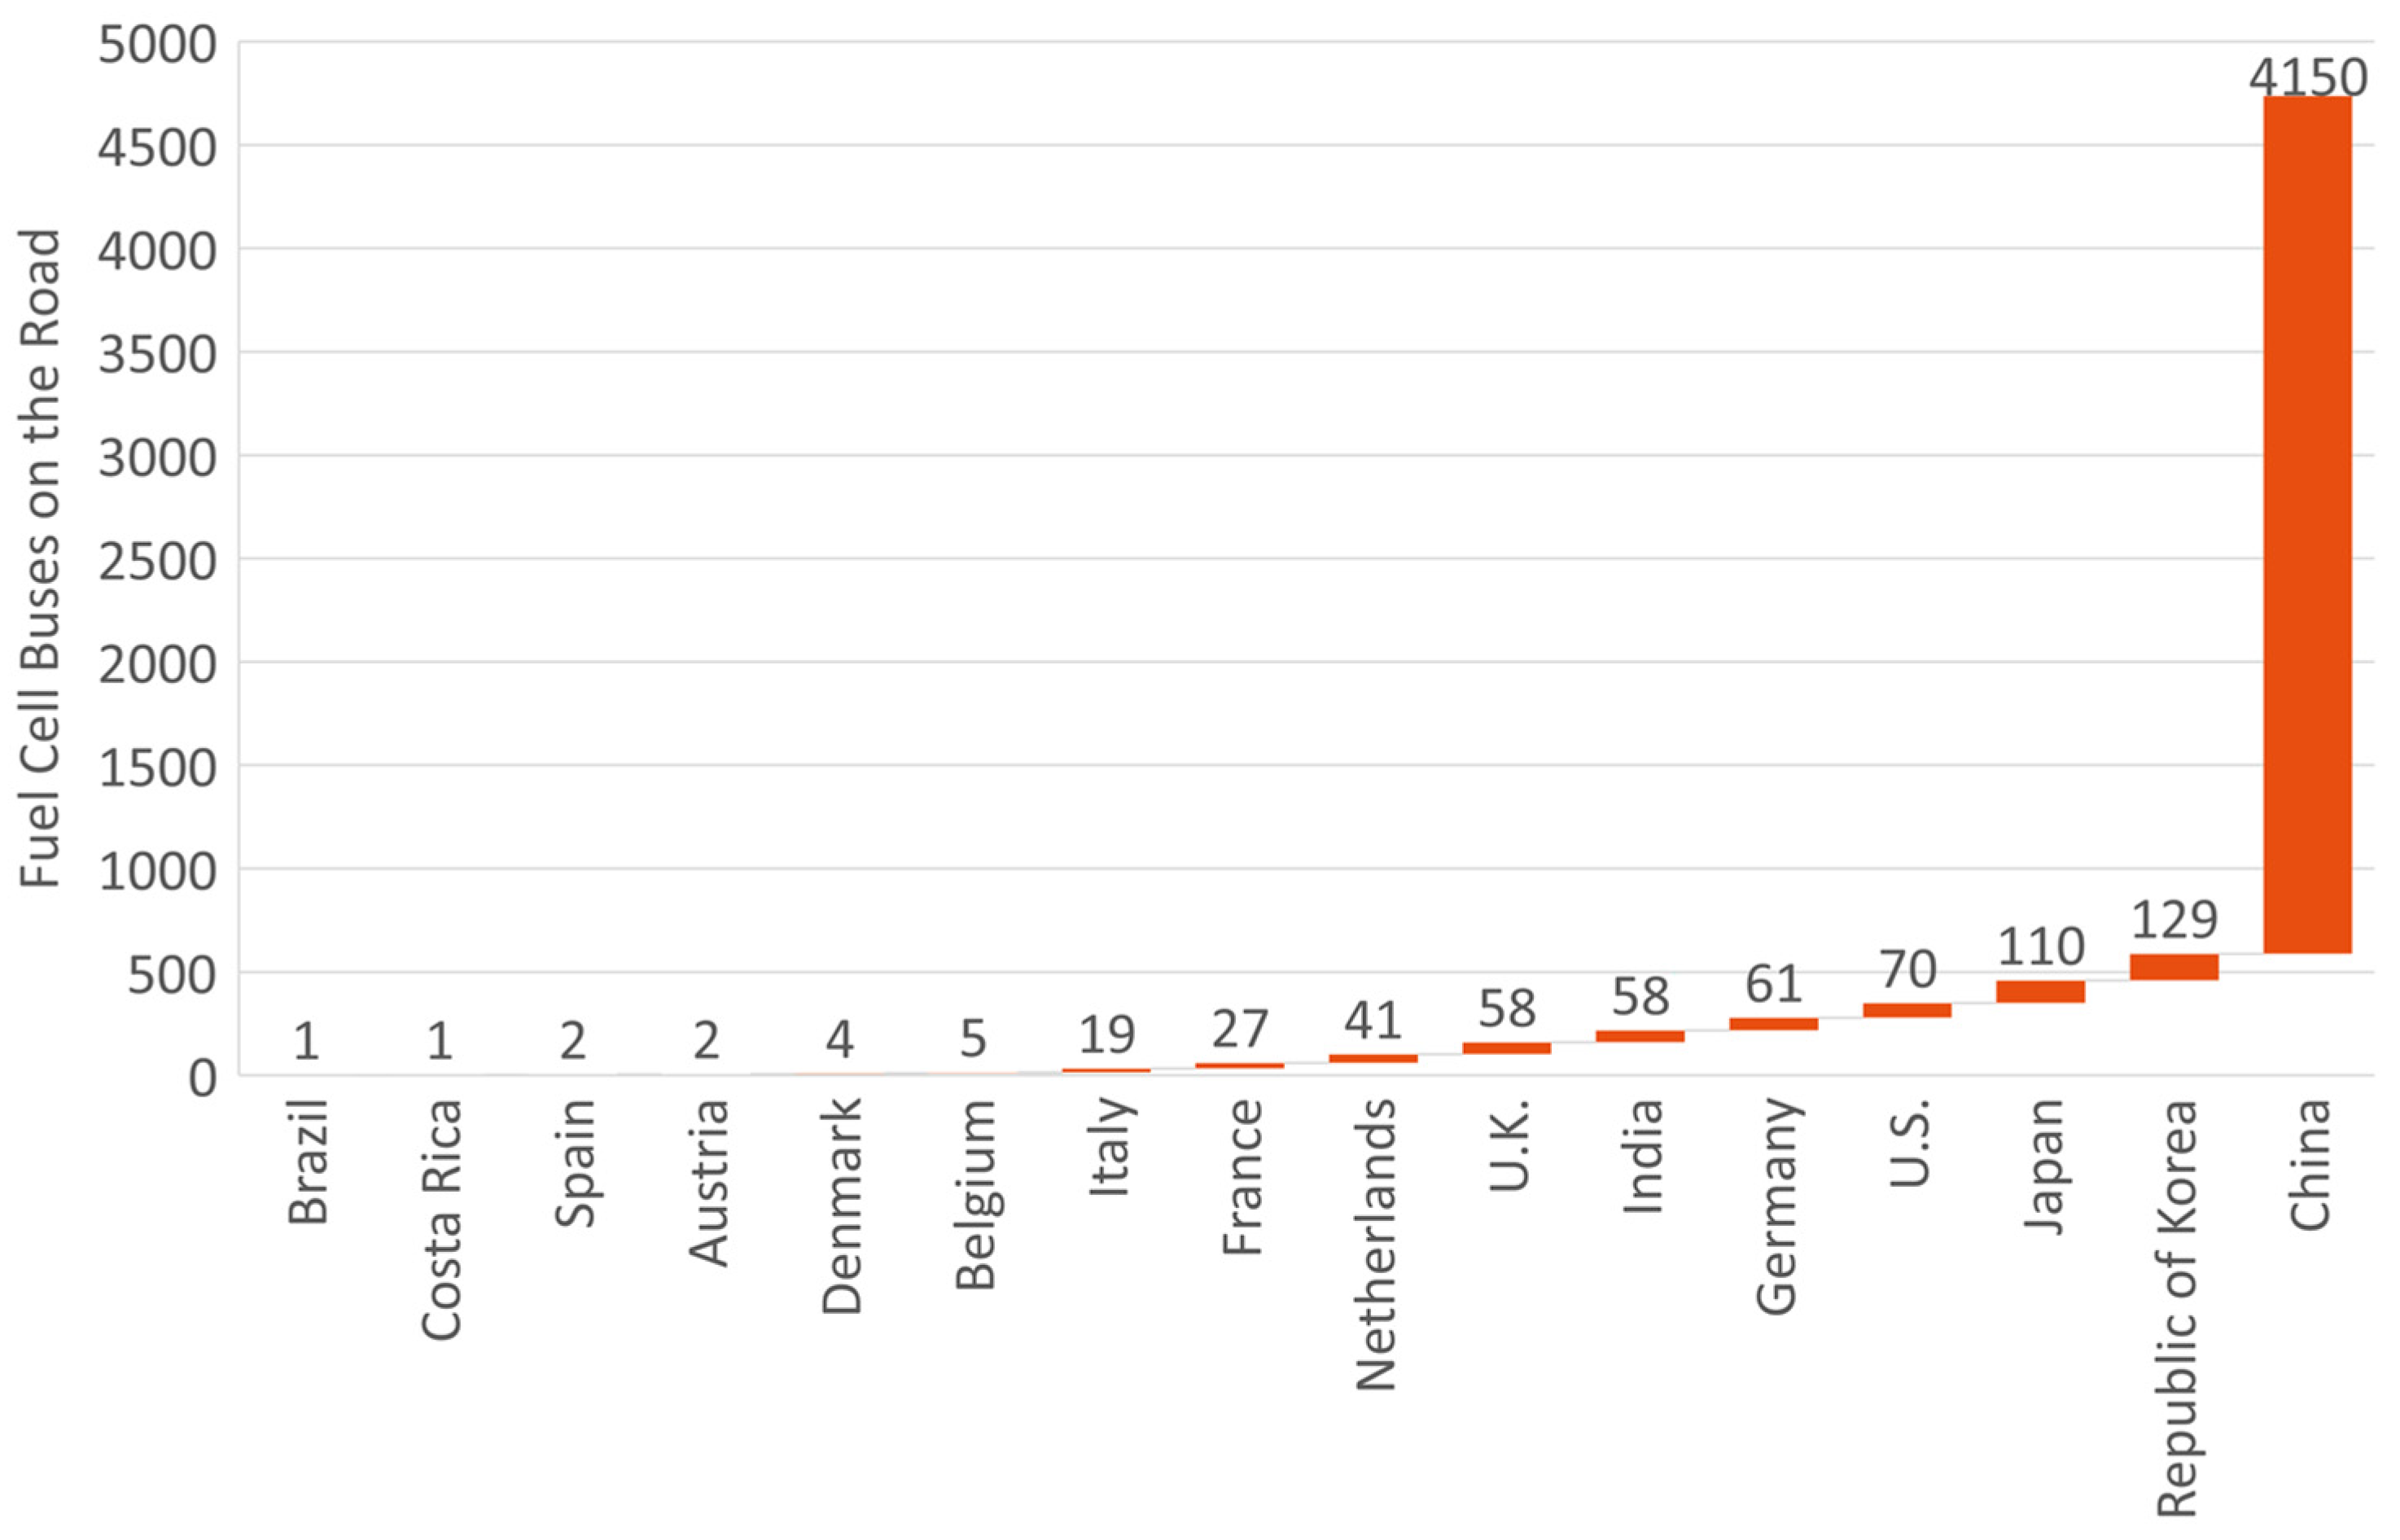
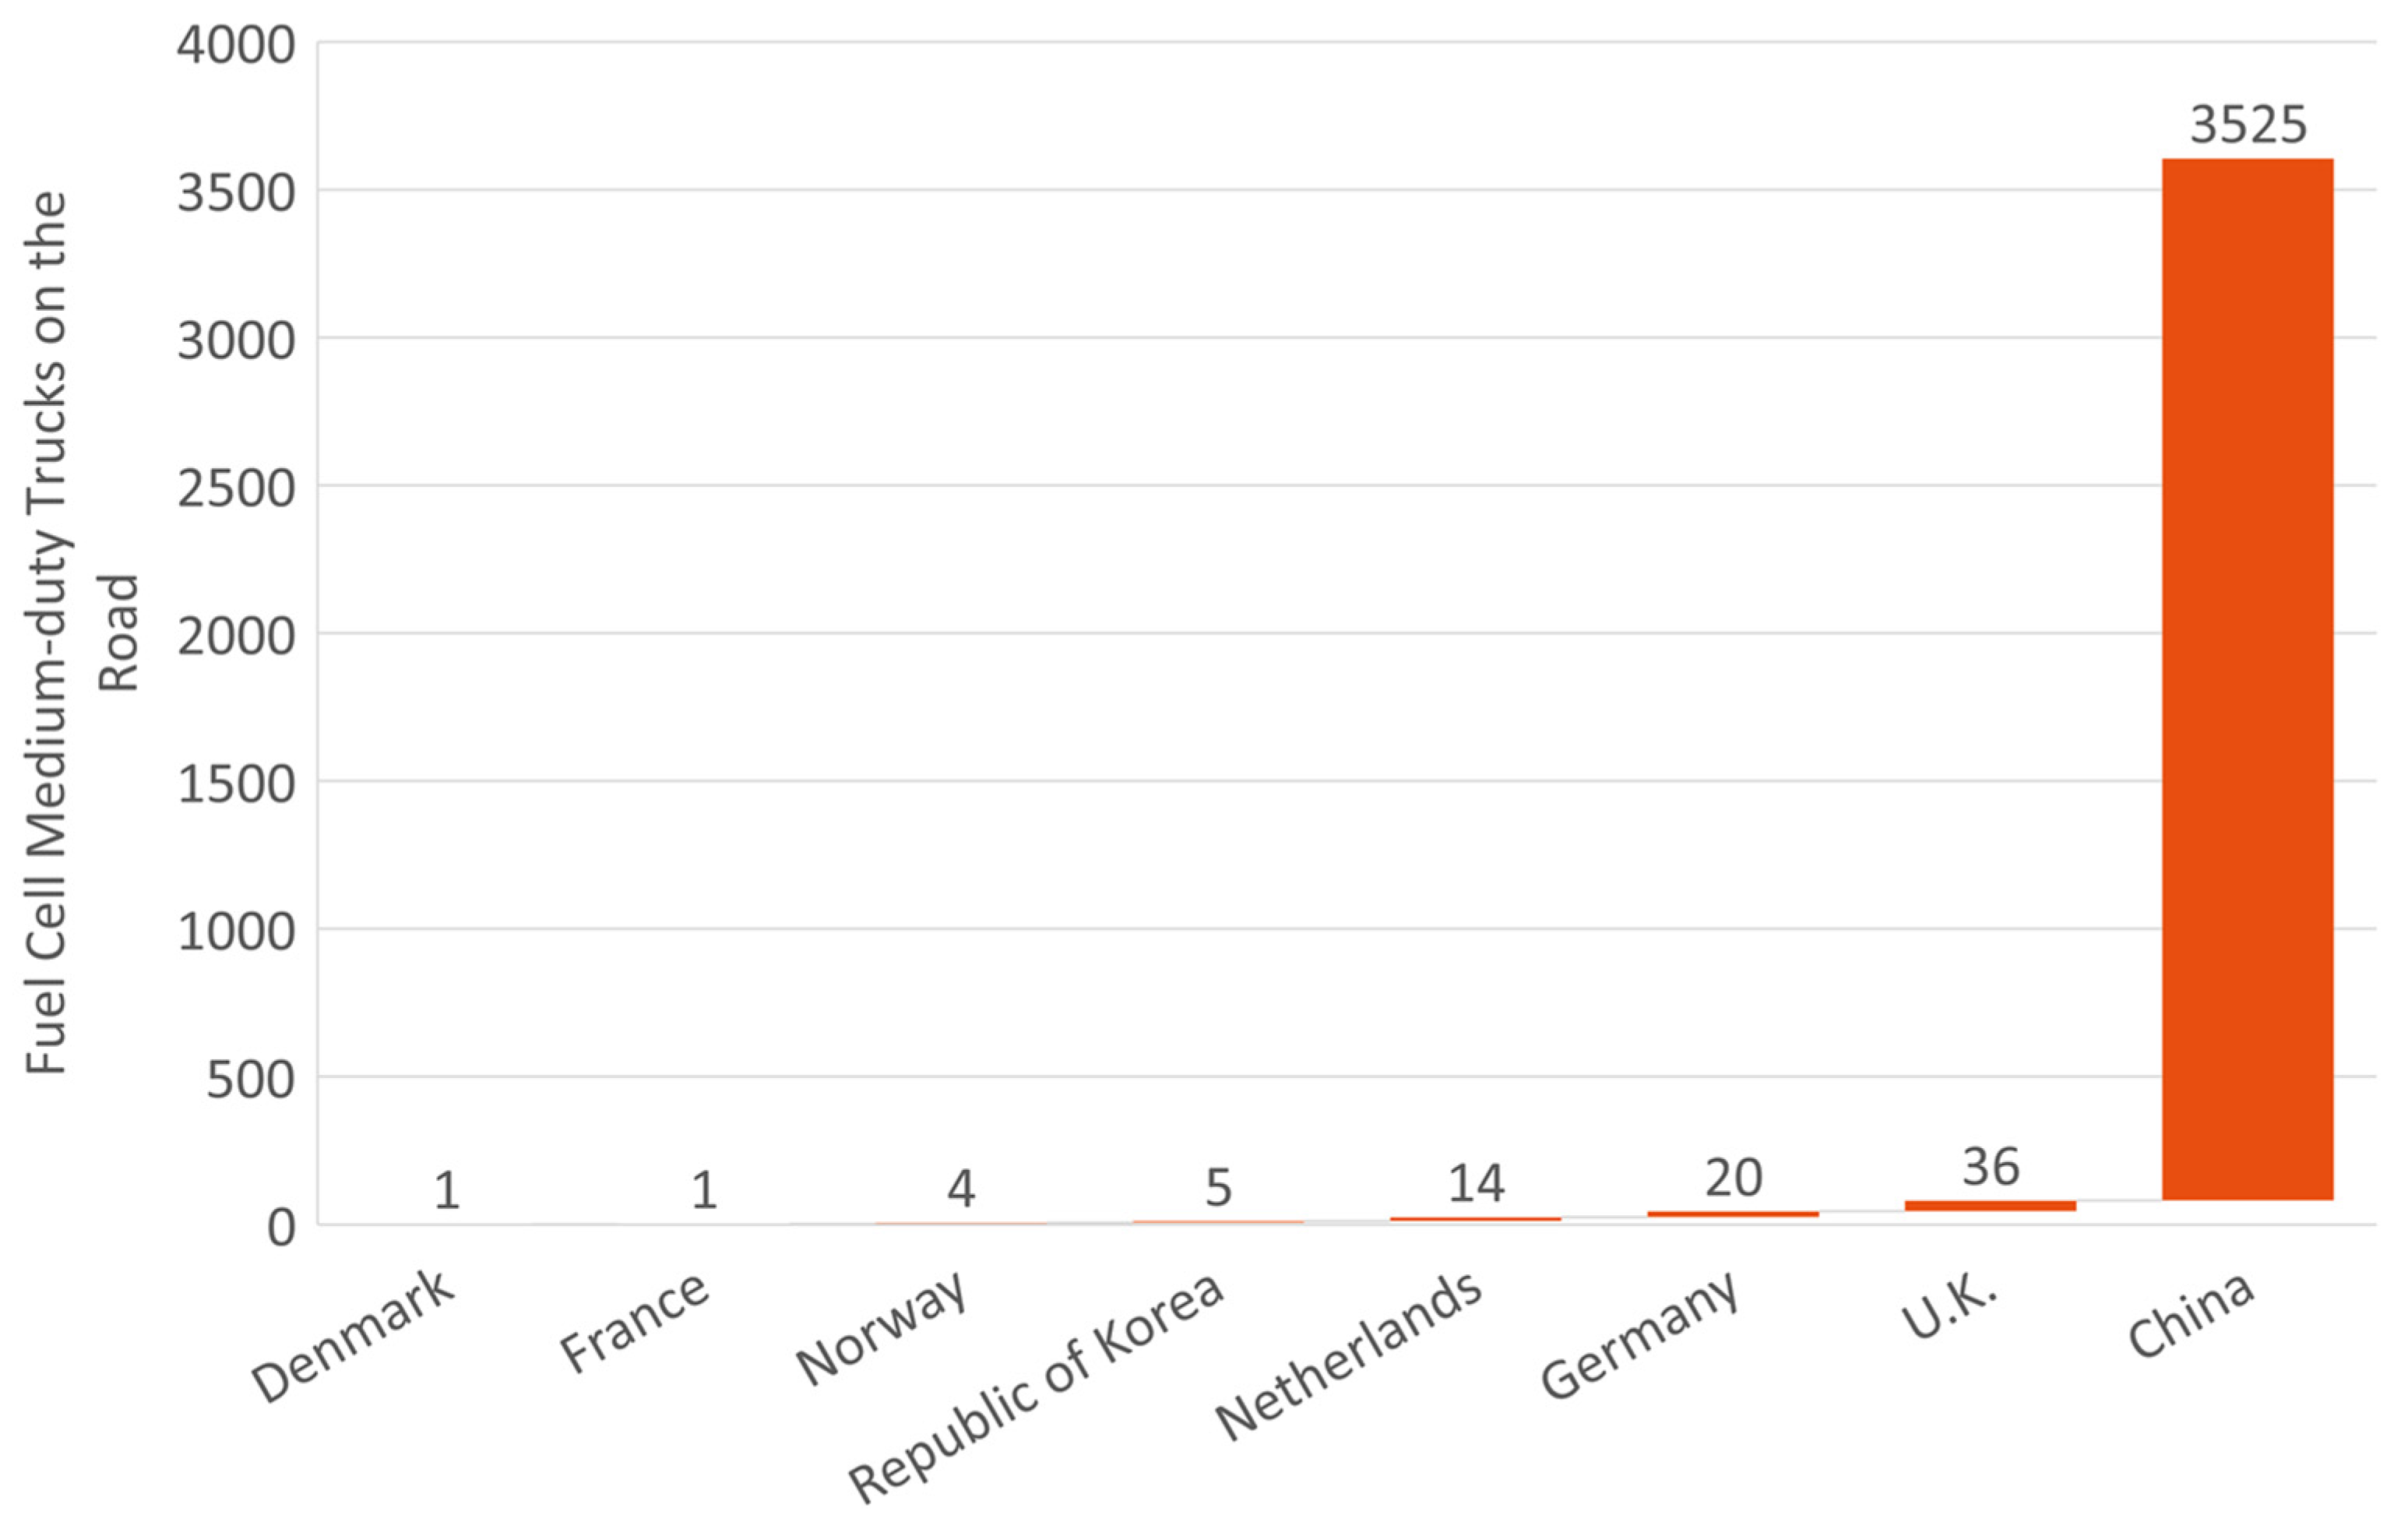
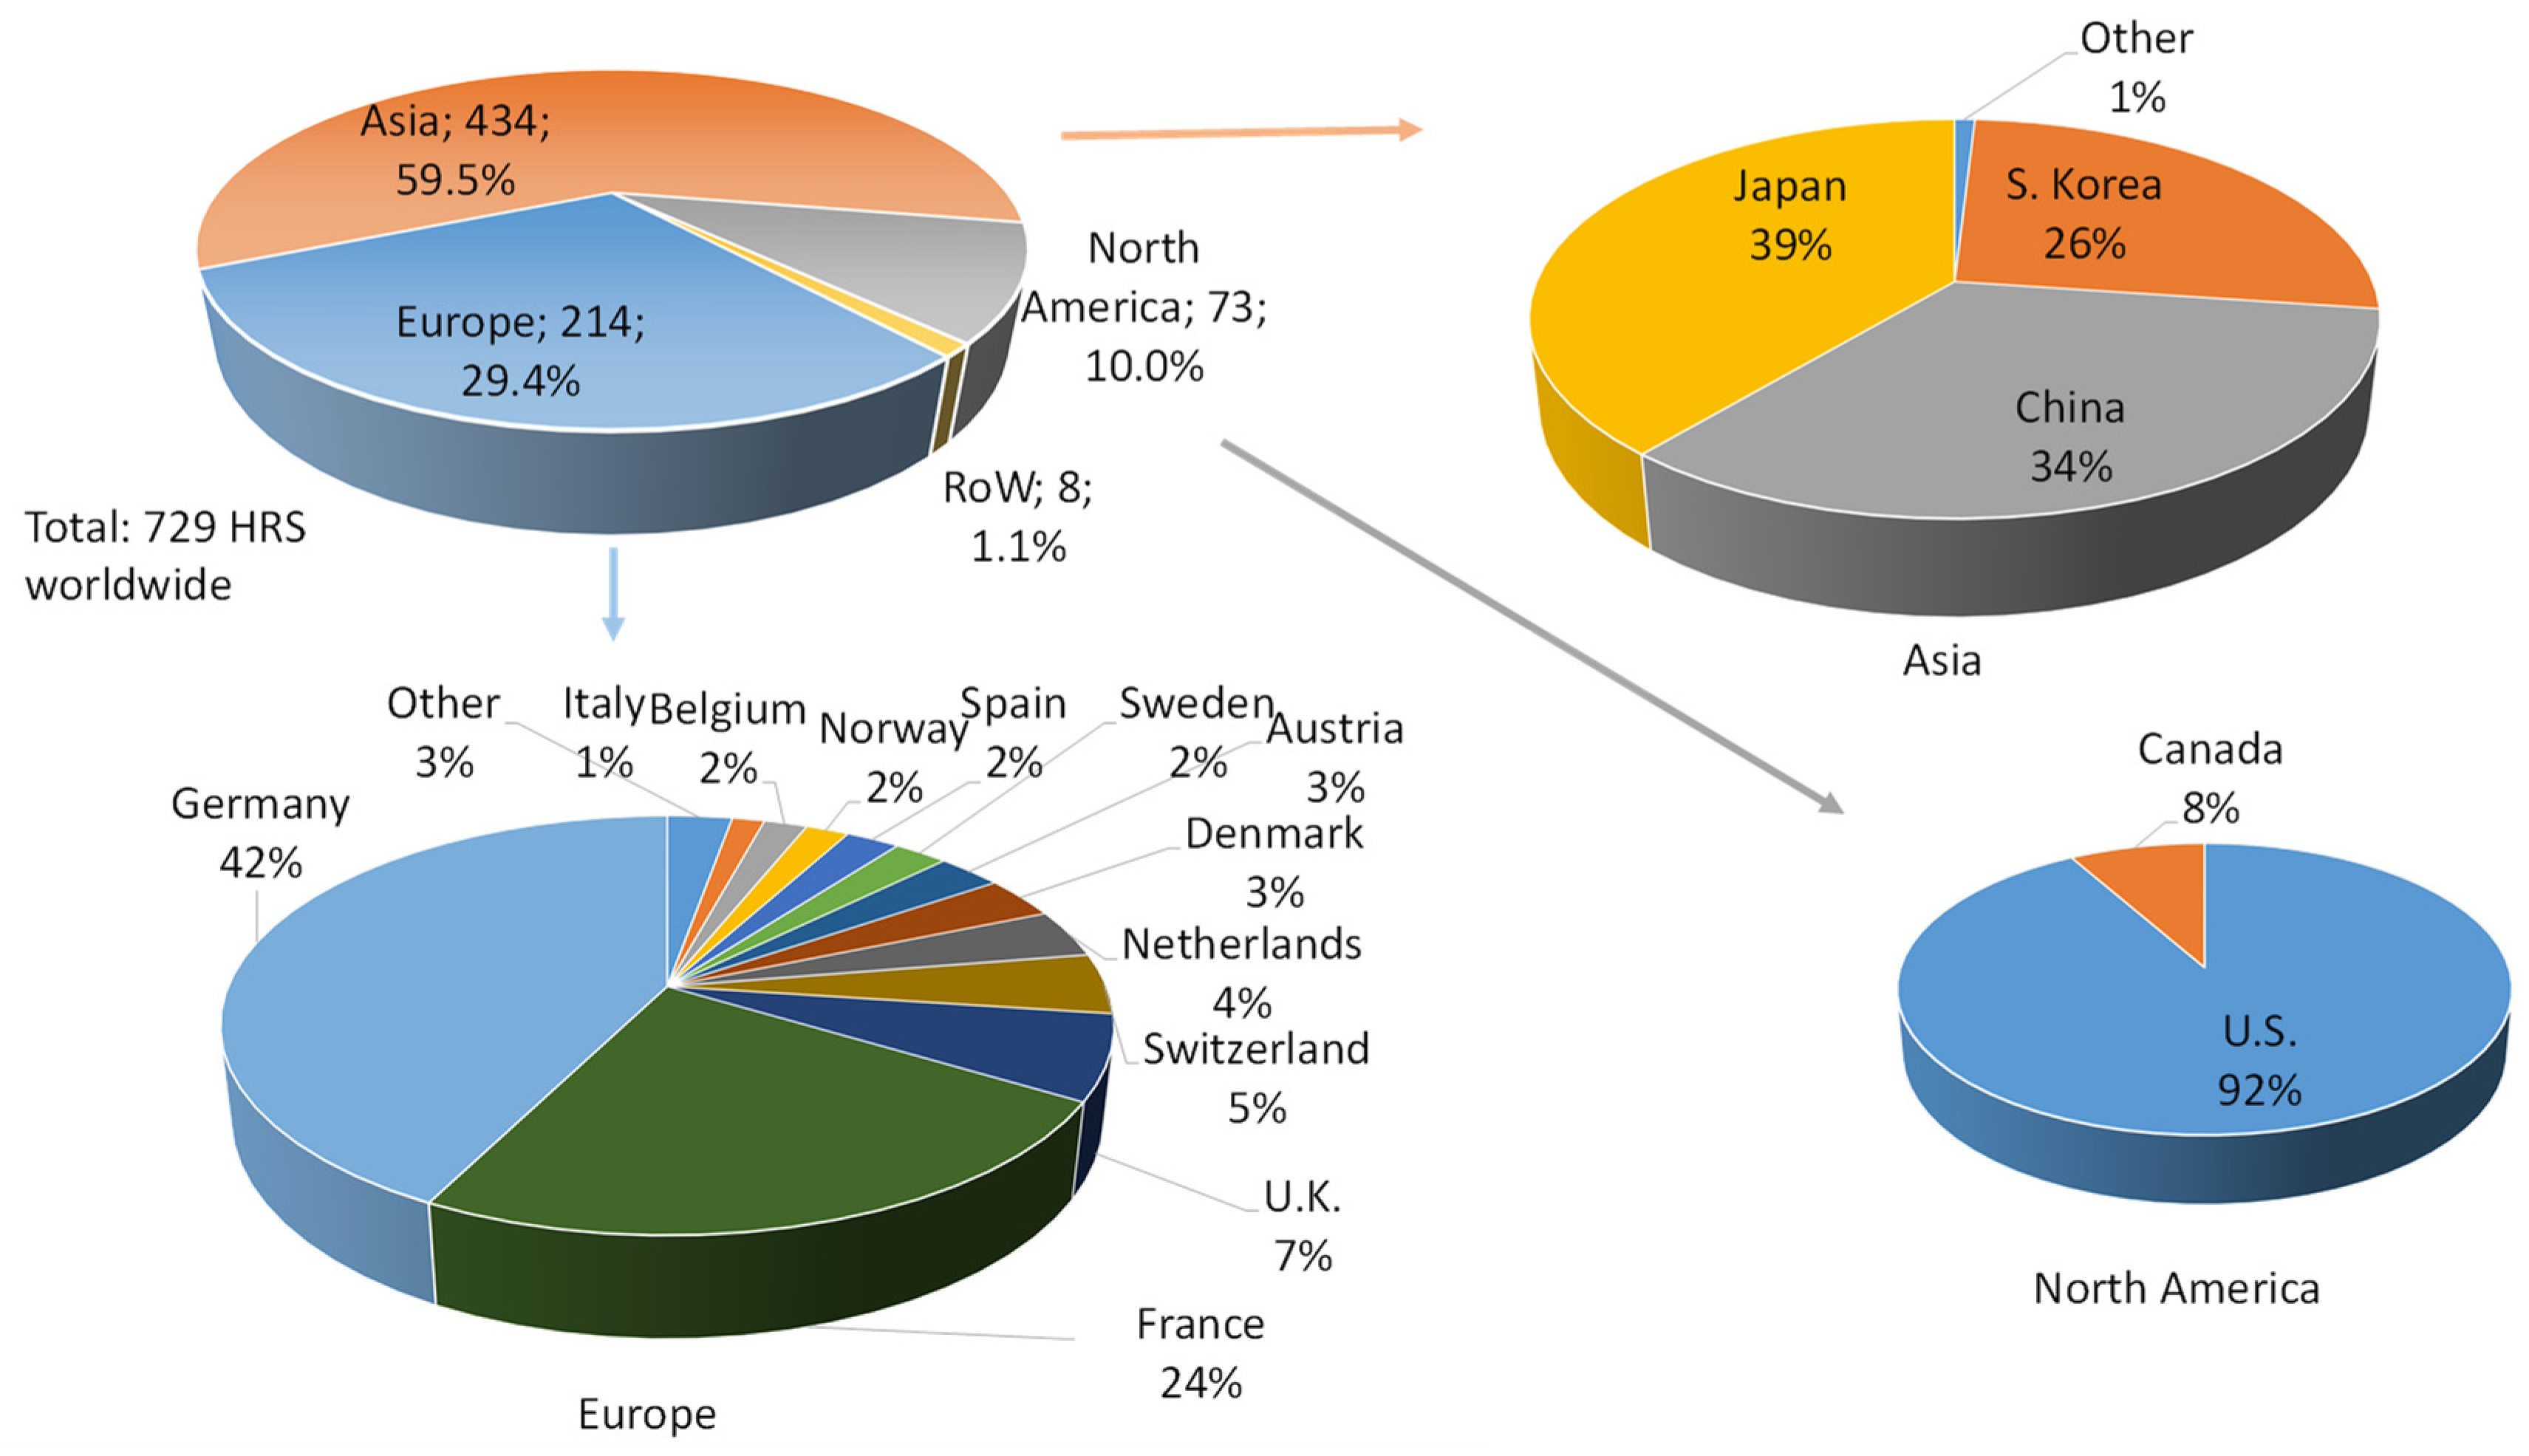
An overview of the present deployment status of FCVs and HRSs was presented in this paper in an effort to convey a snapshot of the global picture as of the end of 2021. The results of the data collection effort show that 51,437 FCVs were on the roads and 729 HRSs were in operation as of the reporting date. The numbers demonstrate the leading role of South Korea, with around 40% of vehicles being in this country. Moreover, around 90% of the vehicles are in South Korea, the U.S., China, and Japan, clearly highlighting the worldwide hubs of developing fuel cell mobility. The collected data also shows that passenger cars dominate the numbers, making up more than 80% of all vehicles. Over 90% of passenger cars are in three countries, namely South Korea, the U.S., and Japan. The available information shows that the majority of passenger cars are from Hyundai and Toyota, with Hyundai selling more FCVs than Toyota in 2020 and 2021, reversing the trend in the years before. Although the numbers are relatively low in Europe, many countries in Europe put FCVs on their roads, led by Germany, the Netherlands, and France. Being in the third position for all vehicles, China dominates the markets for fuel cell buses and trucks, with a huge share of between 88% and 98% in these vehicle categories, bringing the country to the leading position for commercial vehicles. In particular, the heavy-duty truck market showed a significant expansion in 2021, with 796 heavy-duty trucks registered only in China.
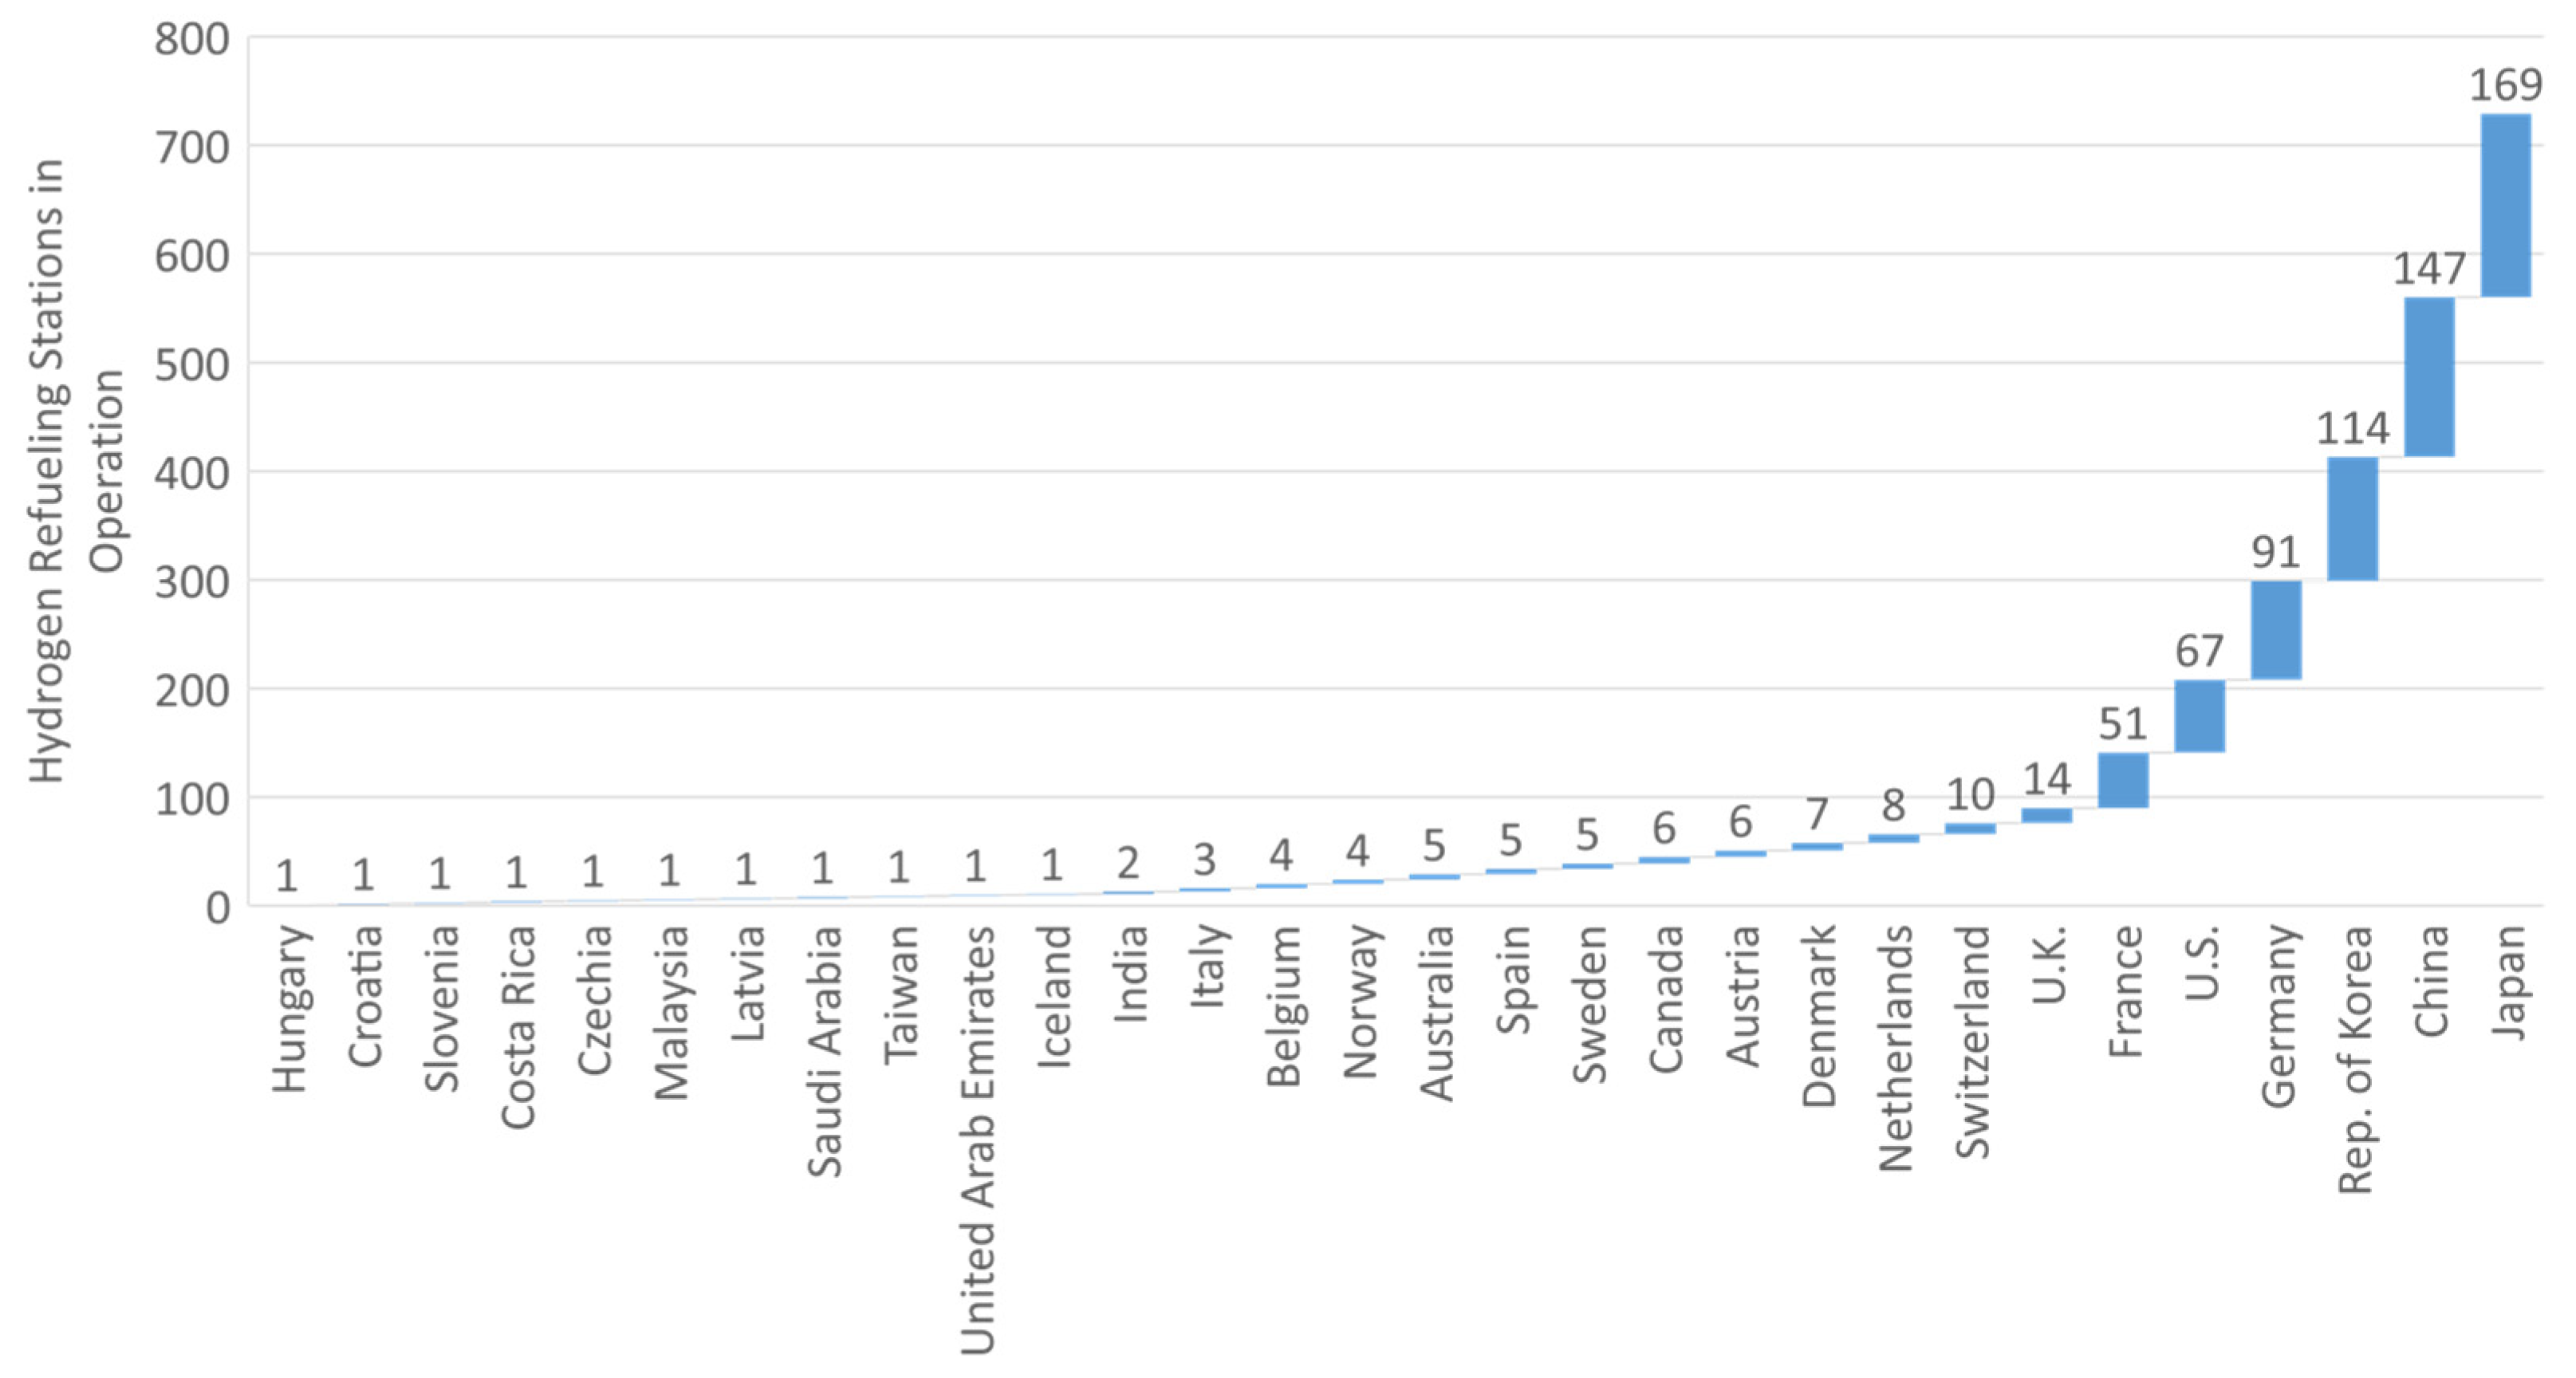
Around 60% of HRSs are being operated in three Asian countries, namely Japan, China, and South Korea. This is also the list of the three countries with more than 100 HRSs in operation in decreasing order. Germany, the U.S., and France operate more than 50 HRSs each.
An overview of the available incentives for purchasing an FCV showed that in most countries, the available incentives are the same for FCVs and BEVs. Moreover, these make only a limited contribution to vehicle price reductions. In some cases, the available fuel cell vehicle models are not even eligible for incentives, as the net list price of the vehicle is higher than the defined maximum level. However, this general trend does not apply to South Korea, where incentives can reduce the vehicle price by around 50% and make it an attractive option compared to other vehicle technologies. This exceptional situation is very important to understanding the numbers in this paper, as South Korea is the country with the highest number of FCVs worldwide. For the case of Germany, a deeper analysis of the numbers showed that the numbers of vehicles that received funding from the National Innovation Programme was much higher than those that received incentives, demonstrating the importance of national programs for the market ramp-up of FCVs. It should also be noted that China recently changed its funding policy, which now aims to provide rewards to selected regions in order to provide the basis for reaching the technical and economic targets for the wider deployment of hydrogen FCVs, instead of providing funds for buying vehicles only. Moreover, hundreds of FCVs are available in the New Energy Vehicles catalog in China, showing the extreme diversity of suppliers and models in this country.
The analysis showed that the absolute increase in the number of FCVs and HRSs was the highest in 2021, demonstrating important signs of recovery after the pandemic year. A simplified analysis of the number of FCVs per station in the six countries with more than 50 HRSs showed the highest numbers for South Korea and the U.S. (170–185), followed by Japan and China (40–58), and the lowest for Germany and France (8–17). Our literature-based analysis showed the economic necessity and technical possibility of reaching much higher vehicles per station. Although most of the already-built stations can serve many more vehicles, it is clear that future stations will be built with higher capacities to cover rising hydrogen demand.
To understand the present numbers of FCVs on the road, two further analyses were performed. Firstly, the analysis of the share of FCVs in all registered vehicles distinguishes the situation in Korea, where every 1323th vehicle is a fuel cell one. With this, the Korean share is at least an order of magnitude higher than in every other country in the world. Secondly, the trend between GDP and GDP per capita and the number of FCVs was analyzed, but the results did not show a correlation.
Furthermore, the development trends in the last five years in the four countries with the highest numbers of FCVs were analyzed. The most dynamic trends were observed for both vehicle numbers and refueling stations in South Korea and China. In the next step, this information was combined with the target numbers defined in national plans and the roadmaps for these countries to understand the required development trends in the coming years. In all cases, a very strong annual increase rate is required in the first year of future development, which reduces over time. However, the strong annual increase rate in the first year simply brings the stock and, respectively, the number of operating stations to a higher number, so that further high annual absolute increases in the numbers are not accompanied by high annual increase rates, although the absolute increase in the newly introduced vehicles and stations still grows over the years. Our analysis estimates a necessity of 130,000 new FCVs in the first year of “future” development scenarios, which begins in 2022. This compares to 16,500 new registered vehicles in 2021 according to this paper and does not seem feasible for 2022. As a direct consequence, it can be expected that the year with the highest annual increase rate is shifted to 2024, which will of course increase the pressure on the coming years for reaching the defined targets or milestones. This brings us to the conclusion that vehicle production capacities must be increased more radically and supporting mechanisms must accompany the market ramp-up phase, so that the defined goals remain realistic.
If the same analysis is performed for the development of HRSs, a similar trend is observed, yet with a milder annual increase rate in the beginning due to comparatively lower numbers. In comparison to South Korea and Japan, very steep curves are expected for the U.S. and China due to comparatively higher numbers of HRSs defined as end targets.
Finally, a comparison of the development trend of all electric vehicles with that of fuel cell vehicles, which are also electric vehicles with a fairly low contribution to the statistics up until now, shows an interesting overlap: the development trend for FCVs from 2018 to 2021 is in good agreement with that of all electric vehicles from 2014 to 2017, noting that the numbers differ by two orders of magnitude from one another. If the deployment of FCVs continues to follow this trend in the coming years, it will be challenging to achieve the defined targets, as the high expected annual increase rate cannot be realized with this trend. This finding supports the aforementioned finding from the analysis of future trend developments. Thus, the FCV deployment must follow a more ambitious trend, so that fuel cell technology can provide a contribution to sustainable transportation supporting other electric vehicle technologies. If the required ramp-up dynamics are delayed, the fuel cell technology may lose its strategic position in future roadmaps.


