Article

Accelerating Efficient Installation and Optimization of Battery Energy Storage System Operations Onboard Vessels

1
Technology, Digital and Innovation, Equinor, 4035 Stavanger, Norway
2
SINTEF Energi, 7034 Trondheim, Norway
3
Havila Shipping ASA, 6092 Fosnavåg, Norway
4
Corvus Energy, 5224 Nesttun, Norway
5
Institute for Energy Technology, 2007 Kjeller, Norway
*
Author to whom correspondence should be addressed.
Energies 2022, 15(13), 4908; https://doi.org/10.3390/en15134908
Submission received: 27 April 2022 / Revised: 18 May 2022 / Accepted: 23 May 2022 / Published: 5 July 2022

Abstract

:
Emerging large battery energy storage systems (BESSs) are key enablers in the electrification of the shipping sector. With huge government investments in BESSs, there are large gaps between the government supported BESS initiatives and actual BESS integration results on vessels. This study aims to close these gaps, allowing BESSs to become the preferred solution for ship owners without needing government support. Firstly, this industry-driven study reviews both the industrial approaches to achieve CO2 emission reductions and the fuel savings and emission reductions from 500 BESS installations on various vessels. Secondly, a 630 kWh BESS retrofitted onto a hybrid-electric vessel is used to quantitively identify the improvement requirements for installations and operations. The installations required many custom designs that were expensive and have high failure risks. The standardization of interfaces’ between BESSs and vessels is thus urgently required. The BESS was intended for spinning reserve capacity and peak shaving but in practice was under-used in terms of energy throughput (shallow cycles and low equivalent full cycles of 80 versus the design specification of 480 yearly). Thirdly, this study develops new, integrated BESS operational models by learning from large operational data, balancing BESS degradation against fuel saving and utilizing onshore/offshore green power supply/charging. The R&D of BESS is required to deal with the increasing safety requirements and further CO2 emission reductions. Finally, four BESS acceleration scenarios were established to facilitate the technical and operational transferability through utilizing digitalization.

1. Introduction

The International Maritime Organization (IMO) greenhouse gas (GHG) strategy envisages a reduction in the carbon intensity of international shipping of up to 50% by 2030 through intensified, collaborative research activities aiming to achieve the intended CO2 reduction by 2030 (compared to ship emissions in 2008) [1] which in turn helps pave the way towards net-zero GHG emissions in Europe by 2050.
Large BESSs are emerging as great enablers of CO2 emission reductions through the electrification of the maritime sector, although BESSs integrated onto vessels for ship propulsion remain an emerging technology. It has already been proven that ferries, some short-distance freight services, and inland waterway vessels can be successfully fully electrified [2]. However, a commercial large-scale roll-out across the spectrum of waterborne transport faces a different set of challenges from that of the automotive sector, including (i) lower numbers, but many more types of vessels, (ii) long vessel life times (decades), hence the number of retrofits to existing vessels is approximately 10 times higher than the numbers of new vessels being built, (iii) very different installation and operational conditions of water-based fuel-saving solutions compared with theoretically similar land transport scenarios, and (iv) a need for advanced technologies and large investments to establish onshore and offshore vessel power supply/charging infrastructure.
With recent large government investments, many BESS projects have been initiated. However, there are large gaps appearing between the BESS initiatives and the actual BESS integration results achieved on vessels. For the installation of the same BESS onto the same type of vessel, the operational results achieved can vary greatly depending on the skills of individual ship operators (e.g., 6% to 32% variation in energy savings for ferries of the same application [3]). Only approximately half of ship owners/operators installing BESSs have currently achieved their expected fuel-saving results according to several experienced marine experts’ observation. This study aims to close these gaps, allowing BESSs to become the preferred solution for ship owners/operators without needing government support. Very few R&D efforts exist that are dedicated to reducing BESS installation costs and optimizing operations, since research institutions often have difficulties accessing the practical experience and operational data from BESSs integrated onto vessels.
This industry-driven study is part of an on-going three-year project running from 2021 to 2024: optimizing marine battery operations using 6 years of operational data from two commercially operating vessels (OMB6) [4] with funding from the Norwegian Research Council. OMB6 benefits from great collaborative efforts between the ship owner, the BESS supplier, the 1st user of BESS for GHG reductions, and research institutions to increase the operational benefits of BESSs on offshore supply vessels (OSVs) by 5 to 10%. OMB6 aims to increase investors’ confidence leading to the installation of more BESSs on vessels and paving the way for either the full electrification of vessels or the combination of electrification and clean fuel solutions needed to achieve zero emissions.

2. Objectives

This study develops new, integrated, optimized, and operational BESS models to pursue benefits for ship owners undertaking the green transition. Furthermore, four BESS acceleration scenarios have been established to aid replicability and upscaling of BESS technology across sectors and regions, and for technological advancement through digitalization. In more detail, the four objectives are as follows:
  • Reviewing the actual industrial approach for achieving CO2 emissions reductions, learning from the experiences gained from 500 BESS installations on various vessels, and addressing the issues facing ship owners who wish to install more BESSs without needing government support.
  • Presenting BESS practical installation costs and operational results from a 630 kWh BESS retrofitted onto a commercially operating OSV; the annual operational results are used to quantify improvement requirements for future installations and operations.
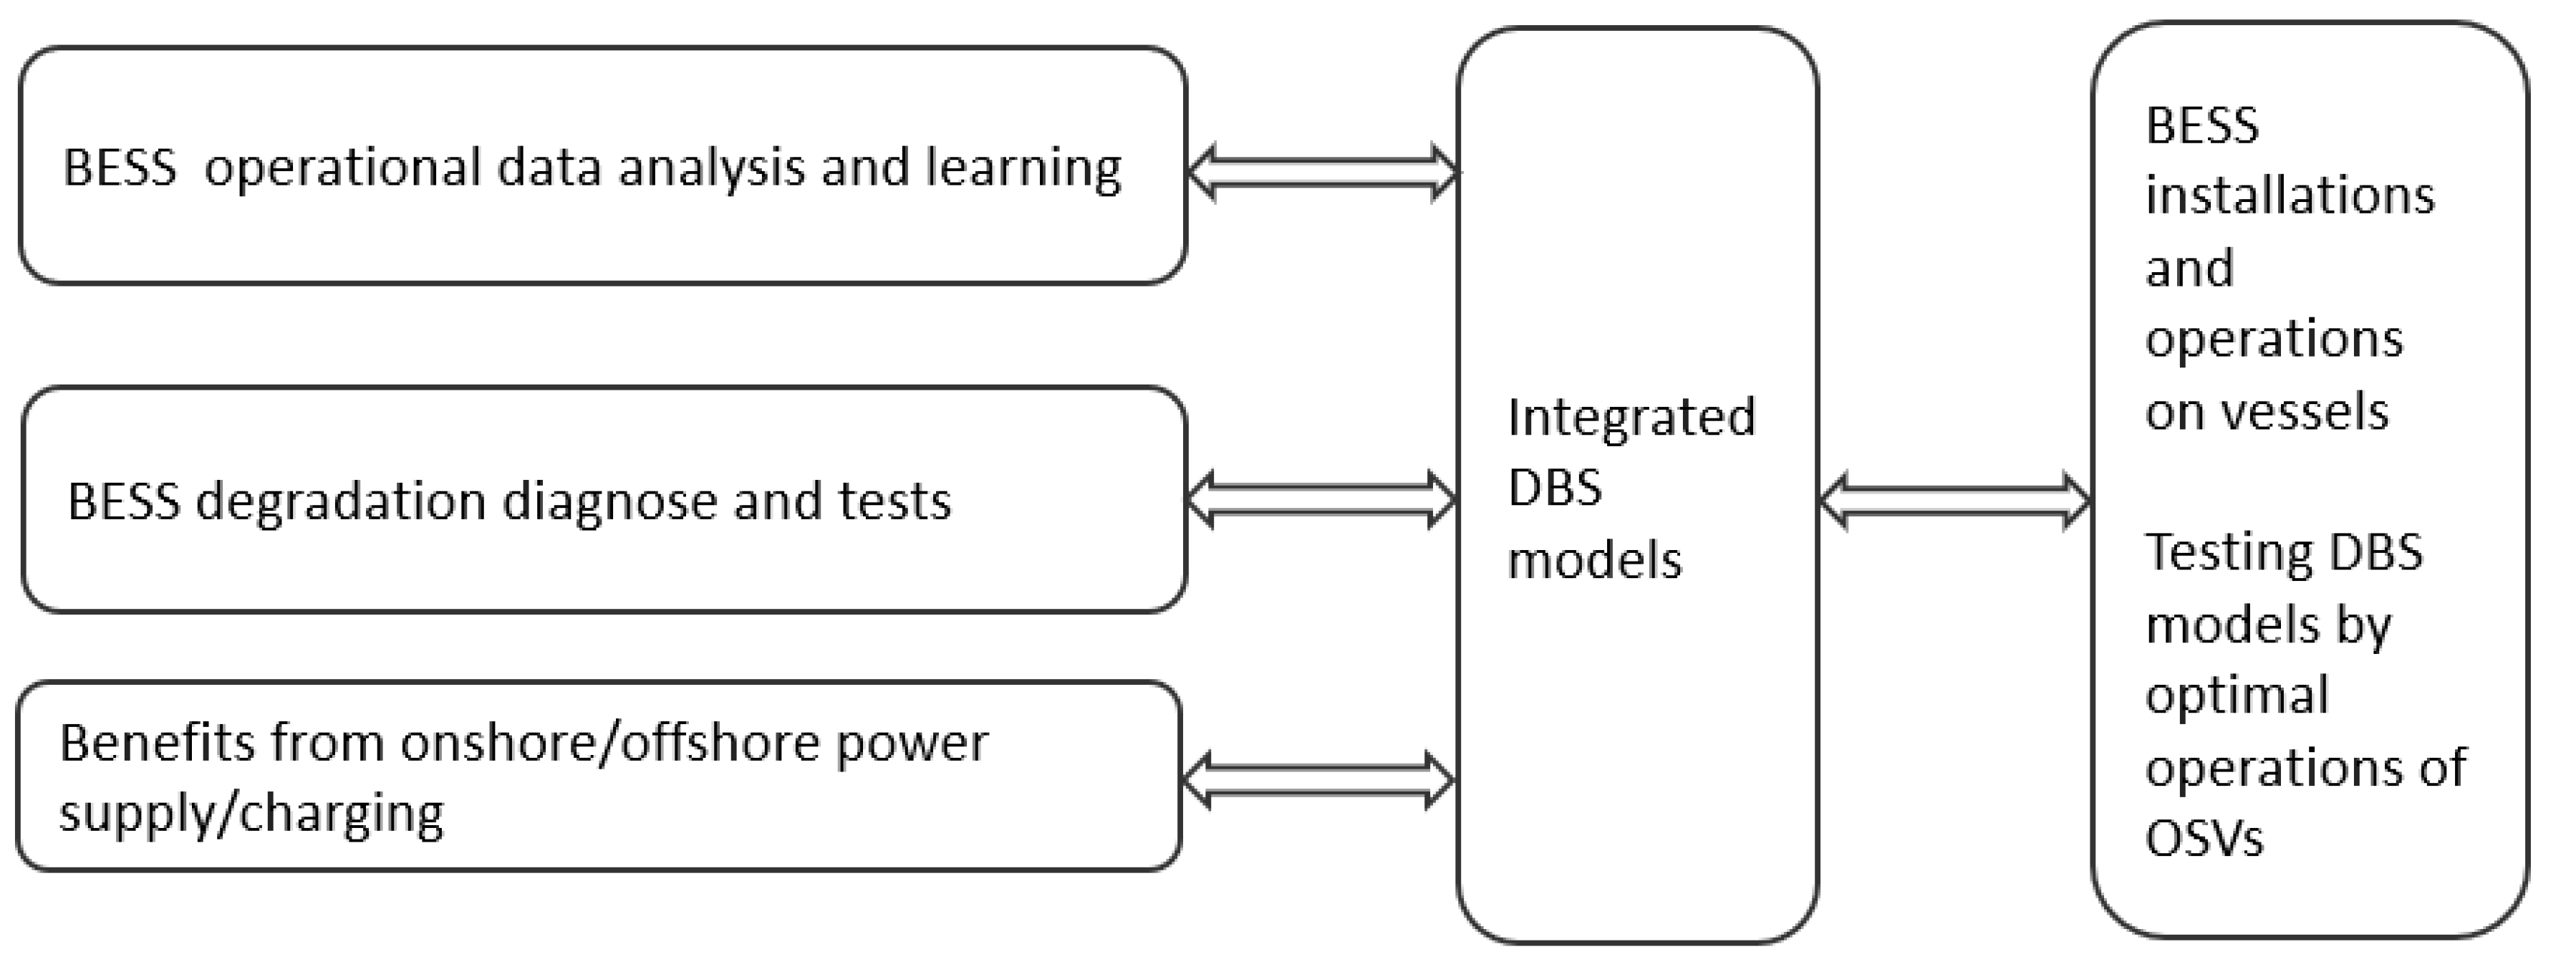
  • Developing new, integrated, optimized operational BESS models by learning from large amounts of collected operational data, accounting for battery degradation and using onshore/offshore green power supply/charging.
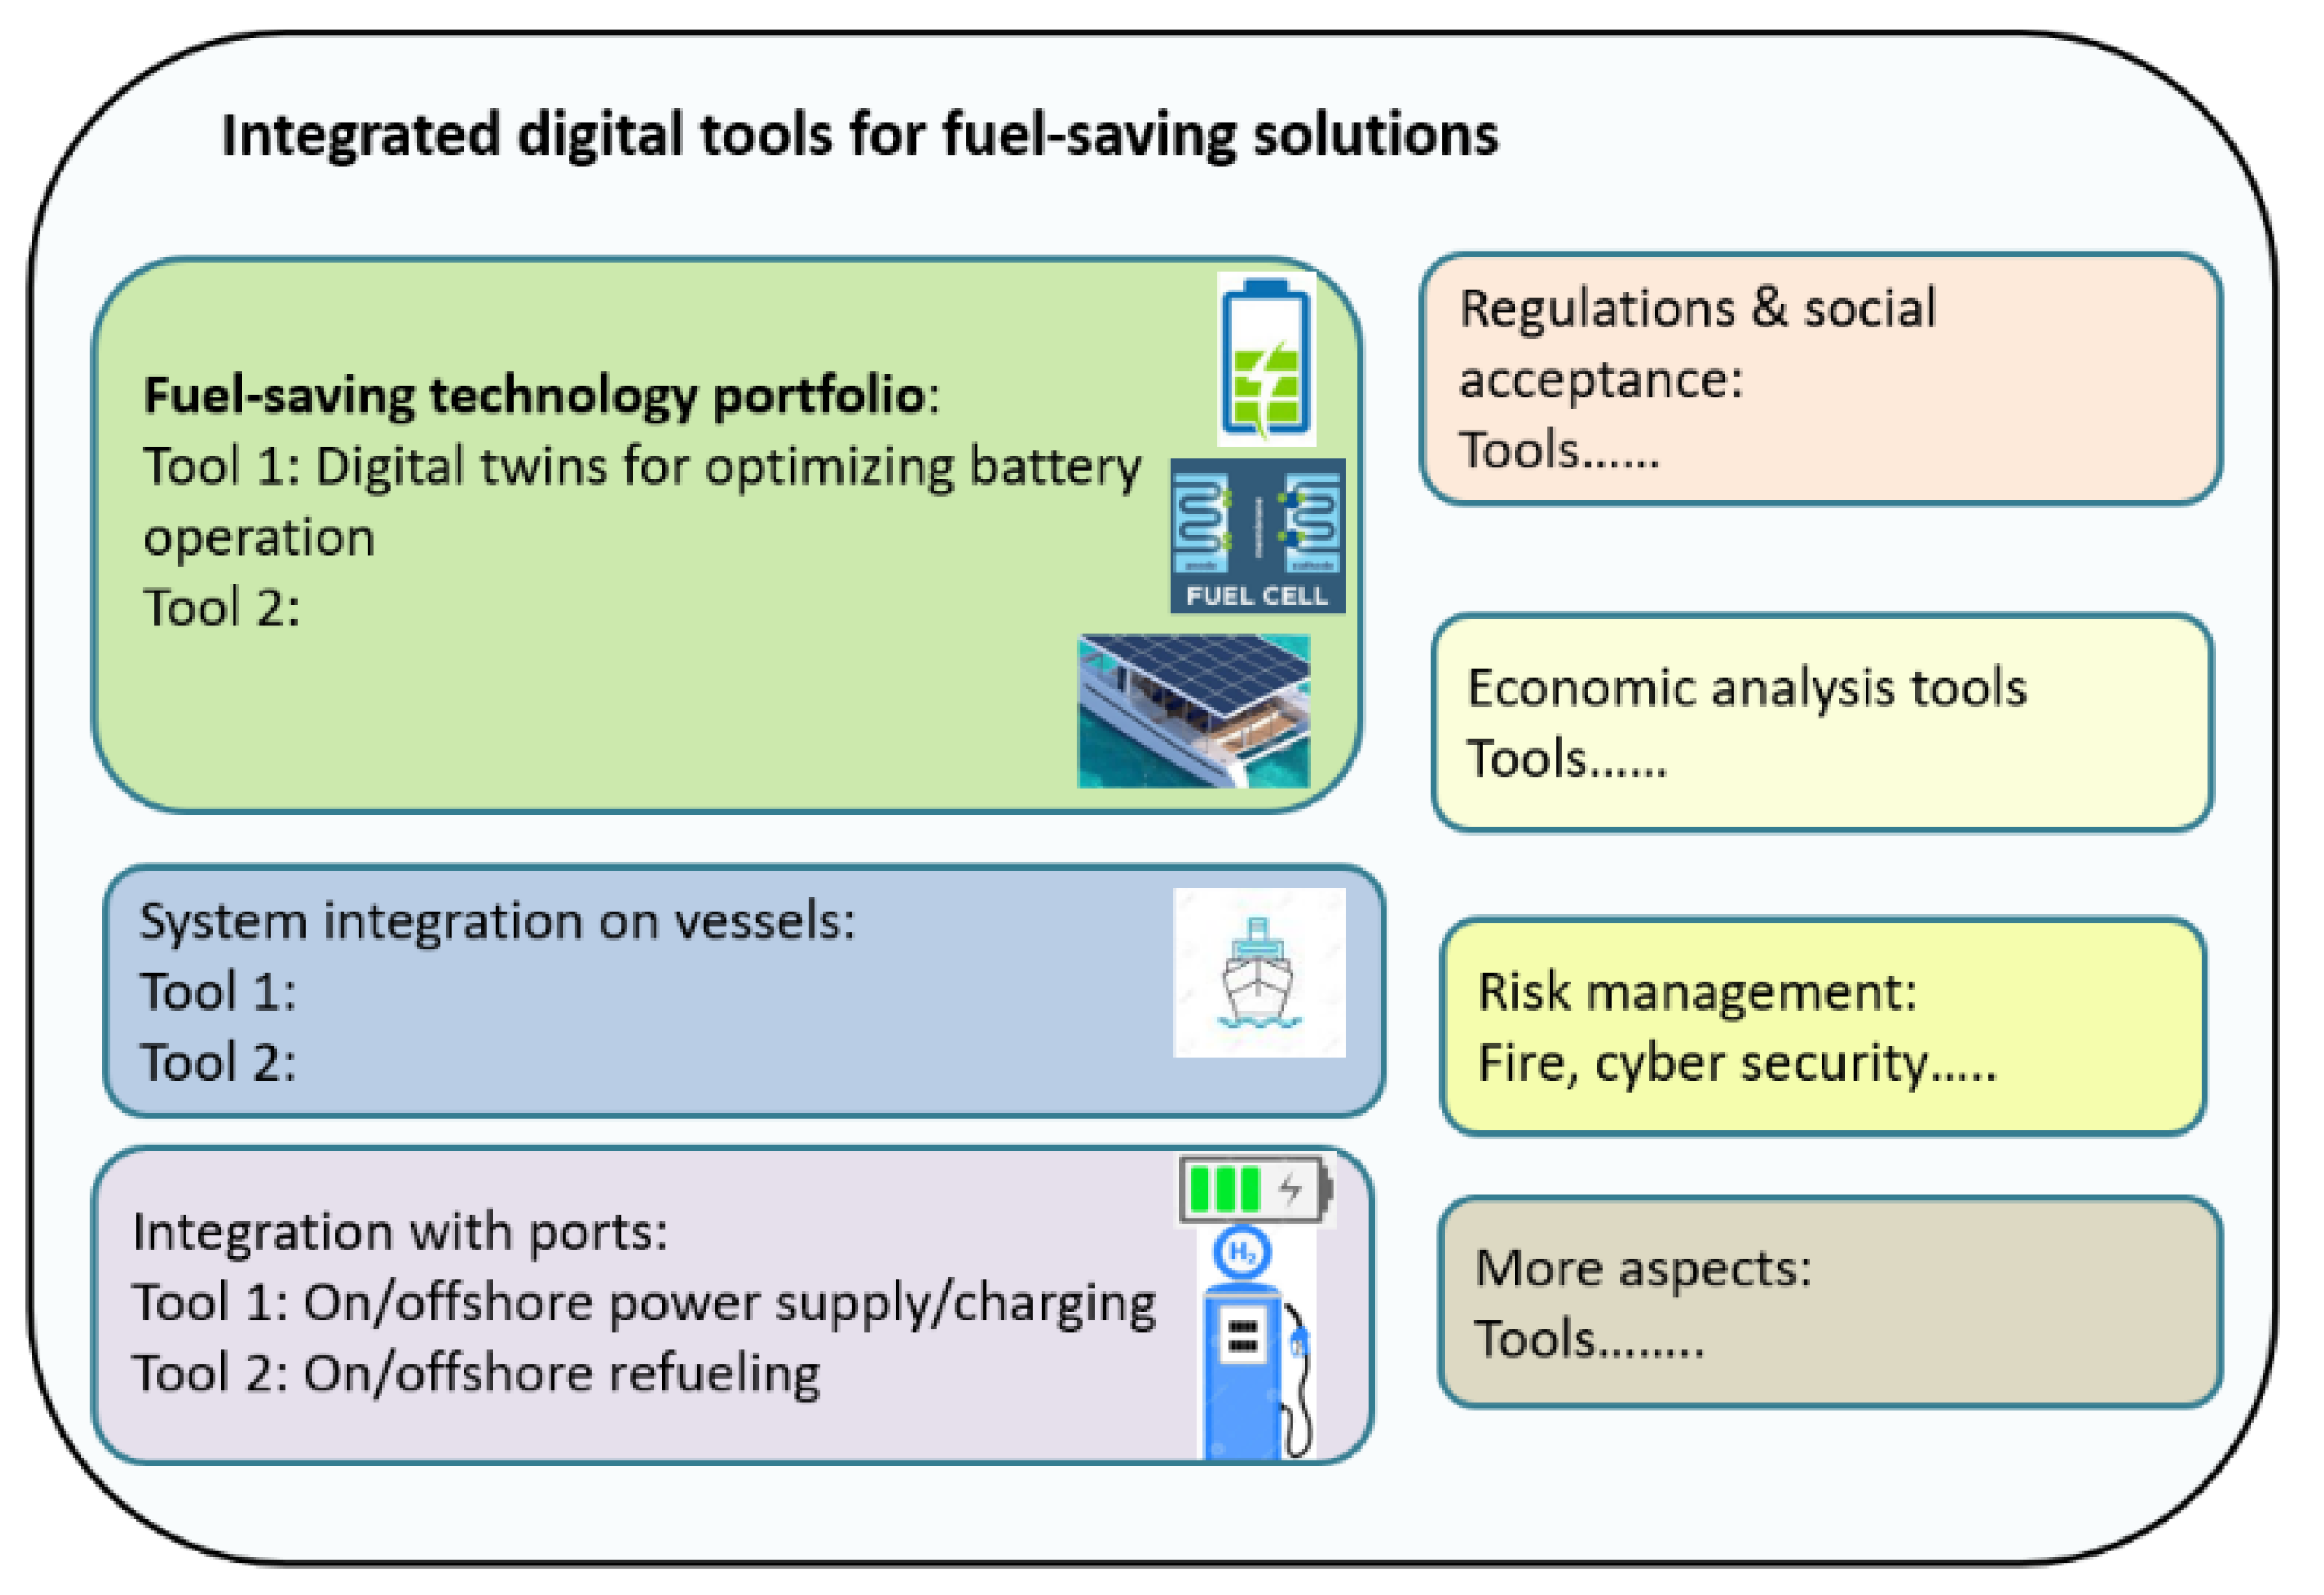
  • Establishing four scenarios to accelerate BESS uptake and facilitate technological and operational transferability among similar vessels, different vessels across sectors and across regions, and technological advancement through digitalization.

3. Reviewing Industrial Approaches for Reducing GHG Emissions

Very few detailed industrial approaches for reducing GHG emissions are publicly available. This section presents Equinor’s CO2 emissions reduction results and approaches. The maritime vessels under Equinor’s long-term contracts for offshore oil and gas platforms operate under harsh offshore conditions in the North Sea, representing a very challenging sector in which to achieve fuel savings and emissions reductions. The marine operation group at Equinor is at the forefront of international efforts to measure and manage the fuel consumptions and emissions from its contracted vessels since 2011.
The CO2 emissions are classified in four categories: (i) supply vessels, (ii) extra supply vessels, (iii) anchor handler vessels and (iv) standby vessels. The annual total CO2 emissions from 2011 to 2021 shown in Figure 1 are the calculated results based on the actual measured fuel consumptions from the four types of vessels together with their efficiencies. Figure 1 shows that the supply vessels have the highest CO2 emissions in all years from 2011 to 2021. The total annual CO2 emissions in 2021 was estimated to be 236,000 tons based on the actual fuel consumption while the CO2 emissions of 436,000 tons calculated for 2008 were based on the best estimates from all the vessel suppliers. Accordingly, Equinor has reached CO2 emissions reductions of 46% in 2021 compared to 2008. Equinor aims to achieve 50% reductions several years ahead of the IMO target in 2030 (218,000 tons in 2030 compared 436,000 tons to 2008).
Figure 2 illustrates the range of approaches for CO2 emissions reductions, showing that effective actions need to combine many aspects including policy and finance (governmental level and company level, e.g., fuel incentive agreements), technology (electrification/clean fuels, accurate measurements, and digitalization tools), and managerial actions (briefing, awareness, ship owner meeting, monthly fuel reporting and effective training programs). More learning from other sectors (e.g., automotive) and their high-impact projects were explored during this study. The experiences and lessons learned from real operational data which resulted in real fuel savings for vessels and other sectors establishes the basis for this study which aims to deploy more BESSs for further fuel savings and emission reductions.
There are strong incentives for enabling innovative green solutions developed across the oil/gas sector to be transferred to other sectors, e.g., offshore wind farms (OWFs). The experience of the Norwegian maritime green program from 2011 to 2021 has also shown that further CO2 emissions reductions are costly and need collaboration across sectors and regions to be more effective. One sector or one country alone cannot achieve the required CO2 emissions reductions. For example, onshore and offshore power suppl/charging infrastructure requires a minimum volume of vessels to be successful, something the offshore oil and gas industry alone cannot provide. Successful upscaling and commercialization of effective green solutions depends on the efforts of the whole supply chain. For maximum socioeconomic effect, five companies reducing emissions by 10% each might be more effective than one company reducing emissions by 50% (since further reductions always cost more). The electrification of waterborne transport can also apply effective energy efficiency solutions from other sectors such as automotive.

4. Experiences of Large BESS Installations and Operations

Large BESS systems installed on fully and hybrid electric vessels are very recent technology and have only begun large-scale operations in the past five years. This study draws from BESS installation decisions and operational experiences of many systems installed on vessels across Europe. Table 1 summarizes the impact of 500 BESS installations undertaken by Corvus onboard various vessels, with their reported/estimated operation and maintenance (O&M) costs, and fuel and emission reductions. With new installed BESS systems, the O&M costs for fully electric vessels (e.g., car ferry) can be reduced by 80% compared to ferries powered by conventional diesel engines. The O&M costs of hybrid vessels can also be significantly reduced by installation of large BESS systems due to (i) reducing the operational hours and start up/shut down times of the rotation machines (e.g., diesel generators) and (ii) improving operational conditions of the rotation machines (e.g., increasing its operational low load to its design load). These O&M cost reductions decrease when the BESS systems degrade over time and need replacement after several years operations. The design life for most of these 500 BESS systems are for 10 years. Large BESS system installations onto vessels have been effective for fuel and emission reductions on all types of vessels. However, the losses of BESS systems, together with high electricity costs can pose problems.
The learning from Corvus’ 500 BESS installations can be summarized with regard to policy, financial support, and technology, as follows.
Firstly, policy and financial support are crucial for BESS installation decisions. For example, for one end user of BESSs, all 16 of its OSVs (which are used for oil and gas-sector work under long-term contract) installed BESSs before March 2019. However, none of its OSVs that are working for OWFs have installed BESSs during this period. This was because the company’s policy for oil and gas platform employed OSVs emission reductions was one step ahead of the policy for OSVs working for OWFs.
Secondly, the installation of BESSs is still expensive and time-consuming. The installation cost of retrofitting a BESS onto an OSV is often twice as much as the cost of the container containing the BESS itself, and it can take months or years of preparation before the actual installation is carried out. Reducing the installation costs of BESSs through standardization of the interfaces between BESSs and vessels is urgently required.
Thirdly, one of the largest technological barriers slowing down BESS installations is the increasingly demanding safe operational requirements for certification and re-registration of flags, especially for retrofitted vessels. Many certifications are required including comprehensive failure mode and effects analysis (FMEA) [5] after BESS installations. The re-registration of flags might also become a showstopper for BESS installations. For example, one French ship owner/operator purchased a 900 kWh BESS, but it could not be installed due to the requirements of the flags not being met.
BESSs on hybrid OSVs currently have two functions: (i) peak shaving of the power from diesel generators—using the BESS to ensure the generators operate at optimal efficiency, and (ii) BESS capacity serving as spinning reserve during dynamic positioning (allowing one generator fewer to operate). Without BESSs, an OSV must have two diesel generators in operation (one for supplying power and another one for spinning reserve). With BESSs, only one diesel generator needs to be operational, and the BESS capacity serves as the spinning reserve, assuming it has been sized to offer sufficient power and energy for this purpose. This reduces fuel consumption by avoiding the need to run an additional generator inefficiently (at part load).
Very few R&D efforts have been dedicated to optimizing these kinds of BESS operations. Most vessel owners/operators are conservative regarding BESS operational modes, hence there are larger potential benefits still to be unlocked from installed systems. When larger capacity BESSs are installed in hybrid-electric vessels, their optimized operations are increasingly important. Furthermore, extending BESS integration from onboard to include the port power supply and charging infrastructure could have a high impact on emission reductions from vessels.

5. Installation and Operation of a 630 kWh BESS

This section presents BESS practical installation costs and operational results of retrofitting a 630 kWh system onto a commercially-operating OSV. The objective is to quantify the improvement requirements for installations and operations.

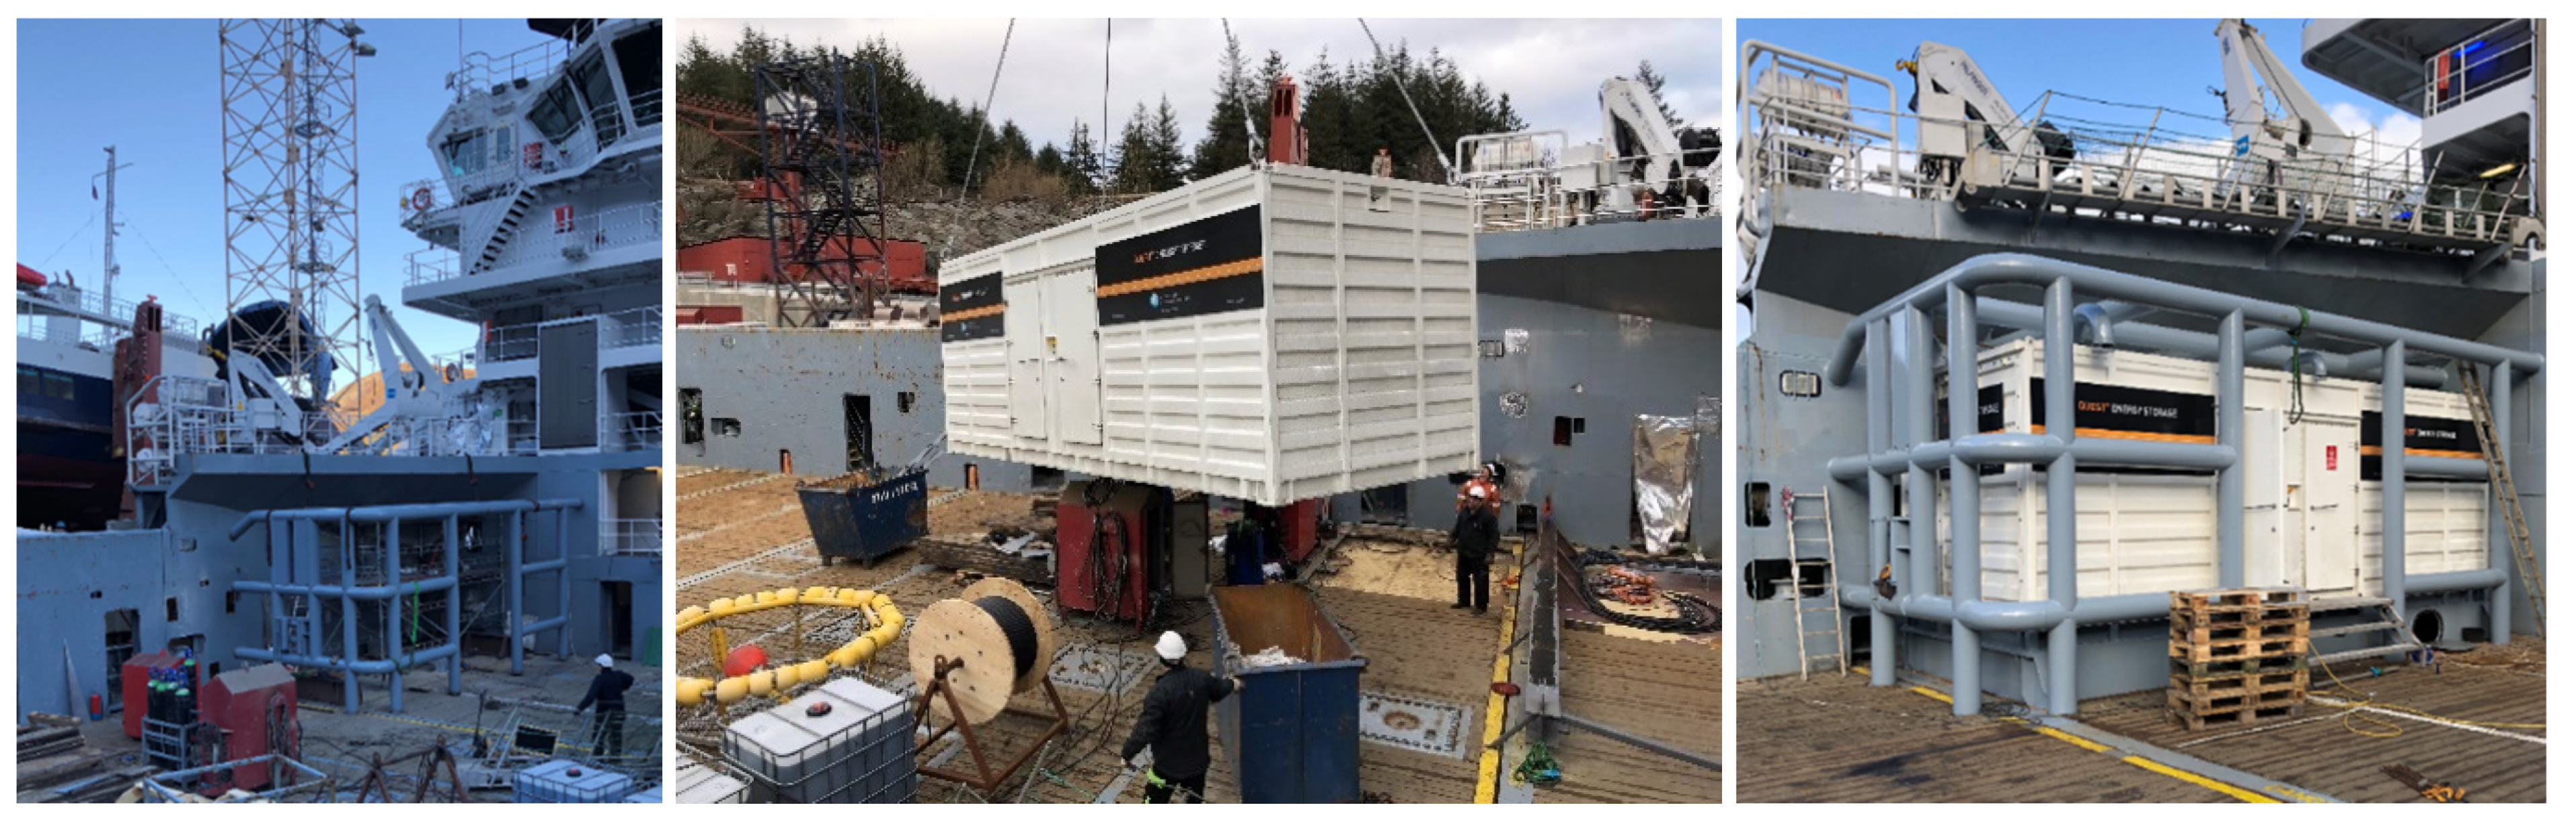
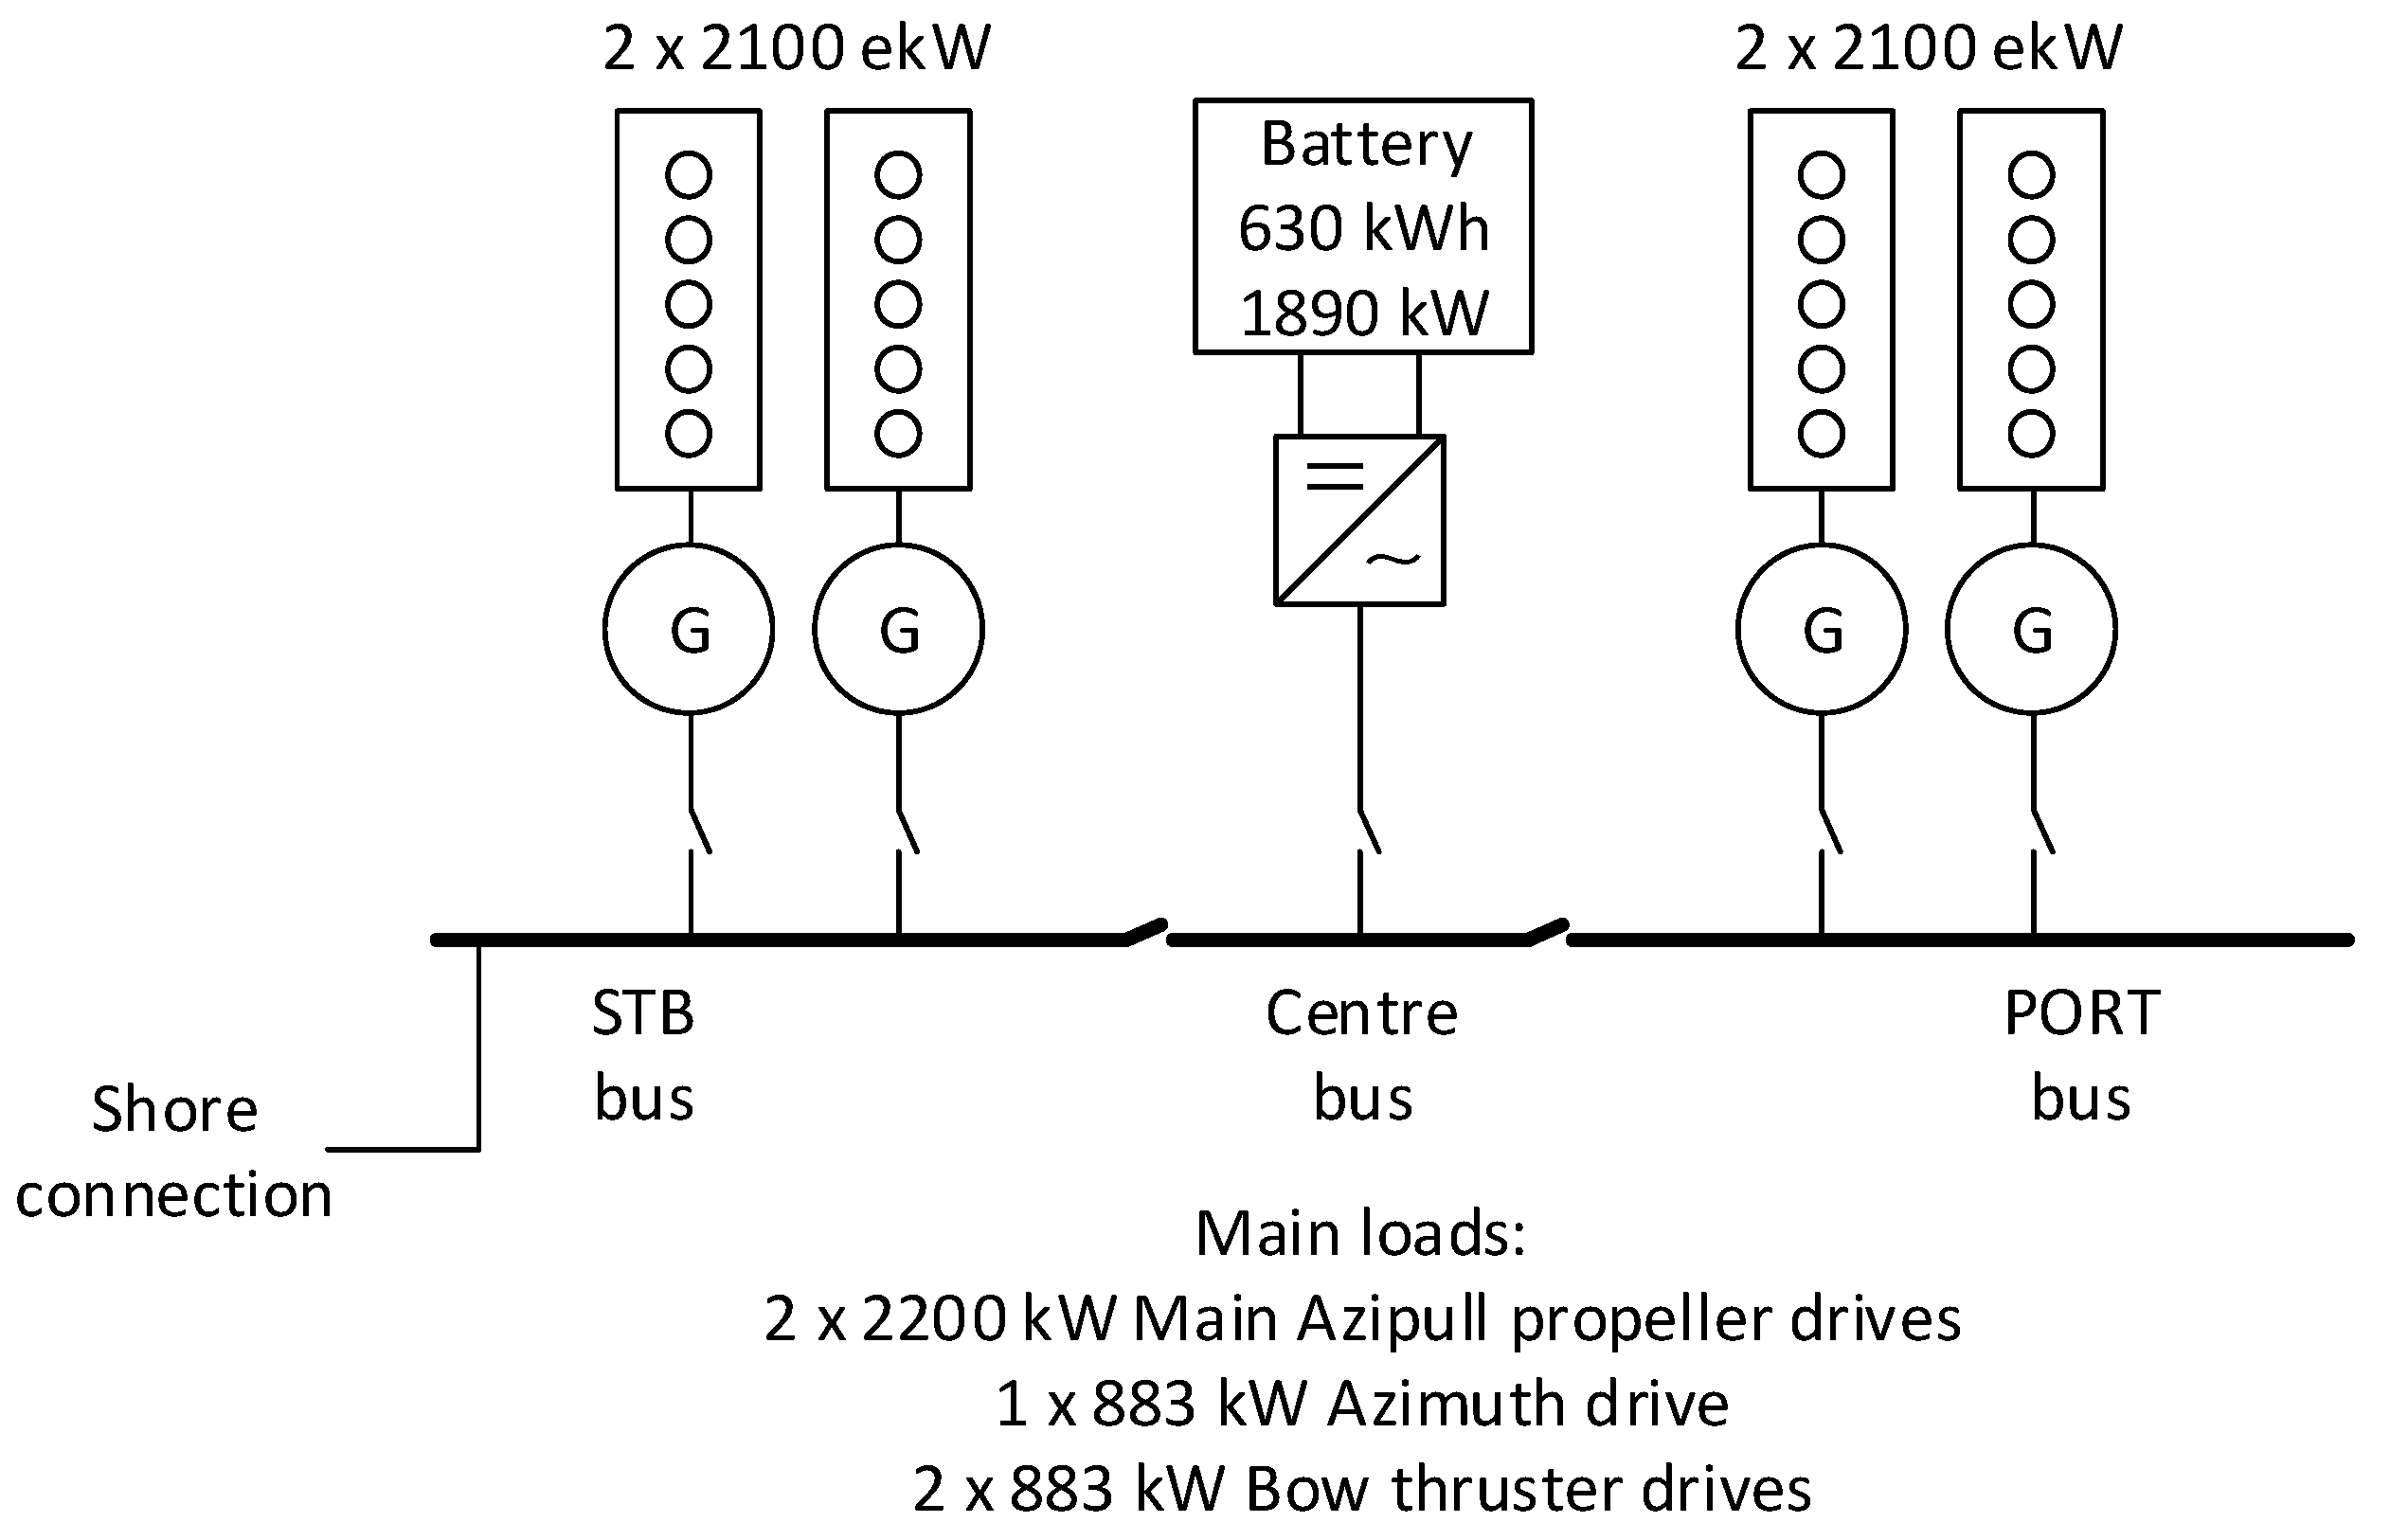
5.1. Installation of a 630 kWh BESS on a Hybrid OSV

A 630 kWh BESS comprising the Corvus Orca Energy Storage System (Orca ESS) was retrofitted onboard a commercially operating OSV in March 2018, and four-years of operational data (2018-2022) have been collected. Orca ESS is a large-scale lithium-ion battery product, designed for hybrid and fully-electric ferries, tugs, cruise ships, superyachts, and port cranes. The OSV was originally built with four diesel generators each having a power generation capacity of 2100 kW. The goal of this section is to present the system installation and operations and to show the need for improvements.
Actual BESS implementation approach, timescale, and costs depend on many factors, including the ship owners’ interests, financial situation and suppliers, and can vary substantially. Installation of a 630 kWh BESS on one commercially operating OSV in 2018 is illustrated in Figure 3. The installation can be summarized into six major aspects as listed in Table 2 and Figure 4.
Firstly, the development of safe and cost-efficient installation plans is crucial. The plans include (i) the type and size of BESS, based on economic feasibility (costs and benefits analysis (CBA)) and the BESS supplier (who typically has a one-year delivery time), (ii) arranging contracts with the suppliers, and (iii) defining requirement from the shipyard for OSV retrofitting. Secondly, negotiation with shipyards and the selection of one for the retrofitting project. Thirdly, four sub-contracts were issued for BESS interactions on the OSV (including mechanical, thermal, electrical grid and communications). Fourthly, the delivery of a 630 kWh containerized BESS at a cost of 1 M€. Fifthly, the installation and commissioning of the BESS took one-month of work time. This included multidisciplinary actions at a cost of approximately 1 M€. For the ship owner, there will be also a 0.6 M€ loss due to the vessel losing commercial rental income for one month. The renting loss can be reduced if the ship owner can effectively combine the installation period with its existing ship O&M plans. Sixthly, after the BESS is installed, comprehensive testing including FMEA is required, and new flag registration is required.
The total cost of a 630 kWh BESS retrofitted onto an OSV according to the six aspects listed in Table 2 was 3.4 M€ (5397 €/kWh) while the installation costs were 2.4 M€ (71%) and the containerized BESS itself was 1 M€ (29%) in 2018. This BESS retrofitting cost of 5397 €/kWh onto vessels is 10-fold more expensive than retrofitting the equivalent battery systems for electric vehicles (EV) in the automotive sector [6,7], since the retrofitting of vessels currently requires many custom designs that are time consuming to source and install and have high failure risks. The volume of systems is also much smaller compared to the EV sector. The standardization of interactions, including mechanical, thermal, electrical grid and communications, between BESSs and vessels is urgently required to reduce the installation costs and to increase the safety.

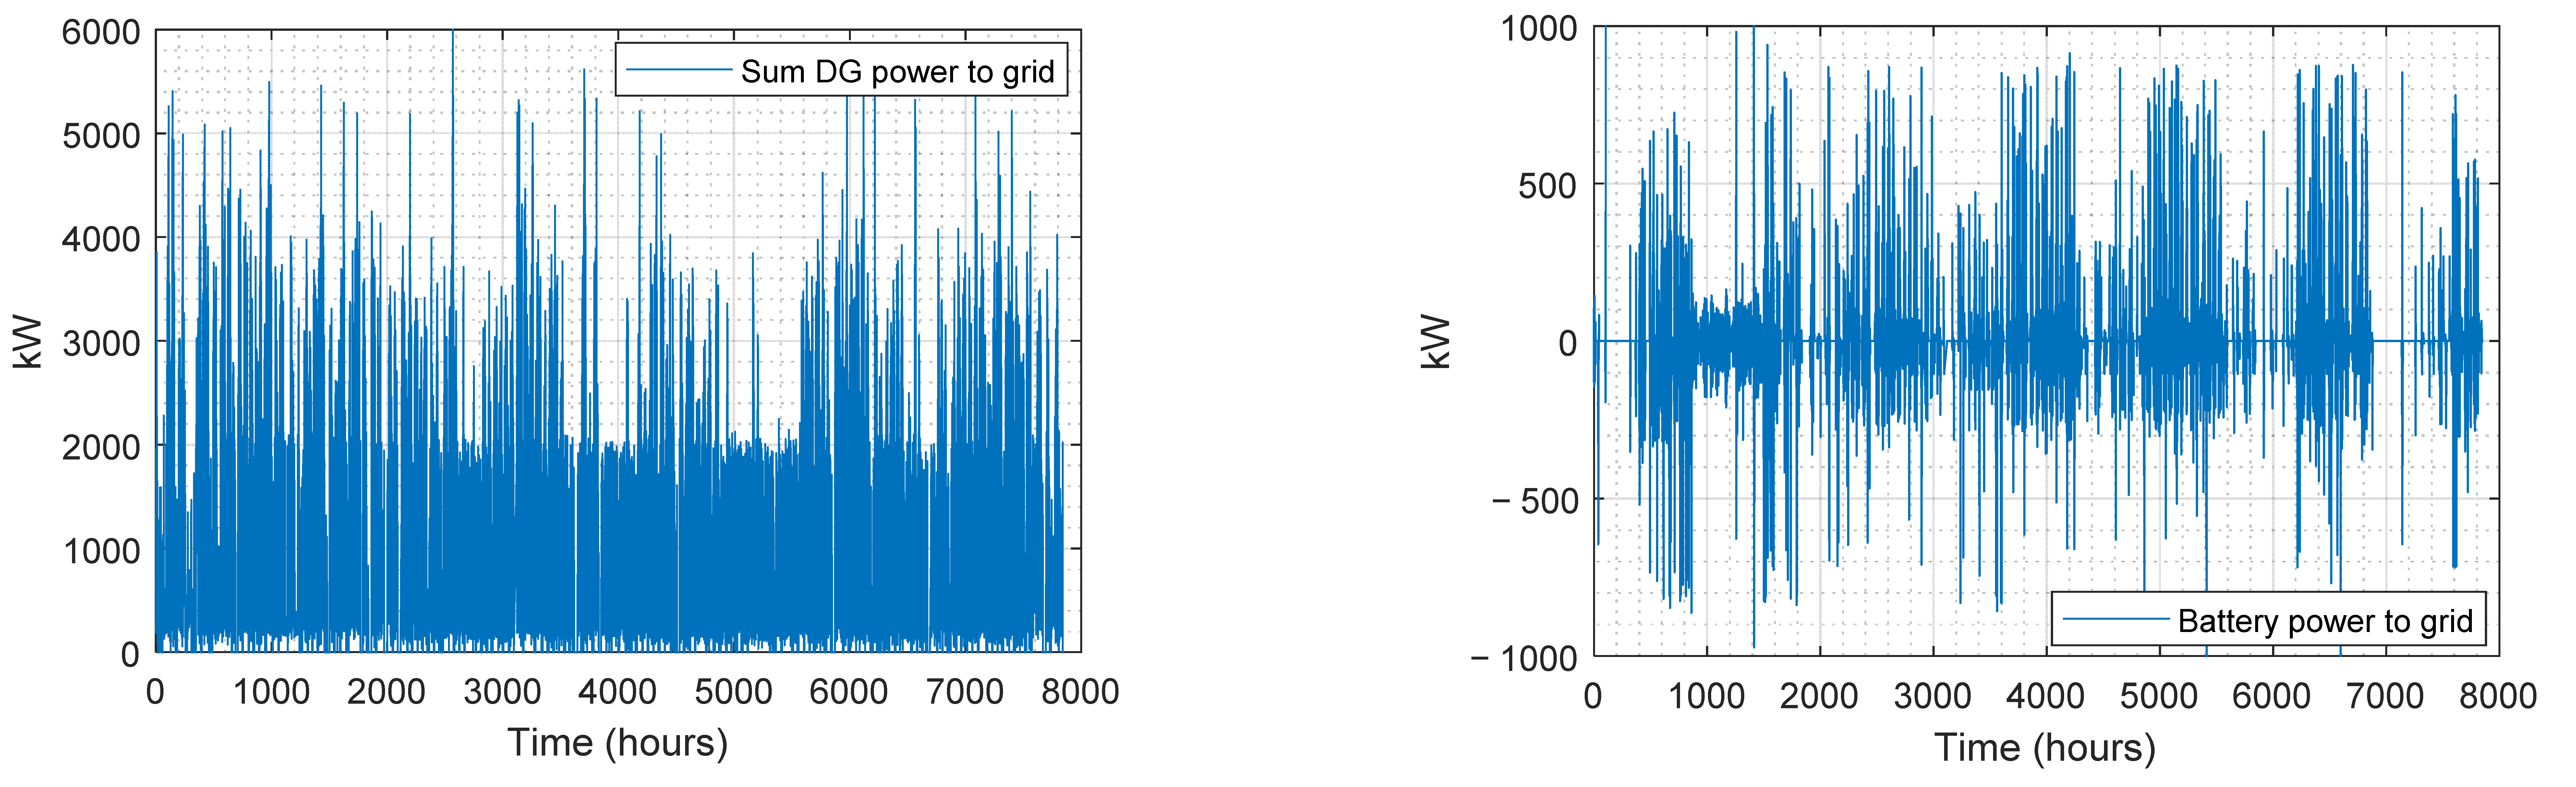
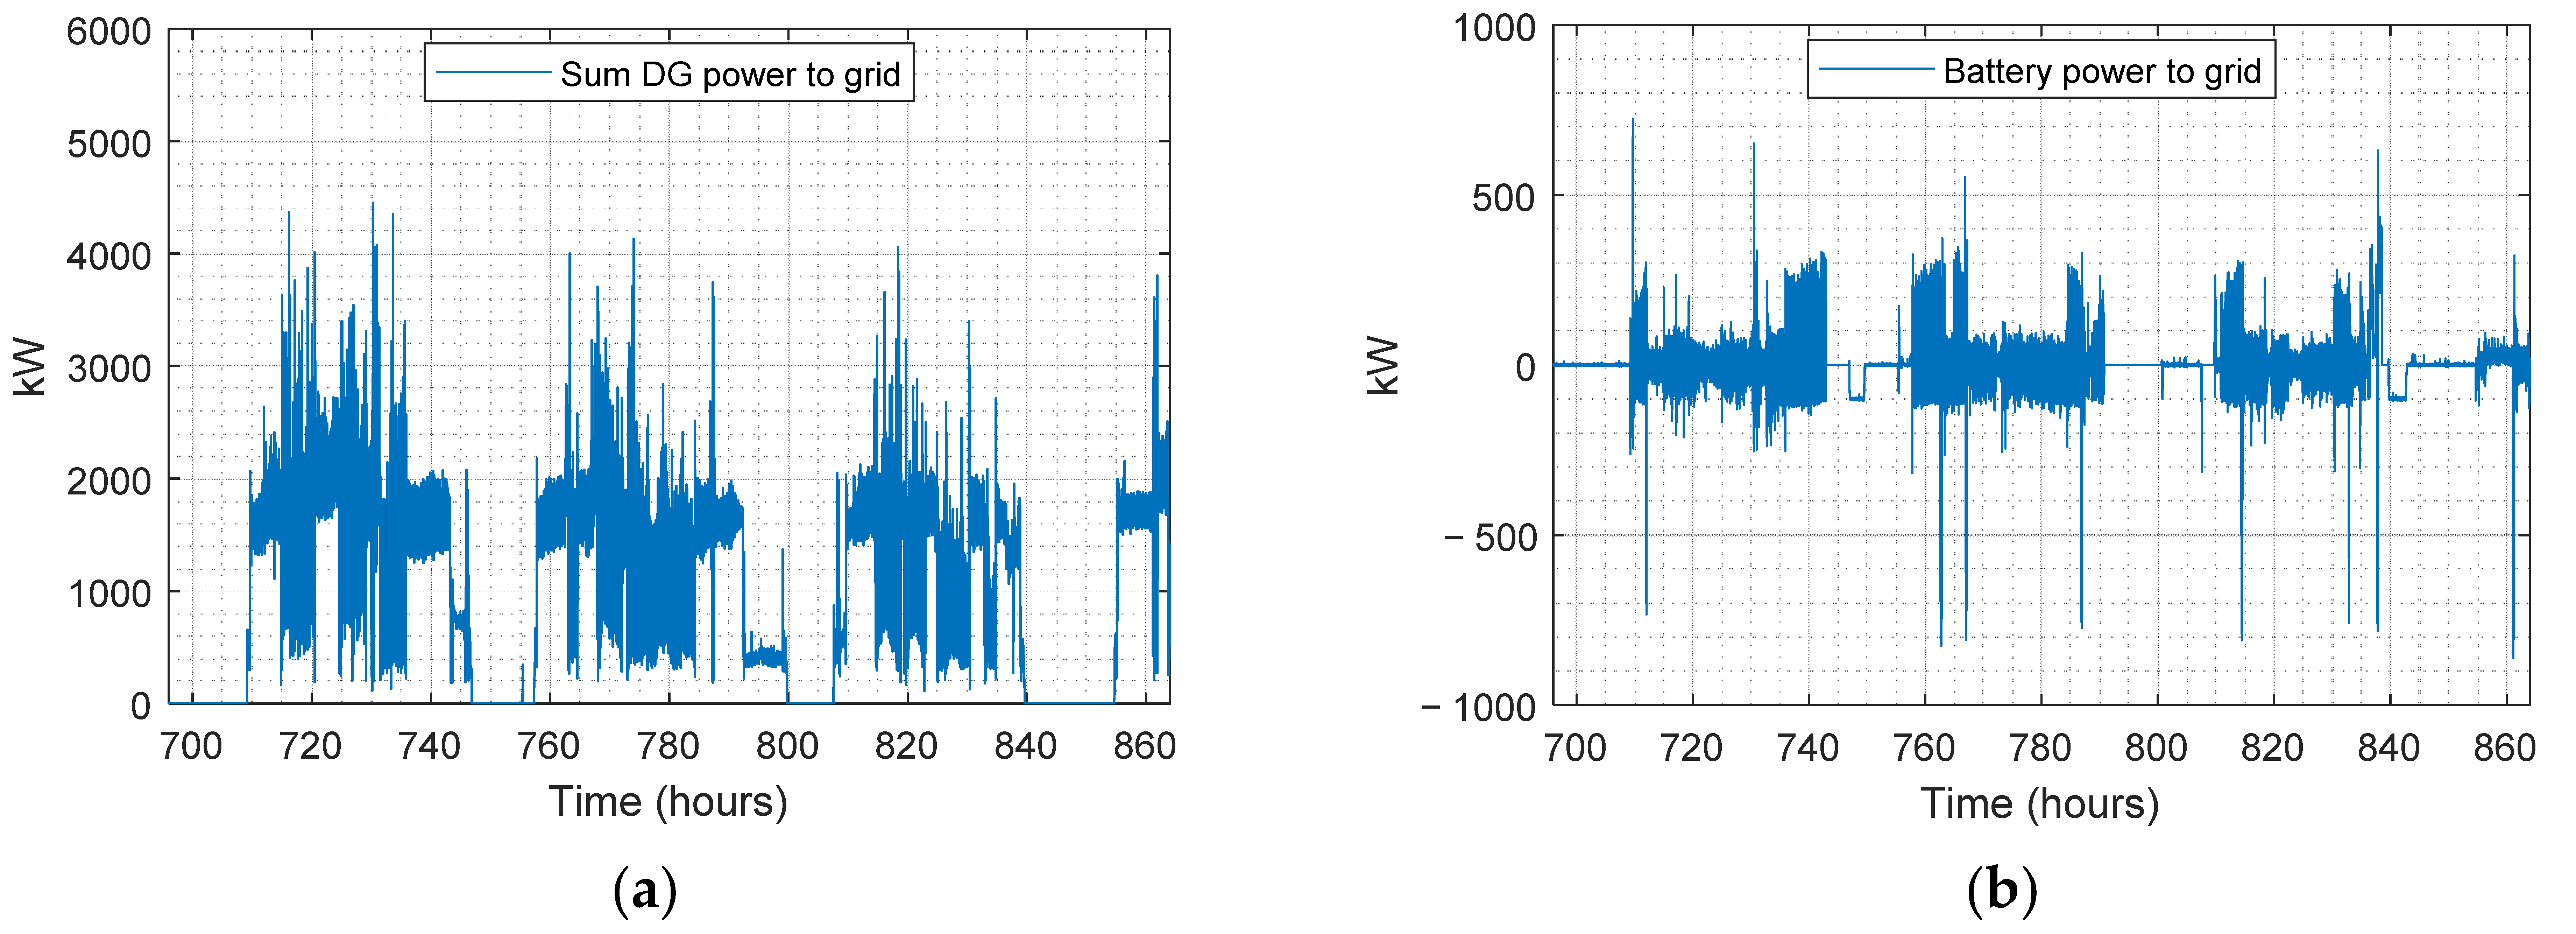
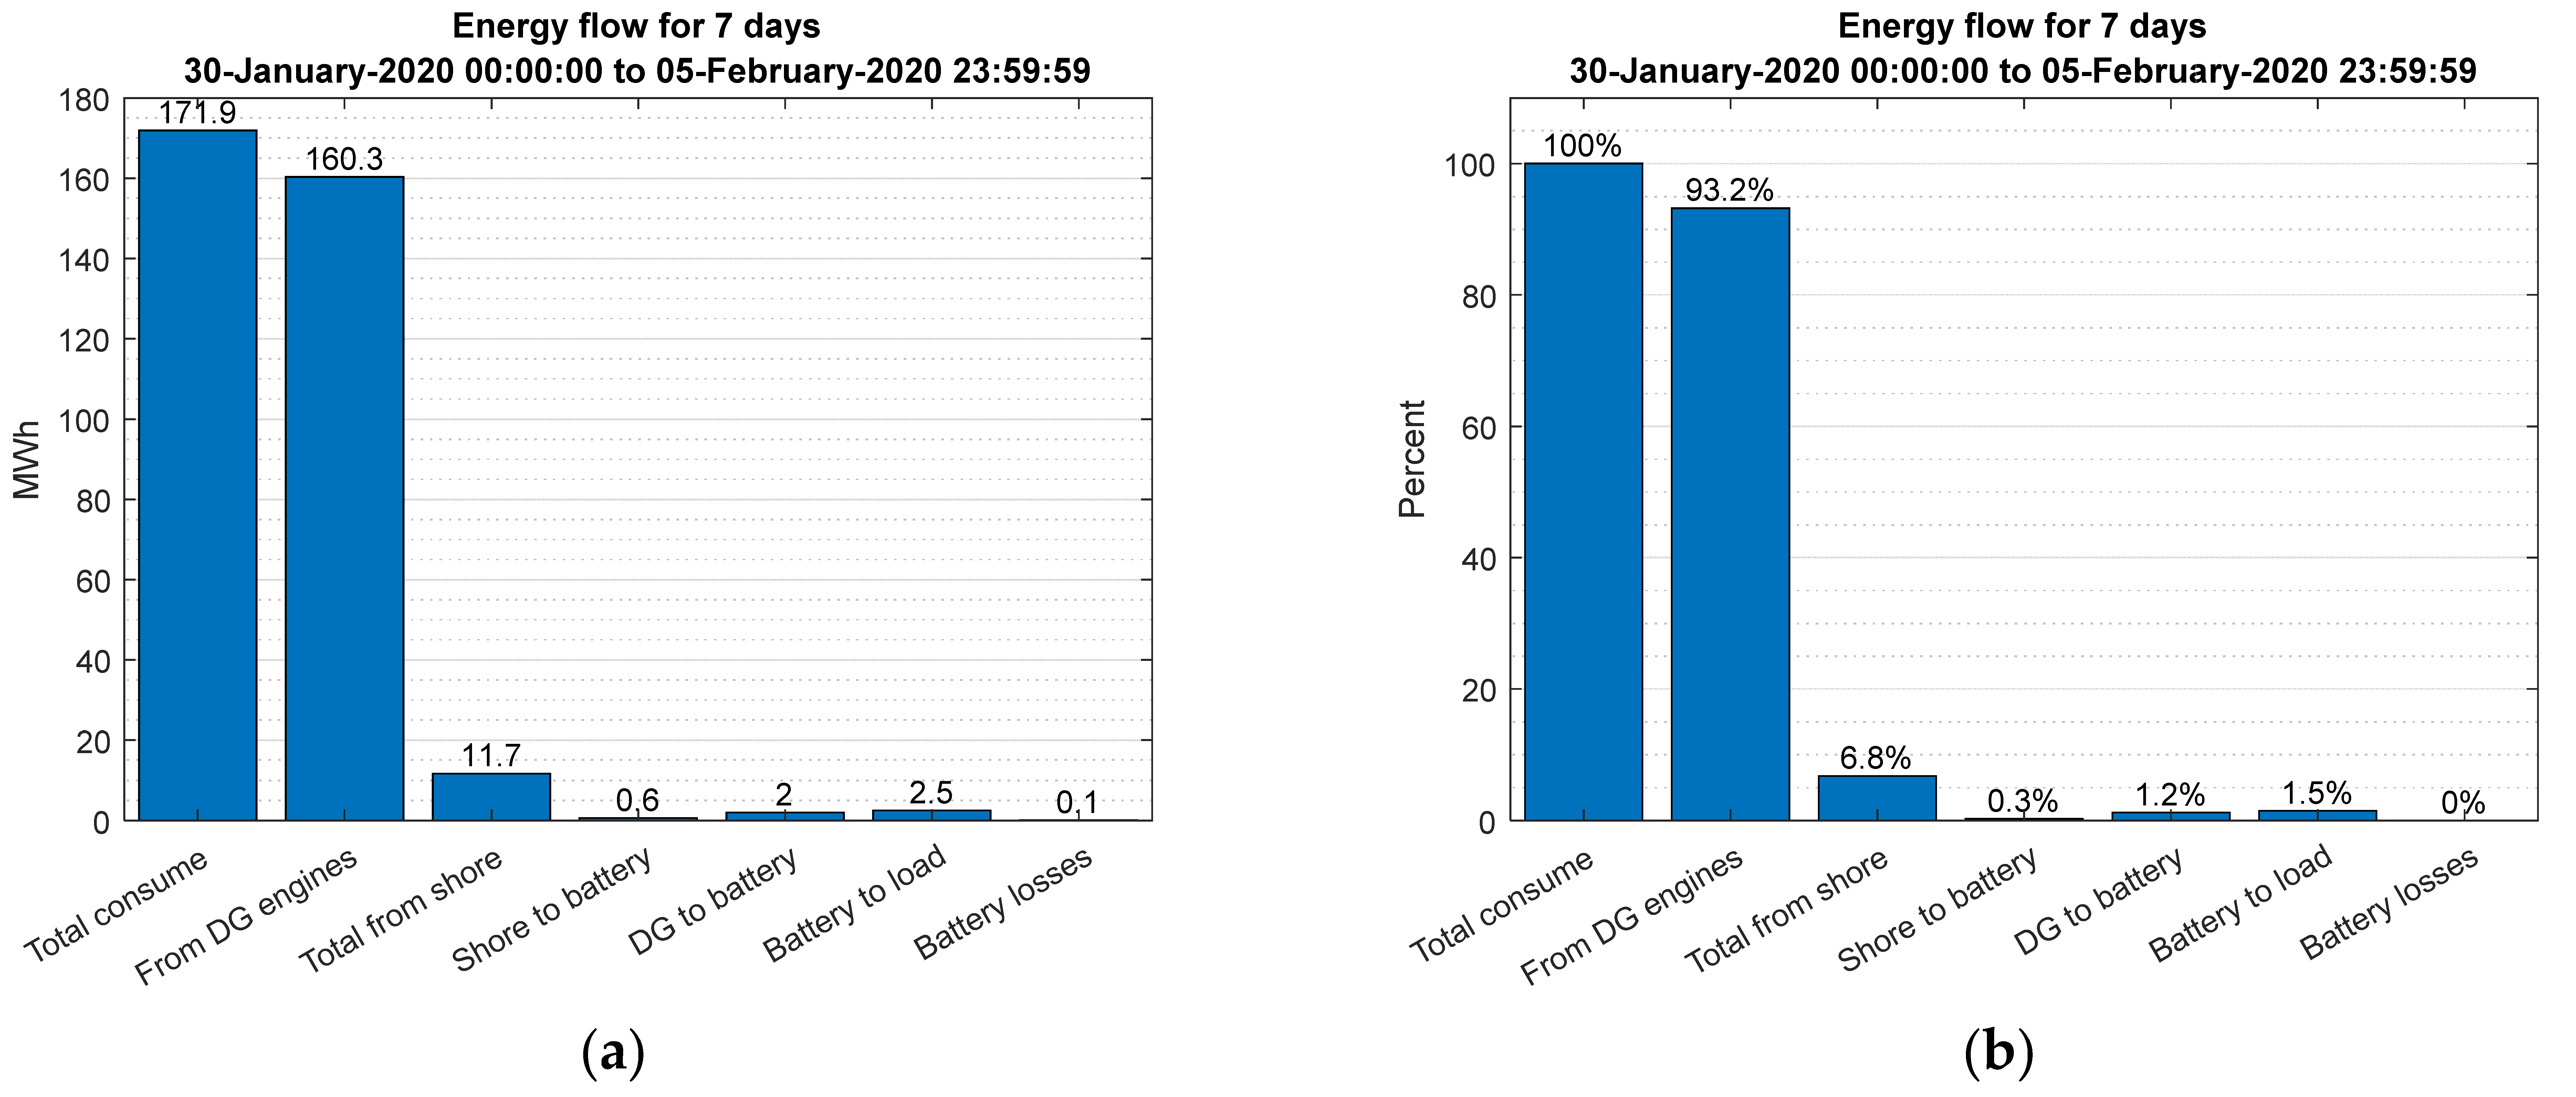
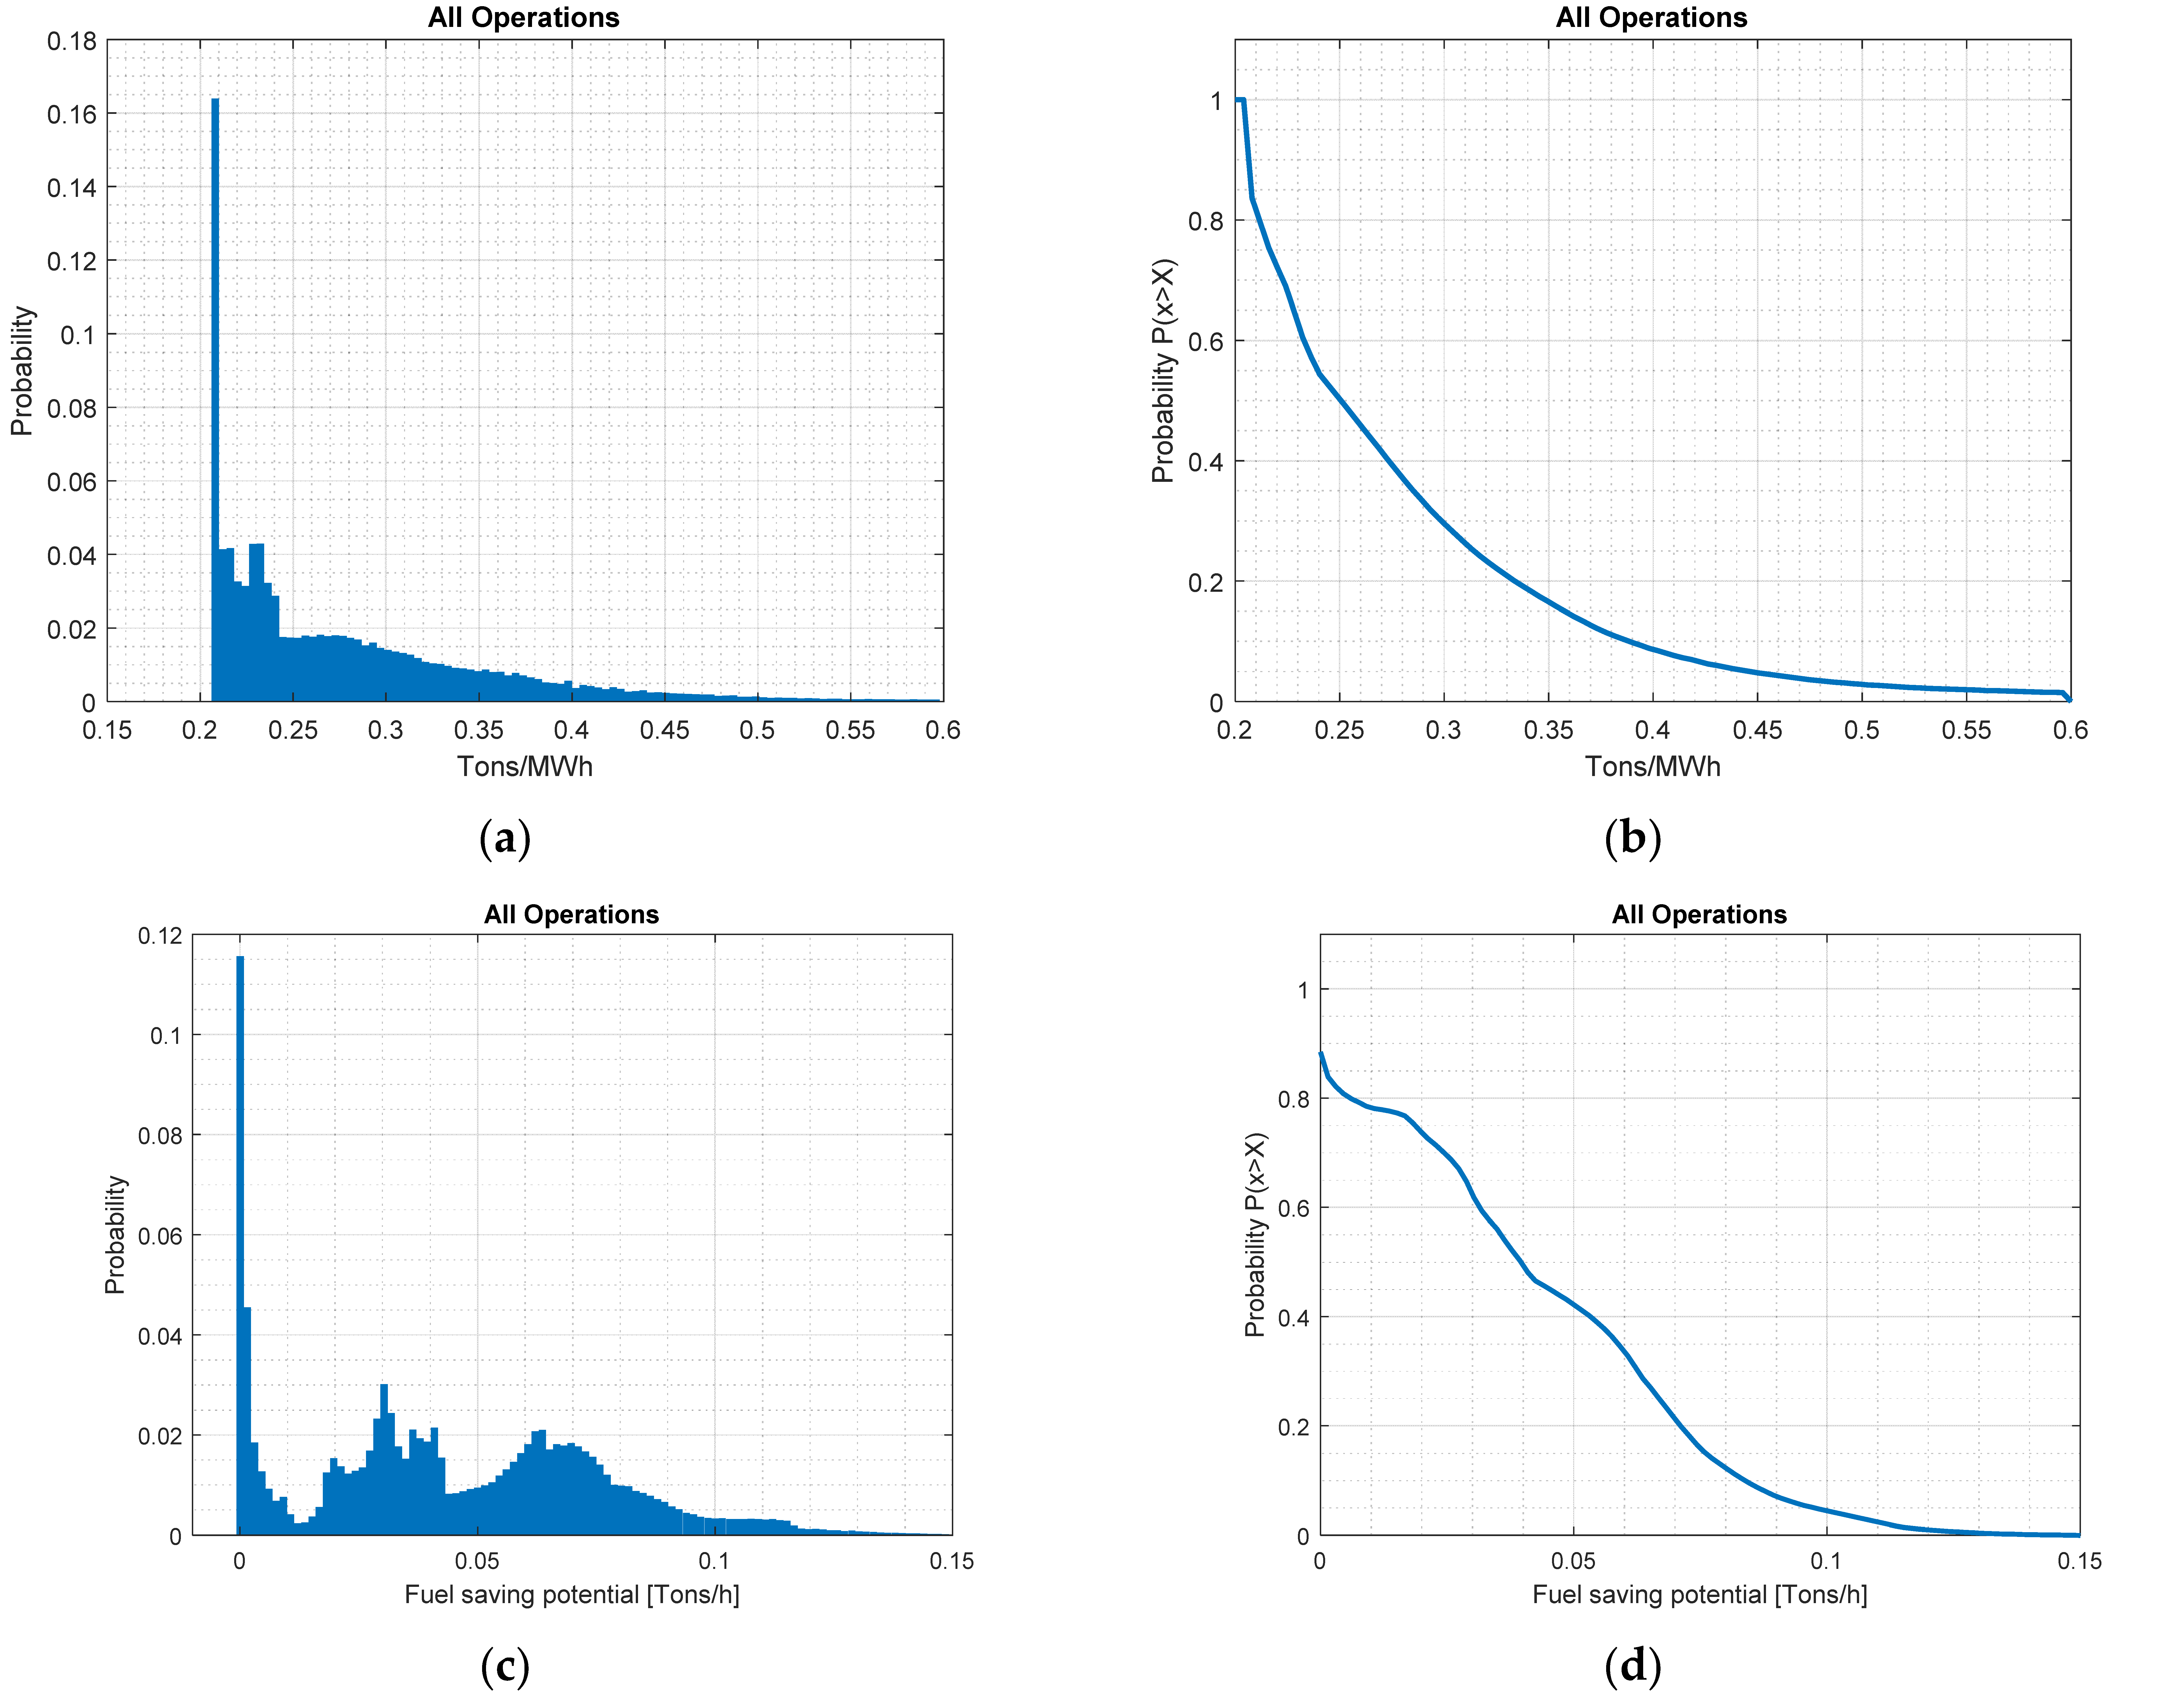
5.2. Operations of a 630 kWh BESS on a Hybrid-Electric OSV

The operation of a battery system aims to minimize the total fuel consumption from OSVs that have a hybrid micro-grid consisting of diesel generators, batteries, and green power injections from onshore and future offshore stations. As mentioned, the example OSV for this project has four diesel generator units (each with 2100 kW) and one installed BESS unit (630 kWh, 1890 kW).
A 630 kWh BESS was integrated into the diesel–battery hybrid system onboard the OSV as shown in Figure 5. The best operating point (lowest specific fuel consumption) from the measurements was found to be at 1629 kW, where the specific fuel consumption is 209 kg/kWh.
The 630 kWh BESS has operated for four years since its installation in March 2018. The available operational data includes 165 parameters at the system level per second (including power generation from diesel units, actual power and rate of charging from BESS) and battery internal performance parameters per second via the lighthouse port (e.g., cell stage of charge, voltage, state of health and temperature; pack voltage and current). This section only discusses the data at the system level. The 11-month’s power generation time-series data from both diesel generators (DG) and the battery are shown in Figure 6, and both datasets show huge variations in power. The 11-month’s time-series data is for the period 1 January–22 November in this section. The main BESS functions were to serve as (i) a spinning reserve to reduce the number of running engines in dynamic positioning (DP) operations, (ii) peak shaving and (iii) for use when vessels are approaching and staying in harbor.
One selected week from the plot in Figure 6 was analyzed. The total DG and battery power for the week is shown in Figure 7. The aggregated flow of energy is shown in Figure 8. The 630 kWh BESS only contributes a small share of energy to the ship propulsion while the diesel engines are the key source of propulsion energy. A significant amount of energy is supplied from onshore, but this is mostly used to supply onboard hotel loads rather than for battery charging. It is therefore reasonable to believe that the current use of the battery only has a minor influence on fuel consumption, except for the potential savings when using the battery to provide spinning reserve.
The vessel logging system also records the operational modes carried out at any time. These registered operations are in port, in port with shore connection, transit, standby and dynamic positioning. Standby implies that the vessel is positioning at a safe distance from an offshore installation, waiting for a loading/unloading operation. Dynamic positioning is used during critical operations close to an offshore installation. In these operations, there are special requirements regarding redundancy in power generation, and in practice this implies that the vessel needs to run more diesel generators than required normally to provide the load power. As will be shown, the load profiles and resulting engine fuel efficiency depend on the actual operational mode.
The 11-month’s logged data was analyzed to achieve a better understanding of the fuel-saving potential. Figure 9 shows the probability distribution of the time elapsed at a given total level of power production in the analyzed period. The distributions are normalized such that the sum of probabilities in each plot is 1. These give significantly more information than the average and peak measurements shown in Figure 10. The plots (a) to (d) show the probability distribution for each operation, and these show that the distribution is quite specific for each operation. Plot (e) shows the probability distribution of power generation in all operations in the analyzed period. The probability distributions are all normalized per mode. such that the sum of probabilities in each plot is 1.
Figure 10a shows the number of hours the vessel has operated in each operational mode within the same week as shown in Figure 7. Shown is also the sum of power delivered from the engines in each of the operations (peak and average). Power from shore is not recorded in the onboard data logging system and is therefore zero in Figure 10b. Figure 10b also shows that the difference between average and peak load is large, and the average load is quite different in different operational modes.
In order to identify the fuel efficiency of each generator, one needs to know the individual load on each engine. The number of running and connected diesel generators varies, depending on the operations, environmental conditions (wind, sea current and waves) as well as onboard operating procedures, safety requirements and crew preferences. The probability distribution of the time elapsed at a given individual loading (kW) of the diesel generators is shown in Figure 11, in each operation, (a) to (d), as well as for all operations (e). It is observed that the individual probability distributions are significantly different from the distribution of total power.
Included in the plots is also a red line showing the best operating point for the engines. An important observation is that the engine load is close to the optimal time in transit, but mainly far from optimal in all other operational modes.
The specific fuel consumption curve (SFC) for the engines was deduced from the measurements. Measurements of instantaneous fuel consumption (tons/hour) and generator power (kW) where used to find a piece-wise linear approximation of fuel consumption per hour at different loading. This approximation where then used to estimate the specific fuel consumption curve that shows the tons of fuel consumed per produced MWh, for different loading. The curves were found to align quite well with the datasheet curves of the engines.
The deduced SFC curve was then combined with the individual loading of the engines to create the probability distribution of the specific fuel consumption (tons/kWh) shown in Figure 12a. The plot shows the probability that a running engine operates at a specific fuel consumption (tons/kWh). The corresponding cumulative distribution is shown in (b). The important observation from Figure 12 is that the engines operate most of the time at specific fuel consumption above the minimum and that there is potential for improvement. It is, however, important to remember that the periods with the highest specific fuel consumption are those with the lowest production since the engines have low efficiency at low load. The fuel usage is, therefore, low in these periods, and consequently the fuel-saving potential is not as large as one might expect based on inspection of Figure 12a,b. Additional insight in the fuel saving potential is found from Figure 12c,d which shows the probability and cumulative distribution of the fuel saving potential of running the engines at their best operating point all the time. This is purely theoretical since it will require an ideal, lossless battery system to maintain optimal loading. It defines however the maximum possible fuel saving that can be achieved by optimizing the engine operating point.
An analysis of the battery power flow shown in Figure 6, from the 11-month’s operation shows that the total energy delivered from the BESS was 45.6 MWh, corresponding to 50.9 MWh for the whole year if one assumes that the analyzed period is representative of a whole year. Accordingly, the BESS underwent 80 equivalent full cycles yearly, which is low compared to the system specification of 480 equivalent full cycles yearly. More significant fuel reductions should be possible by fully using the energy throughput of the BESS, without risking the battery’s 10-year design life. New, integrated BESS optimal operation strategies are required to achieve this.

6. Suggestions to Unlock BESS Benefits for Ship Owners

This section suggests research activities that are needed to increase BESS benefits for ship owners by developing integrated diesel–battery hybrid system (DBS) models, enhancing and developing both onshore/offshore green power supply/charging infrastructures, dealing with the increasing safety requirements for installation and operation of BESSs on vessels, and paving the way for further CO2 emission reductions.

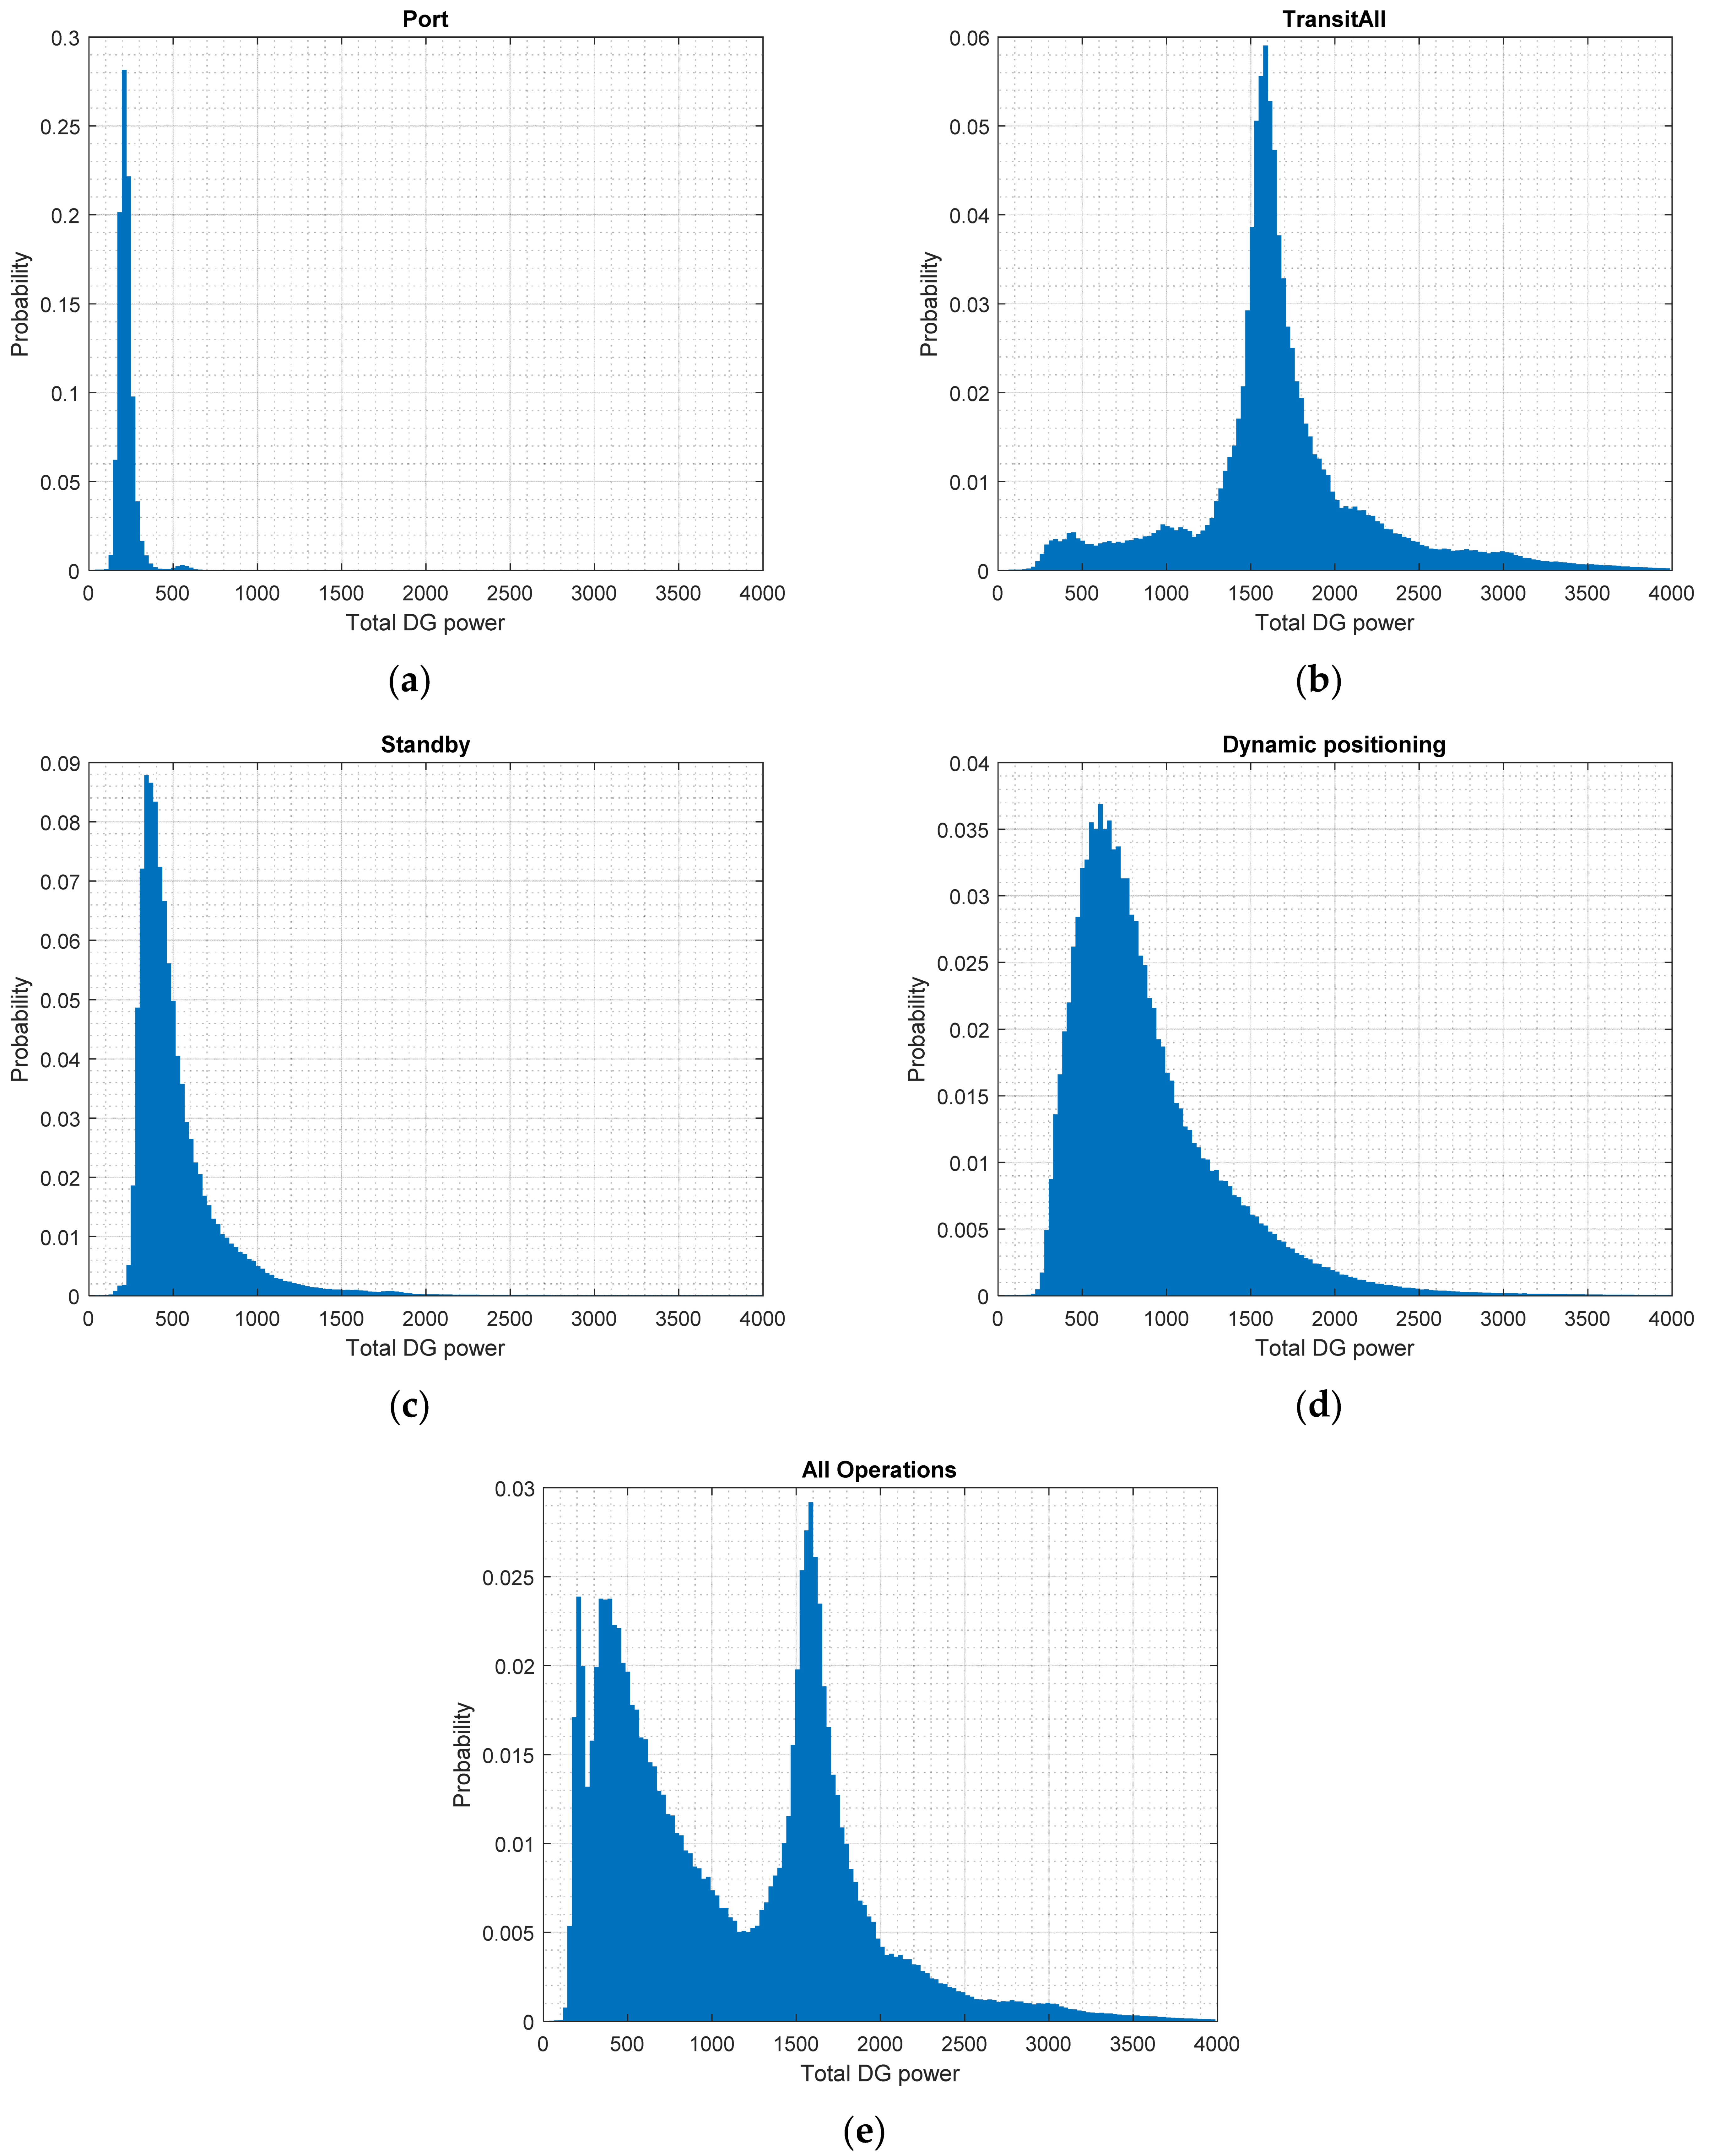
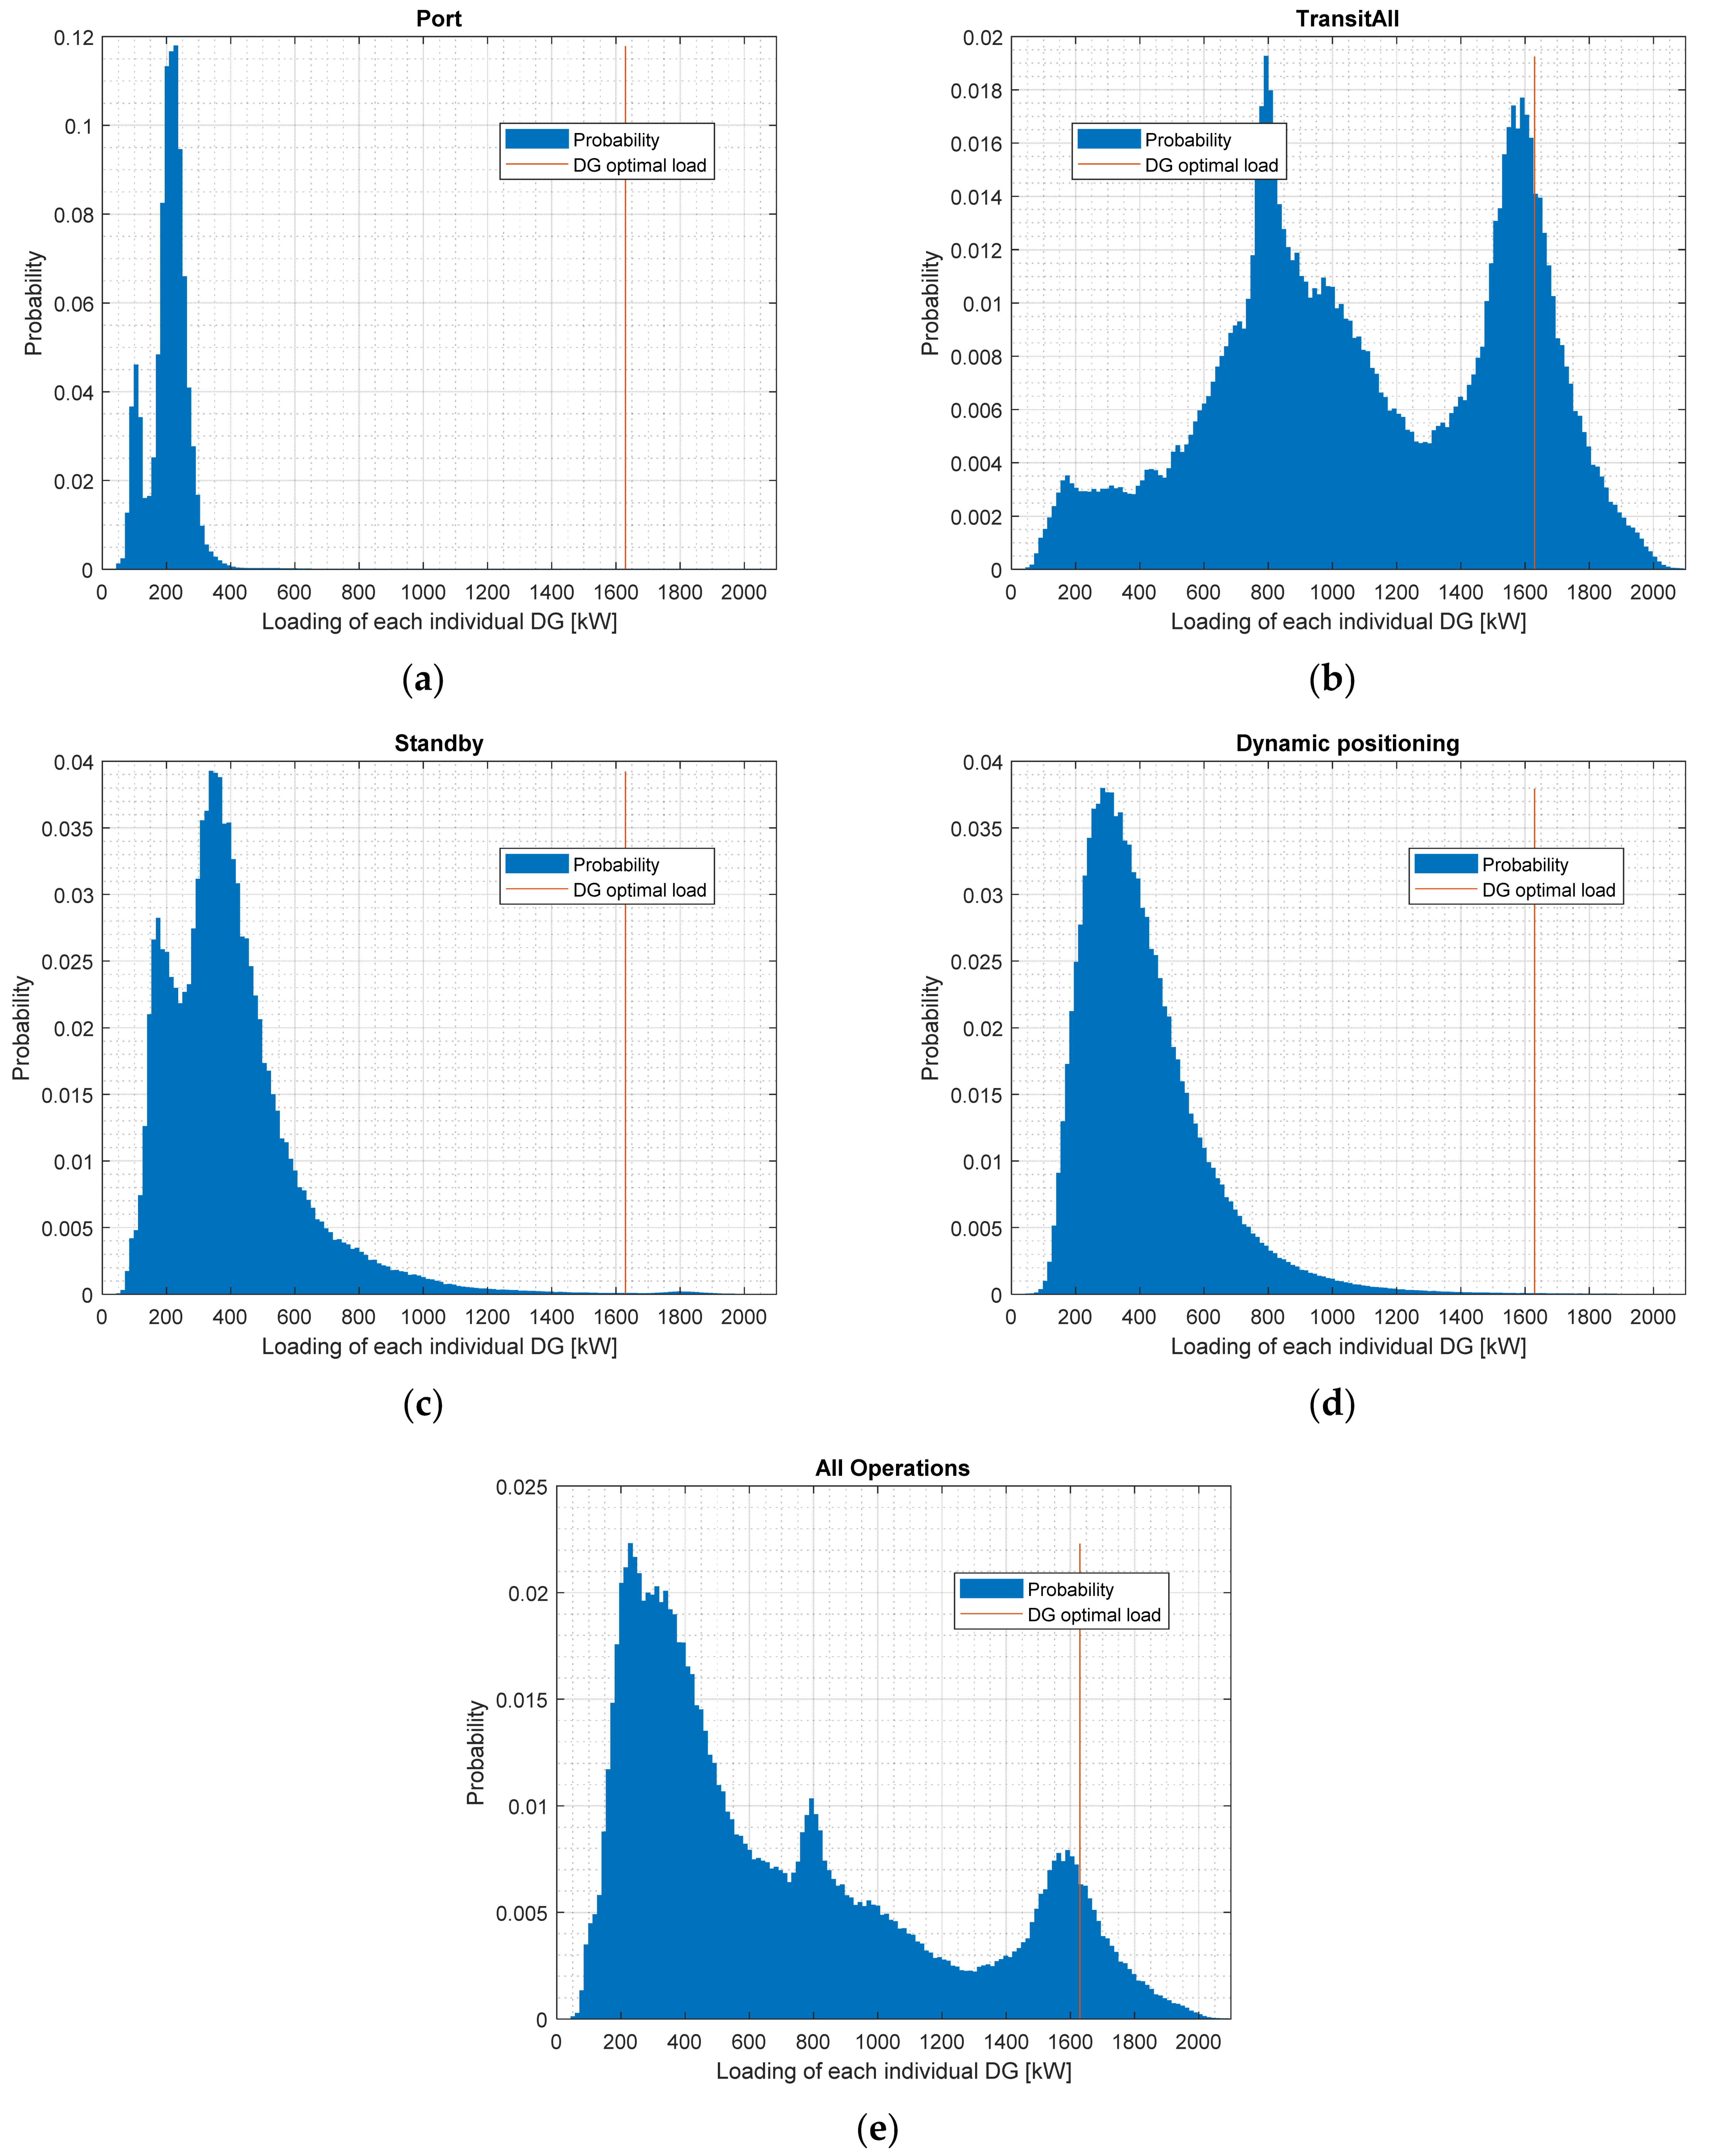
6.1. Development of Integrated Optimized DBS Models

Optimal operational strategies for BESSs on diesel–battery hybrid systems were developed by Olve Mo [8,9]. The development of the integrated optimized DBS models aims to provide useful information for ship owners’ and operators’ BESS investment decisions and optimal operations. In [8], it was shown how to implement a real-time strategy for battery power flow control in order to reduce the average specific fuel consumption, considering battery system losses as well as battery system degradation. In [9], it was shown how to implement a real-time strategy to maximize the fuel-saving impact of energy supplied from the shore. The next step is now to combine these methods, as well as to include possible offshore power supply connections. In addition, the real-time strategy will be extended to take into consideration CO2 emissions taxes and the cost of engine maintenance (related to the number of start/stops and running hours). It is expected that both CO2 taxes and engine maintenance costs will influence the optimal battery system operation strategy (optimal from the ship owner’s perspective).
The new optimized DBS models will include findings from the large amount of operational data, balancing BESS degradation and benefiting from offshore power supply/charging. The developed DBS models will be validated by commercially operating OSVs. As shown in Figure 13, the novel, optimized DBS operational models will integrate three new BESS numerical models: (i) operational data analysis and learning using a large amount of operational data, (ii) degradation diagnosis and testing, and (iii) benefits from onshore/offshore green power supply including for charging BESS. The DBS models are used to optimize the operations of the BESS on OSVs and for improvement feedbacks, which are on-going work in the OMB6 project.

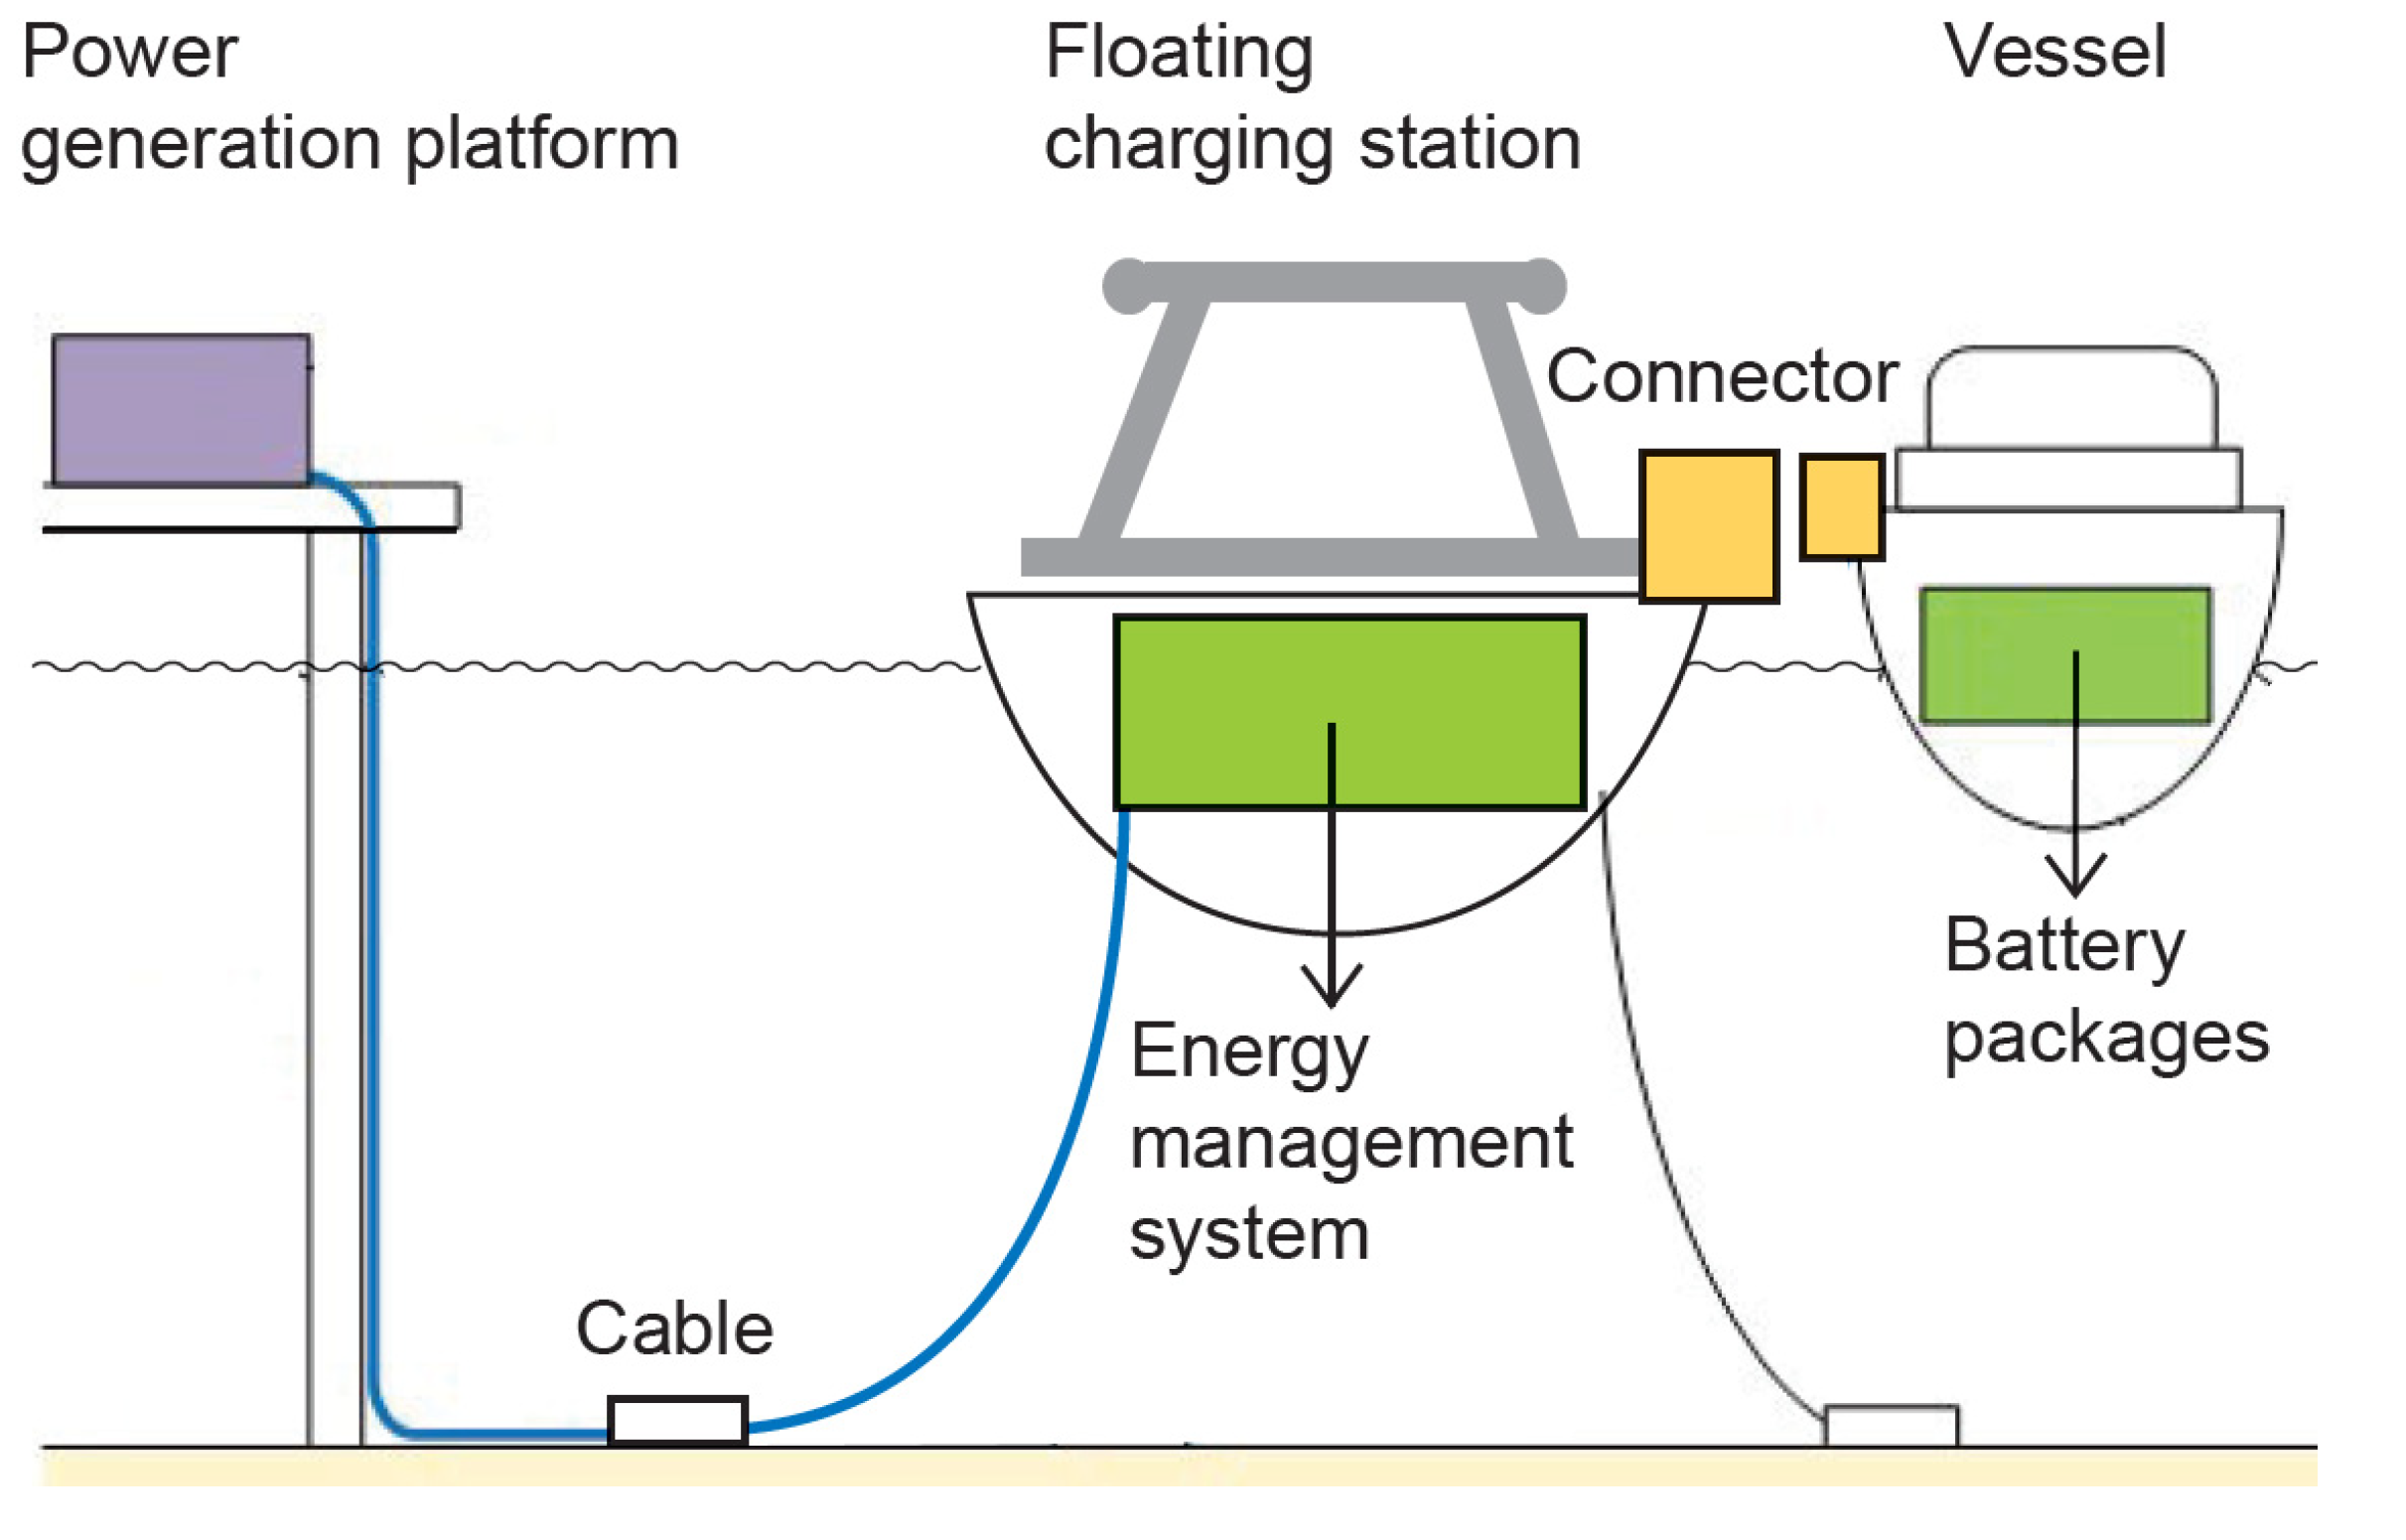
6.2. Onshore and Offshore Power Supply and Charging

This study explores new effective functions for BESSs to increase their benefits to ship owners including achieving total fuel consumption reductions in OSVs. Accordingly, battery degradation will be investigated under new operational conditions. The new functions include providing ship propulsion power during offshore trips. An OSV will often spend more than 14 h at an onshore port between two offshore trips and will be able to maximize the benefits available from using onshore green power (almost 100% Norwegian hydro power). The onshore power supply covers the vessel’s normal hotel load (e.g., approximately 250 kW at port for the selected OSV), whereas one diesel generator might normally need to remain in operation if there are no BESSs installed on the vessel. In order to fully use green power at port, the battery will be discharged to a minimum before it arrives at port and will be charged back up to a maximum at port. With a fully charged BESS, spinning reserve is also available to prevent an electricity trip on the vessel (e.g., starting of a large electric motor).
Significant benefits could also be available from future provision of offshore stations supplying green power including charging (e.g., from offshore wind farms). Figure 9 shows that the loads required during stand-by or DP at offshore sites are much higher than the loads at port. Figure 14 shows a concept for an offshore green power supply/charging station, and more information is given in [10].

6.3. Dealing with the Increasing Safety Requirements for Operation of BESSs on Vessels

There is an increasingly demanding set of safety requirements for installing and operating BESSs onboard all types of vessels. Work is required to document the experiences learnt whilst preparing for newer safety requirements, including extending BESS integration onboard to both green power supplying and charging infrastructure at ports and preparing for unexpected new risks (such as cyber-attacks). This study recommends the continual update of safety training programs to build up the long-term skills needed by the crew to follow/support the safe electrification of ships.

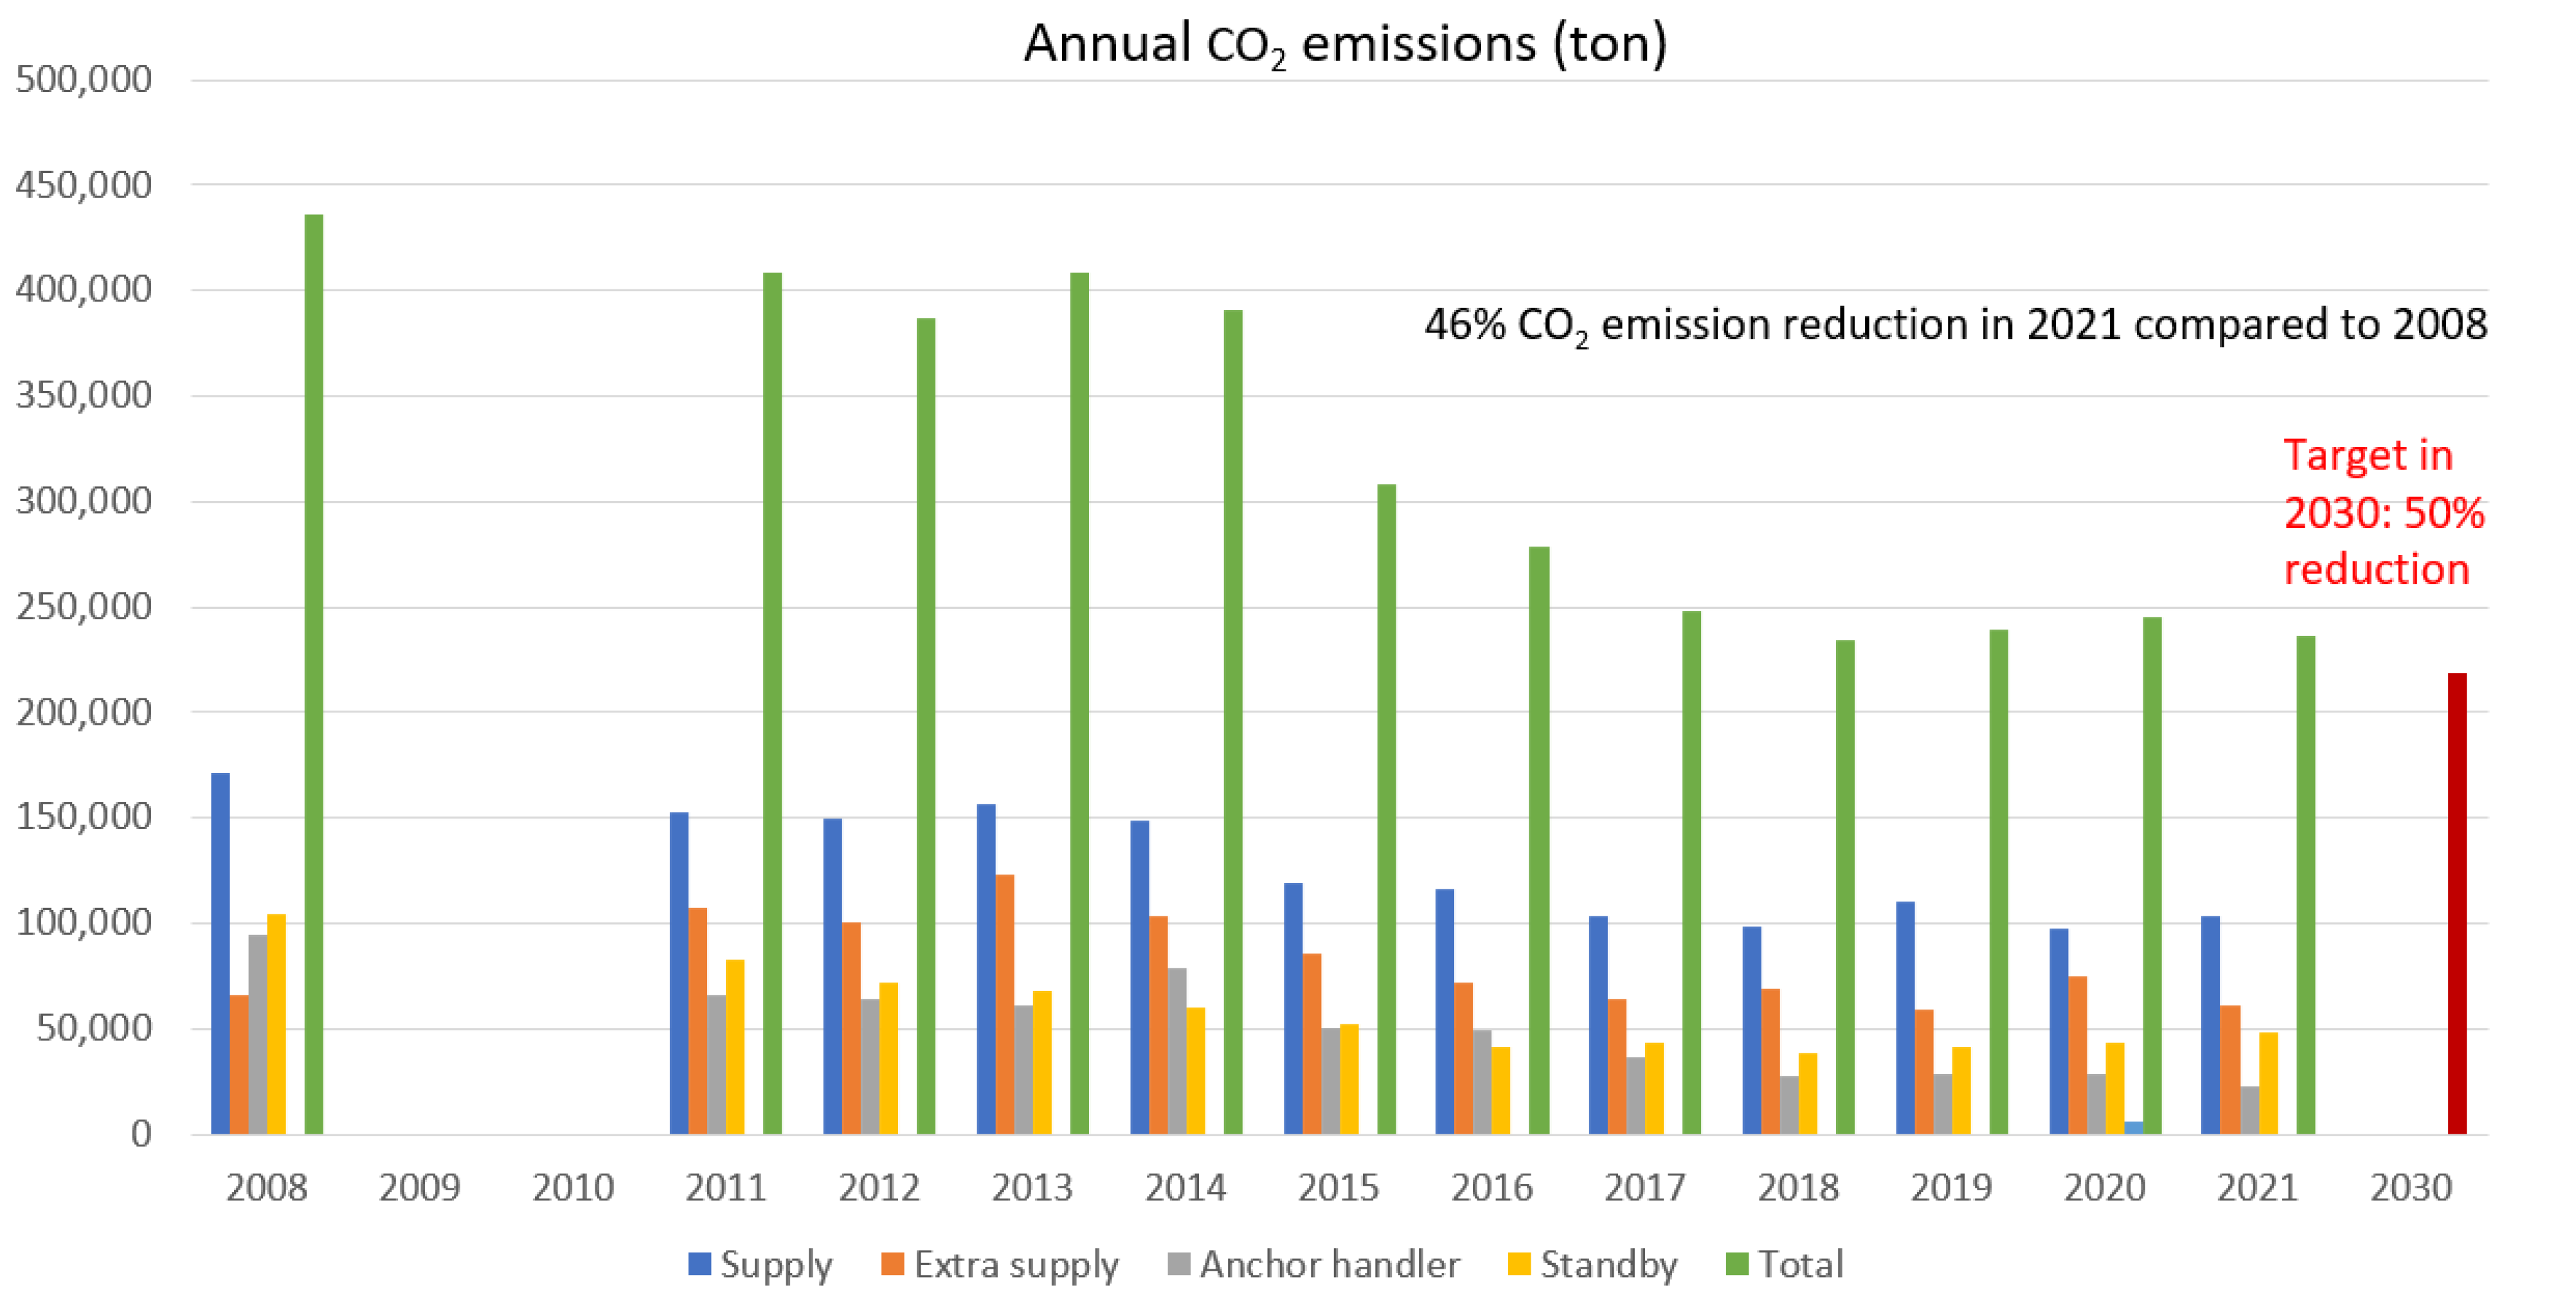
6.4. Towards Further CO2 Emission Reductions

To achieve further CO2 emission reductions, new operational strategies are required to unlock the potential for using larger capacity BESSs or more individual units of BESS on hybrid OSVs. One plan is to install a new BESS unit of 1 MWh. This study will continue to optimize the operations of BESSs and to evaluate the combinations among BESSs along with the use of alternative fuel solutions.

7. Four Acceleration Scenarios

The installation of the same BESS on the same type of vessel, the operational results achieved can vary depending on the skills of individual ship operators. Furthermore, there are large disparities in the level of BESS applications found in waterborne transport in different industrial sectors or from different regions globally. Two examples are: (i) although a significant number of commercially operating OSVs working for offshore oil/gas have installed BESSs to reduce emissions, the installation level of BESSs for OSVs working on OWFs is much lower; and (ii) a significant number of ferries in Scandinavian countries have installed MW-scale BESSs on both hybrid and fully electric vessels, but the degree of electrification of ferries in southern Europe is much less developed. Low-hanging fruits can be harvested by technical and operational transferability among similar vessels and across sectors/regions globally. There is also need for technology advancement to achieve further emission reductions. Accordingly, four acceleration scenarios are established in Table 3 to enhance BESS installations and optimize operational transferability among similar vessels, different vessels across sectors and across regions, and to achieve technology advancement.
The first three scenarios in Table 3 are for technical and operational transferability among similar vessels, across sectors and across regions in Europe. The digital platform development deals with not only the barriers to BESS such as policy, management and technology but the increasingly demanding safety requirements for operating BESSs onboard all types of vessels including dealing with new, unprecedented risks (such as cyber-attacks). The fourth scenario addresses technology advancement towards zero emissions. It evaluates the benefits and costs of the installation of a 2nd unit of BESS onto hybrid electric vessels, extending the BESS integration onboard to port infrastructure for onshore/offshore green power supply/charging, and evaluating the combinations among BESSs along with the use of alternative fuel solutions. This study has already been initiated and has progressed to a point of beginning to deliver the four BESS acceleration scenarios through the use of digital platforms.
The digital tools needed will be end-user oriented to enhance investment confidence and to optimize the transferal of the operational results of fuel-saving technology across-sectors/regions. The developed digital platforms comprise three dimensions: (i) tools dealing with technologies from the fuel-saving technology portfolio (e.g., battery, fuel cells and their combinations), (ii) tools dealing with systems integration onto the vessels (e.g., diesel–battery hybrid systems, and ship simulator), and (iii) systems integration with ports. An interface software package completes this integration. The concept is illustrated in Figure 15. The auxiliary tools include policy tools (e.g., regulations and social acceptance), economic analysis tools (e.g., cost–benefit analysis), and risk management (fire and cyber security).

8. Conclusions

This industry-driven study has firstly reviewed practical BESS installations and operations on vessels to help close the gaps between BESS initiatives and actual integration results on vessels, ultimately increasing the benefits for ship owners. Secondly, this study has investigated BESS installations on vessels, many of which employ many custom designs. Installation of one 630 kWh BESS and its operations on a commercially operating hybrid OSV were used as an example. The total installation cost was 3.4 M€ (5397 €/kWh), which was 10 times the price of equivalent battery systems for EV in the automotive sector in 2018. The standardization of interfaces, including mechanical, thermal, electrical grid and communications, between BESSs and vessels, is urgently required to reduce installation costs and increase safety. A 630 kWh BESS was used for spinning reserve and peak shaving, but the yearly operational results show that this BESS had very shallow cycles and low equivalent full cycle numbers (total 80 full cycles versus the specification of 480 yearly)—it was under-used from an energy perspective.
Thirdly, the development of new, integrated DBS models consists of (1) learning from large operational data, (2) balancing BESS degradation and (3) fully utilizing the benefits from onshore/offshore green power supply/charging, and (4) interactions with the operations of commercially operating vessels. R&D of BESSs should also deal with the increasing safety requirements and meet challenges towards further CO2 emission reductions. Finally, four proposed BESS acceleration scenarios facilitate the technical and operational transferability among similar vessels, across sectors and across regions, and to pursue technological advancement through the utilization of digitalization. The suggested digital platforms will be end-user oriented to enhance ship owners’ investment confidence. We hope that this study will motivate further collaborative effort among research and industrial partners to unlock the benefits from BESSs to accelerate the electrification of the shipping sector.

Author Contributions

Concepts and writing, W.H.; operational data analysis and writing, O.M.; OSV installations and operations, A.R.; learning from 500 BESS operations, L.O.V.; industrial approaches for CO2 emission reduction, H.S.; BESS degradation, P.J.S.V.; paper review and improvements, A.H. All authors have read and agreed to the published version of the manuscript.

Funding

This study has received funding from the Norwegian Research Council, Project OMB6, nr. 321559.

Acknowledgments

All authors thank David Hovey at University of Oxford for his detailed reviewing of this article and his high-value improvement suggestions.

Conflicts of Interest

All authors declare no conflict of interest.

Disclaimer

This paper presents BESSs on vessels study for OMB6 project and does not represent in any way author’s company strategies or views of BESS development.

References

  1. International Maritime Organization (imo.org). Available online: https://www.imo.org/en (accessed on 16 April 2022).
  2. DNV. Available online: https://www.dnv.com/expert-story/maritime-impact/Batteries-gain-momentum-in-themaritime-sector.html (accessed on 6 August 2021).
  3. Boveri, A.P.; Silvestro, F.; Molinas, M.; Skjong, E. Optimal Sizing of Energy Storage Systems for Shipboard Applications. IEEE Trans. Energy Convers. 2018, 34, 801–811. [Google Scholar] [CrossRef] [Green Version]
  4. Optimizing Marine Battery Operations Using 6 Years’ Operational Data from Two Commercially Operating Vessels. Available online: https://www.sintef.no/en/projects/2021/omb6-optimizing-marine-battery-operations/ (accessed on 16 May 2022).
  5. Failure Mode and Effects Analysis for Classification, Havyard, Document: 12009.408.910.00 FMEA, DNV. ID: D31005. Available online: https://ww2.eagle.org/content/dam/eagle/rules-and-guides/current/design_and_analysis/215_fmea/FMEA_GN_e-Mar18.pdf (accessed on 4 April 2018).
  6. European Battery Alliance, Internal Market, Industry, Entrepreneurship and SME. Available online: https://ec.europa.eu/growth/industry/policy/european-battery-alliance_en (accessed on 17 May 2022).
  7. Ioannis, T.; Dalius, T. Li-Ion Batteries for Mobility and Stationary Storage Applications-Scenarios for Costs and Market Growth; EUR 29440 EN; Publications Office of the European Union: Luxembourg, 2018. [Google Scholar]
  8. Mo, O.; Guidi, G. Optimized use of Energy Charged from Shore in Plug-in Hybrid Marine Vessels. J. Physics Conf. Ser. 2019, 1357, 012023. [Google Scholar] [CrossRef] [Green Version]
  9. Mo, O.; Guidi, G. Design of Minimum Fuel Consumption Energy Management Strategy for Hybrid Marine Vessels with Multiple Diesel Engine Generators and Energy Storage. In Proceedings of the 2018 IEEE Transportation Electrification Conference and Expo (ITEC), Long Beach, CA, USA, 13–15 June 2018; pp. 537–544. [Google Scholar]
  10. He, W.; Byklum, E. MDemo (Two Offshore Multi-Use Pilot Demonstrators), Submitted on 23 January 2019 under EU H2020 “Blue Growth H2020-BG-2018-2020, BG-05-2019: Multi-Use of the Marine Space, Offshore and Near-Shore: Pilot Demonstrators”. 2019. Available online: https://ec.europa.eu/info/funding-tenders/opportunities/portal/screen/opportunities/topic-details/bg-05-2019 (accessed on 20 May 2022).
Figure 1. Annual CO2 emission results from Equinor’s contracted vessels from 2008 to 2021.
Energies 15 04908 g001
Figure 2. Equinor’s practical CO2 emissions reduction approaches.
Energies 15 04908 g002
Figure 3. The installation of one unit of a 630 kWh BESS on a OSV in March 2018.
Energies 15 04908 g003
Figure 4. The major costs percentage of installing 630 kWh BESS on one OSV.
Energies 15 04908 g004
Figure 5. Simplified one-line diagram of the vessel power system on an OSV.
Energies 15 04908 g005
Figure 6. 11-month’s operational data from a diesel–battery hybrid system on an OSV. Sum kW power from DG and battery kW power to OSV onboard power grid.
Energies 15 04908 g006
Figure 7. One week of operation: (a) sum kW power from DG and (b) battery power to grid.
Energies 15 04908 g007
Figure 8. Comparison of energy flow in one week (a) in MWh (b) and percent.
Energies 15 04908 g008
Figure 9. The probability distribution for the time elapsed at a given total level of power production (kW) for the OSV for 11 months, for time elapsed in (a) port, (b) transit, (c) standby and (d) dynamic positioning. The probability distribution all operations are shown in (e).
Energies 15 04908 g009
Figure 10. Time spent (a), and total average and peak power delivered by the DG engines (b), by operation mode (one week).
Energies 15 04908 g010
Figure 11. The probability distribution for the time elapsed at a given loading (kW) of the diesel generator units for the 11 months elapsed in (a) port, (b) transit, (c) standby and (d) dynamic positioning. The probability distribution all operations are shown in (e). The probability distributions are all normalized per mode. such that the sum of probabilities in each plot is 1.
Energies 15 04908 g011
Figure 12. The probability distribution (a) and the cumulative distribution (b) of the time the engines were running at different specific fuel consumption (tons/kWh) during 11-month’s operation and the probability distribution (c) and the cumulative distribution (d) of the time with different fuel (theoretical) saving potential (tons/hour).
Energies 15 04908 g012
Figure 13. Integrated BESS optimal operation model.
Energies 15 04908 g013
Figure 14. Illustration of floating charging station.
Energies 15 04908 g014
Figure 15. The concept of the digital platforms.
Energies 15 04908 g015
Table 1. Reported and estimated O&M, fuel and emission reductions per vessel type.
Car Ferry
Fully Electric
Passenger Ferry
Hybrid
Fishing Vessel
Hybrid
OSVs
Hybrid
Operation and maintenance cost reductions80%35–50%50–75%35–55%
Fuel saving100%15–40%20–25%20–60%
CO2 emission reductions95%15–40%20–25%20–60%
NOx emission reductions95%30–60%30–40%30–60%
Table 2. The six major costs of retrofitting a 630 kWh BESS on an OSV.
Major AspectsDescriptionTimeCosts
Installation plansDevelopment of safe and cost-efficient installation plans (CBA study and contracting BESS supplier, booking shipyard and OSV retrofitting plans, arranging contracts, etc.)1 or 2 yearsTwo persons for half year
0.1 M€ (3%)
Preparations at shipyardBooking shipyard for retrofitting OSVSeveral months0.1 M€ (3%)
Preparations on OSVPreparing BESS interactions (including mechanical, thermal, electrical grid and communications)Several months0.2 M€ (6%)
Delivery of a 630 kWh containerized BESSBattery pack production, system integration and containerized BESSSeveral months1 M€ (29%)
Installation and commissioningExecution of retrofit of BESS on OSVOne month1 M€ (29%)
+ 0.6 M€ (18%)
in loss of OSV commercial renting income.
Tests, certifications and flag registrationsTests including FMEA and new flag registrationOne week0.4 M€ (12%)
Total costs: 3.4 M€
Table 3. Four scenarios to accelerate BESS solutions globally.
ScenariosDescription of Scenarios
1: Similar vesselsFacilitating technical and operational transferability among similar vessels including the standardization of BESS designs, certifications (and flags, safety) and documentations of crew training programs; control operational systems easy for crew.
2: Across sectorsApplying the electrification experiences of OSVs for the oil/gas industry and cruise ships to other sectors (e.g., 450 GW OWFs in Europe in 2050 and OWFs in US, promoting blue growth)
3: Across regionsTransferring the experiences gained from electrification of OSVs and ferries in Scandinavian countries to OSVs and ferries in all regions in Europe
4: Towards futureAdvancing hybrid OSVs to further lower emissions and pave the way towards zero emissions ships
Publisher’s Note: MDPI stays neutral with regard to jurisdictional claims in published maps and institutional affiliations.

