Article

Transient Stability Analysis of a Multi-Machine Power System Integrated with Renewables

1
Department of Electrical Engineering, Visvesvaraya National Institute of Technology, Nagpur 440010, India
2
Department of Power System and Control, Faculty of Electrical Engineering, Silesian University of Technology, 44-100 Gliwice, Poland
*
Author to whom correspondence should be addressed.
Energies 2022, 15(13), 4824; https://doi.org/10.3390/en15134824
Submission received: 31 May 2022 / Revised: 22 June 2022 / Accepted: 24 June 2022 / Published: 1 July 2022
(This article belongs to the Special Issue Studies on Power System Dynamics and Stability)

Abstract

:
The impact on the stability of power systems is rising as the penetration level of renewable energy with sporadic natures rises rapidly on the grid. However, the impact of different types of renewable energy sources (wind, solar) and their combination on system stability varies even with the same penetration level. This paper concentrates mainly on the stability analysis of multi-machine systems connected to various types of renewable energy sources. The study presents a simple and novel control technique named automatic reactive power support (ARS) for both single and combinations of renewable sources by injecting the available reactive power into the system during fault through converters to enhance system stability. The permanent magnet synchronous generator (PMSG) and doubly fed induction generator (DFIG) are both considered as wind generators in this paper for comparison. In addition, transient stability enhancement is carried out by improving critical clearing time of a three-phase fault in the power system. With the creation of a 3-phase fault at various buses, stability analysis is carried out on the 9-bus WSCC test bus system and also on the 68-bus IEEE test system. Comparative analysis of six test case conditions is provided and the considered cases are without renewable source, with DFIG as a wind generator, PMSG as a wind generator, solar PV farm, wind farm with DFIG and solar PV in combination and the combination of wind farm with PMSG and solar PV. Moreover, the improvement in critical clearing time of the system is compared using conventional and proposed controls with all the aforementioned renewable sources. Comparative results show that the proposed control technique improves system stability and also that the combination of renewable energy sources ought to enhance the critical clearing time of system.

1. Introduction

The integration of non-conventional energy sources, specifically solar PV power and wind power generation sources, with the grid has risen drastically in the past decade [1]. As advanced power electronics develop, solar and wind energy become the most attractive and promising types of renewable energy sources [2,3]. However, the challenges, such as the impact of a high penetration level of renewable energy sources (RES), and their possible solutions are focused and addressed in the literature [4,5].
In [6], studies were conducted to provide electric energy to a local community with 100 households and a health center by using a wind–solar hybrid power generation system in Ethiopia. The effect of partial shading in the PV module is investigated in [7,8,9]. The benefits and drawbacks of various maximum power point tracking (MPPT) strategies in solar PVs and their importance is explained in [10,11,12] to assure maximum power is delivered to the system. However, the difficulties in the control techniques of MPPT with proportional-integral-derivative controllers are minimized by using the model predictive control [13] and the sliding mode control [14]. The workings of wind energy systems with an implementation of MPPT are investigated in [15,16,17,18,19]. Studies of different types of wind generators are carried out in [20,21,22,23]. The impact of grid-integrated wind farms, with a DFIG as wind generator, on the transient stability of power systems is investigated in [24,25]. Stability analysis of grid-integrated solar PV systems is seen in [26,27,28]. The decoupled control approach is a well-adapted control method which allows for controlling real and reactive power independently and is considered in [27]. To enhance stability, the grid-side converter (GSC) behaves as a STATCOM while the DFIG operates at a constant speed during the fault. Solar system inverters can be configured to regulate renewable power generation in response to changes in system frequency and voltage [28].
Recently, studies have been more intense regarding the integration of combinations of renewable sources which ensure the optimum utilization of resources and hence improve overall efficiency as compared to single modes of operation. The hybridization of solar and wind systems exploits the advantages of both while at the same time easing limitations. The power generated by the hybrid renewables can be extracted more efficiently by implementing new technologies in power electronics. The implementation and working of hybrid systems of wind and solar energy, their advantages and disadvantages. and different topologies of hybridization are explained in [29], and the power system equivalents for dynamic and transient studies are created and analyzed in [30]. The effect on transient stability with hybrid models of hydro power, solar, and wind power injected to a single machine connected to an infinite bus system is investigated in [31]. The improvement of system stability connected to hybrid renewable sources with arbitrary amounts of reactive power support is mentioned in [32].
The main aim of the proposed research work is introducing a simple, new technique to improve multi-machine system (MMS) transient stability coupled with both individual and combinations of renewable sources. The concern about system stability is increasing as the share of renewable energy injection with variable power natures is expanding. Objectives of the present work are as follows:
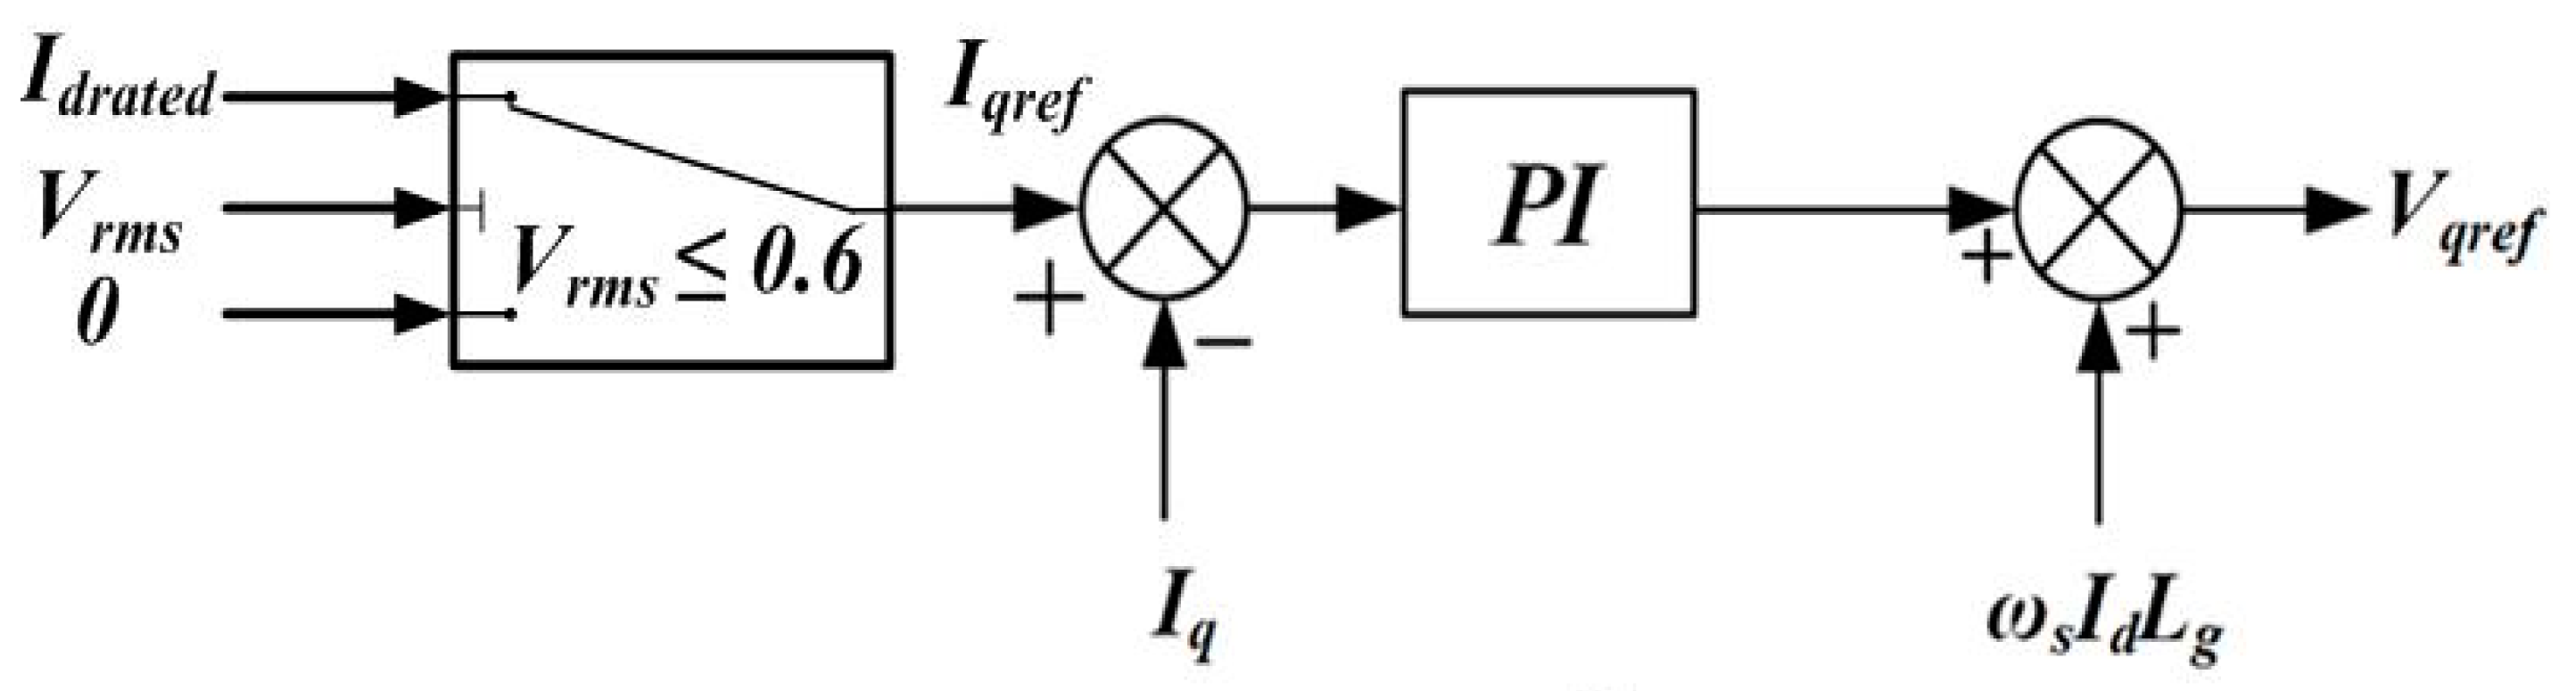
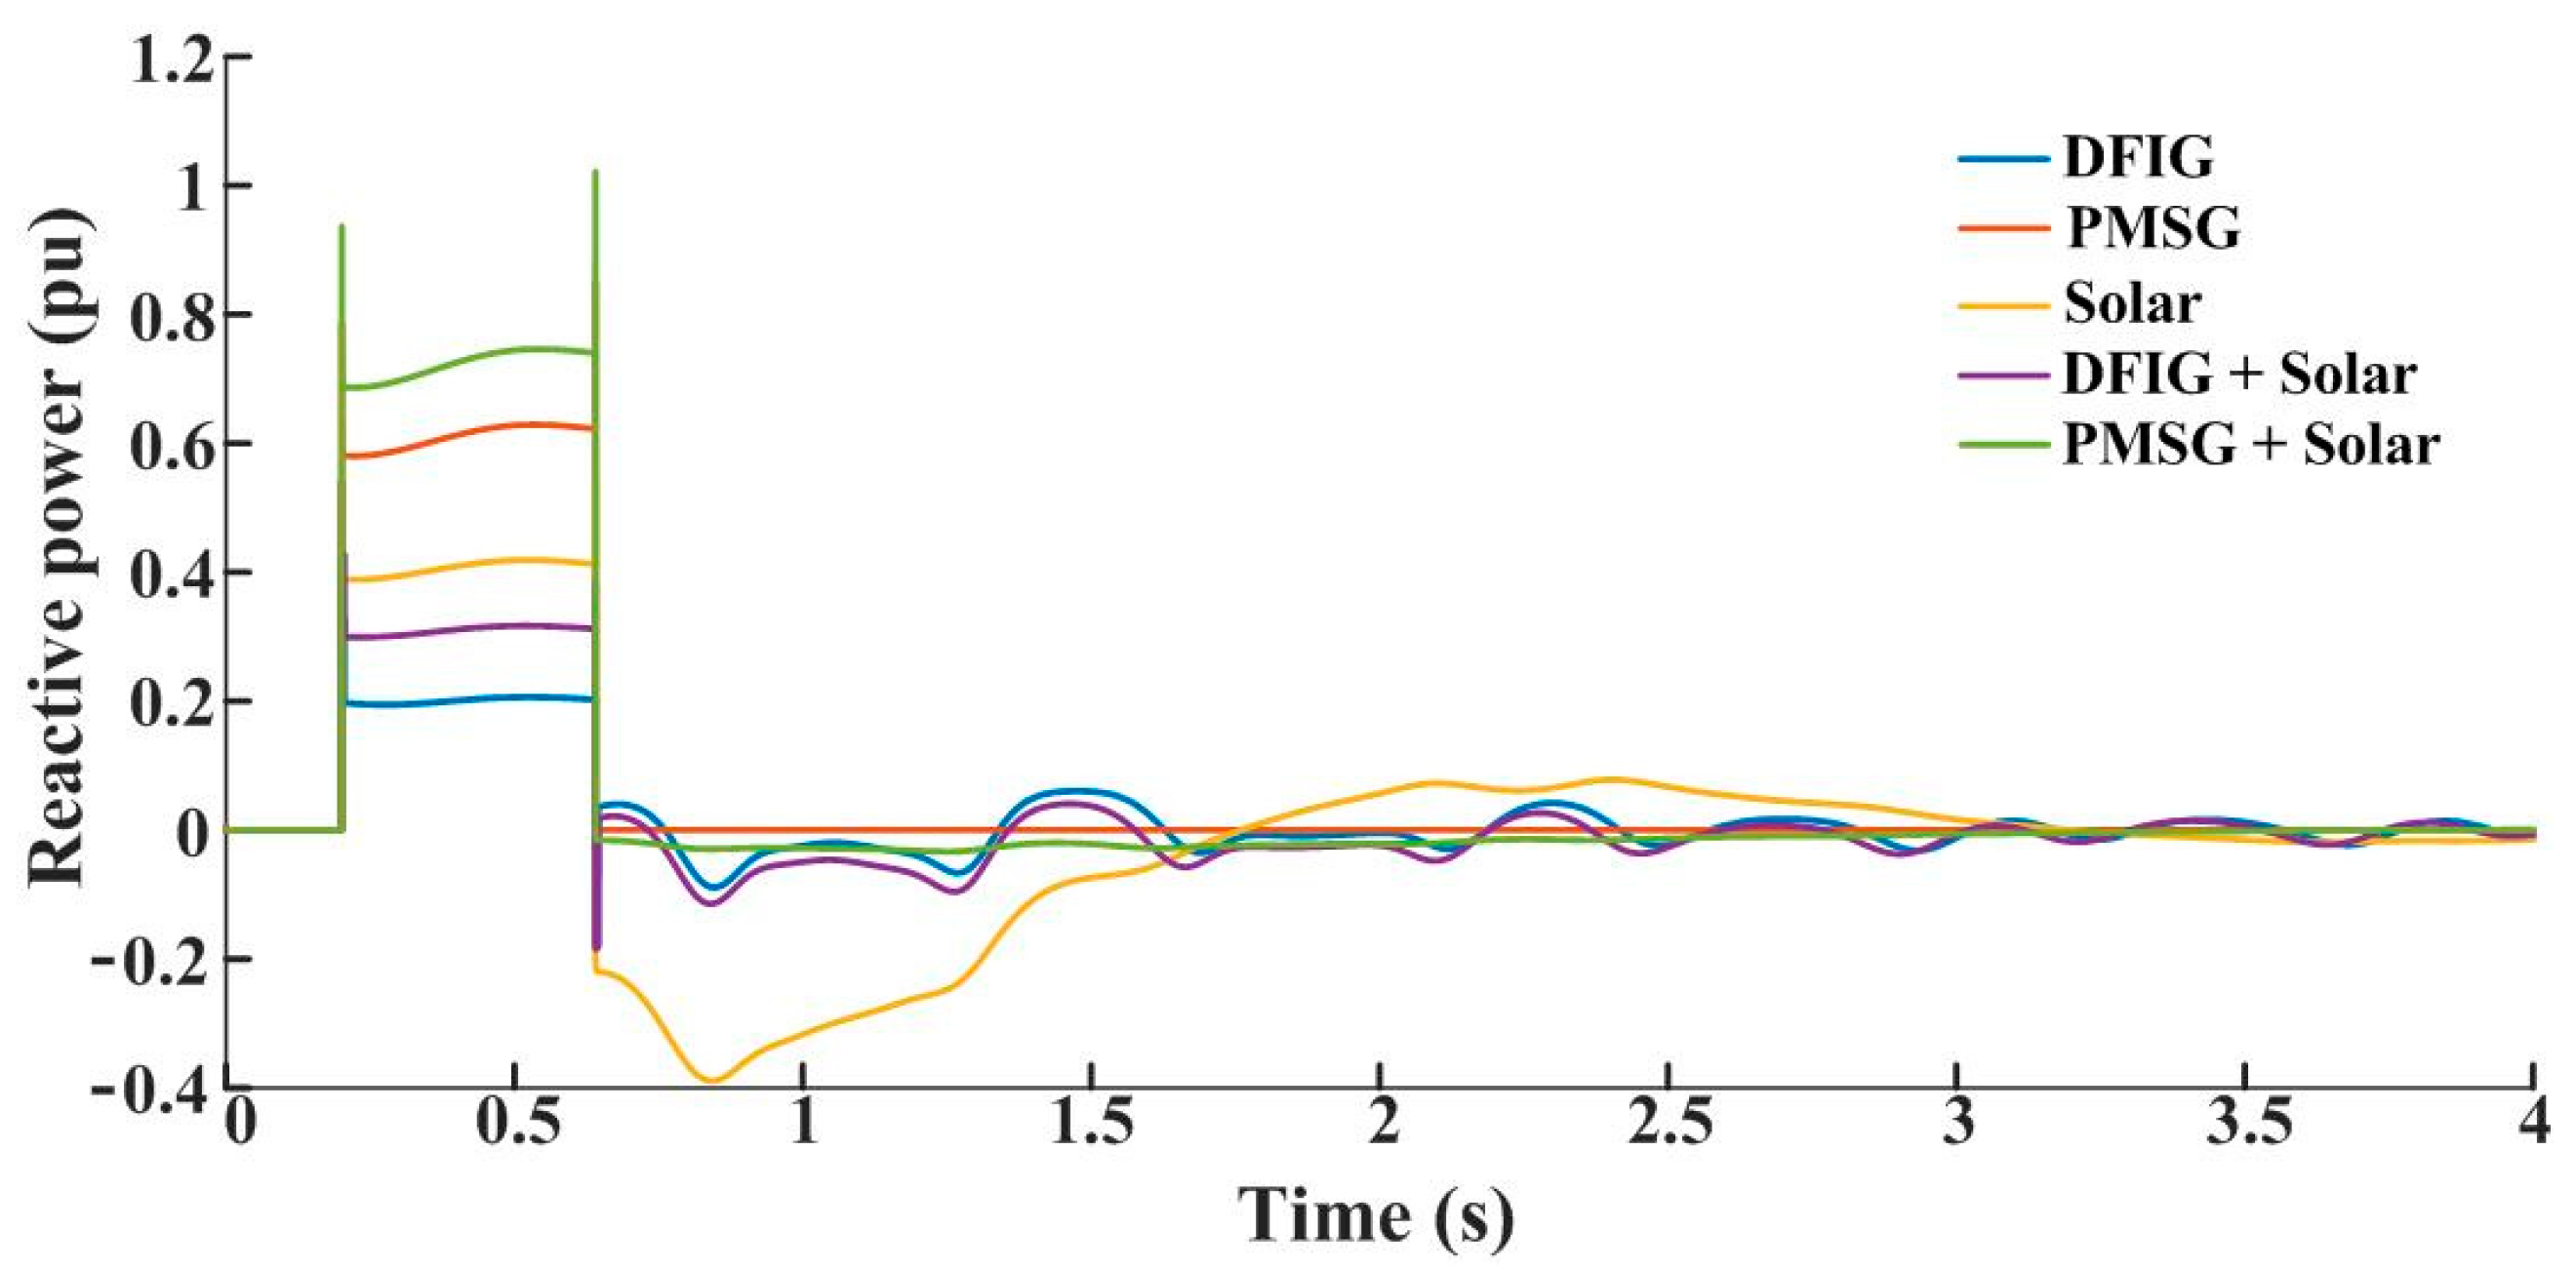
  • Modifying the controllers of the converters such that all RES connected to the system will be injecting the maximum available reactive power into the grid during faults. Normally, the converters are configured to inject only real power into the grid (with unity power factor). The injection of reactive power during faults improves the bus voltage profile and hence enhances the overall stability of system.
  • Performing a comparative analysis of critical clearing time for a MMS coupled with different renewable sources.
The proposed controller’s performance is validated with an individual RES and as well as hybrid renewables along with different fault locations at different fault instants. The study is performed on a WSCC 9-bus system and also IEEE 68-bus system.
The rest of the article is organised as follows. Section 2 presents the mathematical modelling of a complete power system including the RES. Both the existing control techniques and the proposed control techniques used in the RES are explained in Section 3. Section 4 is carried out with analysis of system results followed by the conclusion in Section 5.

2. Mathematical Model of the System

Modelling of power system components, such as synchronous machines, a power system network, solar PVs, DFIGs, and PMSGs, along with the turbine, rotating mass, and also the integration of these RES to the power system network are presented in this section.

2.1. Modelling of the Multi-Machine System

The synchronous machine model considered for study is the flux decay model with a static exciter. As the time constant of the speed governor system (electro-mechanical phenomena) is in the order of seconds and the time constant of machine dynamics (electro-magnetic phenomena) followed by sudden disturbance is in the range of milliseconds to a second [33], the dynamics of the speed governor are neglected. The machine equations (for n machine systems with i = 1 through n) including a static exciter with one time constant and one gain can be summarized as [24,34]
d δ i d t = ω s Δ ω i
2 H i d Δ ω i d t = P m i P e i K D i Δ ω i
T d o i d E q i d t = x d i x d i E q i + ( x d i x d i 1 ) V i cos ( δ i θ i ) + E f d i
T A i d E f d i d t = E f d i + ( V r e f i V i ) K A i
where δ represents the rotor angle, ωs and Δωi are the synchronous speed and deviation in rotor speed (per unit), respectively, KD is damping coefficient, H represents the inertia constant, Pe and Pm are the output electrical power and input mechanical power, respectively, the q-axis and d-axis components of synchronous reactance are represented by xq and xd, respectively, xq and xd are the q-axis and d-axis components of transient reactance, Eqi is the q-axis component of voltages behind the transient reactance of the ith generator, Tdoi is the d-axis open circuit time constant, TA and KA are the time constant and gain of the exciter, Efd represents the exciter voltage, V is the per unit terminal voltage of the machine, and angle is represented by θ.

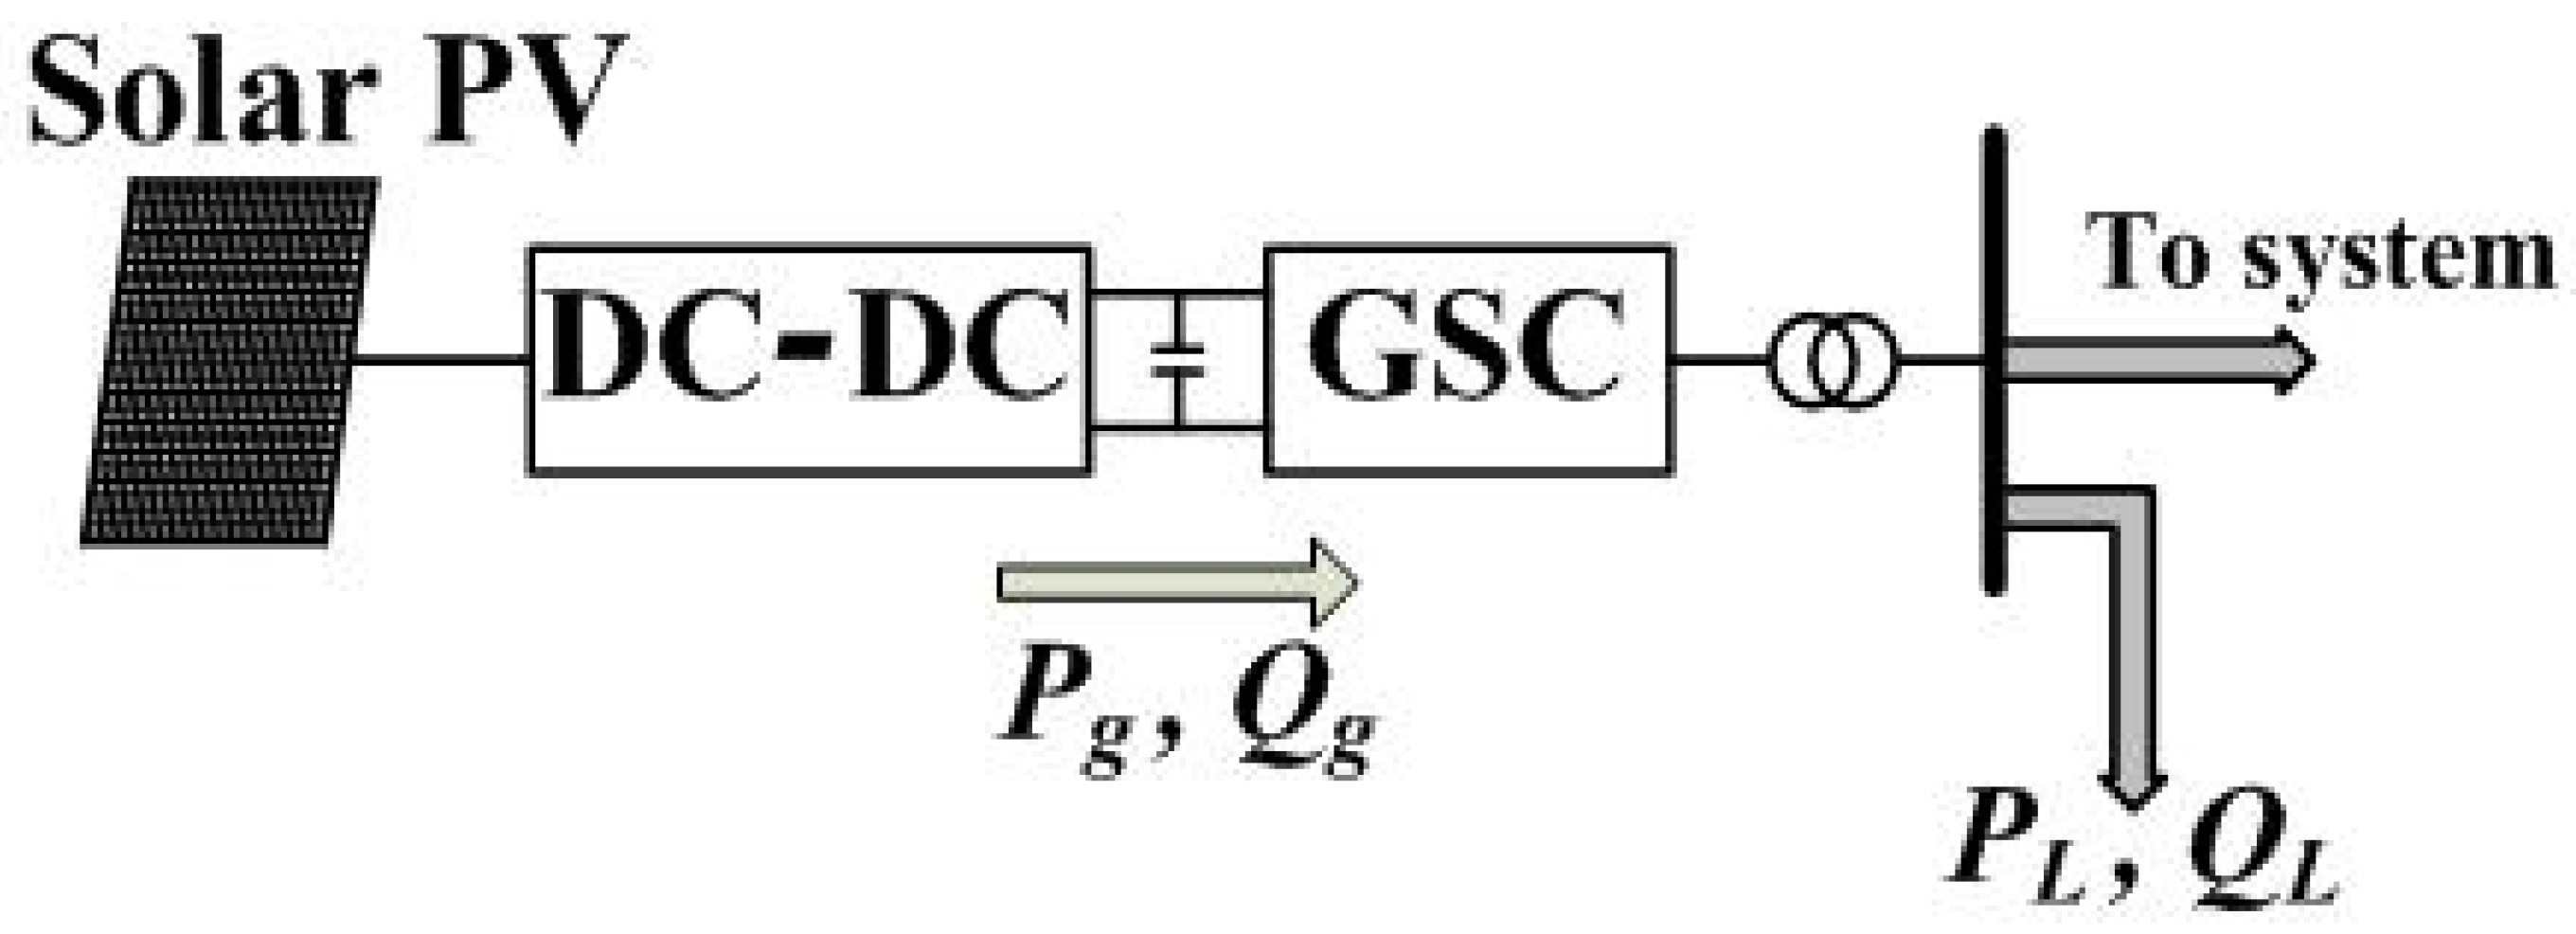
2.2. Modelling of Solar PV

Photovoltaic (PV) cells are used to convert solar energy into electricity through a photoelectric effect. An ideal representation of a PV cell is a current source in parallel with a diode. However, two resistors, one in series and the other in parallel, are also included in practice. Here, series resistors serve as internal resistance to current source and shunt resistors include the leakage current.
The equation to describe characteristics I-V of a PV cell is given as [7]:
I = I L I D [ exp [ q ( V + I R s ) α K T ] 1 ] ( V + I R s ) R S H ,
where IL and ID are photocurrent and reverse saturation current of diode, respectively. K denotes Boltzmann’s constant, T is the temperature, ‘α’ is the diode ideality factor, and ‘q’ represents charge of electron. RSH and RS represent the equivalent shunt and series resistance of the PV cell. A connection diagram of a solar PV farm to the grid is shown in Figure 1. The power generated by the solar PV is injected to the grid through a boost converter, voltage source converter (VSC) filter, and transformer. Equations of solar PVs are modelled assuming that power generated is always maximum.

2.3. Modelling of Turbine and Rotating Mass

The wind farm contains turbines and generators which have rotating masses, unlike the solar PV farm. These turbines and rotating masses have their own dynamics and the same are modelled in this section. A two-mass model representation is used to model both the wind generator and the wind turbine. The equations are as follows [24,35].
d ω r d t = 1 2 H g [ k s h θ t w + C s h ω b a s e ( ω t ω r ) T e ] ,
d θ t w d t = ω b a s e ( ω t ω r ) ,
d ω t d t = 1 2 H t [ T m k s h θ t w C s h ω b a s e ( ω t ω r ) ] .
Here, ωt and ωr are the mechanical speed of the turbine and rotor, respectively, Hg and Ht are the generator and the turbine inertia, respectively, θtw represents the torsional angle of shaft, and Csh and ksh are the damping coefficient and shaft stiffness, respectively. Tm and Te are the mechanical and electrical torque, respectively.

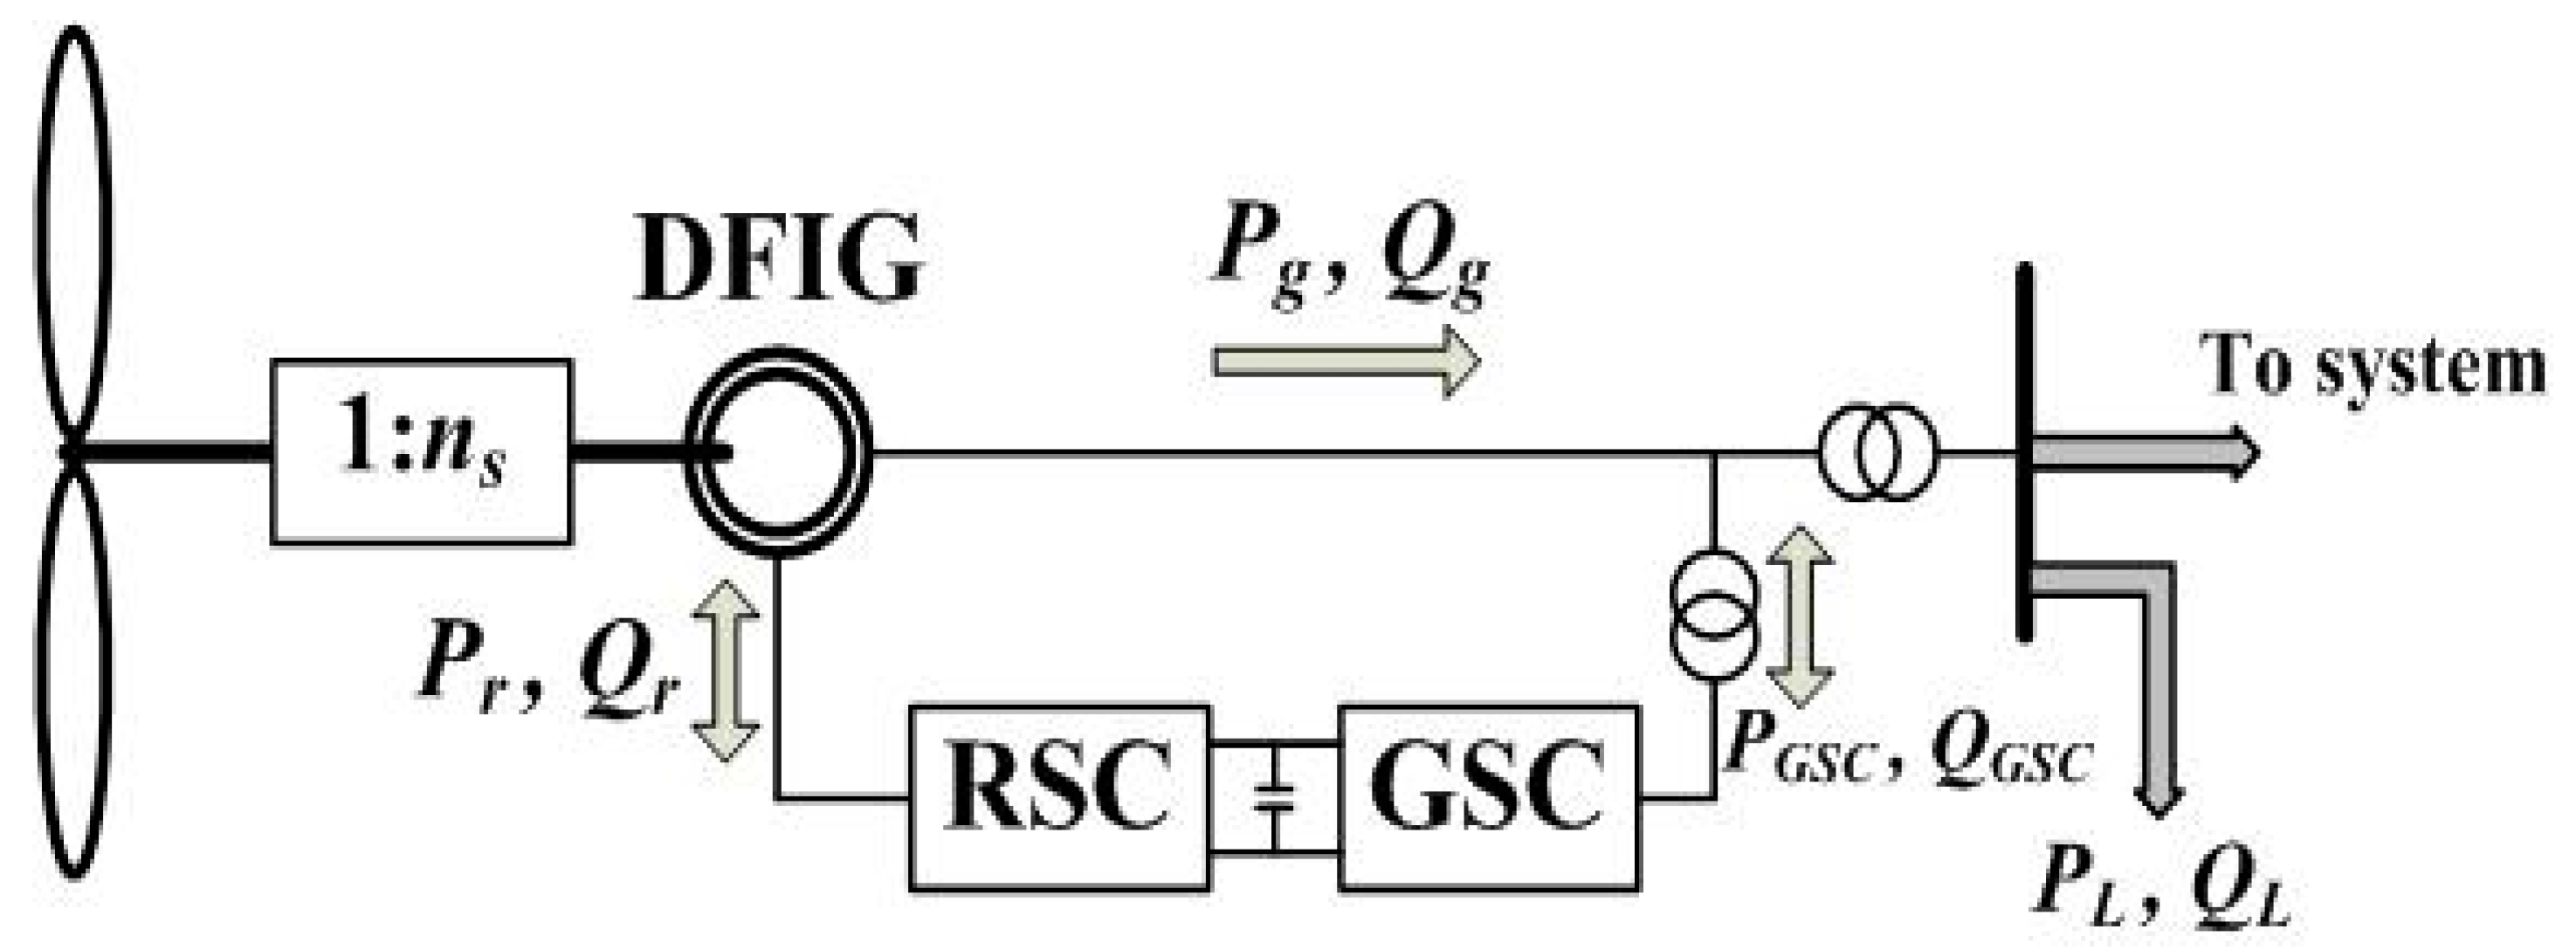
2.4. Modelling of the DFIG

The connection diagram of a wind farm with a DFIG is shown in Figure 2. The DFIG is connected to the system through a transformer, and the rotor of the DFIG is also connected to the system through a back-to-back converter. The total power injected into the grid is the algebraic sum of powers delivered from the DFIG and the grid-side converter (GSC). The mathematical model of the DFIG [24] is represented in state space form with dq representation and the following are the equations.
X = A X + B U
where
X = [ i d s , i q s , e d , e q ] t
U = [ v d s , v q s , v d r , v q r ] t
A = [ ω e B L r r L s s L r r L m 2 ( R s + R r L m 2 L r r 2 ) ω e B L r r L s s L r r L m 2 ( L s s L m 2 L r r ) ω e B ω R L r r L s s L r r L m 2 ω e B R r L s s L r r L m 2 ω e B L r r L s s L r r L m 2 ( L s s L m 2 L r r ) ω e B L r r L s s L r r L m 2 ( R s + R r L m 2 L r r 2 ) ω e B R r L s s L r r L m 2 ω e B ω R L r r L s s L r r L m 2 0 ω e B ω s ( R r L m 2 L r r 2 ) ω e B R r L r r ω s ( ω s ω r ) ω e B ω s ( R r L m 2 L r r 2 ) 0 ω s ( ω s ω r ) ω e B R r L r r ]
B = [ 1 0 L m L r r 0 0 1 0 L m L r r 0 0 0 ω s L m L r r 0 0 ω s L m L r r 0 ]
where ‘v’ and ‘i’ are voltage and current of the machine, respectively. The suffixes ‘qs’, ‘qr’, ‘ds’, and ‘dr’ are q-axis and d-axis components of stator and rotor quantities, respectively. ‘ωeB’ is base electrical speed and ‘ωs’ is the synchronous speed. ‘L’ and ‘R’ are the inductance and resistance of the machine, respectively. The suffixes ‘ss’, ‘rr’, and ‘m’ are self and mutual components, respectively. In addition, the equivalent q-axis and d-axis source voltages behind transient reactance “eq” and “ed” are as follows
e q = ω s L m L r r ( L r r i d r + L m i d s )
e d = ω s L m L r r ( L r r i q r + L m i q s )
The electromagnetic torque is as follows
T e = 1 ω s [ e q i q s + e d i d s ] .

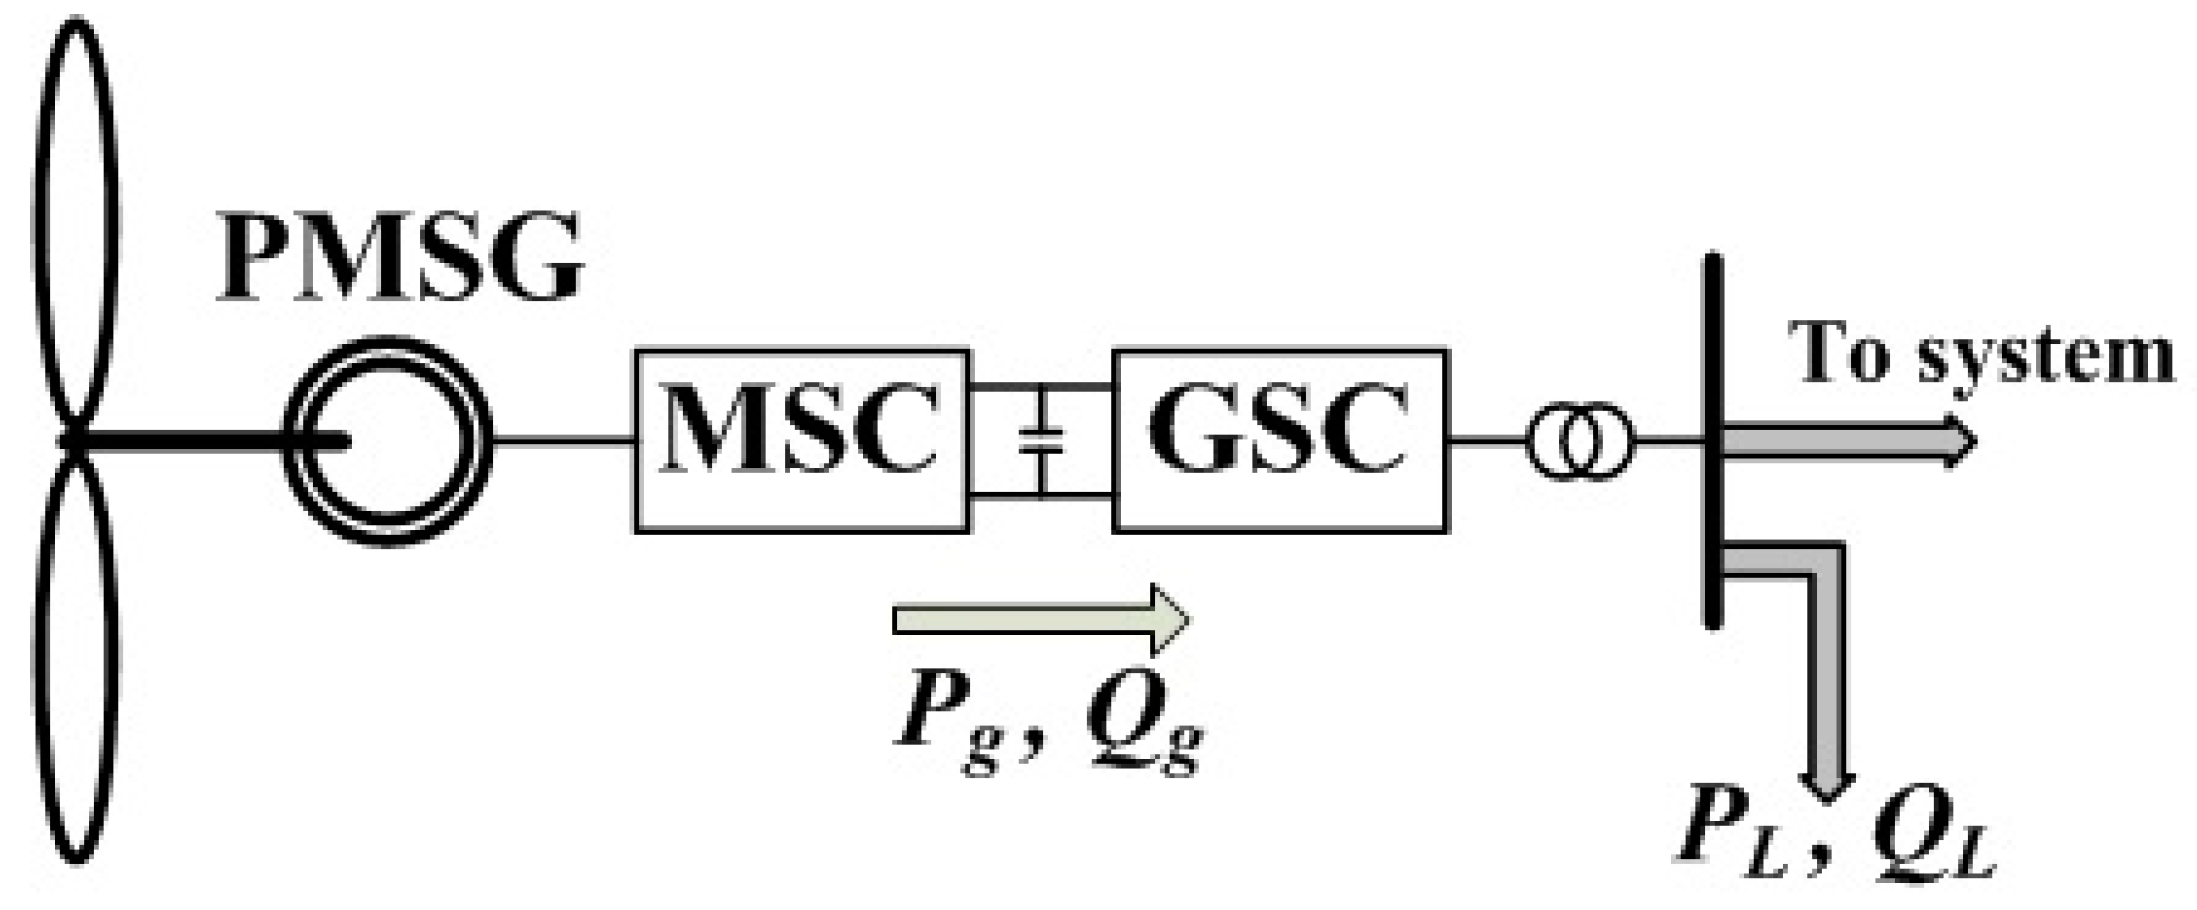
2.5. Modelling of the PMSG

The PMSG (Permanent Magnet Synchronous Generator) is mathematically modeled from the equivalent d-axis and q-axis circuit of the machine. Here, dq0-axis modelling of the PMSG is used, in which the alignment of the d-axis is along the magnet axis. The d-axis and q-axis voltage equations of the PMSG in terms of current are given by [36,37]
V d s = R s i d s + L d d i d s d t ω r o t L q i q s ,
V q s = R s i q s + L q d i q s d t + ω r o t L d i d s + ω r o t λ M ,
where Vqs, Vds, iqs, and ids are q-axis and d-axis components of stator voltages and currents, respectively. Lq and Ld are the q-axis and d-axis inductances, respectively. The stator resistance is represented by Rs, ωrot is the electrical rotor speed in rad/s, and λM represents the rotor magnetic flux produced by the permanent magnet. The connection diagram of a wind farm with a PMSG is shown in Figure 3. The PMSG is connected to the system through the back-to-back converter and the transformer.

2.6. Integration of RES with the Grid

Integration of renewable energy sources to the grid is a great task with an increased penetration level. The integration of hybrid renewables to the existing power system creates technical challenges including harmonic distortion, flicker, voltage regulation, etc. The challenges involved in the integration of RES with the grid and the advanced techniques to overcome those challenges are presented in [38,39]. The power generated by the RES is intermittent in nature and can cause stability issues grid-side. The synchronization of voltage magnitude and the frequency of RES with the grid is the most important aspect in integrating RES to the grid. The injection of power must also occur with less harmonics.

3. Controllers of Renewable Energy Sources

Various types of controllers used in wind (DFIG, PMSG) and solar PV systems are explained in this section. Controllers are a vital part of any system. Three system variables must be controlled strictly in a wind generation system. They are: (1) the optimal power generated; (2) the injected power (active and reactive) to the utility grid; and (3) the DC-link voltage. In this study, the conventional controllers are modified such that the transient stability of the system can be enhanced. Details of conventional and modified controllers are presented in this section. Controllers of all converters of RES are modelled using the dq0 reference frame.

3.1. Conventional Controllers in the DFIG

Wind farms with a DFIG basically have two converters. One is a rotor side converter (RSC), and the other is a grid-side converter (GSC). The conventional controllers used in these two converters are presented here.

3.1.1. Controllers in the Rotor Side Converter (RSC)

Orientation of the d-axis is considered along with the voltage for the RSC of a DFIG control. The expressions for electromagnetic torque and reactive power in terms of d-axis and q-axis rotor current are as follows [24]
T e = L m L s s [ λ q s i d r ] ,
Q s   = ( L m V d s L s s ) i q r ( λ q s V d s L s s ) .
The reference values of both q-axis and d-axis components of rotor currents are calculated by re-arranging (13) and (14) as follows
i d r r e f = ( L s s L m λ q s ) T e r e f   ,
i q r r e f = ( L s s L m V d s ) Q s r e f + ( λ q s L m ) .

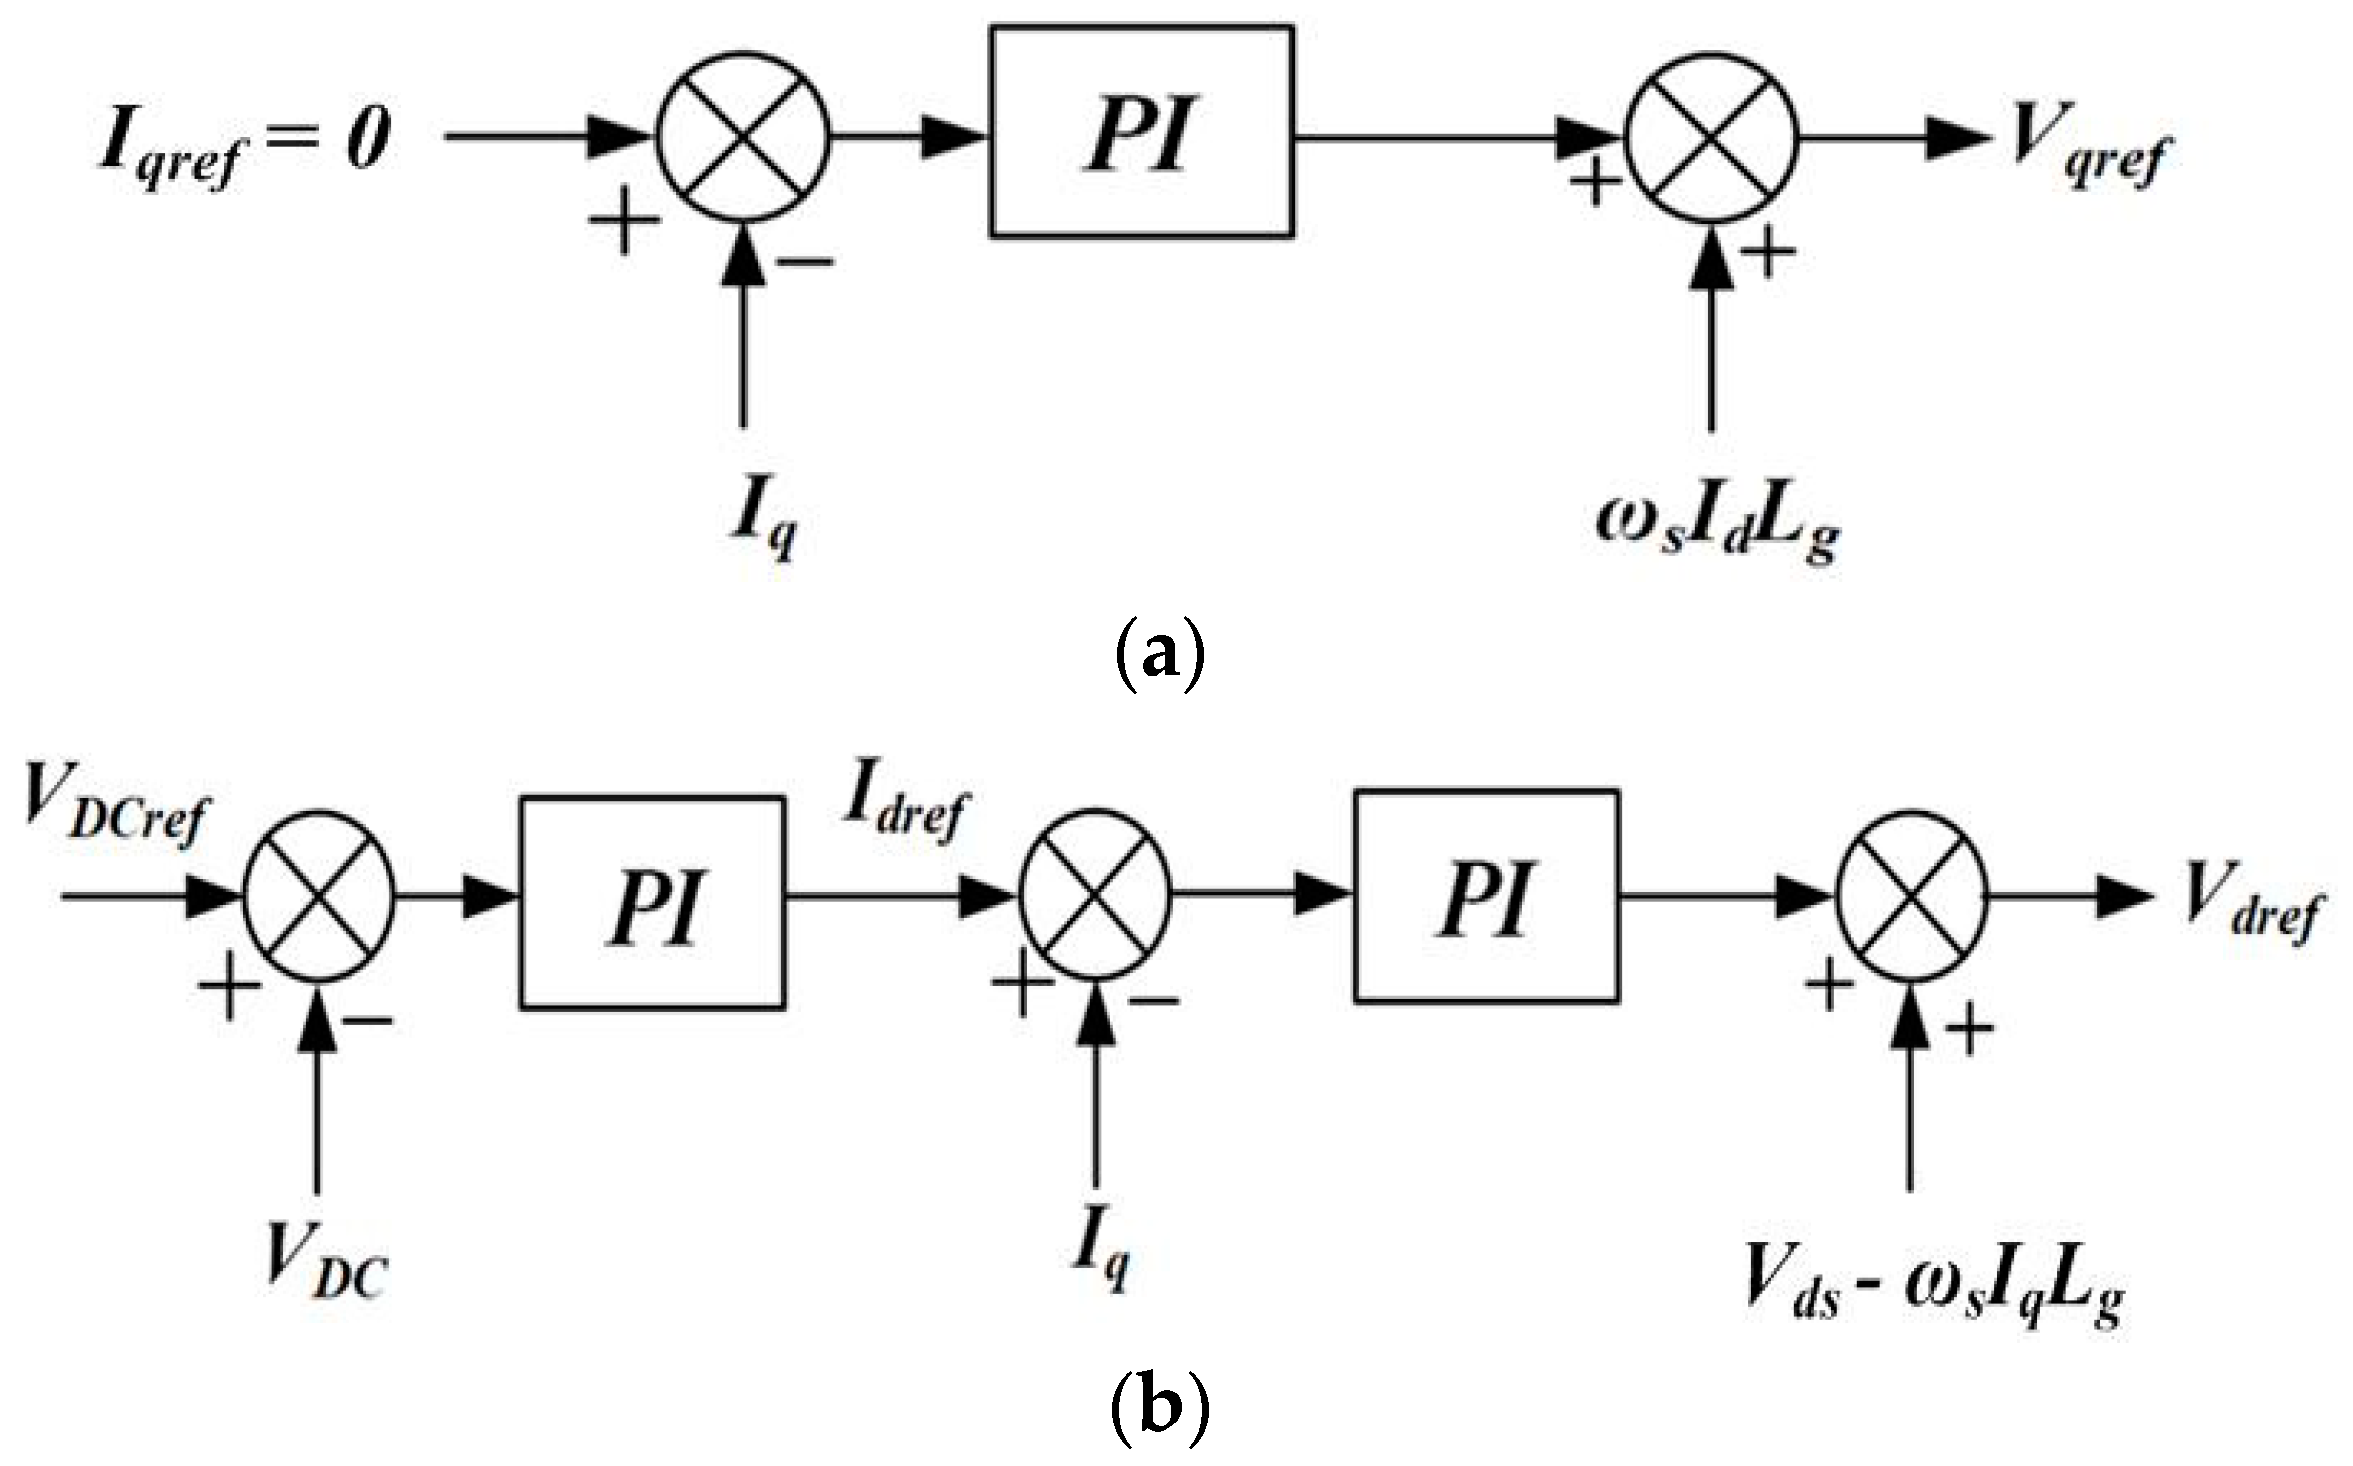
3.1.2. Controllers in the Grid-Side Converter (GSC)

The main aim of the GSC of both PMSG and DFIG controllers is to uphold the DC-link voltage at a constant level and to regulate the flow of both reactive and active power independently between the grid and the inverter. In the three-phase balanced system, the instantaneous active (P) and reactive power (Q) outputs are described by the following equations
P = 3 2 ( V d I d + V q I q ) ,
Q = 3 2 ( V q I d V d I q ) ,
where, Vq, Vd, Iq, and Id are q-axis and d-axis components of grid voltages and currents, respectively. For the easy control of P and Q, a control approach is applied based on voltage orientation. It is assumed that the alignment of the d-axis of the reference frame is aligned with the space vector of grid voltage. This makes the q-axis component of space vector for the grid voltage become zero (i.e., Vq = 0). Thus, the expression for active and reactive power of Equations (17) and (18) can be modified as follows:
P = 3 2 V d I d ,
Q = 3 2 V d I q .
From (19) and (20) we can control P and Q independently by d-axis and q-axis components of current (Id and Iq), respectively. The reference for the q-axis component of current is chosen to be zero (i.e., Iqpref = 0) in order to maintain unity power factor for the power injected into the grid. Voltage equations between the grid and inverter are as follows [24]
V d = R g I d + L g d d t I d ω s L g I q + V d s ,
V q = R g I q + L g d d t I q + ω s L g I d .
Here, Rg and Lg are the resistance and inductance of line, respectively. The conventional control block of the GSC is shown in Figure 4.

3.2. Conventional Controllers in the PMSG

Wind farms with a PMSG also have two converters. One is a machine side converter (MSC), and the other is a grid-side converter (GSC). The conventional controllers used in these two converters are presented here.

3.2.1. Controllers in the Machine Side Converter (MSC)

Extraction of maximum power is the aim of the MSC controller for the PMSG by controlling the speed of the PMSG rotor. The MPPT controller starts to operate when the speed of the wind is greater than the cut in speed, and it will stop when the wind speed surpasses the rated value. The torque (Te) equation of the permanent magnet synchronous generator is given by [37]
T e = 1.5 p 2 [ λ M i q + ( L d L q ) i d i q ] ,
where p is the number of pole pairs, λM is the magnetic flux produced by the permanent magnets in the PMSG rotor, and remaining quantities hold the same definition except that these quantities belong to the PMSG. The electromagnetic torque Te can be controlled independently by q-axis current iq alone by assuming that the d-axis current id is equal to zero. Thus, the torque expression will be simplified to
T e = 1.5 p 2 [ λ M i q ] .
It is clear from (24) that torque can be controlled solely by iq. The control structure of the MSC is derived from the voltage–current equation and torque equation as shown in Figure 5. Reference torque is calculated from optimal speed of rotation. Iqref can be calculated from reference torque which is kept to an optimum value. The error signals are generated by comparing actual currents with the reference values. Error signal through PI of the controller gives d-axis and q-axis reference rotor voltages (Vdref and Vqref). Reference phase voltages in the abc frame will be obtained by converting dq0 voltages. With the use of these signals in the abc frame and PWM, switching pulses of the MSC are then generated. Extraction of optimal wind power delivers the needed torque or power reference, which is given by
T e r e f = K o p t ω r 2   ;   if   ω r < ω r   r a t e d ,
where
K o p t = 0.5 ρ π R 5 C P m a x ω t B 2 λ o p t 3 S B
Here, ωtB and SB are the base speed and the base power of the wind turbine, respectively. CPmax is the maximum value of CP, the wind turbine’s coefficient of performance, which is obtained when pitch angle (β) = 0°; λopt is the tip speed ratio when CP = CPmax.

3.2.2. Controllers in the GSC

The GSC of the wind farm with the PMSG is the same as the wind farm with the DFIG. The control strategy, as illustrated in Figure 4, and the equations to model the controller are also the same.

3.2.3. Pitch Angle Control

If the speed of the wind exceeds its rated value, a mechanical method is used to protect the blade from being damaged by controlling blade angle. For wind speed below the rated value, the maximum power point tracking technique is implemented such that the maximum amount of power can be extracted from wind velocity. If the wind speed is very high (more than the rated velocity), the power extraction is limited by pitch angle control. This is achieved by turning the blades away from the wind.

3.3. Conventional Controllers in Solar PVs

Solar PVs and the grid are connected through back-to-back converters consisting of a DC–DC chopper circuit followed by a DC–AC voltage source converter (VSC).

3.3.1. Controllers in the DC–DC Converter

DC–DC converters mainly use the MPPT technique to transfer maximum power into the system. The MPPT controller is a completely electronics-based control system used to extract the maximum power available at the PV module. In this work it is assumed that the power injected into the grid is always the maximum.

3.3.2. Controllers in the VSC

A VSC is present next to the DC–DC chopper circuit which converts DC voltage to 3-phase AC. VSC controllers aim to maintain DC-link voltage as a constant value and to regulate the flow of reactive and active power between the grid and inverters independently. The same control strategy as in Figure 4 is implemented for the GSC. The equations to model the controller are also identical to (19)–(22). Keeping the reactive power reference to zero is also followed here such that the power injected into the grid is maintained at unity power factor.

3.4. Proposed Controllers

The integration of hybrid renewable energy sources to the grid is increasing in capacity and also affects the stability of the system. However, if the injected power (both active and reactive) is controlled tactically during a small duration of time of disturbance (such as a fault), system stability can be enhanced. Bus voltage magnitude will decrease during a fault. Injection of reactive power helps to improve the voltage profile and hence improves system stability.
Here, the controllers of the VSC in solar PVs and the GSC in both the DFIG and the PMSG are adjusted in a way so that both the RES inject maximum available reactive power throughout fault duration to achieve the enhancement in stability. This automated control of converters is termed as Automatic Reactive-power Support (ARS) in this paper. The procedure of ARS is the same for the VSC of solar PVs and the GSC of both DFIGs and PMSGs. Reactive power injected into the grid will be zero when there is no disturbance in the system. In contrast, during fault periods maximum available reactive power is injected to grid. This is achieved by changing the reference value of q-axis current to the maximum available current (i.e., Iqref = Idrated) and Idref = 0. This modification in the controller is shown in Figure 6. The first block in Figure 6 is the switch, which has three inputs and one output. The detection of faults is carried out by comparing the RMS voltage of the bus (in pu) with 0.6pu. If Vrms ≤ 0.6, then the switch gives Iqref = Idrated as output, otherwise the switch gives Iqref = 0 as output. The combined effect improves terminal voltage and hence ensures stability enhancement. The real power injected will be zero in the case of solar systems and PMSG-based wind farms since these systems are connected to the grid through back-to-back converters, whereas in the DFIG-based wind farm the real power transferred through the back-to-back converter only kept to zero to achieve the proposed modification in the controller.

4. Analysis of System Results

Two test bus systems, WSCC 9-bus and IEEE 68-bus, are considered for simulation study. In order to make the results comparable, a local additional load is connected at the same bus where the renewable source is connected such that the steady state solution of the test bus system is the same with and without a renewable source. Transient stability analysis is carried out by finding the critical clearing time (CCT) of the generators in the system following a 3-phase fault near the bus. CCT of generators is calculated and compared for both the systems with no renewable source, with a DFIG in a wind farm, a PMSG in a wind farm, a solar PV farm, and hybrid renewables (combination of wind farm with a DFIG and solar farm, as well as the combination of wind farm with a PMSG and solar farm) with both conventional and the proposed automatic reactive-power support. A total of 100 MW is considered as base power for the whole system.

4.1. WSCC 9-Bus Test System

The system under study, WSCC 9-bus, is shown in Figure 7 with renewable energy sources (RES). An additional load is also connected at bus 8. Additional load is used to nullify effects on the initial state of the system. The total power from RES injected into the system is 80 MW. However, for both the combinations of RES, it is considered that the power injected through the wind farm is 60 MW, and 20 MW power is injected through the solar PV farm so that the total injected power into the system would remain 80 MW to make the results comparable. A 3-phase fault is created at bus 5 and the rotor angle of both generators is observed. Study of the system was carried out in two steps and involved constant power injection with the assumption that wind speed and solar irradiation were constant with time, and the injection of varying power while considering that wind speed and solar irradiation changes with time.

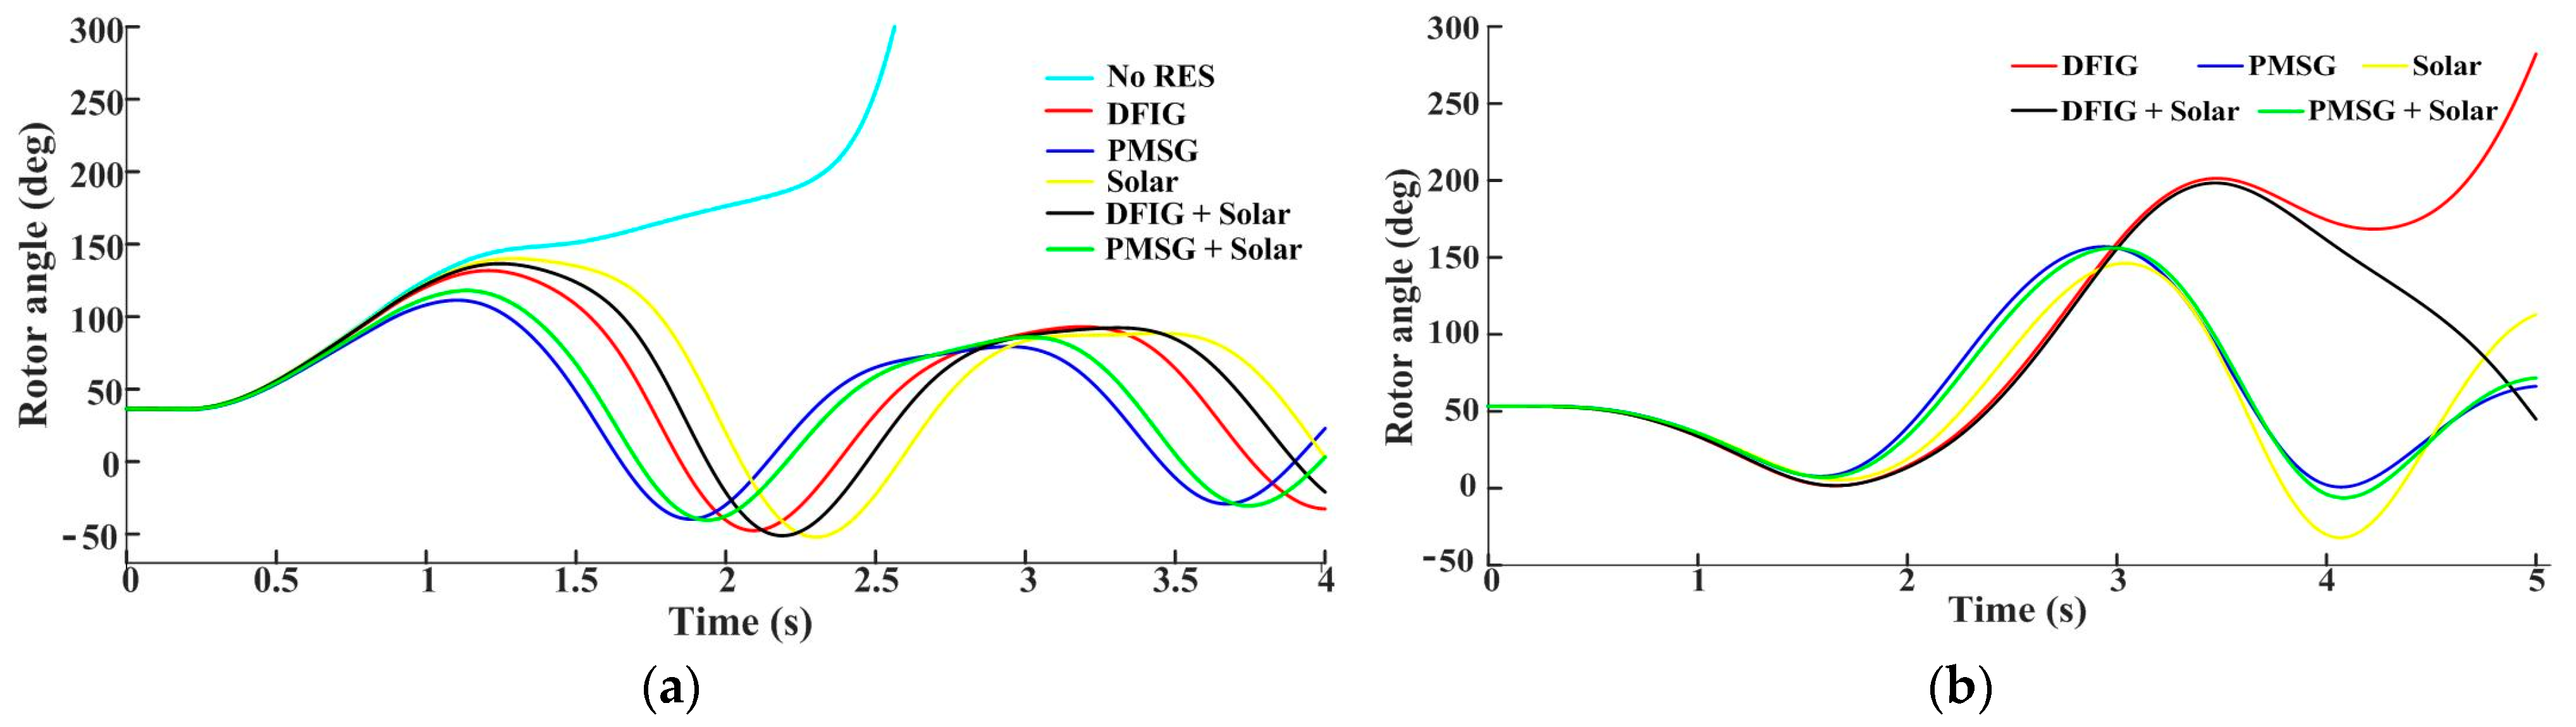
4.1.1. 9-Bus Test System with Constant Power Injection

Initially, the wind speed is considered as 13.95 m/s and the solar irradiation as 1000 W/m2. A 3-phase fault is created at 0.2 s and cleared after 431 ms. Rotor angle of generator-2 is shown here in Figure 8a with and without different RES. Figure 8a shows that stability is improved with the power injection of RES with conventional control when compared to the system without RES. Rotor angle variations of generator-2 with ARS are shown in Figure 8b when the fault is created at 0.2 s and cleared after 484 ms, since the lowest CCT of generator-2 is 483 ms (when connected with a DFIG wind farm because of low power rating of back-to-back converters). The system voltage profile at bus 8 when connected to different types of RES is shown in Figure 9 for both conventional and proposed control techniques with the fault duration of 440 ms. It is clear from Figure 9a–e that the voltage profile is improved with the proposed control technique. The improvement in the voltage profile caused by the fault is because of the reactive power supply during the time period of the fault and hence improves the CCT of the system.
The reactive power support given by the DFIG wind farm during the fault period is less compared to the PMSG wind farm with proposed control because of the low rating of the DFIG grid-side converter which is shown in Figure 10. Figure 10 clarifies that the reactive power supplied to the system during fault is larger when the combination of the PMSG wind farm and solar PVs is connected to the system since the rating of converters connected to the RES are the same as the rating of the RES.
CCT of generator-2 (δ21) with no renewable source is 430 ms. CCT values of generator-2 for different renewable sources with conventional and proposed control techniques are tabulated in Table 1. Hybrid renewable sources (the combination of the DFIG wind farm and solar PVs) give a CCT of 465 ms with the conventional control which is an improvement of 35 ms, whereas the hybrid renewable source (PMSG wind farm and solar PV) gives a CCT of 551 ms with the proposed control, an improvement of 121 ms compared to when no renewable source (No RES) is connected. It is clear from Table 1 that the improvement in CCT is better when the combination of PMSG wind farm and solar PVs is connected to the system with proposed control ARS when compared to remaining cases.

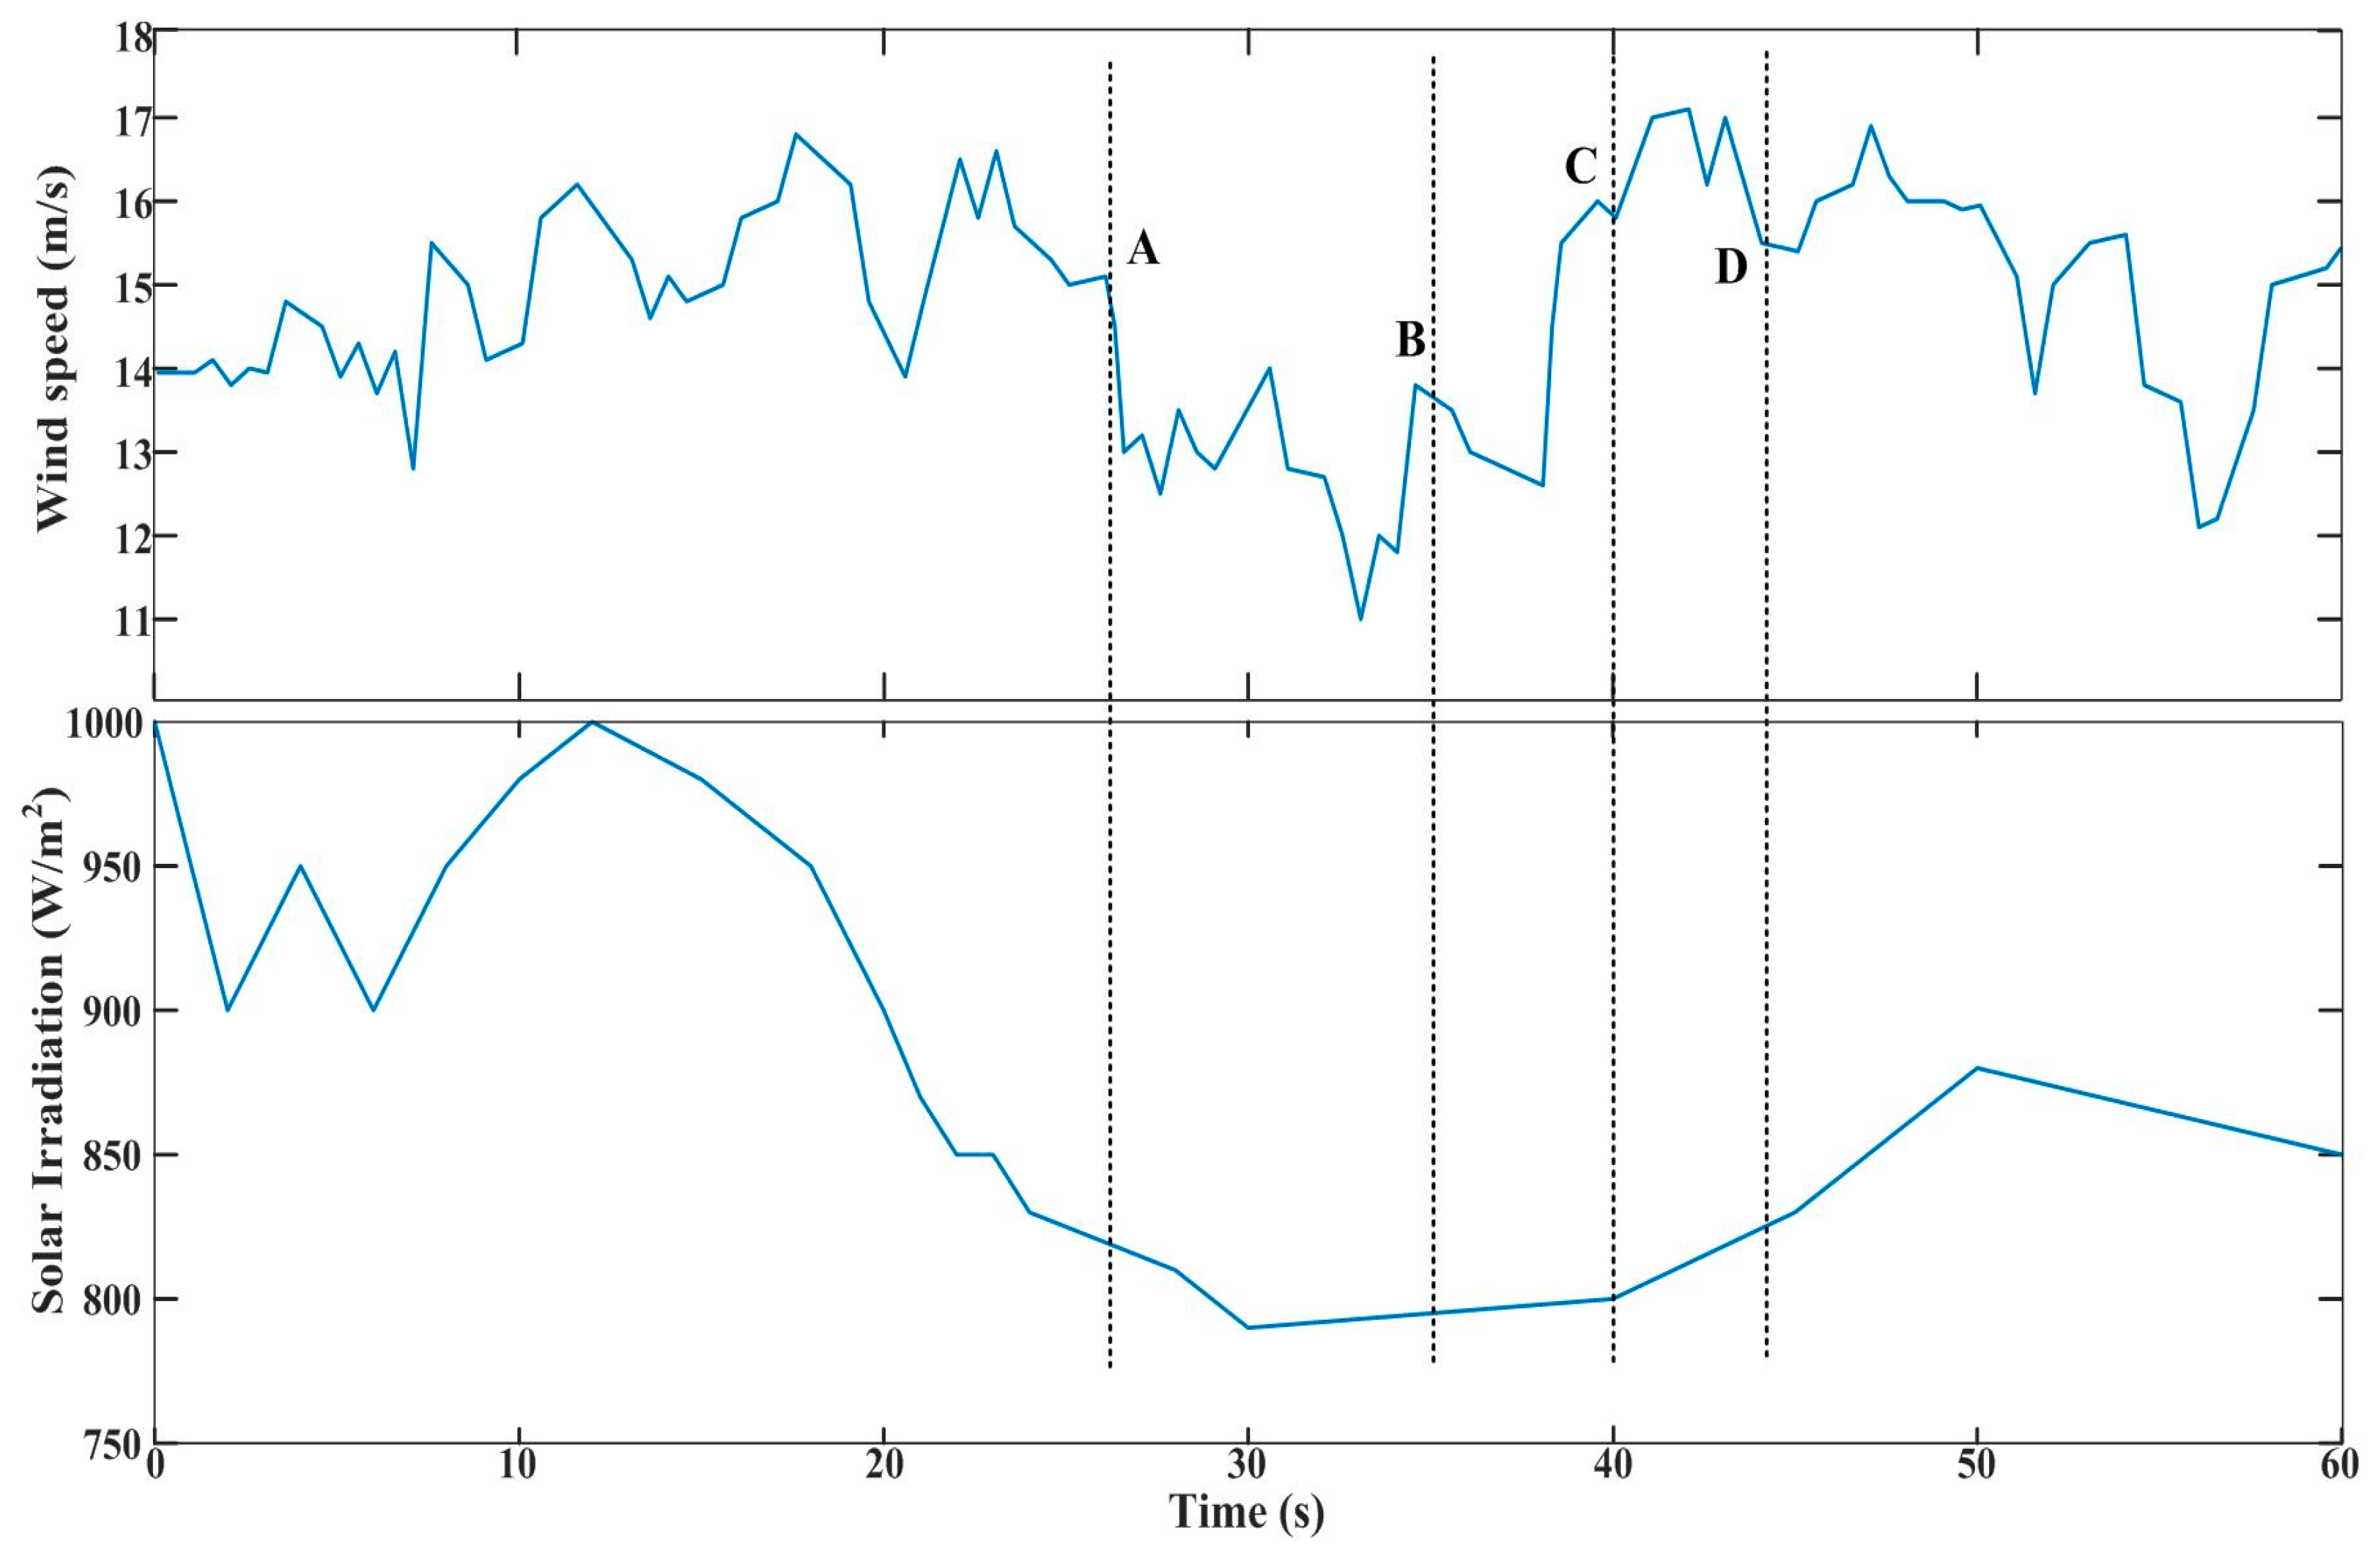
4.1.2. 9-Bus Test System with Variable Power Injection

The profiles of both wind speed and solar irradiation are shown in Figure 11. Four different instances of time, namely A–D, are considered here to support different combinations of variations in both wind speed and solar irradiation such that one profile is in a positive slope and the other is in a negative slope, or vice versa, or one profile is in local minimum and the other is with some slope. The fault instants (time instants) are simulated by creating the fault at that particular time instant, and these fault instants represent time along the profiles of wind speed and solar irradiation at which the fault was created in the system for study. For the case of fault instant ‘C’, the fault is created at 40 s with wind speed 15.8 m/s and solar irradiation 800 W/m2, which can also be seen in Figure 11. CCT values of generator-2 for different RES and with variable power injection into the system for both conventional and proposed control techniques are tabulated in Table 2 with faults at different instances which elucidates that the combination of PMSG and solar with ARS gives better improvements in CCT even with variable power injection into the system.
Moreover, Table 1 specifically shows the CCT of generator-2 when the system is connected to RES and the power injected by the RES is maintained at a constant throughout the study. Table 2 shows the same CCT with power injected into the system varying with respect to time. Therefore, the CCT values of particular renewable energy sources are different in Table 1 and Table 2.

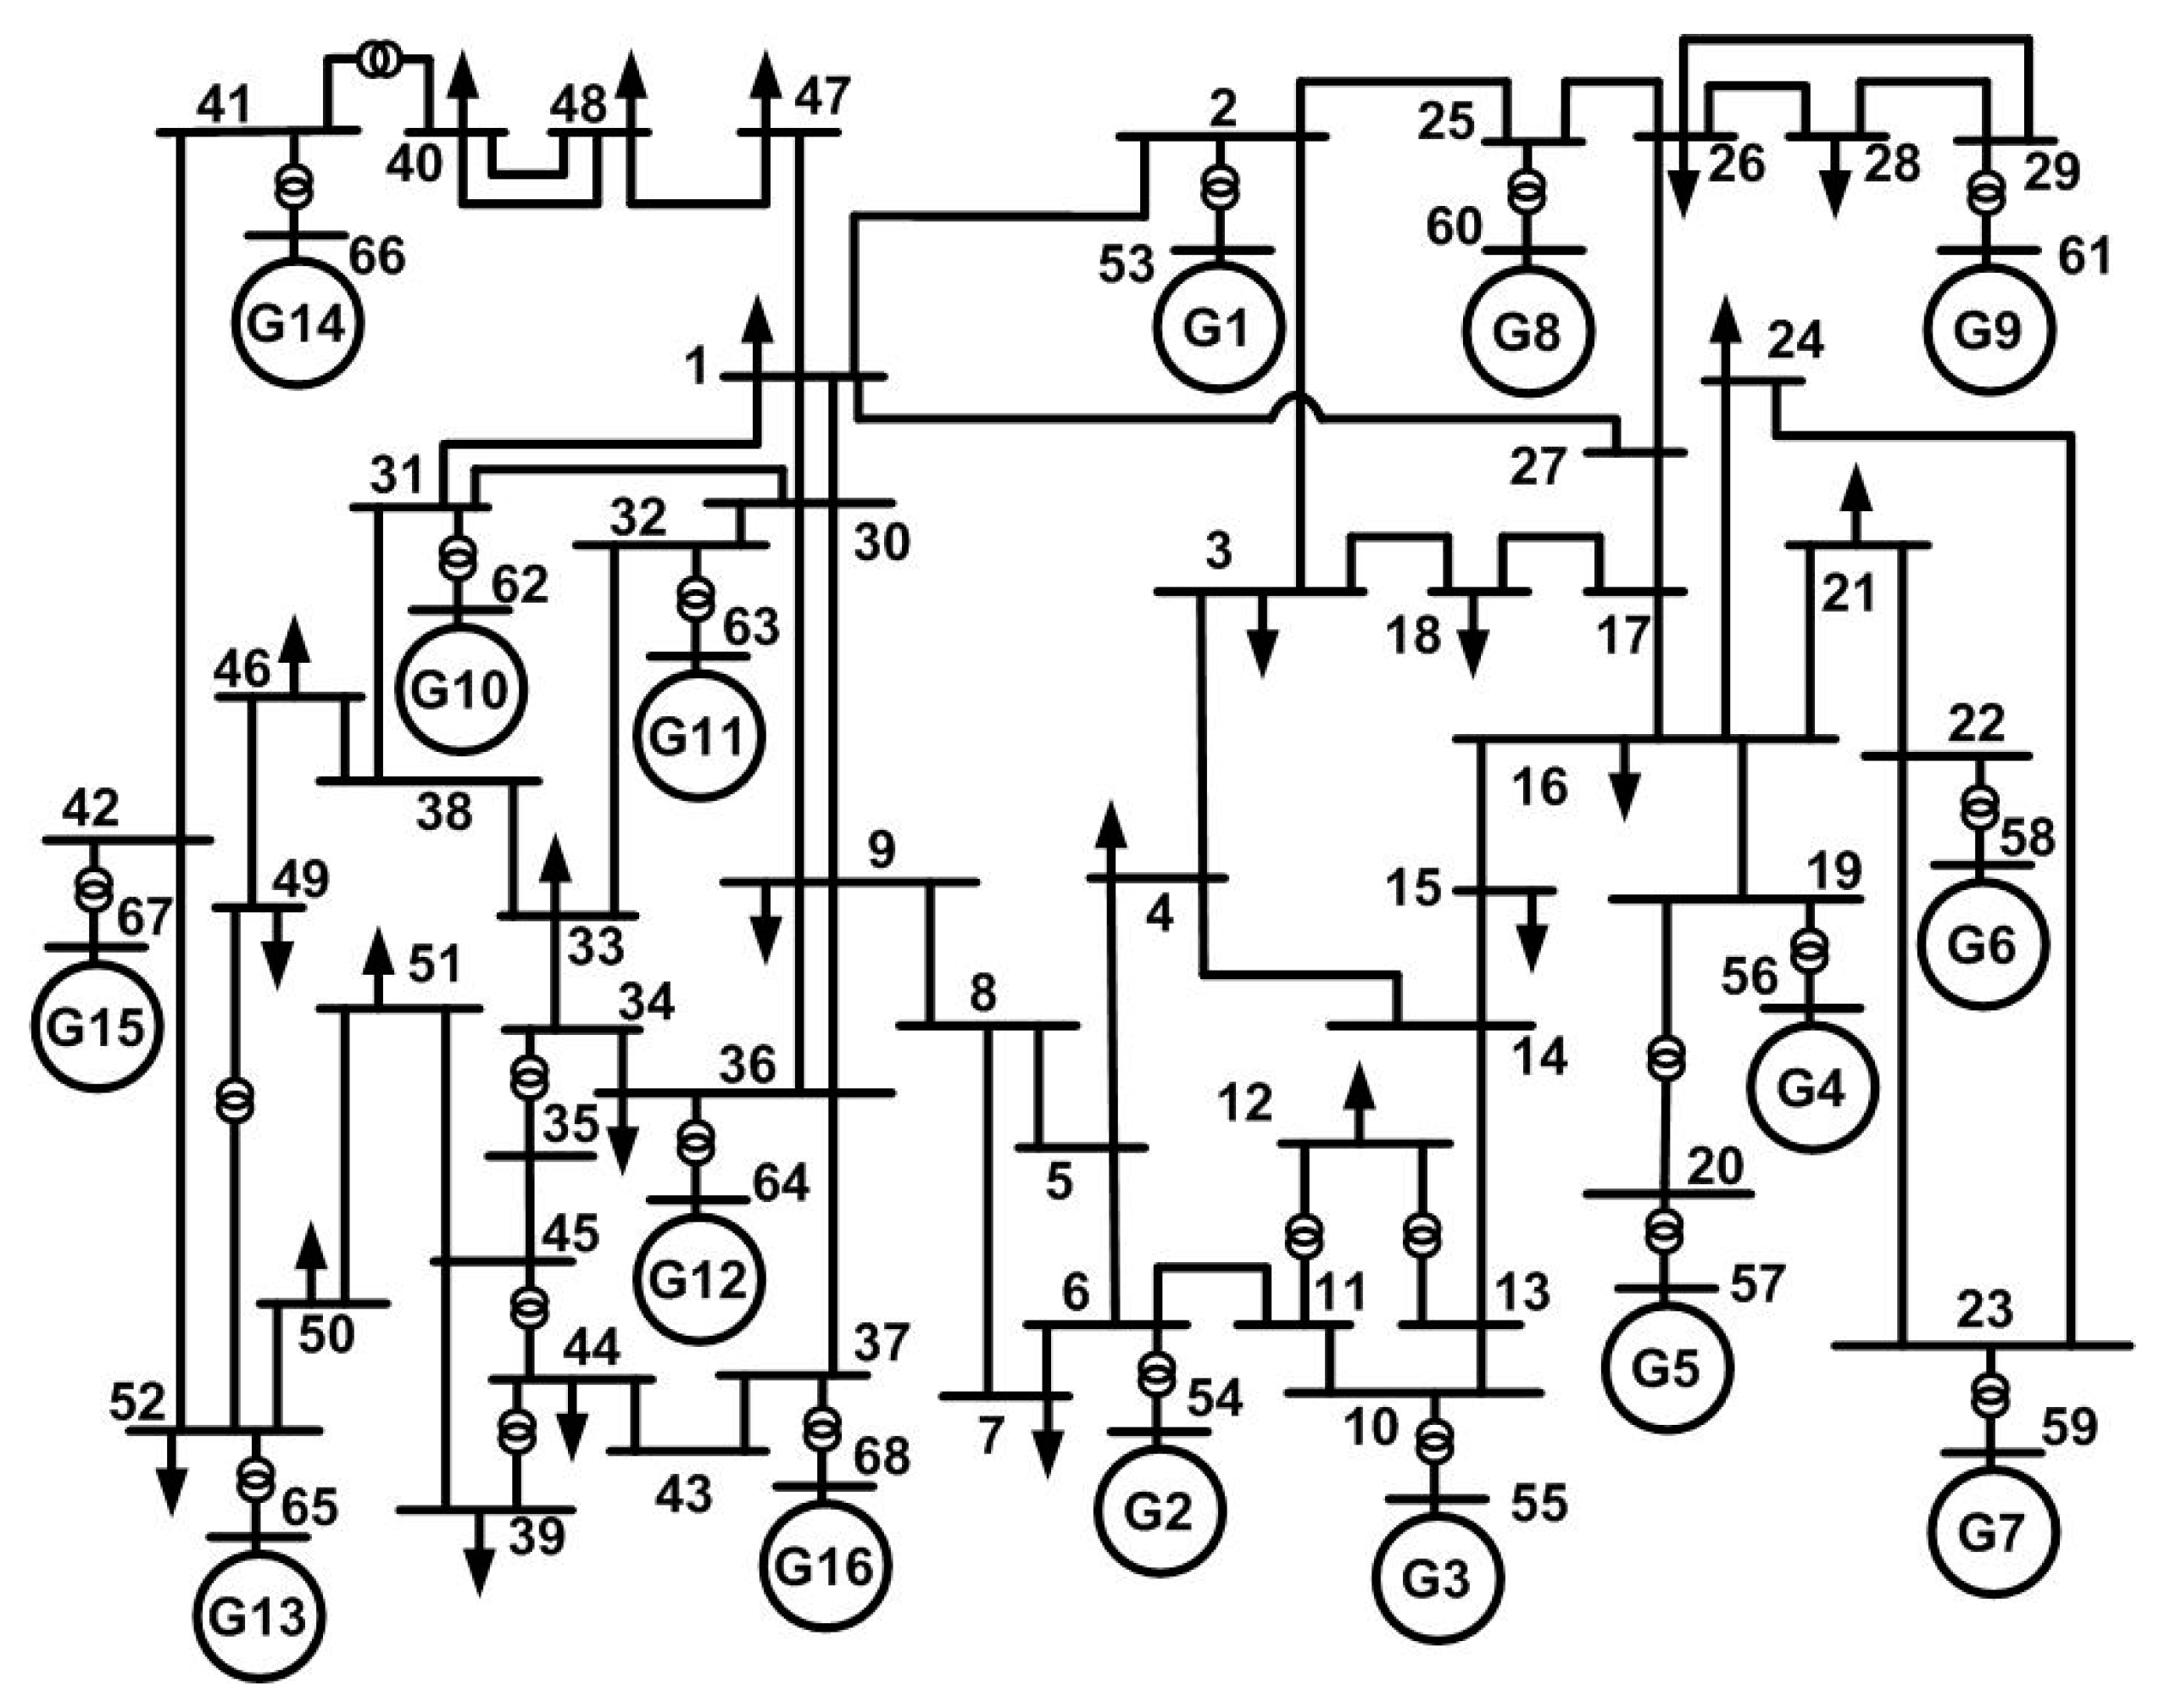
4.2. IEEE 68-Bus Test System

The system under study, IEE 16-machine 68-bus, is shown in Figure 12. A renewable source is connected at different buses considering five different zones [24]. The total power from RES injected into the system is 400 MW. However, for both combinations of RES, it is considered as 300 MW through the wind farm and 100MW through the solar farm in order to make the results comparable. The buses in the different zones are as follows:
  • Zone-I: {4, 5, 6, 7, 8, 9, 10, 11, 12, 13, 14, 54, 55}.
  • Zone-II: {1, 2, 3, 17, 18, 25, 26, 27, 28, 29, 53, 60, 61}.

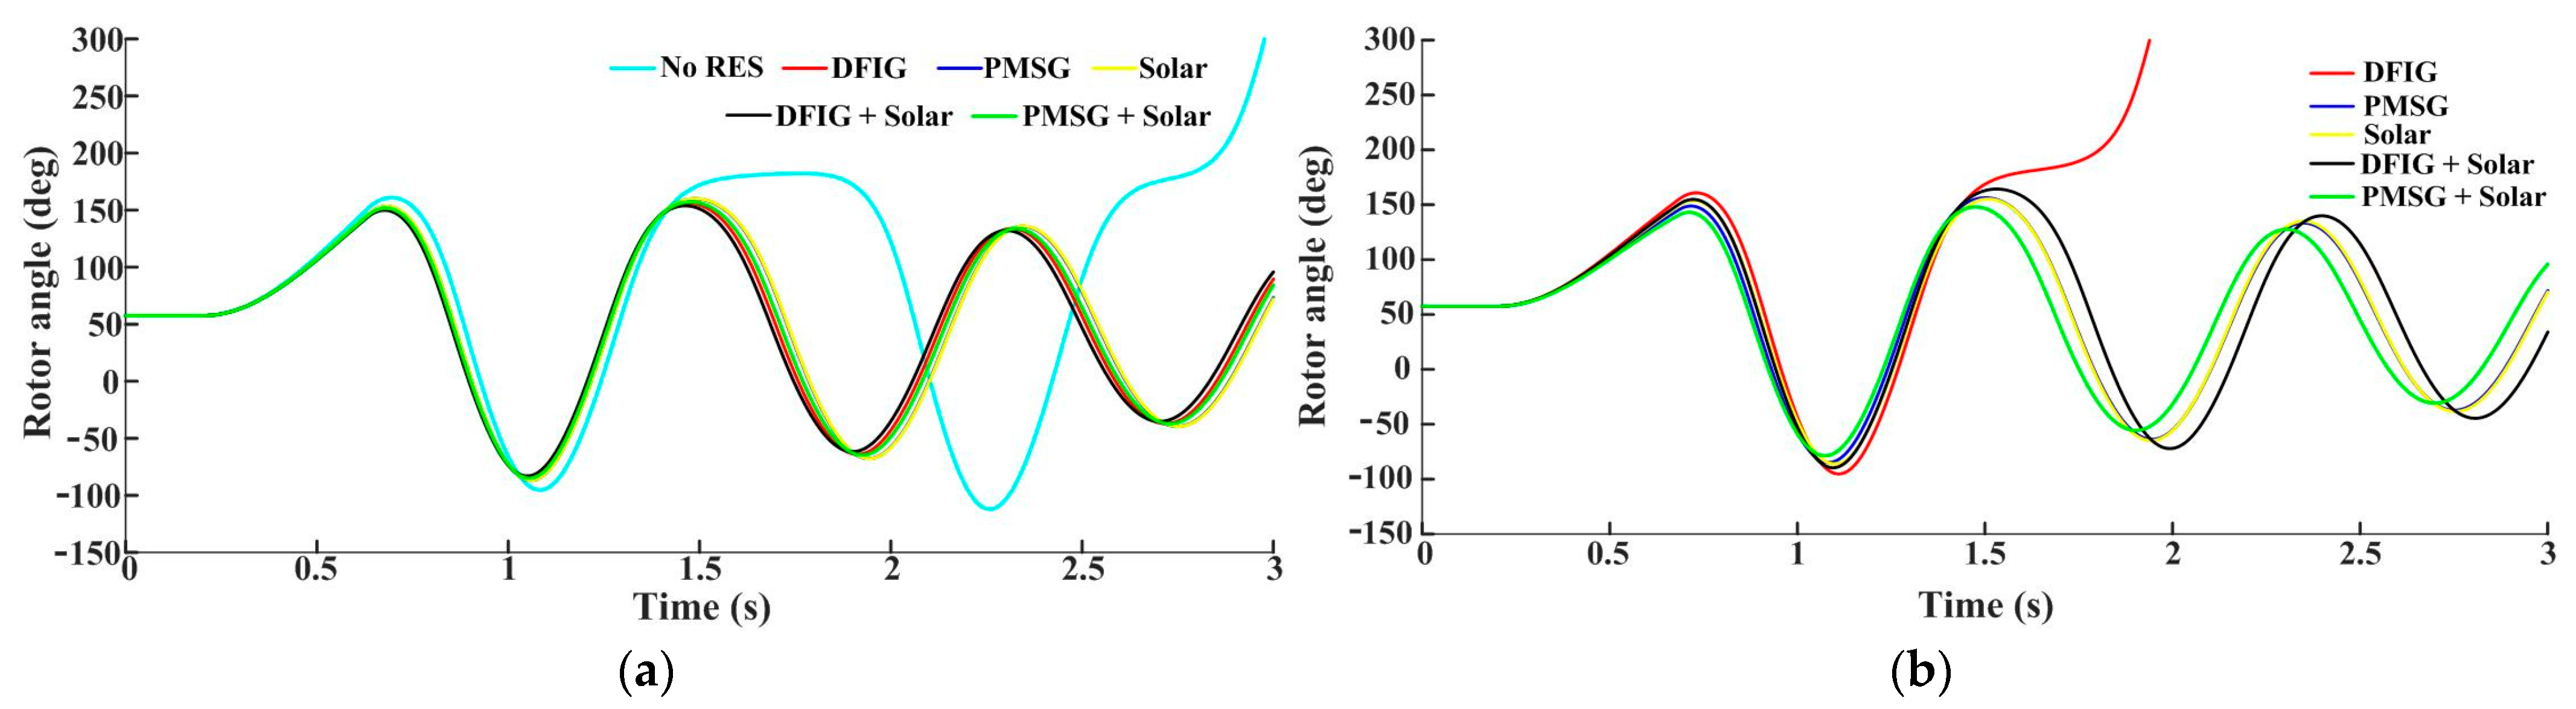
4.2.1. 68-Bus Test System with Constant Power Injection

A 3-phase fault is created at bus 53 when the renewable energy source is connected at bus 28 in zone-II and the rotor angle of all generators is observed. Rotor angles of the least stable generators are shown in the Figure 13a for both with and without different RES. CCT of the system with no renewable source is 664 ms. Rotor angle variations with ARS are shown in Figure 13b. It is clear from Figure 13b that the variations in rotor angle are better when the combination of wind farm with a PMSG and solar PV farm is connected to the system with proposed control ARS. CCT values for different renewable sources with conventional and proposed control techniques are tabulated in Table 3. Hybrid renewable sources (combination of PMSG wind farm and solar PV) gives a CCT of 684 ms with conventional control which is an improvement of 20 ms, whereas the same combination gives a CCT of 751 ms with the proposed control, an improvement of 87 ms compared to when no renewable source is connected. In addition, the improvement in CCT with ARS is better in the combination of wind farm with PMSG and solar PV when compared to other RES, due to the low power rating of back-to-back converters in the wind farm with a DFIG. Thus, the reactive power support given by the wind farm with a DFIG is low during fault periods when compared to either the wind farm with a PMSG or the solar PV farm.

4.2.2. 68-Bus Test System with Variable Power Injection

The better improvement in CCT for the system when connected to the wind farm with a DFIG is 39 ms at instance B when the renewable source is connected at bus 28 and a fault created at bus 53. For the same case as mentioned above, the better improvements are 37 ms at fault instance A, 61 ms at fault instance D, 54 ms at fault instances C and D, and 68 ms at fault instances C and D when connected to the wind farm with a PMSG as its generator, solar PV farm, the combination of wind farm having a DFIG as its generator and solar PV farm, and the combination of wind farm having a PMSG as its generator and solar PV farm, respectively. CCT values of the least stable generators for the combination of PMSG-based wind farm and solar PV farm with variable power injection to the system for both conventional and proposed control techniques are tabulated in Table 4 with faults at different instances. From Table 4, the CCT of the overall system is almost the same when compared to different fault instances with the chosen technique, though the generators that become unstable in different scenarios are different.
It is clear from Table 1, Table 2, Table 3 and Table 4 that the combination of a wind farm with a PMSG and solar PVs gives better results with proposed control in almost all conditions.

5. Conclusions

The analysis of the transient stability of a MMS with different types of renewable energy sources is presented here with a simple control technique to enhance system stability with and without considering the presence of various RES and the combination of those sources. Both the doubly fed induction generator (DFIG) and the permanent magnet synchronous generator (PMSG) are considered as wind generators. Enhancement of transient stability is carried out by improving critical clearing time of faults in the system. Using a simple control of reactive and active powers during faults improved system stability as well as voltage profile. This study is carried out on both a 9-bus WSCC test system and a 68-bus IEEE test system by creating a 3-phase fault at different buses as well as different time instants. Results are compared for several cases which includes the system with a DFIG as a wind generator, a PMSG as a wind generator, a solar PV farm, the combination of a DFIG as a wind generator and solar PVs, and the combination of a PMSG as a wind generator and solar PVs as well as the system without any renewable source. Additionally, results are compared for all these combinations with conventional control and proposed control ARS. It is observed from the findings discussed in the paper that the combination of wind power with a PMSG and solar PVs connected to the system improves system stability with the proposed control technique when compared to a system connected to the other types of RES and also to the conventional control. It is also observed from the results that the improvement in system stability is better in regards to variable power injection when the combination of wind power with a PMSG and solar PVs is connected to the system.

Author Contributions

Conceptualization, A.A. and A.M.; methodology and validation, A.A., A.M. and S.S.B.; writing—original draft preparation, A.A.; writing—review and editing, A.M., S.S.B., D.Z. and P.S.; supervision, S.S.B., A.M. and P.S. All authors have read and agreed to the published version of the manuscript.

Funding

This research received no external funding.

Institutional Review Board Statement

Not applicable.

Informed Consent Statement

Not applicable.

Data Availability Statement

Not applicable.

Conflicts of Interest

The authors declare no conflict of interest.

References

  1. Kroposki, B.; Johnson, B.; Zhang, Y.; Gevorgian, V.; Denholm, P.; Hodge, B.-M.; Hannegan, B. Achieving a 100% renewable grid: Operating electric power systems with extremely high levels of variable renewable energy. IEEE Power Energy Mag. 2017, 15, 61–73. [Google Scholar] [CrossRef]
  2. Hansen, L.H.; Helle, L.; Blaabjerg, F.; Ritchie, E.; Munk-Nielsen, S.; Bindner, H.; Soerensen, P.; Bak-Jensen, B. Conceptual Survey of Generators and Power Electronics for Wind Turbines; Risø-R-1205; Risø National Laboratory: Roskilde, Denmark, 2001.
  3. Chakraborty, S.; Kramer, B.; Kroposki, B. A review of power electronics interfaces for distributed energy systems towards achieving low-cost modular design. Renew. Sustain. Energy Rev. 2009, 13, 2323–2335. [Google Scholar] [CrossRef]
  4. Du, E.; Zhang, N.; Kang, C.; Xia, Q. A High-efficiency network-constrained clustered unit commitment model for power system planning studies. IEEE Trans. Power Syst. 2019, 34, 2498–2508. [Google Scholar] [CrossRef]
  5. Hou, Q.; Du, E.; Zhang, N.; Kang, C. Impact of high renewable penetration on the power system operation mode: A data-driven approach. IEEE Trans. Power Syst. 2020, 35, 731–741. [Google Scholar] [CrossRef]
  6. Bekele, G.; Boneya, G. Design of a Photovoltaic-Wind Hybrid Power Generation System for Ethiopian Remote Area. Ph.D. Thesis, Addis Ababa University, Addis Ababa, Ethiopia, 2011. [Google Scholar]
  7. Patel, H.; Agarwal, V. Matlab based modeling to study the effect of partial shading on PV array characteristics. IEEE Trans. Energy Convers. 2008, 23, 302–310. [Google Scholar] [CrossRef]
  8. Abdulazeez, M.; Iskender, I. Simulation and Experimental Study of Shading Effect on Series and Parallel Connected PV Modules. In Proceedings of the 2011 7th International Conference on Electrical and Electronics Engineering, Bursa, Turkey, 1–4 December 2011. [Google Scholar]
  9. SiyuGuo, T.M.W.; Walsh, T.M. Analyzing Partial Shading of PV Module by Circuit Modeling. In Proceedings of the 2012 38th IEEE Photovoltaic Specialists Conference, Austin, TX, USA, 3–8 June 2012. [Google Scholar]
  10. Xuesong, Z.; Daichun, S.; Youjie, M.; Deshu, C. The Simulation and Design for MPPT of PV System Based on Incremental Conductance Method. In Proceedings of the 2010 WASE International Conference on Information Engineering, Beidai, China, 14–15 August 2010. [Google Scholar]
  11. Safari, A.; Mekhilef, S. Simulation and hardware implementation of incremental conductance MPPT with direct control method using cuk converter. IEEE Trans. Ind. Electron. 2011, 58, 1154–1161. [Google Scholar] [CrossRef]
  12. Rosu-Hamzescu, M.; Oprea, S. Practical Guide to Implementing Solar Panel MPPT Algorithm; Microchip Technology Inc.: Chandler, AZ, USA, 2013. [Google Scholar]
  13. Palmieri, A.; Rosini, A.; Procopio, R.; Bonfiglio, A. An MPC-sliding mode cascaded control architecture for PV grid-feeding inverters. Energies 2020, 13, 2326. [Google Scholar] [CrossRef]
  14. Feshara, H.F.; Ibrahim, A.M.; El-Amary, N.H.; Sharaf, S.M. Performance evaluation of variable structure controller based on sliding mode technique for a grid-connected solar network. IEEE Access 2019, 7, 84349–84359. [Google Scholar] [CrossRef]
  15. Taftichat, T.; Agbossou, K. Output power Maximization of a Permanent Magnet Synchronous Generator Based Stand-Alone Wind Turbine System. In Proceedings of the 2006 IEEE International Symposium on Industrial Electronics, Montreal, QC, Canada, 9–13 July 2006. [Google Scholar]
  16. Gules, R.; Pacheco, J.D.P.; Hey, H.L.; Imhoff, J. Maximum power point tracking system with Parallel connection for PV stand-alone application. IEEE Trans. Ind. Electron. 2008, 55, 2674–2683. [Google Scholar] [CrossRef] [Green Version]
  17. Rahmani, S.; Hamadi, A.; Ndtoungou, A.; Al-Haddad, K.; Kanaan, H.Y. Performance Evaluation of a PMSG-Based Variable Speed Wind Generation System Using Maximum Power Point Tracking. In Proceedings of the 2012 IEEE Electrical Power and Energy Conference, London, ON, Canada, 10–12 October 2012. [Google Scholar]
  18. Jamil, M.; Gupta, R.; Singh, M. A Review of Power Converter Topology Used with PMSG Based Wind Power Generation. In Proceedings of the 2012 IEEE 5th Power India Conference, Murthal, India, 19–22 December 2012. [Google Scholar]
  19. Koutroulis, E.; Kalaitzakis, K. Design of a maximum power tracking system for wind-energy conversion application. IEEE Trans. Ind. Electron. 2006, 53, 486–494. [Google Scholar] [CrossRef]
  20. Ahuja, H.; Bhuvaneswari, G.; Balasubramanian, R. Performance Comparison of DFIG and PMSG Based WECS. In Proceedings of the IET Conference on Renewable Power Generation (RPG 2011), Edinburgh, UK, 6–8 September 2011; pp. 1–6. [Google Scholar]
  21. Fandi, G.; Igbinovia, F.O.; Ahmad, I.; Svec, J.; Muller, Z. Modeling and Simulation of a Gearless Variable Speed Wind Turbine System With PMSG. In Proceedings of the 2017 IEEE PES PowerAfrica, Accra, Ghana, 27–30 June 2017; pp. 59–64. [Google Scholar]
  22. Wang, L.; Truong, D.-N. Stability enhancement of a power system with a PMSG-based and a DFIG-based offshore wind farm using a SVC with an adaptive-network-based fuzzy inference system. IEEE Trans. Ind. Electron. 2013, 60, 2799–2807. [Google Scholar] [CrossRef]
  23. Ngom, I.; Mboup, A.B.; Thiaw, L.; Mustapha, S.S.; Slama-Belkhodja, I. Improved Control for DC-Link Fluctuation during Voltage Dip Based on DFIG. In Proceedings of the 2018 9th International Renewable Energy Congress (IREC), Hammamet, Tunisia, 20–22 March 2018; pp. 1–6. [Google Scholar]
  24. Mitra, A.; Chatterjee, D. Active power control of DFIG-based wind farm for improvement of transient stability of power systems. IEEE Trans. Power Syst. 2016, 31, 82–93. [Google Scholar] [CrossRef]
  25. Mitra, A.; Chatterjee, D. A sensitivity-based approach to assess the impacts of integration of variable speed wind farms on the transient stability of power systems. Renew. Energy 2013, 60, 662–671. [Google Scholar] [CrossRef]
  26. Zhou, T.; Francois, B. Energy management and power control of a hybrid active wind generator for distributed power generation and grid integration. IEEE Trans. Ind. Electron. 2011, 58, 95–104. [Google Scholar] [CrossRef]
  27. Ropp, M.; Gonzalez, S. Development of a MATLAB/simulink model of a single-phase grid-connected photovoltaic system. IEEE Trans. Energy Convers. 2009, 24, 195–202. [Google Scholar] [CrossRef]
  28. Ku, T.-T.; Lin, C.-H.; Hsu, C.-T.; Chen, C.-S.; Liao, Z.-Y.; Wang, S.-D.; Chen, F.-F. Enhancement of power system operation by renewable ancillary service. IEEE Trans. Ind. Appl. 2020, 56, 6150–6157. [Google Scholar] [CrossRef]
  29. Hirose, T.; Matsuo, H. Standalone hybrid wind-solar power generation system applying dump power control without dump load. IEEE Trans. Ind. Electron. 2012, 59, 988–997. [Google Scholar] [CrossRef]
  30. Sowa, P.; Zychma, D. Dynamic equivalents in power system studies: A review. Energies 2022, 15, 1396. [Google Scholar] [CrossRef]
  31. Olulope, P.K.; Folly, K.A.; Venayagamoorthy, G.K. Modeling and Simulation of Hybrid Distributed Generation and Its Impact on Transient Stability of Power System. In Proceedings of the 2013 IEEE International Conference on Industrial Technology (ICIT), Cape Town, South Africa, 25–28 February 2013; pp. 1757–1762. [Google Scholar]
  32. Ghanasyam, P.; Verma, A.; Mitra, A. Impact of Hybrid Renewable Sources on the Transient Stability of Multi-Machine Power System. In Proceedings of the IEEE International Conference on Power Electronics, Drives and Energy Systems (PEDES), Chennai, India, 18–21 December 2018; pp. 1–5. [Google Scholar] [CrossRef]
  33. Machowski, J.; Lubosny, Z.; Bialek, J.W.; Bumby, J.R. Power System Dynamics: Stability and Control; John Wiley & Sons: New York, NY, USA, 2020. [Google Scholar]
  34. Kundur, P. Power System Stability and Control; McGraw-Hill: New York, NY, USA, 1994. [Google Scholar]
  35. Pal, B.; Mei, F. Modelling adequacy of the doubly fed induction generator for small-signal stability studies in power systems. IET Renew. Power Gener. 2008, 2, 181–190. [Google Scholar] [CrossRef]
  36. Yang, S.; Zhang, L. Modeling and Control of the PMSG Wind Generation System with a Novel Controller. In Proceedings of the 2013 Third International Conference on Intelligent System Design and Engineering Applications, Hong Kong, China, 16–18 January 2013; pp. 946–949. [Google Scholar]
  37. Kurian, S.; Sindhu, T.K.; Cheriyan, E.P. Modelling and Simulation of Direct Driven Wind Electric Generator for Grid Integration. In Proceedings of the 2012 Annual IEEE India Conference (INDICON), Kochi, India, 7–9 December 2012; pp. 171–174. [Google Scholar]
  38. Mai, T.; Hand, M.M.; Baldwin, S.F.; Wiser, R.H.; Brinkman, G.L.; Denholm, P.; Arent, D.J.; Porro, G.; Sandor, D.; Hostick, D.J.; et al. Renewable electricity futures for the United States. IEEE Trans. Sustain. Energy 2014, 5, 372–378. [Google Scholar] [CrossRef]
  39. Hashimoto, J.; Ustun, T.S.; Suzuki, M.; Sugahara, S.; Hasegawa, M.; Otani, K. Advanced grid integration test platform for increased distributed renewable energy penetration in smart grids. IEEE Access 2021, 9, 34040–34053. [Google Scholar] [CrossRef]
Figure 1. Connection diagram of a solar PV farm to the system.
Energies 15 04824 g001
Figure 2. Connection diagram of a wind farm with a DFIG to the system.
Energies 15 04824 g002
Figure 3. Connection diagram of a wind farm with a PMSG to the system.
Energies 15 04824 g003
Figure 4. (a) q-axis control block; (b) d-axis control block of GSC.
Energies 15 04824 g004
Figure 5. (a) q-axis control block; (b) d-axis control block of MSC.
Energies 15 04824 g005
Figure 6. Proposed controller (ARS) for the q-axis control block.
Energies 15 04824 g006
Figure 7. WSCC 3-machine 9-bus system connected with RES at bus 8.
Energies 15 04824 g007
Figure 8. Variations in rotor angle (δ21) with: (a) conventional control and (b) proposed control (ARS) when the fault is at bus 5.
Energies 15 04824 g008
Figure 9. Variations in system voltage at bus 8 when connected to: (a) a wind farm with a DFIG; (b) a wind farm with a PMSG; (c) a solar PV farm; (d) a combination of a wind farm with a DFIG and a solar PV farm; and (e) a combination of a wind farm with a DFIG and a solar PV farm.
Energies 15 04824 g009
Figure 10. Reactive power support given different RES.
Energies 15 04824 g010
Figure 11. Profiles of wind speed and solar irradiation.
Energies 15 04824 g011
Figure 12. Single line diagram of IEEE 16-machine 68-bus system [24].
Energies 15 04824 g012
Figure 13. Variations in rotor angle when the fault is at bus 53 with: (a) conventional control and (b) proposed control (ARS).
Energies 15 04824 g013
Table 1. CCT of generator-2 with conventional and proposed control when connected to different RES.
Type of RES ConnectedCCT of δ21 in ms
Conventional ControlProposed ControlImprovement
No RES 1430
DFIG46348320
PMSG45353380
Solar PV45854486
DFIG and Solar PV46550035
PMSG and Solar PV45255199
1 No RES represents the system without any renewable energy source.
Table 2. CCT of generator-2 when connected to different RES at different fault instants.
Type of RES
Connected
Fault InstantsCCT of δ21 in ms
Conventional ControlProposed ControlImprovement
DFIGA45447218
B46848921
C46448420
D45647418
PMSGA45353380
B45353380
C45353380
D45353380
Solar PVA45555196
B45655296
C460560100
D462565103
DFIG and Solar PVA46049535
B47551641
C47351239
D46449935
PMSG and Solar PVA459586127
B459585126
C460588128
D461589128
Table 3. CCT with conventional and proposed control when connected to different RES.
Type of RES
Connected at Bus 28
CCT in ms Fault at Bus 53
Conventional ControlProposed ControlImprovement
No RES664
DFIG67671337
PMSG68672337
Solar PV67672347
DFIG and Solar PV67773053
PMSG and Solar PV68475167
Table 4. CCT when connected to different RES at various fault instants.
Type of RES
Connected
Zone (RES at Bus)Fault InstantsFault BusCCT of in ms
Conventional ControlProposed ControlImprovement
PMSG and Solar PVI (4)A1265769235
B1265669135
C1265769134
D1265769134
II (28)A263323364
5368574560
B263313354
5368474359
C263313354
5368475268
D263313354
5368475268
Publisher’s Note: MDPI stays neutral with regard to jurisdictional claims in published maps and institutional affiliations.

