Article

The Impacts of Resource Endowment, and Environmental Regulations on Sustainability—Empirical Evidence Based on Data from Renewable Energy Enterprises

School of Business, Macau University of Science and Technology, Taipa 999078, Macau
*
Author to whom correspondence should be addressed.
Energies 2022, 15(13), 4678; https://doi.org/10.3390/en15134678
Submission received: 11 April 2022 / Revised: 2 June 2022 / Accepted: 9 June 2022 / Published: 26 June 2022
(This article belongs to the Special Issue Available Energy and Environmental Economics)

Abstract

:
In today’s socio-economic context where environmental protection and sustainable development are equally important, how renewable energy enterprises can achieve sustainable development has become a topic of academic interest in recent years. This paper investigates the link between sustainable growth (SG) of renewable energy firms, resource endowment (RE), and environmental regulatory (ERs) issues through a fixed-effects model and a GMM model. Through empirical analysis, it was found that economical environmental regulations have the greatest positive impact on sustainable growth, followed by legal environmental regulations and supervised environmental regulations. Resource endowment is positively related to sustainable growth for non-state-owned renewable energy enterprises, but the negative impact on sustainable growth reflects the effect the of “resource curse”. In addition, resource endowment has a negative moderating effect on environmental regulations and sustainable growth. Thus, the most significant effect is on the relationship between economical environmental regulations and sustainable growth, followed by legal environmental regulations and supervised environmental regulations. Therefore, the flexible and concurrent application of multiple environmental policies is an important way to ensure effective regulations and promote sustainable business growth.

1. Introduction

Energy is crucial to a country’s economy and people’s livelihoods since it is the material underpinning for human survival and development [1]. The majority of people have realized that excessive energy consumption and pollution from the production and use of chemical products will cause an environmental crisis, despite the rapid expansion of the renewable energy industry.
The need to strike a balance between energy corporations’ long-term expansion and environmental protection has become a pressing concern [2].
According to Ren et al. (2018), the environmental regulations discussed in this paper are related to those mandatory regulations issued by the government [3]. Environmental regulation (ER) is one of the policies initiated by the government to control and protect environmental resources [4]. Environmental regulation’s role has received a lot of academic attention. Telle and Larsson (2007) suggested that ER does not reduce industrial productivity [5], but Xie et al. (2017) argued that environmental regulation can boost enterprises’ industrial production competitiveness [6]. Wang, Y. et al. (2022) consider the diversity of the regulatory role of environmental regulations on the energy sector [7]. ERs have a favorable impact on sustainable growth up to a certain amount, but beyond that point, environmental regulation is detrimental to sustainable growth. Later, it was further suggested that environmental regulation has a facilitating effect on firms’ performance and sustainable growth [8]. In addition, ERs have a facilitating and then inhibiting effect on the green economy [9]. Further, a combination of policy subsidies and carbon taxes is an effective way to develop low-carbon environmental protection.
Sustainability is the ability to improve living standards within ecological tolerances. Elkington (1994) proposed the concept of a sustainability floor based on social, economic, and environmental perspectives, which is now widely recognized by the academic community [10]. Das et al. (2020) argue that the concept of achieving growth without compromising the prospects of the next generation is increasingly becoming a core concept in business philosophy [11]. Salzmann et al. (2005) and Engert et al. (2016) argue that the regulatory effect of ERs on the sustainability of a business or economy varies in effect in different situations [12,13]. There are three main relationships between ERs and SG: first, environmental regulation has a positive contribution to sustainable growth [14]; second, Curtis and Lee (2019) argue that environmental regulation has a reverse inhibitory effect on sustainable growth [15]. Third, Curtis and Lee (2019) argue that the link between environmental regulation and sustainable growth is considered to be a “hump-shaped” relationship that varies over time [15].
Without resources, no business can expand sustainably, and resource endowment is the most important aspect in promoting long-term success. Zhai and An (2020) discovered that human capital, financial capabilities, technical innovation, and government conduct have a significant positive impact on SG, based on survey data from 500 Chinese manufacturing enterprises in 2017 [16]. The factors of education, expertise, and the availability of local entrepreneurial capital, fluctuate along the stages of the entrepreneurial process [17]. It has been argued that resource endowment has a long-term positive effect; specifically, the opportunity cost since resource endowment has the impact of inhibition in the early stage, and when it waits for the later order, resource endowment starts to show its positive effect, thus favoring long-term growth. Wang, S et al. (2022) argue that countries and regions that are rich in natural resources tend to have poorer green economic growth [18]. Government subsidies are the main driver for the long-term growth of renewable energy firms (Yang et al., 2019) [19], and they have been an important policy tool to nurture and promote the renewable energy industry in China (Song et al., 2020) [20]. Peng and Liu (2018) argue that government subsidies have a moderating effect on firm development, with negative and then positive effects developing over time [4]. When businesses receive government subsidies, it signifies that the government has accepted their legal status, which allows them to obtain more resources [21]. According to Lu et al. (2020), finance and subsidy impacts can raise the export size, impacting the long-term viability of firms’ export expansion, and social capital plays an important role in fostering long-term growth, since high social capital firms are subjected to more lenient non-price lending requirements, resulting in lower bond interest rates [22].
With its large population and vast land area, China needs to import and use large amounts of energy in its development. The energy structure of China is dominated by traditional energy sources of fossil fuels, and the massive use of fossil fuels will certainly lead to a slew of significant environmental issues, including energy scarcity and pollution. Wu, L. et al. (2021) point out that energy endowment is a major factor in the growth of carbon emissions [23]. People’s tolerance for environmental pollution decreases as their money and living standards rise, and the strength of environmental regulation steadily rises, opening up prospects for renewable energy development. Wang, Q et al.’s (2022) research found that renewable energy gives a significant boost to the economy [24]. Renewable energy is crucial for modifying the energy structure, lowering greenhouse gas emissions, and fostering long-term growth. Renewable energy businesses have grown quickly in recent years as high-tech industries throughout the world. Increased R&D expenditure is required to strengthen technical innovation and promote long-term growth in order to expand quickly and profitably. Furthermore, a major portion of China’s renewable energy businesses are state-owned companies (SOEs), which have greater resources than private businesses. As a result, the research object for this study is renewable energy enterprises.
Do environmental regulations inhibit or promote sustainable company growth? How do different types of environmental regulatory regimes affect the sustainable growth of firms? With the increasing emphasis on resource endowment by firms, how does environmental regulation affect resource endowment and further contribute to firms’ sustainable growth? To address these questions, this paper will provide insights into the impact of environmental regulation and resource endowment on firms’ sustainable growth from the perspective of Chinese renewable energy firms and provide constructive suggestions for the government to develop more accurate environmental and energy policies.
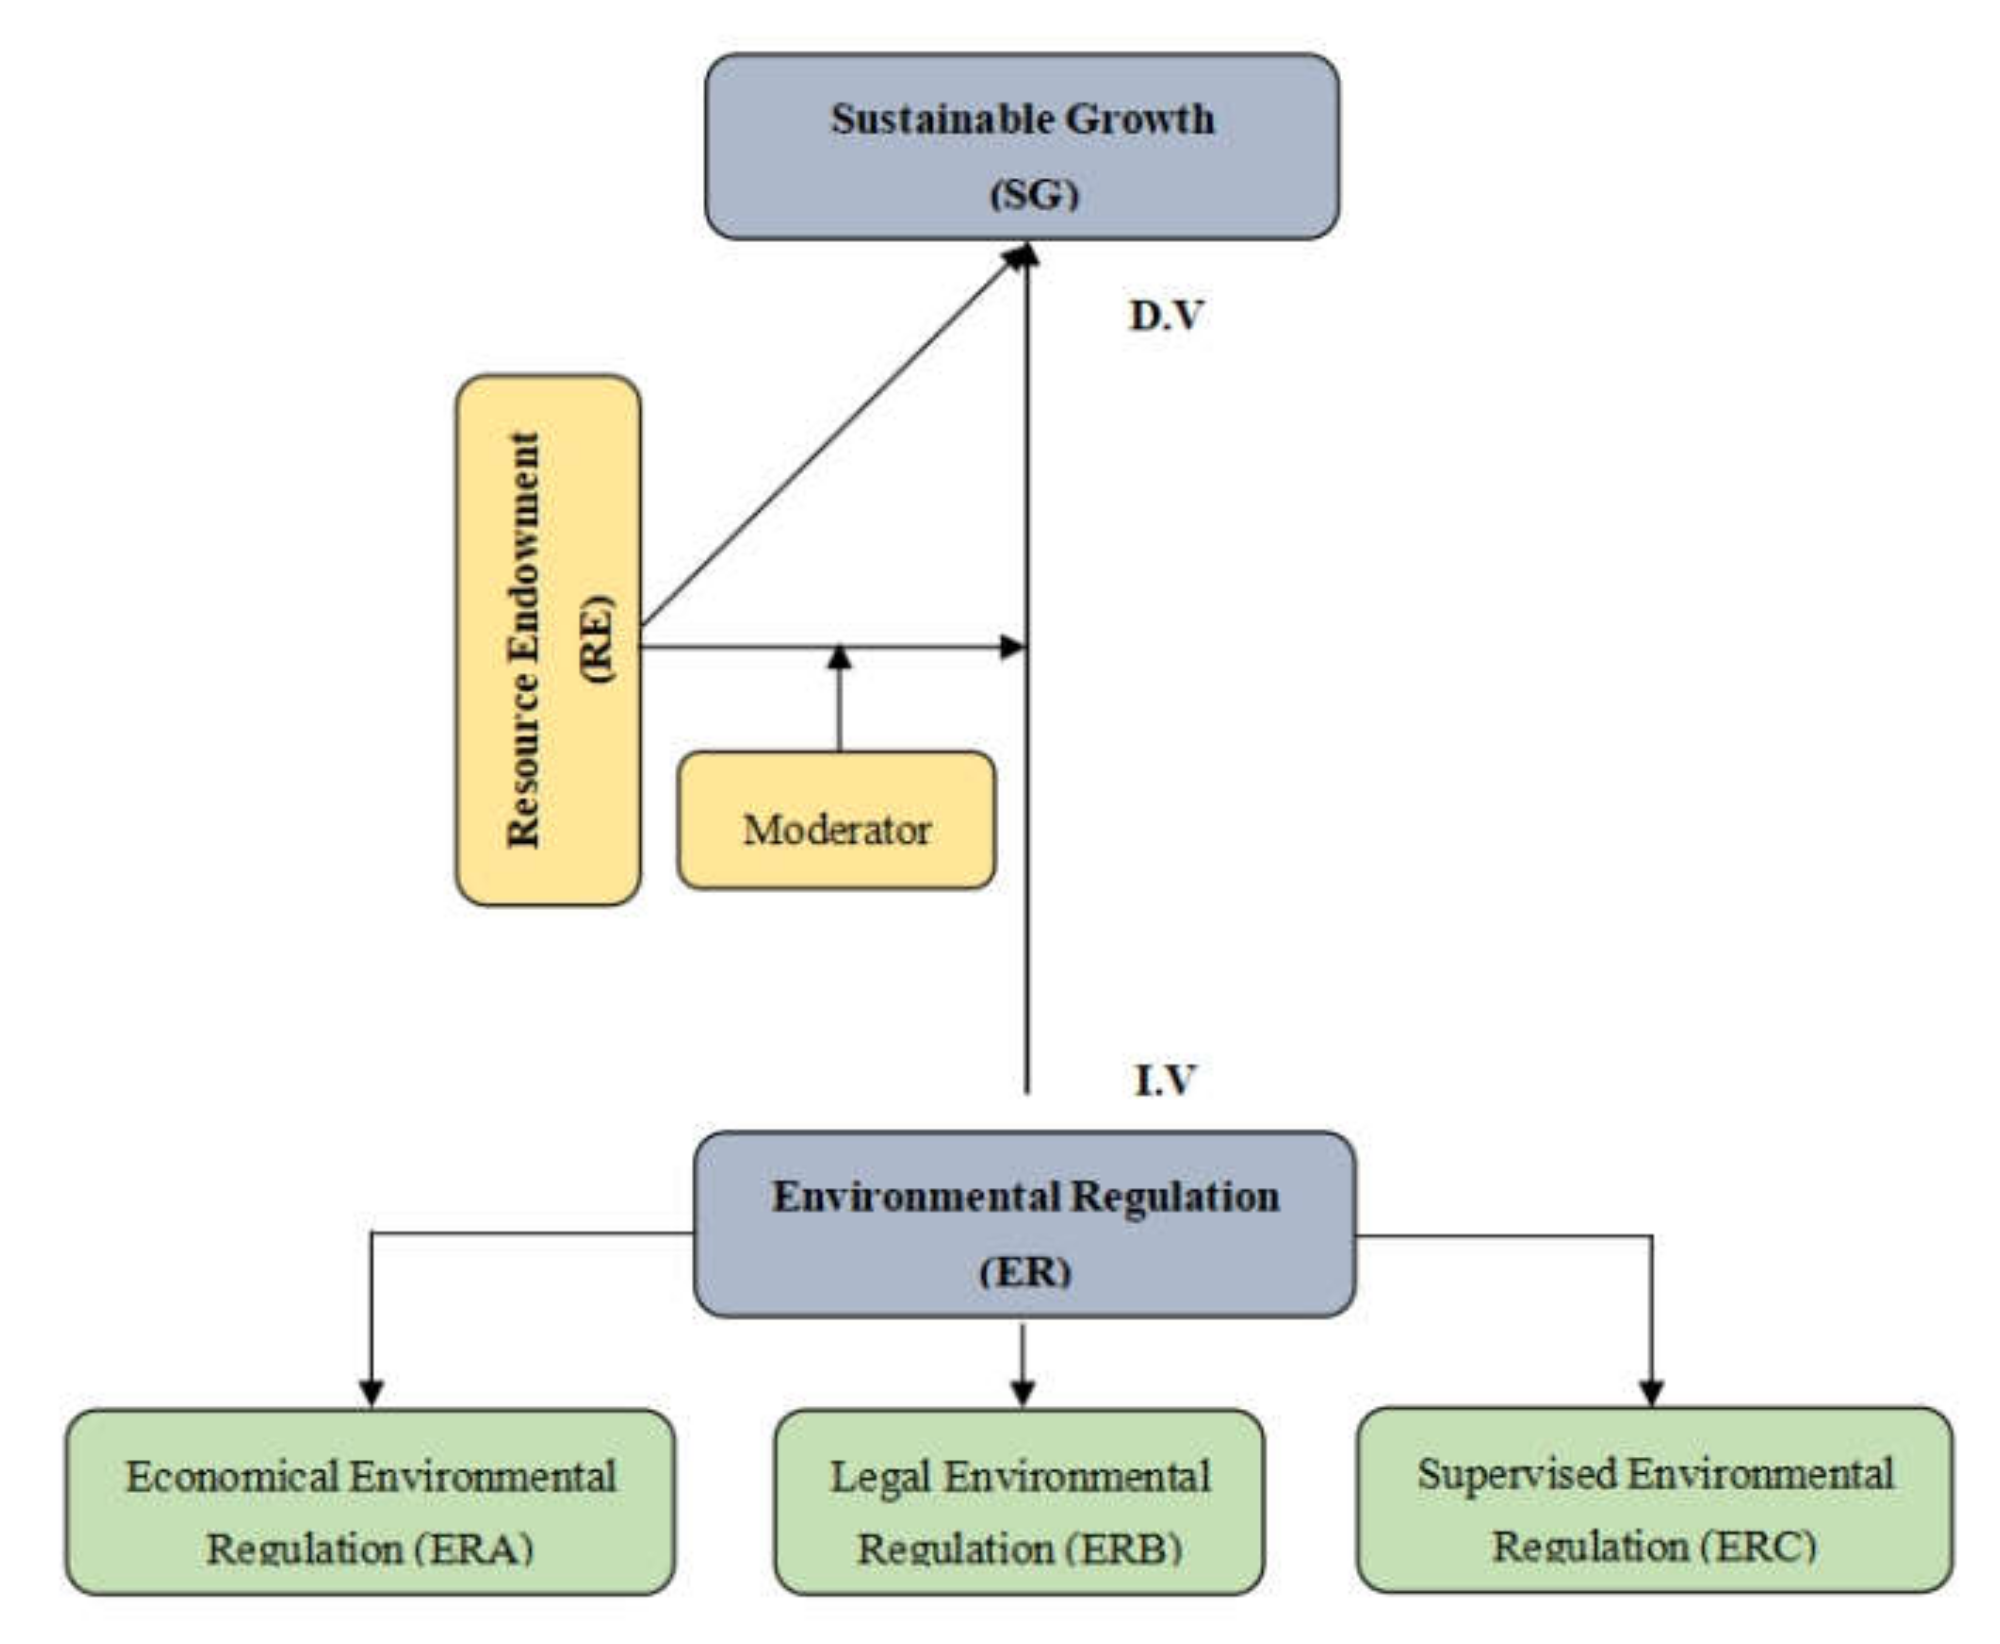
The following are the main contributions: First, this is the first article that divides environmental regulation into three levels, including economic environmental regulation, legal environmental regulation, and supervisory environmental regulation. Second, for the first time, the impact of environmental regulation on the sustainable development of renewable energy firms is studied and specifically analyzed from the perspective of micro data of firms. Third, this paper is the first to study the relationship between environmental regulation and sustainable growth using resource endowment as a moderating variable. Fourth, this paper analyzes the ownership structure heterogeneity of the impact of resource endowment on sustainable growth, which helps to provide targeted policy recommendations for improving the sustainable growth of renewable energy firms with different ownership structures. Fifth, considering the accuracy and comprehensiveness of variable calculation, this paper uses a weighted algorithm to calculate environmental regulations and principal component analysis to calculate resource endowments.

2. Literature Review

2.1. Impact of Environmental Regulations (ERs) on Sustainable Growth (SG)

Environmental regulations (ERs) are a collection of features for government environmental policies aiming at reducing businesses’ influence on the natural environment and providing an atmosphere conducive to environmental innovation [25]. According to López-Gamero et al. (2010), ERs are a collection of environmental behaviors that are either mandatory or discretionary and are disseminated directly or indirectly by economic organizations or governments [26]. Pargal and Wheeler (1996) established the notion of informal ERs, arguing that in poor nations where institutional regulation is weak or non-existent, many communities have struck emission reduction agreements with local firms [27]. Informal regulation is the term for this occurrence. For command and control and market-based rules, Li and Ramanathan (2018) find a positive non-linear relationship between Environmental regulations (ERs) and Sustainable growth (SG). [28]. The informal ERs represented by environmentally related technology and education levels, according to Wang and Shao (2019), have a favorable and substantial influence on SG [29]. ERs have a statistically significant and positive connection with SG, according to Javeed et al. (2020a) [14]. Higher ERs intensity might drive manufacturing, resulting in a more concentrated economy with lower CO2 emissions, hence promoting SG [30]. Firms can increase staff quality at or beyond the ER threshold level, according to Song et al. (2018), for additional gains in SG [31]. Labor cost and ERs, according to Zheng et al. (2019), have a synergistic influence on company growth and structural adjustment [32]. Zhao et al. (2018) suggested that if appropriate ERs are used, then in a short period of time, ERs and financial returns can produce a win–win situation [33]. The effect of ERs on the link between technical innovation and SG is theoretically good, but not substantial, showing that there is still an “implementation gap” [34].
According to Ramanathan et al. (2017), depending on their resources and expertise, firms that adopt a more dynamic approach to reacting to ERs innovatively and taking a proactive approach to managing their environmental performance are generally better able to reap the SG [35]. Regulatory and supervisory actions based on actual market conditions, according to Xie et al. (2017), have a non-linear connection and can be favorably associated with “green” production [6]. Dasgupta et al. (2001) discovered a substantial positive correlation between the frequency of ER agency inspections and the SG [36]. According to Liu et al. (2018), ERs have a net negative effect on energy usage, which is advantageous for reducing energy pressures [4]. In China, the energy-saving impact of ERs is dynamic, with complicated outcomes arising from the “Green Paradox” and “compliance cost.” It has also been found that ERs help stimulate technological progress in manufacturing, which indirectly saves energy [37].
Based on Liu et al. (2018), this paper breaks down environmental regulations into three aspects: economic, legal, and supervision [4], and makes the following hypotheses about their relationship with sustainable growth (SG), respectively.
Hypothesis 1a (H1a).
Economic environmental regulation is conducive to sustainable growth.
Hypothesis 1b (H1b).
Legal environmental regulation is conducive to sustainable growth.
Hypothesis 1c (H1c).
Supervised environmental regulation is conducive to sustainable growth.

2.2. The Impact of Resource Endowment (RE) on Sustainable Growth (SG)

Resource endowment (RE), also known as factor endowment, relates to a country’s ownership of numerous production components such as labor, money, land, technology, and management. The concept of the “resource curse” was coined by Auty (1993), where the dependence on natural resources and its potentially detrimental relationship with economic growth is referred to as a “curse”. His research found that the world’s natural resource-rich countries were unable to use their environmental wealth to improve their economies, and he introduced the concept of the “resource curse”, and as a result, their economies grew at a slower rate than those without natural resources [38]. The evidence that RE negatively impacts SG remains compelling, especially in Chinese cities that produce fossil energy, and the direct influence of ERs on economic development exhibits an “N” curve connection, according to survey data [39]. However, there was some dissent to this widely held belief; Hilmawan and Clark (2019) found no evidence of a “resource curse” using yearly fixed effects and first-order difference regression analysis [40]. It is worth noting that even the most ardent proponents of the “resource curse” are not arguing that states with abundant natural resources would be better off without them [39].
Basic and diverse resources are the two types of enterprise resources [41]. Human resources, financial resources, material resources, technical resources, information resources, and other basic resources are required for company technological innovation operations. The heterogeneity of heterogeneous resources is expressed in the variability of the unique use value [42]. Enterprise culture, which transforms basic resources into diverse resources while encouraging technical innovation abilities, ensures the survival and development of businesses. Energy companies’ RE is unique, and their financial RE mostly consists of government subsidies and financing limits. The value contained in social interactions between individuals or groups is referred to as social capital, which may help spread knowledge, communicate information, and share resources, lower transaction costs, and enhance financial performance. The “relationship finance hypothesis,” presented by Chakravarty and Scott (1999), holds that social capital plays a crucial function in enhancing a company’s ability to raise funds [43].
Government subsidies are the most visible kind of social capital in the energy sector. The value of the government subsidy is derived from the company’s financial statements’ remarks. The value of government subsidy items is calculated using the amount from direct subsidies, tax refunds, and other things [44]. The subsidies granted by the government can help companies with customer service shortage of funds and are an important source of cash for companies [45]. Hu (2001) found no evidence of a link between government subsidies and increased productivity in subsidized firms in Chinese industries [46]. According to Yang et al. (2019), government subsidy policies have a positive moderating effect on investment in the renewable energy sector in China [47]. The contribution of government subsidies to renewable energy investment increases significantly when energy consumption intensity is high, but bank credit is more restrictive, and the degree of economic growth is below the threshold. Both cash subsidies and tax incentives can encourage renewable energy investment, with tax incentives having a greater impact. Overall, government subsidies are the main driver of renewable energy firms.
Another expression of RE in energy businesses is a financial limitation. Energy companies face three types of financial constraints: loan financing, equity financing, and internal financing. Short-term liabilities, according to Cutillas and Sánchez (2014), can prevent businesses from making unproductive investments [48]. Enterprises’ expansion initiatives are directly hampered by financial restrictions [37]. The most significant impediment to the development of SMEs is the absence of funding channels; high financing costs and lack of professional advice are the main obstacles to external financing [49]. Access to funding is a crucial growth restriction for SMEs, according to Beck and Demirguc-Kunt (2006), and financial and legal institutions play a key role in alleviating this limitation [50]. Ferris et al. (2017) found that social capital lowered the cost of equity borrowing using data from 1999 to 2012 [51]. Information asymmetry and the agency problem are reduced as a result of social relationships, lowering the cost of equity. Hypothesis 2 is offered based on the preceding discussion:
Hypothesis 2 (H2).
A positive relationship exists between resource endowment and long-term growth.

2.3. The Role of Resource Endowment (RE) in Mediating the Connection between Environmental Regulations (ERs) and Sustainable Growth (SG)

According to Yang and Song (2019), the link between ERs and the “resource curse” is inverted U-shaped, and the “resource curse” can only be broken when the ERs’ intensity passes the turning point [19]. In complete samples, ERs can also break the “resource curse” issue indirectly by increasing green technical innovation, reducing resource reliance, and speeding up enterprise development. Reducing financing constraints and implementing government subsidies are one of the main sources of RE for energy firms. Financial and tax assistance are the key way for SG of firms in nations with excellent renewable energy development [52,53]. RE has the potential to not only assist the long-term growth of energy businesses, but also to achieve the government’s environmental policy objectives. Environmental management and debt finance, according to Xu and Chen (2020), have a good association with firm sustainability [54]. When businesses have less social capital, such as government subsidies and limited funding, their growth is constrained to some extent. The impact of ERs on business SG will be readily apparent at this time. The better the RE, the less influenced by Ers it is, reducing the impact of Ers on the SG of businesses and promoting their long-term development.
In addition, this paper reviews in the literature review the findings of the effect of ERs on factors such as CO2 emissions, firm structure, and SG in different research contexts in different literature. Based on the results of existing studies, the hypotheses to be tested in this paper are presented:
Hypothesis 3a (H3a).
With the increased resource endowment, the impact of environmental regulation on sustainable growth will be weakened.
Hypothesis 3a (H3b).
With the decreased resource endowment, the impact of environmental regulation on sustainable growth will be strengthened.

3. Research Methodology

3.1. Modeling

The experimental analysis in this paper is based on the following theoretical framework, as shown in Figure 1.
First, the paper tests the effects of environmental regulations and resource endowments on sustainable growth using the following model:
S G i t = α 0 + α 1 E R i t + α 2 R E i t + α 3 C t r l i t + θ i t
C t r l i t = A T i t + H H I i t + F D I i t + F S i t + L E V i t + P P E i t
To measure the impact of environmental regulation on sustainable growth under the moderating effect of resource endowments, Equations (1) and (2) are further extended in this paper as follows.
S G i t = β 0 + β 1 R E i t + β 2 C t r l   i t + μ i t
S G i t = γ 0 + γ 1 E R i t + γ 2 R E i t + γ 3 E R i t × R E i t + γ 4 C t r l i t + ε i t
where Equation (3) measures the effect of resource endowment per se on sustainable growth, and Equation (4) measures the effect of resource endowment on the relationship between environmental regulation and sustainable growth. Where i and t stand for listed businesses and time periods, respectively. The dependent variable SG stands for long-term growth. Environmental regulation is represented by ERs, resource endowment is represented by RE, and the moderating influence of resource endowment on environmental regulation and sustainable growth is represented by ER × RE. We have also added some important control variables represented by Ctrl, such as asset turnover (AT), the Herfindahl–Hirschman Index (HHI), foreign direct investment (FDI), firm size (FS), leverage (LEV), property, plant, and equipment (PPE), etc.
α 0 , β 0 and γ 0 are constant term. α 1 ,   α 2 ,   α 3 , β 1 ,   β 2 ,   β 3 and γ 1 ,   γ 2 ,   γ 3 ,   γ 4 are estimated coefficients of the independent variable, the moderator variable, and the cross multiplication of the independent variable and the moderator variable, respectively. θ i t , μ i t and ε i t represent the random disturbance terms. In this paper, the panel data model is used to estimate the coefficients.

3.2. Variables

3.2.1. Sustainable Growth (SG)

Sustainable growth (SG) is the result of a set of activities in the business process, including two dimensions: sustainable business growth potential, and sustainable business profitability. The capital approach to sustainable growth is known to be useful in explaining sustainable development.
This paper uses the sustainable growth rate as proposed by Javeed et al. (2020b) to measure SG [14].

3.2.2. Environmental Regulations (ERs)

Referring to Liu et al. (2018), environmental regulations are government-initiated environmental protection measures that are universally applicable to all businesses; this paper breaks down environmental regulations from three perspectives: economic, legal, and supervisory [4].
(1)
Economical environmental regulation (ERA): ERA refers to the use of economic tools to reduce or eliminate negative external consequences produced by pollution and is a voluntary regulation. The ERA is represented in this article by the overall investment share of industrial added value in pollution control.
(2)
Legal environmental regulation (ERB): ERB refers to a set of severe restrictions that limit the production and administration of businesses in order to safeguard the environment; this is a market-based regulation. If a company violates environmental regulations, the government can apply administrative fines. As an alternative indication of ERB, we use the number of administrative penalty cases involving the environment.
(3)
Supervised environmental regulation (ERC): ERC refers to government departments’ oversight of environmental contamination, forcing businesses to enhance current equipment and technology in order to achieve cleaner output, and is command-and-control regulation. The number of environmental protection agencies at the end of each year is used as a proxy variable for ERC in this study.

3.2.3. Resource Endowment (RE)

In this paper, based on the studies of Xu et al. (2019) and Mtaturu (2020), the resource endowment of firms is divided into five areas based on the source of resources: government, and financing institutions such as banks, suppliers, customers, and other firms [55,56]. In addition, for the aspect quantitative analysis, this paper uses the data of government subsidy income, short-term loans, accounts payable, accounts receivable, and long-term equity investment of enterprises to represent the resource endowment of these five aspects respectively. Different basic index weights were assigned using the principal component analysis (PCA) approach, and the composite index RE was created.

3.2.4. Control Variables

Both the influence on RE and TIE should be considered while selecting control variables. AT, HHI, FDI, FS, LEV, and PPE are used as control variables in this study (Hille et al., 2020) [57]. The definitions of variables, statistical descriptions of the variables, and correlation analyses are shown in Table 1, Table 2 and Table 3, respectively.

4. Empirical Analysis

4.1. Data Source

The data for 91 renewable energy businesses were chosen for this study. The China Statistical Yearbook and the RESSET database provided data for ER (ERA, ERB, and ERC), while the CSMAR database provided data for RE and the WIND database provided data for SG. The CSMAR database was used to obtain data for the control variables. Interpolation was employed to supplement the data due to a lack of data for particular REs. All data were tested for stability to determine that they are stationary.

4.2. Fitting Results for Hypothesis 1

The results of the empirical calculations around Hypothesis 1 are shown in Table 4. The Hausman test values for models were 19.27, 18.98, and 21.32, respectively, at the 1% significance level, thus allowing the FE regression to be selected. Specifically, the FE regression for model 1 shows a coefficient value of 0.019 for the ERA term at the 1% significance level and a coefficient value of 0.273 for the ERA term at the 1% significance level in the GMM regression. In the regression results for model 2, the ERB term has a coefficient value of −0.3 at the 1% significance level in the FE regression and a coefficient value of 0.165 in the GMM regression. The coefficient value was 0.165. The coefficient of the ERC term in the FE regression of model 3 is 0.038 at the 1% level of significance, and in the GMM regression, the coefficient of the ERC term is 0.054 at the 1% level of significance. In summary, the results show that the economy, law, and supervision of environmental regulation all contribute to sustainable development, so Hypothesis 1 holds. Among, them ERA has the most significant contribution to SG compared to ERB and ERC.

4.3. Fitting Results for Hypothesis 2

The results of the empirical calculations around Hypothesis 2 are shown in Table 5. Overall, the Hausman test values for Models 1, 2, and 3 were 21.22, 20.19, and 18.99 at the 1% significance level, respectively, indicating that the FE regression could be chosen. Specifically, in Model 1, the RE term has a coefficient of 0.414 in the FE regression and 0.284 in the GMM regression at the 10% significance level, indicating that RE has a significant contribution to SG. The paper then divides RE into SOEs and non-SOEs, which are analyzed in Model 2 and Model 3, respectively. According to Model 2 for SOEs, RE has a coefficient of 0.389 in the FE regression and 0.179 in the GMM regression at the 10% significance level. According to the results of Model 3 for non-SOEs, the RE term has a coefficient of 0.402 in the FE regression and 0.277 in the GMM regression at the 10% significance level. In summary, the results can be that Hypothesis 2 holds and the contribution of resource endowment to RE firms is more significant in non-state-owned firms.

4.4. Fitting Results for Hypothesis 3

The results of the empirical calculations around Hypothesis 3 are shown in Table 6. This paper determines the effect of RE on the relationship between ER and SG by measuring the interaction term between ER and RE. Overall, the Hausman test values for Models 1, 2, and 3 were 28.08, 21.67, and 20.59, respectively, at the 1% significance level, allowing for the choice of FE regression. Specifically, in Model 1, the ERA × RE term has a coefficient of −0.016 for the FE regression and −0.31 for the GMM regression at the 5% level of significance. Model 2 shows that the ERB × RE term has a coefficient of −0.007 for the FE regression and −0.259 for the GMM regression at the 1% level of significance. Model 3 has the ERC × RE term at the 5% level of significance. In summary, Hypothesis 3 holds that RE is able to inhibit the facilitative effect between ER and SG, and RE has the most pronounced inhibitory effect on ERA and SG compared to ERB and ERC.

4.5. Robustness Test

To ensure that the empirical findings are accurate, this paper instead measures SG using ROE (Cao and Wang, 2017; Song and Wang, 2018) [58,59]. The association between ER, RE, and SG is then measured again and the test results are shown in Table 7. Models 1, 2, and 3 measured the relationship between ERA, ERB, ERC, and SG, respectively, and the results showed that the coefficients of the ERA, ERB, and ERC terms were 0.216, 0.224, and 0.219, respectively, at the 5% level of significance. The relationship between the interaction terms of the ER series variables and RE variables on SG was measured in Models 4, 5, and 6, respectively, and the results showed that at the 5% level of significance the coefficients of the ERA × RE, ER × RE, and ERC × RE terms are −0.298, −0.344, and −0.316, respectively. In summary, it can be seen that the results of the robustness tests are basically consistent with the previous empirical results and the empirical findings are stable and valid.

5. Conclusions and Policy Recommendations

This paper studied the relationships between environmental regulation, resource endowment, and sustainable growth by using a fixed-effects model and system GMM method, and the research sample is the panel data of new energy enterprises from 2010 to 2019. This paper focuses on the impact of environmental regulation on the sustainable growth of Chinese renewable energy enterprises, and introduced resource endowment to examine its moderating effects. After empirical analysis, we obtained the following conclusions: economical environmental regulations, legal environmental regulations, and supervised environmental regulations are positively associated with sustainable growth. Compared with legal environmental regulations and supervised environmental regulations, economic environmental regulations have the greatest impact on sustainable growth. The resource endowment is positively associated with sustainable growth, especially for non-state-owned renewable energy enterprises, and resource endowment plays a moderating role between environmental regulations and sustainable growth. Furthermore, resource endowment has the greatest moderating effect on the relationship between economical environmental regulations and sustainable growth. According to the above conclusion, we propose the following suggestions.
The first one is based on the effectiveness of economic environment regulations. Economic environmental regulations intuitively discourage the consumption of traditional energy sources and promote the development of renewable energy from an economic perspective. Governments can implement flexible and effective economic policies that take into account local conditions, such as increasing taxes on traditional energy sources while providing policy subsidies and tax incentives for renewable energy. By reducing the financial pressure on renewable energy companies, new energy innovations can be promoted to achieve sustainable growth.
Secondly, based on the effectiveness of legal environmental regulations. The use of traditional energy sources inevitably leads to the consumption of environmental resources and environmental pollution. For government policies, on the one hand, through the establishment of a sound legal environmental regulation system, the use of traditional energy sources and the treatment and discharge of pollution can be regulated in order to curb the consumption of natural resources and mitigate environmental pollution. On the other hand, legal environmental regulations are also conducive to the management of renewable energies, as they regulate the research and development and production of renewable energies and promote the sustainable growth of new energy enterprises.
Thirdly, based on the effectiveness of supervisory environmental regulations. Strict and effective regulation, based on sound laws and regulations, can ensure that legal provisions are implemented. For example, strict monitoring of energy consumption and the treatment and discharge of pollutants by energy companies can effectively force traditional energy companies to transform and promote technological progress in the field of new energy. Thus, strengthening supervisory environmental regulation is beneficial to the sustainable growth of renewable energy companies.
Fourth, based on the effectiveness of resource endowment. Environmental endowments are inherently conducive to sustainable growth, so governments should actively guide energy companies to develop and build local resources with local characteristics, and sufficient environmental resources to ensure sustainable growth. However, given the ‘resource curse’ effect, local energy development should not be overly dependent on the benefits of environmental endowments and should focus on the long-term benefits of renewable energy. In addition, as resource endowments have a negative impact on the influence of environmental regulations, as resource endowments increase, the role of environmental regulation in sustainable growth decreases. Therefore, government departments should be fully aware of the contradictions between resource endowments and environmental regulation, and the link between resource endowment and environmental regulation should be better coordinated. For example, for traditional energy sources, environmental regulations should be strengthened to avoid the “resource curse” brought about by overly strong resource endowments, while for renewable energy enterprises, resource endowments can be moderately strengthened through the creation of a favorable financing environment and research environment to promote sustainable growth. Whether starting from an environmental regulatory perspective or a resource endowment perspective, the final goal is to curb traditional energy sources and promote renewable energy development so as to achieve sustainable growth. The government should be fully aware that technological development is the basic driver of sustainable growth, reasonably integrating the local environmental and social resources, enhancing resource-use efficiency, and encouraging scientific and technological research and development so as to achieve sustainable growth.

Author Contributions

Methodology, H.Z.; Writing—original draft, H.H.C.; Data curation, K.L.; Writing—review & editing, Z.R. All authors have read and agreed to the published version of the manuscript.

Funding

This research received no external funding.

Institutional Review Board Statement

Not applicable.

Informed Consent Statement

Not applicable.

Data Availability Statement

Not applicable.

Conflicts of Interest

The authors declare that they have no known competing financial interests or personal relationships that could have appeared to influence the work reported in this paper.

References

  1. Iram, R.; Zhang, J.; Erdogan, S.; Abbas, Q.; Mohsin, M. Economics of energy and environmental efficiency: Evidence from OECD countries. Environ. Sci. Pollut. Res. 2020, 27, 3858–3870. [Google Scholar] [CrossRef]
  2. Wang, J.; Wang, S.; Li, S.; Feng, K. Coupling analysis of urbanization and energy-environment efficiency: Evidence from Guangdong province. Appl. Energy 2019, 254, 113650. [Google Scholar] [CrossRef]
  3. Ren, S.; Li, X.; Yuan, B.; Li, D.; Chen, X. The effects of three types of environmental regulation on eco-efficiency: A cross-region analysis in China. J. Clean. Prod. 2018, 173, 245–255. [Google Scholar] [CrossRef]
  4. Liu, Y.; Li, Z.; Yin, X. Environmental regulation, technological innovation and energy consumption—A cross-region analysis in China. J. Clean. Prod. 2018, 203, 885–897. [Google Scholar] [CrossRef]
  5. Telle, K.; Larsson, J. Do environmental regulations hamper productivity growth? How accounting for improvements of plants’ environmental performance can change the conclusion. Ecol. Econ. 2007, 61, 438–445. [Google Scholar] [CrossRef]
  6. Xie, R.-H.; Yuan, Y.-J.; Huang, J.-J. Different Types of Environmental Regulations and Heterogeneous Influence on “Green” Productivity: Evidence from China. Ecol. Econ. 2017, 132, 104–112. [Google Scholar] [CrossRef]
  7. Wang, Y.; Deng, X.; Zhang, H.; Liu, Y.; Yue, T.; Liu, G. Energy endowment, environmental regulation, and energy efficiency: Evidence from China. Technol. Forecast. Soc. Change 2022, 177, 121528. [Google Scholar] [CrossRef]
  8. Fu, T.; Cai, C.; Jian, Z. The illusion of “win–win” solution: Why environmental regulation in china promotes firm performance? Struct. Change Econ. Dyn. 2020, 52, 366–373. [Google Scholar] [CrossRef]
  9. Shuai, S.; Fan, Z. Modeling the role of environmental regulations in regional green economy efficiency of China: Empirical evidence from super efficiency DEA-Tobit model. J. Environ. Manag. 2020, 261, 110227. [Google Scholar] [CrossRef]
  10. Elkington, J. Towards the Sustainable Corporation: Win-Win-Win Business Strategies for Sustainable Development. Calif. Manag. Rev. 1994, 36, 90–100. [Google Scholar] [CrossRef]
  11. Das, M.; Rangarajan, K.; Dutta, G. Corporate sustainability in SMEs: An Asian perspective. J. Asia Bus. Stud. 2020, 14, 109–138. [Google Scholar] [CrossRef]
  12. Salzmann, O.; Ionescu-Somers, A.; Steger, U. The Business Case for Corporate Sustainability: Literature Review and Research Options. Eur. Manag. J. 2005, 23, 27–36. [Google Scholar] [CrossRef]
  13. Engert, S.; Rauter, R.; Baumgartner, R.J. Exploring the integration of corporate sustainability into strategic management: A literature review. J. Clean. Prod. 2016, 112, 2833–2850. [Google Scholar] [CrossRef]
  14. Javeed, S.A.; Latief, R.; Lefen, L. An analysis of relationship between environmental regulations and firm performance with moderating effects of product market competition: Empirical evidence from Pakistan. J. Clean. Prod. 2020, 254, 120197. [Google Scholar] [CrossRef]
  15. Curtis, E.M.; Lee, J.M. When do environmental regulations backfire? Onsite industrial electricity generation, energy efficiency and policy instruments. J. Environ. Econ. Manag. 2019, 96, 174–194. [Google Scholar] [CrossRef]
  16. Zhai, X.; An, Y. Analyzing influencing factors of green transformation in China’s manufacturing industry under environmental regulation: A structural equation model. J. Clean. Prod. 2020, 251, 119760. [Google Scholar] [CrossRef]
  17. Mickiewicz, T.; Nyakudya, F.W.; Theodorakopoulos, N.; Hart, M. Resource endowment and opportunity cost effects along the stages of entrepreneurship. Small Bus. Econ. 2017, 48, 953–976. [Google Scholar] [CrossRef] [Green Version]
  18. Wang, S.; Wang, X.; Lu, B. Is resource abundance a curse for green economic growth? Evidence from developing countries. Resour. Policy 2022, 75, 102533. [Google Scholar] [CrossRef]
  19. Yang, Q.; Song, D. How does environmental regulation break the resource curse: Theoretical and empirical study on China. Resour. Policy 2019, 64, 101480. [Google Scholar] [CrossRef]
  20. Song, Y.; Li, G.; Wang, Q.; Meng, X.; Wang, H. Scenario analysis on subsidy policies for the uptake of electric vehicles industry in China. Resour. Conserv. Recycl. 2020, 161, 104927. [Google Scholar] [CrossRef]
  21. Söderblom, A.; Samuelsson, M.; Wiklund, J.; Sandberg, R. Inside the black box of outcome additionality: Effects of early-stage government subsidies on resource accumulation and new venture performance. Res. Policy 2015, 44, 1501–1512. [Google Scholar] [CrossRef]
  22. Lu, J.; Li, B.; Li, H.; Zhang, Y. Sustainability of enterprise export expansion from the perspective of environmental information disclosure. J. Clean. Prod. 2020, 252, 119839. [Google Scholar] [CrossRef]
  23. Wu, L.; Sun, L.; Qi, P.; Ren, X.; Sun, X. Energy endowment, industrial structure upgrading, and CO2 emissions in China: Revisiting resource curse in the context of carbon emissions. Resour. Policy 2021, 74, 102329. [Google Scholar] [CrossRef]
  24. Wang, Q.; Wang, L.; Li, R. Renewable energy and economic growth revisited: The dual roles of resource dependence and anticorruption regulation. J. Clean. Prod. 2022, 337, 130514. [Google Scholar] [CrossRef]
  25. Eiadat, Y.; Kelly, A.; Roche, F.; Eyadat, H. Green and competitive? An empirical test of the mediating role of environmental innovation strategy. J. World Bus. 2008, 43, 131–145. [Google Scholar] [CrossRef]
  26. López-Gamero, M.D.; Molina-Azorín, J.F.; Claver-Cortés, E. The potential of environmental regulation to change managerial perception, environmental management, competitiveness and financial performance. J. Clean. Prod. 2010, 18, 963–974. [Google Scholar] [CrossRef]
  27. Pargal, S.; Wheeler, D. Informal Regulation of Industrial Pollution in Developing Countries: Evidence from Indonesia. J. Political Econ. 1996, 104, 1314–1327. [Google Scholar] [CrossRef]
  28. Li, R.; Ramanathan, R. Exploring the relationships between different types of environmental regulations and environmental performance: Evidence from China. J. Clean. Prod. 2018, 196, 1329–1340. [Google Scholar] [CrossRef]
  29. Wang, X.; Shao, Q. Non-linear effects of heterogeneous environmental regulations on green growth in G20 countries: Evidence from panel threshold regression. Sci. Total Environ. 2019, 660, 1346–1354. [Google Scholar] [CrossRef]
  30. Wang, Y.; Yan, W.; Ma, D.; Zhang, C. Carbon emissions and optimal scale of China’s manufacturing agglomeration under heterogeneous environmental regulation. J. Clean. Prod. 2018, 176, 140–150. [Google Scholar] [CrossRef]
  31. Song, M.; Wang, S.; Sun, J. Environmental regulations, staff quality, green technology, R&D efficiency, and profit in manufacturing. Technol. Forecast. Soc. Change 2018, 133, 1–14. [Google Scholar] [CrossRef]
  32. Zheng, T.; Zhao, Y.; Li, J. Rising labour cost, environmental regulation and manufacturing restructuring of Chinese cities. J. Clean. Prod. 2019, 214, 583–592. [Google Scholar] [CrossRef]
  33. Zhao, X.; Fan, Y.; Fang, M.; Hua, Z. Do environmental regulations undermine energy firm performance? An empirical analysis from China’s stock market. Energy Res. Soc. Sci. 2018, 40, 220–231. [Google Scholar] [CrossRef]
  34. Yuan, B.; Zhang, Y. Flexible environmental policy, technological innovation and sustainable development of China’s industry: The moderating effect of environment regulatory enforcement. J. Clean. Prod. 2020, 243, 118543. [Google Scholar] [CrossRef]
  35. Ramanathan, R.; He, Q.; Black, A.; Ghobadian, A.; Gallear, D. Environmental regulations, innovation and firm performance: A revisit of the Porter hypothesis. J. Clean. Prod. 2017, 155, 79–92. [Google Scholar] [CrossRef] [Green Version]
  36. Dasgupta, S.; Laplante, B.; Mamingi, N.; Wang, H. Inspections, pollution prices, and environmental performance: Evidence from China. Ecol. Econ. 2001, 36, 487–498. [Google Scholar] [CrossRef]
  37. Zhou, X.; Feng, C. The impact of environmental regulation on fossil energy consumption in China: Direct and indirect effects. J. Clean. Prod. 2017, 142, 3174–3183. [Google Scholar] [CrossRef]
  38. Auty Richard, M. Sustaining Development in Mineral: The Resources Curse Thesis; Taylor & Francis Group: Abingdon, UK, 1993. [Google Scholar]
  39. Badeeb, R.A.; Lean, H.H.; Clark, J. The evolution of the natural resource curse thesis: A critical literature survey. Resour. Policy 2017, 51, 123–134. [Google Scholar] [CrossRef]
  40. Hilmawan, R.; Clark, J. An investigation of the resource curse in Indonesia. Resour. Policy 2019, 64, 101483. [Google Scholar] [CrossRef] [Green Version]
  41. Barney, J.B. Resource-based theories of competitive advantage: A ten-year retrospective on the resource-based view. J. Manag. 2001, 27, 643–650. [Google Scholar] [CrossRef]
  42. Barney, J. Firm resources and sustained competitive advantage. J. Manag. 1991, 17, 99–120. [Google Scholar] [CrossRef]
  43. Chakravarty, S.; Scott, J.S. Relationships and Rationing in Consumer Loans. J. Bus. 1999, 72, 523–544. [Google Scholar] [CrossRef]
  44. Peng, H.; Liu, Y. How government subsidies promote the growth of entrepreneurial companies in clean energy industry: An empirical study in China. J. Clean. Prod. 2018, 188, 508–520. [Google Scholar] [CrossRef]
  45. Claro, S. Supporting inefficient firms with capital subsidies: China and Germany in the 1990s. J. Comp. Econ. 2006, 34, 377–401. [Google Scholar] [CrossRef]
  46. Hu, A.G. Ownership, government R&D, private R&D, and productivity in Chinese industry. J. Comp. Econ. 2001, 29, 136–157. [Google Scholar] [CrossRef]
  47. Yang, X.; He, L.; Xia, Y.; Chen, Y. Effect of government subsidies on renewable energy investments: The threshold effect. Energy Policy 2019, 132, 156–166. [Google Scholar] [CrossRef]
  48. Cutillas Gomariz, M.F.; Sánchez Ballesta, J.P. Financial reporting quality, debt maturity and investment efficiency. J. Bank. Financ. 2014, 40, 494–506. [Google Scholar] [CrossRef] [Green Version]
  49. Wang, Y. What are the biggest obstacles to growth of SMEs in developing countries?—An empirical evidence from an enterprise survey. Borsa Istanb. Rev. 2016, 16, 167–176. [Google Scholar] [CrossRef] [Green Version]
  50. Beck, T.; Demirguc-Kunt, A. Small and medium-size enterprises: Access to finance as a growth constraint. J. Bank. Financ. 2006, 30, 2931–2943. [Google Scholar] [CrossRef]
  51. Ferris, S.P.; Javakhadze, D.; Rajkovic, T. CEO social capital, risk-taking and corporate policies. J. Corp. Financ. 2017, 47, 46–71. [Google Scholar] [CrossRef]
  52. Fan, Y.; Zhu, L. A real options based model and its application to China’s overseas oil investment decisions. Energy Econ. 2010, 32, 627–637. [Google Scholar] [CrossRef]
  53. Driouchi, T.; Bennett, D.J. Real Options in Management and Organizational Strategy: A Review of Decision-making and Performance Implications. Int. J. Manag. Rev. 2012, 14, 39–62. [Google Scholar] [CrossRef] [Green Version]
  54. Xu, X.-L.; Chen, H.H. Exploring the relationships between environmental management and financial sustainability in the energy industry: Linear and nonlinear effects. Energy Environ. 2020, 31, 1281–1300. [Google Scholar] [CrossRef]
  55. Xu, H.; Jilenga, M.T.; Deng, Y. Institutional Quality, Resource Endowment, and Economic Growth: Evidence from Cross-Country Data. Emerg. Mark. Financ. Trade 2019, 55, 1754–1775. [Google Scholar] [CrossRef]
  56. Mtaturu, J. Foreign Direct Investment Inflows to Sub Saharan Africa: Do Resource Endowment and Market Size Matter? Bus. Educ. J. 2020, 4, 1–12. [Google Scholar]
  57. Hille, E.; Althammer, W.; Diederich, H. Environmental regulation and innovation in renewable energy technologies: Does the policy instrument matter? Technol. Forecast. Soc. Change 2020, 153, 119921. [Google Scholar] [CrossRef] [Green Version]
  58. Cao, B.; Wang, S. Opening up, international trade, and green technology progress. J. Clean. Prod. 2017, 142, 1002–1012. [Google Scholar] [CrossRef]
  59. Song, M.; Wang, S. Market competition, green technology progress and comparative advantages in China. Manag. Decis. 2018, 56, 188–203. [Google Scholar] [CrossRef]
Figure 1. Conceptual framework.
Energies 15 04678 g001
Table 1. Variables and definitions.
Variable AbbreviationsDefinition Description
Dependent Variable
Sustainable growthSGPM × (1 − D) × (1 + L)/(T − (PM × (1 − D) × (1 + L)))
Independent Variables
Economical environmental regulationERAThe ratio of environmental pollution treatment investment to the industrial added value
Legal environmental regulationERBThe number of year-end administrative penalty cases on the environment
Supervised environmental regulationERCThe number of year-end environmental protection agencies
Resource endowmentREThe principal component analysis
Control Variables
Asset turnoverATRatio of total sales to total asset
Herfindahl–Hirschman IndexHHIThe HHI of industry
Foreign direct investmentFDIRatio between foreign direct investment and GDP
Firm SizeFSNatural logarithm of total assets
LeverageLEVRatio of total liabilities to total assets
Property, Plant, and EquipmentPPERatio of property, plant, and equipment to total sales
Table 2. Descriptive statistics of variables.
VariablesObsMeanStd. Dev.MinMax
SG8820.0560.142−0.6730.491
ERA8820.0600.0470.0140.246
ERB88211.361.0988.61713.61
ERC8829.3590.6897.40310.22
RE88210.621.5597.19914.24
AT8820.3900.2380.0441.462
HHI8820.0650.0080.0520.076
FDI8827.1821.3733.8669.864
FS88222.781.42520.1926.34
LEV8820.5630.2000.0510.941
PPE88221.771.79615.8625.94
Table 3. Correlation analysis of variables.
VariablesSGERAERBERCREATHHIFDIFSLEVPPE
SG1
ERA−0.0151
ERB−0.003−0.338 ***1
ERC0.011−0.229 ***0.251 ***1
RE0.0500.095 ***0.004−0.300 ***1
AT0.048−0.062 *−0.069 **0.074 **−0.125 ***1
HHI0.022−0.0200.087 ***−0.075 **−0.119 ***0.181 ***1
FDI−0.047−0.462 ***0.635 ***0.191 ***−0.088 ***−0.0040.297 ***1
FS0.140 ***0.141 ***0.010−0.278 ***0.900 ***−0.257 ***0.206 ***0.150 ***1
LEV0.175 ***0.165 ***0.203 ***−0.217 ***0.481 ***−0.0220.086 **0.362 ***0.413 ***1
PPE0.098 ***0.166 ***0.095 ***−0.232 ***0.772 ***−0.206 ***0.163 ***0.238 ***0.882 ***0.472 ***1
Note: *** p < 0.01, ** p < 0.05, * p < 0.1.
Table 4. Measurement results of the relationship between ER and SG.
VariablesModel 1Model 2Model 3
FEGMMFEGMMFEGMM
ERA0.019 ***0.273 ***
ERB 0.300 ***0.165 ***
ERC 0.038 ***0.054 ***
AT0.120 **0.092 *0.120 **−0.029 *0.126 **0.089 *
HHI2.5361.5052.5231.0012.5962.268
FDI−0.011−0.001−0.010−0.005−0.013−0.005
FS0.057 ***0.068 *0.057 ***−0.0160.057 ***0.040 *
LEV−0.396 ***−0.116−0.396 ***−0.379 ***−0.388 ***−0.222
PPE−0.0060.003 *−0.0050.004 *−0.0060.005 *
C−1.048 *−0.971 **−1.018 *−2.178−1.381 **1.211
R20.321 0.452 0.476
Hausman test19.27 *** 18.98 *** 21.32 ***
Arellano–Bond test
AR (1) 0.051 0.036 0.027
AR (2) 0.427 0.432 0.733
Sargan test 0.913 0.907 0.946
Observations790790790790790790
Number of id919191919191
Note: *** p < 0.01, ** p < 0.05, * p < 0.1.
Table 5. Measurement results of the relationship between RE and SG.
VariablesModel 1Model 2Model 3
FEGMMFEGMMFEGMM
RE0.414 *0.284 **0.389 *0.179 *0.402 *0.277 *
AT0.679 **1.021 **1.089 ***2.315 *0.857 ***2.299 **
HHI0.024 *0.1260.0260.1870.0290.154 *
FDI−0.093−0.105 *−0.087−0.127−0.089 **−0.166
FS0.209 **0.106 *0.2330.1760.2310.119 *
LEV−0.325−0.421−0.450−0.298 *−0.312−0.206 **
PPE0.546 *0.2190.444 *0.3980.590 *0.265
C1.508 *0.8823.001 *0.8322.098 *0.891
R20.545 0.547 0.550
Hausman test21.22 *** 20.19 *** 18.99 ***
Arellano–Bond test
AR (1) 0.039 0.027 0.025
AR (2) 0.593 0.642 0.589
Sargan test 0.899 0.915 0.907
Observations790790588588202202
Number of id919166662525
Note: *** p < 0.01, ** p < 0.05, * p < 0.1.
Table 6. Measurement results of the relationship between ER and SG with moderating effect of RE.
VariablesModel 1Model 2Model 3
FEGMMFEGMMFEGMM
ERA0.011 **0.065 **
ERB 0.005 **0.072 **
ERC 0.037 ***0.180 **
RE0.020 **0.021 ***0.021 ***0.062 ***0.020 **0.133 ***
ERA × RE−0.016 **−0.310 **
ERB × RE −0.007 ***−0.259 ***
ERC × RE −0.012 **−0.312 **
AT0.126 **0.532 ***0.126 **0.561 ***0.126 **0.641 ***
HHI−4.152−7.343−3.967−7.483−3.823−7.591
FDI2.9155.0242.9185.1092.958 *5.336 *
FS0.076 ***0.678 ***0.076 ***0.725 ***0.074 ***0.702 ***
LEV−0.366 *−6.368 *−0.359 *−5.319 *−0.365 *−6.160 *
PPE−0.006 *−3.517−0.007−2.980−0.007−3.874
C−1.307 *−4.271 *−1.632 *−5.295 **−2.165 *−4.553 *
R20.449 0.453 0.446
Hausman test28.08 *** 21.67 *** 20.59 ***
Arellano–Bond test
AR (1) 0.060 0.051 0.059
AR (2) 0.588 0.546 0.607
Sargan test 0.919 0.923 0.904
Observations882882882882882882
Number of id919191919191
Note: *** p < 0.01, ** p < 0.05, * p < 0.1.
Table 7. Robustness test.
VariablesModel 1Model 2Model 3Model 4Model 5Model 6
GMMGMMGMMGMMGMMGMM
ERA0.216 *** 0.358 ***
ERB 0.224 *** 0.217 ***
ERC 0.219 ** 0.311 ***
RE0.258 **0.299 **0.287 **0.375 **0.402 ***0.395 ***
ERA × RE −0.298 **
ERB × RE −0.344 **
ERC × RE −0.316 **
AT0.172 *0.176 *0.178 *0.0980.0990.090
HHI5.5655.2845.223 *9.5178.346 *8.885 *
FDI0.1210.199 **0.124 **0.5480.8270.718
FS0.0490.0480.0499 *0.272 *0.286 **0.262 *
LEV−1.746 *−1.934 *−1.689 **−2.778 **−2.899 **−2.957 **
PPE0.0650.0670.068 *0.4210.398 *0.413
C7.169 **7.206 **7.308 **5.477 **6.103 **6.890 *
Arellano–Bond test
AR (1)0.0280.0360.0270.0350.0280.031
AR (2)0.3350.4010.3340.4020.3350.405
Sargan test0.8760.9070.8960.8990.9180.923
Observations882882882882882882
Number of id919191919191
Note: *** p < 0.01, ** p < 0.05, * p < 0.1.
Publisher’s Note: MDPI stays neutral with regard to jurisdictional claims in published maps and institutional affiliations.

