Article

Construction and Calibration of a Unique Hot Box Apparatus

by
Abdalhadi Alhawari
1,2 and
Phalguni Mukhopadhyaya
3,*
1
Department of Mechanical Engineering, University of Victoria, Victoria, BC V8P 3E6, Canada
2
Department of Mechanical Engineering, University of Tripoli, Tripoli 13275, Libya
3
Department of Civil Engineering, University of Victoria, Victoria, BC V8P 3E6, Canada
*
Author to whom correspondence should be addressed.
Energies 2022, 15(13), 4677; https://doi.org/10.3390/en15134677
Submission received: 13 May 2022 / Revised: 11 June 2022 / Accepted: 21 June 2022 / Published: 26 June 2022
(This article belongs to the Special Issue Building Energy Management: Materials, Modeling, and Components)

Abstract

:
A variety of mathematical models are available to estimate the thermal performance of buildings. Nevertheless, mathematical models predict the thermal performance of buildings that might differ from the actual performance. The hot box is a widely-used test apparatus to assess the actual thermal performance of various building envelope components (walls, roofs, windows) in the laboratory. This paper presents the process of designing, constructing, and calibrating a unique small-scale hot box apparatus. Despite its smaller metering area (1.0 m × 1.0 m), this apparatus met the key requirements (below ±0.25 °C fluctuations in chambers’ air temperature, and below 2.0% variation from the point-to-point temperature in reference to the temperature difference across the specimen) as prescribed in the ASTM C1363 and ISO 8990 standards. The walls of this apparatus are uniquely constructed using vacuum insulation panels or VIPs. The efficient and novel use of VIPs and workmanship during the construction of the apparatus are demonstrated through the temperature stability within the chambers. The achieved range of temperature steadiness below ±0.05 °C and point-to-point temperature variation below 1.0% of the temperature difference across the specimen allow for this apparatus to be considered unique among the calibrated hot box categories reported in the literature. In addition, having an affordable, simple-to-operate, and high-accuracy facility offers a great opportunity for researchers and practitioners to investigate new ideas and solutions. The apparatus was calibrated using two extruded polystyrene foam (XPS) specimens with thicknesses of 2″ and 4″. The calibration exercise indicates small differences between results obtained numerically, theoretically, and experimentally (below 3.0%). Ultimately, the apparatus was employed to measure the thermal properties of a specimen representing a lightweight steel framing (LSF) wall system, which is commonly used in cold climates. The results obtained experimentally were then compared to the ones estimated numerically using a 3D finite element modelling tool. The difference between the results obtained by both methods was below 9.0%.

1. Introduction and Background

Energy consumption in the building sector has increased significantly over time to meet the expected living standards of the occupants. In developed countries, 20% to 40% of the total energy consumption is consumed by the building sector [1,2]. Therefore, reducing building energy consumption will help meet the requirements of energy codes. Consequently, it will diminish the negative impacts associated with the energy production process, such as air pollution and global warming. For example, using high thermal resistive insulation materials in building envelopes and making buildings more airtight are the key steps to reducing the amount of energy consumed for heating and cooling processes. The appropriate selection of insulation materials/components and the determination of their representative thermal properties are critical steps toward constructing highly energy-efficient buildings.
Different approaches are employed to measure the thermal properties of the building envelope materials in the laboratory. The most common devices used to measure the thermal properties, in the case of one-dimensional heat flow, are the guarded hot plate (see ASTM C177 standard [3]) and the heat flow meter (see ASTM C518 standard [4]). However, there are some limitations to using these devices because they can be used only to test homogeneous building materials that can be represented by a small-size specimen. In the case of large-scale and nonhomogeneous building assemblies, hot box test apparatuses are employed to determine the thermal properties of such components. The hot boxes are used to measure the thermal performance of nonhomogeneous building components with multi-dimensional heat flows. More details and history of hot boxes are presented in the next paragraphs.
The concept of a hot box test apparatus was first introduced about a century ago in the USA [5]. The hot box was initially introduced as an analogous testing method to the guarded hot plate (Figure 1a), which is used to evaluate the thermal properties of homogeneous building materials [6]. Unlike the guarded hot plate, the hot box is used to test large-scale, homogeneous/non-homogeneous specimens, which represent building envelope assemblies. The hot box consists of two chambers, i.e., a metering chamber and a climate chamber, which, respectively, serve as indoor and outdoor environments. During hot box testing, the specimen is placed between the chambers, and heating and cooling systems are incorporated to create a steady temperature difference across the specimen. The hot box setups are typically classified under two categories: (1) calibrated hot box (Figure 1b), and (2) guarded hot box (Figure 1c). The major distinction between the two systems is the existence of a guarded chamber that surrounds the metering chamber in the case of the guarded hot box. The guarded chamber helps to maintain the difference in temperature between the metering and guarded chambers, keeping it very small so as to minimize the heat loss via the metering walls. In the case of the calibrated hot box, the surrounding environment is treated as a guarded chamber, and heat transfer through the metering walls needs to be measured. According to the ASTM C1363 standard, the calibrated hot box must be used when the area of specimens is smaller than the opening of the metering chamber, where a surrounding panel is needed. However, the guarded hot box is a suitable choice when the building element to be tested has an area larger than the opening of the metering chamber and is free of high-conductive elements that continue outside the opening of the metering chamber. It is to be noted that there are more studies with calibrated hot boxes reported in the literature than studies with guarded hot boxes [7].
The utility of laboratory tests with hot boxes was recognized by the building envelope designers/engineers/researchers, and several hot boxes were built to evaluate the thermal performance of different building components, including fenestration systems [8,9,10]. In the early 1970s, Mumaw [11] developed a large-size calibrated hot box facility to measure the properties of large-scale wall sections of areas up to 2.7 m by 4.2 m. Soon after, from the 1970s to the 1990s, numerous studies were published on the construction and calibration of hot box test apparatuses [12,13,14,15,16,17,18,19,20,21,22]. All of these publications were used as the basis for the ASTM C 1363 standard [23], which was first published in 1997 and was recently updated in 2019. In Europe, an identical standard, ISO 8990, was released in 1996 [24]. Both standards illustrate specific requirements that should be followed during the stages of construction and operation to obtain repeatable and representable results.

2. Literature Review

Due to our recent concern about the issues related to global warming [25], more regulations and policies have been introduced in building codes to boost the energy performance of building envelopes, which consequently helps to reduce the carbon footprints of buildings. One important criterion to ensure the requirements of building codes are met is accurately specifying and determining the thermal characteristics of building envelope materials/systems, and the guarded hot box test apparatus is routinely used for this purpose. Though hot box test apparatuses are usually available in commercial research laboratories [26,27,28,29], several thermal investigations have been performed using test facilities that are available in academic/university laboratories. In academic laboratories, hot boxes are usually distinct in size and structure, and are usually inexpensive and relatively simple and easy to operate. The following paragraphs present studies using hot box facilities in academic institutions, which are comparable to the hot box presented in this paper.
Asdrubali and Baldinelli [30] studied the accuracy of three different hot box standards (ISO 8990; ASTM C1363-05; and GOST 26602.1-99) using a calibrated hot box. The chamber walls of the hot box were constructed with an EPS (240 mm thick) inserted between two panels of wood (19 mm each) with an overall thermal resistance of 7.5 m2·K/W (R-42.3). The opening area of the apparatus was 2.7 m × 2.0 m and temperature fluctuation inside the chambers was lower than ±0.20 °C. A few years later, Ricciardi et al. [31] employed the same apparatus to investigate the thermal properties of two panels with an area of 1.23 m × 1.48 m that were made of waste paper (12 mm thick) and textile fibers (20 mm thick). The authors did not provide any information regarding temperature stability inside the chambers.
Seitz and MacDougall [32], at Queen’s University, Canada, designed and constructed a small-scale calibrated hot box. The size of the metering area was 1.18 m × 1.37 m and the apparatus was built to evaluate the thermal characteristics of non-conventional building materials such as a straw bale of a maximum thickness of 41 cm. The hot chamber was constructed using layers of expanded polystyrene coated by two layers of plywood of a total thickness of 130 mm. The total thermal resistance of the chamber wall was 2.91 m2·K/W (R-16.5). To provide a cold environment on the side of the specimen, an environmental chamber was employed. Air temperature variation from point to point was below 3.0 °C, and the air temperatures inside the chambers at steady state fluctuated within ±2.0 °C.
Buratti et al. [33,34] developed a small-scale calibrated hot box to evaluate the thermal conductivity of different coating materials. The testing facility consisted of a hot chamber and a test specimen frame with opening area of 0.46 m × 0.46 m. The hot chamber and the specimen frame were made of expanded polyurethane (200 mm thick) and two panels of wood (each of 20 mm thick). So, the total thermal resistance of the walls was 8.78 m2·K/W (R-50). The laboratory room was considered a cold chamber. During the test, the hot chamber air temperature fluctuated by about ±0.10 °C, and the specimen surface temperature varied within a range of 0.60 °C on the hot face and 0.40 °C on the cold face.
Alongi et al. [35] developed an apparatus at Politecnico of Milano, Italy to experimentally investigate the thermal behavior of air-permeable concrete specimens at different pressure differentials. The apparatus envelope/wall consisted of polystyrene panels protected by laminated panels on both sides (140 mm total thickness). The total thermal resistance of the apparatus wall was 4.35 m2·K/W (R-25). The maximum specimen area that could be tested in this apparatus was 1.0 m × 1.0 m and had a thickness of 33 cm. The design of this apparatus was different because authors were not only looking to investigate the thermal performance of tested samples under steady-state conditions, but also to study the impact of airflow through air-breathing wall samples. Thus, the apparatus was fitted with an air circulation system that controlled the velocity and direction of the airflow. The authors indicated that temperature fluctuation inside chambers was always within the range of ±0.30 °C.
Chowdhury and Neogi [36] investigated the thermal performance of common wall and roof constructions used in residential buildings in India using a guarded hot box facility. The facility was constructed according to the ISO 8990 standard. Extruded polystyrene insulation panels (250 mm thick) were used for chamber’s walls, which lead to a total thermal resistance of 8.80 m2·K/W (R-50). The dimensions of the apparatus’ metering chamber and metering area were 1.75 m × 1.50 m and 0.50 m × 0.50 m, respectively. The authors presented a detailed description of the apparatus calibration process and testing methodology. At steady state, temperature fluctuation within the chambers was about ±0.06 °C.
Barbaresi et al. [37] developed a prototype hot box for the preliminary assessment of thermal properties of wall elements and insulation panels at the University of Bologna, Italy. The apparatus was used to test a small specimen of a maximum area of 1.0 m × 1.0 m and consisted only of a hot chamber made of 100 mm of expanded polystyrene panels and a layer of wood with a total thermal resistance of 2.0 m2·K/W (R-11.5). The laboratory space was treated as a cold chamber. The temperature inside the hot chamber fluctuation was high, as presented in the graphs; however, the authors stated that the apparatus provided results with low error compared to the value measured by a guarded hot plate. Additionally, they mentioned that this apparatus can only be used for preliminary evaluations, not for certification purposes.
Shen et al. [38] constructed a small-scale hot box with a 355 mm × 355 mm metering area to establish a relationship of thermal properties between full-scale and scaled-down concrete sandwich wall panels. Whereas the full-scaled specimens were tested using the finite element method, the scaled-down specimens were tested in the hot box. The walls of the hot chamber were built of a layer of extruded polystyrene panel (25.4 mm thick) that was finished with a layer of plywood (19.1 mm thick). An insulation blanket layer was added to the outer surfaces to reduce the impact of temperature fluctuations in the laboratory. The apparatus was calibrated using an extruded polystyrene sample before testing the concrete sandwich wall panel; however, the degree of stability of the chamber’s temperature was not specified. The authors concluded that using a small-scale hot box is practicable and inexpensive, but it cannot replace full-scale hot box measurements.
Most recently, Tejeda et al. [39] and Boukhelf et al. [40] studied the hygrothermal behavior of different concrete wall systems. In both studies, small-scale hot boxes of the metering area of around 1.0 m × 1.0 m were incorporated to perform the experimental analysis. The chamber walls of both hot boxes were made of extruded polystyrene (50 mm thickness) that was coated by protection layers from both inside and outside. The first group reported that the temperature of the air inside the chambers fluctuated by below 1.0 °C, though the second group reported less temperature variation below 0.30 °C.
The present study introduces the construction and calibration processes of a unique small-scale calibrated hot box apparatus for academic research. A description of the apparatus and its components including the novel use of insulation materials in wall structures, and the calibration procedure of the apparatus using two extruded polystyrene foam panels of different thicknesses are presented. This apparatus is intended to be used for testing and validating various research questions. As a case study, a test specimen representing a lightweight steel frame (LSF) wall system (clear wall, i.e., wall area containing only insulation and necessary framing materials) was tested using this apparatus. Table 1 lists and compares the studies available in the published literature on hot boxes fabricated in academic research laboratories across the world, and also includes the recommendations provided by the relevant ASTM and ISO standards.
The table above (Table 1) presents a comparison between the hot box introduced in this study and the ones described in the relevant literature. The comparison was made considering five major characteristics: (1) the type of the apparatus, (2) the size of the apparatus and its metering area, (3) the type and thickness of the core insulation material used in the chamber walls, (4) the total thermal resistance of the chamber walls, and (5) the temperature stability inside the chambers. It is clear from Table 1 that the developed apparatus has thinner walls. It has also the highest thermal resistance due to the novel use of VIPs. Furthermore, the significant achievement of the apparatus is the high level of temperature stability within the chambers. The point-to-point air temperature variations and the maximum temperature fluctuations at steady state condition reported from this study were the lowest compared with the hot box constructions reported in the literature.

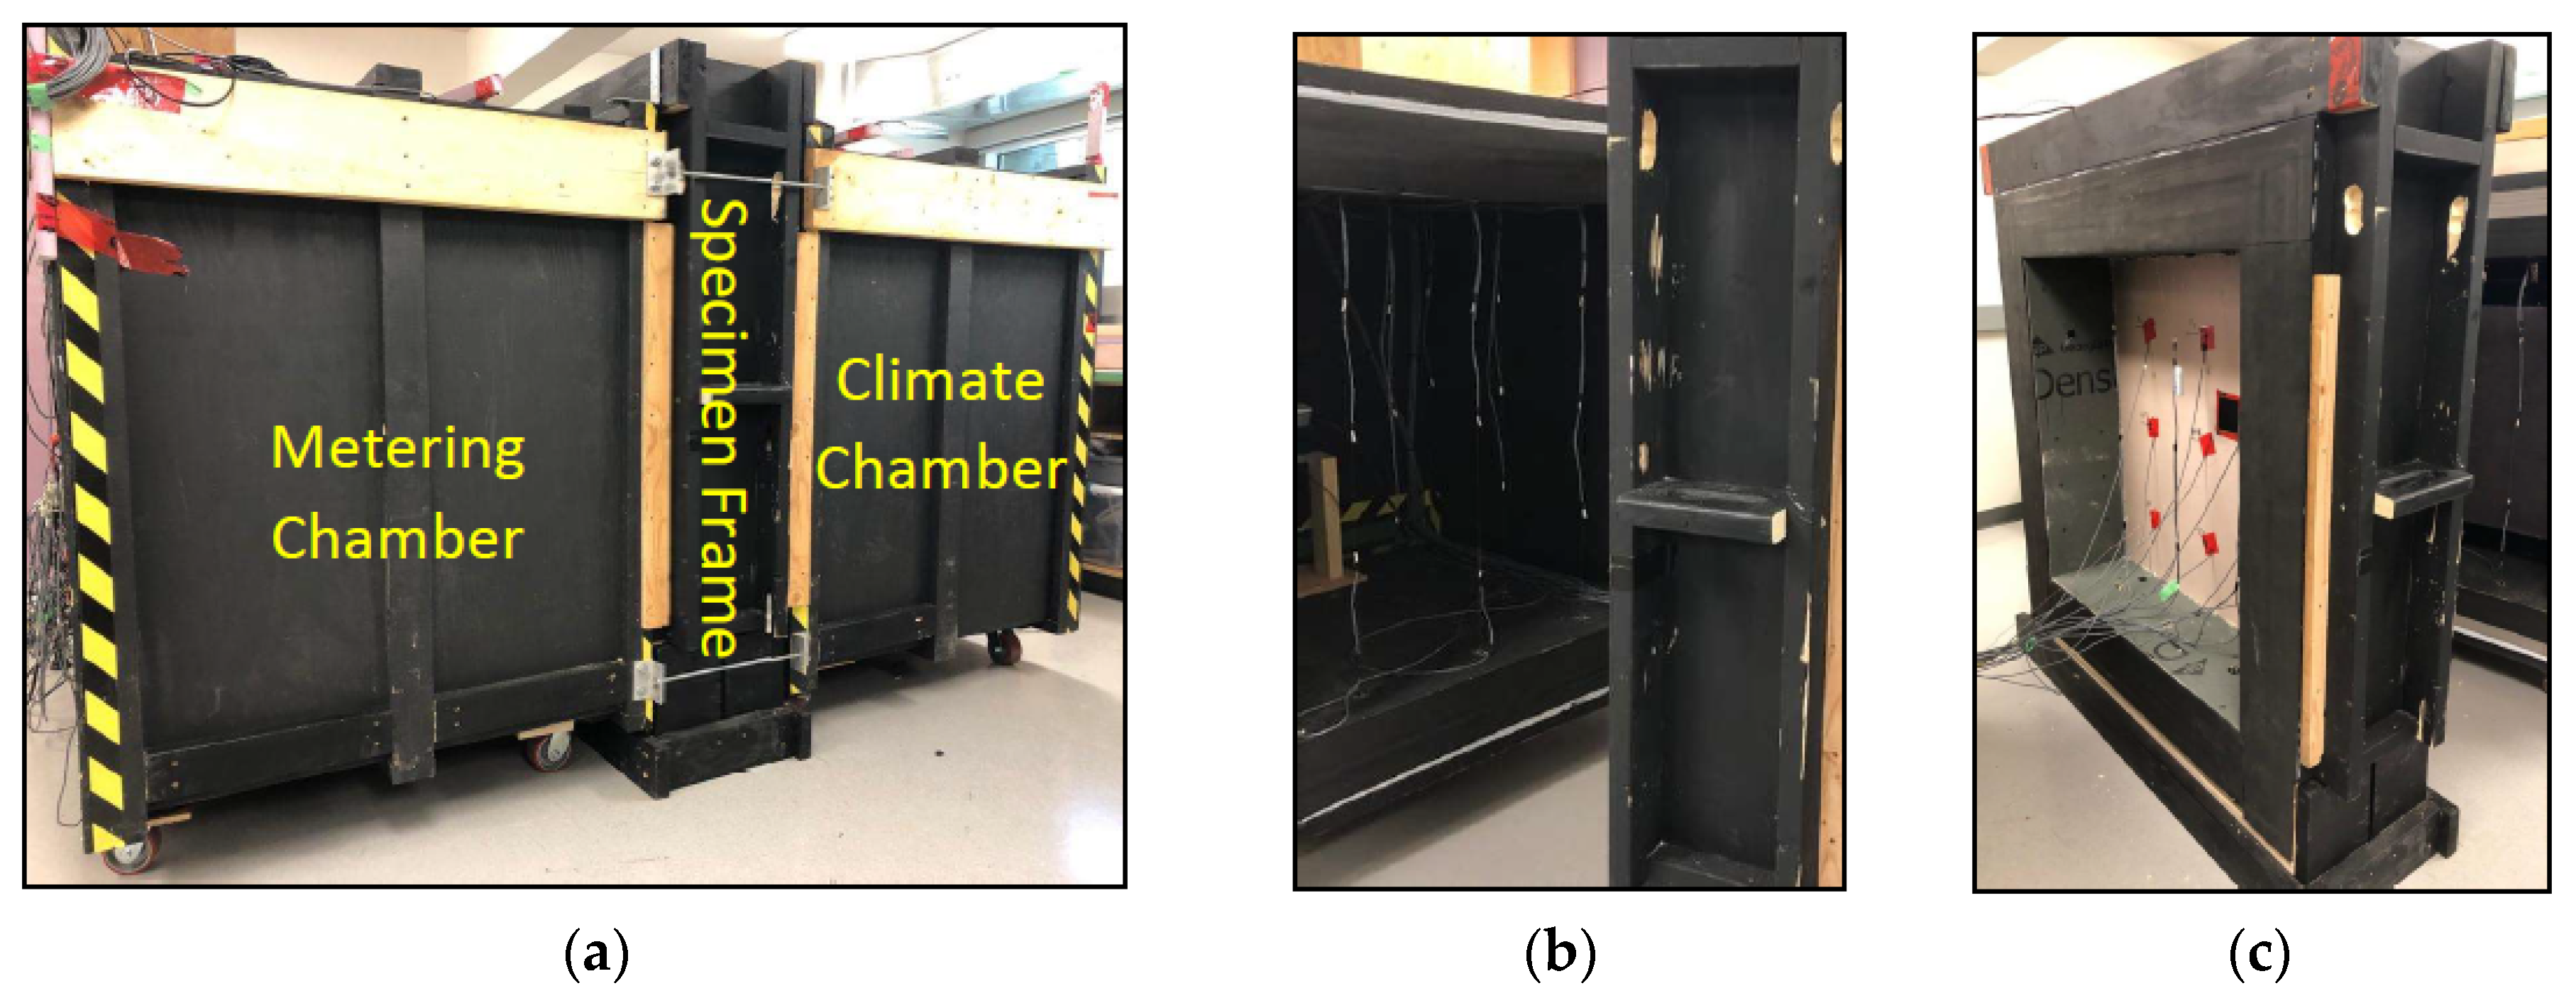
3. Description of the Apparatus

The apparatus was designed to test a variety of wall configurations, including the ones associated with balcony penetration. The apparatus consists of eight major components: (i) environment chambers, (ii) specimen frame, (iii) heating system, (iv) cooling system, (v) radiation baffles, (vi) air circulation systems, (vii) temperature sensors, and (viii) heat flux sensors. Further details about these major components are depicted below.

3.1. Environment Chambers

The hot (metering) and the cold (climate) chambers are identical in dimension at 1.0 m × 1.0 m wide and 1.0 m deep (Figure 2a,b). Despite what is stipulated in ASTM C1363, the minimum size of the metering area is 1.5 m2 and the metering area of this apparatus is 1.0 m2 because of several restrictions, such as the laboratory height and door size. The walls of the chambers are assembled using very high thermal resistive materials. The walls are constructed of one layer of 25 mm (1.0 in) vacuum insulation panels (VIP) attached to four 25 mm (1.0 in) layers of extruded polystyrene (XPS), with two layers on each side. As a protection to the apparatus, a 16 mm (5/8 in) plywood layer is used on the outer surface. As interior skin, a 16 mm (5/8 in) fiberglass-mat-faced gypsum (DENSGLASS®) sheathing is used to prevent any moisture management issues. As specified by the ASTM 1363 standard, the surface’s emittance needs to be greater than 0.80 to avoid any radiative heat transfer with the specimen. Hence, all interior surfaces have been colored black. The total thermal resistance of the chamber walls is about 9.15 m2·K/W (R-52) according to the manufacturer’s specifications for the used materials. At the back of each chamber, there is a small aperture for wiring access and coolant pipe connections.

3.2. Specimen Frame

The specimen frame (shown in Figure 2c above) consists of two pieces to facilitate the installation of specimens: the base and the U-shape. In addition to a 25 mm (1.0 in) VIP layer, the base is constructed of three layers of high-density extruded polystyrene foam (XPS-100) 76 mm (3.0 in) thick. This type of XPS was chosen to guarantee handling heavy specimens. The U-shape component is assembled from layers identical to those used in chamber walls described in the previous section. The frame is stationary while the chambers are transportable, with four wheels attached to the bottom of each one. To minimize heat loss via interfaces between chambers and the specimen frame, layers of neoprene rubber are glued to the interfaces, which work as a gasket. Table 2, below, presents the properties of the materials used in constructing the apparatus.

3.3. Heating System

The ASTM C1363 standard illustrates that the thermal stability of the metering chamber can be obtained through two different methods [23]. The first is supplying constant power to the chamber, and the second is controlling the temperature within the chamber. The first method is adopted in this study. The disadvantage of this approach is the long operation time to reach thermal stability, because of the thermal mass of materials constructing the metering chamber. A ceramic heat bulb is used as a heat source in the metering chamber (Figure 3a). The heat supply by the bulb is adjusted by a regulated DC power supply (Figure 3b).

3.4. Cooling System

The air to water cooling system has been adopted as a cooling system. The system is required to remove the heat transferred from the metering chamber or surrounding space to reach stable conditions. A refrigerating circulation bath (chiller) attached with a precise temperature controller was used as a main cooling system component (Model: AP7L-20R). Inside the climate chamber, two small evaporators connected in series are mounted at the back of the chamber. For efficient heat exchange between the air in the climate chamber and the coolant inside the evaporators, four small fans are attached to the evaporators; two pairs are attached to each evaporator.

3.5. Radiation Baffles

There are multiple reasons for having baffles parallel to the surfaces of the sample. Baffles prevent any radiative heat exchange from any heat source device such as fans and heaters inside the chambers. Thus, all heat-generating devices need to be installed behind the baffle. Baffles also help to obtain a uniform airflow of a constant velocity by adjusting the distance between the specimen and the baffle. The space between the specimen side and the baffle is recommended by the ASTM C1363 standard to be between 140 and 200 mm. The surface of the baffles facing the specimen should have an emittance greater than 0.80 to prevent any radiative heat exchange with the specimen. Moreover, materials that are used to construct the baffles should have a high thermal resistance (1.0 m2·K/W is recommended by standards). Because of all the aforementioned reasons and recommendations, the baffles of this apparatus are made of 50 mm (2 in) of extruded polystyrene insulation panels. The distance between the specimen and the baffles is adjustable depending on the specimen geometry and air velocity requirement. Figure 4a, below, shows the baffle element.

3.6. Air Circulation Systems

Attaining uniform temperatures and velocities in the air curtains is required in regard to obtaining accurate results. The uniform temperature in both chambers can be acquired by circulating the air in the curtains at constant velocities. To maintain temperature uniformity in the air curtains, twelve small fans are used, six in each chamber. To achieve natural air movement, fans are mounted to circulate the air downwards in the hot chamber and upwards in the cold chamber at constant velocities. According to the ASTM C1363 standard, the maximum air velocity of 0.50 m/s is allowed to ensure the natural convection air condition in the metering chamber. Figure 4b shows the fans’ positions for the hot and cold chambers. The fans are attached to the back of the baffles to avoid any heat radiation between them and the specimen. The speed of the fans is adjusted by controlling the power supply through a DC power-regulated device. The air velocity inside the air curtains is measured using a hot wire anemometer. During all measurements, the air velocity is below the limit mentioned above.

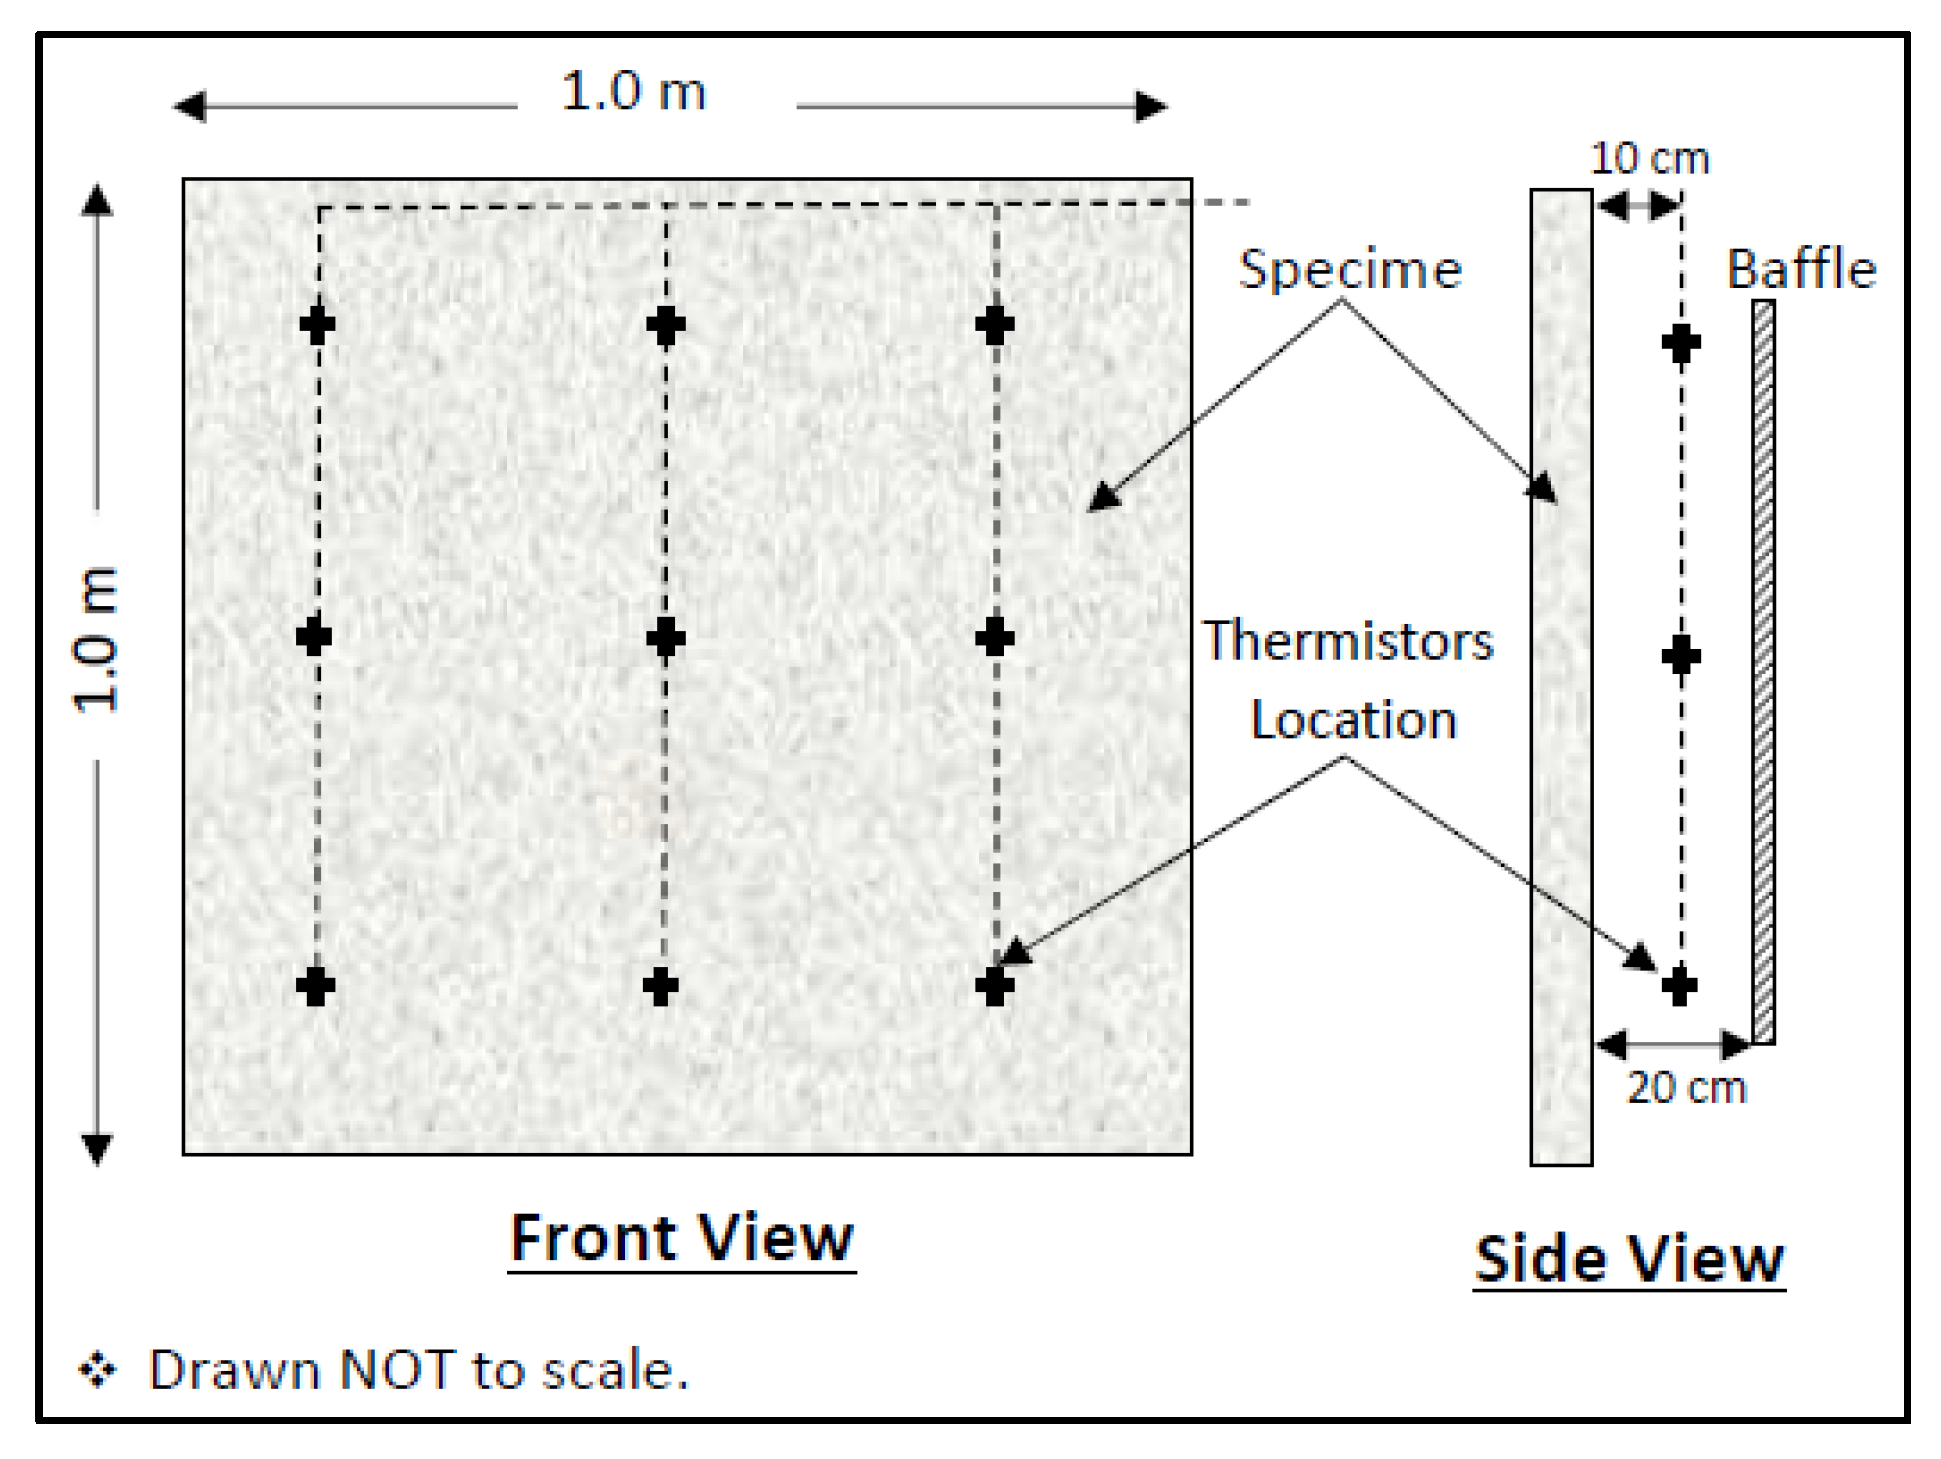
3.7. Temperature Sensors

To measure the temperatures of the air inside the chambers, a number of thermistors are installed. According to the product datasheet, the operating temperature limits of the thermistor are from −55 °C to 125 °C with a tolerance of 1.0%, and are readable to ±1.0 K. There are two data acquisition boards, one for each chamber. Each board has 48 channels, so a total of 48 thermistors can be installed inside each chamber and on each surface of the specimen. In each chamber, nine thermistors were installed in the air curtain between the baffle and specimen about 100 mm away from specimen surfaces. An adequate number of temperature sensors for the specimen can be installed based on the area and the geometry. Figure 5, below, shows the location of the thermistors in the space between the faces of the specimen and the baffle. Four sensors (two in each chamber) are placed on the surfaces of baffles that are facing the specimen. Measurements of the baffles surface temperatures are required to determine if there is any contribution of radiative heat transfer between the baffle and the specimen, which can occur if there is a difference in temperature.

3.8. Heat Flux Sensors

Two heat flux transducers have been installed, one for each chamber. According to the specification datasheet, these sensors can be used within a temperature range of −50 °C to 120 °C, and a heat flux range of ±150 kW/m2. The transducer has a sensing area of 84 cm2. The heat flux sensors are connected to precision instrumentation amplifiers. The amplifiers’ job is to convert the differential voltage output readings from micro and mille ranges to higher ranges. The output data from the amplifier are then transferred to the data acquisition system. The heat flux transducers can be used to measure the thermal heat flux transferred through the test specimen or via the walls of the chamber in the process of calibration. Before use, the heat flux sensors have been calibrated according to the procedure indicated in the product datasheet.

4. Calibration Procedure

The calibration process is essential for the hot box to determine its performance and the accuracy of its measurements. Calibration procedures can be accomplished numerically, theoretically, or experimentally. According to the literature, the experimental approach is usually implemented to perform the calibration procedure, where materials with uniform thermal properties are used. For example, boards of extruded (XPS) and expanded (EPS) polystyrene rigid foam insulation are recommended. In the current study, two samples of XPS of different thicknesses (2.0 and 4.0 in) with areas equal to the aperture of the apparatus (1.0 m2) were selected for calibration. The calibration process was completed in two steps under three temperature gradients. The first step was completed by comparing the amount of heat flow via the specimens obtained experimentally with the amount calculated both theoretically, assuming a one-dimensional heat transfer, and numerically, using a three-dimensional finite element program (HEAT3) [46]. The second step of calibration is to experimentally estimate the amount of associated metering and flanking losses.

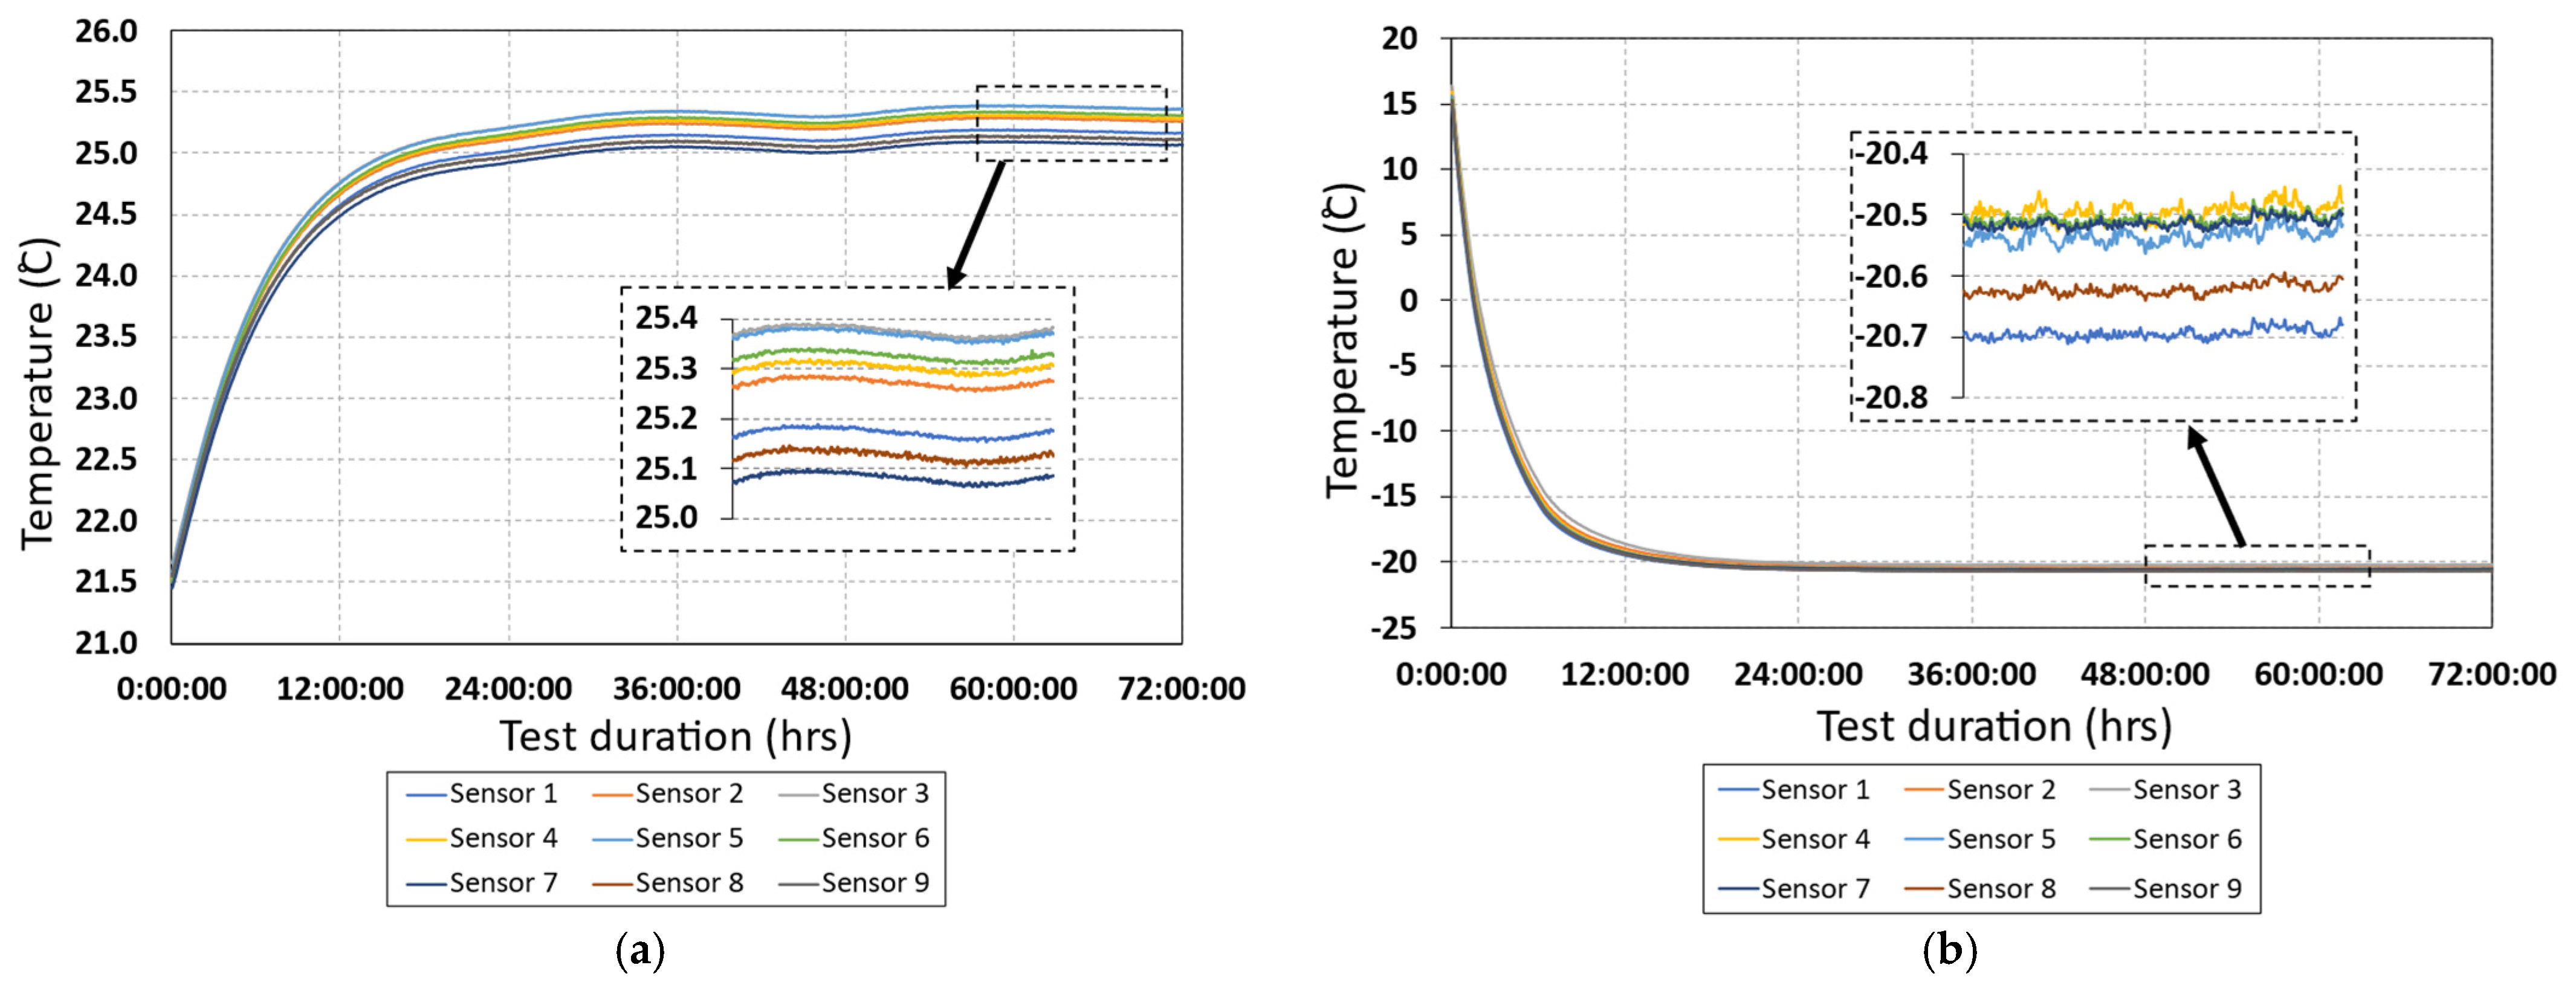
4.1. Temperature Stability

Maintaining stable temperatures in air curtains, which refers to the air space between the surfaces of the baffles and the specimen’s surfaces, is a key point for obtaining accurate results when investigating the material properties using the hot box apparatus. Incorporating low thermal conductivity materials in the walls of the hot box is helpful for reducing temperature fluctuations as well as the impact of instability of the ambient temperature of the laboratory space. The two selected samples were used to perform the initial experiments. Despite challenges in ensuring that the surrounding environmental temperature remained within a stable range, very small fluctuations in the air curtains’ temperatures of metering and climate chambers were noticed. As mentioned earlier, nine thermistors in each chamber were used to measure the temperature of the air adjacent to the surfaces of the specimen (as shown in Figure 5). In order to show the stability of the temperature inside the chambers, the air curtains’ temperature profiles of the test conducted on the 2″ XPS specimen are presented in Figure 6. These figures illustrate the degree of air temperature stability inside the chambers while the ambient air temperature swings by about 3 °C (as shown in Figure 7). The ambient air temperature was measured by placing five thermistors around the hot chamber. Several reasons for the fluctuation in the laboratory temperature are related to the age of the building, such as the building’s poor thermal insulation and airtightness. Moreover, other devices running in the same space were accounted for as heat sources.

4.2. Experimental, Numerical, and Theoretical Thermal Analyses

The performance of the apparatus was assessed by measuring the heat flux through known thermal properties specimens, which are two XPS boards in this study. The boards had thicknesses of 2.0 in and 4.0 in. These specimens were tested under three different temperature gradients, as listed in Table 3. The size of each specimen was equal to the box aperture area (1.0 m2). As mentioned above, the heating control system of the apparatus was a constant power supply into the metering chamber; thus, the temperature readings are not presented as the same fixed values in all cases. The average temperature of the air in the curtains was measured using nine thermistors located about 100 mm away from the surfaces of the specimens. The precision of the measurements using this apparatus was evaluated by estimating the rate of heat flow through the designated specimens via three different methods:
  • Theoretical calculation: the heat flux was estimated according to Equations (1) and (2), where the average values of the measured temperatures of the specimen surfaces T h , s and T c , s were employed:
    q S = ( T h , s T c , s ) R
    R = x S λ S
  • Numerical analysis: the HEAT3 program was incorporated to estimate the heat flux, where the average values of the measured air temperatures are assumed. In both the theoretical and numerical analysis, the thermal conductivity of the tested samples was assumed to be a constant value equal to 0.028 W/m·K. According to the ASHREA handbook and the ISO 12567-1 standard, the cold (exterior) and hot (interior) sides’ surface film coefficients ( h e and h i ) were assumed to be 25 W/m2·K and 7.7 W/m2·K;
  • Experimental measurements: the average heat flux value collected using the heat flux sensor was considered. The heat flux sensor is located at the center of the specimen panel. The average value was collected over a period of more than 6 h after reaching the steady-state conditions, as indicated in [23]. In general, the steady state was considered to have been achieved when the temperature measurements in the air curtains started to vary arbitrarily by less than 1.0% over a period of time [24].
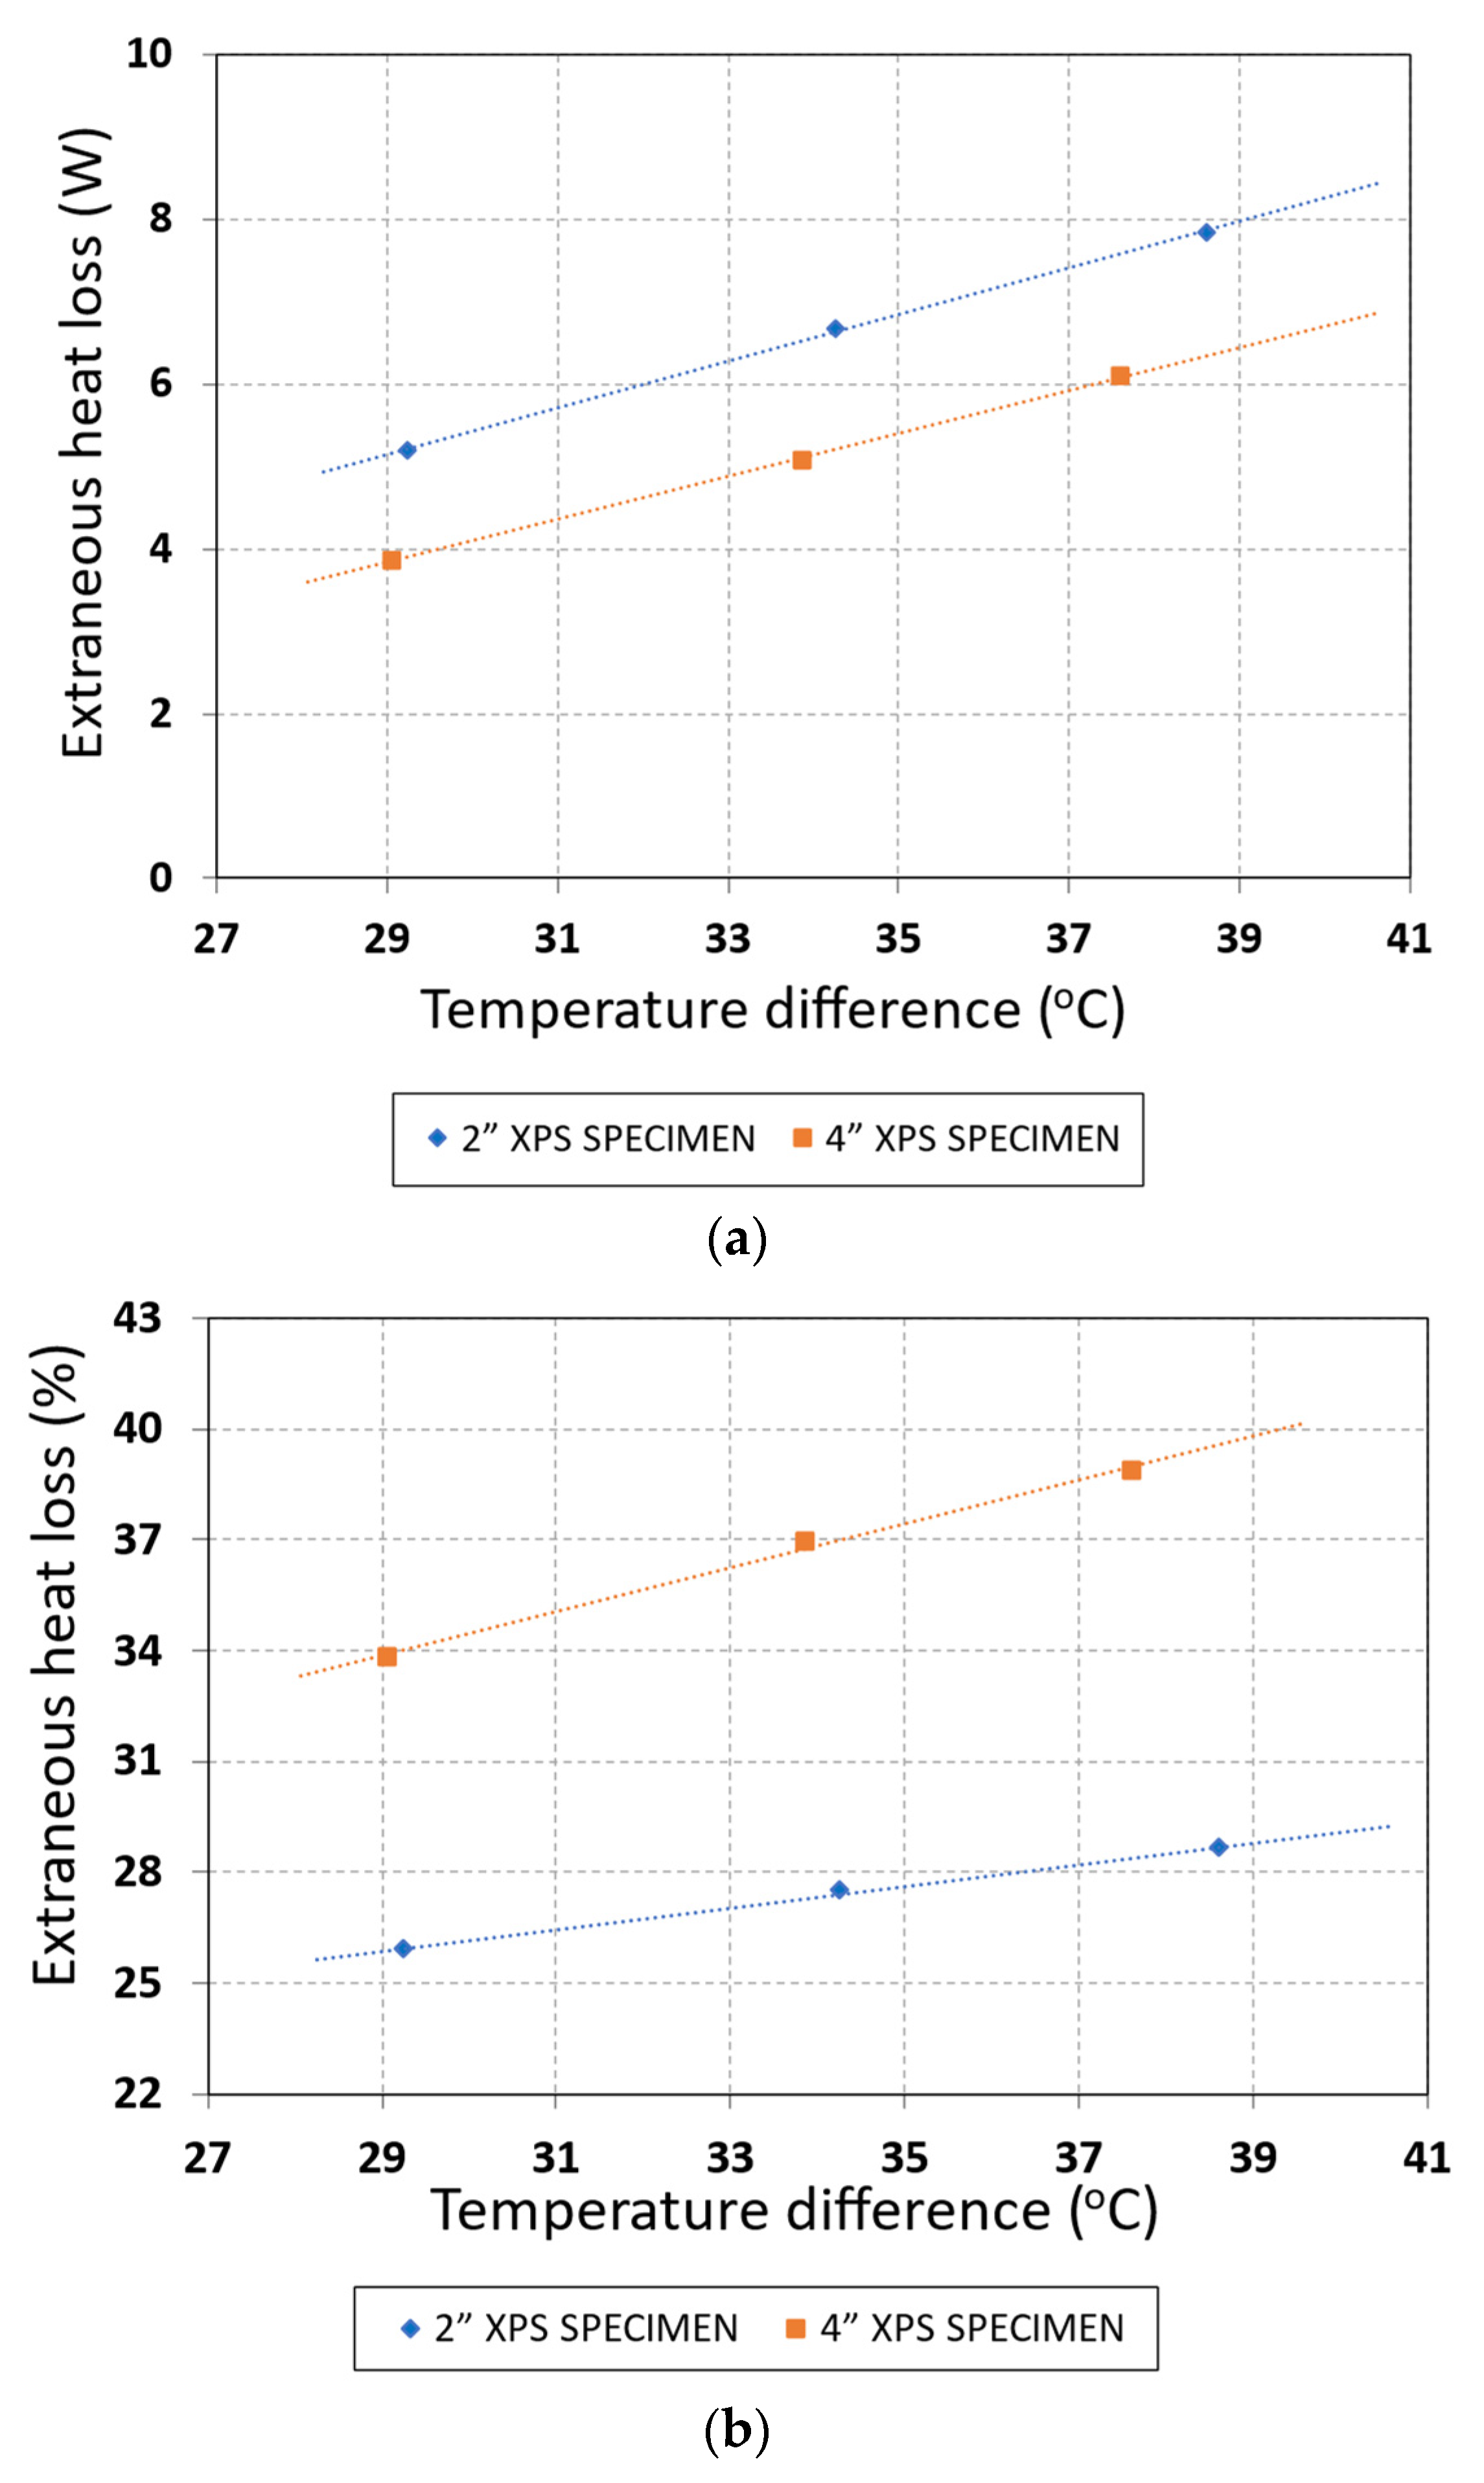
Ultimately, the theoretical and numerical computed heat flux values were then compared to the average value of data measured experimentally. The differences are also presented as percentages in Table 3 and Figure 8.

4.3. Energy Balance

The main objective of the hot boxes is to measure the amount of heat that flows through the tested specimen when the air conditions of both sides reach steady-state conditions. During the test, stability in both temperature and air velocity are required within the air curtains in both chambers for a period of time. When the steady-state conditions are established, the amount of heat flowing through the specimen is then calculated. The standards stipulate that the heat loss through the walls of the metering chamber must be less than 10% of the amount of heat transferred through the specimen. This apparatus has been constructed to be well insulated; nevertheless, a small percentage of the supplied heat into the metering chamber will transfer through its walls. Moreover, some heat will be lost through the interface areas of the apparatus components. It is impractical to fabricate a completely insulated apparatus; therefore, the heat transfer across the walls of the metering chamber (metering loss), and the heat flow at the edges of the specimen and frame (flanking loss), needs to be characterized to obtain precise results. Moreover, the apparatus contains different parts, such as wires and access openings, which might cause thermal loss to the surrounding space. Due to the complexities of estimating metering and flanking loss separately, all forms of heat losses are combined in a single quantity known as an extraneous loss. Flanking loss was first accounted for as a part of the extraneous loss by Lavine at el. [47]. They defined flanking loss as the heat flow increment between the chambers in reference to specimen heat flow in absence of any edge effect. Figure 9 shows a scheme of various types of heat flow paths.
The net amount of heat transferred through the specimen ( Q s ) is calculated by subtracting total heat loss from the net amount of energy input into the metering chamber. The net amount of supplied energy is presented through the total heat dissipated by the heater ( Q i n ) and air circulation system ( Q f ). The electric power consumed by the heater and fans is metered and considered to be totally converted into heat. As mentioned above, the heat loss includes the metering wall loss ( Q m w ) and flanking loss ( Q f l ). Equations (3)–(6) represent the calculation procedure using the data obtained experimentally.
Q i n + Q f = Q S + Q m w + Q f l
Q S = [ Q i n + Q f ] [ Q m w + Q f l ]
Q e x t r = Q m w + Q f l
Q e x t r = [ Q i n + Q f ] Q S
The total amount of extraneous loss ( Q e x t r ) can be estimated either theoretically by applying the regression Equations (7)–(9) below [23], or experimentally by testing known thermal characteristic materials, such as polystyrene foam panels (presented next). Finite element methodologies can be also used to estimate the thermal balance of the hot box.
A e f f = A i + 0.54 ·   L · Σ e i + 0.60 ·   L 2
Q m w = λ e f f ·   A e f f · ( T m w , i T m w ,   e ) L
Q f l = λ e f f ·     ( A / L ) e f f   ·   ( T e n v , h T e n v , c )
where A e f f   is the metering chamber’s effective area normal to the heat flow, A i n is the interior area of the metering chamber in m2, and L is the wall thickness of the metering chamber in m; e i is the sum of metering chamber’s interior edges lengths in m; λ e f f is the effective thermal conductivity; T m w , i and T m w , e are the temperatures of the interior and exterior surfaces of metering chamber; ( A / L ) e f f is the effective area/path length of the entire specimen frame; and T h , e n v and T c , e n v are the air temperatures inside the metering and climate chambers.
According to the ASTM C1363 standard, reasonable results are obtained when the metering box walls and flanking losses are at a minimum. The first type of losses can be minimized by using high thermal resistance materials in the construction of the box walls. Flanking loss can be reduced by designing an apparatus with a large metering area, which is not the case here because of the restrictions described earlier. Another strategy to diminish the flanking loss is to incorporate low thermal conductivity materials at the interface between the specimen edges and its frame. Calculating the metering walls and flanking losses accurately is very challenging due to the non-uniformity of the wall layers of the chambers and the specimen frame based on the design requirements. Thus, losses are estimated experimentally using insulation panels of known thermal properties. From the perspective of a thermal bridging analysis, specimens containing any types of thermal bridges can be tested to address the impact of the thermal bridge. This apparatus is beneficial to evaluations of the performance of some novel solutions for thermal bridging problem. The relation between the measured heat flow through the calibration panels of 1.0 m2 area and the associated extraneous losses are presented in Table 4 and Figure 10, below.

5. Thermal Characterization of a Clear Wall Assembly

The thermal transmittance (U-value) of a simple geometry representing one of the common wall systems in North America has been evaluated experimentally using a hot box. A specimen of an exterior insulated steel-framed wall assembly with dimensions of 0.90 m × 0.90 m (Figure 11) was fabricated and tested. The cladding materials and the fixture structures outward of the insulation layer can vary widely; therefore, they were excluded from the analysis. To reduce flanking loss through the edges of the sample, a frame made of 2″ XPS was added to surround the specimen’s edges. The air temperature inside the metering chamber was controlled to be constant by adjusting the amount of supplied power into the metering chamber, while the air temperature of the climate chamber was controlled as presented in Table 5. The average temperature of the surrounding space (the laboratory) ranged between 20 °C and 23 °C.
The metering wall loss was estimated by maintaining the same temperature in both chambers and changing the air temperature of the surrounding area. Simultaneously, the supplied heat added into the metering chamber was recorded. The amount of heat transferred between the surrounding area and the metering chamber was equal to the amount of energy added to the metering chamber, since the heat transferred between the chambers was equal to zero. Three measurements were performed to establish a relation between the amount of metering wall loss ( Q m w ) and the air temperature difference between the metering chamber ( T h , e n v ) and the surrounding space ( T s u r r ). A linear correlation was obtained to estimate the metering wall loss for each test, which can be expressed as follows:
Q m w = 1.0875   (   T h , e n v T s u r r )
Due to the complexity of the apparatus’ walls, the flanking loss was estimated numerically using finite-difference simulations. For numerical analysis, the materials properties were taken from the Lawrence Berkeley National Laboratory and ASHREA Handbook. Likewise, the materials’ thermal conductivities were assumed to be constant, regardless of the operating temperatures. All of the wall’s components were considered to be tight at the interface, and the contact resistance between the materials was assumed to be neglected, as was any air leakage impact. The boundary conditions were specified according to the ASHREA Handbook and ISO 12567-1 standard, in which the cold (exterior) and hot (interior) sides’ surface film coefficients ( h e   &   h i ) were assumed to be equal to 25 W/m2·K and 7.70 W/m2·K. The flanking loss was calculated numerically to be around 28% of the total heat transferred between the two chambers.
The flanking loss percentages that were computed numerically were assumed for the experimental analysis under same temperature conditions. Thereafter, the thermal transmittance ( U ) and overall thermal resistance ( R u ) of the assembly was calculated based on Equations (11) and (12) [23]. Table 6, below, presents the tested specimen’s thermal properties obtained experimentally by taking into account the metering wall and flanking loss assumptions.
U = Q S A S   ( T h , e n v T c , e n v )
R u = 1 U
where Q S   is the amount of heat transfers via the specimen; A S is the area of the specimen; T h , e n v and T c , e n v are the air temperatures inside the metering and climate chambers.

6. Summary of Observations and Conclusions

This paper presents the process of the construction and calibration of a unique small-scale calibrated hot box apparatus that has unprecedented temperature stability. The walls of this hot box have been constructed with vacuum insulation panels (VIPs) sandwiched between layers of extruded polystyrene (XPS) boards. The walls have high thermal resistance (R-52); thus, specimens with high thermal resistance can be tested using this apparatus. The apparatus can be used to evaluate the thermal characteristics of traditional and novel building envelope components of sizes up to 1.0 m (height) × 1.0 m (width) × 0.4 m (thickness). The major findings from this study are outlined below:
  • Although the temperature of the surrounding space fluctuates by ±1.50 °C, at the steady state, the temperature fluctuation inside the chambers and the temperature variation from point to point across the specimen’s surface remain below ±0.05 °C and 0.20 °C, respectively. These values are the lowest among all studies reported in the literature using a calibrated hot box apparatus;
  • During the calibration procedure, the differences between the results obtained experimentally and the ones computed both numerically and theoretically were always below 3.0%;
  • Using this apparatus, the thermal evaluation of a representative clear lightweight steel framing (LSF) wall assembly (0.9 m × 0.9 m × 0.28 m) at four different temperature gradients has shown a consistent agreement with the results obtained from the numerical simulations, as:
    the measured average values of thermal transmittance and resistance were 0.317 W/m2·K and 3.15 m2·K/W, respectively;
    the numerically simulated average thermal transmittance and resistance values were 0.292 W/m2·K and 3.43 m2·K/W, respectively;
    the differences between the experimental and numerical results were always less than 9.0%.
The aforesaid observations clearly demonstrate the uniqueness of this calibrated hot box apparatus with the unprecedented temperature stability and reliability of the test results.

Author Contributions

Conceptualization, A.A. and P.M.; data curation, A.A.; formal analysis, A.A.; funding acquisition, P.M.; investigation, A.A.; methodology, A.A.; project administration, P.M.; resources, P.M.; software, A.A.; validation, A.A.; writing—original draft, A.A.; writing—review and editing, P.M. All authors have read and agreed to the published version of the manuscript.

Funding

The authors would like to acknowledge NSERC, BC Housing, CFI, and BCKDF for providing financial support for this research initiative.

Institutional Review Board Statement

Not applicable.

Informed Consent Statement

Not applicable.

Data Availability Statement

Not applicable.

Acknowledgments

The support received from the Libyan Ministry of Higher Education and Scientific Research and the University of Victoria are greatly acknowledged. The authors would also like to acknowledge SMT Research Ltd. for providing technical support for this research initiative.

Conflicts of Interest

The authors declare no conflict of interest.

References

  1. Pérez-Lombard, L.; Ortiz, J.; Pout, C. A review on buildings energy consumption information. Energy Build. 2008, 40, 394–398. [Google Scholar] [CrossRef]
  2. Asdrubali, F.; Bonaut, M.; Battisti, M.; Venegas, M. Comparative study of energy regulations for buildings in Italy and Spain. Energy Build. 2008, 40, 1805–1815. [Google Scholar] [CrossRef]
  3. ASTM International. Test Method for Steady-State Heat Flux Measurements and Thermal Transmission Properties by Means of the Guarded-Hot-Plate Apparatus; ASTM International: West Conshohocken, PA, USA, 2019. [Google Scholar] [CrossRef]
  4. ASTM International. Test Method for Steady-State Thermal Transmission Properties by Means of the Heat Flow Meter Apparatus; ASTM International: West Conshohocken, PA, USA, 2017. [Google Scholar] [CrossRef]
  5. Zarr, R.R. A history of testing heat insulators at the national institute of standards and technology. Ashrae Trans. 2001, 107, 661. [Google Scholar]
  6. van Dusen, M.S.; Finck, J.L. Heat transfer through building walls. Bur. Stand. J. Res. 1931, 6, 493. [Google Scholar] [CrossRef]
  7. de Rubeis, T.; Muttillo, M.; Nardi, I.; Pantoli, L.; Stornelli, V.; Ambrosini, D. Integrated Measuring and Control System for Thermal Analysis of Buildings Components in Hot Box Experiments. Energies 2019, 12, 2053. [Google Scholar] [CrossRef] [Green Version]
  8. Klems, J.H. A Calibrated Hotbox for Testing Window Systems? Construction, Calibration, and Measurements on Prototype High-Performance Windows. 1979. Available online: https://escholarship.org/content/qt76x4x231/qt76x4x231.pdf (accessed on 18 January 2022).
  9. de Fang, X. A study of the U-factor of the window with a high-reflectivity venetian blind. Sol. Energy 2000, 68, 207–214. [Google Scholar] [CrossRef]
  10. Wakili, K.G.; Tanner, C. U-value of a dried wall made of perforated porous clay bricks: Hot box measurement versus numerical analysis. Energy Build. 2003, 35, 675–680. [Google Scholar] [CrossRef]
  11. Mumaw, J.R. Calibrated Hot Box: An Effective Means for Measuring Thermal Conductance in Large Wall Sections. In Heat Transmission Measurements in Thermal Insulations; ASTM International: West Conshohocken, PA, USA, 1974. [Google Scholar] [CrossRef]
  12. Burch, D.M.; Zarr, R.R.; Licitra, B.A. A Dynamic Test Method for Determining Transfer Function Coefficients for a Wall Specimen Using a Calibrated Hot Box. In Insulation Materials, Testing and Applications; ASTM International: West Conshohocken, PA, USA, 1990. [Google Scholar]
  13. Sabine, H.J.; Lacher, M.B.; Flynn, D.R.; Quindry, T.L. Acoustical and Thermal Performance of Exterior Residential Walls, Doors, and Windows; National Bureau of Standards: Washington, DC, USA, 1975.
  14. Miller, R.G.; Perrine, E.L.; Linehan, P.W. A Calibrated/Guarded Hot-Box Test Facility. In Thermal Transmission Measurements of Insulation; ASTM International: West Conshohocken, PA, USA, 1978. [Google Scholar]
  15. Mumaw, J.R. Thermal research facility—A large calibrated hot box for horizontal building elements. In Thermal Insulation Performance; ASTM International: West Conshohocken, PA, USA, 1980. [Google Scholar]
  16. Achenbach, P.R. Design of a calibrated hot-box for measuring the heat, air, and moisture transfer of composite building walls. Thermal performance of the exterior envelopes of buildings. Proceedings 1981, 1, 308–324. [Google Scholar]
  17. Fiorato, A.E. Laboratory Tests of Thermal Performance of Exterior Walls; Thermal Performance of the Exterior Envelopes of Buildings; American Society of Heating Refrigerating and Air-conditioning Engineers and US. Department of Energy Office of Energy Conservation and solar Energy Buildings and Community Systems Division: Kissimmee, FL, USA, 1979; pp. 221–236.
  18. Perrine, E.L.; Linehan, P.W.; Howanski, J.W.; Shu, L.S. The Design and Construction of a Calibrated/Guarded Hot Box Facility. In Thermal Performance of the Exterior Envelopes of Buildings; ASHRAE SP28; American Society of Heating, Refrigerating, and Air-Conditioning Engineers, Inc.: New York, NY, USA, 1981; pp. 299–307. [Google Scholar]
  19. Rucker, J.L.; Mumaw, J.R. Calibration procedures and results for a large calibrated hot box. Thermal Performance of the Exterior Envelopes of Buildings. Ashrae SP 1981, 28, 237–249. [Google Scholar]
  20. Powell, F.J.; Bales, E.L. Design of Round-Robin Tests with Guarded/Calibrated Hot Boxes, Guarded Hot Plates, and Heat Flow Meters. In Thermal Insulation, Materials, and Systems for Energy Conservation in the’80s; ASTM International: West Conshohocken, PA, USA, 1983. [Google Scholar]
  21. Broderick, T.B. Design and calibration of a guard added to an existing hot box. J. Test. Eval. 1987, 15, 145–152. [Google Scholar]
  22. Zarr, R.R.; Burch, D.M.; Faison, T.K.; Arnold, C.E.; O’Connell, M.E. Calibration of the NBS calibrated hot box. J. Test. Eval. 1987, 15, 167–177. [Google Scholar]
  23. ASTM International. Standard Test Method for Thermal Performance of Building Materials and Envelope Assemblies by Means of a Hot Box Apparatus; ASTM International: West Conshohocken, PA, USA, 2019. [Google Scholar]
  24. ISO 8990:1996 Thermal Insulation. Determination of Steady-State Thermal Transmission Properties. Calibrated and Guarded Hot Box. Available online: https://www.en-standard.eu/bs-en-iso-8990-1996-thermal-insulation-determination-of-steady-state-thermal-transmission-properties-calibrated-and-guarded-hot-box/ (accessed on 16 June 2021).
  25. Annual Reports. ClimateWorks Foundation. Available online: https://www.climateworks.org/report/annual-reports/ (accessed on 26 January 2022).
  26. Martin, K.; Campos-Celador, A.; Escudero, C.; Gómez, I.; Sala, J.M. Analysis of a thermal bridge in a guarded hot box testing facility. Energy Build. 2012, 50, 139–149. [Google Scholar] [CrossRef]
  27. Kus, H.; Özkan, E.; Göcer, Ö.; Edis, E. Hot box measurements of pumice aggregate concrete hollow block walls. Constr. Build. Mater. 2013, 38, 837–845. [Google Scholar] [CrossRef]
  28. Chen, F.; Wittkopf, S.K. Summer condition thermal transmittance measurement of fenestration systems using calorimetric hot box. Energy Build. 2012, 53, 47–56. [Google Scholar] [CrossRef]
  29. Schumacher, C.J.; Straube, J.F.; Ober, D.G.; Grin, A.P. Development of a New Hot Box Apparatus to Measure Building Enclosure Thermal Performance. p. 19. Available online: https://web.ornl.gov/sci/buildings/conf-archive/2013%20B12%20papers/212-Schumacher.pdf (accessed on 26 January 2022).
  30. Asdrubali, F.; Baldinelli, G. Thermal transmittance measurements with the hot box method: Calibration, experimental procedures, and uncertainty analyses of three different approaches. Energy Build. 2011, 43, 1618–1626. [Google Scholar] [CrossRef]
  31. Ricciardi, P.; Belloni, E.; Cotana, F. Innovative panels with recycled materials: Thermal and acoustic performance and Life Cycle Assessment. Appl. Energy 2014, 134, 150–162. [Google Scholar] [CrossRef]
  32. Seitz, S.; MacDougall, C. Design of an Affordable Hot Box Testing Apparatus. In Proceedings of the NOCMAT 2015-Construction for Sustainability-Green Materials & Technologies, Mérida, Yucatán, Mexico, 26–29 November 2015. [Google Scholar]
  33. Buratti, C.; Belloni, E.; Lunghi, L.; Borri, A.; Castori, G.; Corradi, M. Mechanical characterization and thermal conductivity measurements using of a new ‘small hot-box’ apparatus: Innovative insulating reinforced coatings analysis. J. Build. Eng. 2016, 7, 63–70. [Google Scholar] [CrossRef]
  34. Buratti, C.; Belloni, E.; Lunghi, L.; Barbanera, M. Thermal Conductivity Measurements By Means of a New ‘Small Hot-Box’ Apparatus: Manufacturing, Calibration and Preliminary Experimental Tests on Different Materials. Int. J. Thermophys. 2016, 37, 47. [Google Scholar] [CrossRef]
  35. Alongi, A.; Angelotti, A.; Mazzarella, L. Experimental investigation of the steady state behaviour of Breathing Walls by means of a novel laboratory apparatus. Build. Environ. 2017, 123, 415–426. [Google Scholar] [CrossRef] [Green Version]
  36. Chowdhury, D.; Neogi, S. Thermal performance evaluation of traditional walls and roof used in tropical climate using guarded hot box. Constr. Build. Mater. 2019, 218, 73–89. [Google Scholar] [CrossRef]
  37. Barbaresi, A.; Bovo, M.; Santolini, E.; Barbaresi, L.; Torreggiani, D.; Tassinari, P. Development of a low-cost movable hot box for a preliminary definition of the thermal conductance of building envelopes. Build. Environ. 2020, 180, 107034. [Google Scholar] [CrossRef]
  38. Shen, Z.; Brooks, A.L.; He, Y.; Shrestha, S.S.; Zhou, H. Evaluating dynamic thermal performance of building envelope components using small-scale calibrated hot box tests. Energy Build. 2021, 251, 111342. [Google Scholar] [CrossRef]
  39. Tejeda-Vázquez, R.; Macias-Melo, E.V.; Hernández-Pérez, I.; Aguilar-Castro, K.M.; Serrano-Arellano, J. Empirical model of hygrothermal behavior of masonry wall under different climatic conditions using a hot box. Energy Build. 2021, 249, 111209. [Google Scholar] [CrossRef]
  40. Boukhelf, F.; Trabelsi, A.; Belarbi, R.; Bouiadjra, M.B. Experimental and numerical modelling of hygrothermal transfer: Application on building energy performance. Energy Build. 2022, 254, 111633. [Google Scholar] [CrossRef]
  41. Thermal Insulation. Available online: https://d8-na.industrial.panasonic.com/node/956 (accessed on 2 March 2021).
  42. Kumaran, M.K. Material Properties; Laboratorium Bouwfysica, Deppartment Burgerlijke Bouwkunde, K.U.-Leuven: Leuven, Belgium, 1996. [Google Scholar]
  43. Standard Specification for Rubber Cellular Cushion Used for Carpet or Rug Underlay. Available online: https://www.astm.org/d3676-18.html (accessed on 2 March 2021).
  44. Plywood. Available online: http://www.matweb.com/search/datasheet_print.aspx?matguid=bd6620450973496ea2578c283e9fb807 (accessed on 2 March 2021).
  45. Simmler, H.; Brunner, S.; Heinemann, U.; Schwab, H.; Kumaran, K.; Mukhopadhyaya, P.; Quenard, D.; Sallee, H.; Noller, K.; Kuecuekpinar-Niarchos, E.; et al. Vacuum Insulation Panels-Study on VIP-Components and Panels for Service Life Prediction of VIP in Building Applications (Subtask A). 2005. Available online: https://www.osti.gov/etdeweb/biblio/21131463 (accessed on 2 March 2021).
  46. HEAT3—Heat Transfer in Three Dimensions—Buildingphysics.com. Available online: https://buildingphysics.com/heat3-3/ (accessed on 29 January 2019).
  47. Lavine, A.G.; Rucker, J.L.; Wilkes, K.E. Flanking Loss Calibration for a Calibrated Hot Box. In Thermal Insulation, Materials, and Systems for Energy Conservation in the’80s; ASTM International: West Conshohocken, PA, USA, 1983. [Google Scholar]
Figure 1. Schematics of: (a) guarded hot plate; (b) calibrated hot box; (c) guarded hot box.
Energies 15 04677 g001aEnergies 15 04677 g001b
Figure 2. (a) Environment chamber; (b) interior view of the chamber; (c) specimen frame.
Energies 15 04677 g002
Figure 3. (a) Ceramic heat bulb; (b) DC power supply regulator.
Energies 15 04677 g003
Figure 4. (a) Radiation baffle element; (b) fans attached to the baffle.
Energies 15 04677 g004
Figure 5. Scheme of temperature sensors’ layout.
Energies 15 04677 g005
Figure 6. Air curtain temperature profile of: (a) metering chamber; (b) climate chamber.
Energies 15 04677 g006
Figure 7. Laboratory temperature profile.
Energies 15 04677 g007
Figure 8. Comparison between theoretical, numerical, and experimental heat flow rates.
Energies 15 04677 g008
Figure 9. Scheme of heat flow paths.
Energies 15 04677 g009
Figure 10. Relation between temperature gradients and extraneous heat loss as: (a) an amount; (b) a percentage.
Energies 15 04677 g010
Figure 11. Sketch of the tested wall assembly.
Energies 15 04677 g011
Table 1. Detailed description of selected studies utilizing comparable test apparatus.
Publication Authors/YearSize of Metering AreaSize of Metering ChamberApparatus TypologyThickness of Chamber Walls (Core Materials)Thermal Resistance of Chambers WallsPoint-to-Point Air Temp. VariationMax. Temp. Fluctuations at Steady State
ASTM C1363 Standard (2019) [23]>1.50 m2>1.50 m2GHB/CHB->0.83 m2·K/W
(R-4.7)
<2.0% of ∆T;
and <2 K
<±0.25 °C
ISO 8990 Standard (1996) [24]>1.50 m × 1.50 m>1.50 m × 1.50 mGHB/CHB--<2.0% of ∆T;
and <2 K/m
<1.0% of ∆T
Asdrubali, Baldinelli (2011) [30]2.70 m × 2.0 m2.70 m × 2.0 mCHB240 mm
(EPS)
7.46 m2 K/W
(R-42)
-±0.2 °C
Seitz et al. (2015) [32]1.18 m × 1.37 m1.18 m × 1.37 mCHB130 mm
(EPS)
2.91 m2 K/W
(R-16.5)
<3.0 °C±2.0 °C
Buratti et al. (2016) [33,34]0.46 m × 0.46 m0.50 m × 0.50 mCHB220 mm
(Polyurethan)
8.78 m2 K/W
(R-50)
0.4 °C±0.1 °C
Alongi et al. (2017) [35]1.00 m × 1.00 m1.22 m × 1.22 mCHB140 mm
(Polystyrene)
4.35 m2 K/W
(R-25)
-±0.3 °C
Chowdhury et al. (2019) [36]0.50 m × 0.50 m1.75 m × 1.50 mGHB250 mm
(XPS)
8.80 m2 K/W
(R-50)
-±0.06 °C
Barbaresi et al. (2020) [37]1.00 m × 1.00 m1.00 m × 1.00 mCHB100 mm
(EPS)
2 m2 K/W
(R-11.5)
-±4.0 °C
Shen et al. (2021) [38]0.35 m × 0.35 m0.44 m × 0.44 mCHB25.4 mm
(XPS)
0.88 m2 K/W
(R-5)
--
Tejeda et al. (2021) [39]1.00 m × 1.00 mNot availableCHB50 mm
(XPS)
1.76 m2 K/W
(R-10)
-±1.0 °C
Boukhelf et al. (2022) [40]1.30 m × 1.35 mNot availableCHB50 mm
(XPS)
1.76 m2 K/W
(R-10)
-±0.3 °C
Current study1.00 m × 1.00 m1.00 m × 1.00 mCHB185 mm
(XPS + VIP)
9.15 m2 K/W
(R-52)
0.2 °C±0.05 °C
Table 2. Materials’ properties [41,42,43,44,45].
MaterialProperties
Density (Kg/m3)Thermal Conductivity (W/m·K)Specific Heat Capacity (J/kg·K)Compressive Strength (kPa)
Extruded polystyrene: XPS-20/XPS-10025/480.0281470173/690
Vacuum insulation panel (VIP)2200.0051850100
Plywood5500.1251880~35 × 103
Fiberglass-mat-faced gypsum (DENSGLASS®)7000.1288803445
Neoprene foam1600.0384250025
Table 3. Comparison between theoretical, numerical, and experimental heat flow rates.
ParametersUnits2″ XPS Specimen4″ XPS Specimen
Test 1Test 2Test 3Test 1Test 2Test 3
Metering Chamber Air Temperature°C21.1321.7521.6520.8821.121.65
Climate Chamber Air Temperature°C−7.91−12.51−16.96−8.18−12.76−15.96
Specimen Hot Surface Temperature°C19.9720.3920.1320.2520.3820.86
Specimen Cold Surface Temperature°C−6.46−10.78−15.01−7.43−11.90−14.97
Calculated Heat Flow RateW/m214.5717.1819.377.648.919.81
Simulated Heat Flow RateW/m214.617.2219.47.628.889.87
Measured Heat Flow RateW/m214.8217.4419.637.558.679.61
Difference Between Measured and CalculatedW/m2
(%)
−0.25
(−1.72)
−0.26
(−1.51)
−0.26
(−1.34)
0.09
(1.18)
0.24
(2.69)
0.28
(2.83)
Difference Between Measured and SimulatedW/m2
(%)
−0.22
(−1.51)
−0.22
(−1.28)
−0.23
(−1.19)
0.07
(0.92)
0.21
(2.36)
0.26
(2.63)
Table 4. Extraneous loss associated with hot box measurements.
ParametersUnits2″ XPS Specimen4″ XPS Specimen
Test 1Test 2Test 3Test 1Test 2Test 3
Temperature Difference°C29.2534.2638.6129.0633.8637.61
Mean Temperature°C6.624.622.356.354.172.85
Measured Heat Flow via the SpecimenW14.8217.4419.637.558.679.61
Total Supplied Energy into Metering ChamberW2024.0527.5111.4113.7515.72
Amount of Extraneous Heat LossW5.186.617.883.865.086.11
Percentage of Extraneous Heat Loss *%25.9027.4828.6433.8336.9538.87
* Percentages are calculated in respect to total amount of energy supplied into the metering chamber.
Table 5. Results obtained numerically.
ParametersUnitsTest 1Test 2Test 3Test 4Test 5
Average air temperature in metering chamber°C22.3122.7322.6521.7724.33
Average air temperature in climate chamber°C−1.63−4.76−9.36−14−18.13
Total amount of heat transfers between chambersW7.909.0710.5611.8014
Net amount of heat transfers via specimenW5.676.507.578.4610.04
Amount of flanking heat loss *W
(%)
2.23
(28.23)
2.57
(28.34)
2.99
(28.31)
3.34
(28.31)
3.96
(28.29)
The overall thermal resistance (RSI)m2·K/W3.423.433.433.423.43
* Percentages are calculated with respect to the total amount of energy transfers between the chambers.
Table 6. Thermal properties of the tested wall assembly assessed experimentally.
ParametersUnitsTest 1Test 2Test 3Test 4Test 5
Amount of supplied energyW8.5510.6512.0914.5517.10
Average air temperature of surrounding space°C22.3022.0822.1020.1122.60
Average air temperature of metering chamber°C22.3122.7322.6521.7724.33
Average air temperature of climate chamber°C−1.63−4.76−9.36−14−18.13
Amount of metering heat loss *W00.710.601.811.88
Amount of flanking heat lossW2.412.823.253.614.30
Net amount of heat transfers via the specimenW6.147.138.249.1410.91
The overall thermal transmittanceW/m2·K0.3160.3200.3180.3150.317
The overall thermal resistance (RSI)m2·K/W3.163.123.153.173.15
* Calculated based on the linear correlation in Equation (10).
Publisher’s Note: MDPI stays neutral with regard to jurisdictional claims in published maps and institutional affiliations.

