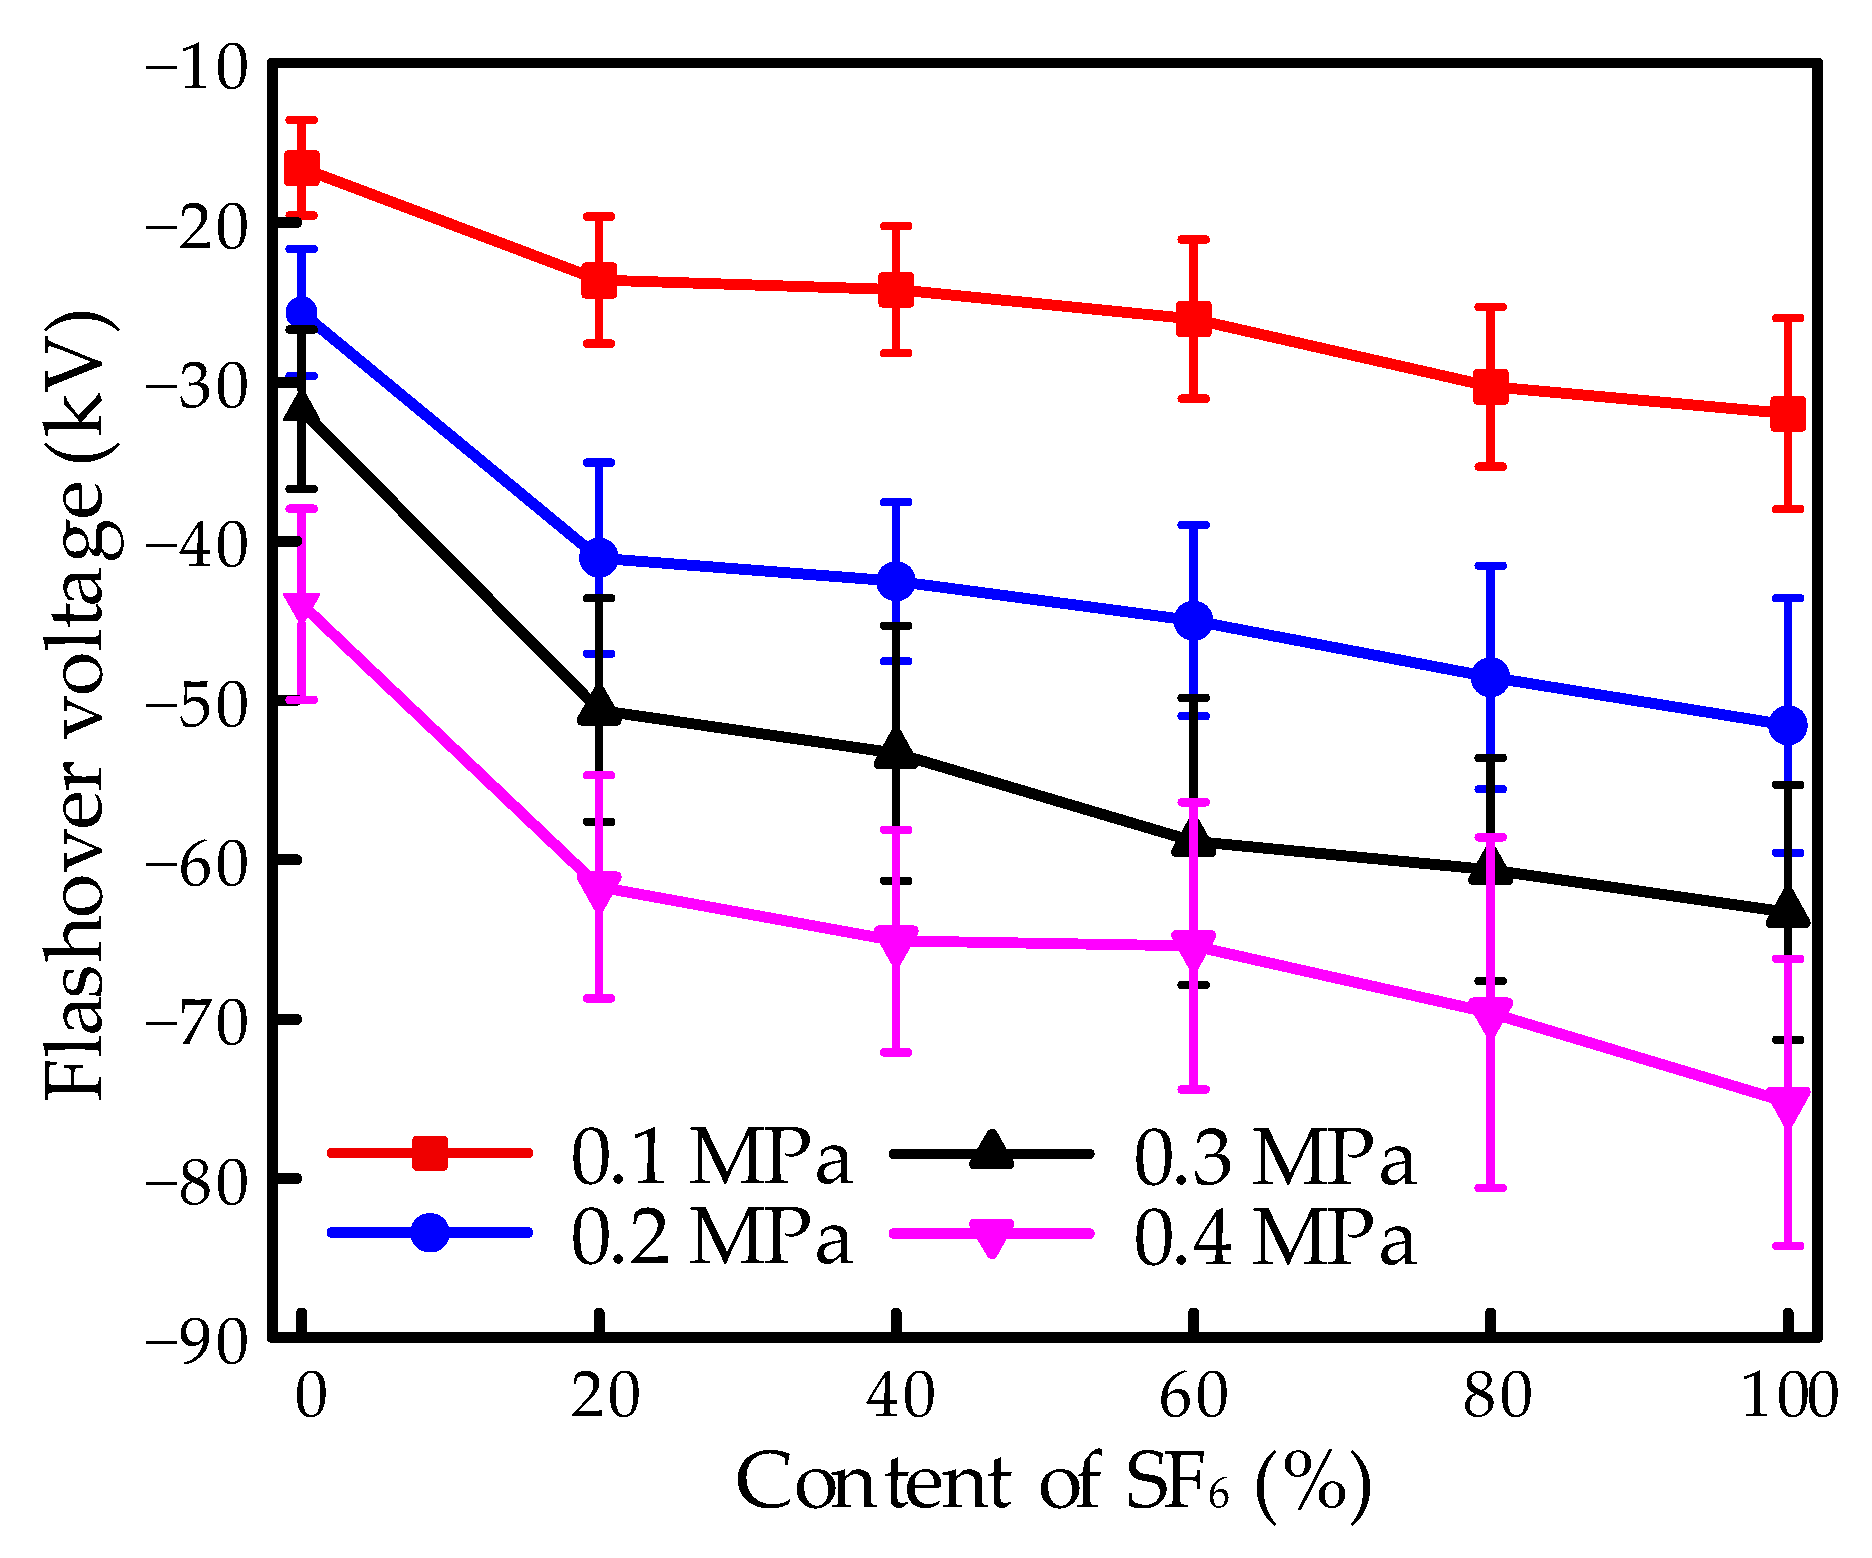
3.1. Surface Flashover
The negative surface flashover of the EP samples under finger-type electrodes was investigated with various SF
6/CF
4 mixtures, and the result is shown in
Figure 3. Contents of 0, 20, 40, 60, 80, and 100% for SF
6 were applied in the mixture, and the pressure was operated from 0.1 to 0.4 MPa. It is obvious that, with the increasing pressure, the negative flashover voltage decreased, while the absolute value increased, indicating an increase in the difficulty of the flashover process. Moreover, no significantly saturate tendency appeared within the increase. According to impact ionization theory, the free path of an electron decreases with increasing pressure, leading to the increasing possibility of collision. However, the obtained energy for an electron in the stress of the electric field decreases owing to the decrease of the free path. The two opposite effects result in the decline of the impact ionization coefficient within the given pressure, which contributes to the increasing tendency with increasing pressure.
The flashover strength showed obvious improvement due to the mixture of SF6, even at low contents compared to CF4. The flashover voltage achieved increments of 42, 60, 59.4, and 38.2%, respectively, from 0.1 to 0.4 MPa for the 20% SF6/80% CF4 mixture compared to CF4. The electronegativity of the gases for the constituent element of F could result in the adsorption of electrons, thus leading to the generation of negative ions. The influence on impact ionization finally leads to the increase in the flashover property. Thus, the flashover characteristics in CF4 perform a disadvantage to SF6 for the deficiency in electronegativity.
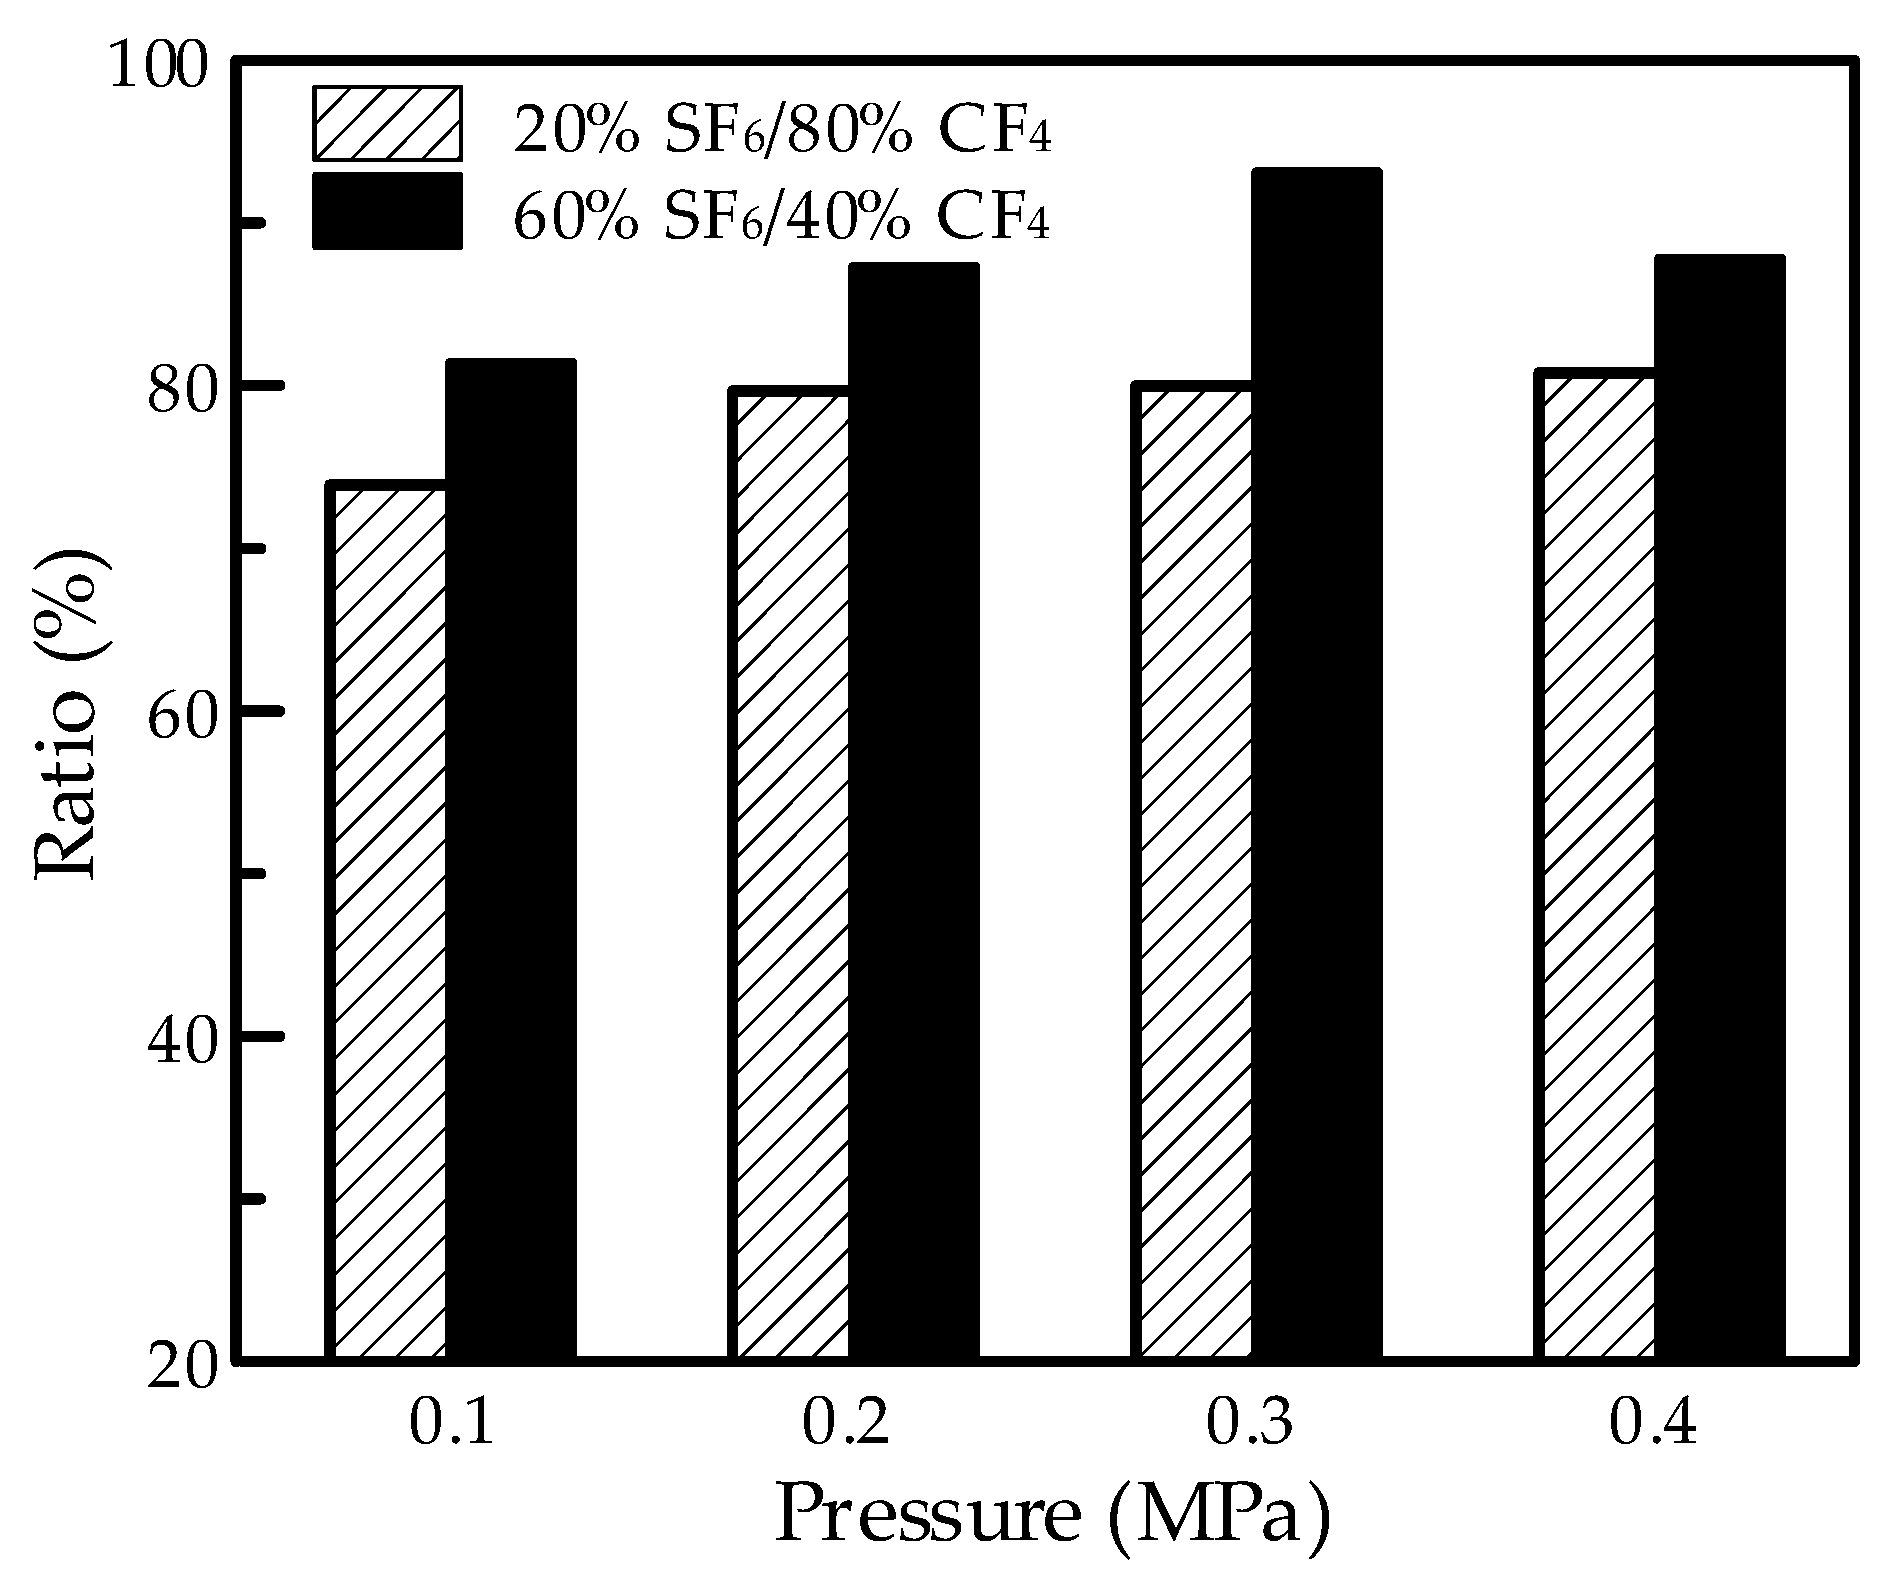
It is shown that the flashover strength increased with the increasing content of SF
6. The flashover voltage in the SF
6/CF
4 mixture reached over 70% compared to SF
6, with the content of 20% at the same pressure. The value would reach over 80% at a high pressure. The results in
Figure 4 present the voltage ratio between the mixture and SF
6 at the same pressure calculated from
Figure 3. The results showed a slight improvement with the increase in the content of SF
6, considering the difference between 20% SF
6/80% CF
4 and 60% SF
6/40% CF
4. This indicated that the 20% SF
6/80% CF
4 mixture would achieve good insulation properties in flashover and show an advantage in the environment-friendly application.
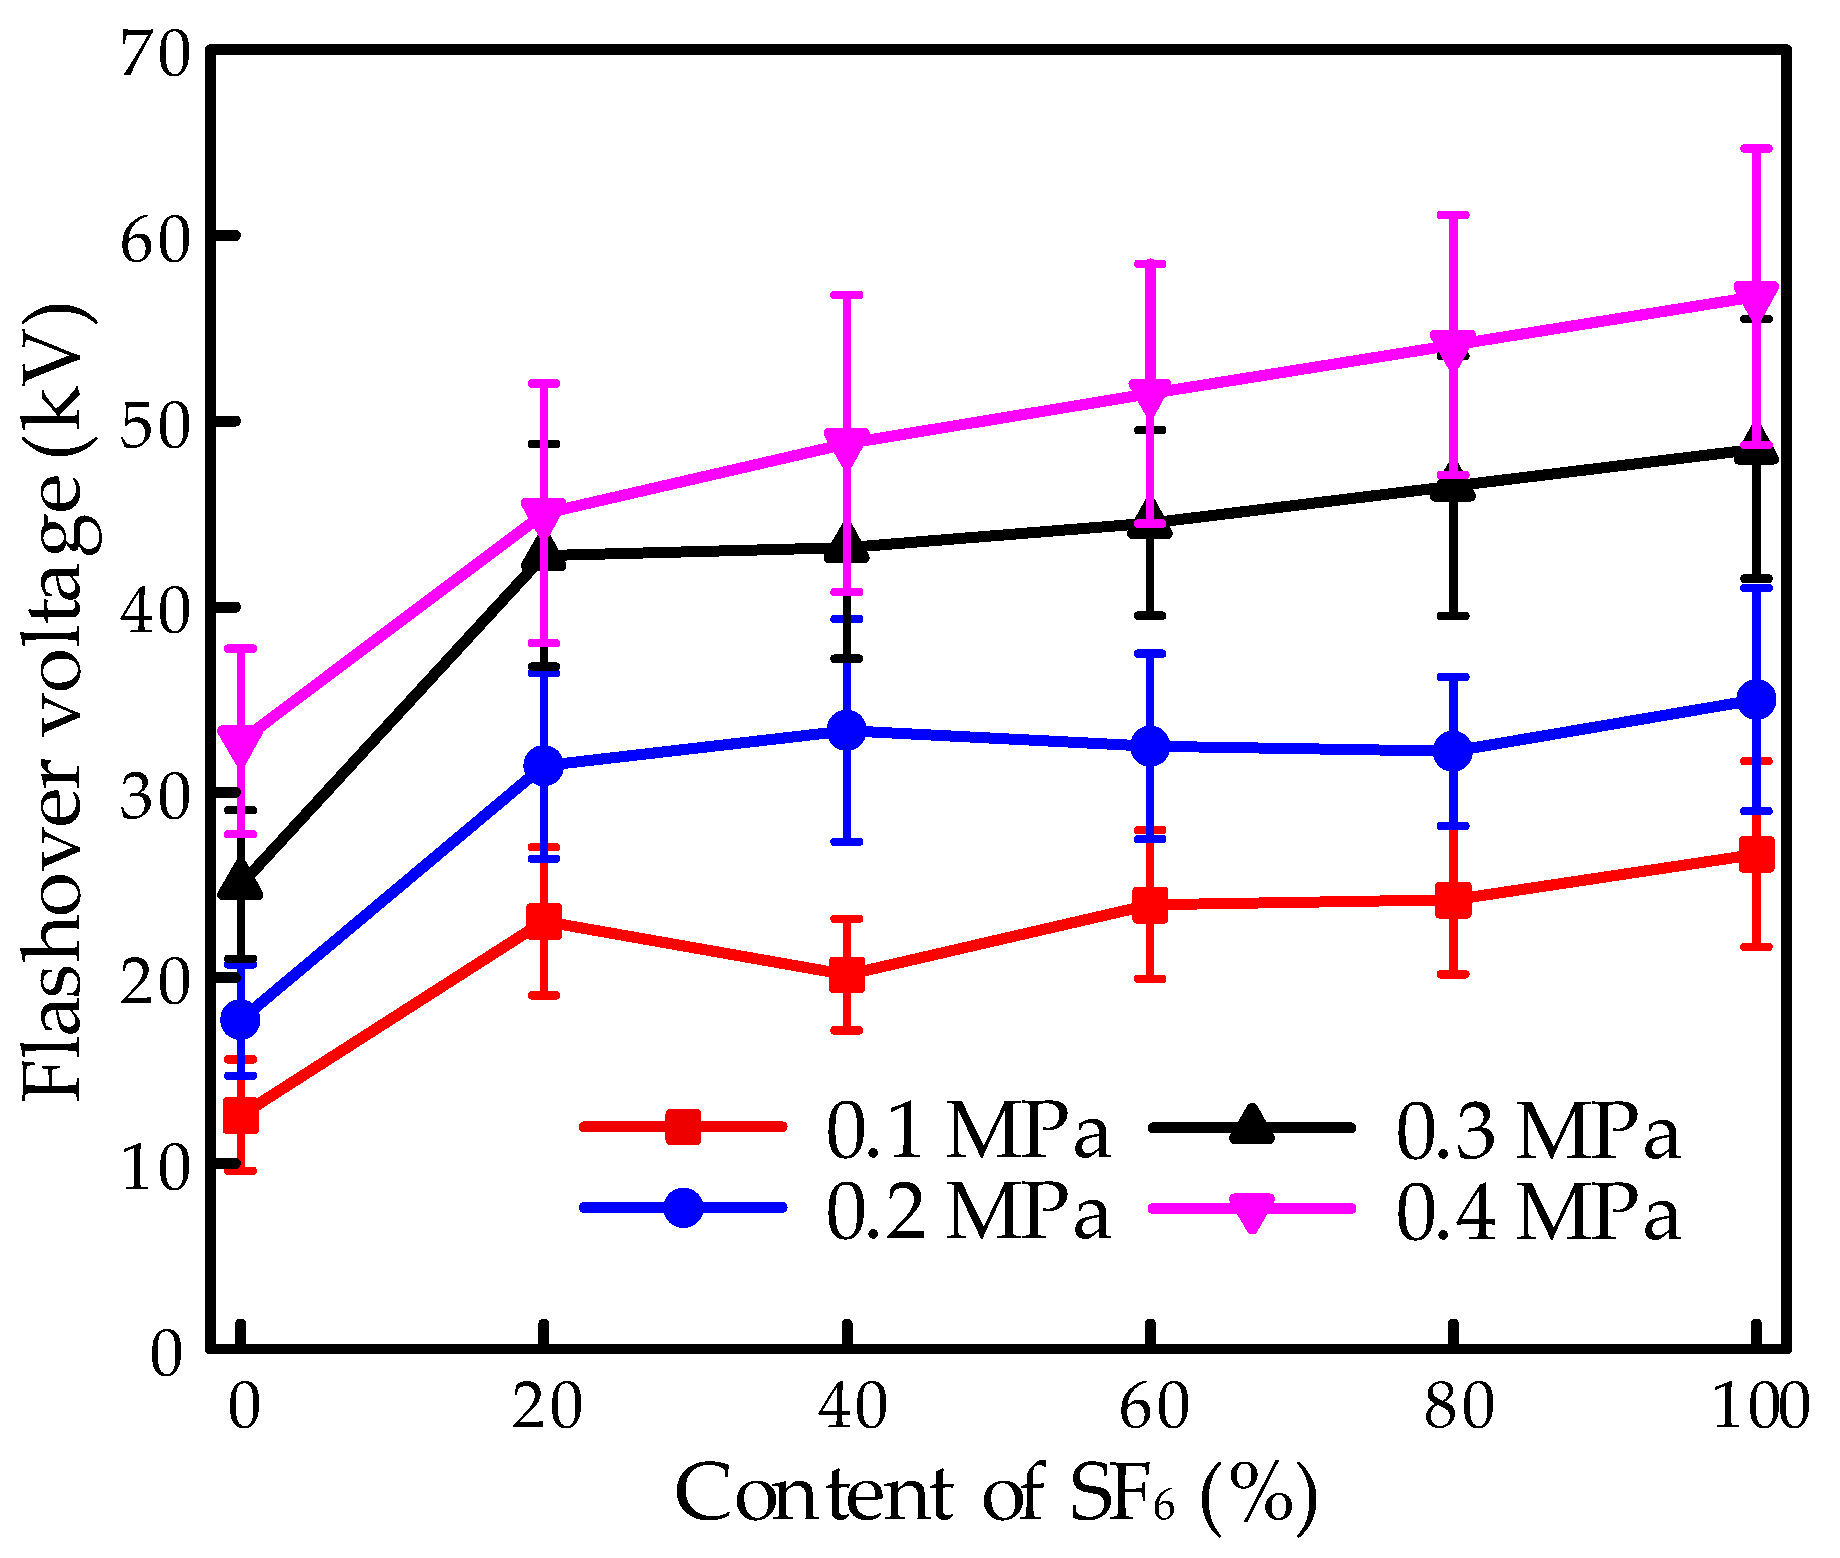
The flashover voltage under the needle-plate electrode system is illustrated in
Figure 5. With increasing pressure, the flashover voltage increased, obviously. Similar to the tendency in the finger-type electrode system, the flashover strength achieved a significant improvement with the mixture of SF
6 compared to that of CF
4, which could be attributed to the excellent insulation property of SF
6. Moreover, the flashover voltage increased with the increasing content of SF
6 and performed a saturate tendency. The flashover property performed an obvious increase with the addition of SF
6 at an extremely low content of 20% and then showed a slight improvement with a continuous increase in SF
6. The flashover voltage for the 80% SF
6/20% CF
4 mixture achieved a slight increase compared to the 20% SF
6/80% CF
4 mixture.
Double parameter Weibull distribution fitting was applied to investigate the flashover property with different mixtures. The Weibull fitting can be defined in Equation (1),
where the two key parameters mean the shape parameter
η and the scale parameter
β.
F represents the probability of the flashover process.
t represents the flashover voltage recorded. The typical results with 100, 80, 60, 40, and 20% SF
6 are shown in
Figure 6. The pressure was 0.4 MPa. The shape and scale parameters of the mixture from Weibull fitting are illustrated in
Table 1. The shape parameter reflects the slope of probability versus the flashover voltage; a high value indicates a high concentration of voltage. The scale parameter represents the flashover voltage at a probability of 63.2%, calculated from the fitting line as a feature voltage. The fitting results of the flashover property indicated the considerable performance in the 20% SF
6/80% CF
4 mixture compared to SF
6. Moreover, the mixture showed property surface flashover characteristics considering the balance between the shape and scale parameters, along with environmental considerations. The flashover voltage at 63.2% probability in the 20% SF
6/80% CF
4 mixture was calculated as 82.3% of SF
6 with a concentrated disparity.
The Weibull fitting results of the point-plate electrode system at 0.4 MPa are shown in
Figure 7. The voltage distribution with the contents of 20, 40, 60, 80, and 100% for SF
6 was illustrated. The shape and scale parameters calculated are illustrated in
Table 2. It was obvious that the flashover voltage increased with the increasing content of SF
6. However, when the content increased from 20 to 80%, the voltage at the probability of 63.2% obtained an increase of only 12.6%. The disparity showed no obvious difference for the various mixtures and displayed concentrate dispersion for the voltage records.
In a real GIS, the gas pressure in the busbar is typically 0.4–0.5 MPa [
3]. Thus, the performance of the gas mixture at 0.4 MPa is beneficial in evaluating its substitute for SF
6 gas applied in a real GIS busbar. However, the result indicates the degradation of dielectric strength for the 20% SF
6/80% CF
4 mixture with increasing pressure, especially for pressures higher than 0.3 MPa. It needs to be emphasized that this degradation tendency in
Figure 5 is obtained with the needle-plate electrode system, which corresponds to the extremely uneven electric field, while the electric field distribution in the real GIS busbar is slightly uneven. In
Figure 3, the result corresponding to a slightly uneven electric field shows a slight degradation tendency for the 20% SF
6/80% CF
4 mixture. Thus, the 20% SF
6/80% CF
4 mixture can be regarded as a potential substitute for SF
6 gas in cold weather. Attention should be paid to this degradation tendency under extremely uneven electric fields, since local electric field distortion may appear during operation due to the surface defect of the crack or metallic particle.
3.2. Synergistic Effect
The evaluation of the synergistic effect was applied to analyze the influence of the interaction between SF
6 and CF
4 in the flashover process. The synergistic effect concerns the phenomenon that the dielectric strength of the gas mixture shows superiority to the weighted average of each constituent and behaves in a non-linear relation [
5,
12]. The synergistic effect could be evaluated with Equation (2),
where
Um represents the flashover voltage in the gas mixture consisting of
g1 and
g2.
U1 represents the voltage of
g1, which shows a higher voltage, and
U2 represents the voltage of
g2, with a lower voltage.
ρ1 is the partial pressure ratio of
g1, and
ρ2 is the partial pressure ratio of
g2.
C is defined as the synergistic coefficient with a scope from 0 to 1. The voltage increases linearly with the synergistic coefficient equal to 1 while staying the same as a superior gas with the synergistic coefficient equal to 0 when the content of the superior gas was increased. A low coefficient indicates that the same improvement in the insulation property could be achieved with a low content of superior gas. A typical synergistic effect on the performance of the flashover property is shown in
Figure 8 with various mixtures. The results illustrated the influence of gas pressure under a finger-type electrode system, with the results of 20% SF
6/80% CF
4, and 40% SF
6/60% CF
4 as examples, calculated from
Figure 3.
The synergistic effect increased as the pressure increased from 0.1 to 0.3 MPa and performed a similar tendency with the breakdown property in the gas mixture. However, by continually increasing the content of SF6, the synergistic effect decreased slightly, which was opposite to the property in the gas breakdown process.
The synergistic effect under the needle-plate electrode system was illustrated in
Figure 9 with the purpose of investigating the influence of pressure on the extreme non-uniform electric field. The synergistic effect decreased with the increasing pressure at high pressures. The non-linear tendency versus pressure is attributable to the influence of accumulated charge on the surface of the EP sample when the sample was applied to the HVDC electric field. Surface charge is considered to accumulate under the stress of the electric field owing to the field emission caused by points on the electrode surface, partial discharge due to the air gap between the solid dielectric and electrode, interlayer polarization considering the difference between dielectrics, discontinuity or non-linearity on the conductivity of the EP sample, etc. [
15,
16,
17]. Moreover, the accumulation of surface charge would be a serious issue under the HVDC electric field. The accumulated surface charge would lead to a serious distortion of the electric field and promote the flashover process due to the high voltage at high pressures, thus resulting in the decrease in the synergistic effect. Moreover, due to the extreme non-uniform electric field, it would perform more serious charge accumulation, thus leading to a more obvious influence on the synergistic effect, with increasing voltages corresponding to the increasing pressure in the needle-plate electrode system compared to the finger-type electrode. Therefore, the synergistic coefficient in
Figure 9 showed a more obvious increasing tendency versus pressure at high pressures from 0.2 to 0.4 MPa. In a previous work, the SF
6/CF
4 mixture showed an excellent synergistic effect in the breakdown characteristics under the extreme non-uniform electric field [
11]. However, in flashover characteristics, due to the surface charge accumulation and the corresponding effect of field distortion on the flashover process, the synergistic effect gets worse in the needle-plate electrode system.
The synergistic effect of the finger-type electrode system is shown in
Figure 10 with various contents of SF
6. The coefficient increased with the increasing the content of SF
6. This indicates that once a low content of SF
6 was mixed with the CF
4 gas, the mixture would perform a significant improvement in the flashover property. However, by continuously increasing the content of SF
6, the influence of SF
6 would slow down, which confirms the similar tendency with the breakdown characteristics of the gas gap in the SF
6/CF
4 mixture.
The synergistic coefficient in the needle-plate electrode system showed a similar monotonic increasing tendency with the increasing content of SF
6 at the pressure of 0.2 MPa, as shown in
Figure 11, compared to the result in
Figure 10. However, the coefficient showed a non-monotonic increasing tendency with the increasing pressure of the SF
6/CF
4 mixture, as the synergistic coefficient decreased at low contents and grew up, continuously increasing the content. This indicates the influence of non-uniformity on the synergistic effect with the increasing content of SF
6. This may be attributable to the influence of severe discharge in the CF
4 gas and the corresponding accumulation of surface charge. It is considered that discharge and ionization would easily occur in CF
4 gas at low voltages compared to SF
6 due to the disadvantage in the insulation property of CF
4. In this experiment, micro-discharge would occur at an extremely low content of SF
6, especially at high pressures, due to the influence of high voltage before the flashover occurred. This would lead to an increase in the charge accumulation on the dielectric surface and thus promote the possibility of flashover, especially for the extreme non-uniform electric field. With the increasing content of SF
6, the discharge phenomenon was restrained along with the charge accumulation, leading to an increase in the insulation property. Thus, with the increasing content of SF
6 at low contents, the influence of charge accumulation at the interface functions as the key factor due to the excellent insulation property of SF
6 resulting in the suppression of charge accumulation, which leads to an increase in the flashover property.
3.3. Polarity Property
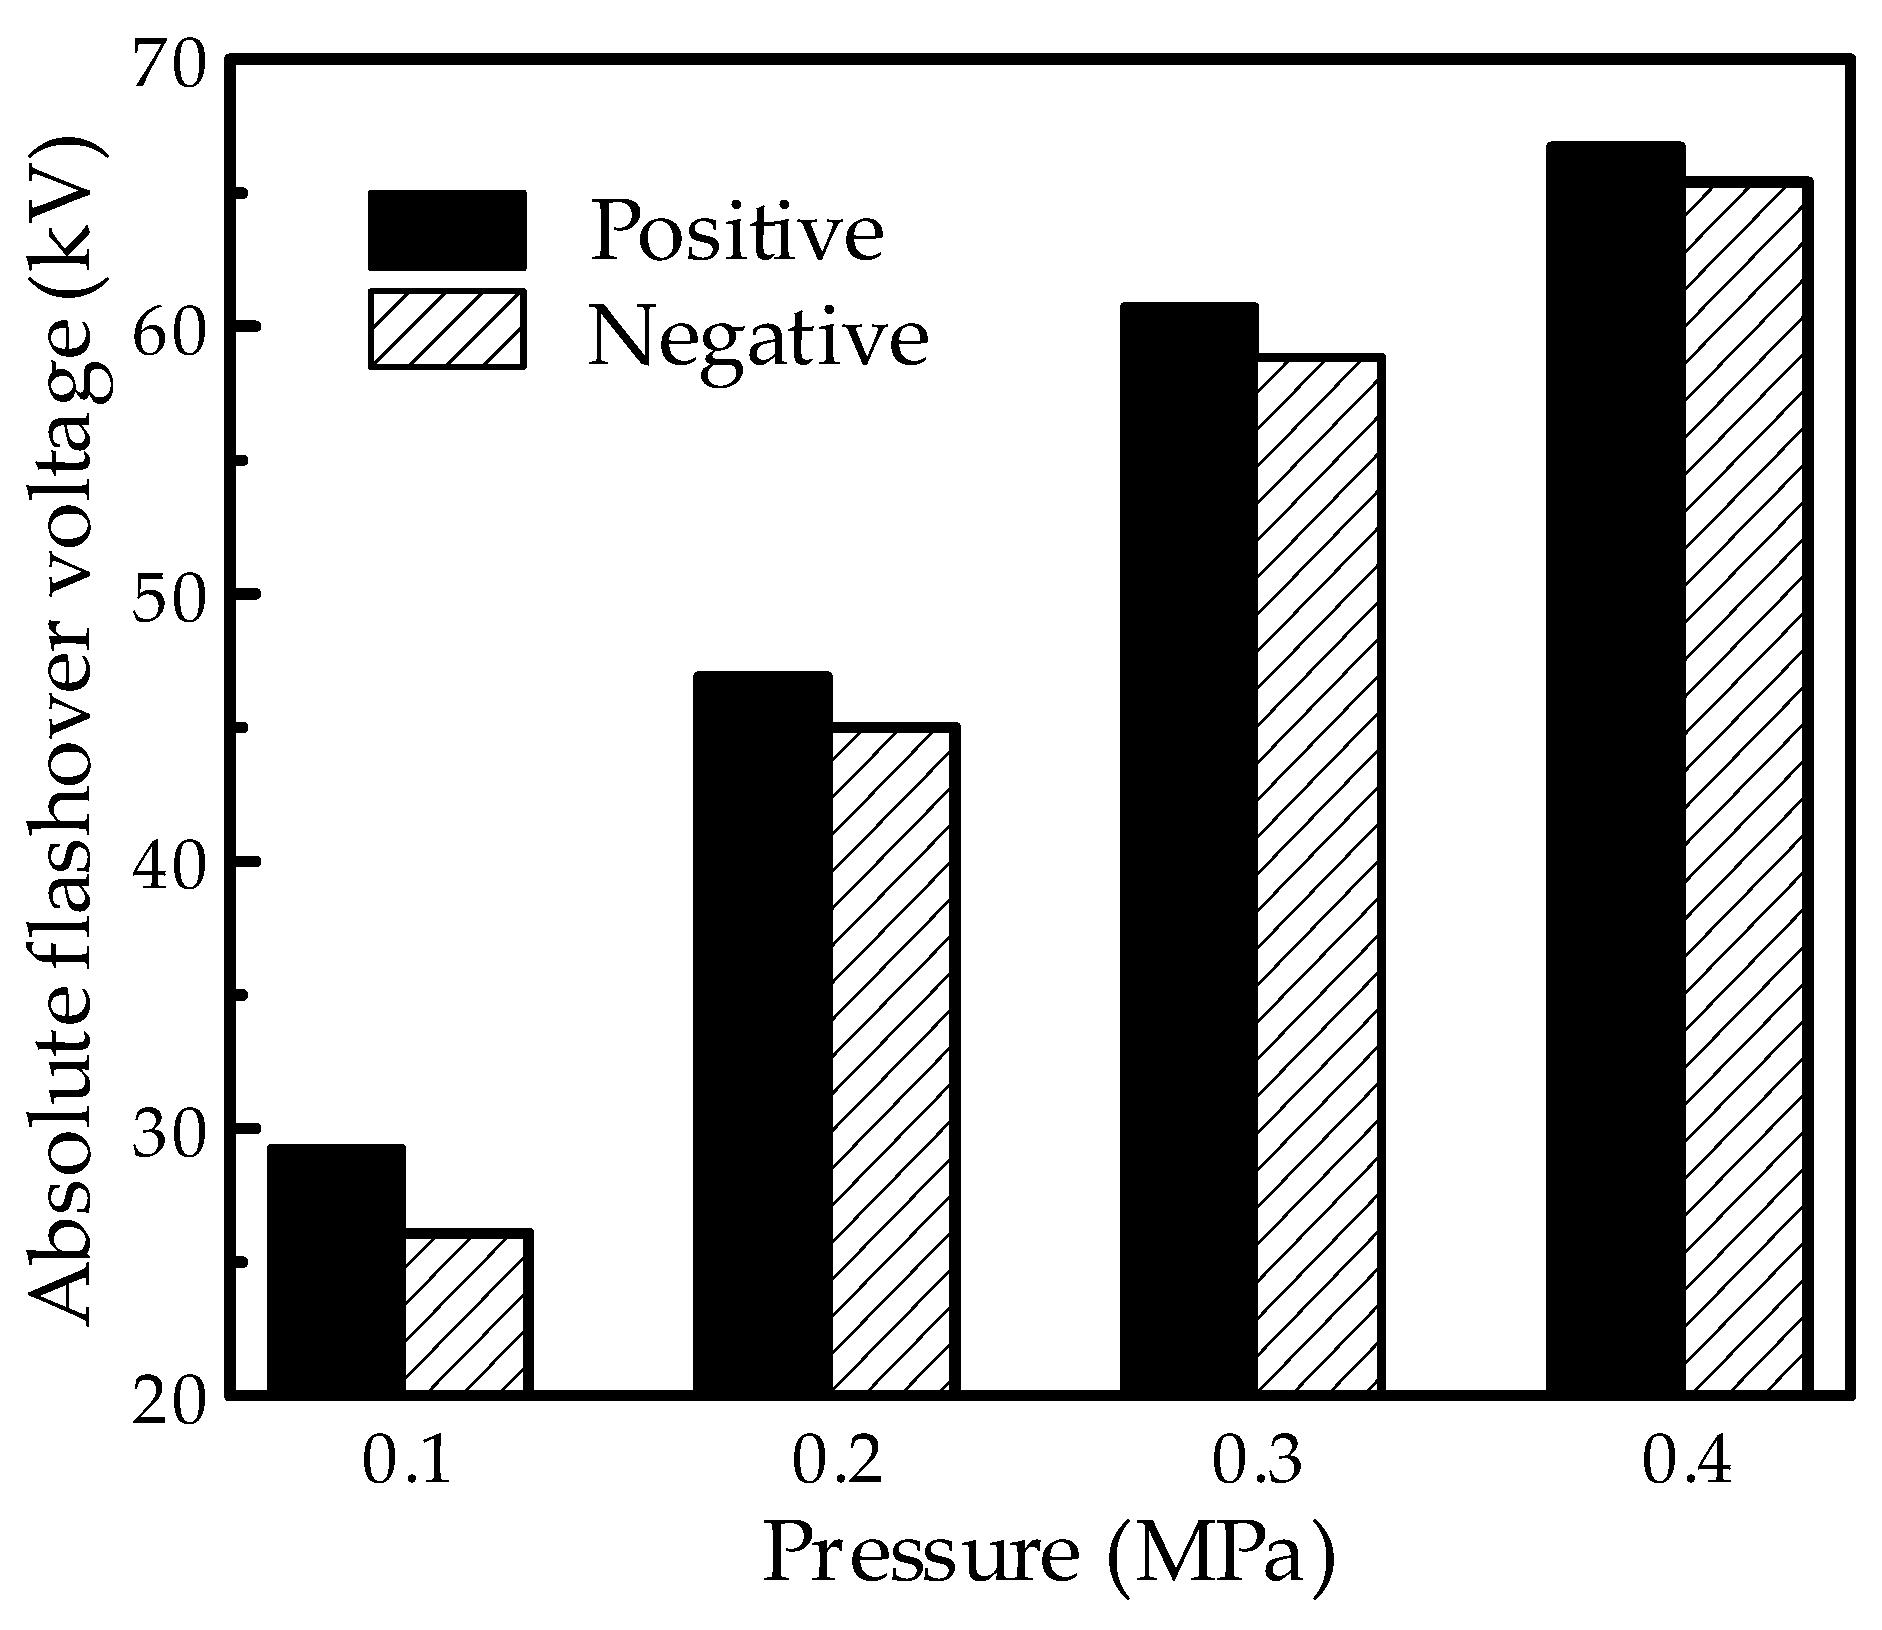
The flashover property in the mixture at positive and negative polarities was investigated under the needle-plate electrode system with an extreme non-uniform electric field. The typical results with a content of 60% are shown in
Figure 12, and the absolute voltage values are illustrated in the figure. As can be seen, the absolute voltage increased with the increasing pressure of the mixture for both the positive and negative polarities. Moreover, when the pressure increased from 0.1 to 0.4 MPa, the negative flashover voltage showed a higher increment compared to the positive polarity. This leads to an obvious reversal of the polarity effect in the flashover property as higher positive flashover voltages occur at lower pressures, while higher negative flashover voltages occur at higher pressures. However, no obvious reversal phenomenon appeared in the test under the finger-type electrode system.
The flashover property for different polarities in the mixture at low pressures is illustrated in
Figure 13 and
Figure 14.
Figure 13 concerns ionization and the charge property and
Figure 14 shows the corresponding electric field distribution on the surface due to the charge distribution. Ionization would occur at the tip of the needle electrode and result in the formation of positive ions and electrons. The generated electrons would easily move to the plate electrode with the stress of the external electric field force owing to the low pressure. Thus, the residual, considerable number of positive ions would gather at the solid–gas interface and lead to the accumulation of the surface charge of hetero-polarity with a negative needle electrode, as shown in
Figure 13a. This would contribute to the increase in the surface electric field and improve the probability of flashover, as shown in
Figure 14a. However, the electrons generated in ionization would move to the needle electrode due to the stress of the electric field force when the needle electrode was applied with positive polarity, as shown in
Figure 13b. The residual positive ions would form an accumulated homo-charge at the surface of the EP sample, resulting in the reduction of the electric field strength at the tip. Thus, the flashover process would be restrained due to the accumulated charge. The influence of the accumulated surface charge on the field distribution with a positive needle electrode is shown in
Figure 14b.
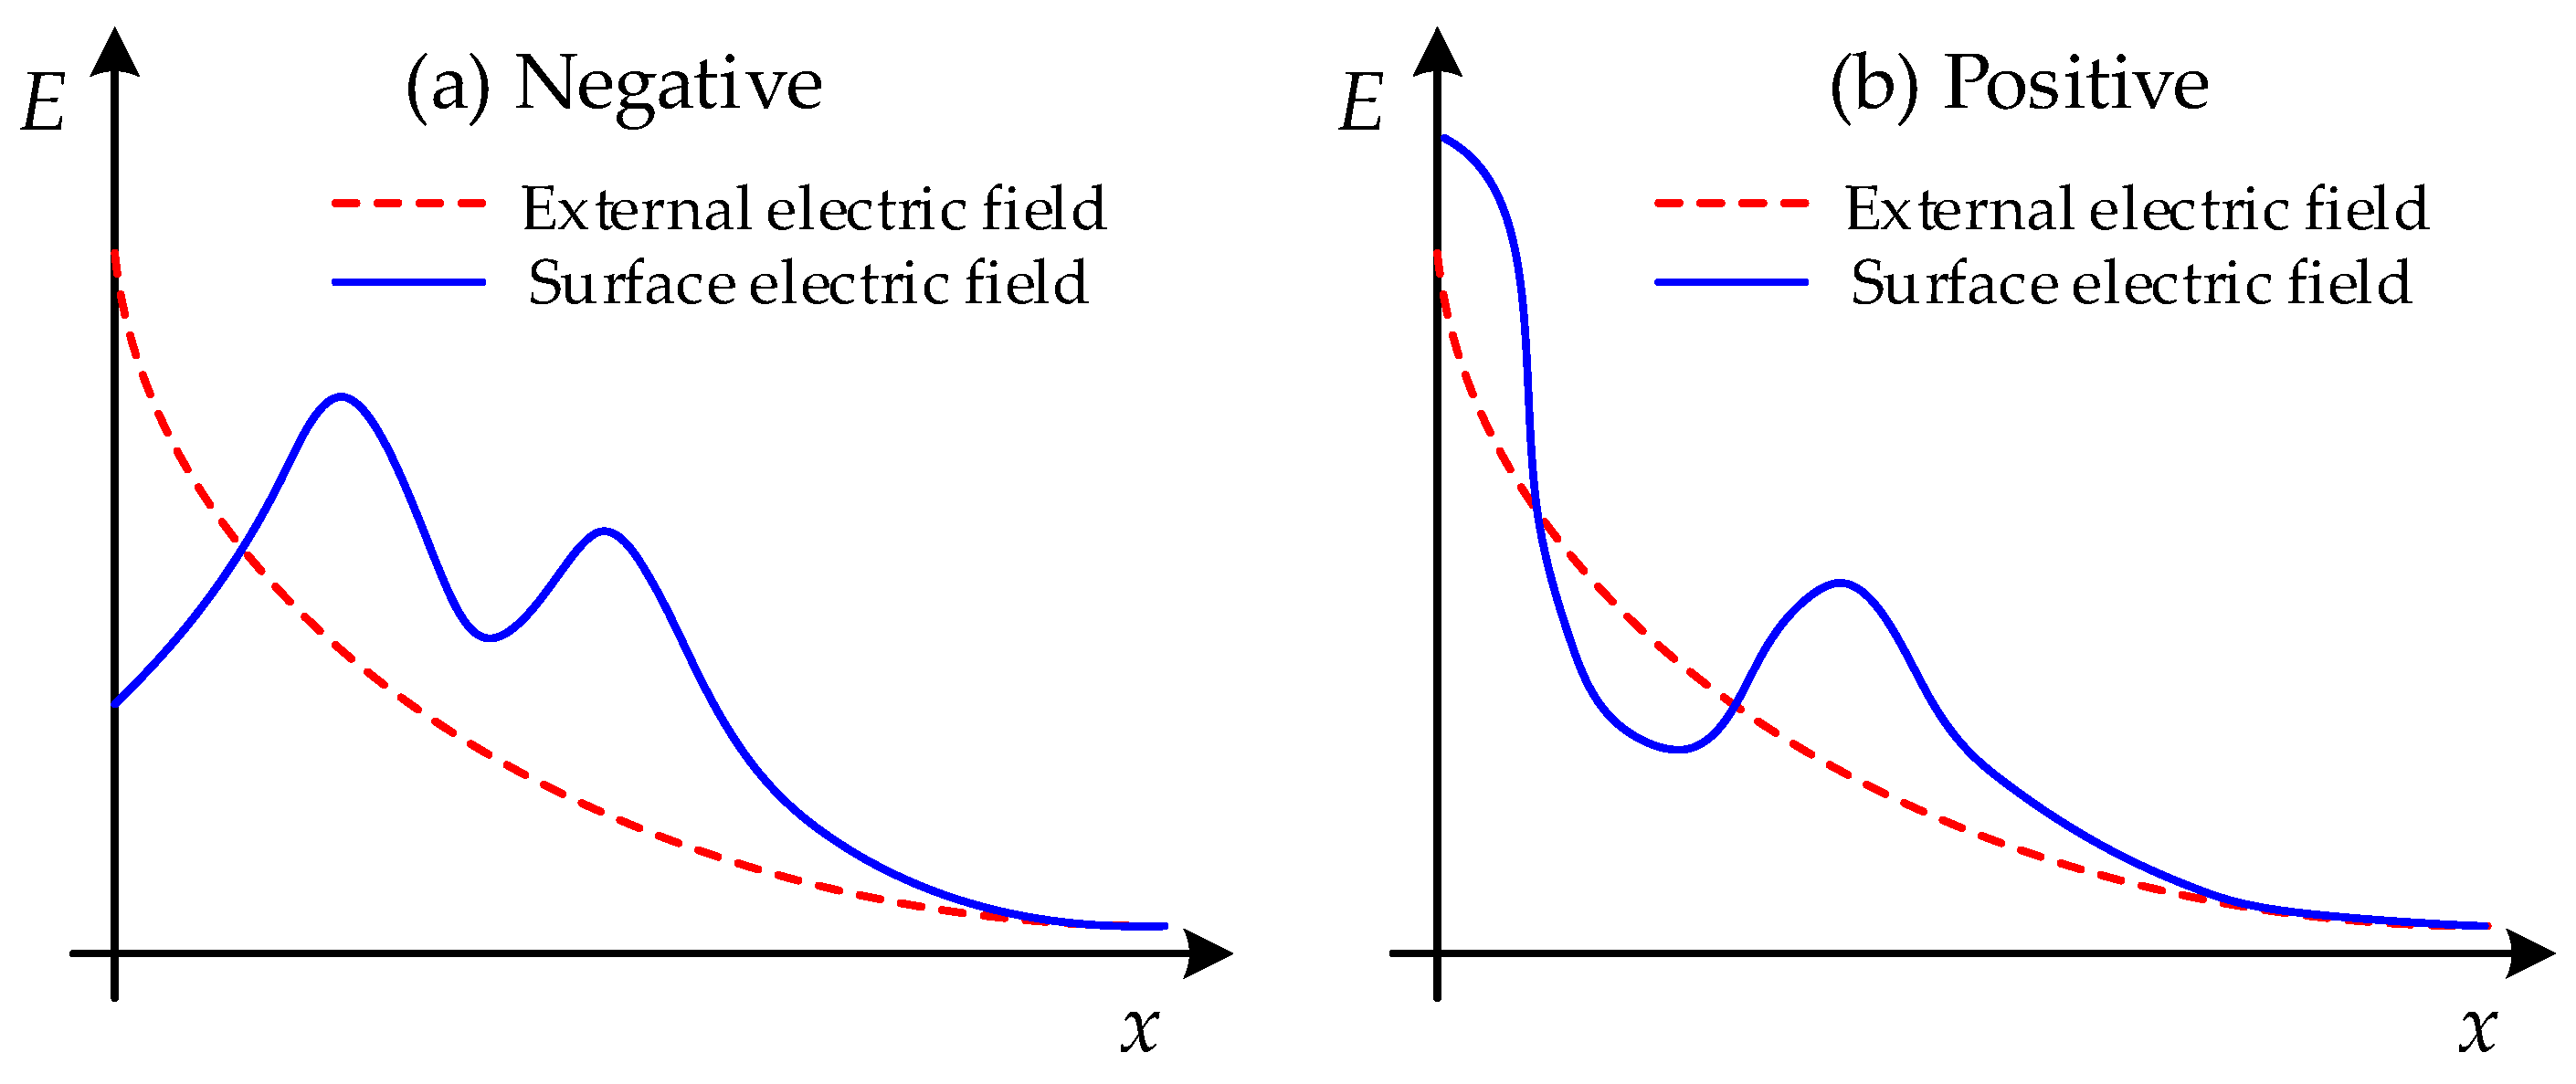
Figure 15 illustrated the corresponding influence of the generated ions and the accumulated surface charge when high gas pressure was applied in the flashover process. Meanwhile, the electric field distribution along the surface is shown in
Figure 16 considering the influence of accumulated charge. Considering the high pressure applied, it would be restrained for the diffusion and movement of the generated positive ions and electrons, leading to a large amount of charge remaining at the tip area. Due to the high electro-negativity of the SF
6 and CF
4 molecules, the electrons would be attracted, resulting in the formation of numerous negative ions [
3,
12]. Thus, as illustrated in
Figure 15a, these negative ions would accumulate at the surface in the vicinity of the electrode tip as a consequence of the high pressure. This could lead to the decrease in the electric field, as shown in
Figure 16a, and contribute to the improvement in the flashover property for the negative needle electrode. However, the accumulated negative surface charge would perform as a hetero-polarity charge, as shown in
Figure 15b, with a positive needle electrode at high pressures.
Figure 16b illustrates the corresponding enhancement in the electric field strength at the tip. Thus, the voltage showed a low value in positive polarity compared to negative polarity. Due to the strong electronegativity of SF
6, the effect of polarity showed a more serious reversal phenomenon. In this case, the decreasing tendency of the charge property would reduce the reversal property due to the influence of low electronegativity for CF
4. Thus, with the mixture of CF
4, the reversal property would decrease in the mixture.
It needs to be emphasized that the curves in
Figure 14 and
Figure 16 are not the exact electric field distribution by the finite element analysis (FEA) calculation, since it is difficult to calculate the surface charge distribution corresponding to the two figures with the FEA method due to the complex reactions and processes in ionization. The curves just illustrate the relative relation between the surface electric field distribution and the external electric field distribution in each condition.
Moreover, due to the enhancement in the uniformity of the electric field, the charge accumulation was prevented, and the influence of surface charge on the polarity property decreased in the finger-type electrode system, as indicated in
Figure 17. Thus, the voltage polarity showed no obvious influence on the reversal phenomenon.
It is known that the regenerative dielectric character of SF6 contributes to its application in circuit breakers as the arc-extinguishing medium. Once referring to the breakdown or flashover performance, the regenerative dielectric character is not that important. The energy released due to flashover is extremely lower than that due to arcing; thus, there is no massive ionization or decomposition of the insulating gas molecule due to flashover compared to what happens during arcing. The ionization or decomposition along the discharge path would be compensated quickly after the flashover owing to the thermal motion of the gas molecule. In the future, the authors will carry out experiments to further reveal the regenerative dielectric character of the SF6/CF4 mixture to achieve comprehensive knowledge of the flashover characteristics.


