1. Introduction
The prices of different energy sources are one of the most significant driving forces of economic growth and development of industrialised societies [
1]. They influence production costs, wages, and the prices of raw materials and products [
2]. Therefore, it is essential to reduce energy consumption, especially for energy-intensive sectors such as coke oven plants, steelworks, paper mills, or refineries.
By the end of 2021, energy prices were extremely high and remained at this level in the first quarter of 2022.
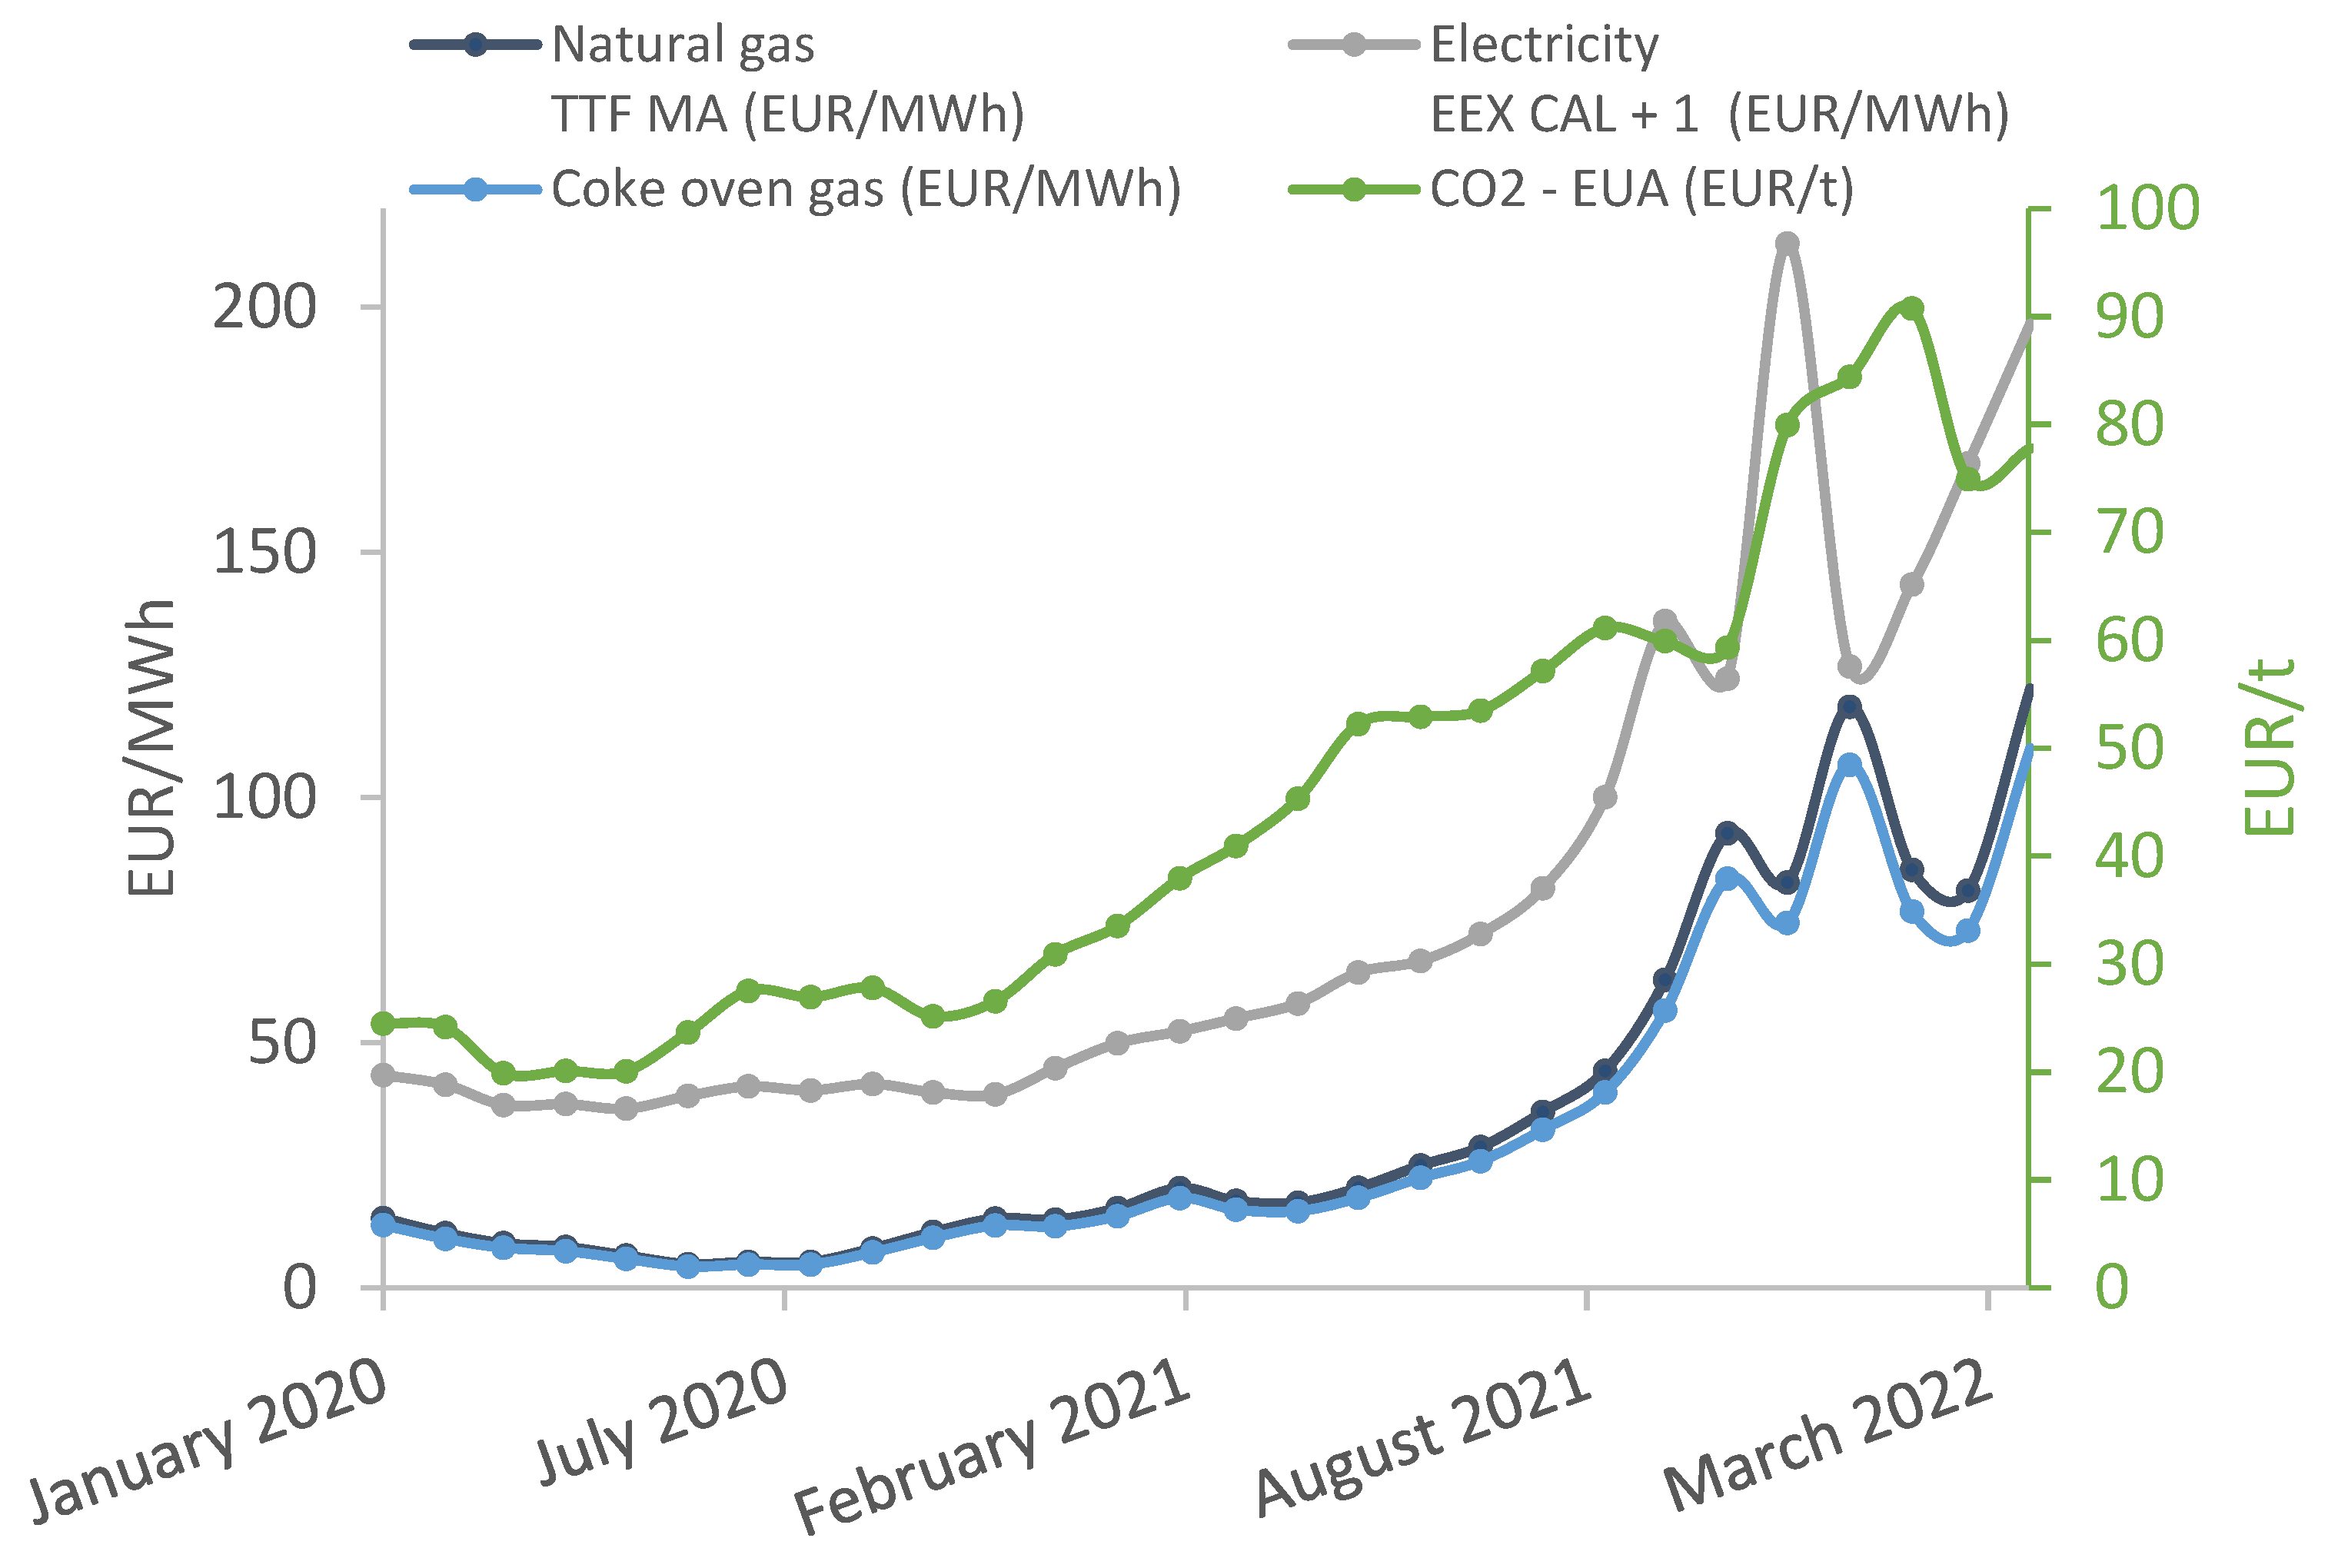
Figure 1 shows the tendency of the price growth of different energy commodities. The cost of natural gas has increased almost 500%, while the electricity price has increased by 390% since the beginning of 2020. The price of coke oven gas depends on natural gas. Accordingly, it has also increased by almost the same amount. The cost of an EU carbon allowance has tripled over the past two years [
3]. By 2027, there will be no free carbon allocation, which will cause extra costs for installations [
4].
The sharp rise in energy prices has caused severe problems for many sectors of the production industry. As a result, several corporations have decided to decrease their production or have experienced a shutdown. The most significant negative impact of rising energy prices has been on continuous operational plants. For instance, chambers of coke oven plants cannot be allowed to cool below a certain temperature, as this would result in irreversible damage to the refractory walls, which could even trigger the collapse of the unit. However, the effect of rising costs can be moderated by effectively utilising the existing energy, mainly by-products and waste from processes [
5].
Besides the continuous increase in energy prices, stricter environmental regulations make the operation of process industries more difficult. In addition, national and international agreements lay down rules to prevent or at least reduce emissions. Therefore, existing technologies need to be continuously improved and operate as effectively as possible to meet standards.
The mentioned issues make it more challenging to operate coke oven plants profitably, although their main product, coke, is the fundamental raw material of the iron and steel industry. Coke is produced by high-temperature pyrolysis of appropriate quality coal blends. During pyrolysis, a large quantity of raw coke oven gas is generated, which can be considered as a by-product or as waste gas. The composition of both the coke and the gas depends on the quality of the coal blends. The most relevant quality parameters of the blends are moisture content, ash content, volatile matter content, sulphur content, and special coal quality parameters (e.g., dilatation, swelling index) [
6].
Properly cleaned coke oven gas is a valuable energy substitute for natural gas. From the coke oven chambers, so-called raw coke oven gas is collected. The raw coke oven gas contains water, valuable components, and impurities as well. Coal tar and light oil (benzene, toluene, xylene, and other aromatic hydrocarbons) can be merchandised after separation, while impurities such as ammonia, hydrogen sulphide, or hydrogen cyanide need to be removed due to emission requirements. The raw coke oven gas treatment is initiated with a precooling step, so coal tar and water condense from the gas. Then, the gas passes through electric precipitators, where fine drops of tar are removed and cooled. This is followed by the removal of impurities in an absorption section. The final step is the light oil recovering in washing towers by special washing oil. Between 40 and 50% of the cleaned gas is recycled to heat the chambers of the coke oven battery, while the rest of it is used in the integrated steel plant as required, and the surplus is burned in gas engines.
The main components of the purified coke oven gas are hydrogen and methane; thus, it has a high heating value (natural gas: 56.6 MJ/kg, coke oven gas: 41.6 MJ/kg, blast furnace gas: 2.7 MJ/kg) [
7]. This is why coke oven gas, together with blast furnace gas, covers a significant part of the fuel needs of integrated steel plants, so natural gas is used only as supplementary fuel [
8]. Furthermore, using properly cleaned waste gas helps reduce the natural gas consumption, which makes the whole steel production more economically and environmentally sustainable [
9]. Moreover, different on-site and off-site coke oven gas utilisation routes have been investigated, including energy generation in combined heat and power plants (CHP), hydrogen and syngas production, and methanol synthesis [
7].
Using coke oven gas as an energy source, its composition needs to meet regulatory and technological limits. European Directives lay down rules to prevent or reduce emissions in order to reach a high level of environmental protection [
10]. The Commission Implementing Decision establishes the best available techniques (BAT) conclusions on emissions for industrial plants. In addition, it specifies the standards for cleaned coke oven gas. The residual hydrogen sulphide concentration must be <300–1000 mg/Nm
3 (using an absorption system) or <10 mg/Nm
3 (using wet oxidative desulphurisation). Furthermore, during the combustion of the coke oven gas, the emission level needs to be <200–500 mg/Nm
3 for SO
x and <350–650 mg/Nm
3 for NO
x [
11].
The most widely applied cleaning technology for coke oven gas is aqueous ammonia absorption. However, there is a trend for new technologies, such as Takahax, Stretford, Potassium Carbonate, or Sulfiban process, etc., which use more efficient absorbents. These processes avoid the adverse effects of trace impurities and provide higher H
2S removal efficiency than ammonia scrubbing [
12]. However, despite the advantages, the changeover or installing of these processes in existing plants is rather costly and often unfeasible due to continuous operation and the lack of available area in the plant.
It is more and more required to improve the existing coke oven gas purification technologies, which often means not to change the process or modernise the equipment and units, but to optimise and effectively manage the process and train competent operating staff. Implementing these alternative solutions, flowsheet simulators can be valuable tools. With the help of process simulators, the optimal mode of operation can be found adequately, and operational staff can be trained for different situations [
13]. Detailed and validated process simulators can assist in aiding understanding of general and specific features of technology behaviour. Different effects and experiments can be investigated without disturbing the real operation [
14]. On the other hand, creating the proper simulation of this system is a rather complicated task, as coke oven gas purification represents a complex multicomponent separation process with numerous parallel and competitive chemical reactions.
The studies concerning coke oven gas mainly investigate the development of the technology by new solutions, column packings, or equipment, but there are only a few studies focusing on modelling, simulation, or optimisation.
A German research team developed a rigorous dynamic two-phase model for a theoretical description of coke oven gas purification. The basis of the model is the two-film theory. It considers several parameters such as diffusional interactions, thermodynamic non-idealities, the effect of chemical reactions on mass transfer, and the impact of structured packings and liquid distributors on hydrodynamics and electrical potential gradients. Steady-state and dynamic experiments were carried out in a pilot-scale gas scrubber, and the results were close to experimental data [
15].
A German research group described the chemical absorption for the system NH
3-CO
2-H
2S-NaOH-H
2O with a non-equilibrium heat and mass transfer model. The validation was performed through experimental studies. This model can extend to other reactive substances, such as monoethanolamine (MEA) or methyl diethanolamine (MDEA). Moreover, the optimal pH range was determined for selective H
2S removal [
16]. Then, this group developed a rigorous rate-based model for a coke oven gas cleaning process. The multicomponent mass transfer of the impurities was investigated in aqueous potassium hydroxide or potash solutions. For validation, a pilot plant and industrial measurements were used. The industrial process was systematically optimised using an evolutionary strategy; thus, a 30% decrease can be reached in annual cost [
17].
Another research team developed a model to evaluate solutions for H
2S removal from coke oven gas. The model validation was based on industrial data, and further investigations were performed. Three process configurations were compared, and the best configuration could achieve a 5% increase in removal efficiency. Applying this configuration makes possible the use of coals with higher sulphur content [
18].
A Canadian research group proposed a combined cycle power plant (CCPP) in which coke oven gas can be applied as fuel. However, before the gas can be used in the CCPP, most of the H
2S needs to be removed. The investigated plant could not clean the gas as much as required, so a sulphur removal system was designed and simulated with ProMax. The CCPP was simulated in Aspen Plus and was optimised using GAMS. The optimised CCPP can generate more than twice the electrical efficiency of the existing steel refinery, and hence the purchase of electricity reduces, which contributes to a reduction in CO
2 emissions [
19].
A research team modelled a H
2S removal unit for coke oven gas consisting of an absorption column and a regeneration column. A sensitivity analysis was conducted to identify the impact of methyldiethanolamine (MDAE) concentration and temperature. Furthermore, the optimal operating conditions were investigated based on energy consumption and removal efficiency [
20].
However, the system is more complex in our case because the three columns are interlinked through the used water streams. The recirculating water streams also increase the complexity of the system. On the other hand, there are physical boundaries which need to be kept in mind, including seasonal changes in the cooling water temperature (that is, with the increasing changes in summer, temperature could reach 35 °C). Creating this model is challenging because it is a complex multicomponent separation process with several parallel chemical reactions. The task is further complicated by the lack of technical information and the limited number of measured data. However, a proper process simulator can help provide constant gas composition even under changing conditions caused by uncertain market effects (e.g., disruption of raw material supply and rising energy prices).
In this study, the steady-state model of an industrial coke oven gas purification process was created. First, the model parameters (construction- and packing-related) were identified. Then, two optimisation scenarios were presented, showing different optimal operation points with or without considering the washing water temperature.
3. Results and Discussion
The steady-state model of the coke oven gas purification technology was built as described in
Section 2.3.
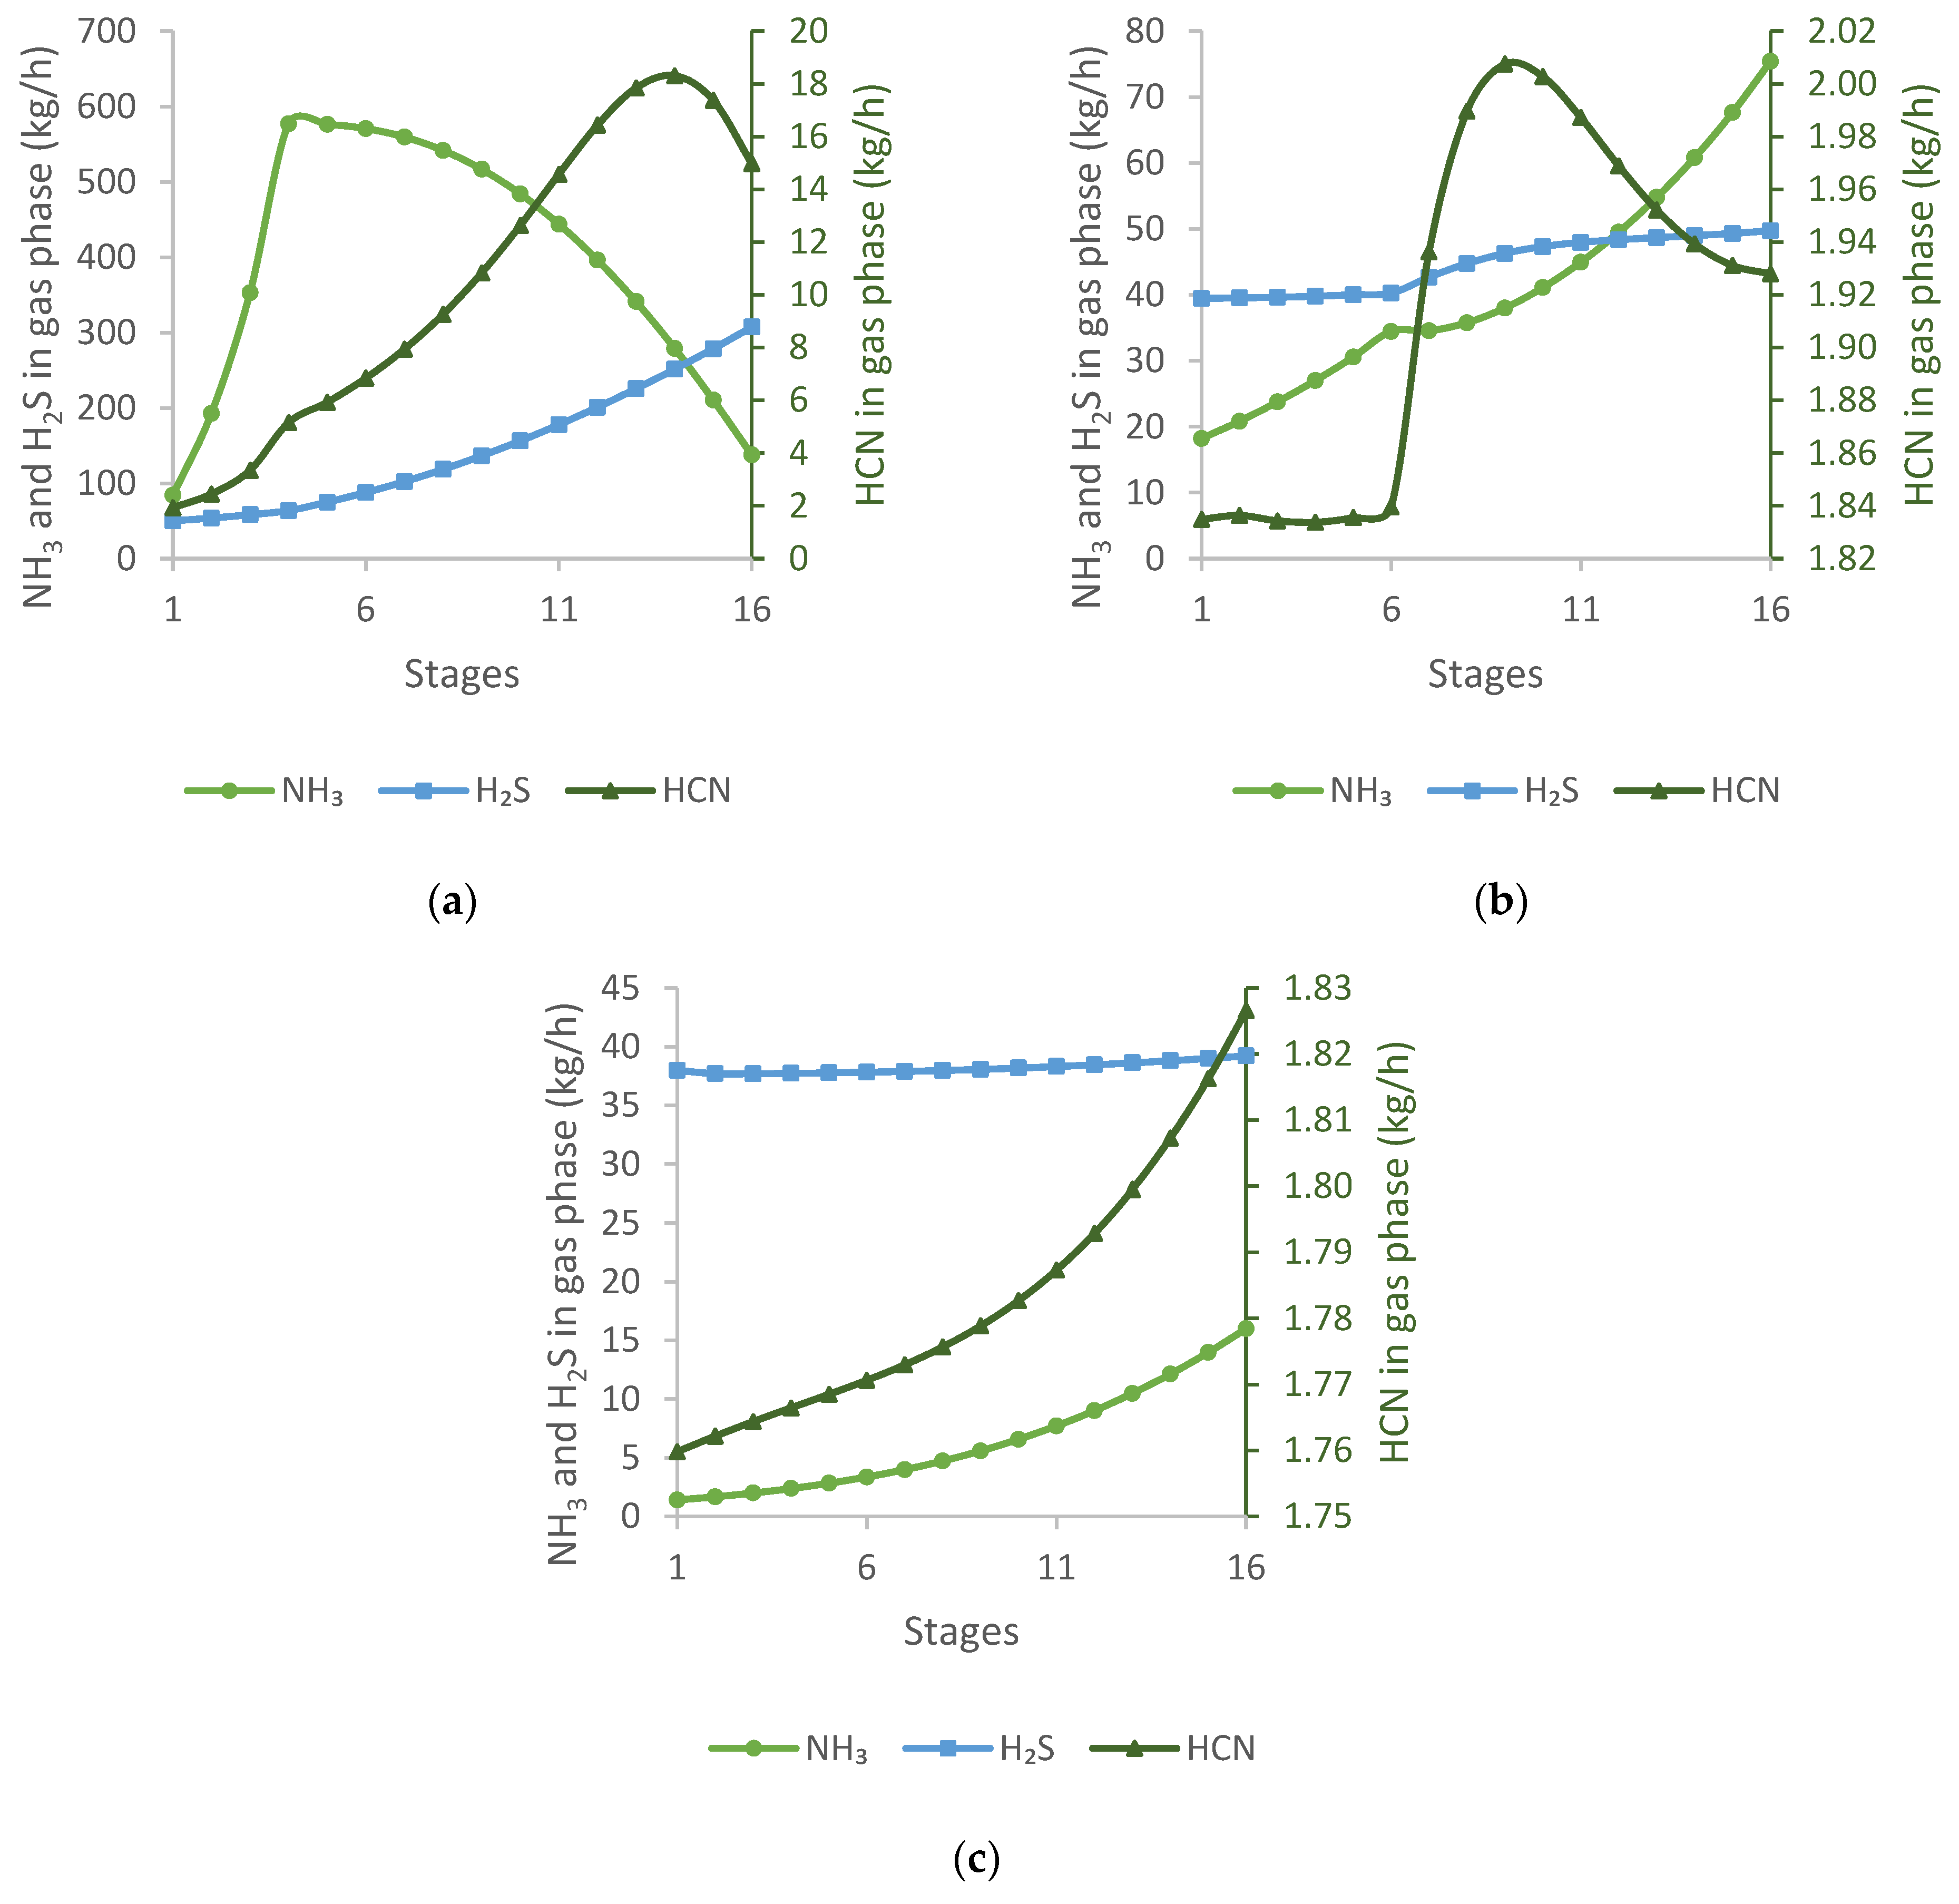
Figure 4 shows the mass flow profiles of H
2S, NH
3, and HCN in the gas phase, along with the scrubbers.
To fine-tune the model, the fmincon function of MATLAB was used, similar to the method applied for optimisation tasks. This was necessary since the design of the columns and the packings are unique. In this way, the tuning factors of the three columns were changed. As a result, it was found that the greatest effect on the composition of the output coke oven gas among all the tuning factors was the liquid mass transfer coefficient factor. Therefore, the liquid mass transfer coefficient factors of the three columns were varied between 0.05 and 80 and searched for the value at which the composition of output coke oven gas was closest to the measured values. For this purpose, the following objective function was used:
where H
2S and NH
3 are the measured values.
In
Figure 4a, it can be observed that, in the H
2S scrubber, the amount of NH
3 increases until the de-acidified water input stage and then decreases rapidly. The quantity of H
2S decreases sharply at first and then slows down. HCN in the gas phase increases slightly up to the inlet and then decreases sharply.
In the NH
3 scrubber, shown in
Figure 4b, there is a breakpoint in each mass flow profile where coal water is fed. Almost all NH
3 from the coke oven gas is removed in this column. As a result, the amount of H
2S is slightly reduced, while HCN increases due to the input of the coal water.
In the fine NH
3 scrubber, all the three impurities are reduced, but only NH
3 shows a more significant reduction. The mass flow profiles in the third column are shown in
Figure 4c.
3.1. Sensitivity Analysis
3.1.1. Parameters That Can Be Influenced
In the following, the results of the effects of parameters that can be changed during operation are presented.
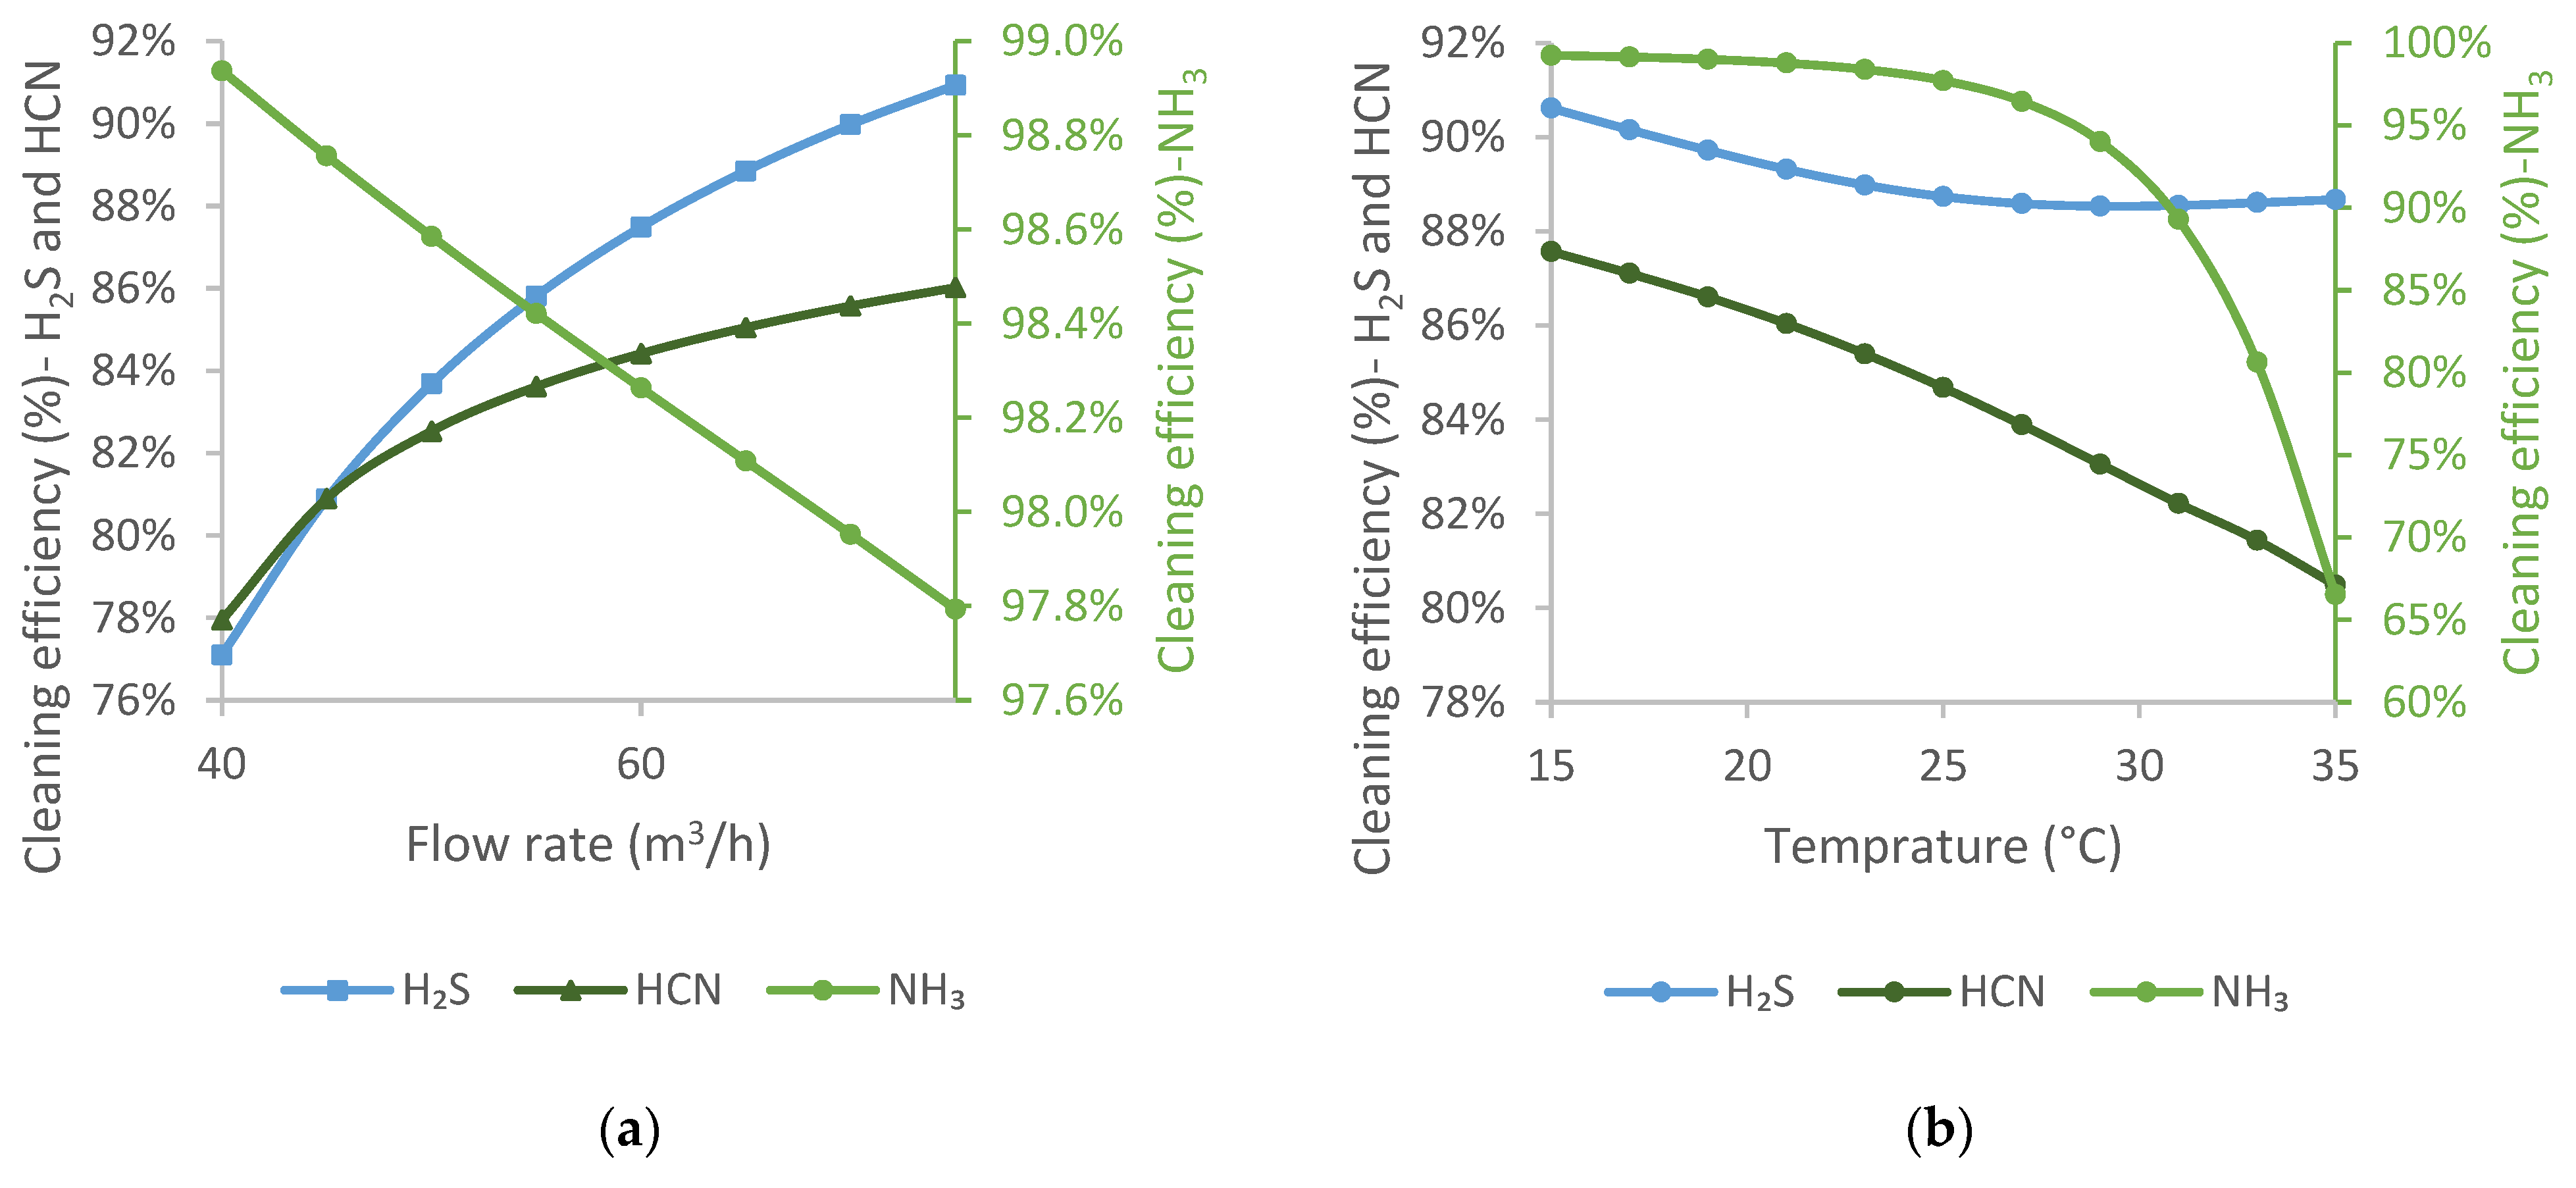
De-acidified water is fed into the H2S scrubber. Therefore, it is the largest volume of washing liquid used and significantly impacts gas purification.
The flow rate of de-acidified water considered in the study was between 40 and 75 m
3/h, as it is possible to vary the flow rate in this range in reality from an operational point of view. The results are shown in
Figure 5a.
The temperature of de-acidified water varied between 15 and 35 °C, as shown in
Figure 5b. In practice, cooling below 20 °C is difficult, especially in the summer months.
Increasing the flow rate of de-acidified water, the cleaning efficiency of NH3 decreases linearly, while the cleaning efficiencies of the other two components improve significantly. In addition, de-acidified water has relatively high ammonia content, which causes H2S and HCN to absorb better, but it is not beneficial for NH3 absorption.
Increasing the temperature of de-acidified water up to 25 °C hardly changes the cleaning efficiency of NH3, while that of H2S decreases. Above 25 °C, the cleaning efficiency of NH3 sharply reduces, while that of H2S is hardly changed. The cleaning efficiency of HCN continuously decreases with increasing temperature. While raising the temperature is advantageous for chemical reactions, it is not beneficial for the absorption process. Under these conditions, desorption of NH3 from de-acidified water can also occur.
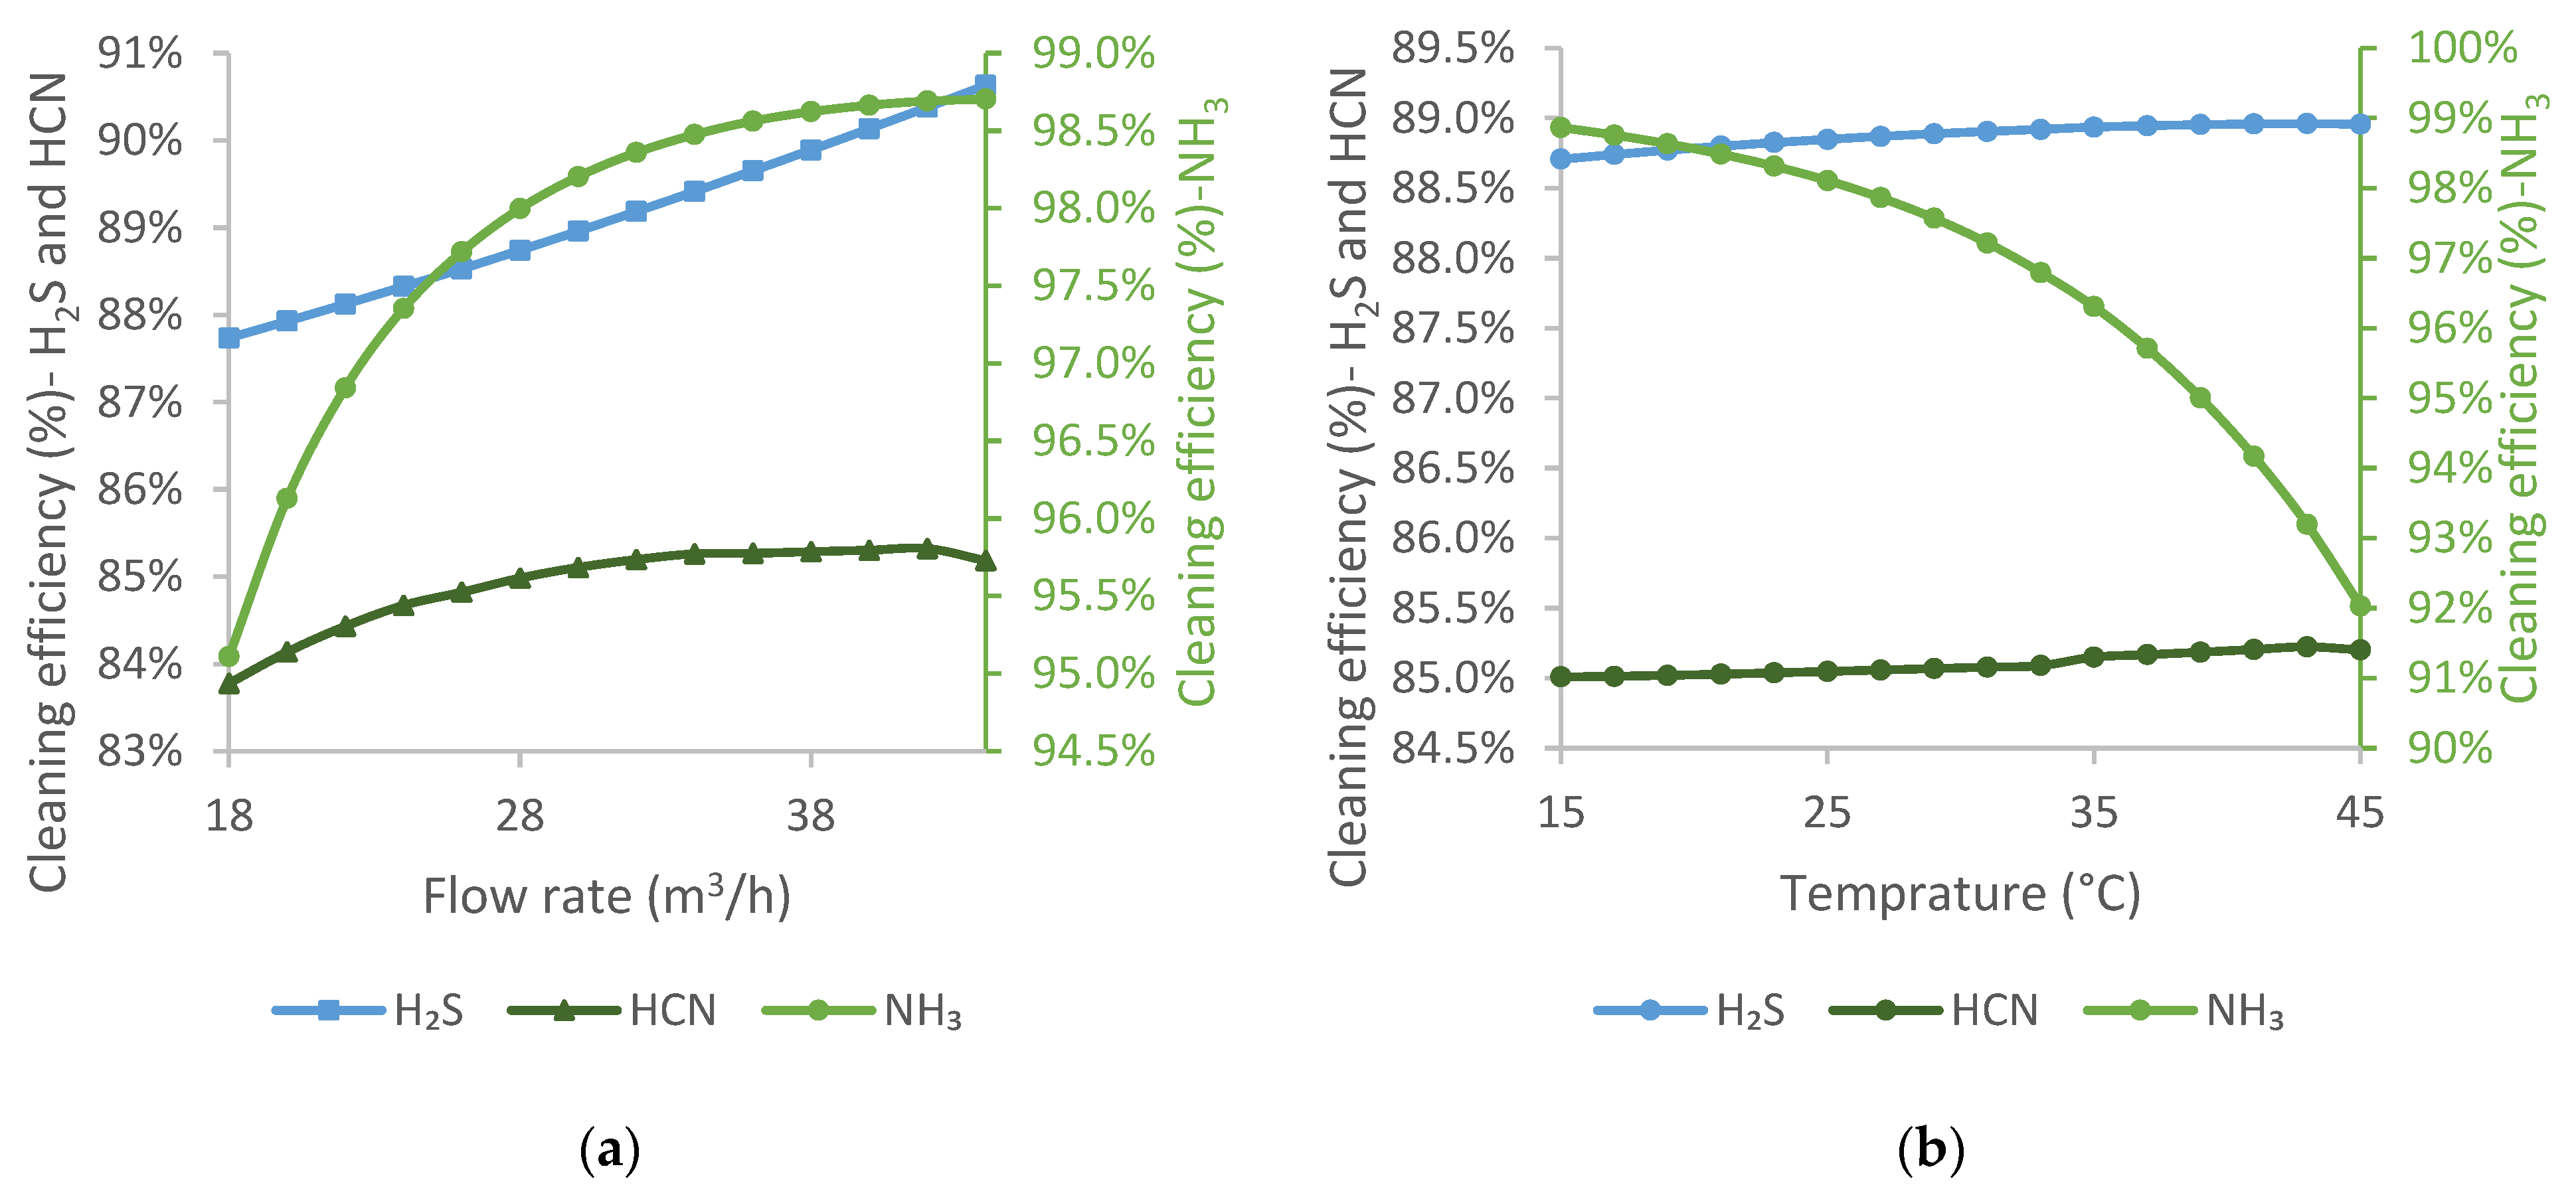
Coal water is sourced from the moisture content of the coal blend used for coke production, so the amount depends on the coke production level. During sensitivity analyses, the flow rate of coal water varied between 18 and 44 m3/h.
The effect of the temperature of coal water was tested between 15 and 45 °C. As with the de-acidified water, it is difficult to provide a temperature below 20 °C during the warmer season.
Increasing the flow rate of coal water improves the cleaning efficiency of all three components, although not to a significant extent, as shown in
Figure 6a. This is because the composition of coal water supports absorption. However, it contains dissolved CN
−, which causes the HCN curve to flatten above a certain point.
The effect of coal water temperature is shown in
Figure 6b. The cleaning efficiencies of H
2S and HCN are essentially invariant to the temperature of coal water. In contrast, the cleaning efficiency of NH
3 decreases with increasing temperature. For ammonia, the adverse effect of temperature on absorption is significant. However, in the cases of the other two pollutants, the effect of the chemical reactions that take place is probably even more significant, which may cause a small increase in cleaning efficiency.
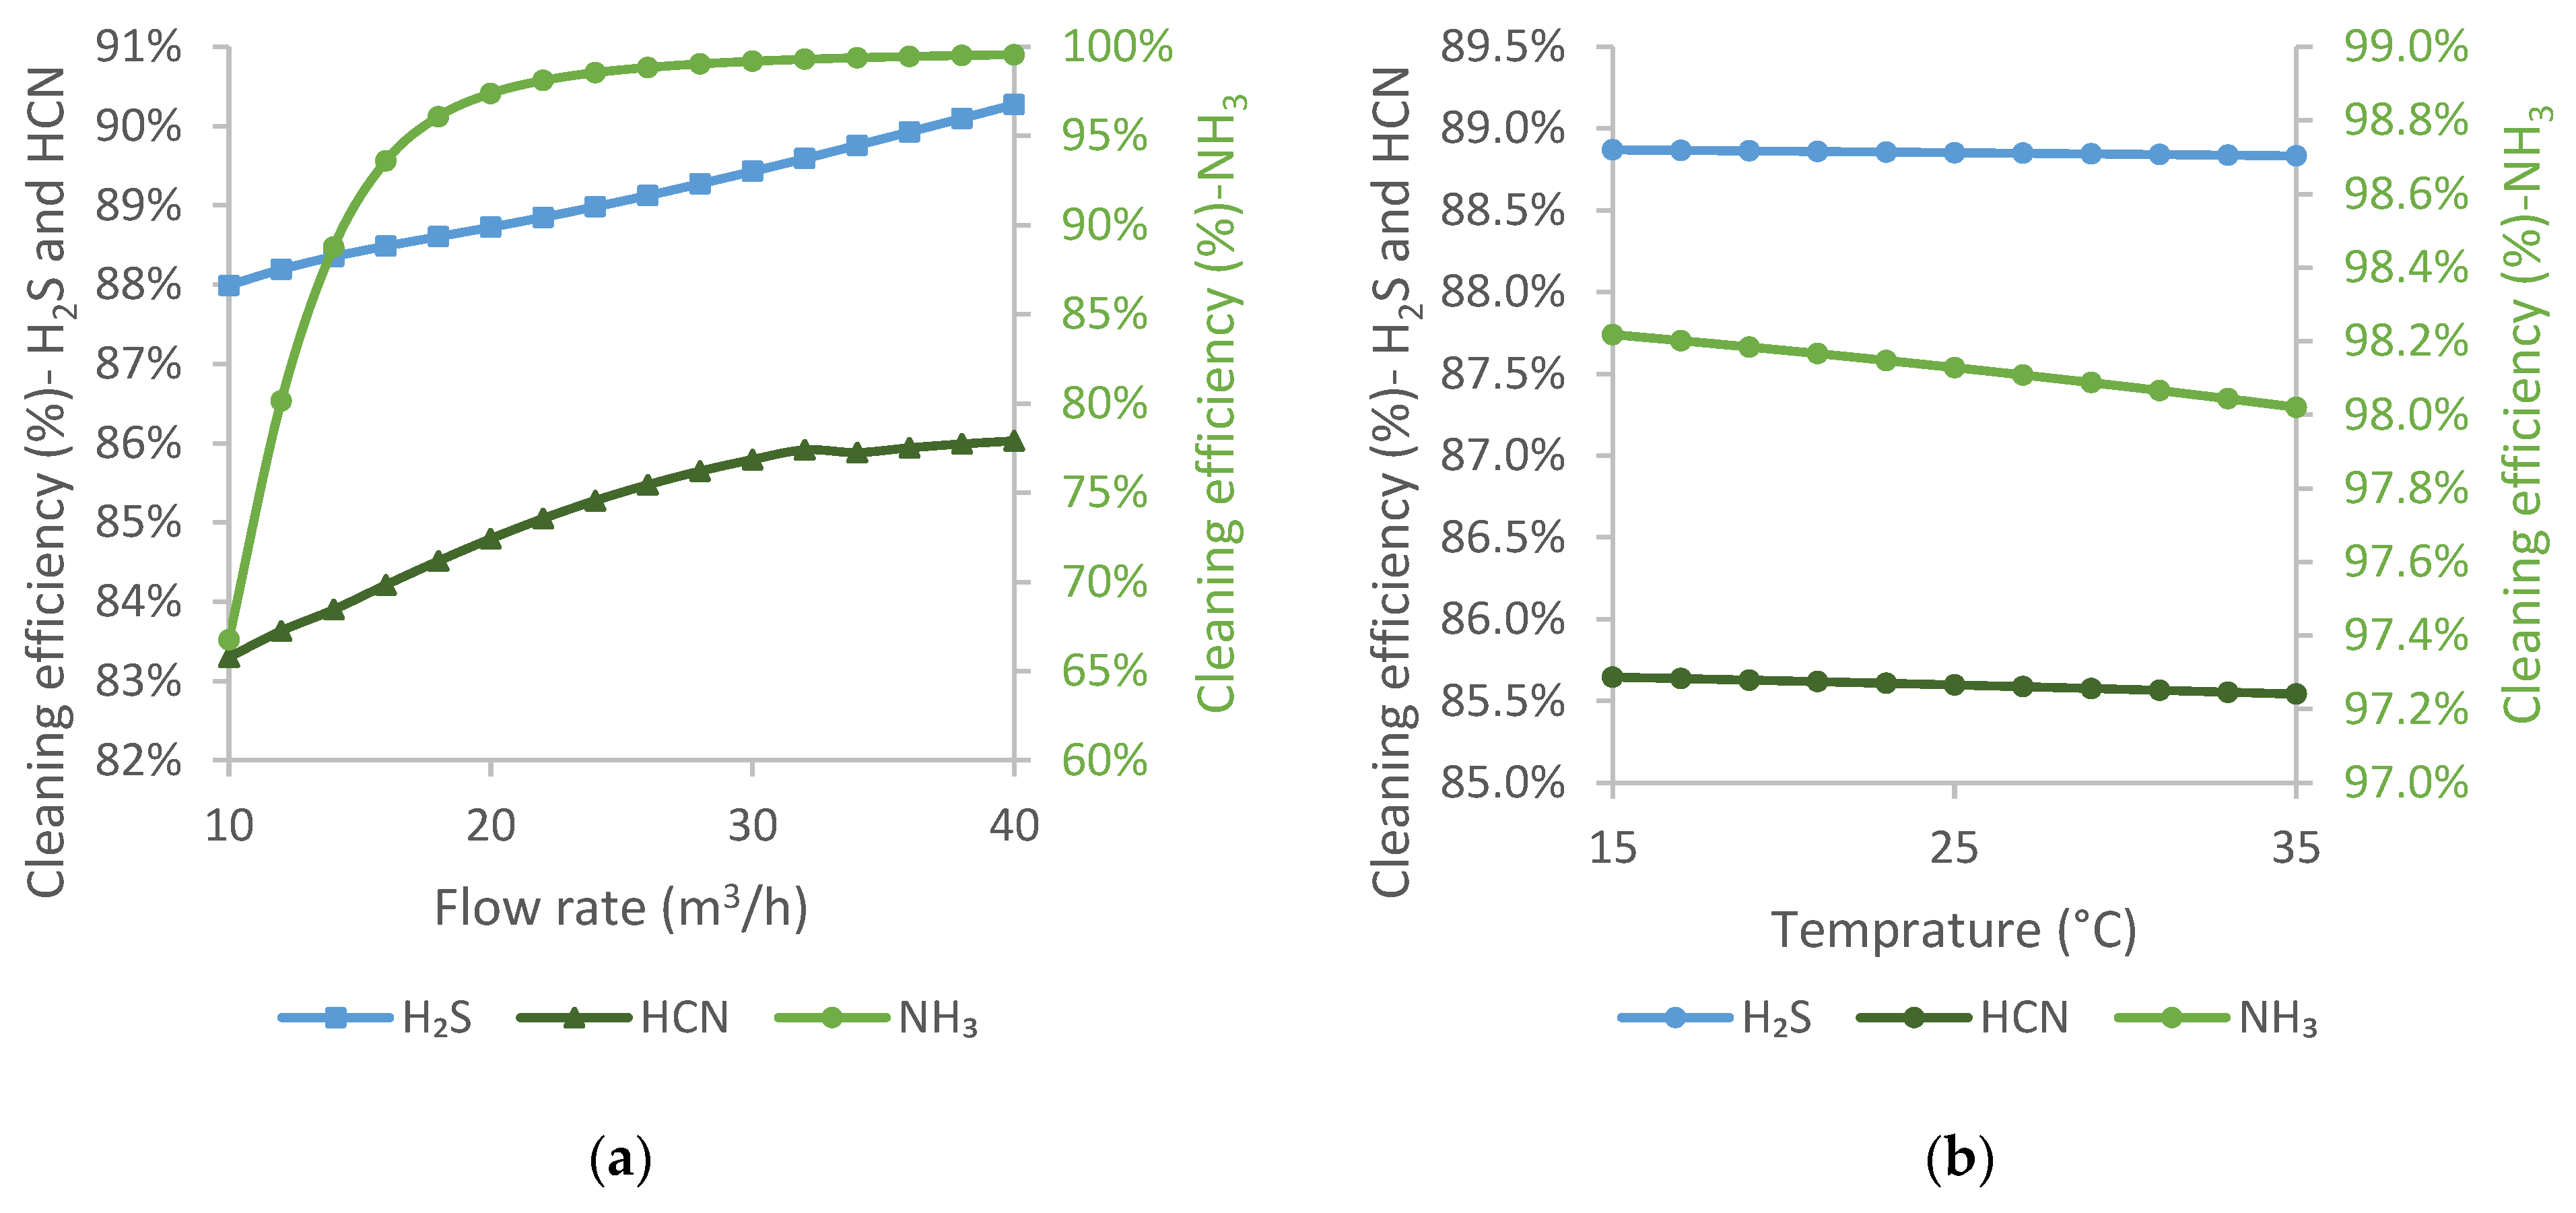
For stripped water, the flow rate was investigated between 10 m3/h and 40 m3/h, while the temperature was between 15 °C and 35 °C.
Based on the results shown in
Figure 7a, it can be concluded that the recovery of impurities improves with increasing the flow rate of stripped water. The content of H
2S decreases almost linearly with the increase in the flow rate of stripped water. In the case of HCN, the cleaning efficiency improves linearly up to a flow rate of 30 m
3/h, after which there is a slight decrease, followed by a less steep increase in the efficiency. For NH
3, the cleaning efficiency improves significantly up to a flow rate of 20 m
3/h, after which the curve becomes flatter. Stripped water is almost entirely pure water, which means that increasing its flow rate has a positive effect on cleaning efficiency, especially on the absorption of NH
3.
Changing the temperature of the stripped water had a relatively small effect on the cleaning efficiency, since it is introduced into the scrubber at a low flow rate. However, the cleaning efficiency decreased linearly with increasing stripped water temperature for all three components.
The differences between the lower and upper values of the parameter ranges are shown in
Table 5. It can be observed that the cleaning efficiency of NH
3 improved the most with the increasing flow rate of coal water and decreased the most with increasing the temperature of de-acidified water.
The H2S cleaning efficiency was improved the most by increasing the flow rate of de-acidified water, whereas it was worsened by increasing the temperature of de-acidified water. For HCN, the largest improvement was caused by increasing the quantity of de-acidified water, while the largest decrease was caused by increasing the temperature of de-acidified water.
3.1.2. Parameters That Cannot Be Influenced
The results of the effects of parameters that cannot be changed during operation are shown below.
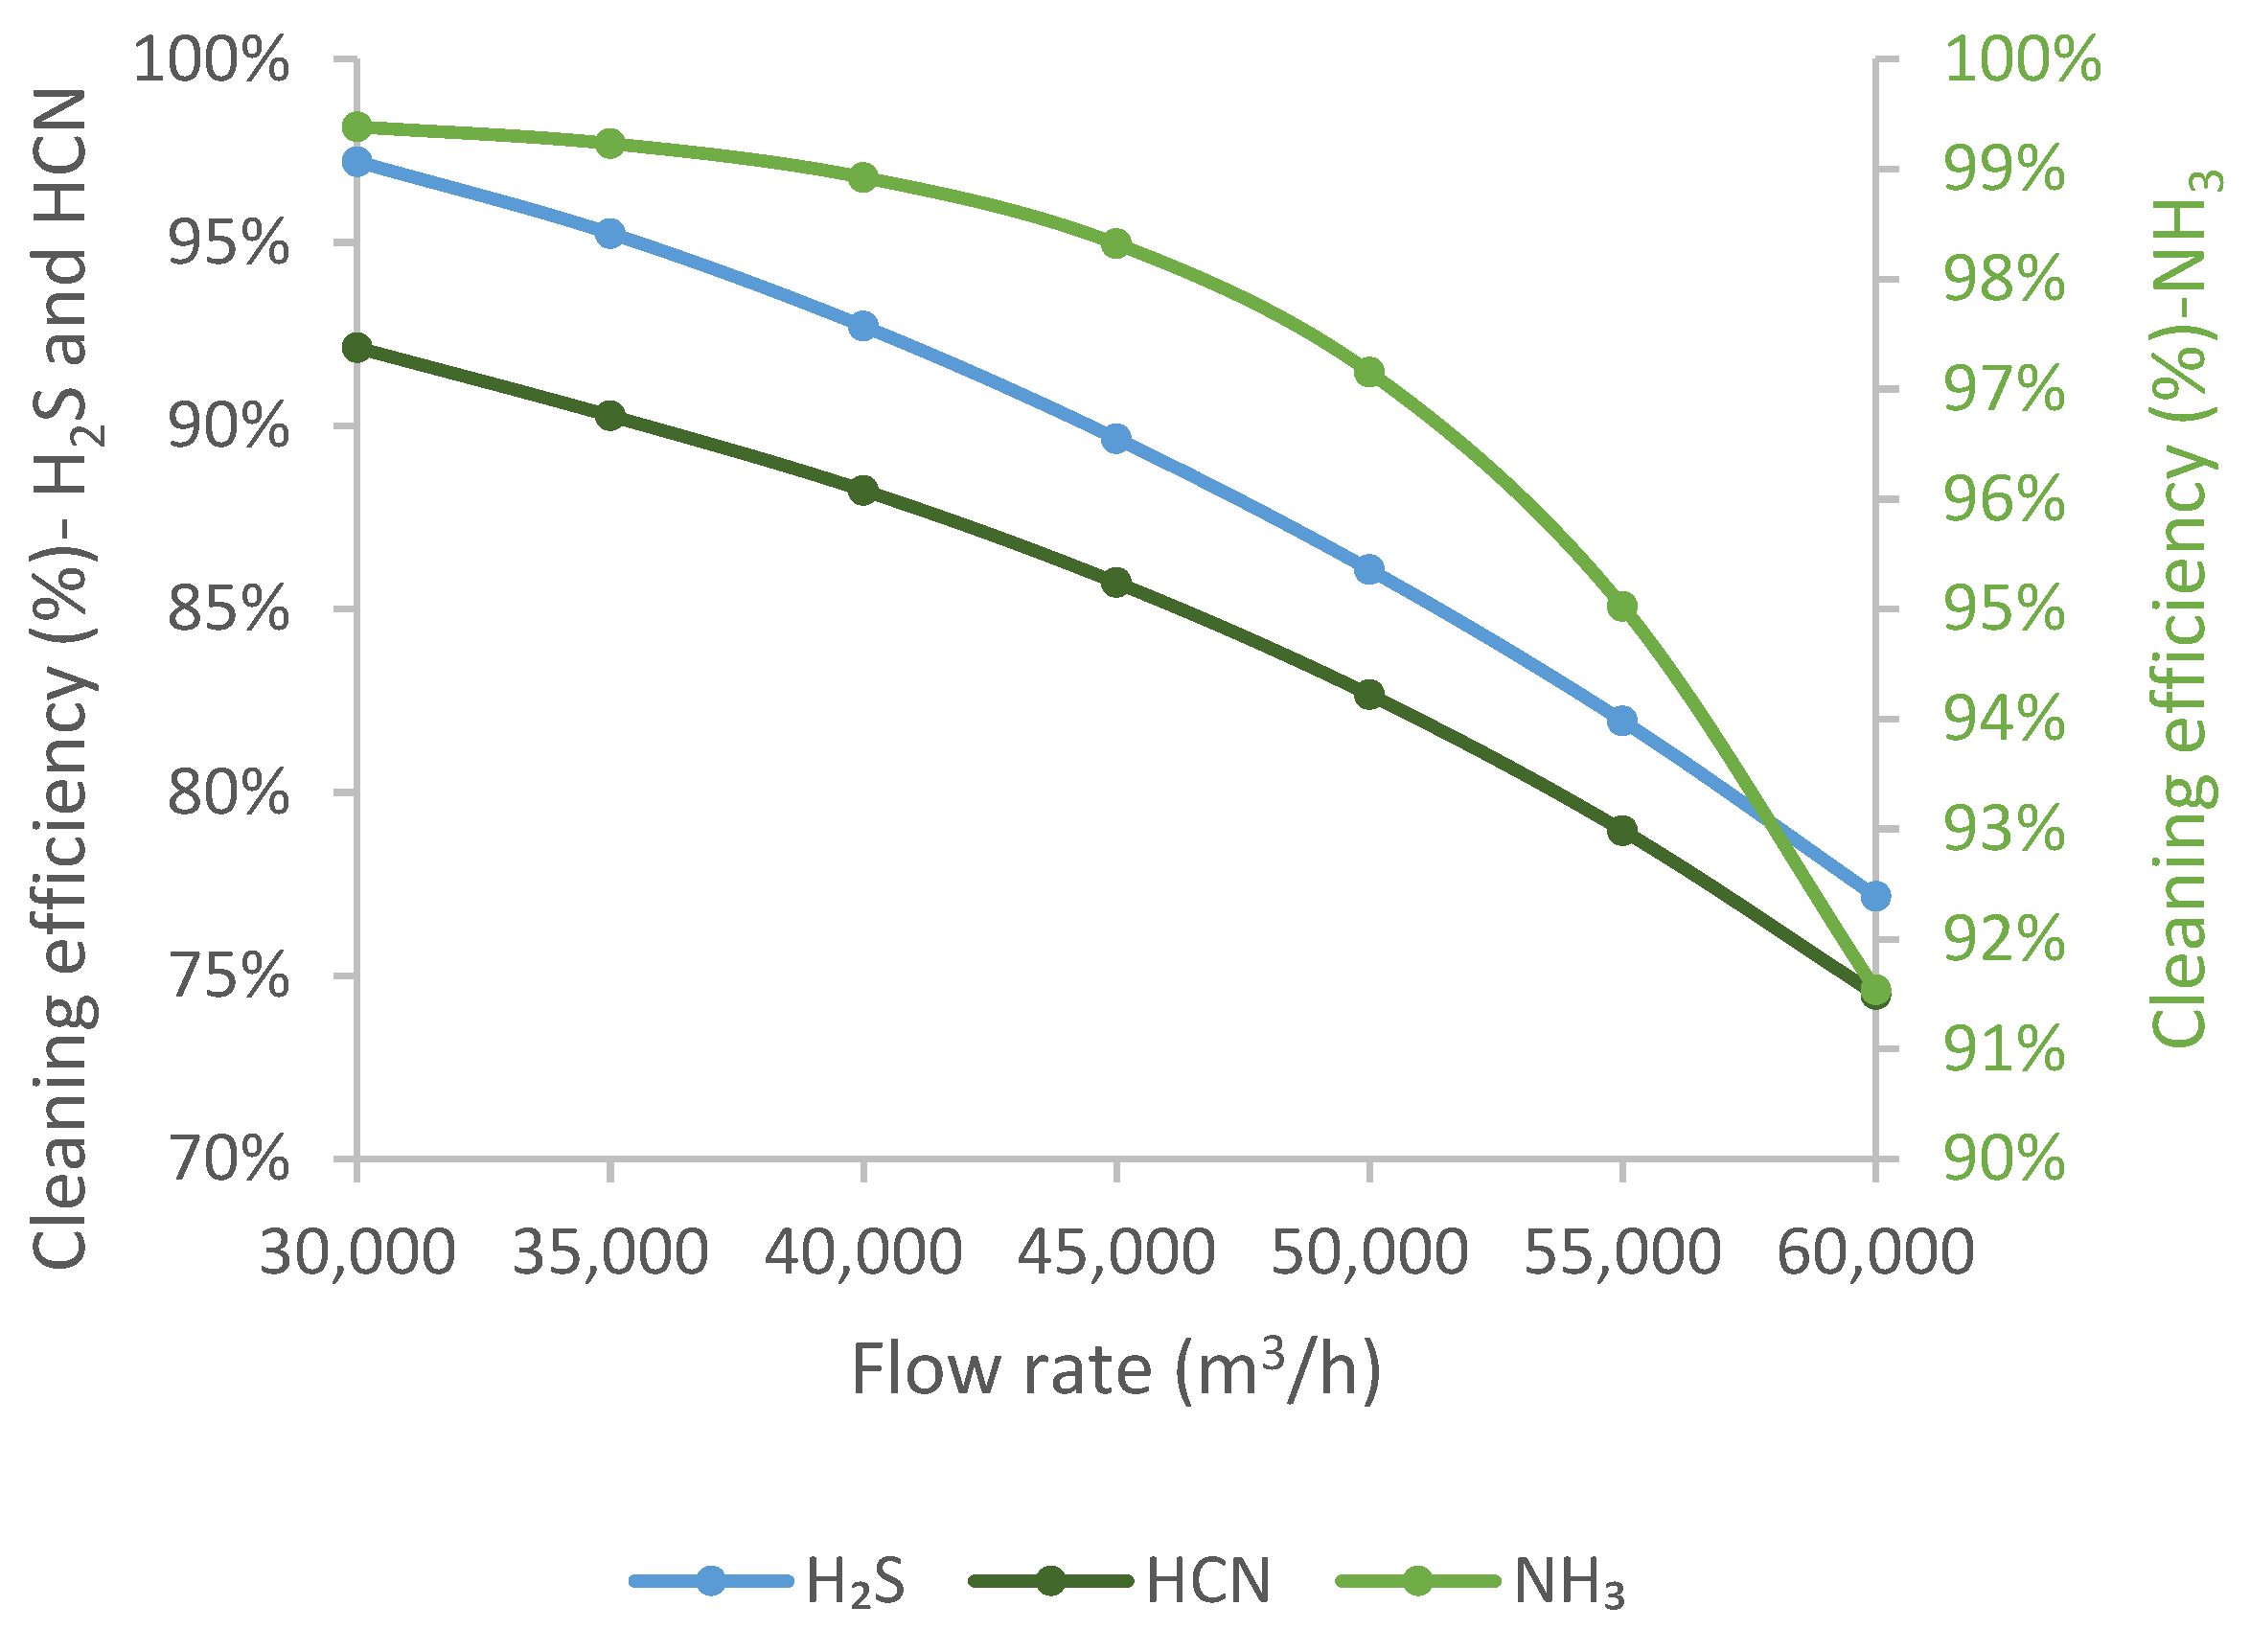
The effect of the coke oven gas flow rate was studied in the range of 30,000–60,000 m3/h. The upper limit of the range was determined based on the maximum plant capacity. In contrast, the lower range was set according to the lowest production level which is more and more frequent due to the increasingly difficult supply of raw materials and stock shortage problems.
The cleaning efficiency of the impurities is reduced by increasing the quantity of coke oven gas, as
Figure 8 shows. A nearly linear relationship is observed for H
2S, and a nearly exponential curve is obtained for NH
3, while HCN shows an intermediate relationship. With the current technology, higher cleaning efficiency can be achieved at a lower gas flow rate for the working point under consideration.
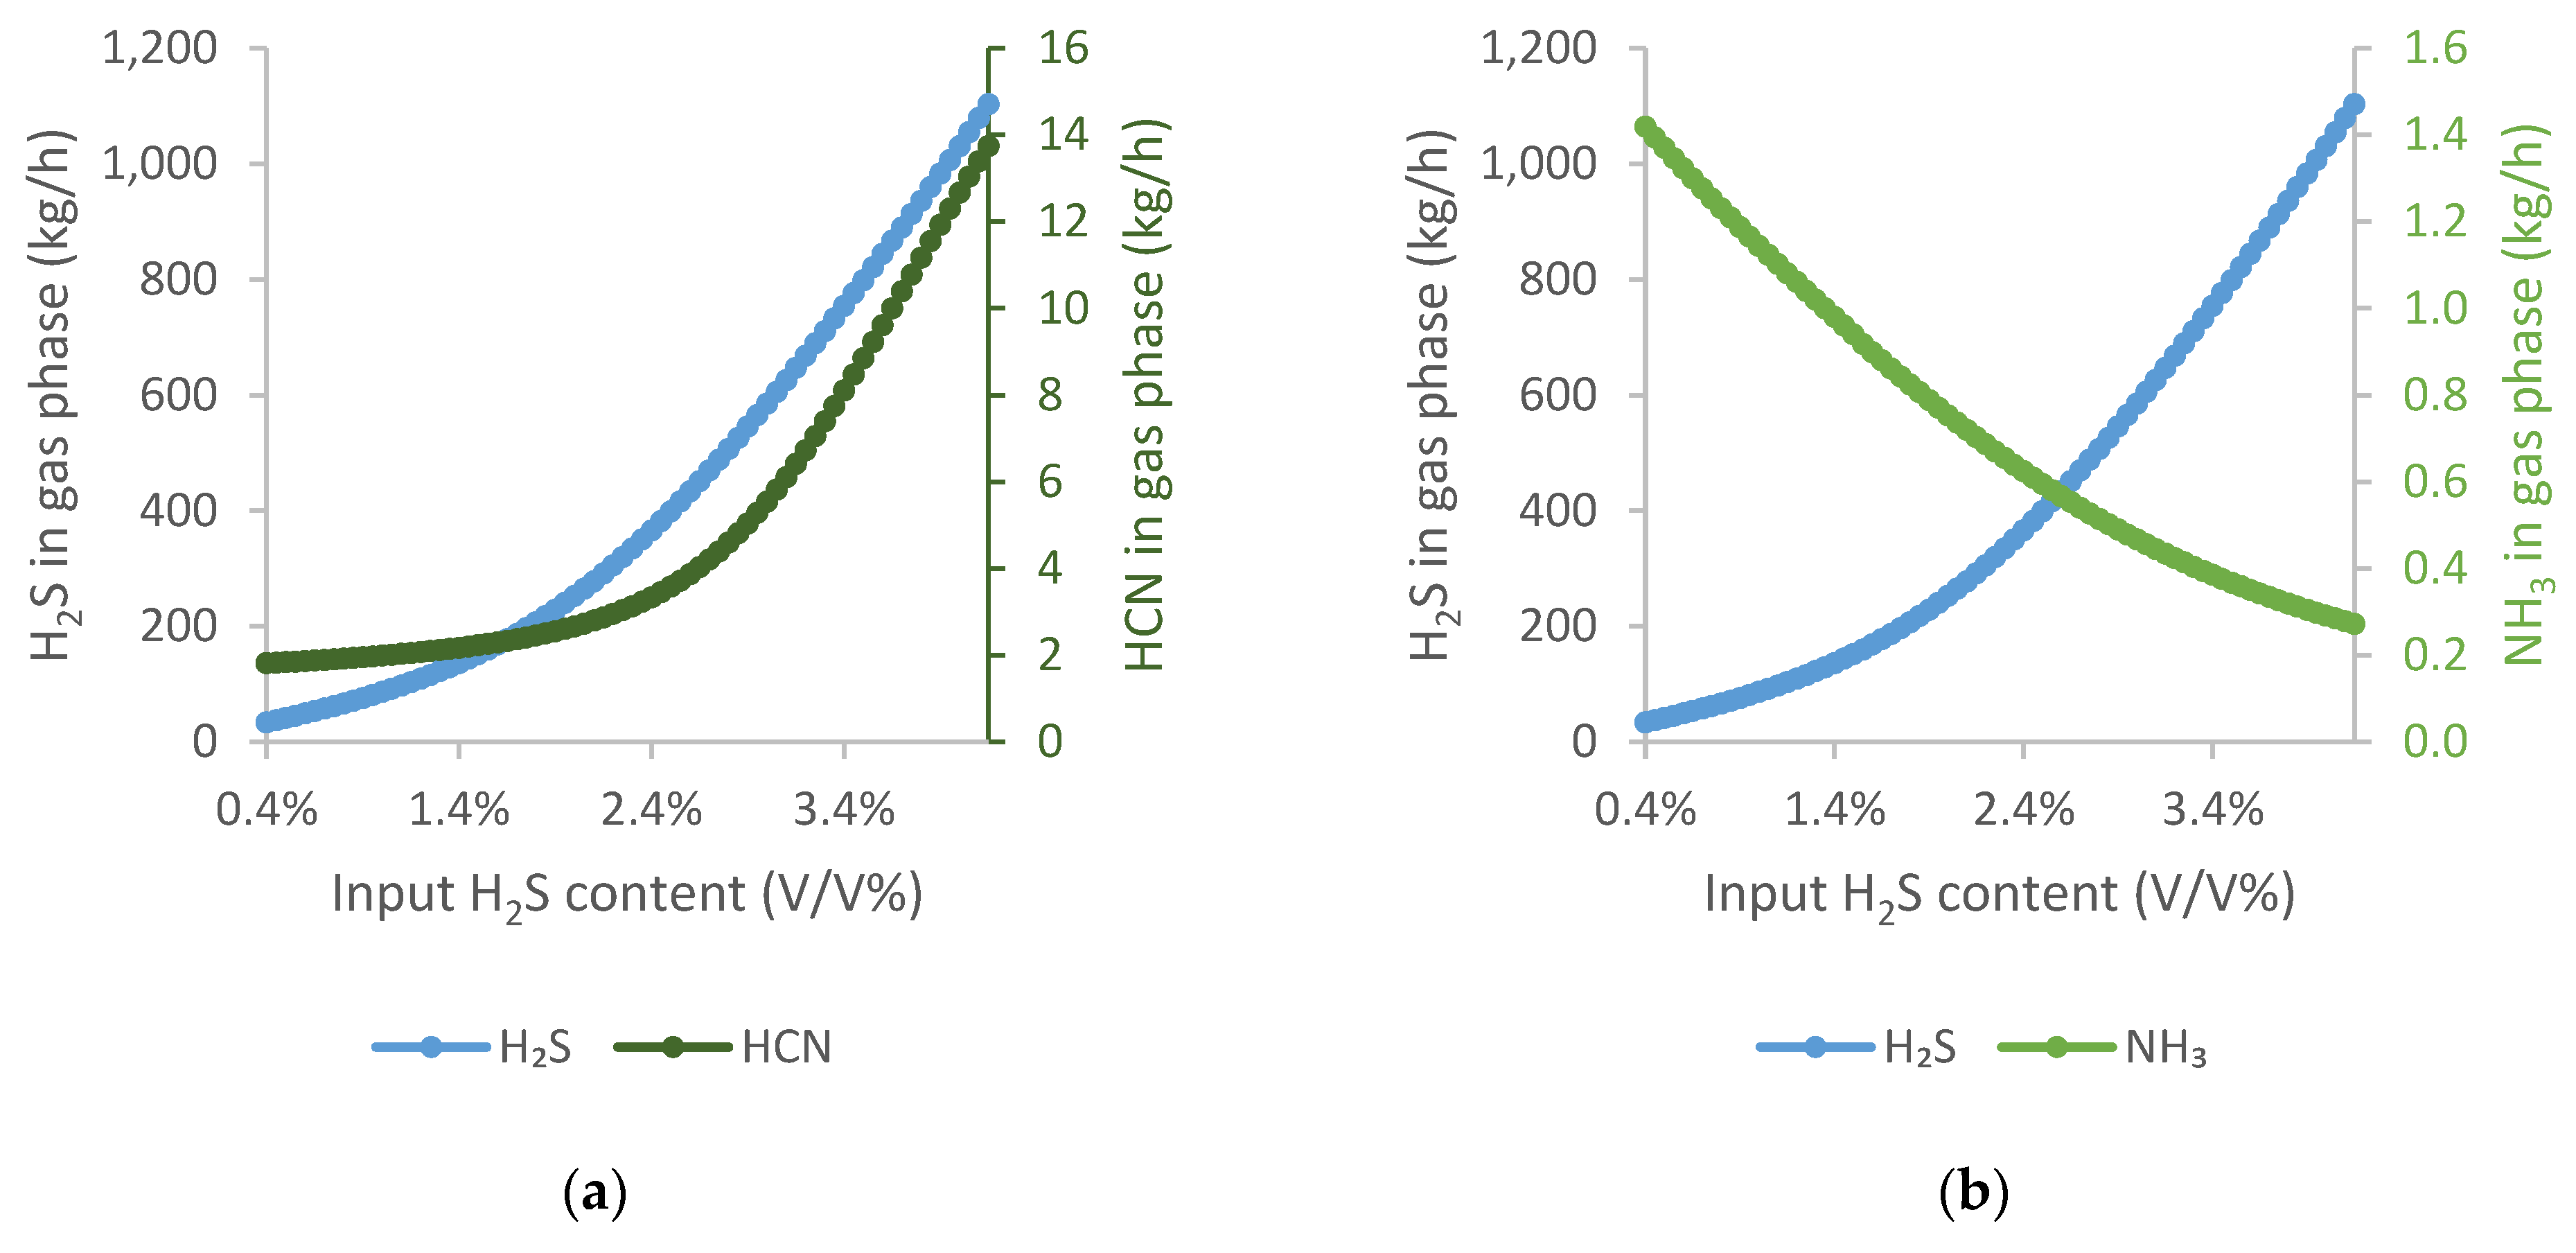
Good quality, low-sulphur coking coal is increasingly difficult to supply, and its price is rising significantly. It is therefore possible that, in the near future, higher-sulphur coals will have to be used to prepare the coking coal blend. Consequently, the H2S content of the coke oven gas will increase. On this basis, the H2S content of coke oven gas was studied between 0.003 and 0.08.
To illustrate the results, the results were plotted on two graphs. Furthermore, unlike in the previous diagrams, the amount of pollutant components in the output gas was compared instead of cleaning efficiency.
It can be observed that with increasing H
2S content, the amount of H
2S in the output gas increases initially flatly and then significantly more sharply from 2.4 V/V%.
Figure 9a shows that increasing the amount of H
2S does not favour HCN absorption.
In
Figure 9b, it is observed that NH
3 has almost the opposite slope curve to H
2S. As the amount of H
2S increases, the amount of NH
3 in the output gas decreases exponentially.
3.2. Optimisation
As described in
Section 2.3.2, the system optimisation was carried out according to the two approaches. The results are summarised in
Table 6.
Optimised operating point 1 collects the results calculated to minimise the impurities content in the output coke oven gas. It can be observed that the temperature of the washing liquids needs to be relatively low, while the flow rate of the water streams needs to be high.
Optimised operating point 2 summarises the operating parameters needed to minimise the energy demand of the technology while still ensuring that it meets environmental standards. The relatively high temperature of the washing liquids means that less auxiliary energy is required for cooling after regeneration. As a result, the amount of washing liquids required is also lower compared to the current working point.
4. Conclusions
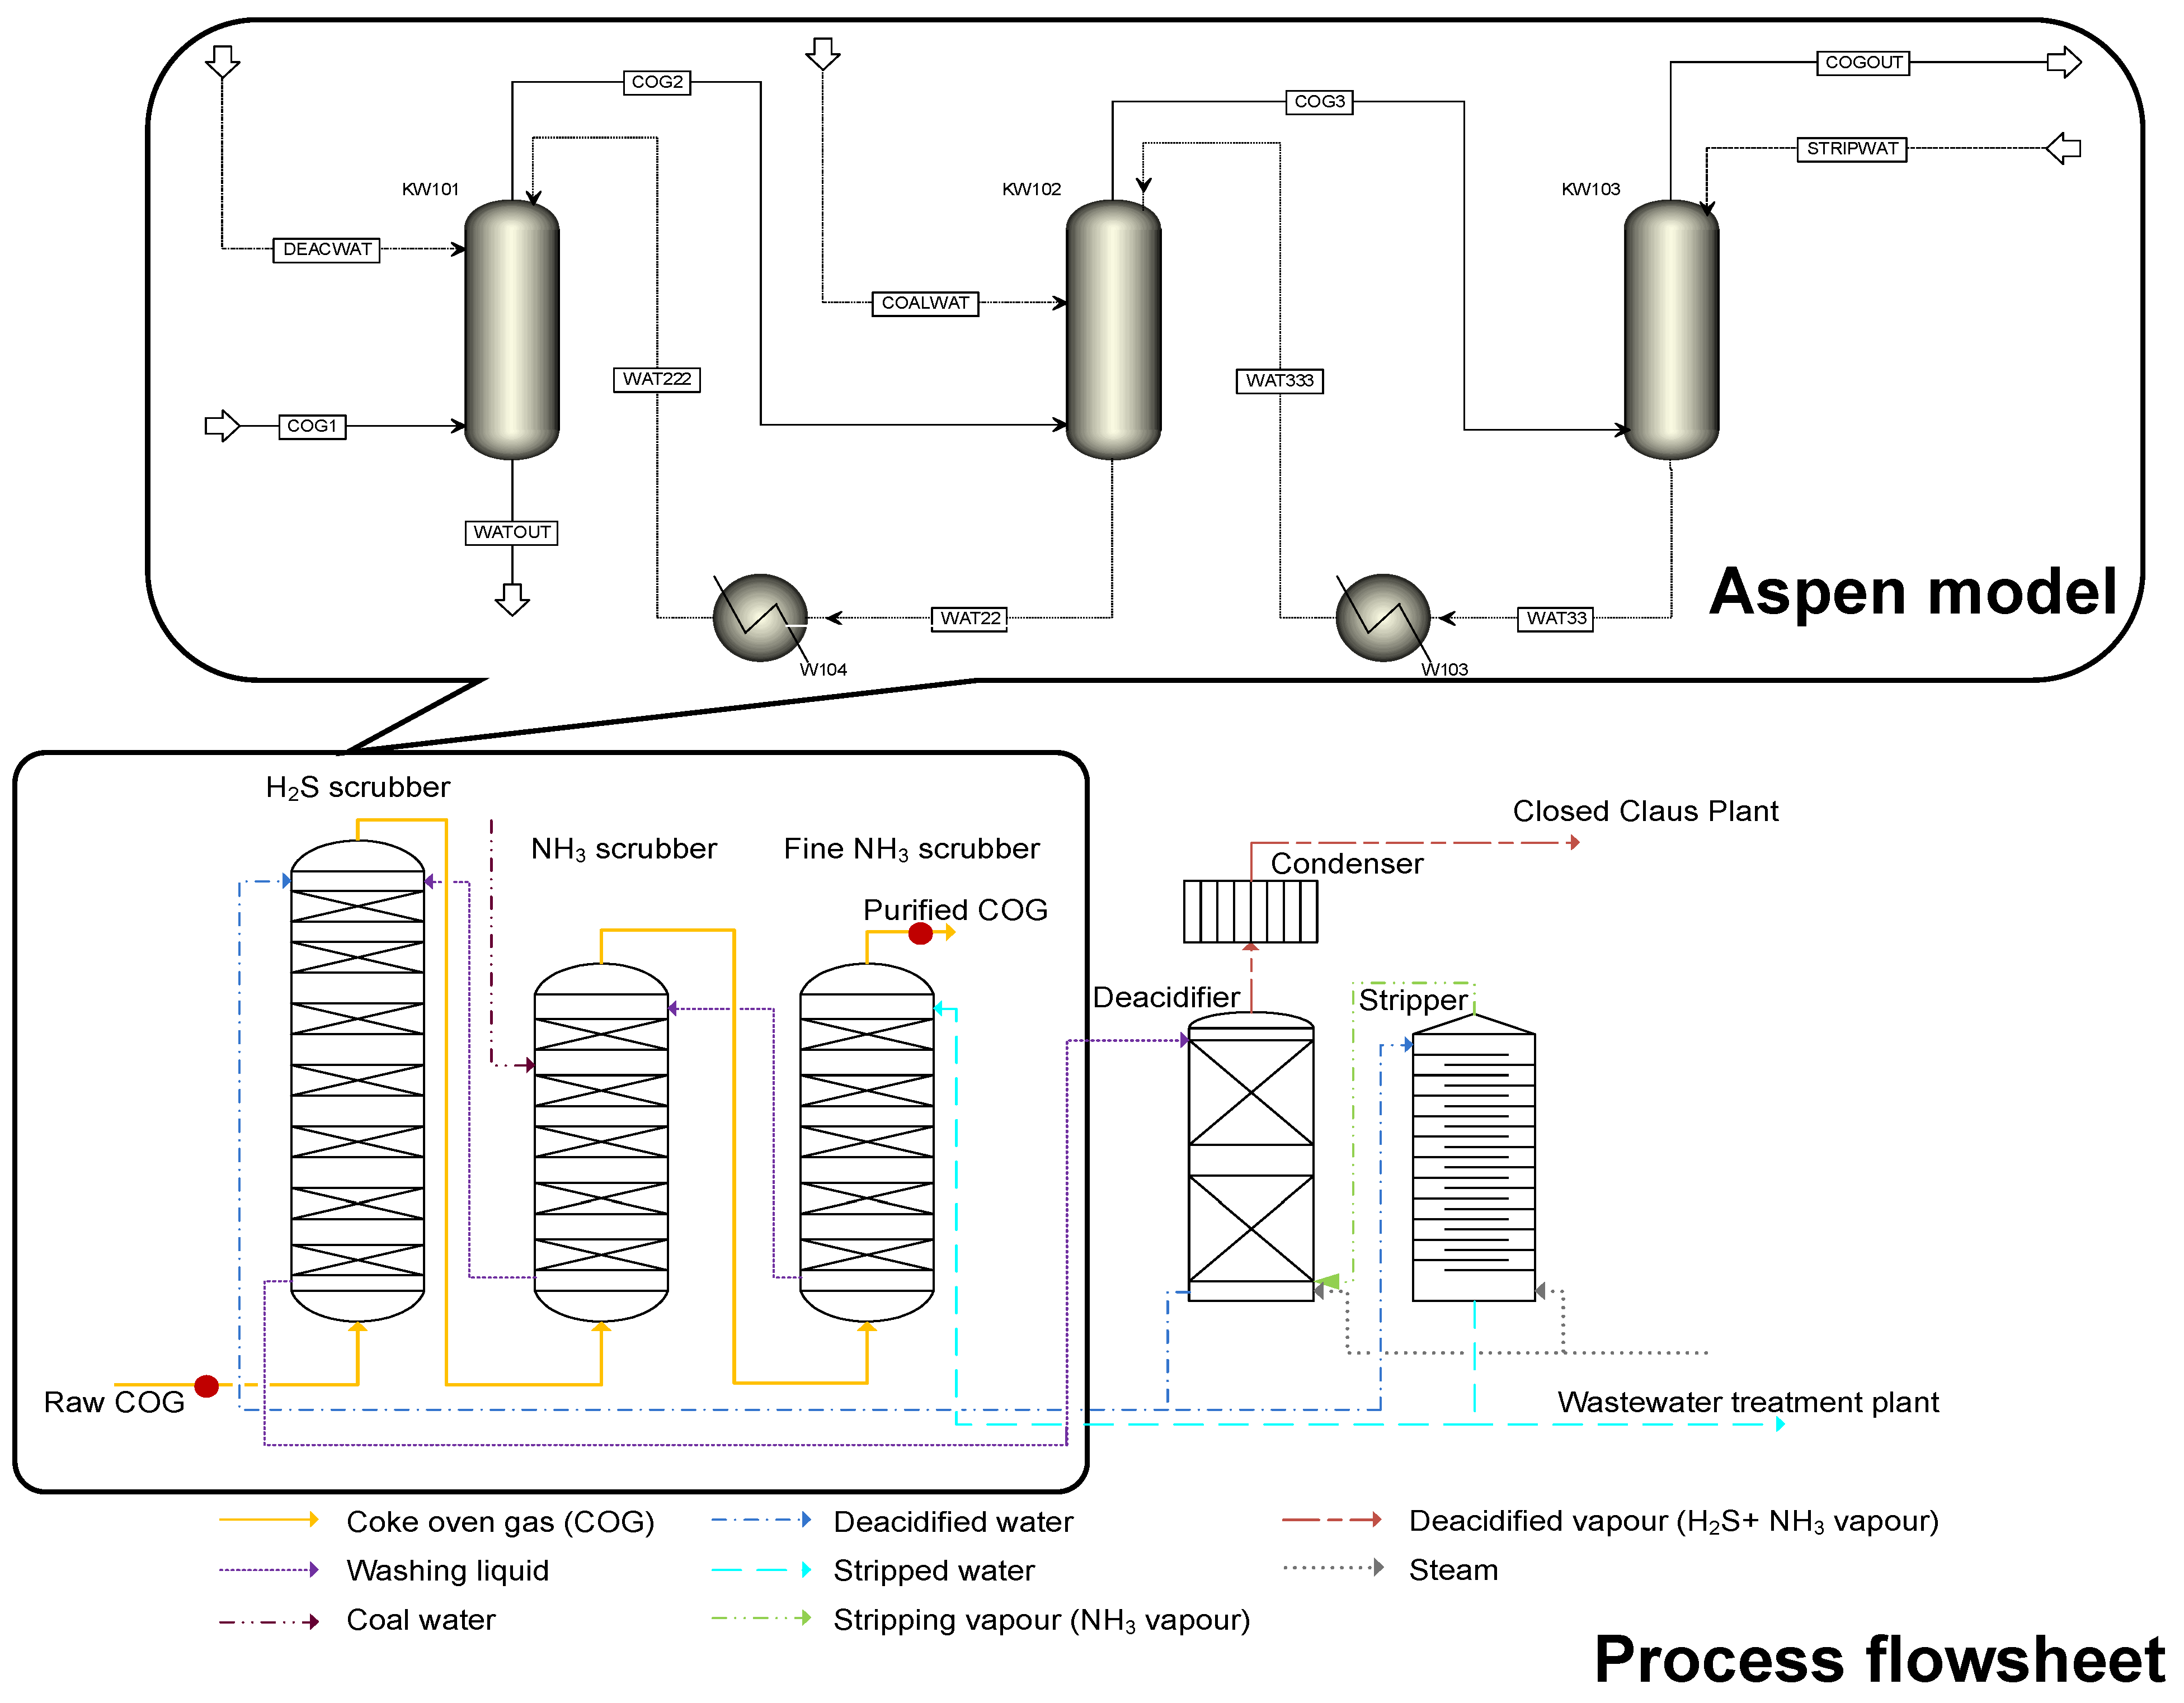
In this work, the steady-state model of the coke oven gas purification process, located in a Hungarian coke oven plant, was created. The task is rather complex since the three scrubbers are interlinked through washing liquids, the columns are filled with special expanded packings, and the coke oven gas is a multicomponent gas, so several parallel and competitive chemical reactions need to be considered.
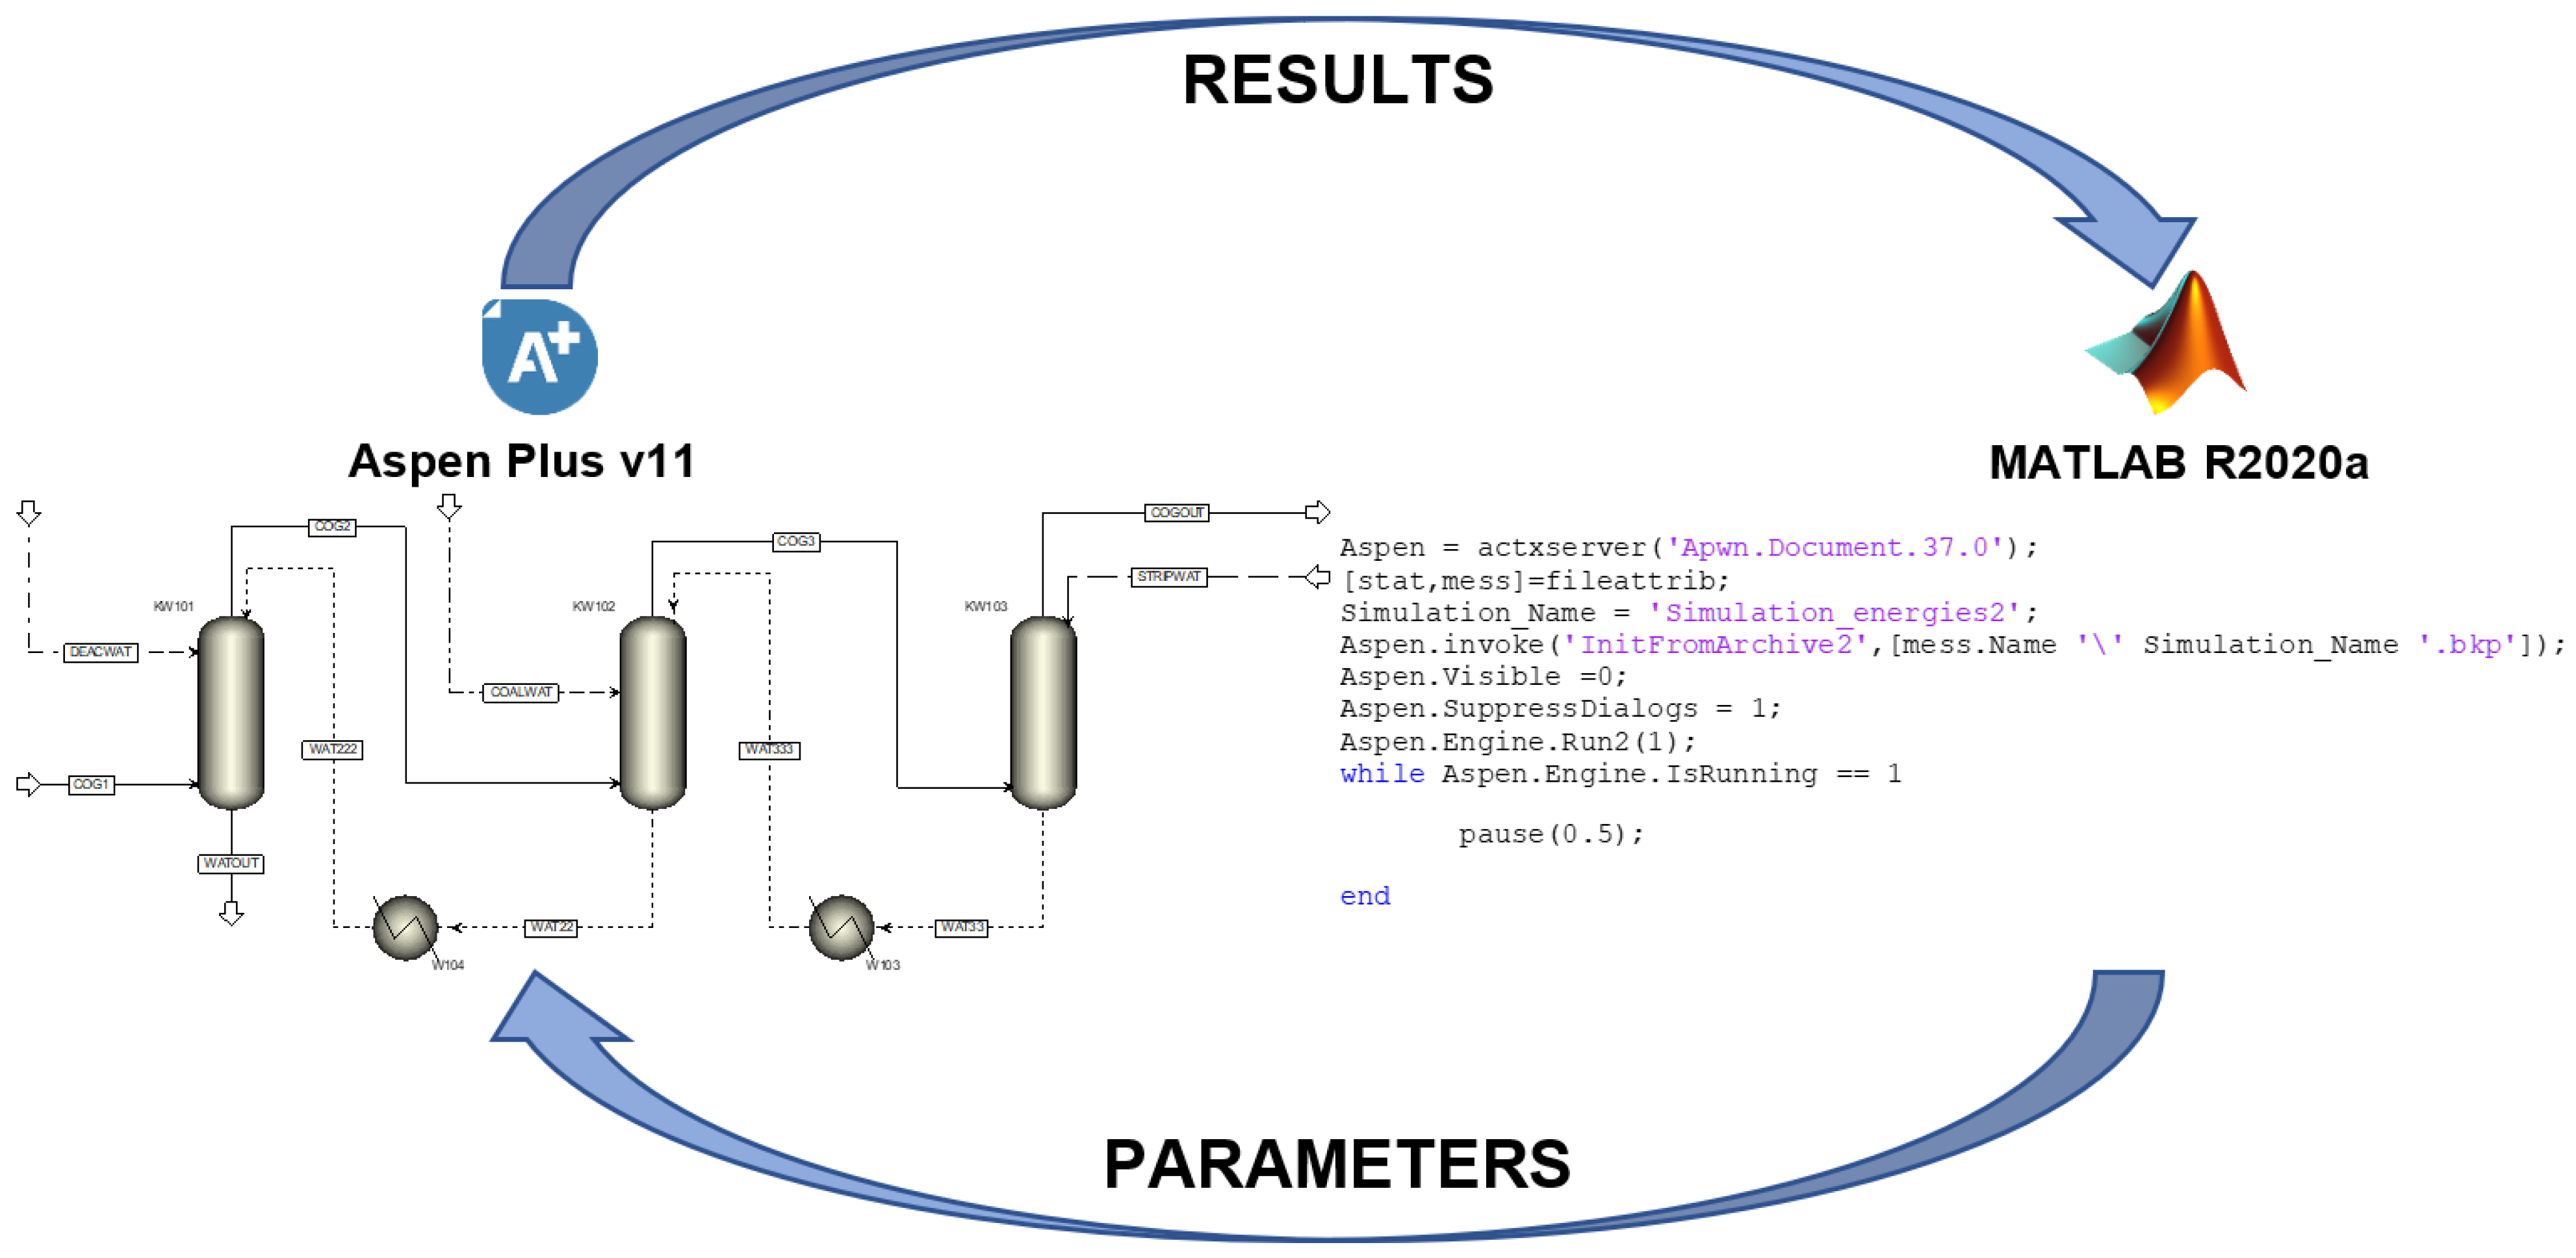
The model was built in Aspen Plus, using the rate-based approach. To fine-tune the model, the liquid mass transfer coefficient factors of the three columns were changed through the fmincon function of MATLAB. As a result, the relative errors between the measured and calculated amount of impurities in output coke oven gas were below 1%.
With the adequately identified model, sensitivity analyses were carried out to study the effects of the parameters that can and cannot be influenced. The influenceable parameters consist of the flow rate and temperature of de-acidified water, coal water, and stripped water.
The investigation of those parameters that cannot be influenced during operation shows the degree of impact on gas purification. Thus, the effect of the H2S content of coke oven gas and the coke oven gas quantity were analysed.
Based on the results of sensitivity analyses, two optimisation tasks were completed with the help of the fmincon function of MATLAB.
One part of the optimisation was to see whether the current system would still be able to guarantee the required purity of coke oven gas if environmental standards were stricter. The results show that, in this case, significantly lower temperatures and higher volumes of washing liquids would be needed. However, this would place a greater energy burden on the plant. With current technology, the concentration of H2S can be reduced to 0.54 g/Nm3, while the concentration of NH3 decreased to 0.01 g/Nm3 in the output coke oven gas. This means that, under the proper operating conditions, the technology can meet significantly more stringent standards as well.
The other optimisation task was to see whether the system could deliver the required composition of the coke oven gas under more energy-efficient conditions. On this basis, it can be concluded that the current requirement can be met with higher-temperature washing liquids. By operating on the basis of the results calculated, the energy required to cool the washing liquids will be about 30% less than the current demand. This is particularly important at a time when energy prices have sharply increased.
As a result of our work, an existing gas purification system can be thoroughly studied and understood. This helps to ensure optimal operation under the given conditions. This is particularly necessary in uncertain times when raw material supply is problematic, and energy efficiency is in great demand. In particular, it is important to make the most efficient use of by-products and waste streams that can be used as a substitute for energy sources. This requires ensuring continuously appropriate quality. Based on the presented steady-state model, a dynamic model of the technology will be developed. It will significantly assist in that the process can be operated more consciously, and the occurrence of breakdowns and malfunctions can be significantly reduced.


