Article

Evaluation of Alternatives for Energy Supply from Fuel Cells in Compact Cities in the Mediterranean Climate; Case Study: City of Valencia

Institute for Energy Engineering, Universitat Politècnica de València, 46022 Valencia, Spain
*
Author to whom correspondence should be addressed.
Energies 2022, 15(12), 4502; https://doi.org/10.3390/en15124502
Submission received: 4 May 2022 / Revised: 9 June 2022 / Accepted: 17 June 2022 / Published: 20 June 2022

Abstract

:
A study of energy supply alternatives was carried out based on a cogeneration fuel cell system fed from the natural gas network of compact Mediterranean cities. As a case study it was applied to the residential energy demands of the L’Illa Perduda neighbourhood, located in the east of the city of Valencia and consisting of 4194 residential cells. In total, eight different alternatives were studied according to the load curve, the power of the system, the mode of operation and the distribution of the fuel cells. In this way, the advantages and disadvantages of each configuration were found. This information, together with the previous study of the energy characteristics of the neighbourhood, enabled selection of the most promising configuration and to decide whether or not to recommend investment. The chosen configuration was a centralised system of phosphoric acid fuel cells in cogeneration, with approximately 4 MW of thermal power and an operating mode that varied according to the outside temperature. In this way, when heating is required, the plant adjusts its production to the thermal demand, and when cooling is required, the plant follows the electrical demand. This configuration presented the best energy results, as it achieved good coverage of thermal (62.5%) and electrical (88.1%) demands with good primary energy savings (28.36 GWh/year). However, due to the high power of the system and low maturity (i.e., high costs) of this technology, would be necessary to make a large initial economic investment of 15.2 M€.

1. Introduction

Actions to achieve energy transition and meet the Paris Agreement targets for decreasing greenhouse gas emissions (GHG) are critical [1]. Cities are a cornerstone of this energy transition, as by the end of 2050 more than two-thirds of the world’s population is likely to live in an urban area [2], contributing to almost two-thirds of global primary energy demand and accounting for more than 70% of greenhouse gas emissions [3]. Therefore, energy transition requires multifaceted targets ranging from 100% renewable energy generation by 2050 [4] to the development of carbon neutral districts [5]. To meet these latter challenges, cities must implement measures to adapt to climate change and mitigate its impact. Action plans and projects are being adopted around the world to provide for such measures and to engage cities in the energy transition. As an example, [6] reviewed the different projects that are being implemented among a variety of cities. All these projects are committed to responding to four main challenges [7]: improving the quality of life of their inhabitants, improving resource efficiency, building a green economy, and involving citizens and local governance.
However, such energy transition cannot be abrupt, and the gas distribution network can play a role as a transition technology. In line with this, the present study consisted of carrying out a study of energy supply alternatives using fuel cells fed from the natural gas network. The fuel cell acts in cogeneration, i.e., both heat and electricity are produced from the same energy source, which is an innovative technology with very significant energy savings. Furthermore, it is supported by existing gas boilers in the building and the electrical network.
The role of cogeneration is currently essential in the field of energy efficiency measures [8,9]. Cogeneration is defined as the production and use of electrical energy and useful thermal energy from the same primary energy source, thereby reducing dependence on fossil fuels and reducing pollution. In addition, significant economic savings can be made by users thanks to the reduction of fuel consumption and the generation of electrical energy [10]. Moreover, the development of fuel cell technology has gained momentum worldwide thanks to its high efficiency, clean operation, and its ability to adapt to different applications, from mobile to stationary. The European Commission implemented the European Green Deal [11] in December 2019, which aims to make Europe a climate-neutral continent by 2050. The European Green Deal contains the European Hydrogen Strategy, which is responsible for carrying out the necessary actions to promote the use of renewable hydrogen: investments, research, and regulation of the legal framework. In addition, the Hydrogen Roadmap [12], which encourages the use of renewable hydrogen-based solutions and sets targets for their implementation, has recently been approved by the government. In this context, stationary fuel cells have been proposed as one of the cogeneration technologies for the transition towards decarbonisation of the residential sector in cities [13]. This is because they take advantage of pre-existing energy systems: gas distribution, electricity distribution, domestic thermal and electrical energy equipment. However, to date there is very little scientific literature on the real feasibility of implementing stationary fuel cells for residential demand, and on methods to calculate their performance [14].
Below, a brief description of the different types of fuel cell technology is given, together with the current relevance of fuel cell technology in improving overall energy efficiency compared to other energy systems.

1.1. Fuel Cell Technology

Hydrogen is the fuel for the cogeneration system proposed. Although hydrogen is very abundant in our natural environment, it is not found in its pure state, so energy is needed to obtain it. For this reason, it is not considered an energy source but an energy vector. The biggest problem that arises from the use of this element is the cost and difficulty of production, because fuel cells have not yet been fully incorporated into the energy market, so the cost is still too high to compete economically with more conventional energy systems [15]. However, when comparing the different methods of producing hydrogen, natural gas reforming processes are currently the least expensive and the most widely used for hydrogen production [16]. On the other hand, the energy dependence on fossil fuels remains and cannot be considered clean energy [17]. Instead, it is considered a transitional technology, which is why city gas has been included among the green fuels by the European Union.
Finally, it is important to know the main advantages of a fuel cell-based production system that cannot be offered by other more conventional energy production systems [15]:
  • Low environmental impact. There is no combustion reaction at high temperature, and there are no emissions of unoxidised hydrocarbons or nitrogen oxides. Moreover, thanks to its high efficiency, CO2 emissions are much lower than those of other conventional production systems.
  • Operational flexibility. Due to the modular nature of the fuel cell, the system can adjust its output to demand without sacrificing efficiency.
  • Low noise pollution. With no moving parts, fuel cells are quiet and require little maintenance.

1.2. Definition of the Different Types of Fuel Cells

There are many types of fuel cells, although they all have the same structure [18] including two electrodes: the anode, where the fuel is supplied, and the cathode, where the oxidant is supplied. These two electrodes are separated by an electrolyte, which functions as an electrical insulator and proton conductor. At the anode, hydrogen dissociates electrochemically into hydrogen ions (H+) and free electrons (e). In this way, the electrons generated are directed to the cathode through the external circuit producing electrical energy, while the protons are directed to the cathode through the electrolyte. At the cathode, the oxidant combines in the presence of a catalyst with the hydrogen ions and free electrons to generate water.
The different types of fuel cells are classified according to the type of electrolyte used. Furthermore, according to the operating temperature, a distinction is made between high-temperature cells:
  • Molten Carbonate Fuel Cell (MFCF)
  • Solid Oxide Fuel Cell (SOFC)
And medium/low temperature cells:
  • Proton Exchange Membrane Fuel Cell (PEMFC)
  • Phosphoric Acid Fuel Cell (PAFC)
  • Alkaline Fuel Cell (AFC)
There is another type of fuel cell that is not included in the list (Direct Methanol Fuel Cell, DMFC) because its field of application is in very low power portable applications. This is due mainly to their low efficiency. Higher efficiency figures can be achieved using different fuels, such as ethanol [19], but more research is needed so this becomes competitive with other types of fuel cells at high power applications. Depending on the operating conditions, such cells are suitable for each application. It can be concluded that high temperature fuel cells have a higher efficiency, but do not adapt well to demand as they have a slow start-up and responsiveness, whereas medium and low temperature fuel cells offer a slightly lower cogeneration efficiency, but with a fast start-up and responsiveness, which allows them to adapt to daily variations in demand. In this respect, PEM fuel cells are the most widely used both in terms of number of applications and installed capacity, mainly in the transport sector. A lot of research has been conducted with this type of fuel cells to improve efficiency [20]. Hence, to evaluate the techno-economic viability and carry out an energy balance, a study of a neighbourhood’s energy demand must first be carried out and a choice made as to which fuel cell technology is the most suitable based on the behaviour of the demand.
To conclude with the introduction, the main objective of this research is to put forward a method for the study and comparison of different energy supply systems based on cogeneration fuel cells, which take advantage of pre-existing energy supply infrastructures. This method has two main objectives: first, to select the most suitable fuel cell technology for residential energy demands, and second, to design a configuration that saves the most primary energy, in an energy transition strategy for cities. As energy demand varies considerably depending on the climate zone, and as energy infrastructures are different depending on the type of city, the findings of this research are valid for the residential sector of compact European Mediterranean cities, i.e., mild weather, high population density, good energy infrastructure, average to poor energy quality of the buildings and high energy prices, mostly of non-renewable origin. For clarification, a case study was chosen: the L’Illa Perduda neighbourhood, located in the East of Valencia, Spain.

2. Materials and Methods

2.1. Applicable Legislation

The aim of this project was self-consumption by the neighbourhood’s dwellings using cogeneration fuel cell technology. The latest self-consumption regulation approved is RD 244/2019 [21], which promotes collective self-consumption in neighbourhood communities and reduces the compensation procedures for energy produced and not consumed instantaneously by small consumers. According to this regulation, in the case under study, the modality of collective self-consumption with surpluses that are not eligible for compensation would be applied. This means that the energy generated is consumed and the surplus energy is sold to the commercialisation company of the consumer’s choice at a previously agreed price. In terms of metering equipment, there are two metering devices, one bidirectional metering device that measures the net hourly energy generated and another that reflects the energy consumed by consumers. It should be considered that, in this modality, the access tolls to the distribution and transmission networks must be paid.

2.2. Description of the Neighbourhood under Study

The case study was the L’Illa Perduda in Valencia, Spain. This neighbourhood has high energy costs combined with a low average income, which makes it a priority for a just energy transition. The high expenditure is due to high energy prices in Spain, but also to the age of the buildings, with poor thermal insulation, and the low efficiency of the systems that supply energy (heaters, boilers, cookers, etc.), both due to the low income of the inhabitants who have not been able to upgrade them.
L’Illa perduda has a total area of 0.232 km2 populated by 9360 inhabitants, so it also has a high population density of approximately 40,345 inhabitants/km2 [22]. In total, there are 28 building blocks. Figure 1 shows the distribution of the buildings that make up the neighbourhood in a Google Maps screenshot.
There are buildings in the neighbourhood that are of non-residential use, which is the category on which this energy supply study is focused. In total, energy is supplied to dwellings in 20 different building blocks, consisting of 150 buildings, with a total of 4194 residential cells.
In addition, it is important to distinguish between primary (inhabited most of the time) and secondary residences (inhabited intermittently). For this purpose, the statistical office of Valencia [22] collects data on the types of housing that exist according to neighbourhood. Although this data has not been updated since 2011, no more recent reliable sources were found. Thus, in L’Illa Perduda the following types of dwellings were obtained:
  • Total: 4070
  • Primary: 3445 (84.64%)
  • Secondary: 190 (4.67%)
  • Uninhabited: 435 (10.69%)
Since most of the dwellings in the neighbourhood are primary dwellings and more up-to-date data were not obtained, all dwellings were considered of this type. Additionally, it is logical to think that in a low-income neighbourhood in a large city, primary dwellings predominate over secondary dwellings.

2.3. Initial Energy Characteristics

2.3.1. Baseline Data

To develop different alternatives, it is necessary to know the initial energy characteristics of the buildings. Since this project focuses on the energy supply to residential dwellings, it is only necessary to know the characteristics of these types of buildings. The following information has been obtained from previous works [23,24,25].
  • Cadastral reference
  • Number of dwellings
  • Residential cells area
  • Top floor
  • Year of construction
  • Size of the building
The basic needs of residential dwellings are domestic hot water (DHW), electricity, heating, and air conditioning. As it is not possible to know exactly how the energy in each dwelling is supplied, two different sources of information were used to calculate the energy demands of the dwellings in the neighbourhood. First, the annual heating, air conditioning and DHW demands were established according to the classification made by the Valencian Building Institute (IVE) in the Tabula project [26]. Tabula is a European project whose objective is to relate the type of building, characterised by its size and year of construction, with its corresponding energy demand to propose energy efficiency improvements. The parameters on which the project focused were:
The construction period of the building:
  • G1: up to 1900
  • G2: 1901–1937
  • G3: 1937–1959
  • G4: 1960–1979
  • G5: 1980–2006
  • G6: 2007–2020
The size of the building:
  • SFH (Single Family House): detached single-family houses
  • TH (Terraced House): single-family terraced houses
  • MFH (Multi Family House): multi-family houses
  • AB (Apartment Block): flat block
Each classification was made according to the location, which in all cases corresponded to the Mediterranean climate given the location of the neighbourhood. In this way, the buildings and dwellings that make up the residential part of L’Illa Perduda were classified according to the Tabula project, which is specified in Table 1.
From the Tabula project website, Table 2 shows the annual energy demands for heating, cooling and DHW for each type of building in the studied neighbourhood per unit area.
The second source of information from which the rest of the energy demands were obtained was the Institute for Energy Diversification and Savings (IDAE), specifically the SECH-SPAHOUSEC project [27], which analyses the energy consumption of the residential sector in Spain. Based on these consumptions, the energy demands of the dwellings under study were established. First, each energy consumption of the residential sector was obtained according to the climatic zone. Table 3 shows the percentage of each consumption of a dwelling in the Mediterranean type of climate.
Since more precise data were obtained for heating, cooling and DHW, which depend on the type of building, only the percentages of consumption for cooking, lighting and appliances were used. On the other hand, the project also provided the total and average energy consumption per household: the average annual consumption of a block of flats in the Mediterranean is 22.1 GJ. With these data and the percentages obtained above, the annual energy consumption of each type of demand per household was obtained:
  • Kitchen: 436.5 kWh/household
  • Lighting: 348.2 kWh/household
  • Household appliances: 1568.95 kWh/household
These consumptions were established because these demands are requiredto estimate the energy characteristics of the neighbourhood.

2.3.2. Annual Demands

Since both the total residential cell area of each building and the number of dwellings is known, it is straightforward to estimate the annual energy demand of the neighbourhood. These results are summarised in Table 4.
However, demands do not remain constant throughout the year but vary according to various factors. Modifications were made to the demands according to the month to know the daily and hourly demands and thus know how the energy demand behaves at each time of the year.

2.3.3. Monthly Demands

The annual demands calculated on Table 4 vary depending on the month. To know the monthly demands, they are calculated based on the days of the month and then adjusted according to the characteristics of the demand. In general terms, this would be the formula for calculating each monthly demand without adjustment:
M o n t h l y   d e m a n d u n a d j u s t e d   M W h = A n n u a l     d e m a n d   M W h D a y s   w i t h   d e m a n d D a y s   o f   t h e   m o n t h
First, both heating and cooling thermal demands trongly depend on the average outdoor temperature in the city of Valencia. To know the average outdoor temperature in Valencia for each month, data collected by Climate Data [28] was used, which collects historical weather data for Valencia from a diverse set of networks. According to these average temperatures, the coldest months requiring heating are January, February, March, April, November, and December, while cooling demand arises from May to October. To calculate the monthly demands from the annual demands, the average daily demands were calculated to estimate the monthly demand according to the days of each month for each type of building and then adjusted according to the average outdoor temperature:
C l i m a t e   c o n t r o l   a d j u s t m e n t   % = T 1 T 2 T 1 100  
where:
T1: Outdoor average temperature of all months requiring climate control
T2: Outdoor average temperature of each month.
To determine the demand based on the outside temperature, the average temperature of the months requiring climate control was calculated and the demand was decreased or increased according to the average monthly temperature of each month.
M o n t h l y   h e a t i n g   d e m a n d   M W h = M o n t h l y   d e m a n d u n a d j u s t e d 1 + C l i m a t e   c o n t r o l   a d j u s t m e n t 100
M o n t h l y   c o o l i n g   d e m a n d   M W h = M o n t h l y   d e m a n d u n a d j u s t e d   1 C l i m a t e   c o n t r o l   a d j u s t m e n t 100
On the other hand, the demand for DHW varies throughout the year depending on the temperature of the mains water. The energy required is proportional to the daily demand and to the temperature difference between the water used and the mains water. The Technical Building Code (CTE) establishes in Section HS4 of its Basic Document on Health [29] that the DHW supply temperature at the consumption points must be between 50 and 65 °C, so a consumption temperature of 60 °C was considered. The temperature of piped water was obtained for each month from the data collected by the IDAE [30]. The daily and monthly demand was calculated and corrected for the difference in temperature between the water consumed and the mains water. The greater this temperature difference, the greater the energy demand.
M o n t l y   D W H   d e m a n d   M W h = M o n t h l y   d e m a n d u n a d j u s t e d Δ T 1 Δ T 2
where:
ΔT1: Difference between consumption temperature and network temperature for each month
ΔT2: difference between the consumption temperature and the average annual network temperature.
The lighting demand changes throughout the year depending on the solar hours. To estimate the solar hours, data collected by the National Astronomical Observatory [31] was used, which specify the sunrise and sunset times for each day of the year. The more solar hours, the lower the demand for lighting, so this demand is proportionally increased or decreased depending on the night hours of each month. In addition, 6 h of sleep were considered in which there was no sunlight but also no demand.
M o n t h l y   l i g h t i n g   d e m a n d   M W h = M o n t h l y   d e m a n d u n a d j u s t e d S u n l e s s   h o u r s   p e r   m o n t h A v e r a g e   s u n l e s s   h o u r s   p e r   y e a r
Finally, the energy demands corresponding to the kitchen and household appliances only vary over the months according to the days of each month, as there is no other significant differentiation to be considered. Once all the monthly energy demands per area or per dwelling were known, the total energy demands were calculated. Table 5 summarises the monthly energy demands in MWh.

2.3.4. Daily Demands

To determine dimensions of the fuel cell, it is necessary to know the daily peak power, so the hourly demand on working days and holidays were calculated. To estimate the demand, it is important to know the occupancy of the dwelling. To this end, data collected by the National Statistics Institute (INE) in a Time Use Survey 2000/2010 [32] was used. The results obtained established that the highest occupancy occurs at night; however, it must be considered that during certain hours of the night when occupancy is at its highest, there is no demand because the necessary hours of sleep must be considered. To determine at what times there is or there is not demand, the hours at which Spanish people go to bed and wake up on holidays and working days was obtained from the Center for Sociological Research (CIS) [33]. By correcting the occupancy percentages with the average hours of sleep of the Spanish people, it is possible to estimate the demand percentages according to the occupancy of the dwelling. Since the CIS distinguishes between working days and holidays, each hourly demand was calculated for each type of day, thus obtaining the daily demand for each type of day for each month.
A v e r a g e   w e e k l y   o c c u p a n c y = Σ w e e k d a y   o c c u p a n c y % 5 + Σ h o l i d a y   o c c u p a n c y % 2     7
O c c u p a n c y   a d j u s t m e n t = E a c h   h o u r l y   o c c u p a n c y   % A v e r a g e   w e e k l y   o c c u p a n c y   %  
To adjust each hourly demand according to occupancy, the daily demand, which is the previously calculated monthly demand divided by the days of the month, must be multiplied by the occupancy adjustment. However, daily demand fluctuations are not only dependent on occupancy. Given the neighborhood’s current energy supply systems, which currently use gas boilers for heating and electric chillers for air conditioning, it was considered that thermal demand includes DHW and heating while the electrical demand includes the rest of the energy demands.
In the case of DHW demand, the percentages corresponding to occupancy were followed, while for heating demand, in addition to the occupancy percentages, the temperature difference throughout the day were considered. For this purpose, the PVGIS website [34] was consulted, where the database of the Valencia weather measuring station can be found, from which the temperature of each hour was obtained for each month. The adjustment was made in the same way as for the calculation of monthly demands but considering the hourly temperatures this time:
C l i m a t e   c o n t r o l   a d j u s t m e n t   % = T 1 T 2 T 1 100  
where:
T1: Outdoor daily average temperature
T2: Outdoor hourly temperature.
The highest thermal demand occurs on public holidays in February at 22:00 h, because a decrease in temperature coincides with a high percentage of occupancy of dwellings and is equal to 13.7 MWh. This maximum thermal demand coincides with a decrease in temperature and a high occupancy of the dwellings.
The graph of the hourly variation of thermal demand in February is shown in Figure 2 where the fluctuation according to occupancy and temperature, and the maximum produced at 22:00 on public holidays can be seen.
On the other hand, electricity demand was divided into the four types mentioned above: appliances, cooking, cooling, and lighting. Each demand must be corrected for occupancy and other additional factors depending on the type of demand. First, to calculate the demand for household appliances, the percentage of operation of each appliance was considered, as obtained from the SECH-SPAHOUSEC project of the IDAE [27]. The demands that remain constant throughout the day are refrigerators, freezers and standby, while the rest of the demands depend on occupancy. Lighting depends on occupancy, but during sunshine hours the demand is reduced by 60%, as there are rooms that are not illuminated by natural light and require artificial lighting. It was decided to reduce estimates by 60% to be on the safe side and to certify to meet the demand with the sizing of the fuel cell, but the reduction could be even higher. On the other hand, the electricity demand of the kitchen depends entirely on occupancy. Finally, for cooling, in addition to the occupancy rates, as with the calculation of the daily heating demand, the temperature difference throughout the day were considered because the hottest hours lead to a higher demand for cooling. For this purpose, the data provided by the Valencia measuring station, available on the PVGIS website [34], were used. The highest electricity demand occurs in August on public holidays at 15:00 and is equal to 3.2 MWh. The fluctuation of electricity demand for the month of August is shown in Figure 3.
It is logical that the highest electricity demand occurs at 3 p.m. on an August holiday, since it coincides with the highest temperature of the month and of the day, which increases the demand for cooling, together with a high occupancy of dwellings, which leads to a high electricity demand.
Once the energy consumption data for the neighbourhood is known, the following methodology was proposed for the study. Based on the energy needs, both thermal and electrical, we proceeded to consider dimensions of the generation system and select the most suitable type of fuel cell to meet the thermal and electrical demands.
There is no single solution to the problem, so it was necessary to consider which alternatives were likely to cover the energy demand, depending on the installed fuel cell power, so that demand is satisfied (thermal or electric), as well as the centralisation or decentralisation of production.
Each of the proposed alternatives were evaluated from a technical and economic point of view. A comparison was made between all of them and the most appropriate one was selected. Finally, a detailed study was made of the best location for the selected generation system based on physical and operational considerations.

3. System Design

3.1. Considerations on the Size of the CHP System

Once the daily demands are known, the system must be sized. Due to the large variations in the demands that are obtained, it is important to size the system so that it is profitable and neither excessive nor insufficient in a way that optimises the utilisation factor of the installation and the degree of coverage of the energy demands. On the one hand, if the system is oversized, the initial investment will be too high and the system too complex; on the other hand, if it is undersized, the advantages of cogeneration are lost.
Depending on the mode of operation of the fuel cell, i.e., the demand to which the production is to be adjusted, the most suitable power is chosen. If the total annual electrical demand and the annual thermal demand for heating and DHW (referred to as thermal demand in the following) are plotted graphically, so-called monotonic demand curves [35] are obtained. These curves help to decide the power of the fuel cell that optimises both the utilisation factor and the degree of coverage of the installation, although a complete study including economic terms must subsequently be carried out to study the feasibility of implementing the system. This power is represented in the curve by a decrease, as seen in Figure 4. The monotonic curves of the annual thermal and electrical demand are represented, and different alternatives were developed according to these.
As can be seen, if the fuel cell output is adjusted to the thermal demand, the thermal power that would optimise the installation is 4 MW, whereas, if the electrical demand is tracked, the electrical power that optimises the system is 1 MW.
Monitoring the thermal demand has many advantages. The most important is that by adjusting to this thermal demand, surpluses are avoided, and energy is not wasted. If more electricity is produced than demanded, because the thermal demand is much higher than the electricity demand, it can be sold to the grid. If, on the other hand, the electricity demanded is higher than the electricity produced, it can be bought from the grid. The major disadvantage of meeting this demand is that a much higher power is required, which would lead to a more complex and costly system.
On the other hand, the monitoring of electricity demand aims for independence from the grid. Although it remains connected to the grid so as not to be isolated in the event of a technical problem, in principle, all the electricity is produced by the chosen fuel cell. If the production is adjusted to the electricity demand, heat will be generated more time than is required. If less heat than required is generated, the system has to rely on the support of gas boilers, which would use more fuel. If, in the opposite case, more heat is produced than demanded, the surplus energy is wasted. The major advantage of prioritising the supply of electricity needs is that a smaller amount of power would be required, so the economic investment would be much lower.
In any case, whatever cogeneration system and mode of operation is chosen, it needs to be backed up by the electricity grid and a thermal support system. The cogeneration system must be adapted to the already existing infrastructure, so it relies on the support of the boilers to meet the thermal needs and the connection to the grid for the purchase or sale of electricity.

3.2. Fuel Cell Selection

Once an energy demand study has been completed and the possible sizing options for the system have been considered, a decision must be made as to which type of basin to choose. First, as is characteristic of the different type of demands in residential buildings, they depend on several factors that fluctuate throughout the day and the year, so a system is needed that behaves well in the face of variations in demand. To ensure that demand monitoring does not affect the maximum efficiency that the system can offer, high temperature fuel cells are not recommended. High temperature fuel cells are not characterised by fast reaction times, and much efficiency would be lost as they would not be able to respond to fast load variations. For this reason, solid oxide fuel cells (SOFC) and molten carbonate fuel cells (MCFC) were discarded as options [36].
In the case of alkaline fuel cells (AFC), the manufacturer recommends maintenance every 500 operating hours. This is a very short period for the proposed application. Therefore, a decision must be made between the proton exchange cell (PEMFC) and the phosphoric acid cell (PAFC), as both cells have the advantage of fast reaction time and quick start-up. For stationary CHP applications, PAFC stacks perform best because they have a higher operating temperature, more waste heat can be utilized, and more thermal demand can be covered than that of a PEMFC stack [36]. Consequently, in order to achieve the highest efficiency of the system based on the energy study carried out, a phosphoric acid fuel cell was chosen to supply all the residential dwellings in the neighbourhood with electrical and thermal energy. After a PAFC market study, The Doosan PureCell 400 model was chosen [37] as it is the most commercially available phosphoric acid fuel cell and has already been used for various stationary applications, offering an overall efficiency of more than 80%. In addition, it offers everything needed for project implementation, as it uses natural gas as fuel, provides both electrical and thermal energy, and uses the electrical grid as a backup system. The most important characteristics are summarised in Table 6.
A complete fuel cell complete system is composed of a reformer, that allows the hydrogen to be obtained from natural gas, the fuel cell stack with a balance of plant system (BoP), including blowers, compressors and heat recovering systems, and power electronics that allow generation of AC electrical energy from the DC electrical energy produced by the fuel cell.
It is important to know how the stack behaves at partial loads so that tracking does not hinder the maximum efficiency that the stack can offer. Figure 5 shows the partial load efficiency curve of a PAFC fuel cell compared to a typical natural gas combustion engine.
The performance of this fuel cell at 50% load is within 2% of its full load efficiency characteristic. As the load decreases, the curve becomes somewhat steeper, as the inefficiencies of the air blowers and fuel processor begin to cancel out the improvement in stack efficiency. For this reason, the fuel cell operates at least 50% of its full load.

3.3. Energy Supply Approach

Since it was not obvious which is the best energy supply solution, different alternatives weree considered to choose the most suitable one according to the energy and economic results they present. In order to carry out the annual energy balance, the most relevant parameters that show the efficiency of the system were calculated for electrical energy and thermal energy. In any case, the current situation was compared with the new situation considering the cogeneration system using a PAFC fuel cell and the corresponding benefits. The most important parameters that were calculated to show the energy efficiency of the system were [35] the useful heat, the thermal and electrical coverage, and the percentage of primary energy savings (PES).
On the other hand, in order to make the economic balance, the initial investment, the difference in fuel and electricity costs through the comparison of the new situation with the current situation and the cost of operation and maintenance of the fuel cells were considered. The initial investment and the operation and maintenance costs depend on the chosen fuel cell. For the Doosan Pure Cell 400 model, data collected by EPA [38] and the U.S. Department of Energy [39], estimate a cost of $7000 per kW of electrical power, and an O&M cost of 0.7 cents per kWh of electricity. However, there are references [40] that argue that the cost of the chosen model has decreased because it has become more competitive in the market. Although the cost of the new 400 kW PAFC system is not publicly available, it is estimated to cost approximately $2 million for the system and installation, which was the cost of the 200 kW PAFC system installed at a zoo in Los Angeles and a high school in New York, thus cutting the cost per kW in a half. The value of USD 2 million for the system and installation was taken in this study.
As with all electricity production plants, surplus energy is sold at the price agreed with the chosen retailer. To make the estimated calculations, the average data provided by the SIOS (System Operator Information System) of the Spanish Electricity Grid [41] for the year 2021 was used, with a purchase price of 120.16 €/MWh and a sale price of surplus energy of 69.3 €/MWh. In addition to the market remuneration, specific remuneration must be considered when applicable. In order to estimate the necessary remuneration parameters for the calculation of the specific remuneration, recourse was had to the order updating the remuneration parameters established in article 20.3 of Royal Decree 413/2014, of June 6, of those type facilities that are within their regulatory useful life [42].
Finally, the price of natural gas in Spain depends on access tolls. In mid 2021, for large or heated dwellings, tariff 3.2 was assigned, which estimated a fuel price of between €0.045/kWh and €0.0615/kWh, so an average value of €0.04785/kWh was taken [43].

4. Development of Alternatives

Two main strategies were identified to cover the heat demand with a total installed power of 4 MWp (given by the monotonic thermal demand curve in Figure 4), and to cover the electrical demand, with a total installed power of 1 MWp (given by the monotonic electrical demand in Figure 4). This allowed the further identification of eight different alternatives differentiated according to the power of the CHP system, the mode of operation and the distribution of the fuel cells. Below, the advantages and disadvantages of each configuration are compared and discussed.

4.1. Alternatives with a Production System of 4 MW of Thermal Capacity

The alternatives developed below with a thermal power of 4 MW wee aimed at satisfying the maximum thermal demand in the months when heating required to determine whether it would be profitable considering the low thermal demand in the rest of the months (DHW demand but without heating demand) and the large economic investment to be made. Given the thermal power of the chosen fuel cell (454 kWth showed in Table 6), a total of nine fuel cells are needed to reach 4 MW of thermal power. A summary of the characteristics of each alternative developed is shown in Table 7.
Alternative 1: Centralised production system with year-round monitoring of thermal demand. This alternative has several advantages, since, by having nine fuel cells operating as a set, it is possible to choose to switch off some of the fuel cells in the months when not so much thermal production is required. This would have the great advantage of covering a large thermal demand when required, which coincides with the heating months, without the need to lose efficiency by operating at low operating loads in summer, when there is only thermal demand for DHW. Another advantage is that during the months with heating demand, large thermal energy production would produce a large amount of electricity so that in addition to meeting electricity demands the surplus could be sold to the grid at a price that allows making some profit, providing economic savings.
Therefore, given that the thermal demand in winter is much higher than that in summer due to the poor quality of enclosures that result in a high heating demand, during these months all the fuel cells would be in operation, while during the rest of the year most of them would be switched off. To find out how many stacks would be switched off during these months, the corresponding monotonic thermal demand curve is plotted in Figure 6.
Where a decrease of the curve by 500 kW is seen, only one battery is left in operation. It is important to note that the durability of the batteries would not be affected by being switched off and on once a year.
Alternative 2: Centralised production system with 4 MW of thermal power and monitoring of thermal demand or electrical demand according to the demanded air conditioning. This case is similar to the previous case; however, it follows the electrical demand from May to October. In these months the electrical demand is much higher and, therefore, the system would provide a greater electrical coverage and significant economic savings would be achieved by reducing the purchase of electricity. As the system is centralised, it is possible to evaluate the option of switching off some batteries during the months when the electricity demand is followed. To do this, the monotonic electricity demand curve for these hours of the year was obtained, as seen in Figure 7.
Approximately, an equivalent electrical power of 1700 kW, equivalent to four fuel cells, is needed during these months.
Alternative 3: Distributed production system with year-round monitoring of thermal demand. This alternative consists of distributing the fuel cells as small power generation sources that are installed close to the consumption points. Therefore, groups of building blocks should be made that are powered by each fuel cell individually. Thus, the fuel cells would be programmed to supply the demands of specific building blocks. Depending on the location and the thermal demand of each block, the distribution shown in Figure 8 was made.
This installation alternative is oriented to cover the maximum thermal demand in the months that require the use of heating, so that in the months that do not have this demand, the batteries would operate most of the time at a partial load of less than 30%. It is important to remember that fuel cells start to lose a large part of their performance from a partial load of less than 50%, so significant efficiency would be lost in these months. For this reason, the simulation included switching off the fuel cells during this time of the year as well as to satisfy the thermal needs with the boilers already installed, and the electricity demand with the purchase of electricity from the grid. This ensures that the stacks operate at high efficiency. Although switching the fuel cells off and on may affect their durability, this would only be done once a year, so loss of cell life would be negligible.
This alternative would have two important advantages. First, due to the operation of nine batteries during the heating months, the cogeneration system covers a large part of the thermal demand. On the other hand, with each battery operating individually, injecting the surplus energy into the grid requires less trouble. However, the fact that each battery operates individually also has the disadvantage that the system cannot supply energy during the non-heating months, as simulation showed they would operate at such a small partial load that they would lose too much efficiency.
Alternative 4: Distributed production system with monitoring of the thermal or electrical demand according to the air conditioning demanded. The island distribution remains the same as in the previous alternative. However, since in the previous alternative the batteries had to be switched off when thermal demand was only for DHW, which forced the fuel cells to work at operating loads at which too much efficiency was lost, an alternative was tested in which monitoring of both energy demands was combined during the year. Therefore, from November to April, the thermal demand is tracked and in the remaining months the electrical demand is tracked. In this way, continuous operation at partial loads above 50% is ensured.

4.2. Alternatives with a Production System of 1 MW of Electrical Power Output

Alternatives of 1 MW of electrical power are much more economical, as only two fuel cells are needed. However, the benefits of installing the system have to be studied in terms of the energy results obtained. Table 8 summarizes the most important characteristics of the alternatives developed.
Alternative 5: Centralised production system with year-round monitoring of electricity demand. In this alternative, electricity demand continues throughout the year, so it is necessary for the conventional system to cover most of the thermal demand during the heating months and heat is wasted in the hot months. In principle, the thermal energy balance will not be successful. A study would have to be carried out to assess how much energy is wasted and whether this is worthwhile considering that a large part of the electricity demand would be covered.
Alternative 6: Centralised production system with monitoring of the thermal or electrical demand according to the demanded air-conditioning. In this case, two batteries would also be required in continuous operation; however, they would operate in one operating mode or another depending on the climate. As with the rest of the alternatives developed, the electrical demand would be followed from May to October, and the thermal demand would be followed during the rest of the months.
Alternative 7: Distributed production system with year-round monitoring of electricity demand. As with the first alternative developed, the two fuel cells would be in continuous operation throughout the year, but in this case, they would be distributed by building blocks according to location and electricity demand as shown in Figure 9.
Alternative 8: Distributed production system with monitoring of the thermal or electrical demand according to air conditioning demanded. In this alternative, finally, a distributed generation system was developed with the same building block groups as in the previous alternative, but with monitoring of thermal demand when there is heating demand and monitoring of electrical demand when there is cooling demand.

5. Results

The following parameters were calculated for each of the alternatives presented in the previous section:
-
Useful heat. Annual heat produced by the cogeneration system used to cover the thermal demand.
-
Heat dissipated. Heat produced by the fuel cell that could not be harnessed to cover thermal demands.
-
Thermal demand coverage (%). Percentage amount of thermal demand that is covered by the heat produced by the cogeneration system.
-
Electricity demand coverage (%). Percentage amount of electricity demand that is covered by the electricity produced by the cogeneration system.
-
Electricity self-consumption (%). Compares in percentage value the energy consumed from the system with the total electrical energy produced.
-
PES (%). Percentage primary energy savings. This is a parameter that relates the primary energy savings with the cogeneration system and the primary energy that would have been consumed with a separate heat and power generation system.
-
Investment (€). Cost of installing fuel cells.
-
Savings (€/year). Annual economic savings produced by the cogeneration system considering the difference in fuel and electricity costs through the comparison of the new situation with the current one and the cost of operation and maintenance of the fuel cells.
-
Simple payback time (years). Investment/savings.

5.1. Results Obtained and Comparison of the Alternatives Developed for a 4 MW Thermal Power Production System

For ease of comparison, Table 9 summarises the most important parameters for each of the alternatives developed.
Despite the high annual savings achieved with the CHP system, the investment is very high, hence unfavourable payback periods occur in all the cases. However, the implementation would be considered feasible as the lifetime of the fuel cells is on average 25 years, so that the investment would be recovered and there would be gains in the later years.
In order to make a comparison between centralised and distributed generation, one must compare e alternatives in which fuel cells are programmed to follow the same energy demands during the year. Therefore, if we compare the first alternative with the third alternative, both with the system prepared to follow the thermal demand but the first one being a centralised system and the third one a distributed generation system, we can conclude that the first one presents better results both energetically and economically. This is due to the fact that there are large differences in thermal demand during the year due to the high demand for heating caused by poor building envelopes, so that following the thermal demand in a distributed installation would force the system to work at low partial loads in the months when this demand is not so high, which coincides with the months when heating is not needed, so that much efficiency is lost and it is more profitable both economically and energetically to operate with the conventional system during this time of year, which means that the advantages of a cogeneration system are not taken advantage of.
On the other hand, comparing the second and fourth alternatives, which follow thermal demand when there is a heating demand and the electrical demand when there is a cooling demand, the second being a centralised system and the fourth a distributed generation system, there is not as much difference as in the previous comparison. The difference lies in the fact that in distributed generation, all the batteries are kept in operation throughout the year, which means that greater electricity coverage is achieved and a higher percentage of self-consumption in the hot months, which are those with the highest electricity demand, although at the same time, energy savings are not achieved because consumption is not compensated by production. Even with distributed generation, less electricity needs to be imported from the grid, and this is compensated by higher fuel costs and lower income from the sale of surpluses. It can be concluded that for a CHP system of 4 MW of thermal power, better results are achieved with a centralised system.
To compare the mode of operation in which the fuel cells work, the first alternative is compared with the second alternative. The biggest advantage of the first alternative is primary energy savings, since, by not producing more heat than demanded, all the thermal energy generated by the fuel cells is useful. Despite this parameter, the rest of the energy and economic results are better for a system that follows the electricity demand during half of the year. On the other hand, comparing the distributed generation cases, practically the same conclusions can be drawn as with the previous comparison. The primary energy savings are higher in the case of the continuous mode of operation in which the thermal demand is followed, because the consumption is compared with the production and no heat energy is wasted. In all other parameters, better results are also achieved with the system that follows one or the other demand depending on the season. By tracking electricity demand in the months with cooling demand, the batteries can operate at partial loads above 50% and do not need to be shut down, thus increasing both the economic and energy benefits of the CHP installation.
Therefore, it can be assumed that the best option for a CHP system of 4 MW thermal power is a centralised system. The choice between the first and the second alternative is more complex, since, as explained above, the second alternative presents better results except for primary energy savings. Given that better coverage of demand and greater economic savings are achieved with the second alternative, it was decided to opt for this configuration in the case of choosing a system with 4 MW of thermal power. Thus, a study of alternatives for a cogeneration system with 1 MW of electrical power was carried out.

5.2. Results Obtained and Comparison of the Alternatives Developed for a Production System of 1 MW of Electrical Power

The changes from one alternative to the other were not as significant as the previously analyzed CHP system which had more power (4 MW), but the parameters were compared, as in Table 10, to determine which alternative is better for the case of this 1 MW CHP system.
In order to make a comparison between centralised generation and distributed generation, the alternatives with fuel cells programmed to follow the same energy demands during the year must be compared. The energy results obtained are very similar in terms of demand coverage achieved and primary energy savings. In terms of economic results, distributed generation offers higher annual economic savings. This is because better regulation of the fuel cells allows greater adaptability to demand, and less electricity needs to be imported, which is currently the most expensive energy.
As for the difference between the mode of operation to be followed for fuel cells, the fifth alternative is compared with the sixth alternative, and the seventh alternative with the eighth alternative. Both the thermal coverage and the electrical coverage are slightly lower in the operation mode that follows the year-round electrical demand as well as the primary energy savings. This is caused by the increase in evacuated heat that occurs when following the electrical demand. On the other hand, the economic results are also better for systems that follow both energy demands, as surplus energy is produced which generates remuneration at market price.
Therefore, although there is not a big difference between the alternatives studied, it is concluded that the best configuration for this CHP system would be the one corresponding to the eighth alternative. i.e., a distributed generation system that follows the thermal demand when heating is required and the electrical demand when there is a cooling demand.

5.3. Selection of the Most Appropriate Alternative

Since the different configurations and modes of operation of the two cogeneration systems were compared in the previous section and a decision made as to which is better in each case, the final choice of the alternative depends on the cogeneration system to be chosen.
As initially intuited, a system that prioritises covering thermal demand offers greater coverage of thermal demand and electricity demand. On the other hand, although the annual savings are also much higher, it requires a much larger initial investment and therefore presents a less viable economic result than a CHP system that prioritises covering the electricity demand.
The cogeneration system of 4 MW of thermal energy was further developed. Despite the lower profitability, the energy results obtained were satisfactory and a large annual economic saving was achieved, which, over the years would amortize investment and could lead to significant profits. Furthermore, given that the aim of this study was to test the viability of stationary fuel cells in compact Mediterranean cities, by choosing a higher power fuel cell it is easier to appreciate the characteristics offered, although it is not an economically viable system.
The energy and economic results obtained for this cogeneration system are shown below (Table 11, Table 12, Table 13 and Table 14), compared to the current system based on complete dependence on the electricity grid for electricity supply and conventional gas-fired boilers to meet thermal needs.
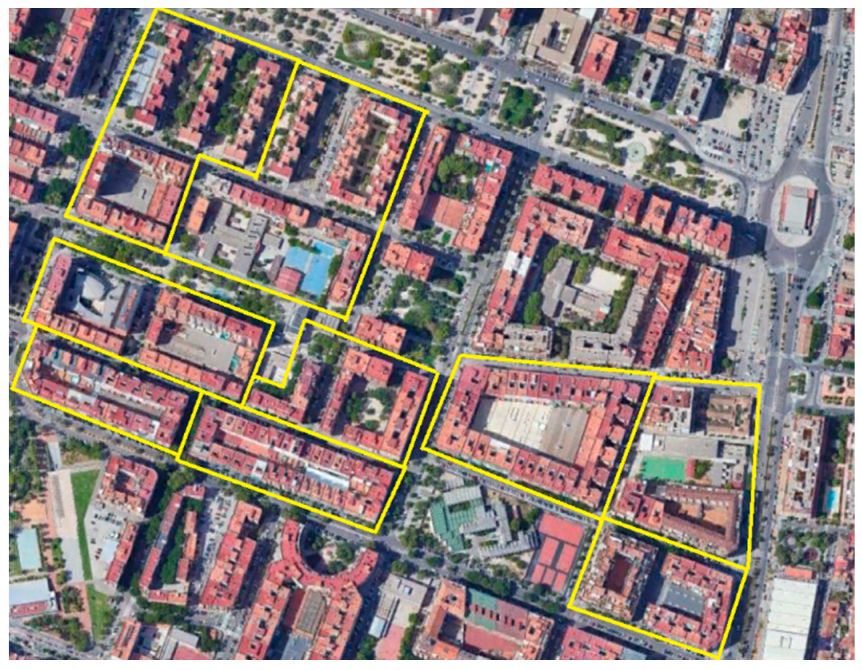
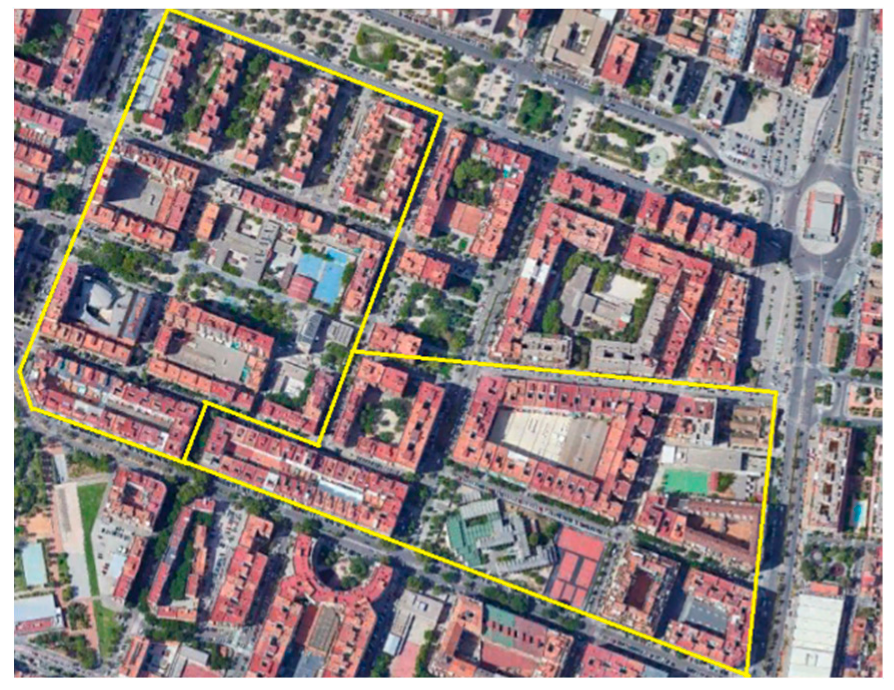
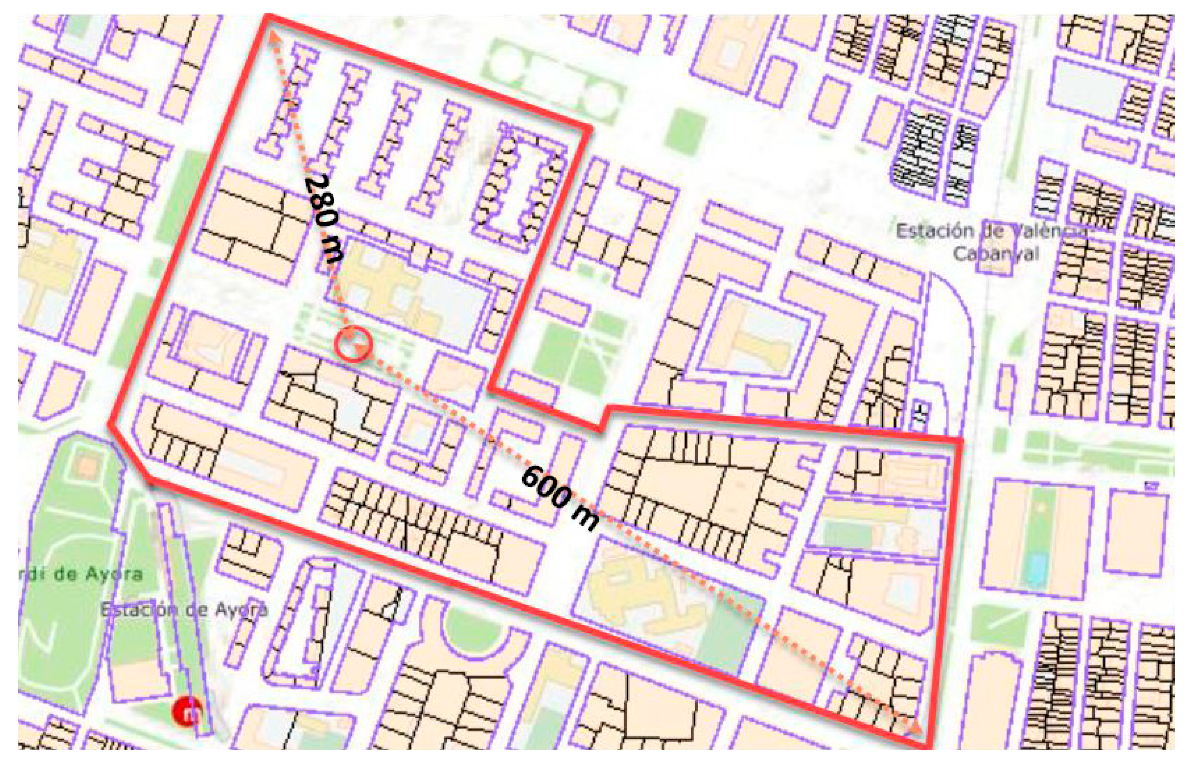
As nine fuel cells are needed in total and centrally, the system can become very complex. This largely depends on the location of the stacks, as this can have a significant effect on the distribution of heat to the users and must be optimised to maintain high efficiency. Due to the complex geometry of the neighbourhood and the scarcity of free building space, it is recommended that a thorough assessment be carried out in collaboration with local urban planners so that a study of the existing infrastructure can be carried out to ensure the adaptation of the new CHP system and distribution network. As a first approximation, it was decided to locate the installation as shown in Figure 10.
Both the plan and the measurements were obtained from the Electronic Headquarters of the Cadastre [44]. To connect the cogeneration system to the electricity grid, the information issued by the Iberdrola Group [45] was used. Access and connection of the installation must be requested, attaching the necessary documentation according to the type of installation. Based on this request, a technical study was carried out on the viability of this connection.
Concerning the supply of domestic hot water and heating to different buildings [46], it would be necessary to install a network of pipes to deliver heat to users from the central plant, which would be complemented by the individual boilers that each user has in their home. In this way, the following components would be needed:
  • Fuel cells as a central thermal system, automated depending on the operating mode in which it operates. Variations in thermal demand are detected from a control system in each of the thermal substations of each building.
  • Distribution network, consisting of supply and return pipes. The hot water produced is distributed to the buildings through a network of pre-insulated and buried pipes to prevent heat loss. In addition, the distribution networks would have the necessary elements: elbows to change the direction of distribution, lockshields to isolate any element of the network, regulation valves in the substations, and aerators and drains to extract the air, as it is a closed circuit.
  • Centralised pumping system: a single pumping unit drives the fluid through the entire distribution network.
  • Heat transmission connections and substations: distribution of energy to buildings. The substations would have a heat exchange system to regulate the consumption temperature in the building. The connections, as already mentioned, would be connection pipes between the distribution network and the substation. All buildings would be connected in parallel to the service connections so that they have the same supply conditions.
It should be noted that the use of pure hydrogen as fuel produced by electrolysis from renewable energy (“Green Hydrogen”) is technically possible with very few modifications to the commercial fuel cell. However, there are some technical and, above all, economic constraints that do not make this a viable solution nowadays. For the moment, contrary to the gas distribution system, there is no hydrogen pipeline to distribute hydrogen in the cities. The gas distribution network admits a very low percentages of hydrogen due to the problems of embrittlement of the metals used. Hydrogen would, therefore, have to be transported by truck from the production site. Transport costs have to be added to the price of hydrogen, which means that, for the moment, it is not a competitive solution in the current Spanish market.
Similar research works were found in literature in which fuel cells were analyzed as a possible solution to cover the heating and electricity demand in residential sectors and in which different operation strategies were analyzed. However, most of them corresponded to micro-combined heat and power (micro-CHP) systems for single family houses which cover electrical demands in the order of 1 to 5 kWe, and which mainly consider PEMFC or SOFC for small scale applications.
In [47] different operation strategies for residential micro-combined heat and power systems were analyzed for three different types of technologies: Stirling engine, gas engine, and solid oxide fuel cell (SOFC). The cost of meeting a typical UK residential energy demand was calculated for hypothetical heat-led and electricity-led operating strategies. It was shown that the lowest cost operating strategy for the three technologies was to follow heat and electricity load during winter months, rather than using either heat demand or electricity demand as the only dispatch signal.
In [13] was proposed the implementation of a regional hydrogen energy interchange network among energy consumers for the interchange of energy comprising hydrogen, electricity, and heat (hot water) in residential areas in Japan using PEMFC. The outcomes of various cases where the number of fuel cells and fuel processors were varied with or without energy interchange were compared. It was concluded that the interconnection resulted in a flexible and cooperative operation, which increased the load factor of the equipment and provided added advantages such as cost reduction and CO2 mitigation, and that the operation of the fuel cells should be determined depending on the electricity and heat balance of the demand, and different operational strategies should be applied in summer and in the other seasons.
In [48] a dynamic modeling of an eco-neighborhood integrated micro-CHP based on PEMFC was developed and a performance and economic analyses were carried out. Analyses were performed by evaluating two operational strategies (heat-led and electricity-led) for two designs. The first design considered a one-house family integrating a micro-CHP system using a PEMFC stack of 1 kWe. The second design was composed of a micro-CHP system based on PEMFC stack of 5 kWe coupled with each of a group of three houses. The performance of the proposed system was examined and compared with those of the conventional system using a natural gas-fired boiler and a power plant mix connected to the central grid from energy, all from environmental point of view in the French context. It was concluded that whatever the installation configuration unit and operational strategies, the proposed system allowed for reducing similar primary energy consumption of around 30% for both operation strategies (heat-led or electricity-led).
In [49] a technoeconomic analysis of PEMFC and SOFC micro-CHP fuel cell systems was carried out for the residential sector in Italy. Four kinds of operation were considered in order to evaluate the system behavior with different modulation strategies for single-family buildings. It was concluded that the choice to let the system operate following the user electric profile was preferable, both from the energy and economic points of view, because it allowed the reduction of the electrical grid dependence.
This research work analyzed fuel cells as a possible technological solution to cover high energy demand in blocks of large buildings with a high number of apartments, which is typical in the compact Mediterranean cities such as the case study analyzed in this paper (Valencia, Spain). This high energy demand implies the need of large units in the order of 1 MW, and the use of PAFCs was proposed. Regarding the operation strategy, a centralized system was proposed that follows the thermal energy demand (heat led) during winter and sells the exceeding electricity generated to the grid, whereas in summer it follows the electricity demand (electricity led).
It can be concluded that the solution is not unique nor universal for all type of systems, and a different operation strategy should be followed depending on each specific case analyzed, each of which would have different thermal and electrical demand profiles to be covered, different price of electricity and gas, fuel cell costs corresponding to different countries or regions. Therefore, results obtained in this research work cannot be directly extrapolated to other Mediterranean cities or other European regions. However, the methodology developed could be replicated provided that the parameters indicated in the Appendix A are replaced by those corresponding to the specific case of study to be analyzed.
Finally, it should be noted that this research mainly focused on the technoeconomic assessment of the system proposed without including other aspects such as social acceptance, which is key for the integration of the system proposed in cities as it implies systemic changes that would not be possible without the acceptance by the end users of this technology, who are the citizens.

6. Conclusions

The main objective of this study was the comparison of different energy supply systems using fuel cells in cogeneration that are fed from the natural gas network in order to achieve an improvement in the energy efficiency of the residential sector of European Mediterranean cities. In total, eight different alternatives were developed, differentiated according to the power of the cogeneration system, the mode of operation and the distribution of the fuel cells. Due to the development and comparison of the alternatives, the advantages and disadvantages of each configuration were identified, and the most suitable one was chosen for the case study: L’Illa Perduda, a neighbourhood whose energy characteristics were studied beforehand.
The chosen configuration was a centralised cogeneration plant of approximately 4 MW of thermal power, with an operating mode that varies according to the outside temperature. In this way, in the cold months when heating is required, the plant follows the thermal demand, while in the hot months when cooling is required, the plant follows the electrical demand. This was chosen because it saves the most primary energy, although for a CHP system with such a high output, a large investment would be required. With the implementation of this system primary energy saving is achieved, and a high coverage of the thermal and electrical demands is reached with very innovative technology. The main disadvantage of this configuration is profitability (with energy prices of mid 2021) which, compared to other more mature technologies, is economically unviable. Indeed, it would be more profitable to retrofit buildings to improve the enclosures that cause such a high demand for heating. However, research into new technologies is necessary, as in this case, so that they can be integrated into the market soon.
Another major problem for the sizing of the CHP system is the difference in thermal demand when heating is required and when only DHW is needed, which requires either evacuating heat because it follows the electrical demand or buying electricity because it follows the thermal demand. As a proposal for future development, the installation of a trigeneration system could be planned, which is a procedure that extends the cogeneration system that has been considered by adding cold production. For this, an absorption machine that obtains cold from a heat source would be needed. With a trigeneration system, the excess heat would be used to produce cooling and to satisfy the cooling demand, thus further improving the overall efficiency.
In addition, carbon capture and storage could also be considered, and production with the so called “Blue Hydrogen” fuel cell, which is a form of production with practically zero emissions. In this way, even greater savings in pollutant emissions could be achieved, and a subsidy could be obtained from the European Union, which plans to invest between 3 billion and 18 billion euros in Blue Hydrogen projects. “Green Hydrogen” could be a suitable technical solution; however, distribution costs and current price per kilogram of this kind of hydrogen does not recommend use for the time being.
To sum up, we can conclude that:
-
Due to the development and comparison of the alternatives, the advantages and disadvantages of each configuration were identified.
-
The chosen alternative provides good coverage of thermal and electrical demands and good primary energy savings.
-
The main disadvantage of this configuration is profitability (with the energy prices of mid 2021) which, compared to other more mature technologies, is economically unviable. Indeed, it would be more profitable to retrofit the buildings to improve the enclosures that cause such a high demand for heating.

Author Contributions

Conceptualization, T.G.-N. and C.S.-D.; Data curation, I.M.R., T.G.-N. and C.S.-D.; Formal analysis, I.M.R., T.G.-N. and C.M.M.; Investigation, I.M.R., T.G.-N. and C.S.-D.; Methodology, I.M.R., T.G.-N., C.S.-D. and C.M.M.; Resources, C.M.M. All authors have read and agreed to the published version of the manuscript.

Funding

This research was funded by Cátedra de Transición Energética Urbana (UPV-Las Naves-FVCiE). Grant number 20210096.

Acknowledgments

This work was supported by a grant of the Cátedra de Transición Energética Urbana UPV-Las Naves-FVCiE, which is chair at Universitat Politència de València (UPV) in collaboration with the city hall of Valencia (Grant number: 20220027).

Conflicts of Interest

The authors declare no conflict of interest.

Abbreviations

DHWSanitary Hot Water
IAEAInternational Energy Agency
CTECódigo Técnico de la Edificicación (Technical Building Code)
EPAUnited States Environmental Protection Agency
IDAEInstituto para la Diversificación y Ahorro de la Energía (Institute for Energy Diversification and Saving)
INEInstituto Nacional de Estadística (National Statistical Institute)
IVEInstituto Valenciano de la Edificación (Valencian Building Institute)
MCFCMolten Carbonate Fuel Cell
PAFCPhosphoric Acid Fuel Cell
PEMFCProton Exchange Membrane Fuel Cell
PESPrimary Energy Savings
PVGISPhotovoltaic Geographical Information Siystem
SOFCSolid Oxide Fuel Cell

Appendix A

In the tables included in this appendix are shown the figures used to make the calculations shown in the article. In the calculation of the economic balance, the guidelines set out in [35] were used.
For the calculation of the Base Specific remuneration, the following expression was used:
R e = R inv P n + R o E g
where Rinv is the Investment remuneration, calculated on the basis of the net asset value, the discount rate with a reasonable return of 7.5%, and the residual life, which, in this case, would be 25 years; Pn is the nominal power of the installation; Ro is the Operation remuneration, which is the result of subtracting the market price from the operating costs to compensate for possible extra electricity costs, and Eg is the selling energy. In Table A3 and Table A6 the two factors of the sum are calculated.
The Reduction factor showed in these tables is calculated considering the equivalent hours of the installation. If Nhinst > Nhmin, the complete specific remuneration is received. If Nhmin > Nhins > Uf, the specific remuneration is corrected with the factor d = (Nhinst − Uf)/(Nhmin − Uf); if Nhinst < Uf any specific remuneration is obtained, being Nhinst the number of equivalent annual operating hours of the installation (calculated on the basis of the energy exported to the grid and the power of the installation); Uf is operating threshold of the standard installation in one year, and Nhmin isthe number of minimum equivalent hours of operation of the standard installation in a year. Table A7 shows the figures for this calculation.
Table A1. Thermal Energy Balance (MWh/year) for alternatives considering 4 MW fuel cell power.
Alternative 1234
Current SituationCogenerationCogenerationCogenerationCogeneration
Heat generated boilers27,079.6811,120.3410,156.9313,131.3310,593.10
Heat generated PAFC 15,959.3520,881.0713,948.3521,944.83
Heat dissipated 0.003958.320.005458.25
Total generated heat27,079.6827,079.6831,038.0127,079.6832,537.93
Fuel consumption boilers33,849.6013,900.4212,696.1716,414.1613,241.38
Fuel consumption PAFC 38,925.2450,929.4434,020.3853,523.97
Total fuel consumption33,849.60 63,625.6150,434.5466,765.34
Fuel consumption increasing 18,976.0529,776.0116,584.9332,915.74
Useful heat 15,959.3516,922.7513,948.3516,486.58
Thermal demand coverage (%) 59625261
Table A2. Electrical Energy Balance (MWh/year) for alternatives considering 4 MW fuel cell power.
Alternative 1234
Current SituationCogenerationCogenerationCogenerationCogeneration
Imported electricity12,821.346292.881522.937810.6360.27
Avoided electricity consumption 6528.4611,298.415010.7112,761.07
Exported electricity 8938.758938.758522.818540.01
PAFC generated electricity 15,467.2120,237.1613,518.2321,301.08
Self-consumption percentage (%) 42.2155.8337.0759.91
Electricity demand coverage (%) 50.9288.1239.0899.53
Table A3. Economic Balance (€/year) for alternatives considering 4 MW fuel cell power.
Alternative 1234
Current SituationCogenerationCogenerationCogenerationCogeneration
Fuel Expenditure1,619,703.502,527,707.623,044,485.542,413,292.593,194,721.69
Purchase electricity1,540,612.56756,152.83182,995.18938,525.4537193.69
Market remuneration 619,455.28621,958.13590,630.67591,822.72
Investment remuneration 301,605.48301,605.48301,605.48301,605.48
Operation remuneration 322,510.05322,510.05307,502.96308,123.58
Base Specific remuneration 624,115.53624,115.53609,108.44609,729.06
Reduction factor 0.740.740.680.69
Reduced specific remuneration 460,694.69460,694.69416,295.34418,098.93
Subtotal 1,080,149.971,082,652.821,006,926.011,009,921.65
Generation toll (0.5 €/MWh) 4469.374469.374261.404270.01
Electricity production tax (7%) 75,610.5075,785.7070,484.8270,694.52
Electricity selling 1,000,070.101,002,397.75932,179.79934,957.13
Maintenance 91,101.86119,196.8979,622.37125,465.75
Total3,160,316.062,374,892.212,344,279.862,499,260.632,392,424.01
Table A4. Thermal Energy Balance (MWh/year) for alternatives considering 1 MW fuel cell power.
Alternative 5678
Current
Situation
CogenerationCogenerationCogenerationCogeneration
Heat generated boilers27,079.6821,146.2120,933.7721,151.4420,939.13
Heat generated PAFC 7146.287298.537131.077283.17
Heat dissipated 1212.811152.611202.831142.62
Total generated heat27,079.6828,292.4928,232.2928,282.5228,222.30
Fuel consumption boilers33,849.6026,432.7626,167.2126,439.3026,173.91
Fuel consumption PAFC 17,429.9617,801.2817,392.8617,763.83
Total fuel consumption33,849.6043,862.7243,968.4943,832.1743,937.74
Fuel consumption increasing 10,013.1110,118.899982.5710,088.14
Useful heat 5933.486145.925928.246140.55
Thermal demand coverage (%) 21.922.721.8922.68
Table A5. Electrical Energy Balance (MWh/year) for alternatives considering 1 MW fuel cell power.
Alternative 5678
Current SituationCogenerationCogenerationCogenerationCogeneration
Imported electricity12,821.345959.295953.775810.805805.30
Avoided electricity consumption 6862.056867.577010.547016.04
Exported electricity 0.00205.890.00205.77
PAFC generated electricity 6862.057073.467010.547221.81
Self-consumption percentage (%) 10097.0910097.15
Electricity demand coverage (%) 53.5253.5654.6854.72
Table A6. Economic Balance (€/year) for alternatives considering 1 MW fuel cell power.
Alternative 5678
Current
Situation
CogenerationCogenerationCogenerationCogeneration
Fuel Expenditure1,619,703.502,098,830.962,103,892.352,097,369.242,102,420.97
Purchase electricity1,540,612.56716,068.53715,404.92698,225.80697,564.73
Market remuneration 0.0014,325.690.0014,317.30
Investment remuneration 87,244.9687,244.9687,244.9687,244.96
Operation remuneration 0.009261.460.009256.04
Base Specific remuneration 87,244.9696,506.4287,244.9696,501.00
Reduction factor 0.000.000.000.00
Reduced specific remuneration 0.000.000.000.00
Subtotal 0.0014,325.690.0014,317.30
Generation toll (0.5 €/MWh) 0.00102.940.00102.88
Electricity production tax (7%) 0.001002.800.001002.21
Electricity selling 0.0013,219.950.0013,212.21
Maintenance 40,417.4841,662.6941,292.0942,536.47
Total3,160,316.062,855,316.972,847,740.012,836,887.152,829,309.97
Table A7. Value of the parameters for economic balance calculation [35].
Power Range1 MW < P < 10 MW0.5 MW < P < 1MW
Rinv76,163 €/MWe99,142 €/MWe
Nhmin2760 h2260 h
Uf840 h680 h
Ro36.08 €/MWhe44.983 €/MWhe

References

  1. United Nations. Paris Agreement. In Proceedings of the 21st Conference of the Parties, Paris, France, 30 November–13 December 2015; p. 21932. [Google Scholar]
  2. Mauree, D.; Naboni, E.; Coccolo, S.; Perera, A.T.D.; Nik, V.M.; Scartezzini, J.L. A review of assessment methods for the urban environment and its energy sustainability to guarantee climate adaptation of future cities. Renew. Sustain. Energy Rev. 2019, 112, 733–746. [Google Scholar] [CrossRef]
  3. Munoz, I.; Hernandez, P.; Perez-Iribarren, E.; Pedrero, J.; Arrizabalaga, E.; Hermoso, N. Methodology for integrated modelling and impact assessment of city energy system scenarios. Energy Strategy Rev. 2020, 32, 100553. [Google Scholar] [CrossRef]
  4. Gómez-Navarro, T.; Brazzini, T.; Alfonso-Solar, D.; Vargas-Salgado, C. Analysis of the potential for PV rooftop prosumer production: Technical, economic and environmental assessment for the city of Valencia (Spain). Renew. Energy 2021, 174, 372–381. [Google Scholar] [CrossRef]
  5. Walker, S.; Labeodan, T.; Boxem, G.; Maassen, W.; Zeiler, W. An assessment methodology of sustainable energy transition scenarios for realizing energy neutral neighborhoods. Appl. Energy 2018, 228, 2346–2360. [Google Scholar] [CrossRef]
  6. Cohen, M. A Systematic Review of Urban Sustainability Assessment Literature. Sustainability 2017, 9, 2048. [Google Scholar] [CrossRef] [Green Version]
  7. Bosch, P.; Jongeneel, S.; Rovers, V.; Neumann, H.M.; Airaksinen, M.; Huovila, A. CITYkeys indicators for smart city projects and smart cities. CITYkeys Rep. 2017. [Google Scholar] [CrossRef]
  8. Alfonso-Solar, D.; Vargas-Salgado, C.; Sánchez-Diaz, C.; Hurtado-Perez, E. Small-Scale Hybrid Photovoltaic-Biomass Systems Feasibility Analysis for Higher Education Buildings. Sustainability 2020, 21, 9300. [Google Scholar] [CrossRef]
  9. Pereira, J.S.; Ribeiro, J.B.; Mendes, R.; Vaz, G.C.; André, J.C. ORC based micro-cogeneration systems for residential application—A state of the art review and current challenges. Renew. Sustain. Energy Rev. 2018, 92, 728–743. [Google Scholar] [CrossRef]
  10. Ai, D.; Xu, K.; Zhang, H.; Cheng, T.; Wang, G. Simulation Research on a Cogeneration System of Low-Concentration Photovoltaic/Thermal Coupled with Air-Source Heat Pump. Energies 2022, 15, 1238. [Google Scholar] [CrossRef]
  11. Council of the European Union—European Green Pact. Available online: https://www.consilium.europa.eu/es/policies/green-deal/ (accessed on 15 October 2020).
  12. Hydrogen Roadmap—A Commitment to Renewable Hydrogen. 2020. Available online: https://energia.gob.es/es-es/Novedades/Documents/hoja_de_ruta_del_hidrogeno.pdf (accessed on 15 December 2020).
  13. Aki, H.; Yamamoto, S.; Kondoh, J.; Maeda, T.; Yamaguchi, H.; Murata, A.; Ishii, I. Fuel cells and energy networks of electricity, heat, and hydrogen in residential areas. Int. J. Hydrogen Energy 2006, 31, 967–980. [Google Scholar] [CrossRef]
  14. Cigolotti, V.; Genovese, M.; Fragiacomo, P. Comprehensive Review on Fuel Cell Technology for Stationary Applications as Sustainable and Efficient Poly-Generation Energy Systems. Energies 2021, 14, 4963. [Google Scholar] [CrossRef]
  15. Abdelkareem, M.A.; Elsaid, K.; Wilberforce, T.; Kamil, M.; Sayed, E.T.; Olabi, A. Environmental aspects of fuel cells: A review. Sci. Total Environ. 2021, 752, 141803. [Google Scholar] [CrossRef] [PubMed]
  16. Acevedo-Arenas, C.Y.; Correcher Salvador, A.; Sánchez-Diaz, C.; Ariza-Chacón, H.E.; Alfonso-Solar, D.; Vargas-Salgado, C.; Petit-Suarez, J.F. MPC for optimal dispatch of an AC-linked hybrid PV/wind/biomass/H2 system incorporating demand response. Energy Convers. Manag. 2019, 186, 241–257. [Google Scholar] [CrossRef]
  17. Kappis, K.; Papavasiliou, J.; Avgouropoulos, G. Methanol Reforming Processes for Fuel Cell Applications. Energies 2021, 14, 8442. [Google Scholar] [CrossRef]
  18. School of Industrial Organisation—Fuel Cells: Functional Analysis and Applications. 2014. Available online: https://static.eoi.es/savia/documents/pilas_de_combustible_aplicaciones.pdf (accessed on 17 December 2020).
  19. Ioannis Sarris, P.T.; Shuqin Song, N.V. A Three-Dimensional CFD Model of direct Ethanol Fuels Cells: Anode Flow Bed Analysis. Solid State Ion. 2006, 177, 2133–2138. [Google Scholar] [CrossRef]
  20. Karvelas, E.; Koubogiannis, D.; Hatziapostolou, A.; Sarris, I. The effect of anode bed geometry on the hydraulic behaviour of PEM fuel cells. Renew. Energy 2016, 93, 269–279. [Google Scholar] [CrossRef]
  21. RD 244/2019, of 5 April, Which Regulates the Administrative, Technical and Economic Conditions for the Self-Consumption of Electricity. Available online: https://www.boe.es/boe/dias/2019/04/06/pdfs/BOE-A-2019-5089.pdf (accessed on 15 January 2021).
  22. Statistical Office of Valencia—Data on L’Illa Perduda. 2020. Available online: https://www.valencia.es/estadistica/inf_dbta/2021/Districte_13_Barri_1.pdf (accessed on 15 January 2021).
  23. Masip, X.; Prades-Gil, C.; Navarro-Peris, E.; Corberán, J.M. Evaluation of the potential energy savings of a centralized booster heat pump in front of conventional alternatives. Smart Energy 2021, 4, 100056. [Google Scholar] [CrossRef]
  24. Prades-Gil, C.; Viana-Fons, J.; Masip, X.; Cazorla-Marín, A.; Goméz-Navarro, T. Heating and cooling demand assessment with European standards, degree days approach and GIS-based tools. Climate change impact on demand and retrofitting benefits in Mediterranean case study. In Book of Abstracts of the 16th SDEWES Conference; Faculty of Mechanical Engineering and Naval Architecture: Zagreb, Croatia, 2021. [Google Scholar]
  25. Ligardo-Herrera, I.; Quintana-Gallardo, A.; Stascheit, C.W.; Gil, C.P.; Sanchis, X.M.; Gómez-Navarro, T. Development of a tool to estimate carbon emissions in districts and dwellings. Open access planner for citizens and policymakers. In Book of Abstracts of the 16th SDEWES Conference; Faculty of Mechanical Engineering and Naval Architecture: Zagreb, Croatia, 2021. [Google Scholar]
  26. Classification of Buildings According to the Tábula Project. Available online: https://webtool.building-typology.eu/#bm (accessed on 10 January 2021).
  27. IDEA—SECH-SPAHOUSEC Project—Analysis of Energy Consumption in the Residential Sector in Spain. 2021. Available online: https://www.idae.es/uploads/documentos/documentos_Informe_SPAHOUSEC_ACC_f68291a3.pdf (accessed on 15 December 2020).
  28. Average Temperature Data for the City of Valencia. Available online: https://es.climate-data.org/europe/espana/comunidad-valenciana/valencia-845/ (accessed on 20 January 2021).
  29. Basic Health Document. 2019. Available online: https://www.codigotecnico.org/pdf/Documentos/HS/DBHS.pdf (accessed on 15 December 2020).
  30. Mains Water Temperature in Capitals of Spanish Provinces. Available online: https://suelosolar.com/guia/acs-solar/temperatura-agua-ciudades (accessed on 1 February 2021).
  31. Observatorio Astronómico Nacional—Instituto Geográfico Nacional: Sunrise and Sunset. 2020. Available online: https://cdn.mitma.gob.es/portal-web-drupal/salidapuestasol/2020/Valencia-2020.txt (accessed on 15 February 2021).
  32. National Statistics Institute—Employment and Time Survey 2009/2010. 2011. Available online: https://www.ine.es/en/prensa/np669_en.pdf (accessed on 1 March 2021).
  33. Centro de Investigaciones Sociológicas (CIS)—What Time Do Spaniards Go To Bed and Wake Up. 2021. Available online: http://datos.cis.es/pdf/Es3170mar_a.pdf (accessed on 1 March 2021).
  34. Photovoltaic Geographical Information System (PVGIS). Available online: https://re.jrc.ec.europa.eu/pvg_tools/es/#PVP (accessed on 15 March 2021).
  35. Office of Environment and Heritage NSW Cogeneration Feasibility Guide. 2014. Available online: http://www.environment.nsw.gov.au/ (accessed on 21 April 2021).
  36. Larminie, J.; Dicks, A. Fuel Cell System Explained; John Wiley and Sons: Hoboken, NJ, USA, 2006. [Google Scholar]
  37. Doosan PureCell 400 PAFC Fuel Cell Catalog. Available online: http://www.doosanfuelcellpower.com/download/pdf/catalog/pafc-400kw_en.pdf (accessed on 30 April 2021).
  38. U.S Environmental Protection Agency (EPA) Combined Heat and Power Partnership. 2015. Available online: https://www.epa.gov/sites/default/files/2015-07/documents/catalog_of_chp_technologies_section_6._technology_characterization_-_fuel_cells.pdf (accessed on 16 May 2021).
  39. U.S Department of Energy—Energy Efficiency and Renewable Energy: Combined Heat and Power Technology Fact Sheet Series. 2016. Available online: https://www.energy.gov/sites/default/files/2016/09/f33/CHP-Fuel%20Cell.pdf (accessed on 20 May 2021).
  40. Noriko Hikosaka, B. Fuel Cells Current Technology Challenges and Future Research Needs; Newnes: Oxford, UK, 2013. [Google Scholar]
  41. Sistema de Información del Operador del Sistema (SIOS) de la Red Eléctrica de España—Purchase Price and Sale Price of Electricity. Available online: https://www.esios.ree.es/es/analisis/1739?vis=1&start_date=01-01-2020T00%3A00&end_date=31-12-2020T23%3A00&compare_start_date=31-12-2019T00%3A00&groupby=hour (accessed on 10 August 2021).
  42. Proposal for an Order Updating the Remuneration Parameters of the Standard Facilities Applicable to Certain Electricity Production Facilities from Renewable Energy Sources, Cogeneration and Waste, for the Purposes of Their Application to the Regulatory Period Starting on 1 January 2020. 2019. Available online: https://energia.gob.es/es-es/Participacion/Documents/propuesta-orden-parametros-1semestre-2019/propuesta-orden-RO-2019-1semestre.pdf (accessed on 10 August 2021).
  43. Price of Natural Gas in Spain. Available online: https://preciogas.com/faq/precio-kwh (accessed on 11 August 2021).
  44. Electronic Headquarters of the Cadastre. Available online: https://www1.sedecatastro.gob.es/Cartografia/mapa.aspx?RC1=8326410&RC2=YJ2782E&RC3=%20&RC4=&esBice=&RCBice1=&RCBice2=&DenoBice=&pest=rc&final=&RCComplete=8326410YJ27%2082E&from=OVCBsearch&roomType=new&ZV=NO&ZR=NO&cartography=True&GoodsList=T%20RUE (accessed on 20 August 2021).
  45. Iberdrola Group—Connection of the Cogeneration Plant to the Electricity Grid. Available online: https://www.i-de.es/conexion-red-electrica/autoconsumo-electrico-produccion-energia/autoconsumidores#acor_documentacion_tecnica_acordeon_2 (accessed on 21 August 2021).
  46. IDEA—Basic Guide to District Heating and Cooling Networks. 2021. Available online: https://www.idae.es/uploads/documentos/documentos_20110502_Guia_Basica_Redes_de_Calor_y_de_Frio_EN_5e18b14a.pdf (accessed on 25 August 2021).
  47. Hawkes, A.D.; Leach, M.A. Cost-effective operating strategy for residential micro-combined heat and power. Energy 2007, 32, 711–723. [Google Scholar] [CrossRef]
  48. Romdhane, J.; Louahlia, H.; Marion, M. Dynamic modeling of an eco-neighborhood integrated micro-CHP based on PEMFC: Performance and economic analyses. Energy Build. 2018, 166, 93–108. [Google Scholar] [CrossRef]
  49. Napoli, R.; Gandiglio, M.; Lanzini, A.; Santarelli, M. Technoeconomic analysis of PEMFC and SOFC micro-CHP fuel cell systems for the residential sector. Energy Build. 2015, 103, 131–146. [Google Scholar] [CrossRef]
Figure 1. Position of L’Illa Perduda in Valencia. Map taken from Google Maps.
Energies 15 04502 g001
Figure 2. Hourly thermal demand for heating and DHW for the month of February. Note: vertical axis shows average energy demand in MWh, while horizontal axis the hours of a day.
Energies 15 04502 g002
Figure 3. Hourly electricity demand for the month of August. Note: vertical axis shows average energy demand in MWh, while horizontal axis the hours of a day.
Energies 15 04502 g003
Figure 4. Monotonic annual demand curve. Graphical representation of demand during the year. (a) Annual monotonic thermal demand curve. (b) Annual monotonic electricity demand curve.
Energies 15 04502 g004
Figure 5. PAFC performance at partial loads.
Energies 15 04502 g005
Figure 6. Monotonic thermal demand curve: graphical representation of demand in months with heating demand.
Energies 15 04502 g006
Figure 7. Monotonic electricity demand curve: graphical representation of demand in months with cooling demand.
Energies 15 04502 g007
Figure 8. Fuel cell distribution areas covering the demand.
Energies 15 04502 g008
Figure 9. Alternative: possible fuel cell distribution.
Energies 15 04502 g009
Figure 10. Location of fuel cell in the case of centralized production.
Energies 15 04502 g010
Table 1. Classification of buildings and dwellings of L’Illa Perduda—Tabula project.
Type of BuildingNo. of BuildingsNo. of Households
AB-G41212927
AB-G5251208
MFH-G4459
Table 2. Energy demands per unit area—Tabula project.
Demand (kWh/m2 Year)AB-G4AB-G5MFH-G4
Heating6716.744.3
Cooling4.810.716.5
DHW12.512.512.5
Table 3. Energy demand per dwelling—SECH-SPAHOUSEC project.
Type of DemandEnergy (%)
Heating40.94
DHW19.59
Cooling1.13
Kitchen7.11
Lighting5.67
Household appliances25.56
Table 4. Annual energy demands.
Type of DemandDemand (GWh/Year)
Heating21.7
Cooling2.95
DHW5.37
Kitchen1.83
Lighting1.46
Household appliances6.58
Table 5. Monthly energy demands calculated from annual energy demands (MWh).
MonthHeatingCoolingDHWLightingHousehold
Appliances
Kitchen
January420860.00503.1175.9558.9155.5
February3827.30.00445.3140504.8140.4
March3575.10.00483129.1558.91555
April2930.30.00457.798.8540.8150.5
May0.00413.8452.879.3558.9155.5
June0.00479.6418.765.2540.8150.5
July0.00559.3412.572.7558.9155.5
August0.00566.1402.592.7558.9155.5
September0.00501.6409115.5540.8150.5
October0.00429.7442.7145.3558.9155.5
November3153.30.00457.7164.0540.8150.5
December40070.00493181.7558.9155.5
Table 6. PAFC Doosan PureCell 400 Characteristics.
FuelNatural Gas
Electrical power (kW)440
Heating capacity (kW)454
Natural gas consumption (kW)1104
Electrical efficiency (%)40
Thermal efficiency (%)41
Overall efficiency81
Dimensions (m)8.3 × 2.5 × 3
Table 7. Characteristics of each alternative for a cogeneration system with a thermal power of 4 MW of capacity.
Alternatives 1234
SystemFuel cell configurationCentralizedCentralizedDistributedDistributed
From May to OctoberDemand trackingThermalElectricityThermalElectricity
No. Of fuel Cells ON1409
Rest of the yearDemand trackingThermalThermalThermalThermal
No. Of fuel Cells ON9999
Table 8. Summary of the main differences of the 1 MW electricity CHP systems developed for further comparison.
Alternatives 5678
SystemFuel cell configurationCentralizedCentralizedDistributedDistributed
From May to OctoberDemand trackingElectricityElectricityElectricityElectricity
No. Of fuel Cells ON2222
Rest of the yearDemand trackingElectricityThermalElectricityThermal
No. Of fuel Cells ON2222
Table 9. Comparison of alternatives of the CHP system with 4 MW thermal capacity.
Alternative1234
Thermal energy balance
Useful heat (MWh/year)15,959.316,922.7513,948.416,486.6
Heat dissipated (MWh/year)03958.305458.25
Thermal demand coverage (%)58.962.551.560.3
Balance of electrical energy
Electricity demand coverage (%)50.988.139.199.5
Electricity self-consumption (%)42.255.837.159.9
Primary energy savings
PES (%)21.816.521.714.8
Economic balance
Investment (€)15,186,60015,186,60015,186,60015,186,600
Savings (€/year)785,423.9816,036.2661,055.4767,845.7
Simple pay-back time (years)19.318.62319.8
Table 10. Comparison of alternatives of the 1 MW of electrical power cogeneration system.
Alternative5678
Thermal energy balance
Useful heat (MWh/year)5933.56145.95928.26140.6
Heat dissipated (MWh/year)1212.81152.611202.81142.6
Thermal demand coverage (%)21.922.721.922.7
Balance of electrical energy
Electricity demand coverage (%)53.553.654.754.7
Electricity self-consumption (%)10097.110097.2
Primary energy savings
PES (%)17.3618.1918.7319.51
Economic balance
Investment (€)3,374,8003,374,8003,374,8003,374,800
Savings (€/year)304,999.1312,576.1323,428.9331,006.1
Pay-back time (years)11.110.810.410.2
Table 11. Annual thermal energy balance for the chosen alternative (GWh).
Current SituationCogeneration System
Heat generated by boilers27.0810.16
Heat generated PAFC 20.88
Heat dissipated 3.96
Total heat generated27.0831.04
Boiler fuel consumption33.8512.7
PAFC fuel consumption 50.93
Total fuel consumption33.8563.63
Increase in fuel consumption 29.78
Useful heat 16.92
Thermal demand coverage (%) 62
Table 12. Annual electricity energy balance for the chosen alternative (GWh).
Current SituationCogeneration System
Imported electricity12.821.52
Avoided electricity consumption 11.3
Exported electricity 8.94
Electricity generated PAFC 20.24
Percentage of self-consumption (%) 55.83
Electricity demand coverage (%) 88.12
Total primary energy avoided (including thermal) 58.14 (*) − 29.78 = 28.36
(*) Datum calculated on the energy balances by [39].
Table 13. Annual economic balance for the chosen alternative (M€).
Current SituationCogeneration System
Fuel purchase (NG)1.623.04
Purchase electricity1.540.18
Electricity for sale0.001.00
Maintenance0.000.12
Total3.162.34
Table 14. Summary of economic result for the chosen alternative.
Current Situation
Investment (M€)15.18
Savings (M€/year)0.82
Payback time (years)18.6
Publisher’s Note: MDPI stays neutral with regard to jurisdictional claims in published maps and institutional affiliations.

