
Waste Heat Driven Multi-Ejector Cooling Systems: Optimization of Design at Partial Load; Seasonal Performance and Cost Evaluation


Abstract
:1. Introduction
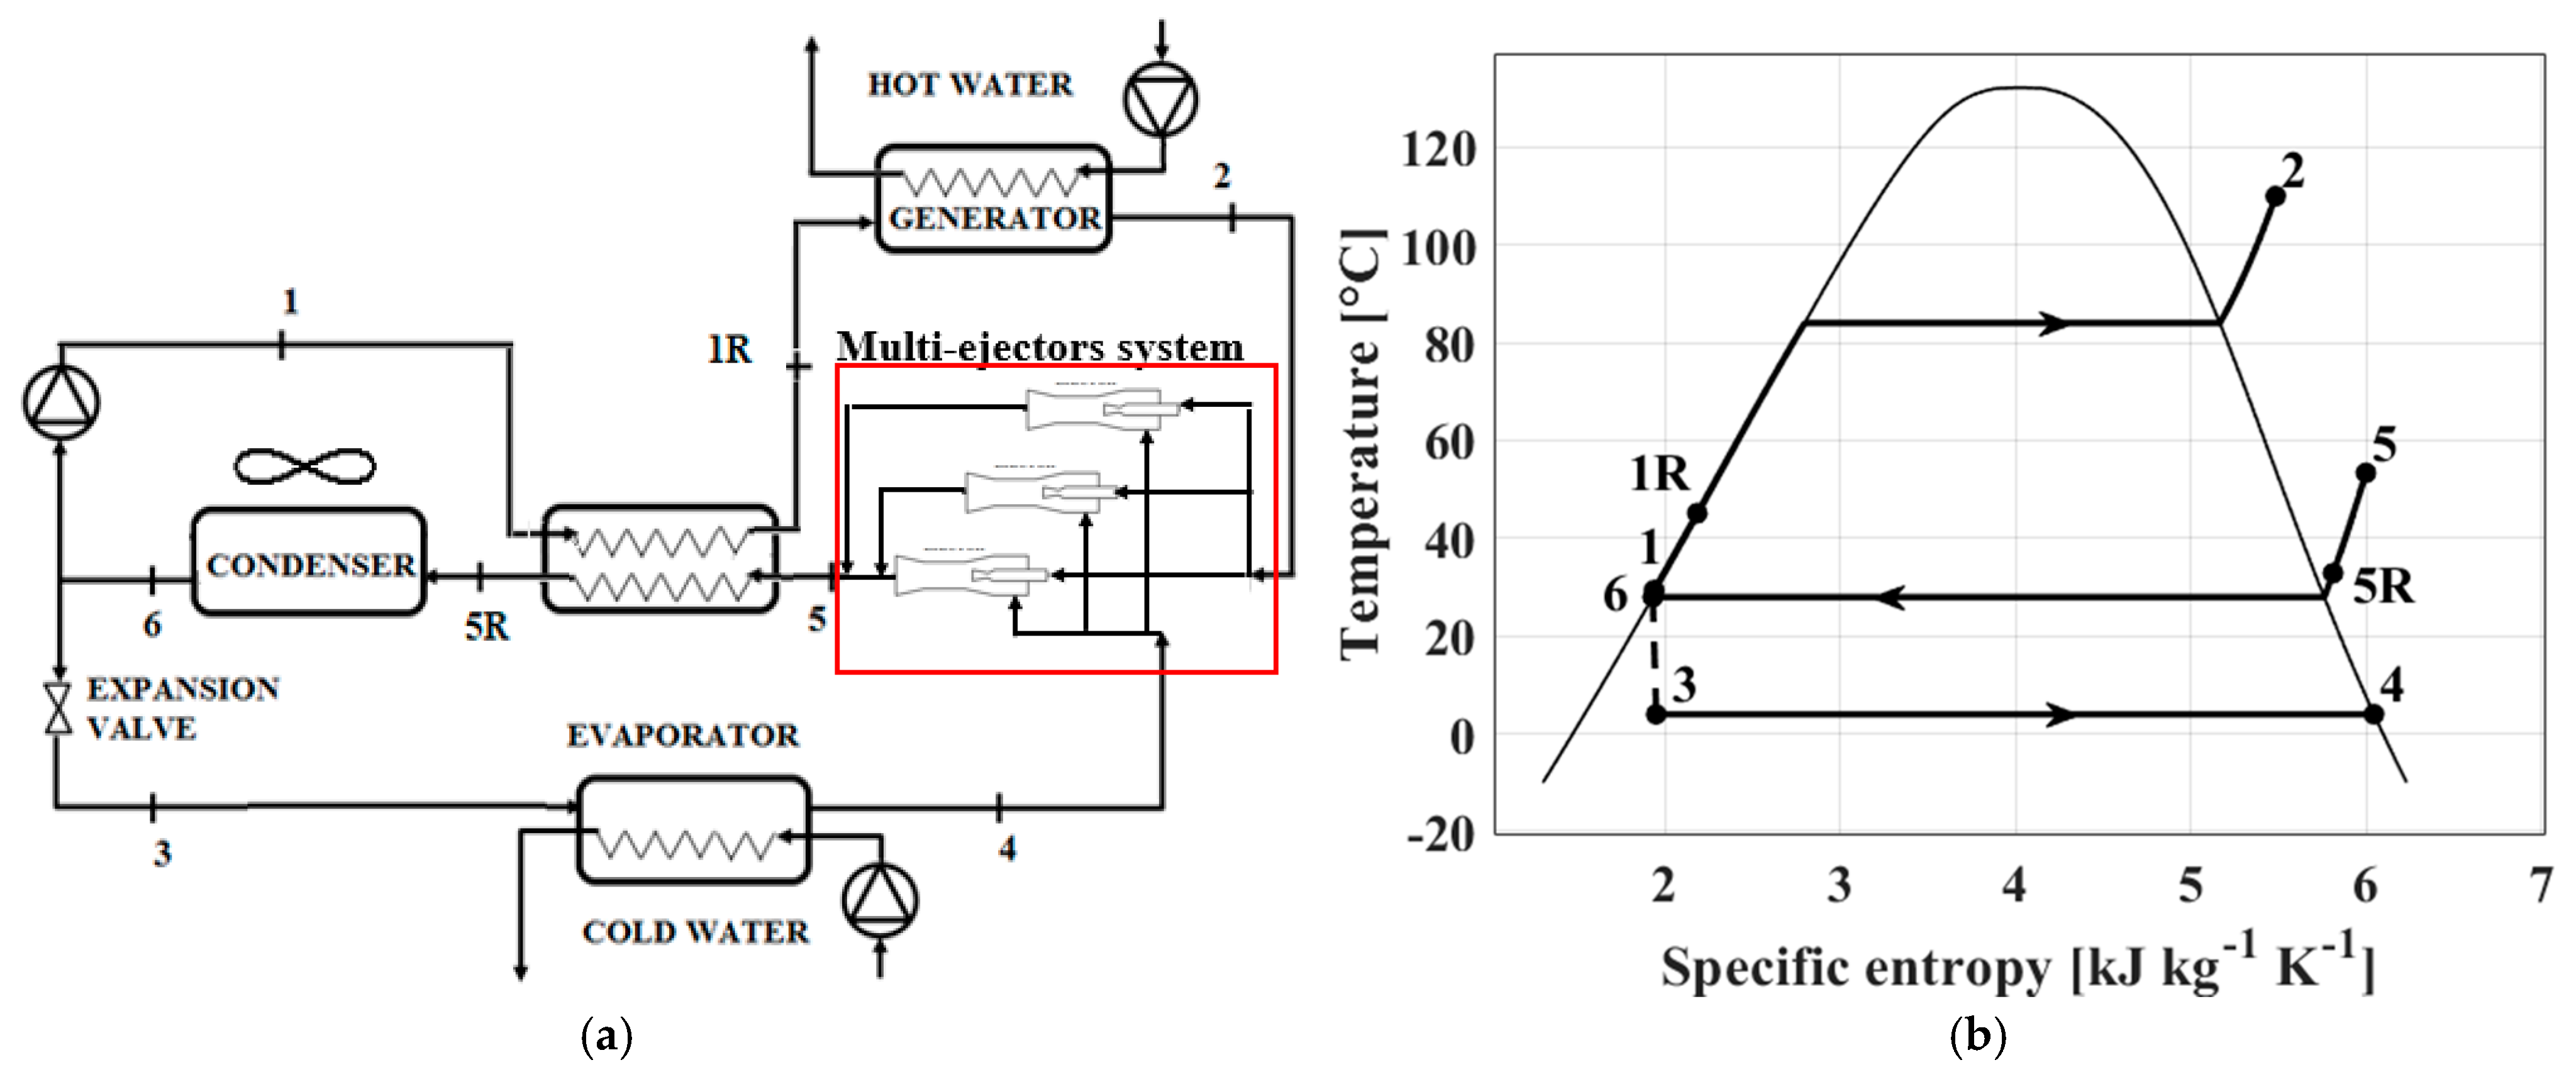
2. Description of the Thermodynamic Hybrid Ejector Cycle
3. System Modeling
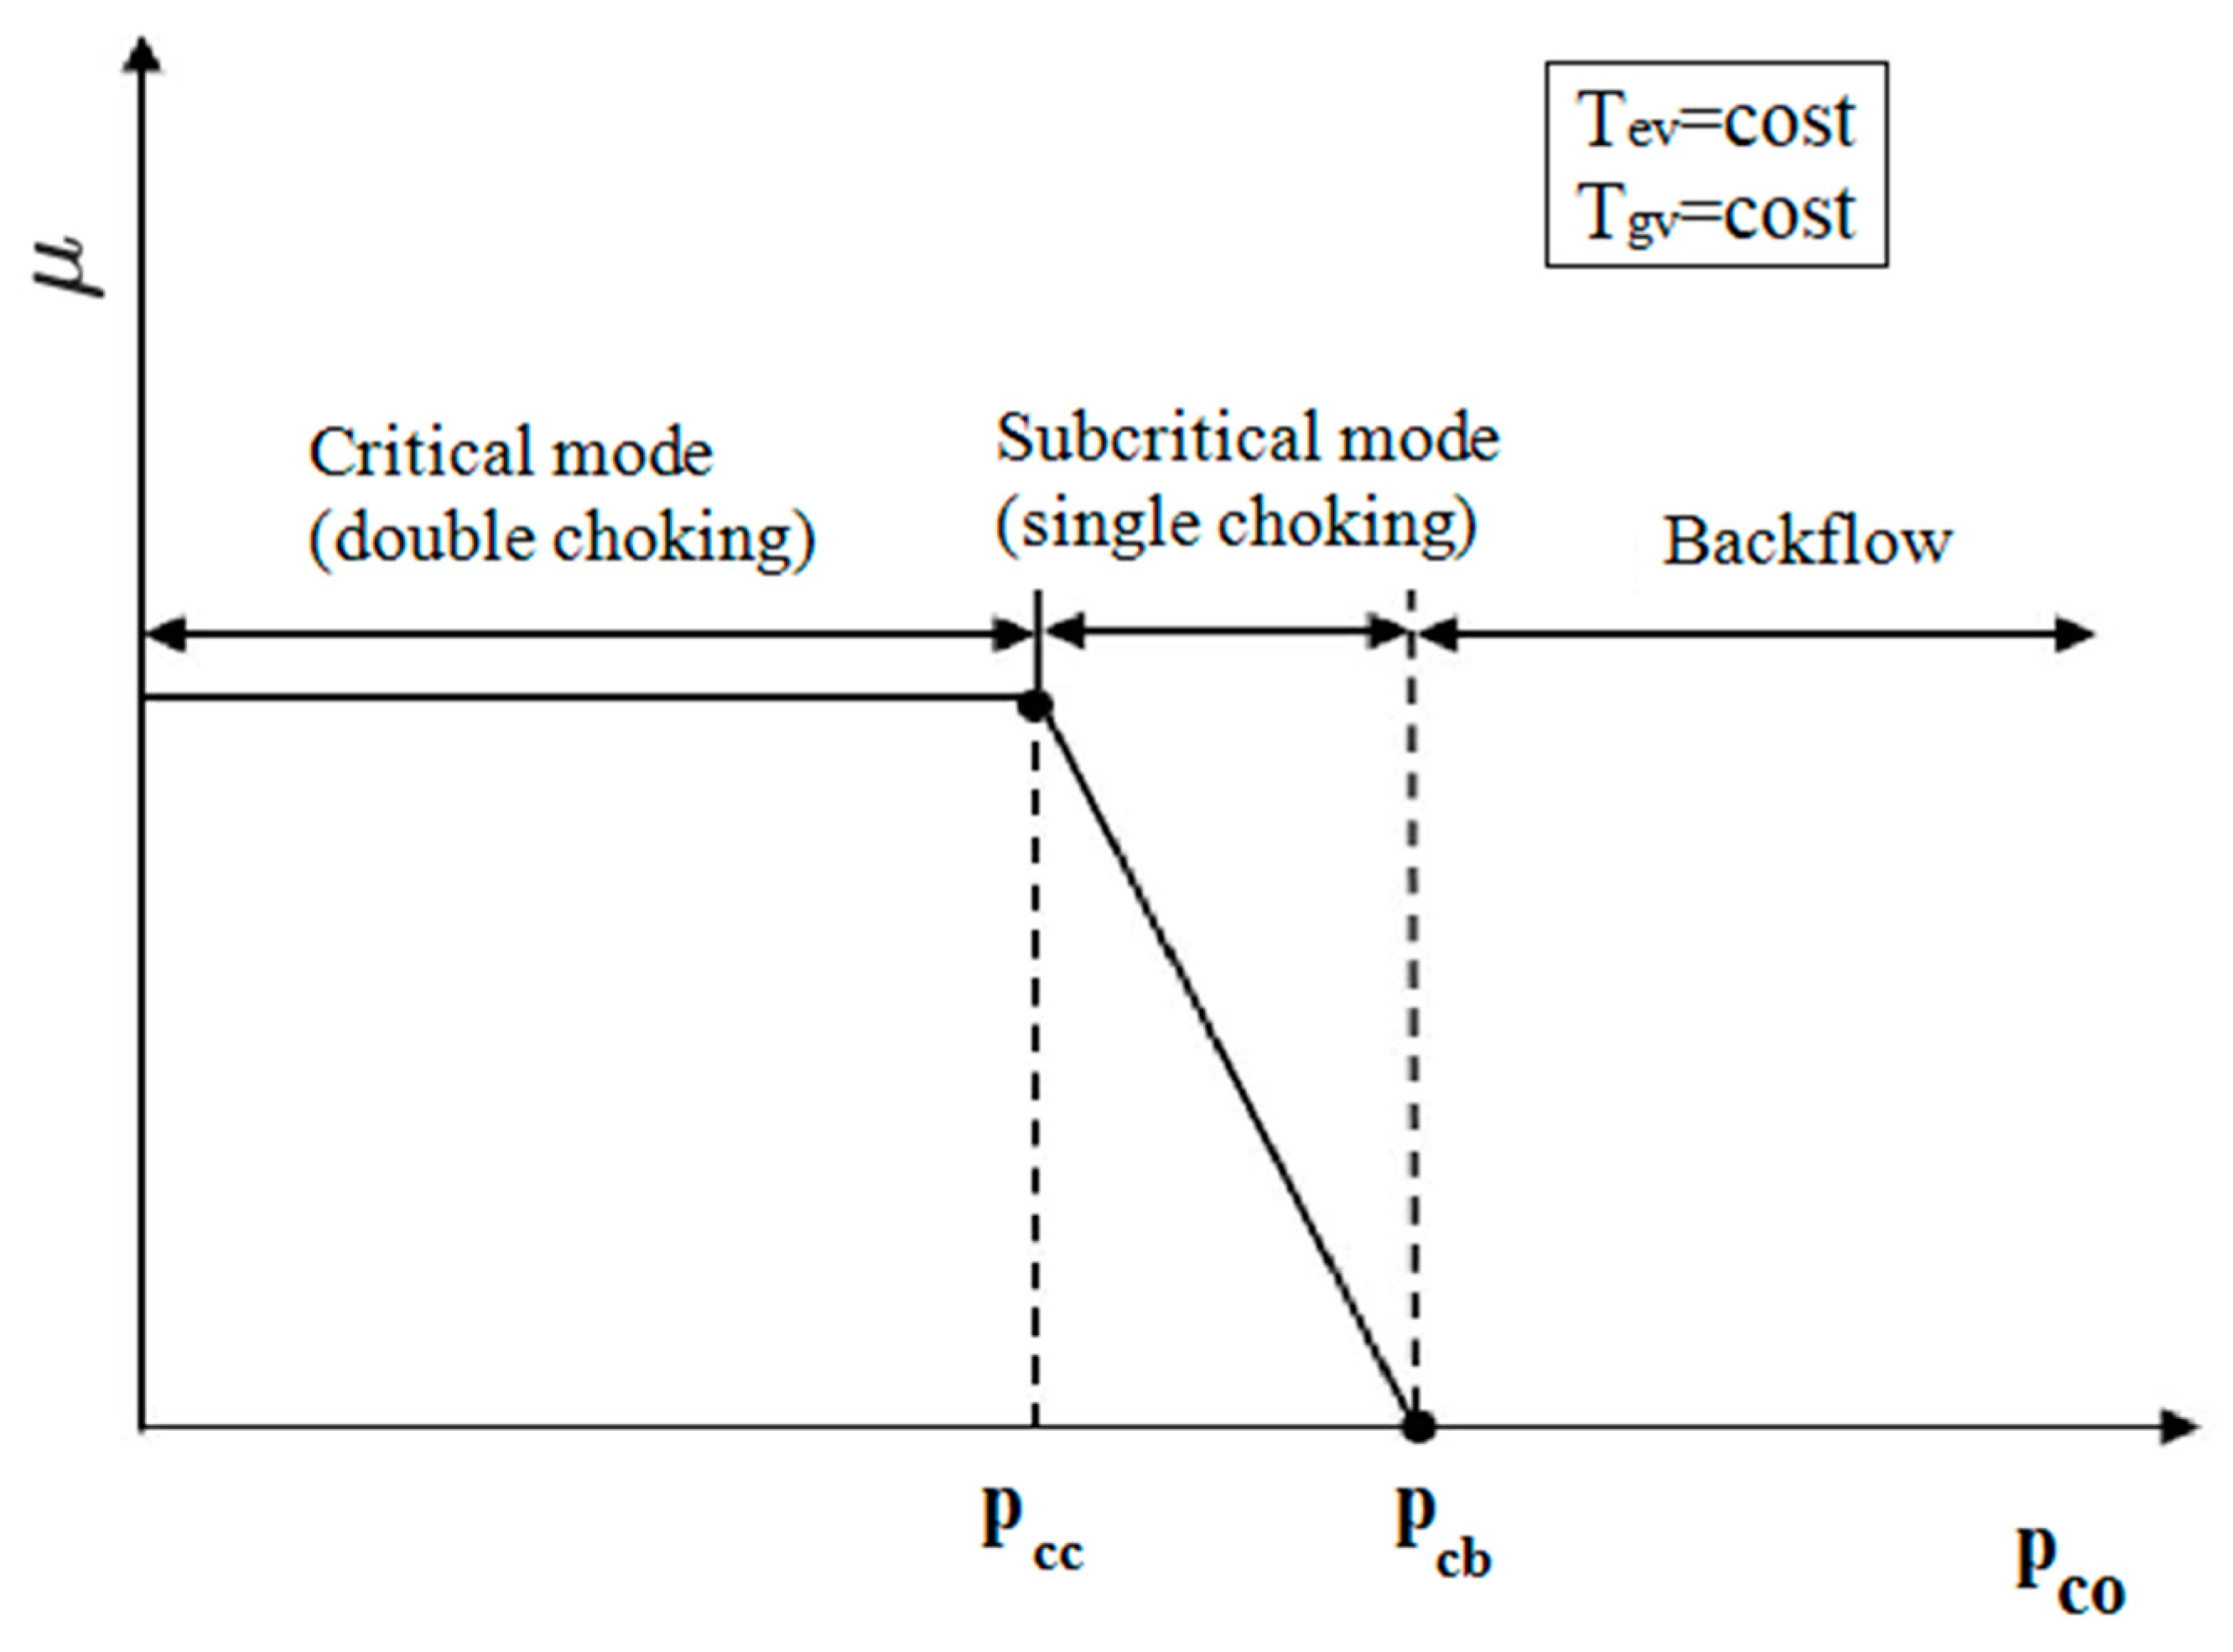
3.1. Ejector Model
3.2. Heat Exchanger Surface Evaluation
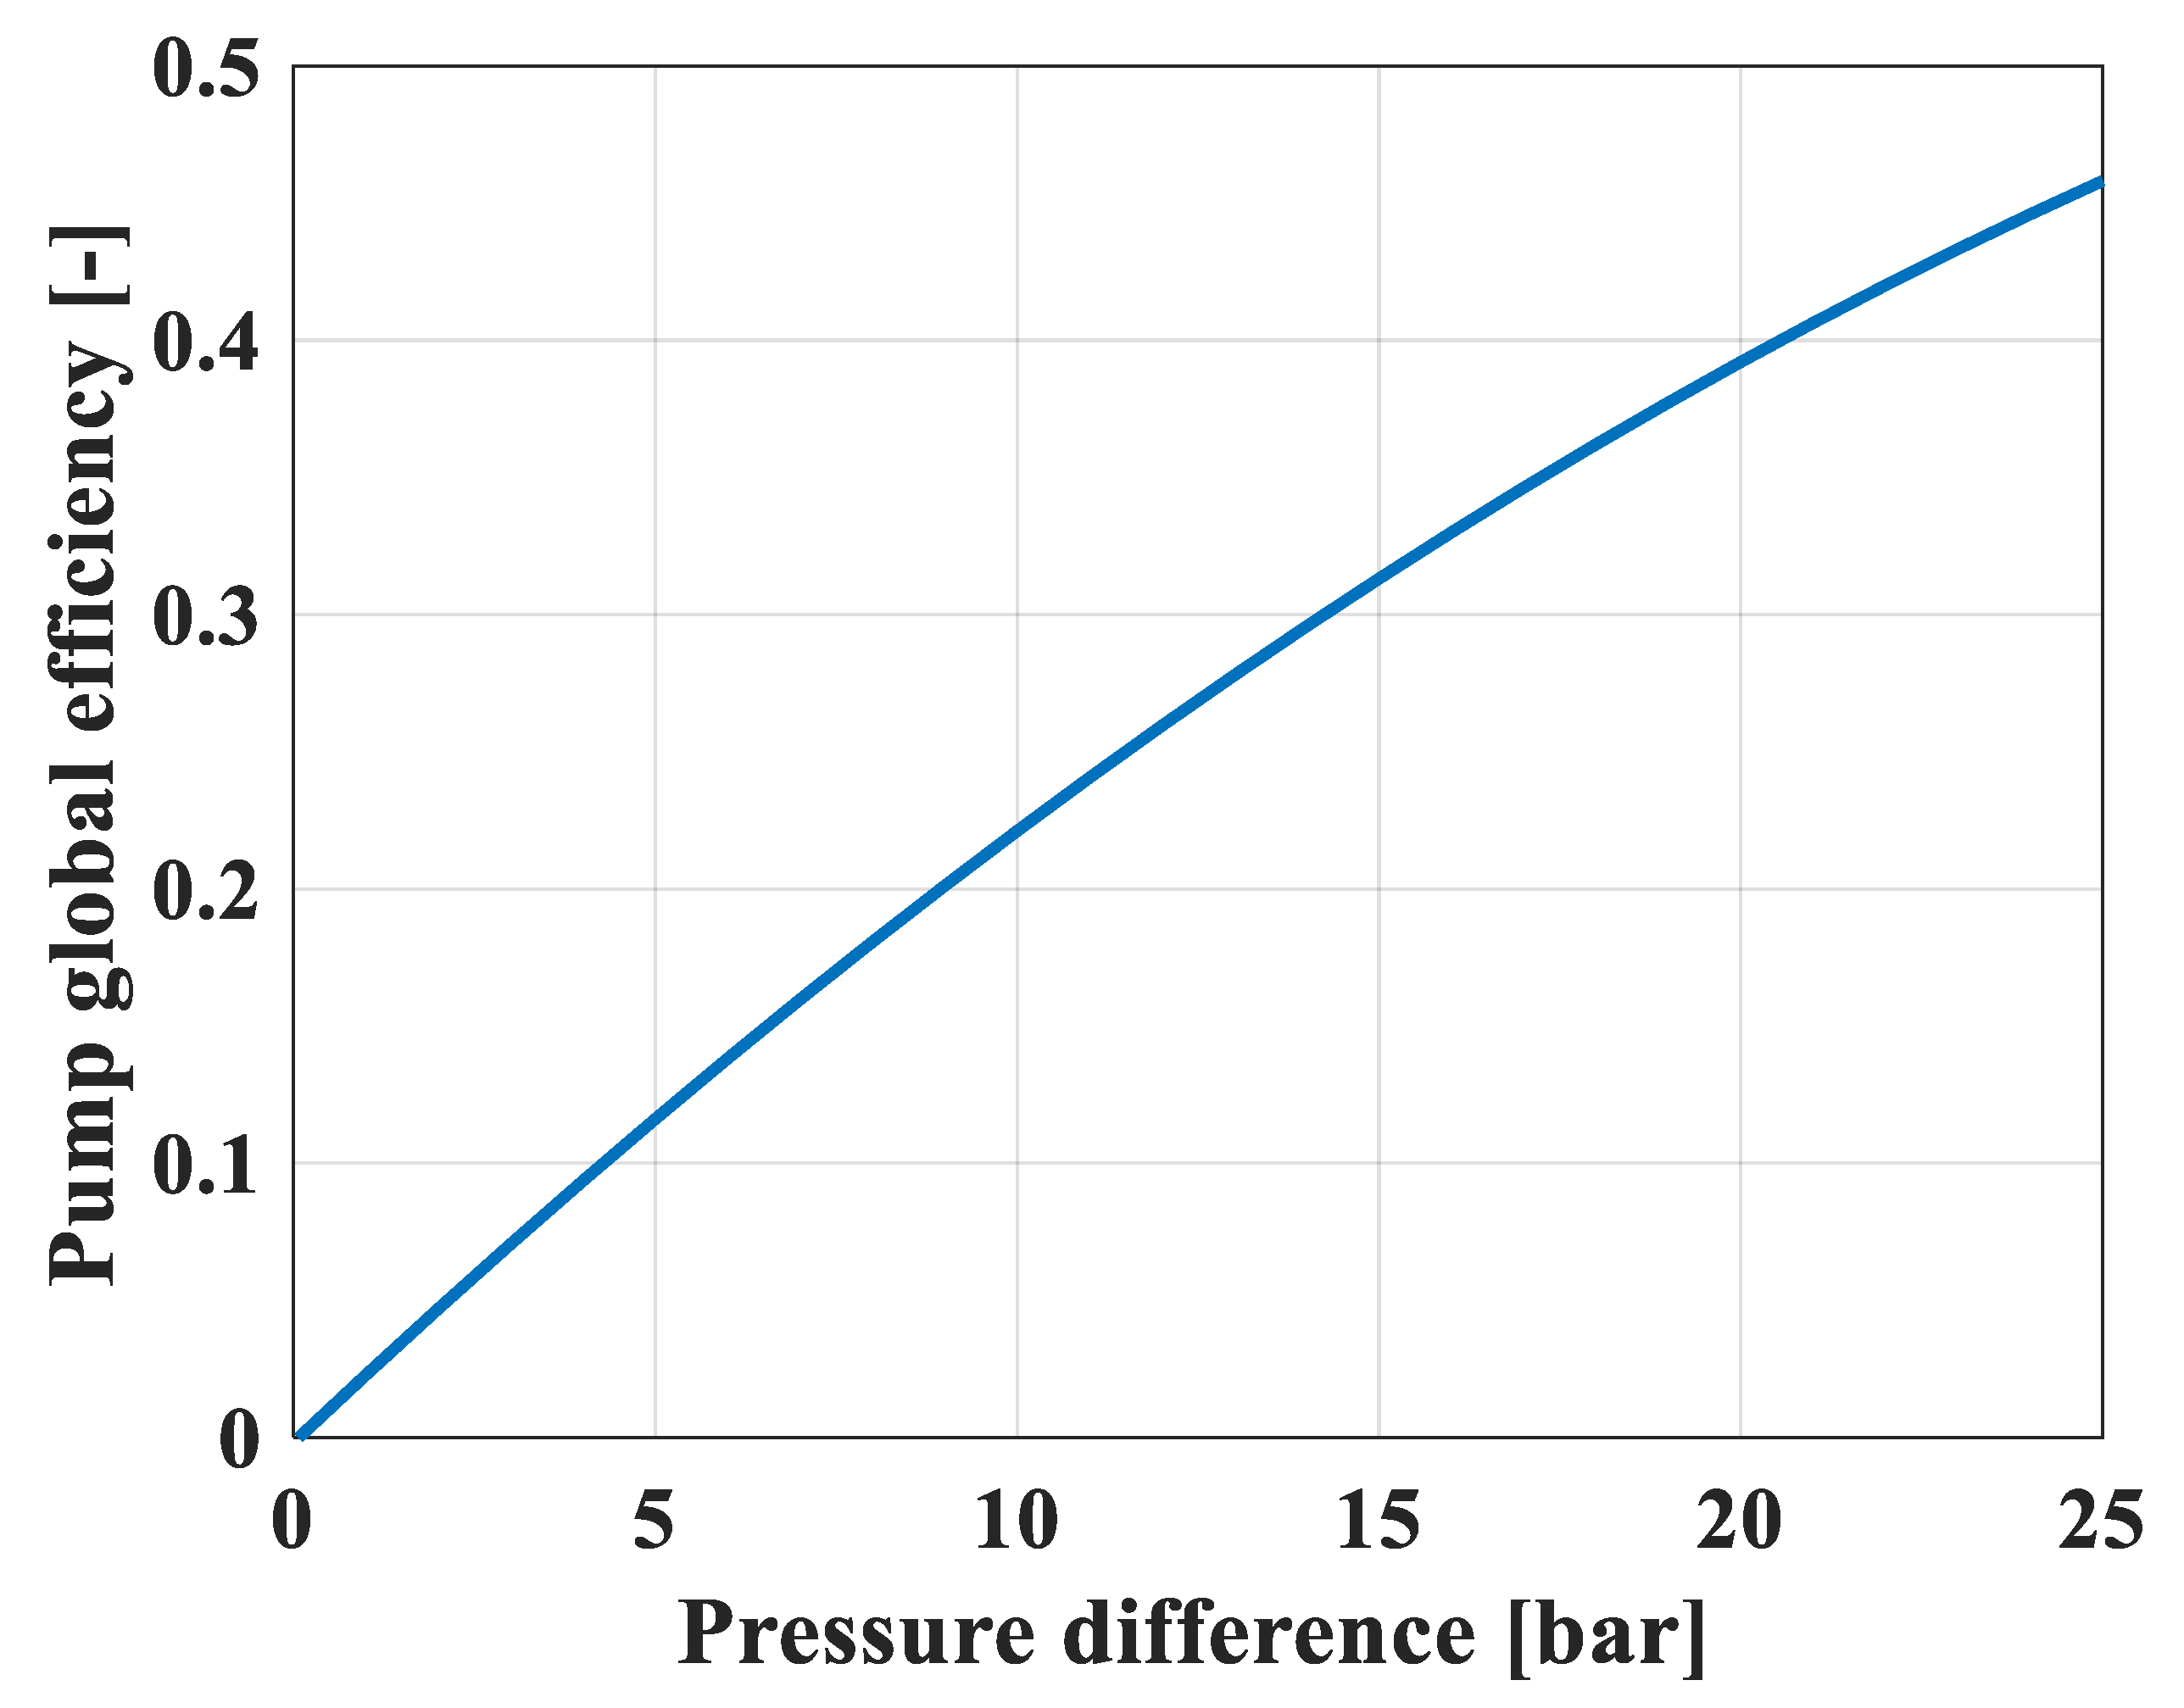
3.3. Other Components
3.4. Working Fluids
4. Component Sizing
4.1. Algorithm
- The thermodynamic and geometric parameters are fixed as input for the model.
- The working fluid temperatures at the inlet (z = 1) of generator, condenser and evaporator are set equal to the temperature values in points 2, 5 and 4, respectively.
- Proper heat transfer prediction methods [11] and Equations (8) and (9) are used to calculate the heat transfer coefficient U for each elementary volume.
- The elementary heat power is obtained from Equation (7).
- The specific enthalpy (and temperature) of the following (z + 1) integration step are calculated with energy balances from Equations (10) and (11).
- By using the thermodynamic properties evaluated in the previous step, the procedure (from step 3 to 5) is reiterated until the overall heat exchanger surface is able to handle the required heat power.
4.2. Cost Functions
4.3. Operating Conditions and Weather Data
4.4. Results
5. Seasonal Performance
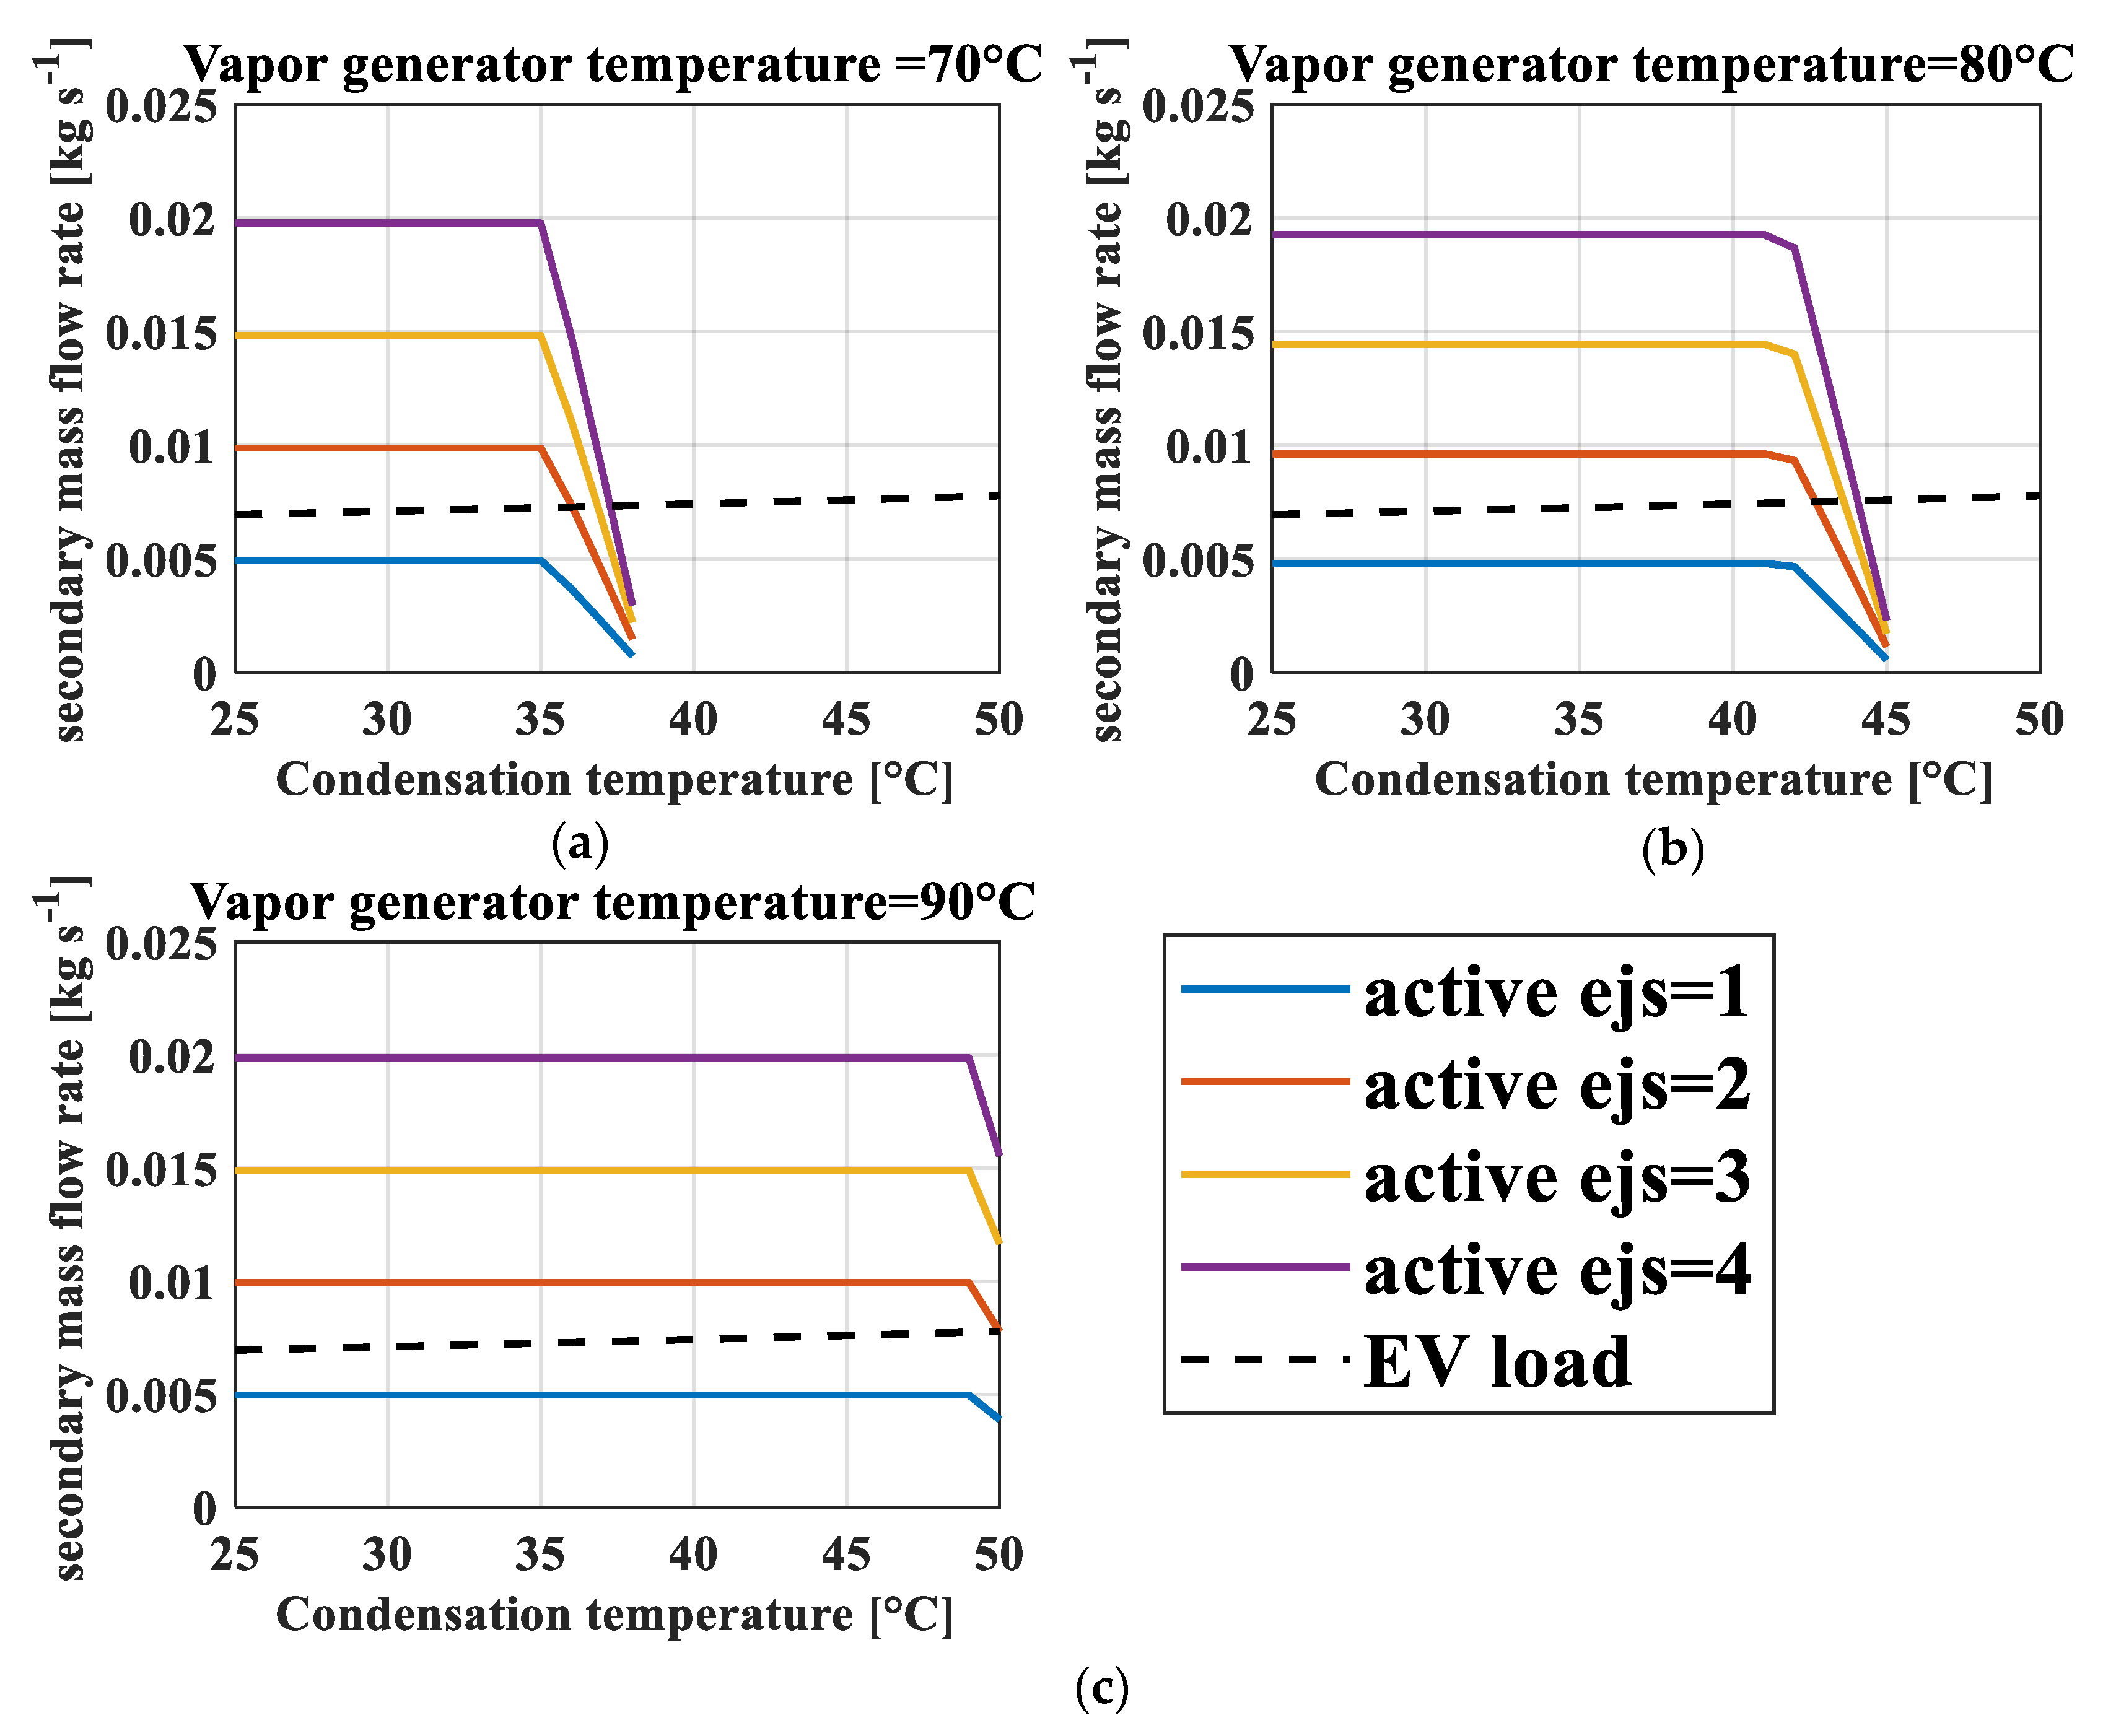
5.1. Multi-Ejector System: Configurations and Control Strategy
5.2. Algorithm
- The multi-ejector configuration, the working fluid, secondary fluid inlet/outlet temperatures and heat exchanger geometry are fixed as inputs for the algorithm;
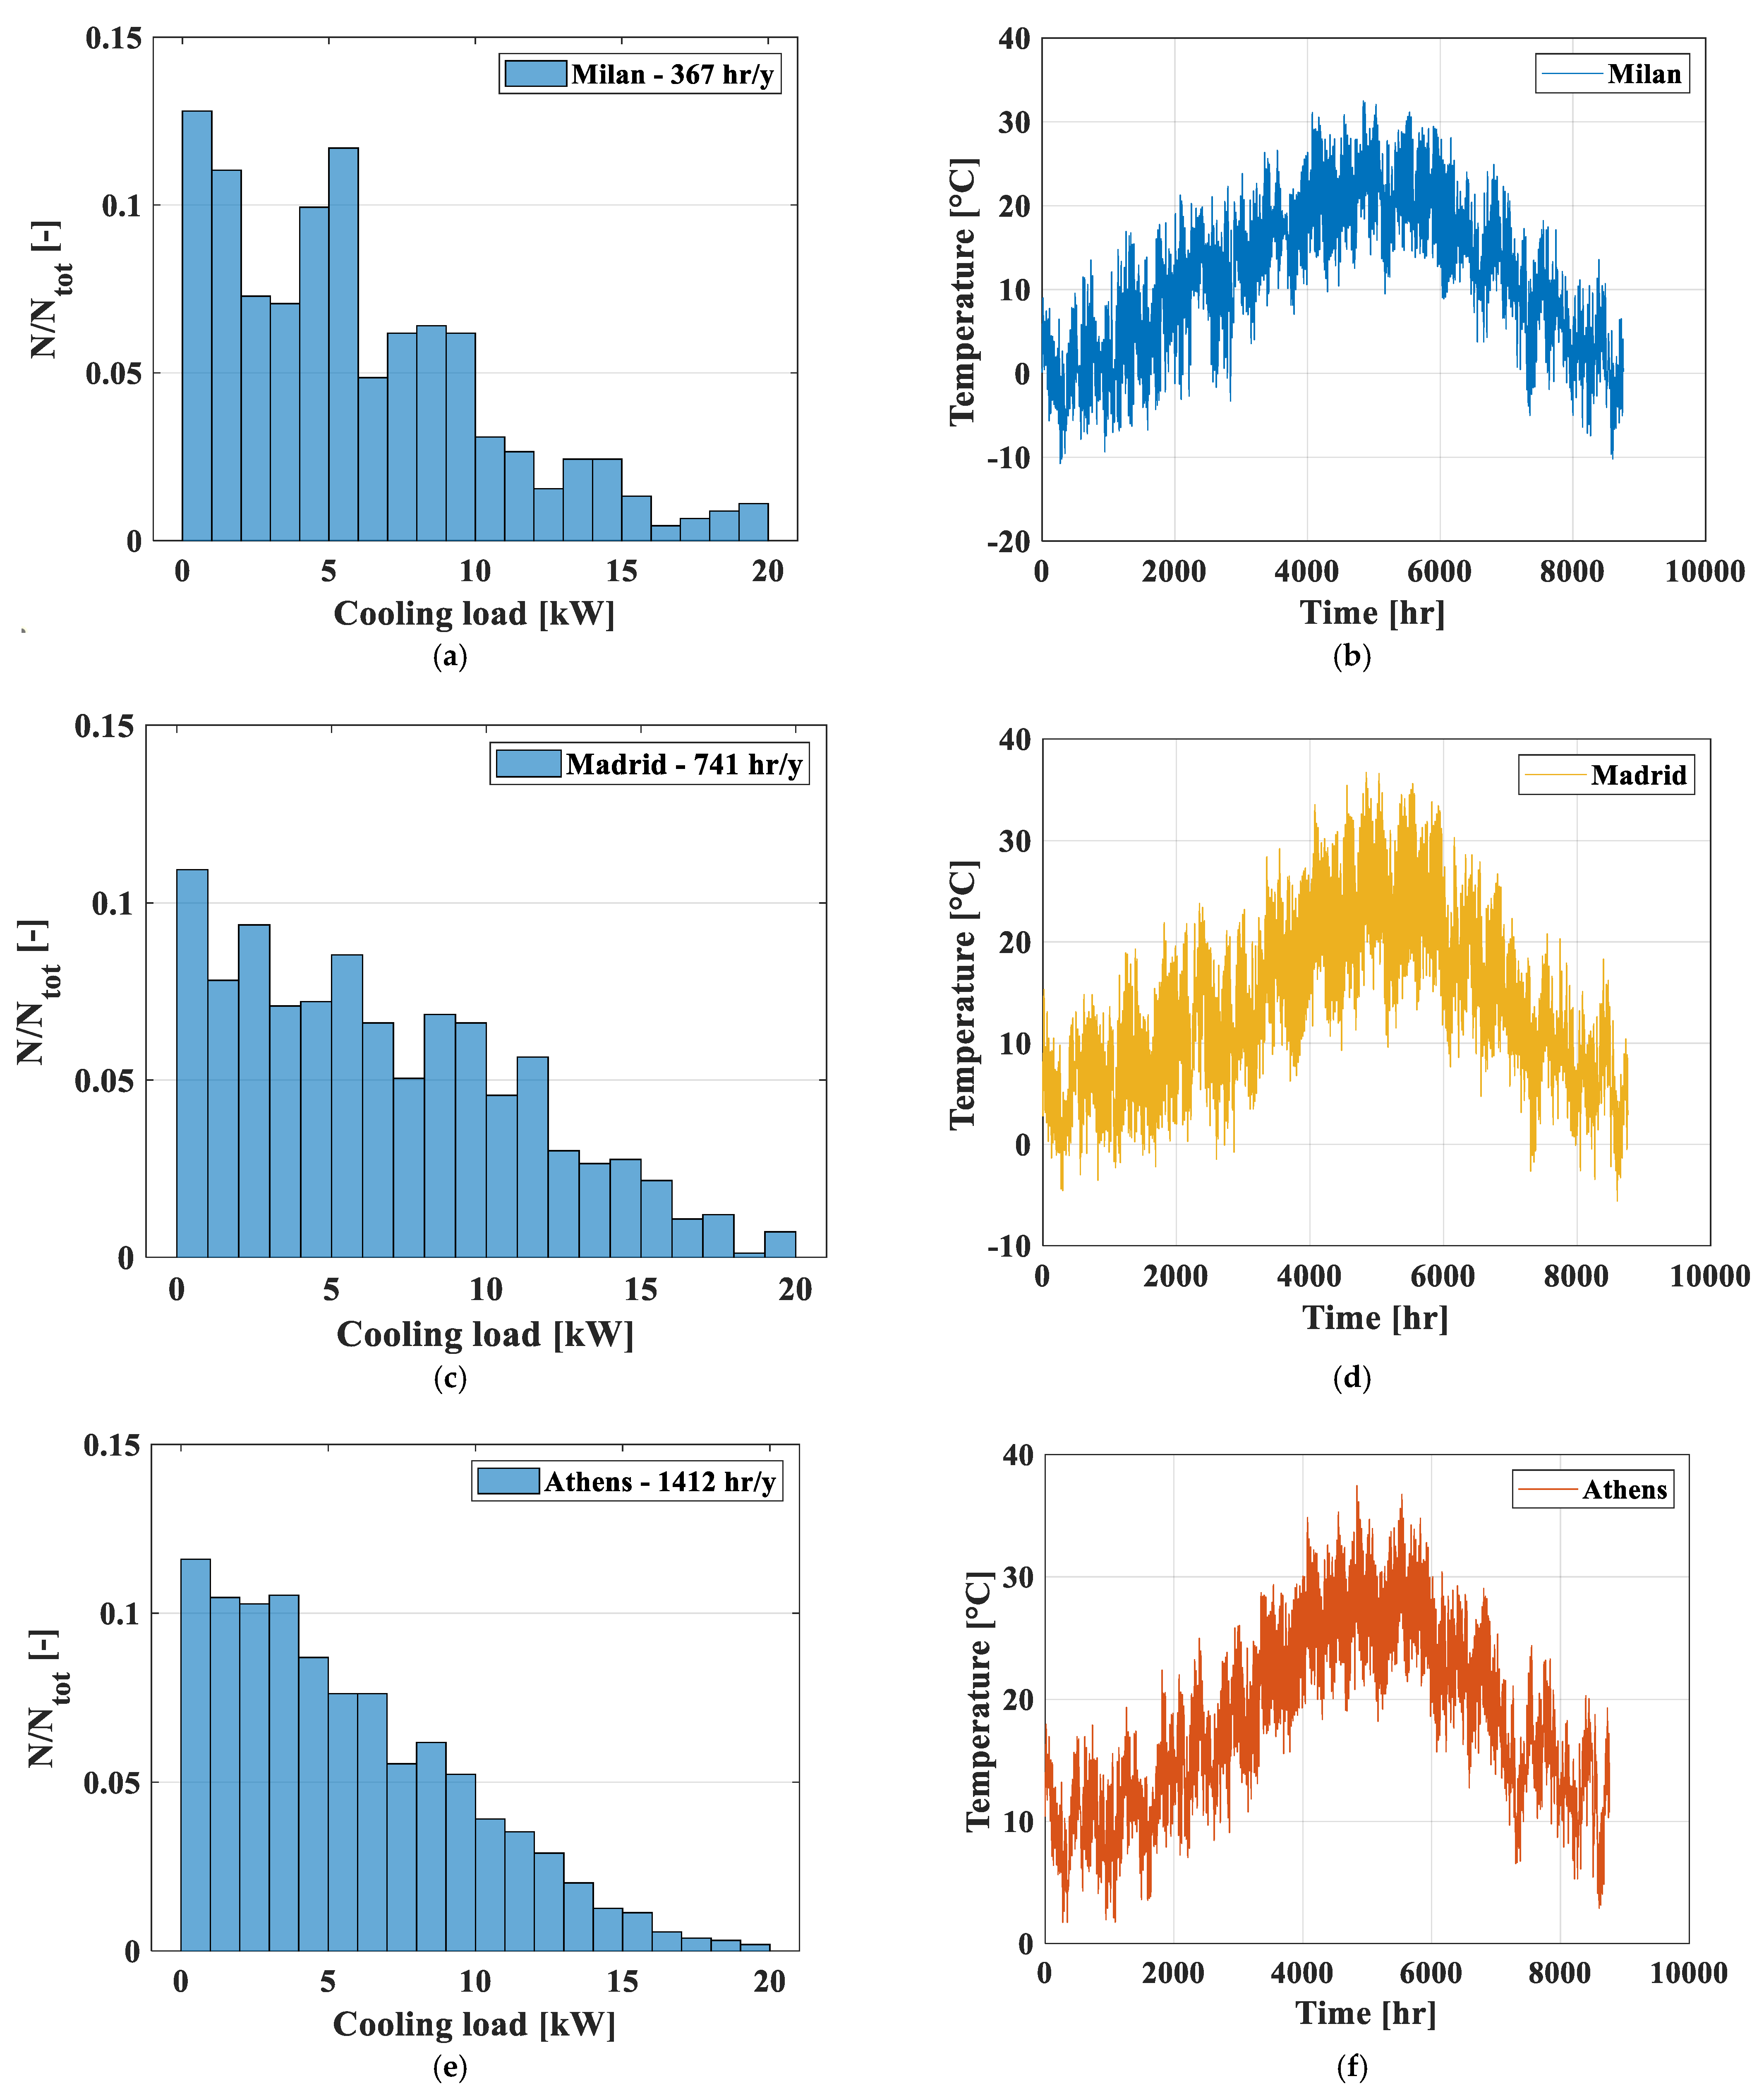
- The ambient temperature and the cooling load at the evaporator are fixed and obtained from the weather data file;
- The evaporation temperature is assumed: the temperature profiles are obtained and the overall heat transfer coefficient U can be evaluated by the logarithmic mean temperature difference. This value is then compared to the one obtained by the heat transfer correlations. The evaporation temperature is adjusted until the matching between the heat exchanger project equation and the heat transfer correlations is obtained;
- Once the cooling load is defined, the undersized and oversized multi-ejector configurations can be selected as described in the previous section;
- The first values of the vapor generator and condenser saturation temperatures are fixed, and the thermodynamic cycle is evaluated;
- The ejector boundary conditions are known, and the entrainment ratio is obtained with the ejector model. Hence, the mass flow rates and the thermal powers can be evaluated;
- The condenser is numerically solved as described before, and the heat transfer surface is calculated and compared to the one obtained by the design process. The condenser saturation temperature is adjusted up to the numerical convergence (with a fixed tolerance of 0.05) by repeating steps 5, 6 and 7;
- With the correct condensation temperature, the vapor generator is integrated in order to evaluate its heat transfer surface. The vapor generator saturation temperature is then adjusted by repeating steps 5, 6, 7 and 8 up to the numerical convergence (keeping the same tolerance of step 7) between heat transfer surfaces.
- The steps from 5 to 8 are performed for each multi-ejector configuration according step 4.
- The thermodynamic cycle and the thermal and electrical powers are known: the oversized multi-ejector configuration operating time is evaluated with Equation (15) and the electrical load required by the fans and the refrigerant pump are calculated with Equation (16). Finally, the seasonal performance indicator SEERel is evaluated with Equation (14).
5.3. Operating Conditions and Weather Data
5.4. Results
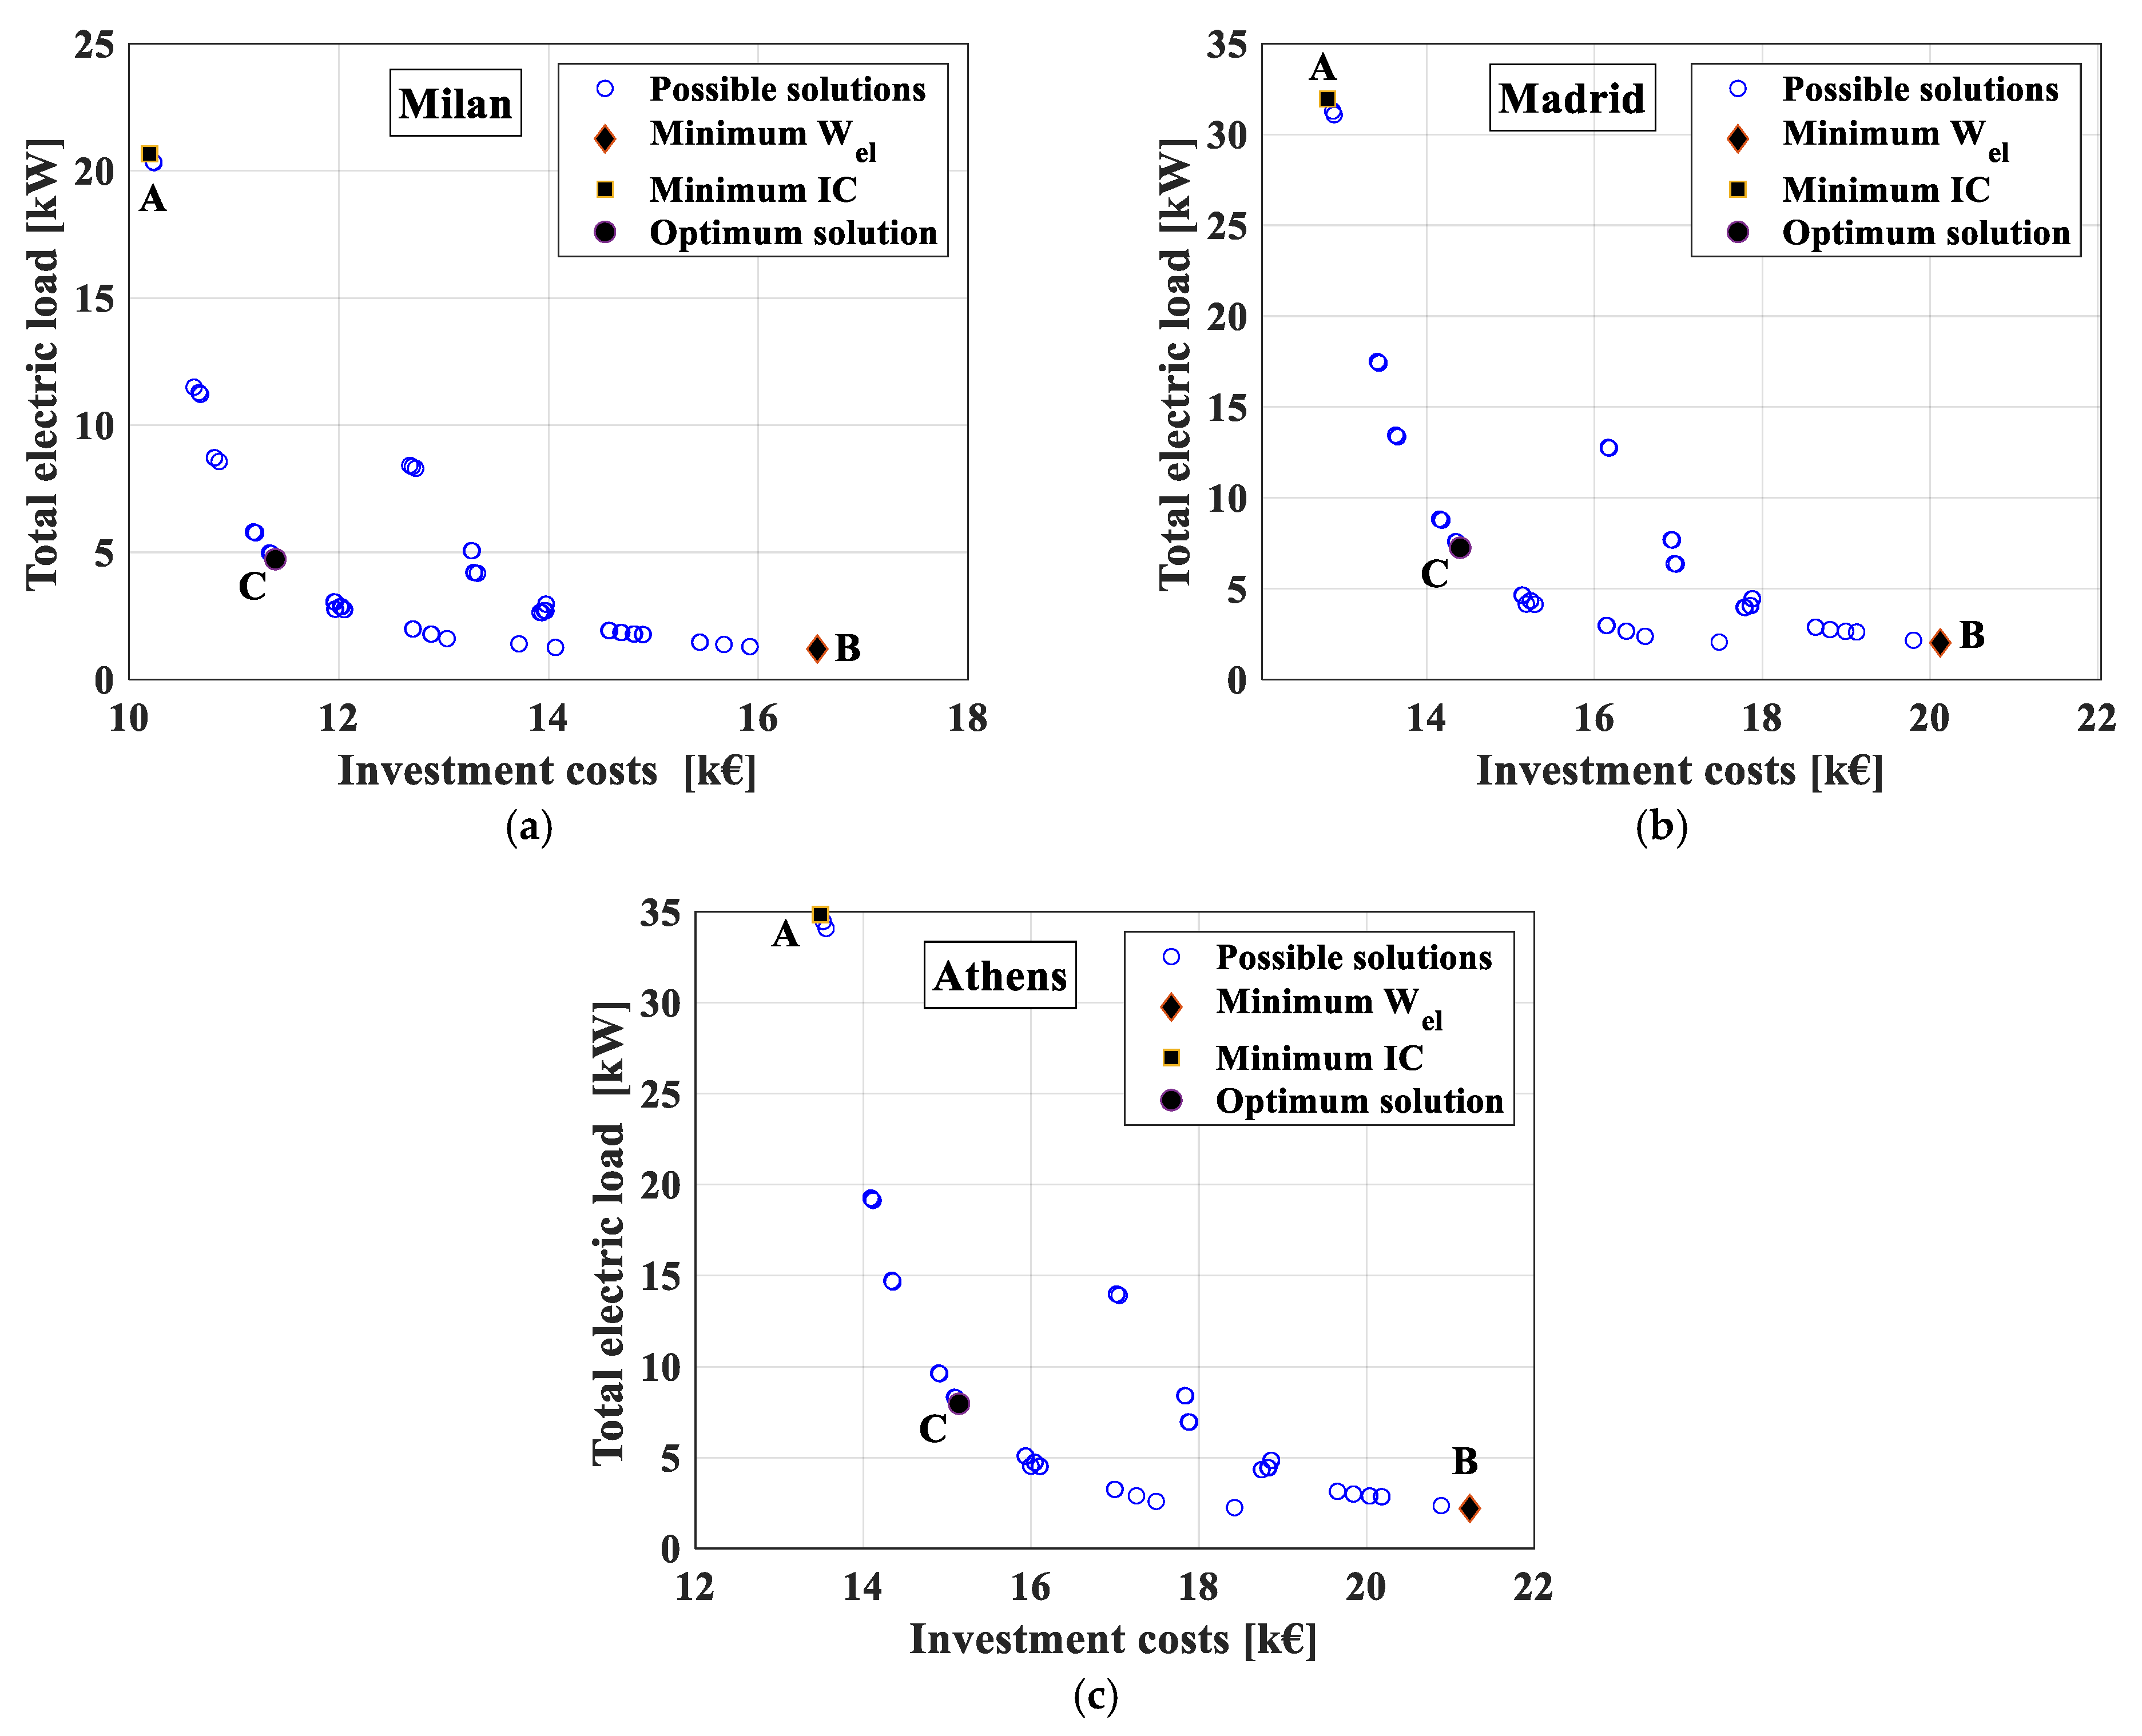
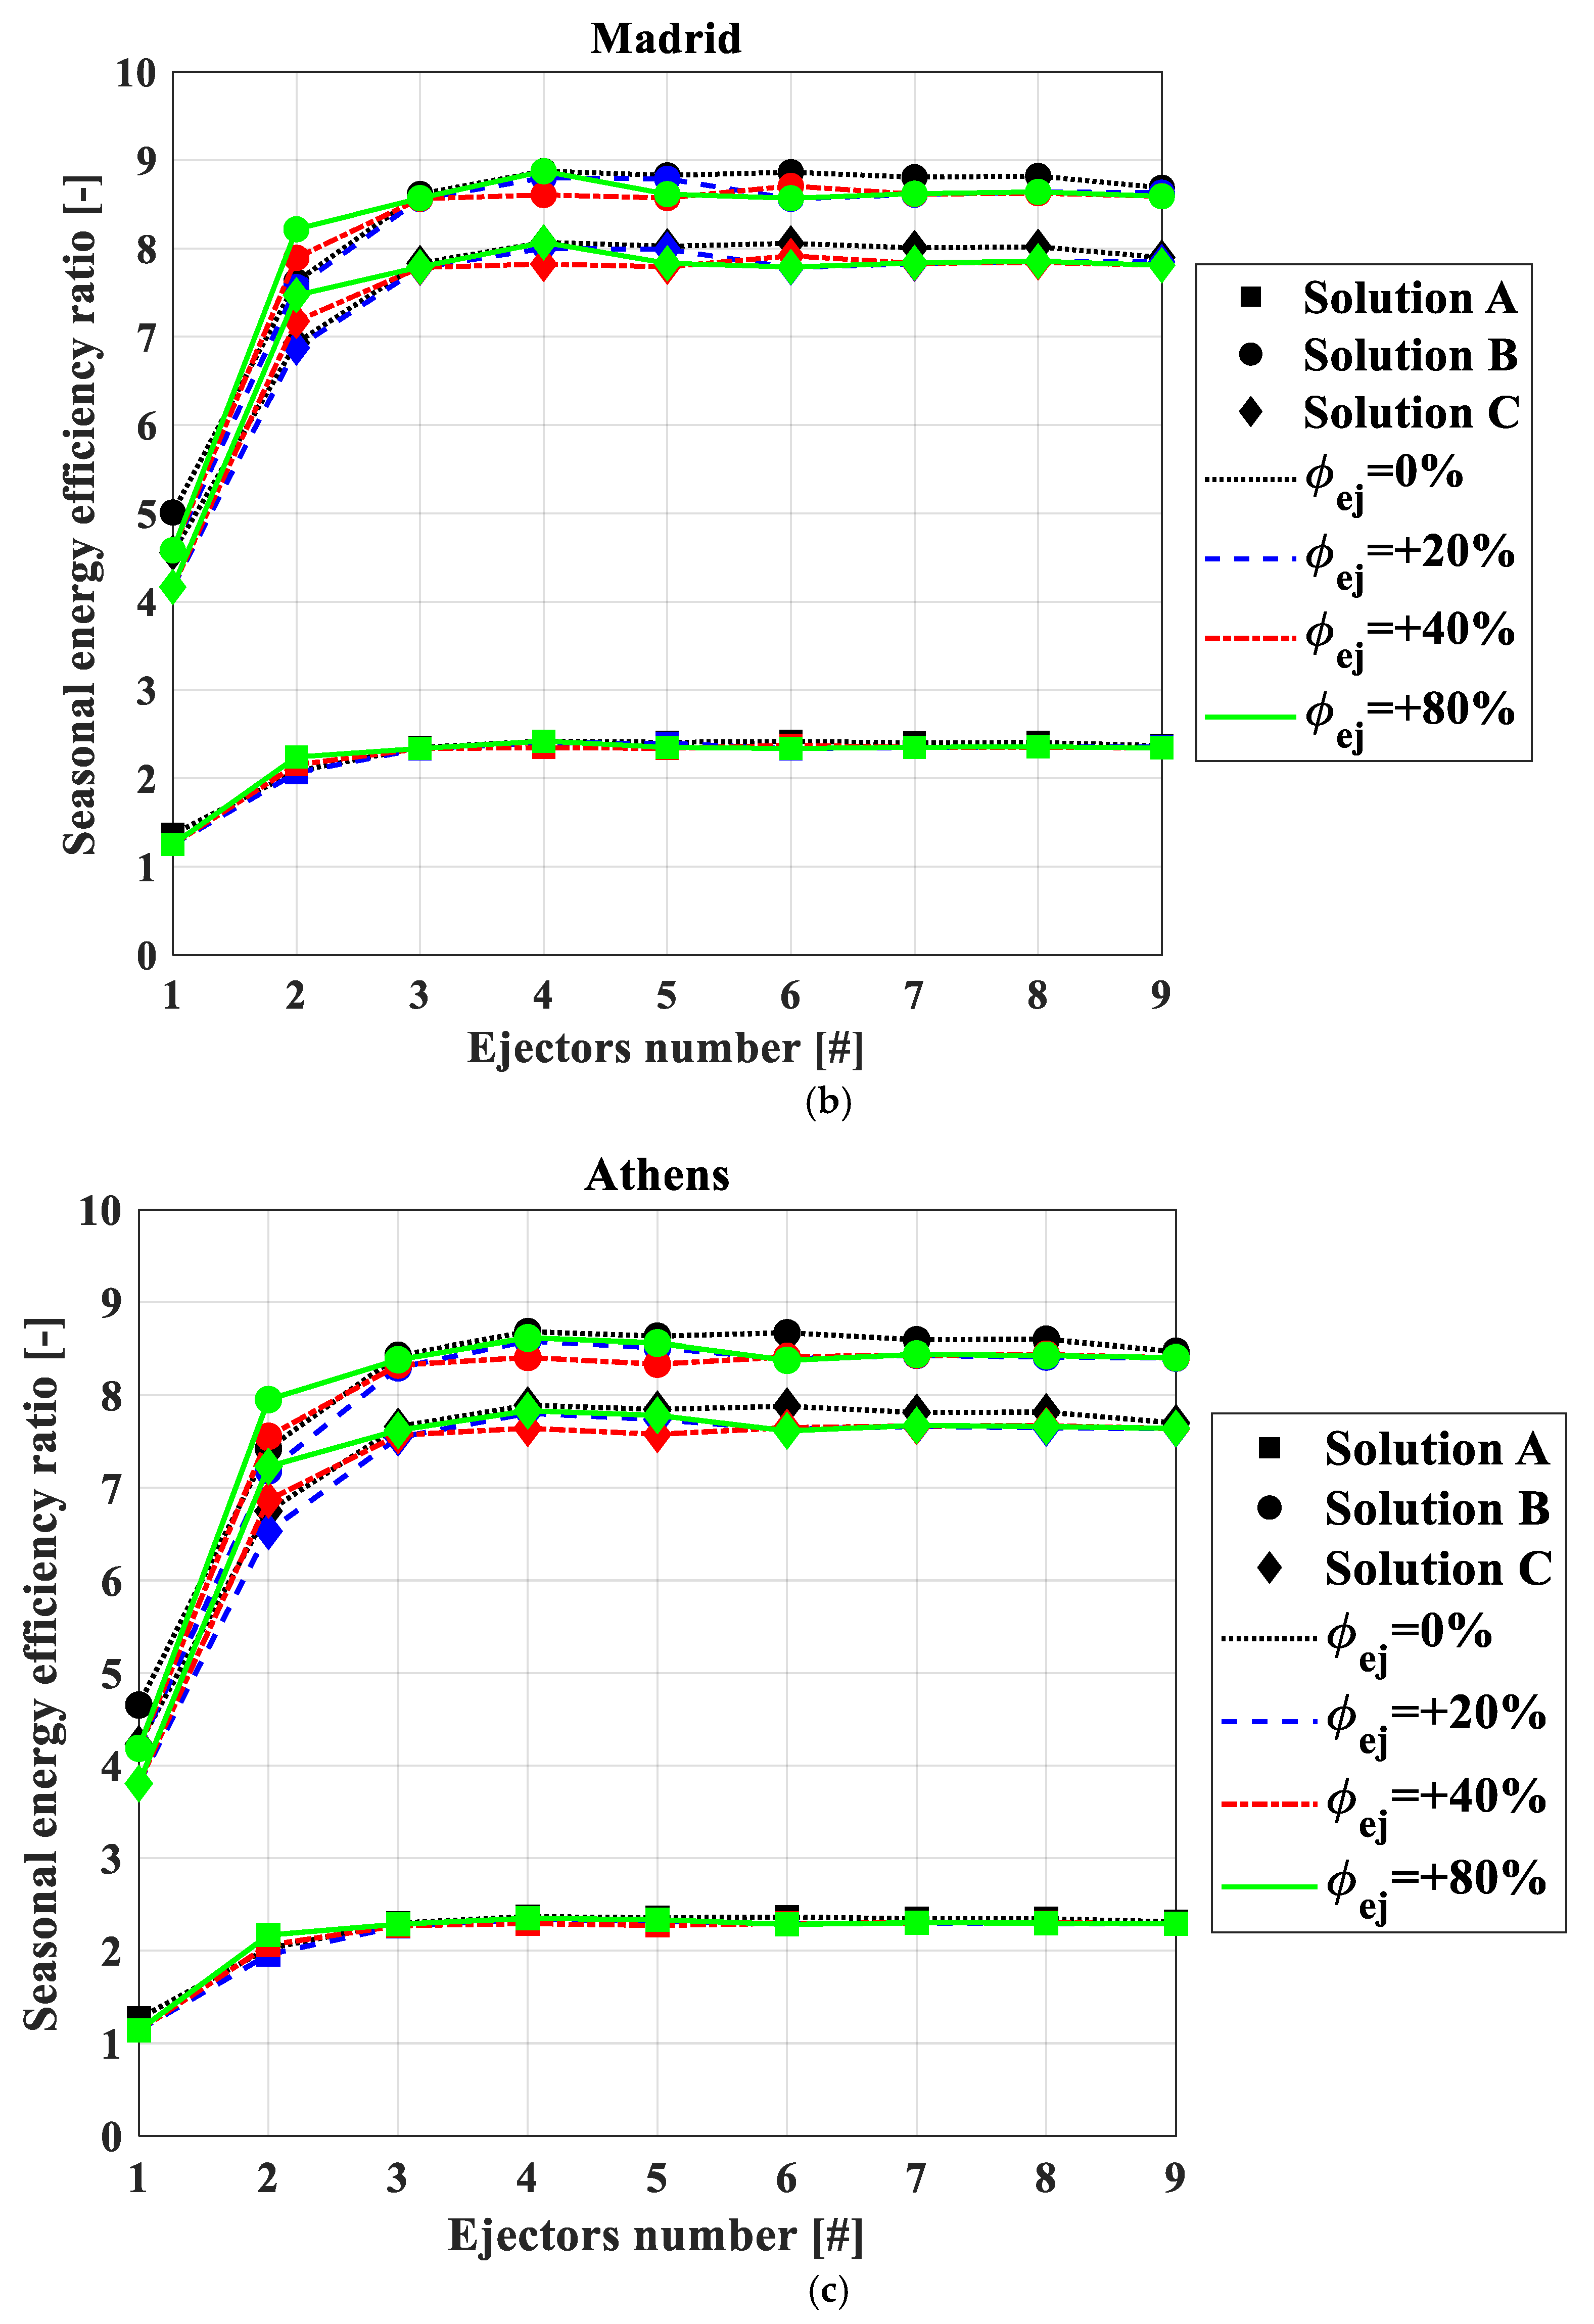
5.4.1. Multi-Ejector System Optimization
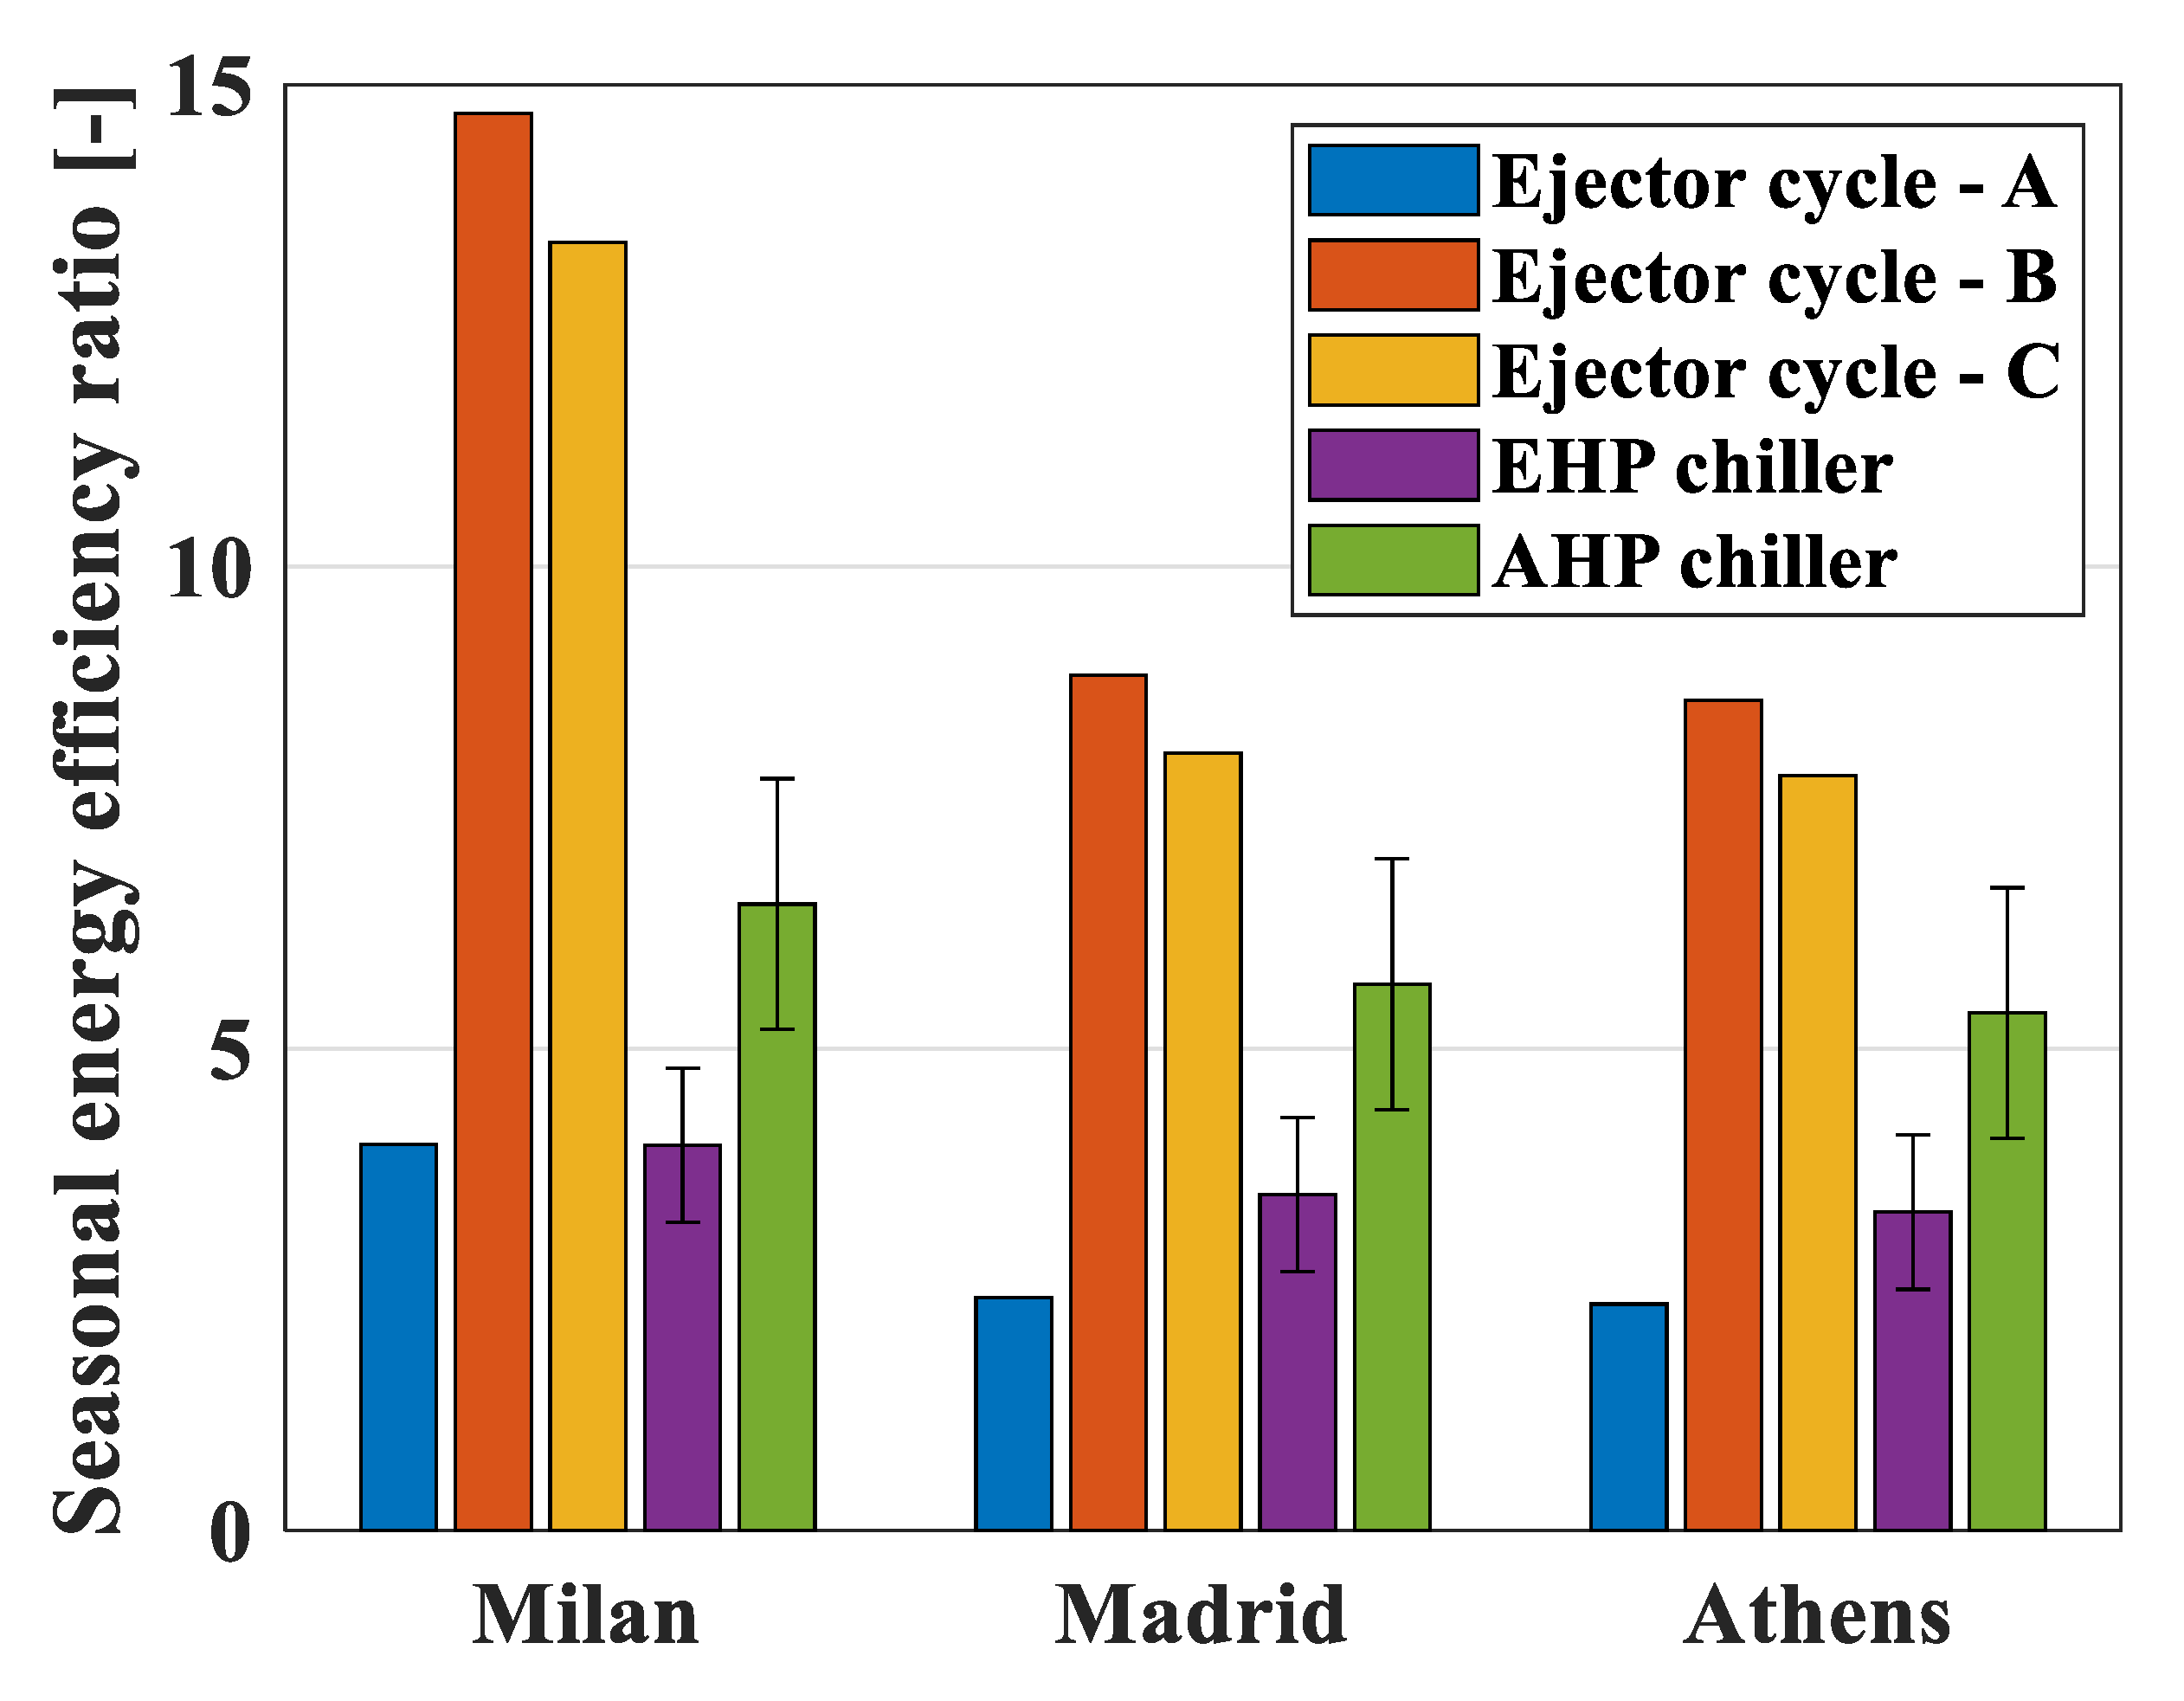
5.4.2. Thermo-Economic Comparison with the Current Technology
6. Conclusions
- The use of a multi-ejector system instead of a single fixed-geometry ejector enables the system to run at partial load without penalizing seasonal performance. Climatically warmer zones gain major benefits by using multi-ejector packs, with an 89.9% increase in the SEERel in Athens when shifting from 1 to 2 ejectors.
- Regardless of the climatic zone and the multi-ejector geometric scale, except ϕej = 0%, maximum seasonal performance could be obtained with a multi-ejector system of 3 or 4 ejectors.
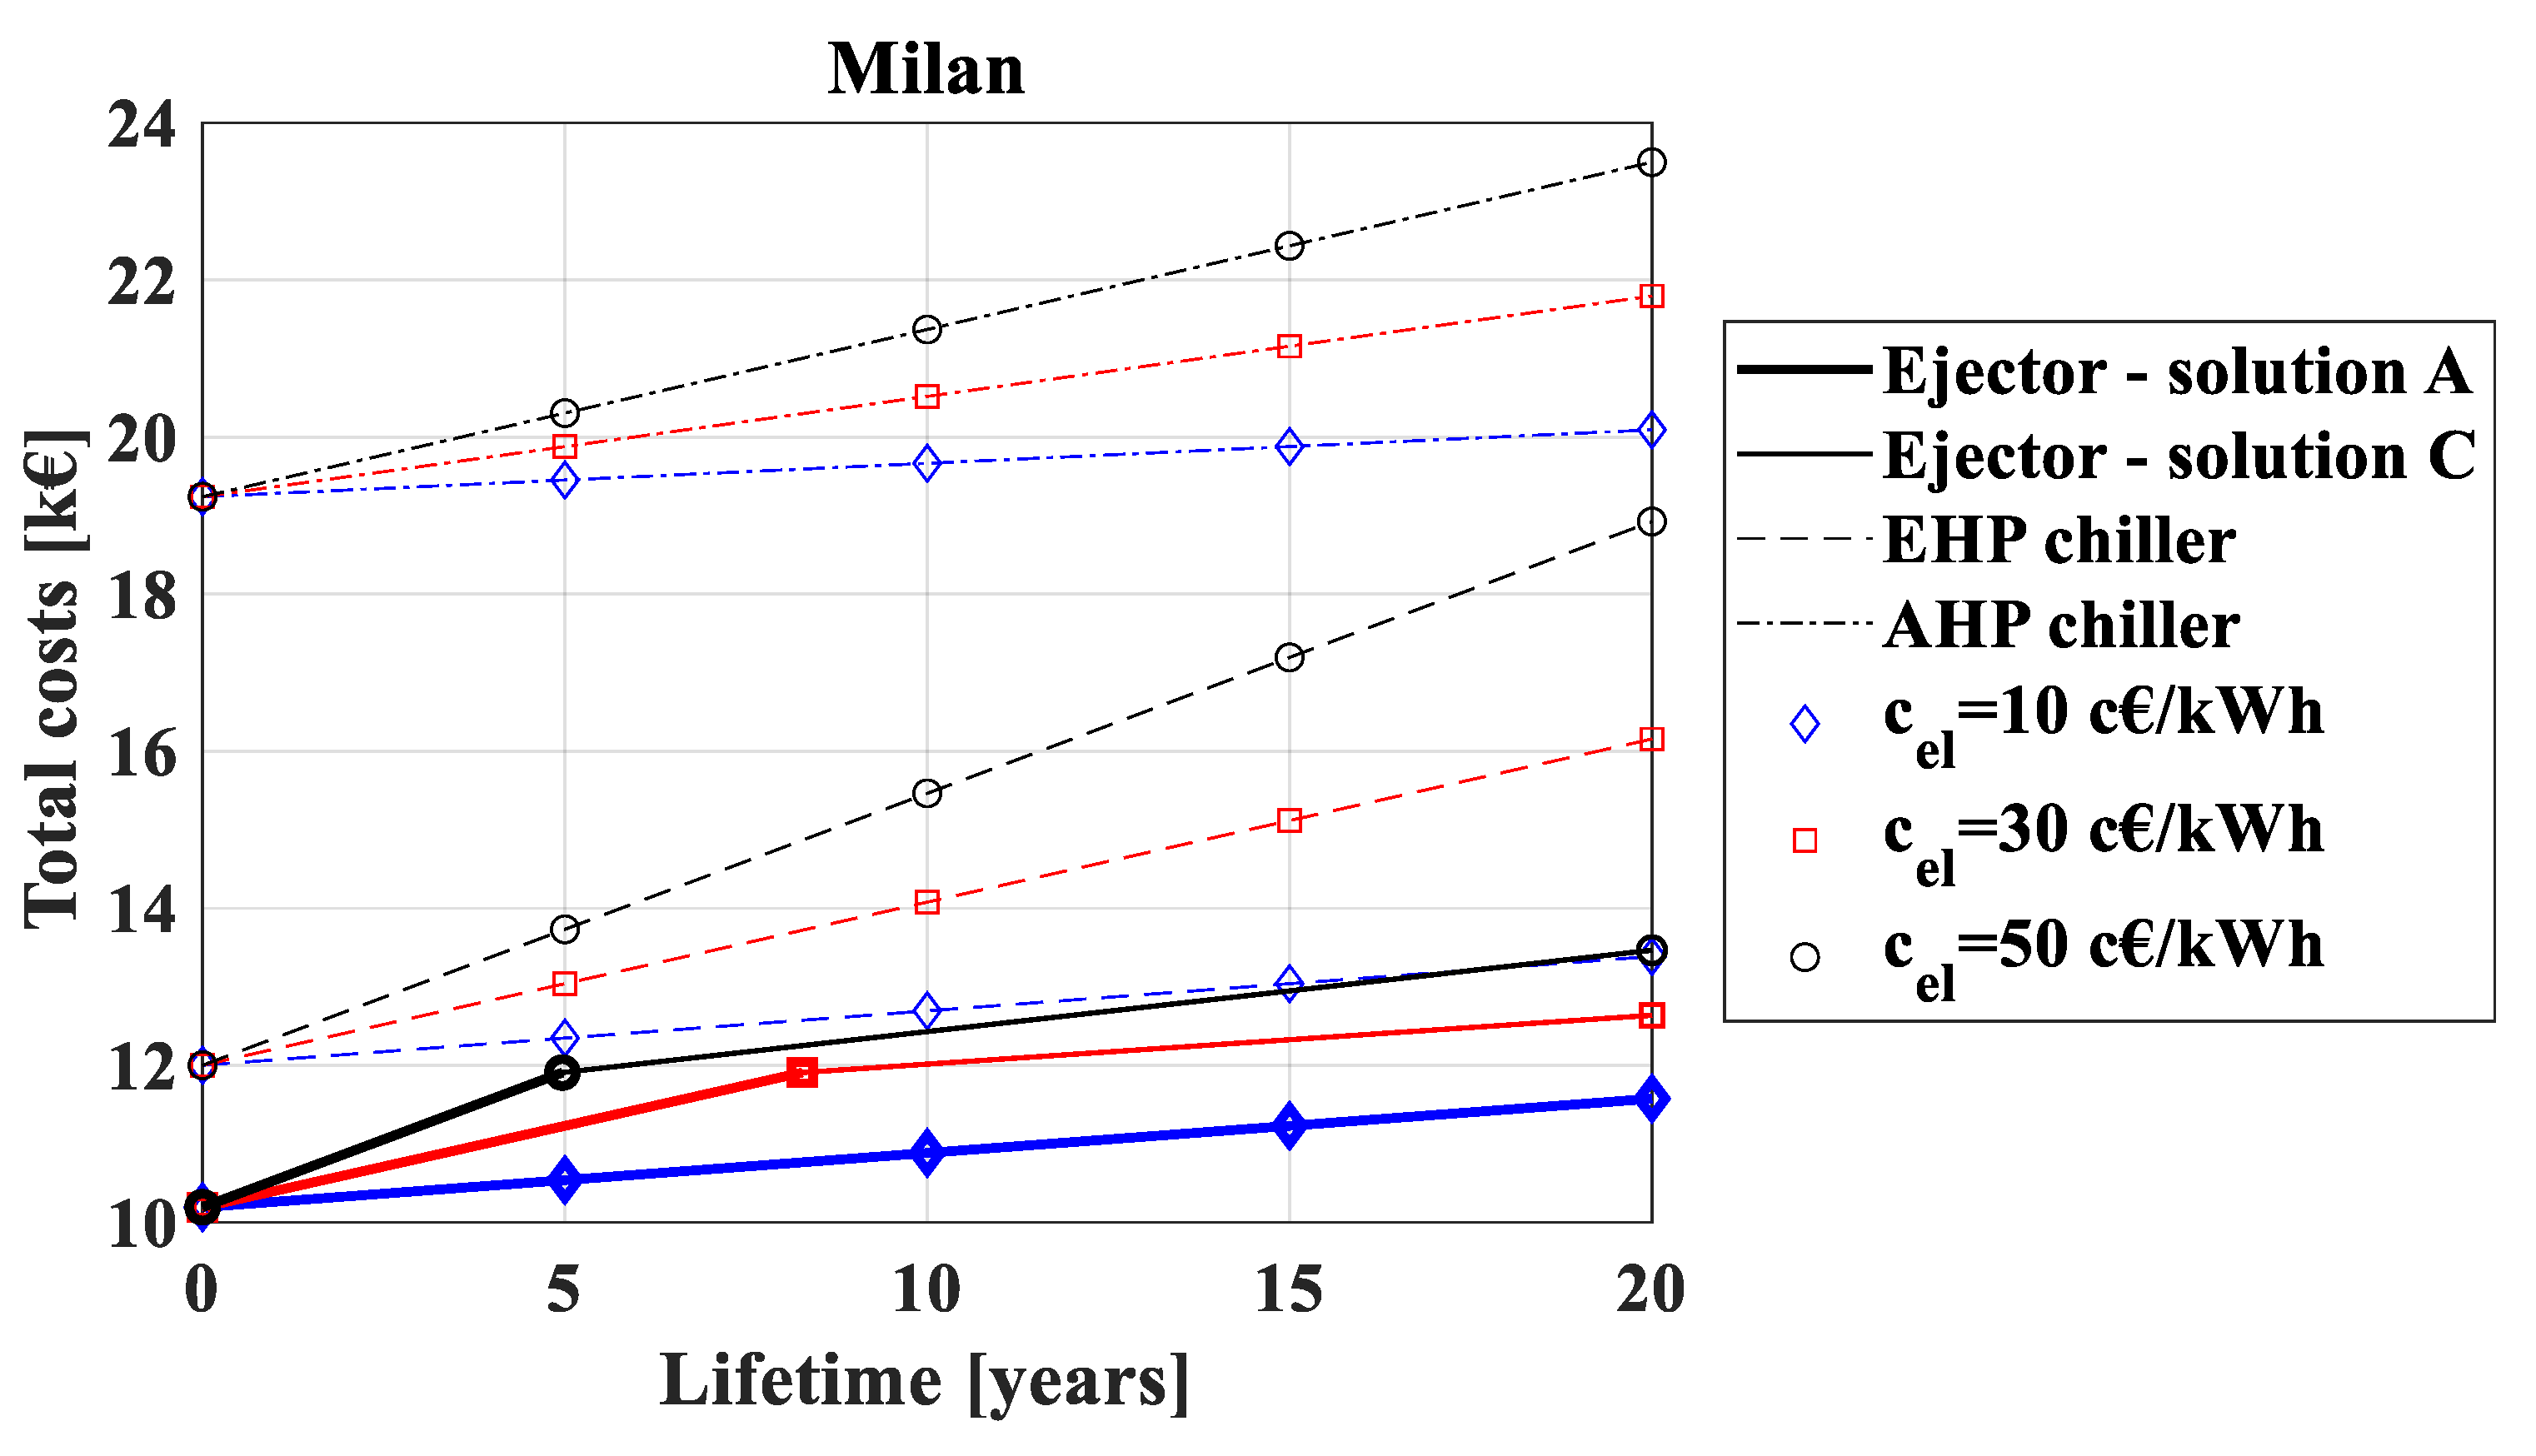
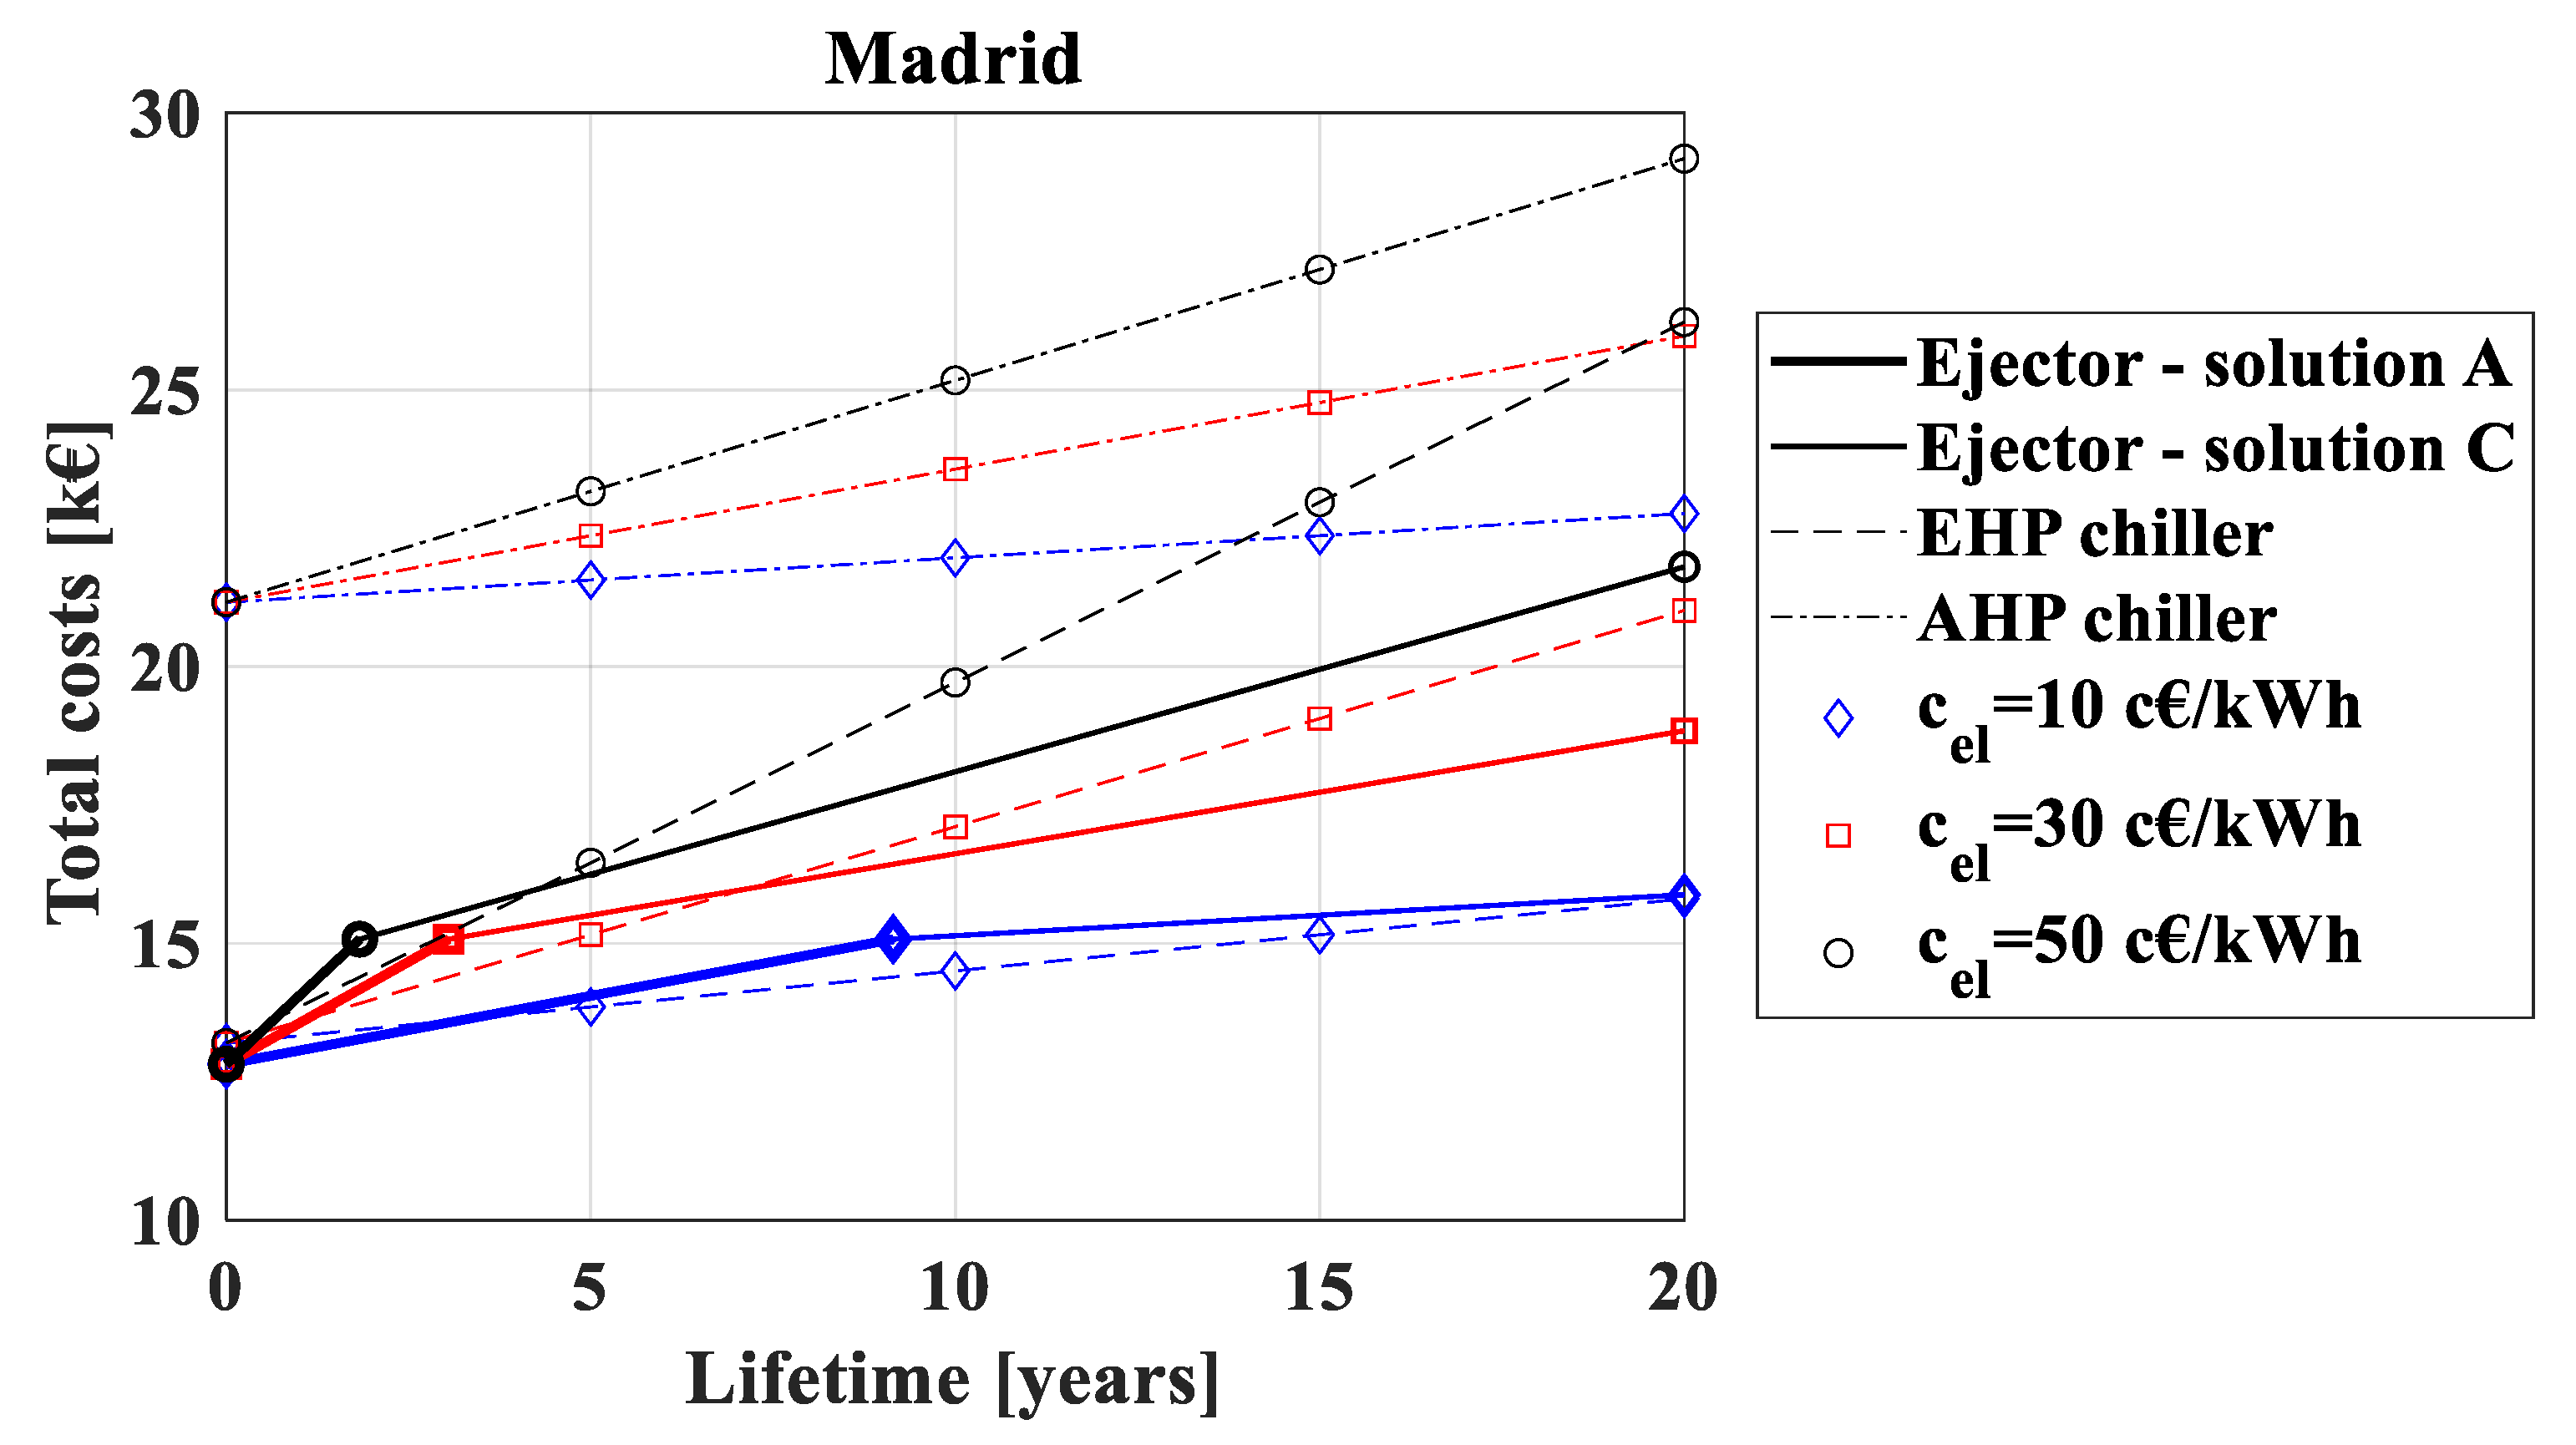
- The hybrid ejector cooling cycle is characterized by higher seasonal performances than those of the reference technologies, especially in moderate climatic zones such as Milan, where the SEERel of the ejector cooling cycle is 3.3 and 2.1 times higher than that of electrical and absorption chillers, respectively. All three chiller technologies are characterized by lower performance in warmer climatic zones but the penalty due to higher ambient temperatures is stronger for the ejector cooling cycle.
- Among the investigated chiller technologies, the hybrid ejector and the electrical system represent the most economically convenient solutions. The convenience in the use of the hybrid ejector cycle strongly depends on the climatic zone and on the electric energy price. Solution C was always economically advantageous in moderate climatic zones such as Milan, whereas in climatic zones with a high cooling load, the hybrid ejector cooling systems were more convenient compared to electrical chillers after an acceptable economic lifetime (after 7.1 years in Madrid with 0.30 €/kWh electricity unit price, and after 9.5 years in Athens with 0.10 €/kWh electricity unit price). Scenarios with higher electricity costs made heat-driven cooling systems as the ejector more and more economically advantageous compared to electrically driven technologies.
Author Contributions
Funding
Institutional Review Board Statement
Informed Consent Statement
Conflicts of Interest
Nomenclature
| A | heat exchanger surface [m2] |
| Am | ejector mixing section [m2] |
| Ar | ejector area ratio [m2] |
| At | ejector motive nozzle throat section [m2] |
| AHP | absorption chiller |
| cel | electricity unit price [€ kWhel−1] |
| COP | coefficient of performance |
| EER | energy efficiency ratio |
| D | diameter [m] |
| Eel | electrical energy consumption [kWh] |
| EHP | electrical chiller |
| GWP | Global Warming Potential [kgCO2eq kg−1] |
| h | specific enthalpy [kJ kg−1] |
| IC | investment costs [k€] |
| k | heat capacity ratio |
| mass flow rate [kg s−1] | |
| N | hours number |
| Nu | Nusselt number |
| ODP | Ozone Depletion Potential |
| ORC | Organic Rankine Cycle |
| p | pressure [bar] |
| Q | thermal energy [kWh] |
| thermal power [kW] | |
| R | ideal gas constant [kJ kg−1 K−1] |
| RC | running costs [k€] |
| SEER | seasonal energy efficiency ratio |
| T | temperature [K] |
| TC | total costs [k€] |
| u | velocity [m s−1] |
| U | overall heat transfer coefficient [W m−2 K−1] |
| volumetric flow rate [m3 s−1] | |
| VCC | vapor compression cycle |
| W | energy consumption [kWh] |
| power consumption [kW] | |
| Greek | |
| α | convective heat transfer coefficient [W m−2 K−1] |
| β | ejector compression ratio |
| δ | thickness [m] |
| Δ | difference |
| ε | heat exchanger efficiency |
| η | efficiency |
| θ | time [hr] |
| κ | thermal conductivity [W m−1 K−1] |
| μ | entrainment ratio |
| Π | pressure lift |
| ϕ | multi-ejector geometric scale |
| Subscript | |
| air | related to the air |
| amb | external ambient |
| build | related to the building |
| cb | breakdown condition |
| cc | critical condition |
| co | condenser |
| cold | cold side |
| D | diffuser |
| ej | ejector |
| el | electrical |
| ev | evaporator |
| f | related to secondary fluid |
| fan | fans |
| fluid | related to the fluid |
| gl | global |
| gv | vapor generator |
| h | hydraulic |
| hot | hot side |
| M | mixing chamber |
| m | mixing section |
| mat | material |
| max | maximum value |
| nom | nominal |
| N | motive nozzle |
| out | outlet section |
| over | oversized conditions |
| p | refrigerant pump |
| pf | primary flow |
| R | rank |
| ref | related to the refrigerant |
| rhe | regenerative heat exchanger |
| s | isentropic |
| sf | secondary flow |
| t | motive nozzle throat section |
| th | thermal |
| tot | total |
| under | undersized conditions |
| user | final user |
Appendix A

| High Pressure Evaporator Plate Heat Exchanger | Condenser Plate Fin and Tube | Low Pressure Evaporator One Pass Flooded Evaporator | |||
|---|---|---|---|---|---|
| Plate height [mm] | to calculate | Tube length [mm] | to calculate | Tube length [mm] | to calculate |
| Channel number [#] | to calculate | Fin step [mm] | 3 ÷ 6 | Tube number | to calculate |
| Plate width [mm] | 150 | Fin thickness [mm] | 0.1/0.2 | External tube diameter [mm] | 4.0 |
| Plate spacing [mm] | 0.5 | Tube pitch [mm] | 33 | Tube thickness [mm] | 0.4 |
| Wavelength corrugation [mm] | 1.0 | Rank pitch [mm] | 33 | Baffle spacing [mm] | 250.0 |
| Chevron angle [°] | 80 | Tube number [#] | 20/25/30 | Shell diameter [mm] | 140.0 |
| Plate thickness [mm] | 0.2 | Tube external diameter [mm] | 8.0 | ||
| Tube thickness [mm] | 1.0 | ||||
| Rank number [#] | 3 ÷ 6 | ||||
References
- International Energy Agency. World Energy Outlook; International Energy Agency: Paris, France, 2014. [Google Scholar]
- International Energy Agency. Energy Technology Perspectives: Scenarios & Strategies to 2050; International Energy Agency: Paris, France, 2010. [Google Scholar]
- European Commission. Mapping and Analysis of the Current and Future (2020–2030) Heating/Cooling Fuel Deployment (Fossils/Renewables); European Commission: Brussels, Belgium, 2016. [Google Scholar]
- IEA, International Energy Agency. Data and Statistic. Explore Energy Data by Category, Indicator, Country or Region. Available online: https://www.iea.org/data-and-statistics?country=EU28&fuel=Energy%20supply&indicator=Electricity%20generation%20by%20source (accessed on 29 August 2020).
- GSE. Monitoraggio Statistico Degli Obiettivi Nazionali e Regionali Sulle FER-Anni 2012–2018. Available online: https://www.gse.it/dati-e-scenari/statistiche (accessed on 24 August 2020).
- Besagni, G.; Mereu, R.; Inzoli, F. Ejector refrigeration: A comprehensive review. Renew. Sustain. Energy Rev. 2016, 53, 373–407. [Google Scholar] [CrossRef] [Green Version]
- Sun, D.W. Comparative study of the performance of an ejector refrigeration cycle operating with various refrigerants. Energy Convers. Manag. 1999, 40, 873–884. [Google Scholar] [CrossRef]
- Kasperski, J.; Gil, B. Performance estimation of ejector cycles using heavier hydrocarbon refrigerants. Appl. Therm. Eng. 2014, 71, 197–203. [Google Scholar] [CrossRef]
- Chen, J.; Havtun, H.; Palm, B. Screening of working fluids for the ejector refrigeration system. Int. J. Refrig. 2014, 47, 1–14. [Google Scholar] [CrossRef]
- Gil, B.; Kasperski, J. Efficiency analysis of alternative refrigerants for ejector cooling cycles. Energy Convers. Manag. 2015, 94, 12–18. [Google Scholar] [CrossRef]
- Lillo, G.; Mastrullo, R.; Mauro, A.W.; Trinchieri, R.; Viscito, L. Thermo-economic analysis of a hybrid ejector refrigerating system based on a low grade heat source. Energies 2020, 13, 562. [Google Scholar] [CrossRef] [Green Version]
- Sun, D.W. Variable geometry ejectors and their applications in ejector refrigeration systems. Energy 1996, 21, 919–929. [Google Scholar] [CrossRef]
- Pereira, P.R.; Varga, S.; Oliveira, A.C.; Soares, J. Development and performance of an advanced ejector cooling system for a sustainable built environment. Front. Mech. Eng. 2015, 1, 7. [Google Scholar] [CrossRef]
- Van Nguyen, V.; Varga, S.; Soares, J.; Dvorak, V.; Oliveira, A.C. Applying a variable geometry ejector in a solar ejector refrigeration system. Int. J. Refrig. 2020, 113, 187–195. [Google Scholar] [CrossRef]
- Chen, J.; Havtun, H.; Palm, B. Investigation of ejectors in refrigeration system: Optimum performance evaluation and ejector area ratios perspectives. Appl. Therm. Eng. 2014, 64, 182–191. [Google Scholar] [CrossRef]
- Shestopalov, K.O.; Huang, B.J.; Petrenko, V.O.; Volovyk, O.S. Investigation of an experimental ejector refrigeration machine operating with refrigerant R245fa at design and off-design working conditions. Part 2. Theoretical and experimental results. Int. J. Refrig. 2015, 55, 212–223. [Google Scholar] [CrossRef]
- McLinden, M. Reference Fluid Thermodynamic and Transport Properties, Nist Standard Reference Database 23; Version 9.1; Physical and Chemical Properties Division, NIST: Gaithersburg, MD, USA, 2002.
- Declaye, S. Vincent Lemort, Improving the Performance of μ-ORC Systems. Ph.D. Thesis, Université de Liège, Liège, Belgium, 2015. [Google Scholar]
- Varga, S.; Lebre, P.S.; Oliveira, A.C. Readdressing working fluid selection with a view to designing a variable geometry ejector. Int. J. Low Carbon Technol. 2015, 10, 205–215. [Google Scholar] [CrossRef] [Green Version]
- TRNSYS 17, a TRaNsient System Simulation Program; Solar Energy Laboratory, University of Wisconsin-Madison: Madison, WI, USA, 2010. Available online: http://www.trnsys.com/index.html (accessed on 29 August 2021).
- Cecchinato, L.; Chiarello, M.; Corradi, M. A simplified method to evaluate the seasonal energy performance of water chillers. Int. J. Therm. Sci. 2010, 49, 1776–1786. [Google Scholar] [CrossRef]
- Kühn, A. (Ed.) Thermally Driven Heat Pumps for Heating and Cooling; Universitätsverlag der TU Berlin: Berlin, Germany, 2013. [Google Scholar]
- Berliner Energieagentur GmbH. Meeting Cooling Demands in Summer by Applying Heat from Cogeneration; Summerheat Publishable Report; Berliner Energieagentur GmbH: Berlin, Germany, 2009. [Google Scholar]


| Parameters | Value | Parameters | Value |
|---|---|---|---|
| Nominal cooling load [kW] | 20 | Water temperature at the evaporator (inlet/outlet) [°C] | 12/7 |
| Working fluid temperature at vapor generator outlet [°C] | 110 | Quality at evaporator outlet | 1.0 |
| Water temperature at the vapor generator (inlet/outlet) [°C] | 120/80 | Regenerative heat exchanger efficiency | 0.90 |
| Air temperature difference at the condenser [K] | 5 | Pinch points for the heat exchangers [K] | 3 |
| Quality at condenser outlet | 0.0 | Set point indoor temperature [°C] | 26.0 |
| Climatic Zone | Tamb,max [°C] |
|---|---|
| Milan | 32.50 |
| Madrid | 36.70 |
| Athens | 37.45 |
| Climatic Zone | Solution | Tgv [°C] | Tco [°C] | Tev [°C] | Dt [mm] | DN,out [mm] | Dm [mm] | Agv [m2] | Aco [m2] | Aev [m2] | Arhe [m2] | µ [-] | EERel [-] | IC [k€] |
|---|---|---|---|---|---|---|---|---|---|---|---|---|---|---|
| Milan | A | 83.0 | 40.3 | 4.0 | 3.71 | 4.82 | 6.90 | 7.20 | 152.56 | 1.33 | 0.33 | 0.184 | 0.97 | 10.194 |
| B | 83.0 | 40.3 | 4.0 | 3.71 | 4.82 | 6.90 | 7.20 | 407.29 | 1.33 | 0.33 | 0.184 | 16.61 | 16.563 | |
| C | 83.0 | 40.3 | 4.0 | 3.71 | 4.82 | 6.90 | 7.20 | 200.56 | 1.33 | 0.33 | 0.184 | 4.23 | 11.394 | |
| Madrid | A | 82.2 | 44.4 | 4.0 | 4.55 | 5.91 | 7.78 | 10.48 | 202.11 | 1.33 | 0.47 | 0.127 | 0.63 | 12.819 |
| B | 82.2 | 44.4 | 4.0 | 4.55 | 5.91 | 7.78 | 10.48 | 494.23 | 1.33 | 0.47 | 0.127 | 9.87 | 20.122 | |
| C | 82.2 | 44.4 | 4.0 | 4.55 | 5.91 | 7.78 | 10.48 | 265.32 | 1.33 | 0.47 | 0.127 | 2.76 | 14.399 | |
| Athens | A | 82.0 | 45.2 | 4.0 | 4.75 | 6.17 | 8.00 | 11.30 | 215.25 | 1.33 | 0.50 | 0.118 | 0.57 | 13.491 |
| B | 82.0 | 45.2 | 4.0 | 4.75 | 6.17 | 8.00 | 11.30 | 524.85 | 1.33 | 0.50 | 0.118 | 9.09 | 21.231 | |
| C | 82.0 | 45.2 | 4.0 | 4.75 | 6.17 | 8.00 | 11.30 | 281.31 | 1.33 | 0.50 | 0.118 | 2.51 | 15.142 |
| Parameters | Value |
|---|---|
| Number of ejectors [#] | 1–9 |
| Multi-ejector geometric scale ϕej | 0; 20; 40; 80 |
| Parameters | Value | Parameters | Value |
|---|---|---|---|
| Working fluid temperature at vapor generator outlet [°C] | 110 | Quality at condenser outlet | 0.0 |
| Water temperature at the vapor generator (inlet/outlet) [°C] | 120/80 | Quality at evaporator outlet | 1.0 |
| Air temperature difference at the condenser [K] | 5 | Heat exchanger geometry | from the sizing procedure |
| Water temperature at the evaporator (inlet/outlet) [°C] | 12/7 | Ejector geometry | from the sizing procedure |
| Climatic Zone | Ejector Cycle Solution A | Ejector Cycle Solution B | Ejector Cycle Solution C | EHP Chiller | AHP Chiller |
|---|---|---|---|---|---|
| Milan | 10.194 € | 16.563 € | 1.394 € | 12.002 € | 19.239 € |
| Madrid | 12.819 € | 20.122 € | 14.399 € | 13.202 € | 21.163 € |
| Athens | 13.491 € | 21.231 € | 15.142 € | 14.402 € | 23.087 € |
| Climatic Zone Hybrid Ejector Solution | Convenience Lifetime [Years] | ||
|---|---|---|---|
| Milan | cel = 0.10 €/kWhel | cel = 0.30 €/kWhel | cel = 0.50 €/kWhel |
| A—Minimum costs | always | always | always |
| B—Minimum electric load | never | never | >18.1 |
| C—Optimum | always | always | always |
| Madrid | cel = 0.10 €/kWhel | cel = 0.30 €/kWhel | cel = 0.50 €/kWhel |
| A—Minimum costs | <3.3 | <1.1 | <0.7 |
| B—Minimum electric load | never | never | never |
| C—Optimum | never | >7.1 | >4.3 |
| Athens | cel = 0.10 €/kWhel | cel = 0.30 €/kWhel | cel = 0.50 €/kWhel |
| A—Minimum costs | <4.2 | <1.4 | <0.8 |
| B—Minimum electric load | never | never | >15.3 |
| C—Optimum | >9.5 | >3.2 | >1.9 |
Publisher’s Note: MDPI stays neutral with regard to jurisdictional claims in published maps and institutional affiliations. |
© 2021 by the authors. Licensee MDPI, Basel, Switzerland. This article is an open access article distributed under the terms and conditions of the Creative Commons Attribution (CC BY) license (https://creativecommons.org/licenses/by/4.0/).
Share and Cite
Viscito, L.; Lillo, G.; Napoli, G.; Mauro, A.W. Waste Heat Driven Multi-Ejector Cooling Systems: Optimization of Design at Partial Load; Seasonal Performance and Cost Evaluation. Energies 2021, 14, 5663. https://doi.org/10.3390/en14185663
Viscito L, Lillo G, Napoli G, Mauro AW. Waste Heat Driven Multi-Ejector Cooling Systems: Optimization of Design at Partial Load; Seasonal Performance and Cost Evaluation. Energies. 2021; 14(18):5663. https://doi.org/10.3390/en14185663
Chicago/Turabian StyleViscito, Luca, Gianluca Lillo, Giovanni Napoli, and Alfonso William Mauro. 2021. "Waste Heat Driven Multi-Ejector Cooling Systems: Optimization of Design at Partial Load; Seasonal Performance and Cost Evaluation" Energies 14, no. 18: 5663. https://doi.org/10.3390/en14185663
APA StyleViscito, L., Lillo, G., Napoli, G., & Mauro, A. W. (2021). Waste Heat Driven Multi-Ejector Cooling Systems: Optimization of Design at Partial Load; Seasonal Performance and Cost Evaluation. Energies, 14(18), 5663. https://doi.org/10.3390/en14185663