
Global Research Trends on Building Indoor Environmental Quality Modelling and Indexing Systems—A Scientometric Review


Abstract
:
1. Introduction
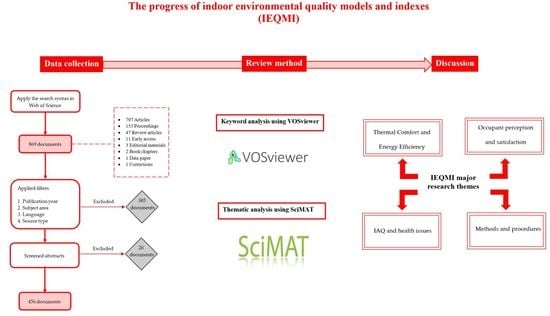
2. Methodology
2.1. Data Collection
2.2. Data Analysis Using VOSviewer
2.2.1. Keyword Analysis Using VOSviewer
2.2.2. Citation Analysis Applying VOSviewer
2.3. SciMAT
2.3.1. Overlay Graph
2.3.2. Evolution Map
3. Results
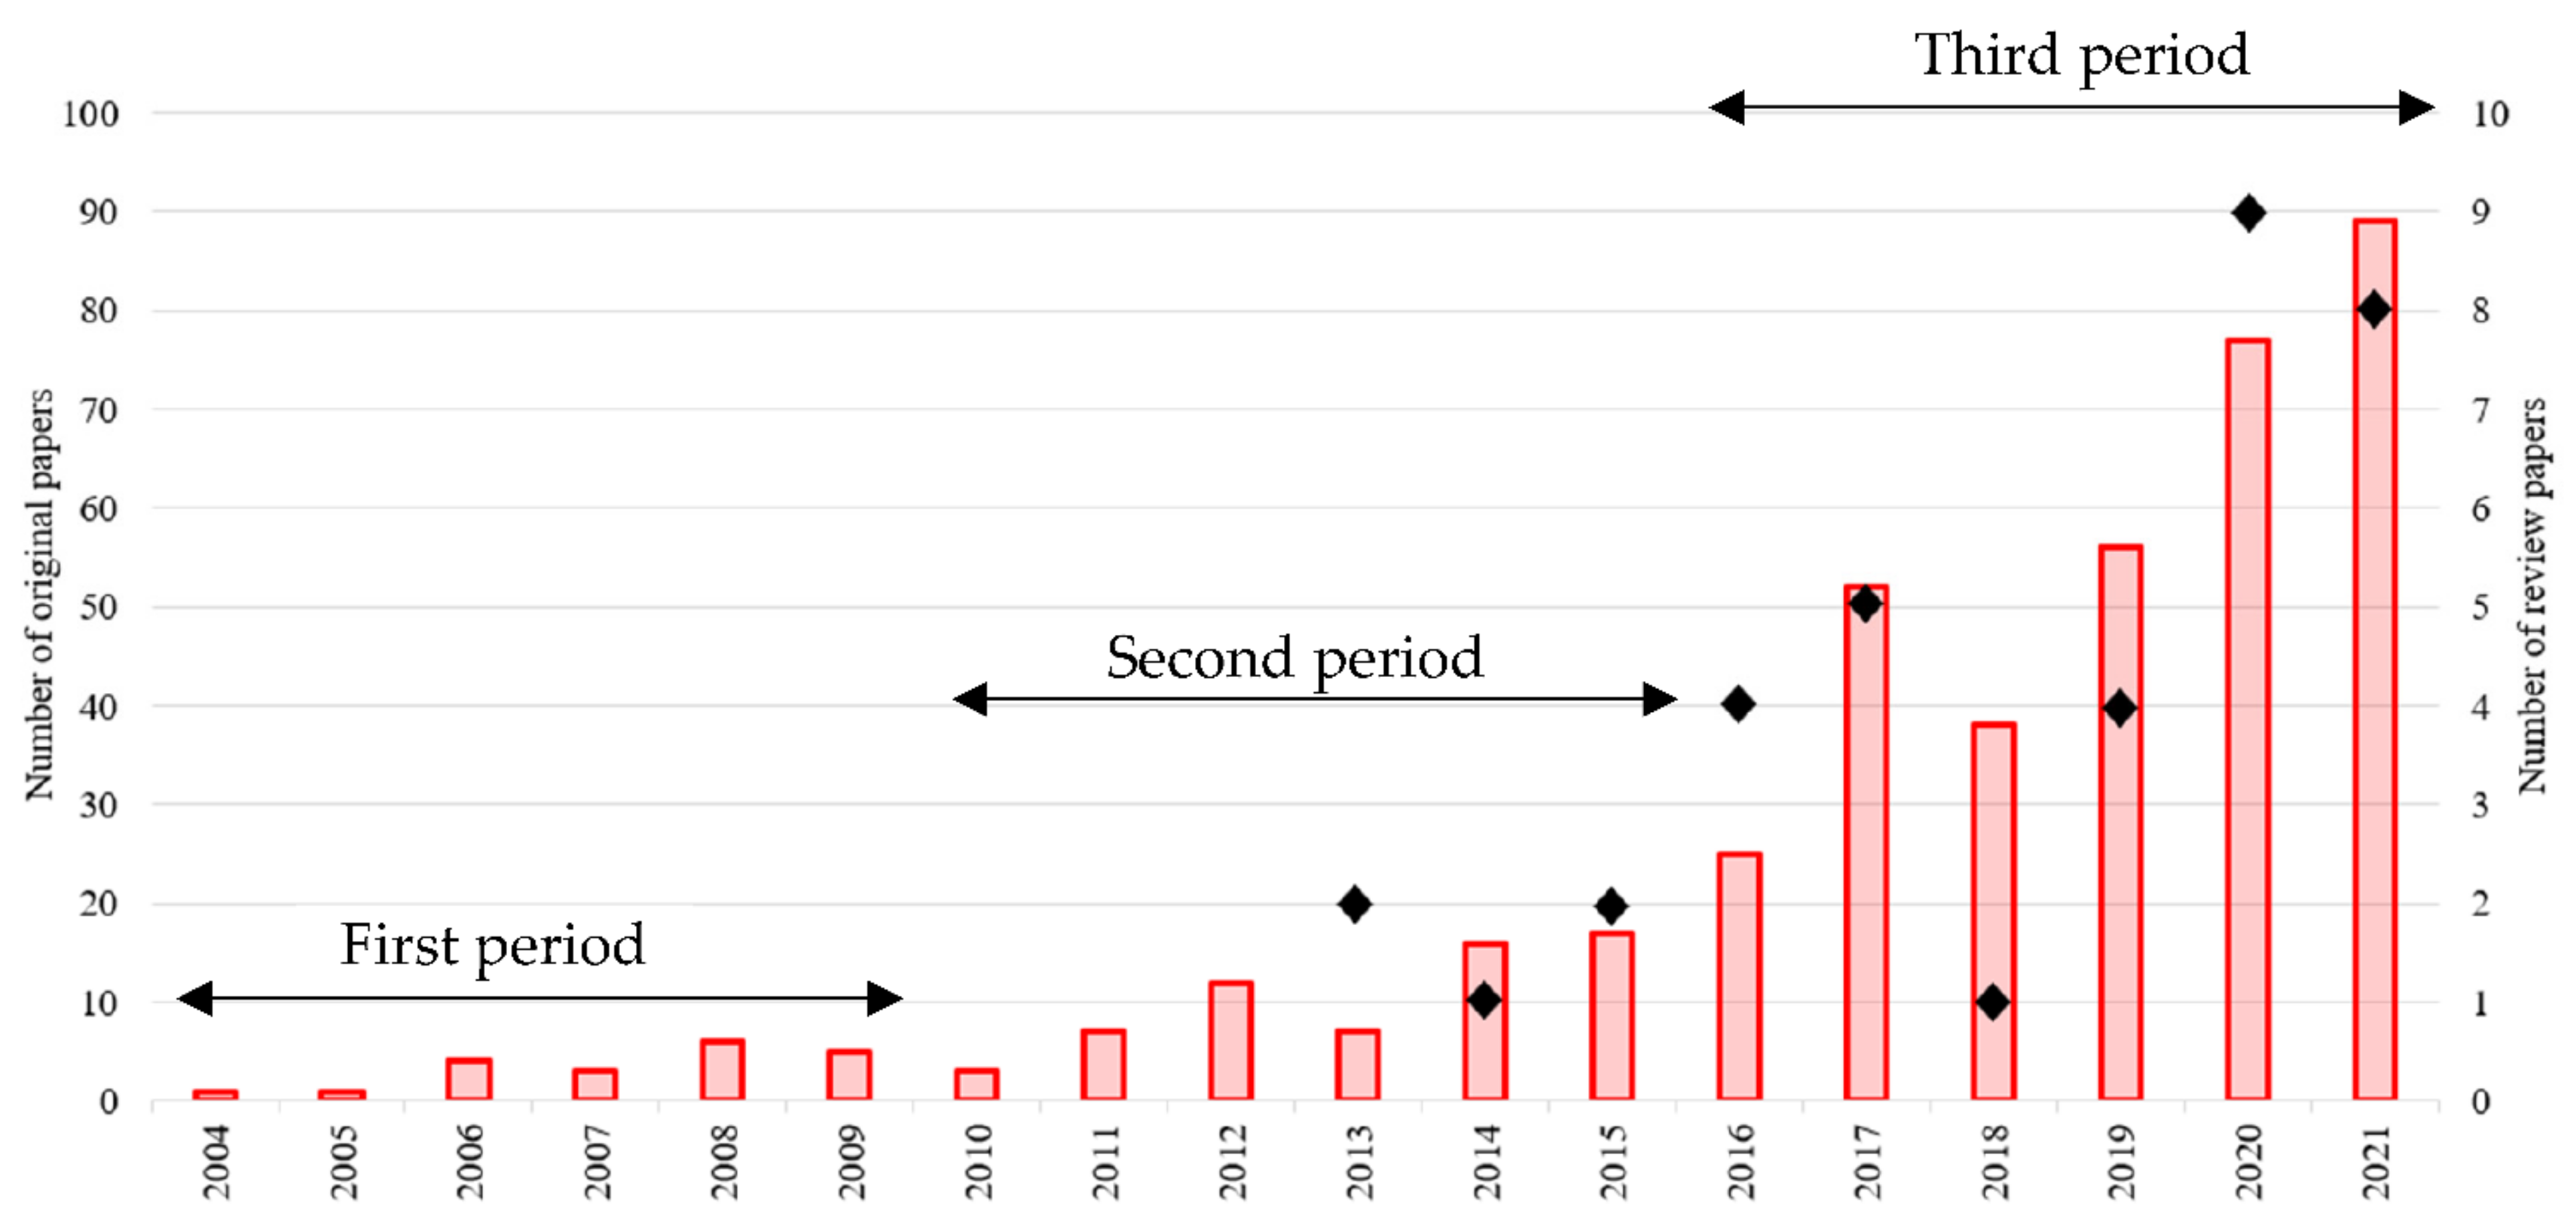
3.1. Publication Trends
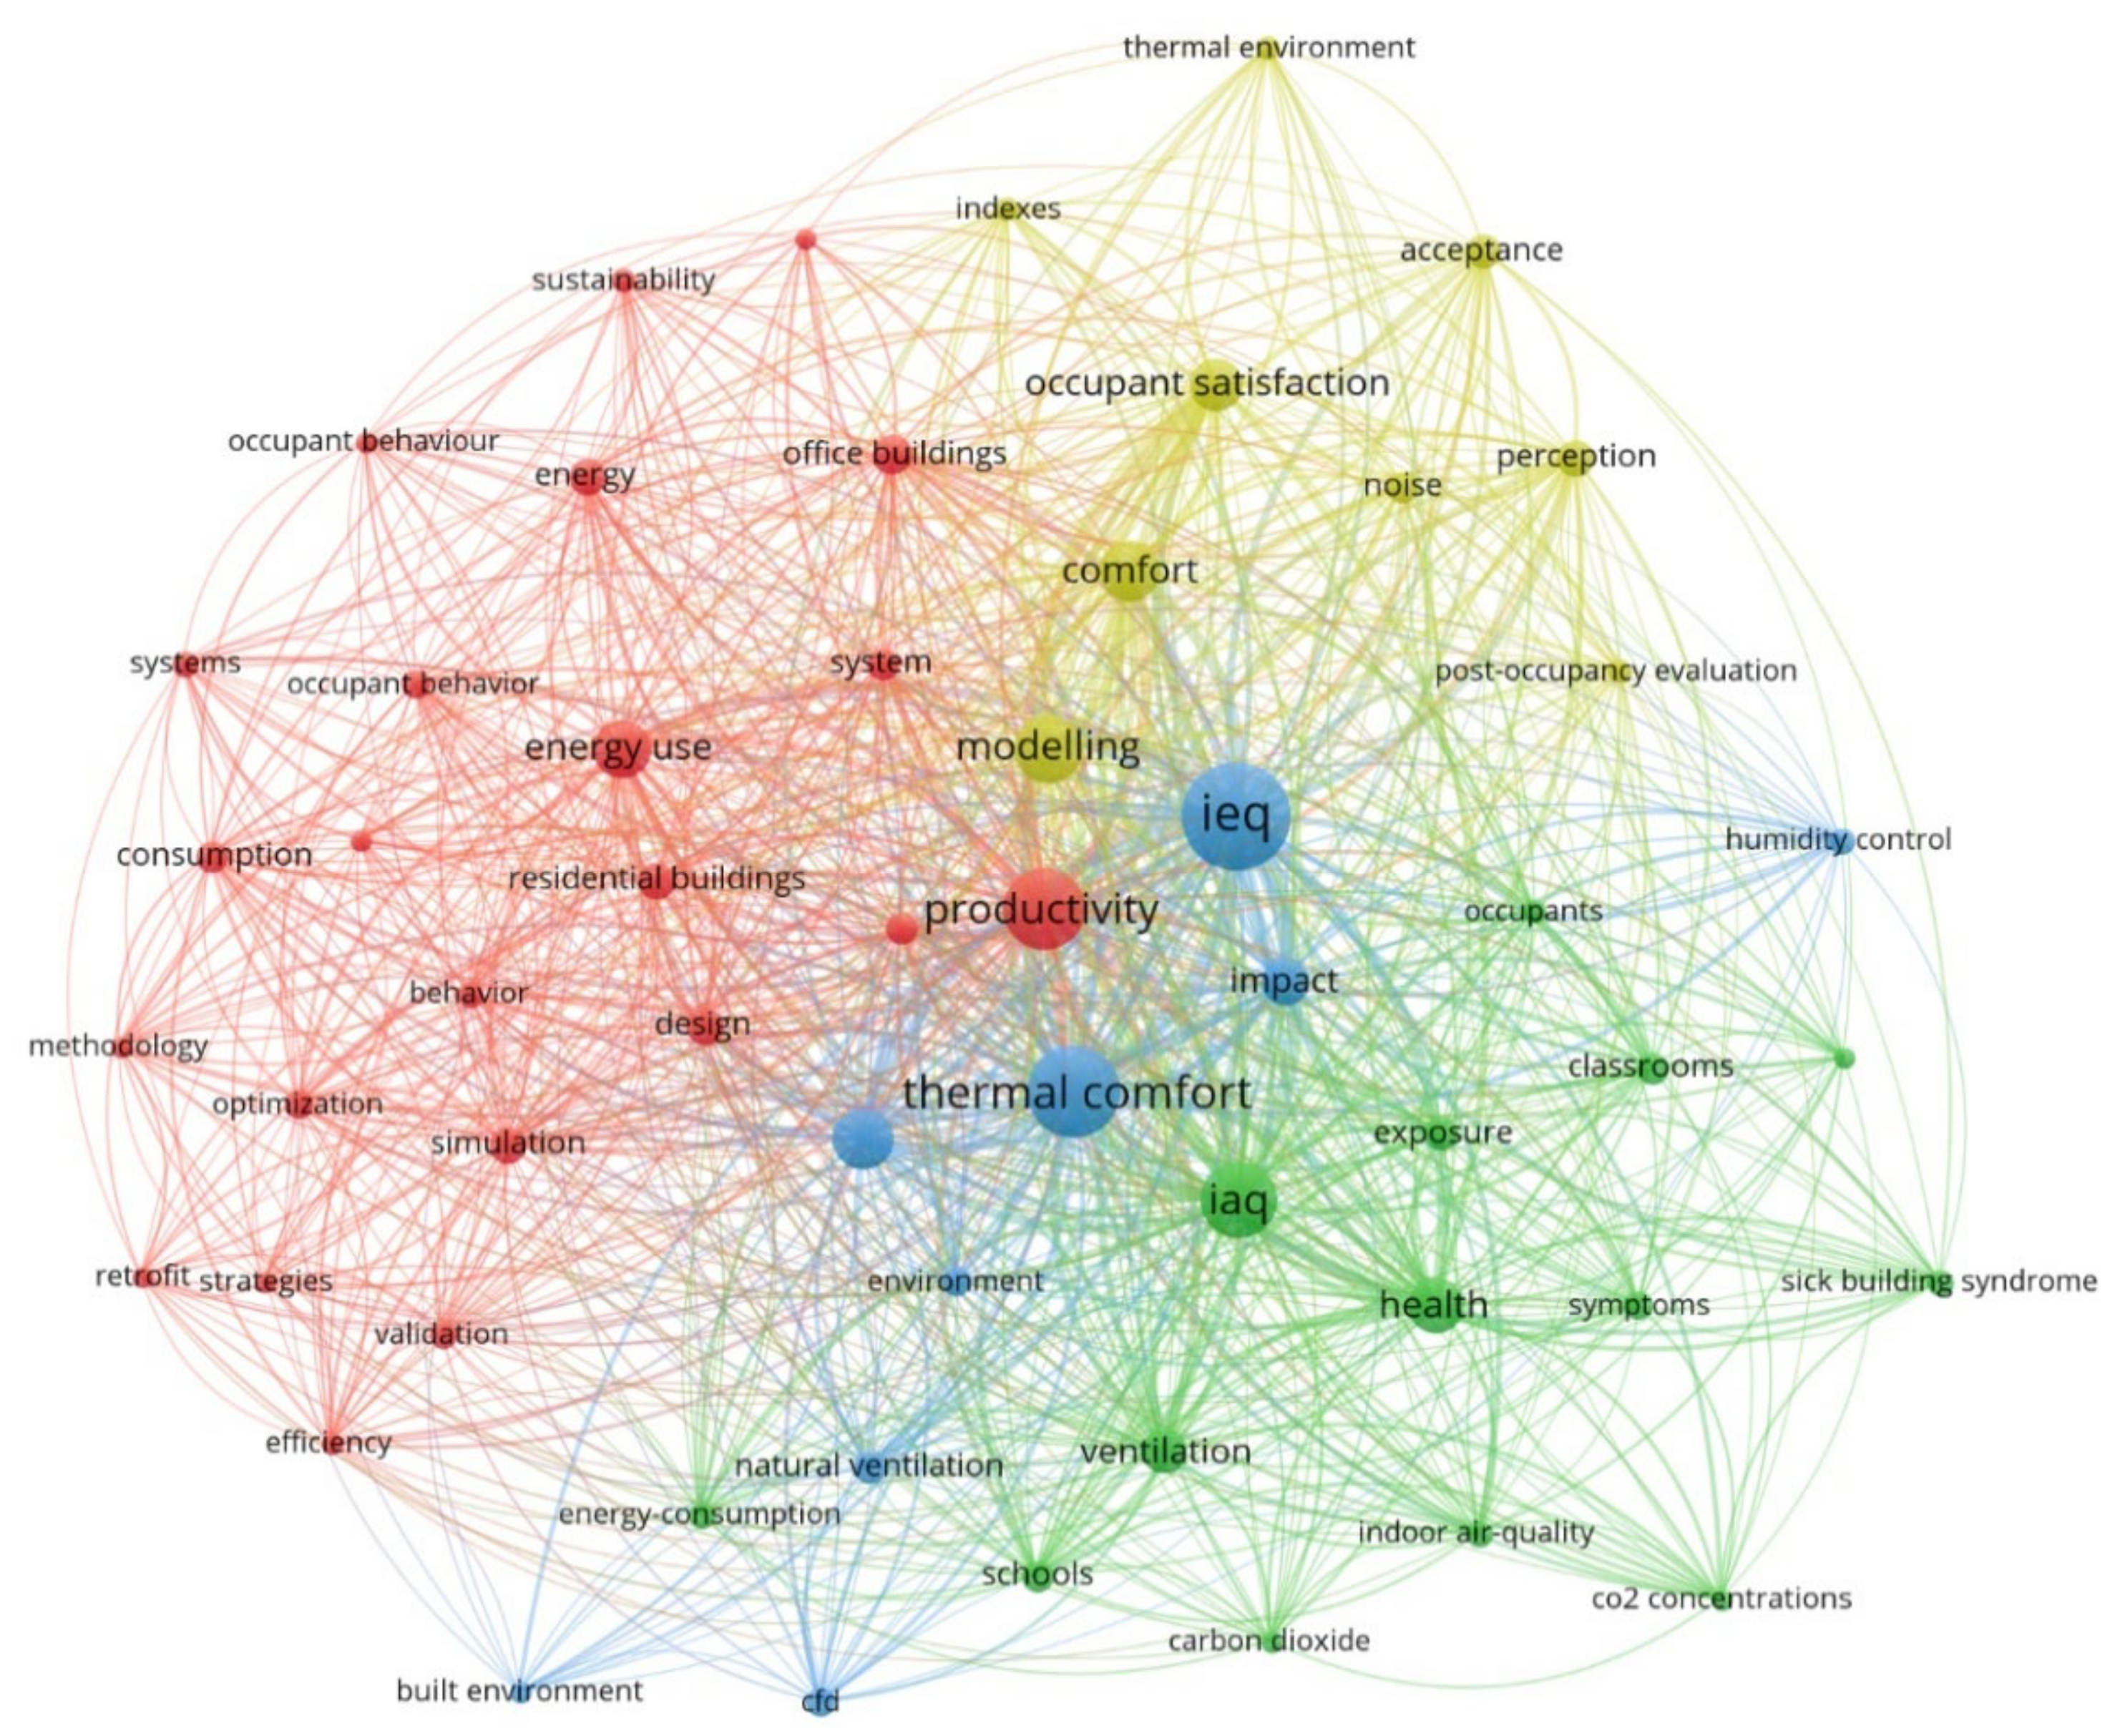
3.2. Analysis of High-Frequency Keywords
3.3. Prominent Journals
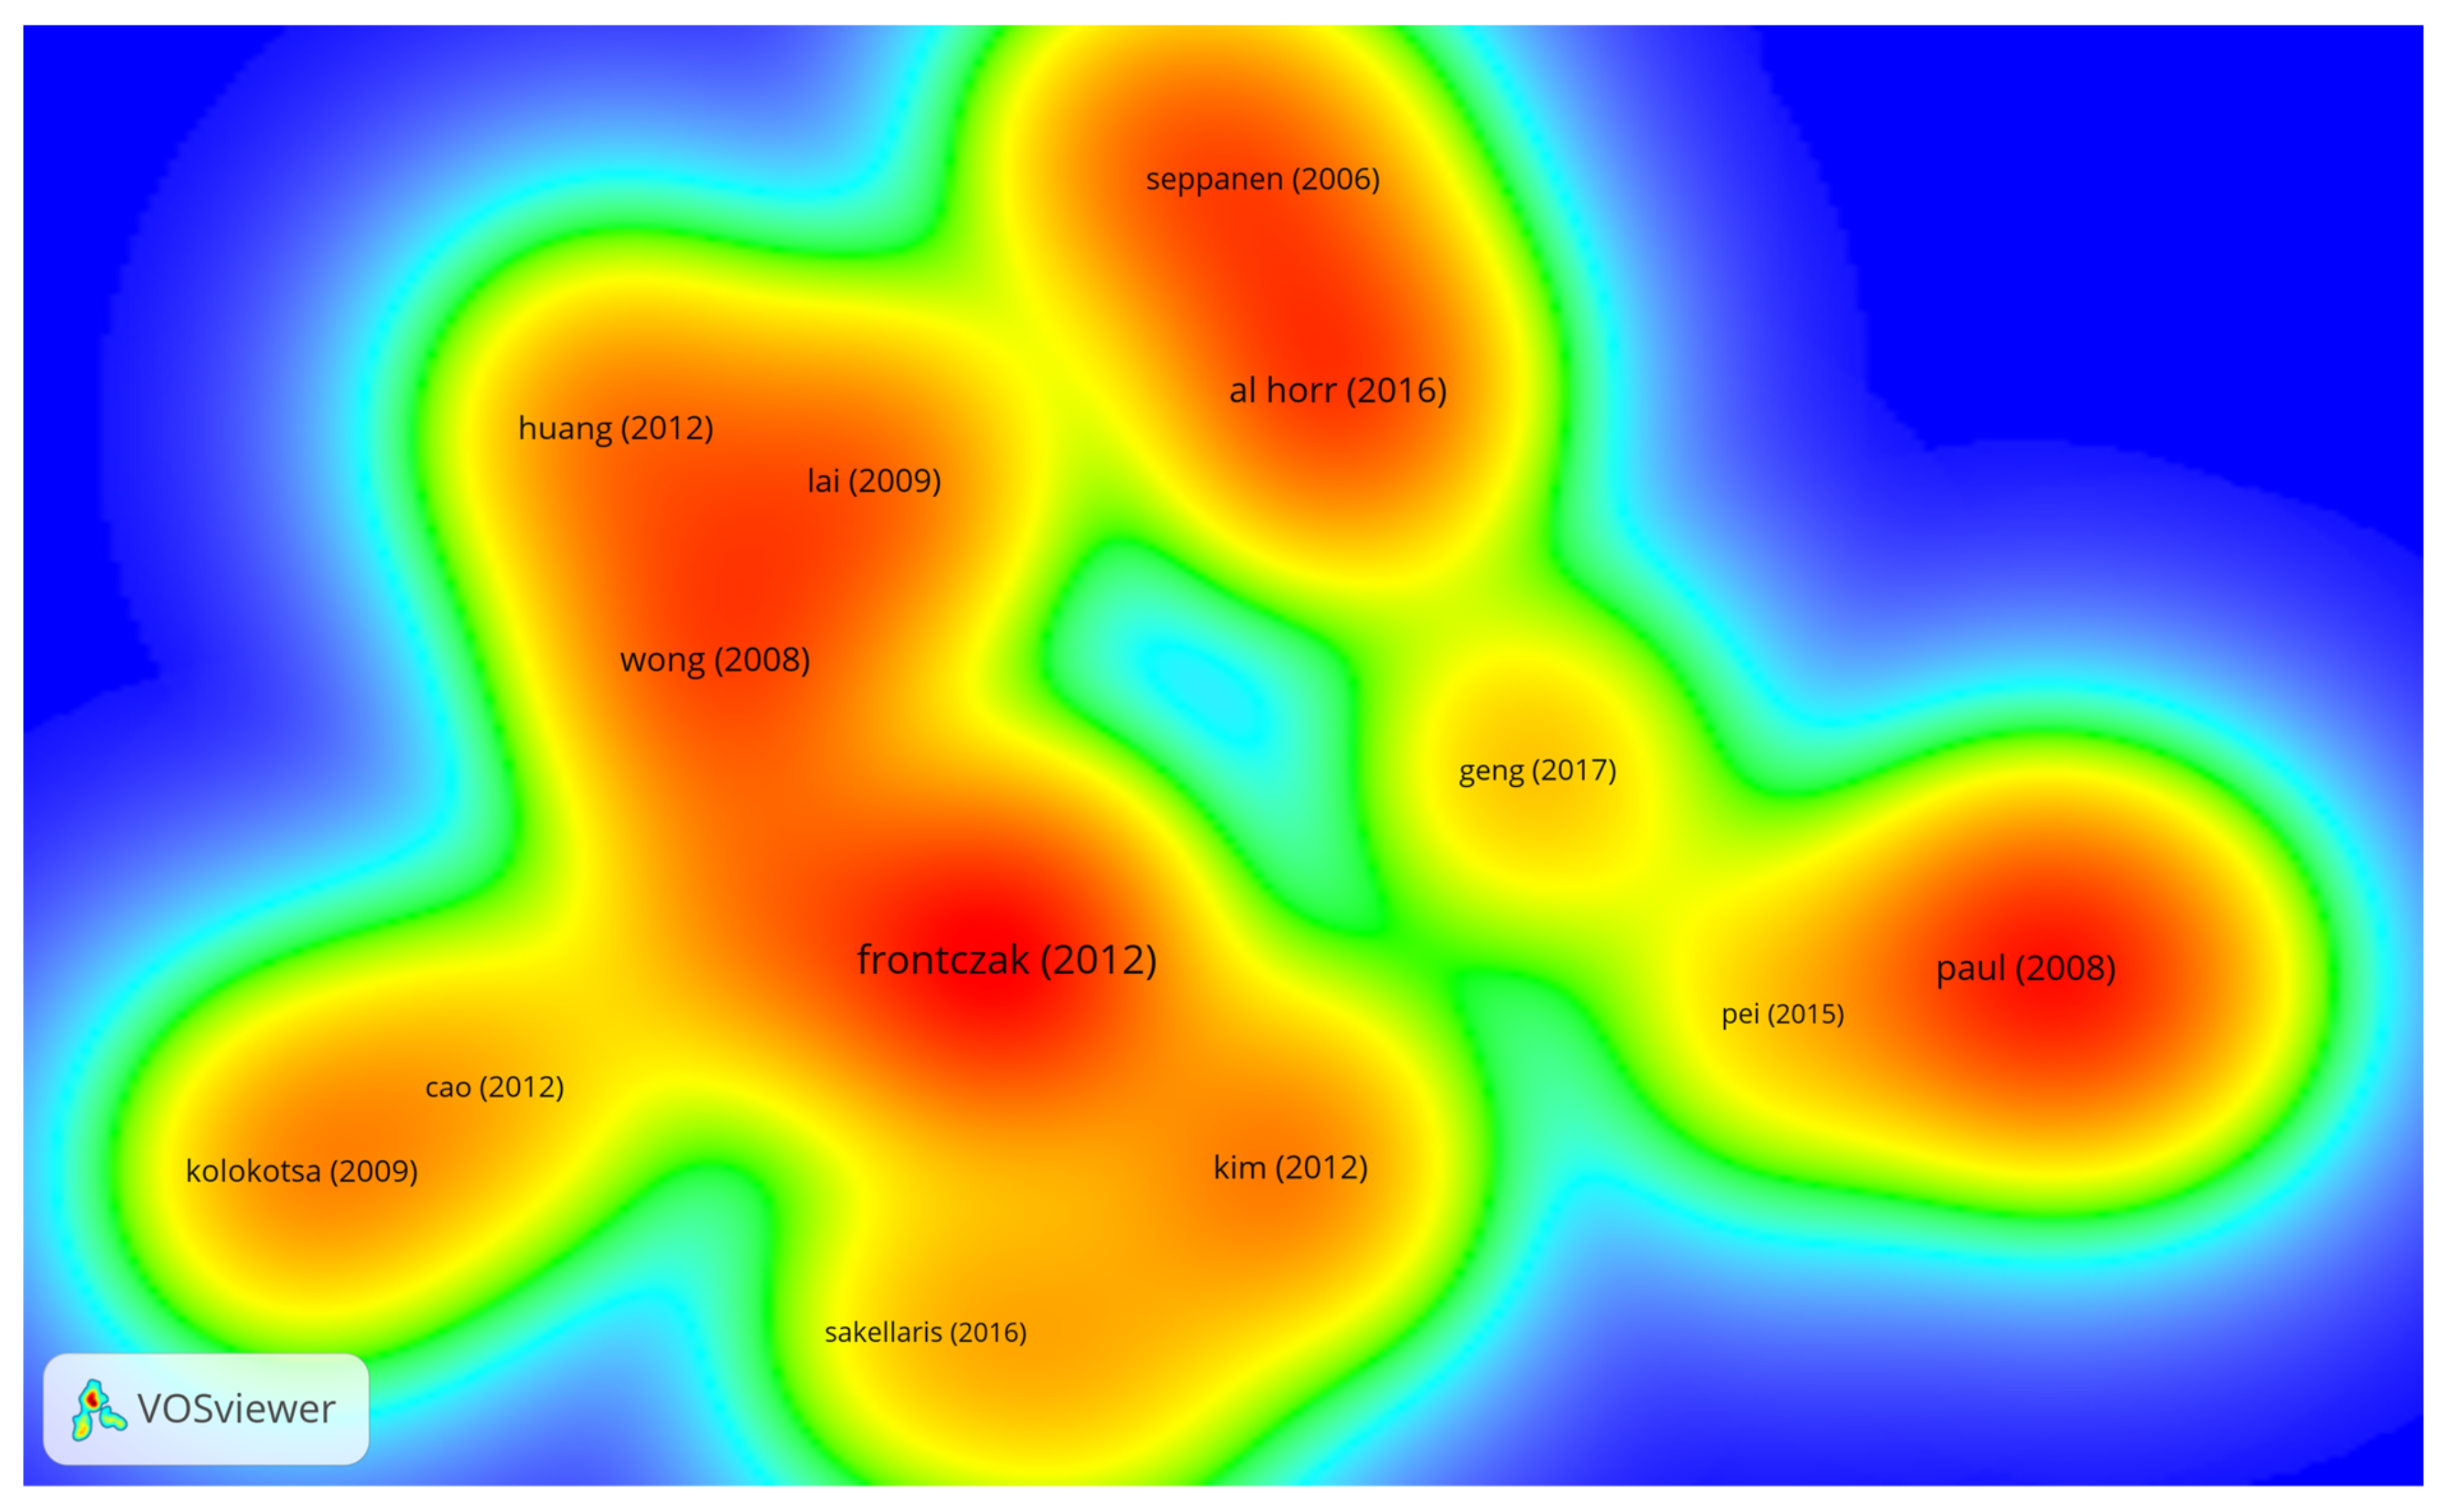
3.4. Prominent Publications

| Article | Title | Year | Citations | Average per Year Citations | Links |
|---|---|---|---|---|---|
| Frontczak et al. [46] | Quantitative relationships between occupant satisfaction and satisfaction aspects of indoor environmental quality and building design | 2012 | 238 | 23.8 | 8 |
| Al Horr et al. [10] | Occupant productivity and office indoor environment quality: A review of the literature | 2016 | 180 | 30 | 3 |
| Paul and Taylor [49] | A comparison of occupant comfort and satisfaction between a green building and a conventional building | 2008 | 175 | 12.5 | 3 |
| Wong et al. [38] | A multivariate-logistic model for acceptance of indoor environmental quality (IEQ) in offices | 2008 | 149 | 10.64 | 6 |
| Lai et al. [47] | An evaluation model for indoor environmental quality (IEQ) acceptance in residential buildings | 2009 | 132 | 10.15 | 7 |
| Kim and de Dear [39] | Non-linear relationships between individual IEQ factors and overall workspace satisfaction | 2012 | 127 | 12.7 | 6 |
| Huang et al. [48] | A study on the effects of thermal, luminous and acoustic environments on indoor environmental comfort in offices | 2012 | 119 | 11.9 | 2 |
| Kolokotsa et al. [50] | Predictive control techniques for energy and indoor environmental quality management in buildings | 2009 | 112 | 8.62 | 1 |
| Seppanen and Fisk [51] | Some quantitative relations between indoor environmental quality and work performance or health | 2006 | 107 | 6.69 | 2 |
| Heinzerling et al. [14] | Indoor environmental quality assessment models: A literature review and a proposed weighting and classification scheme | 2013 | 106 | 11.78 | 5 |
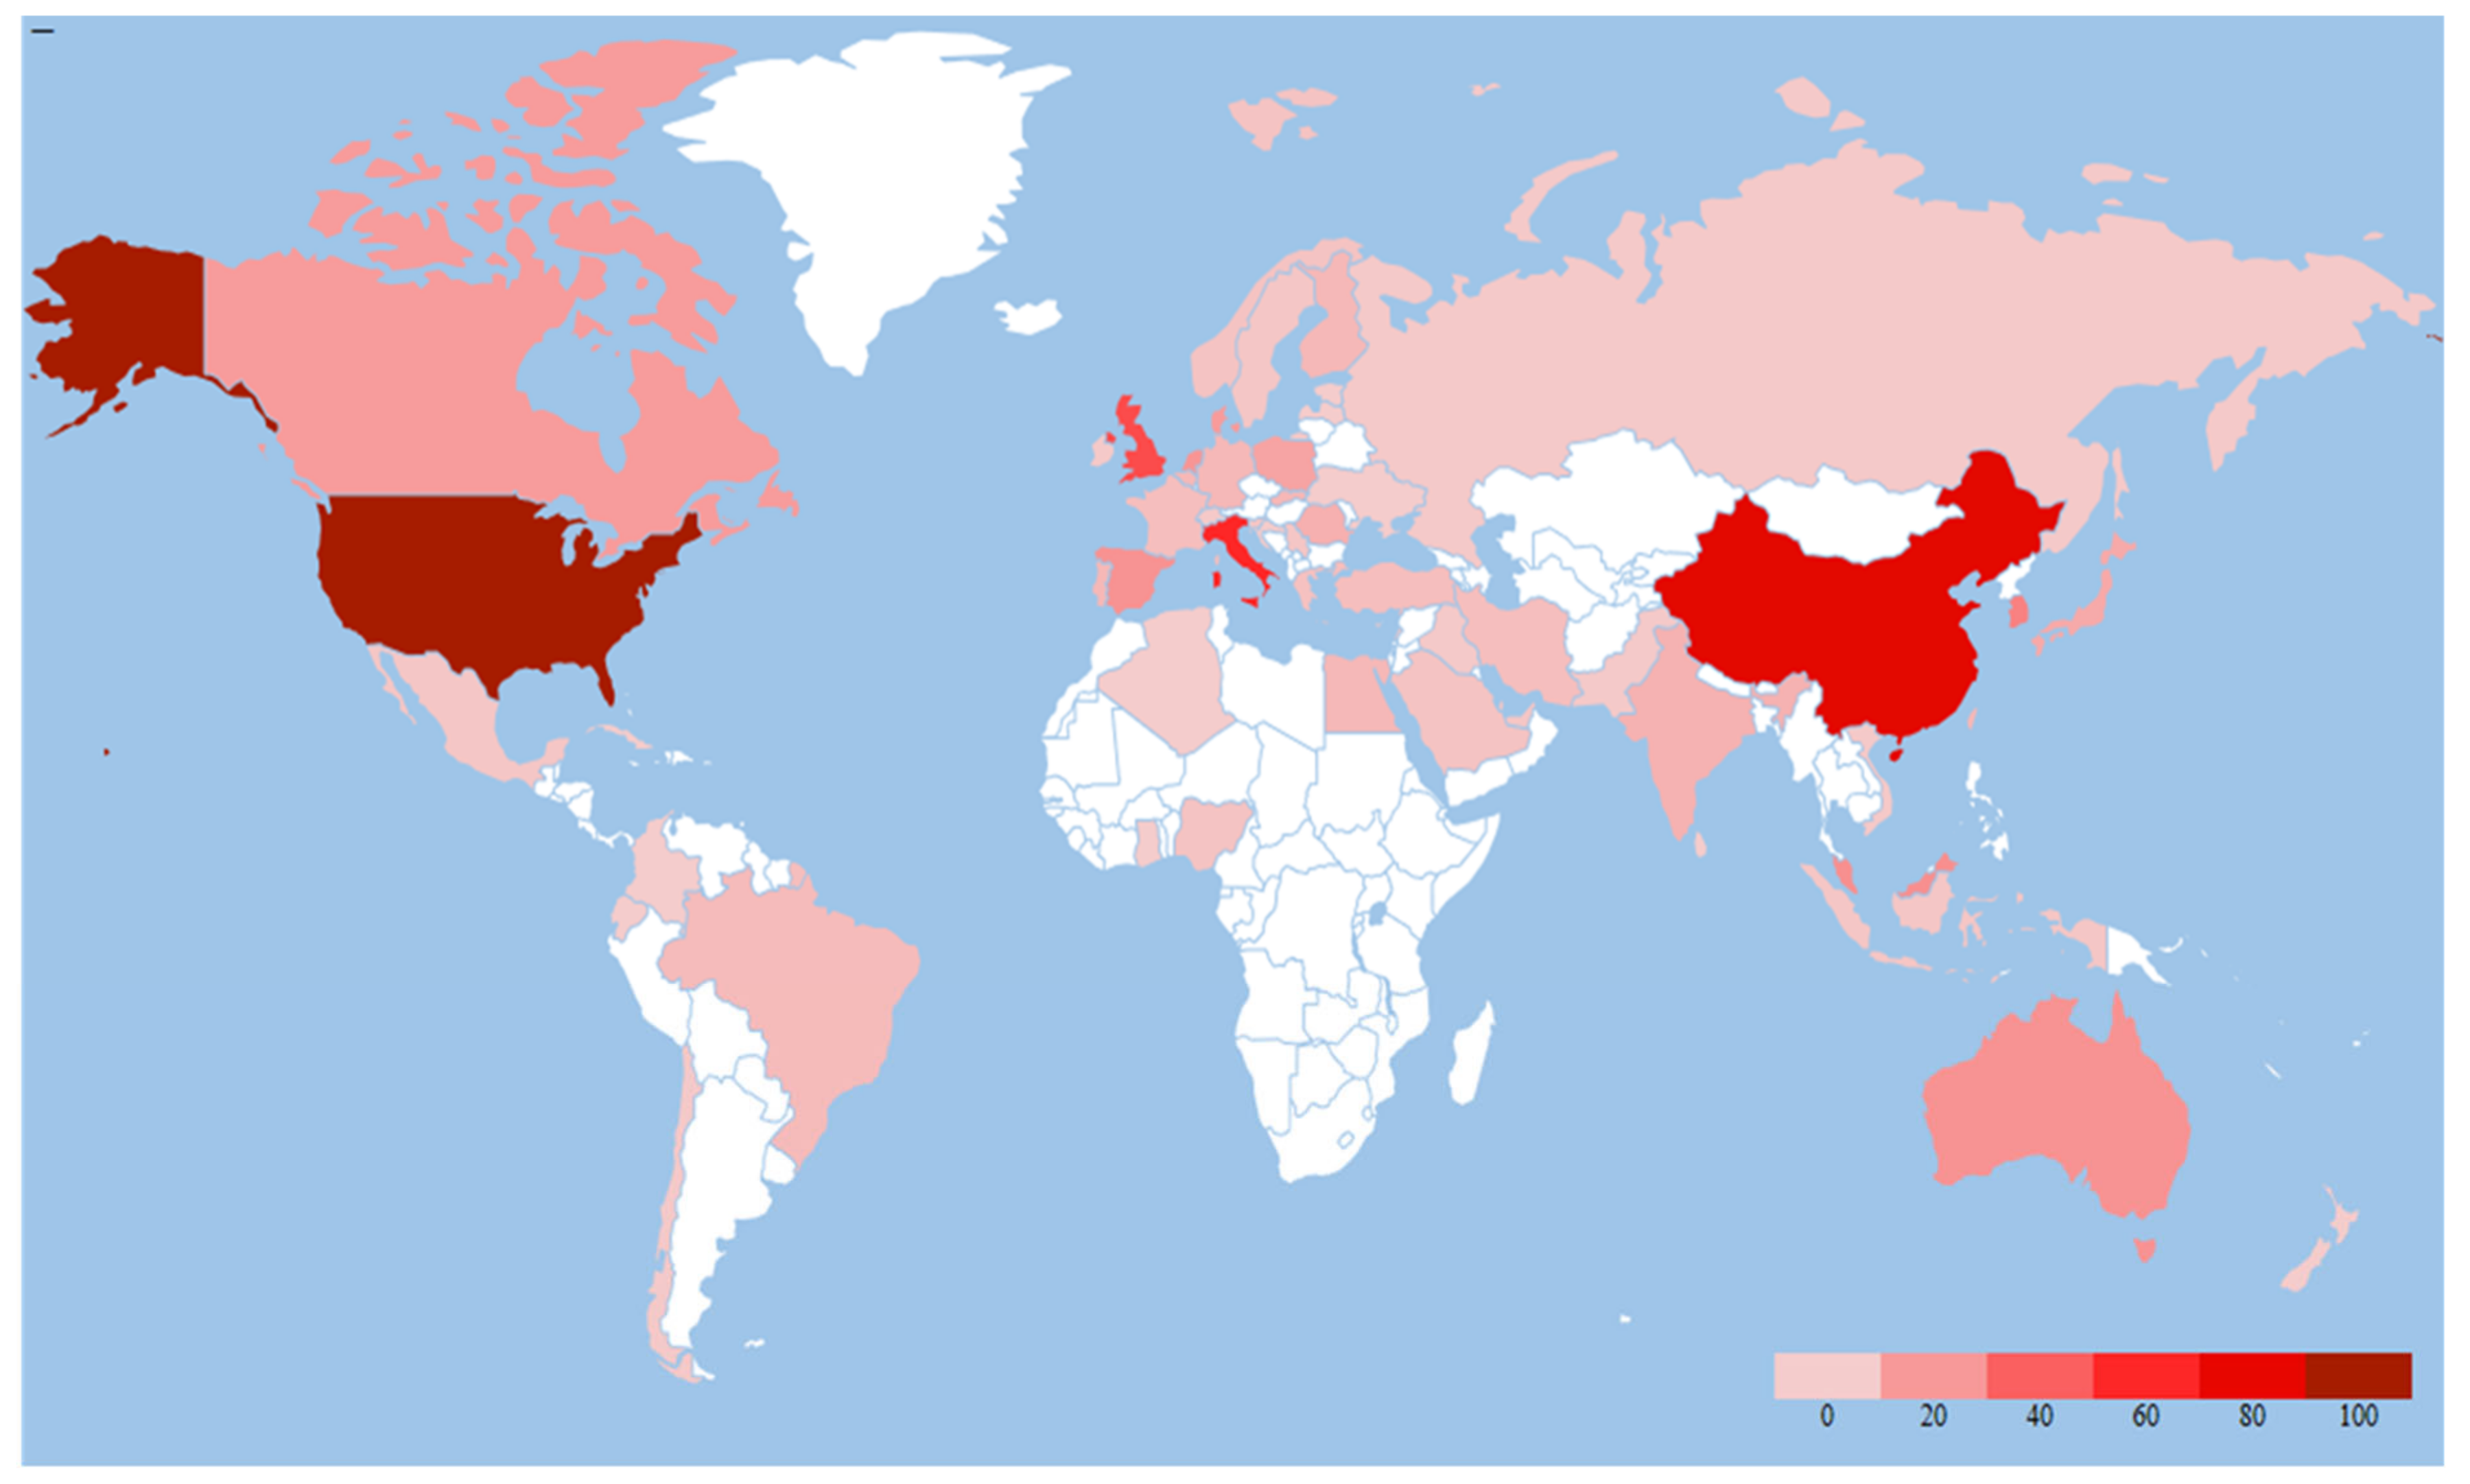
3.5. Active Countries in IEQMI Research
3.6. Prominent Institutions in IEQMI Research
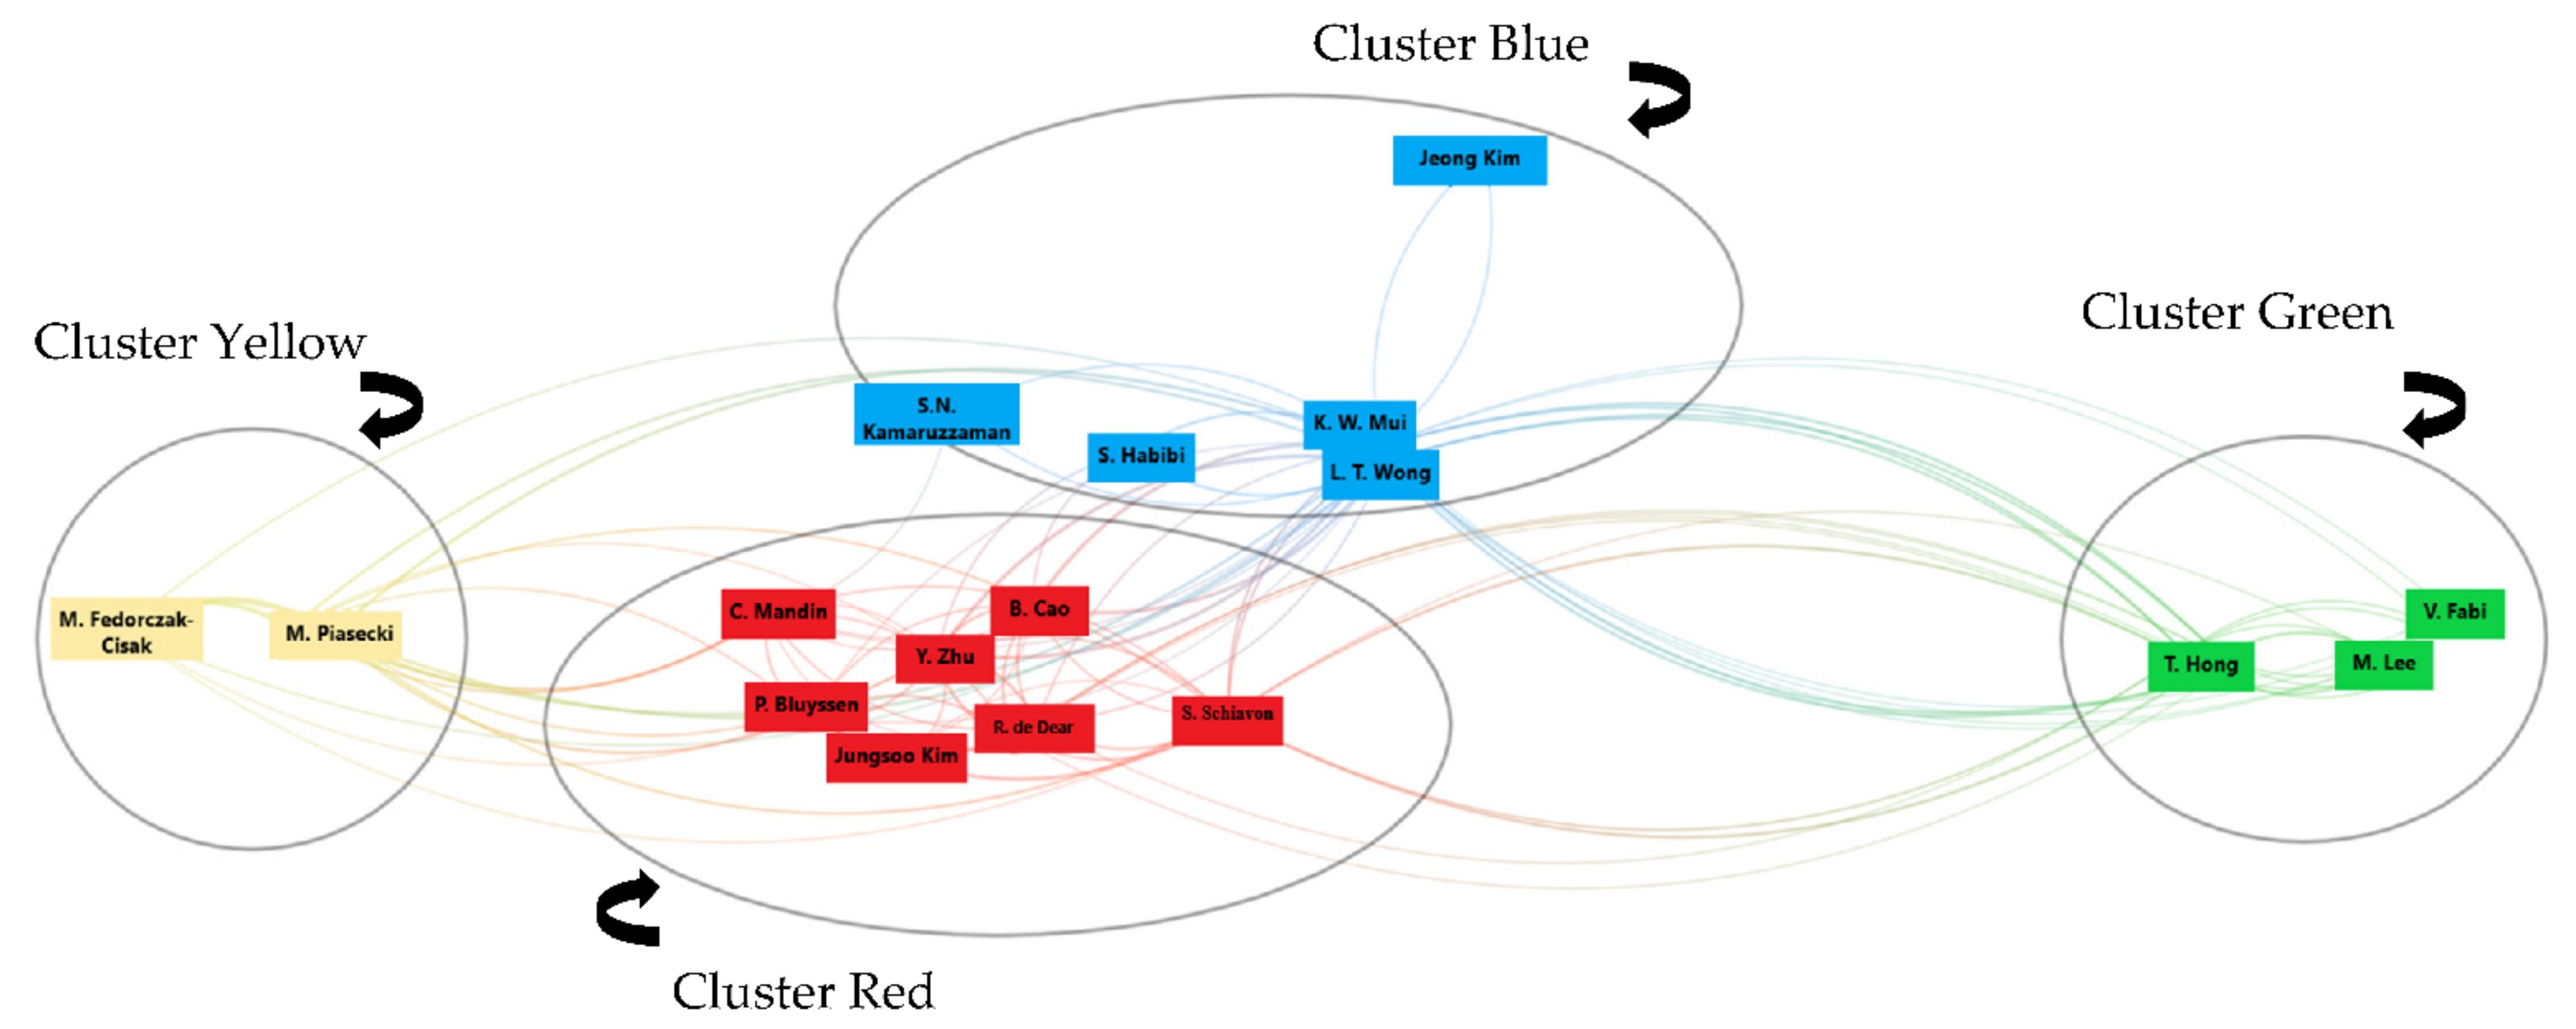
3.7. Analysis of Author Involvement
3.7.1. Productive Authors Analysis
3.7.2. Contribution Analysis
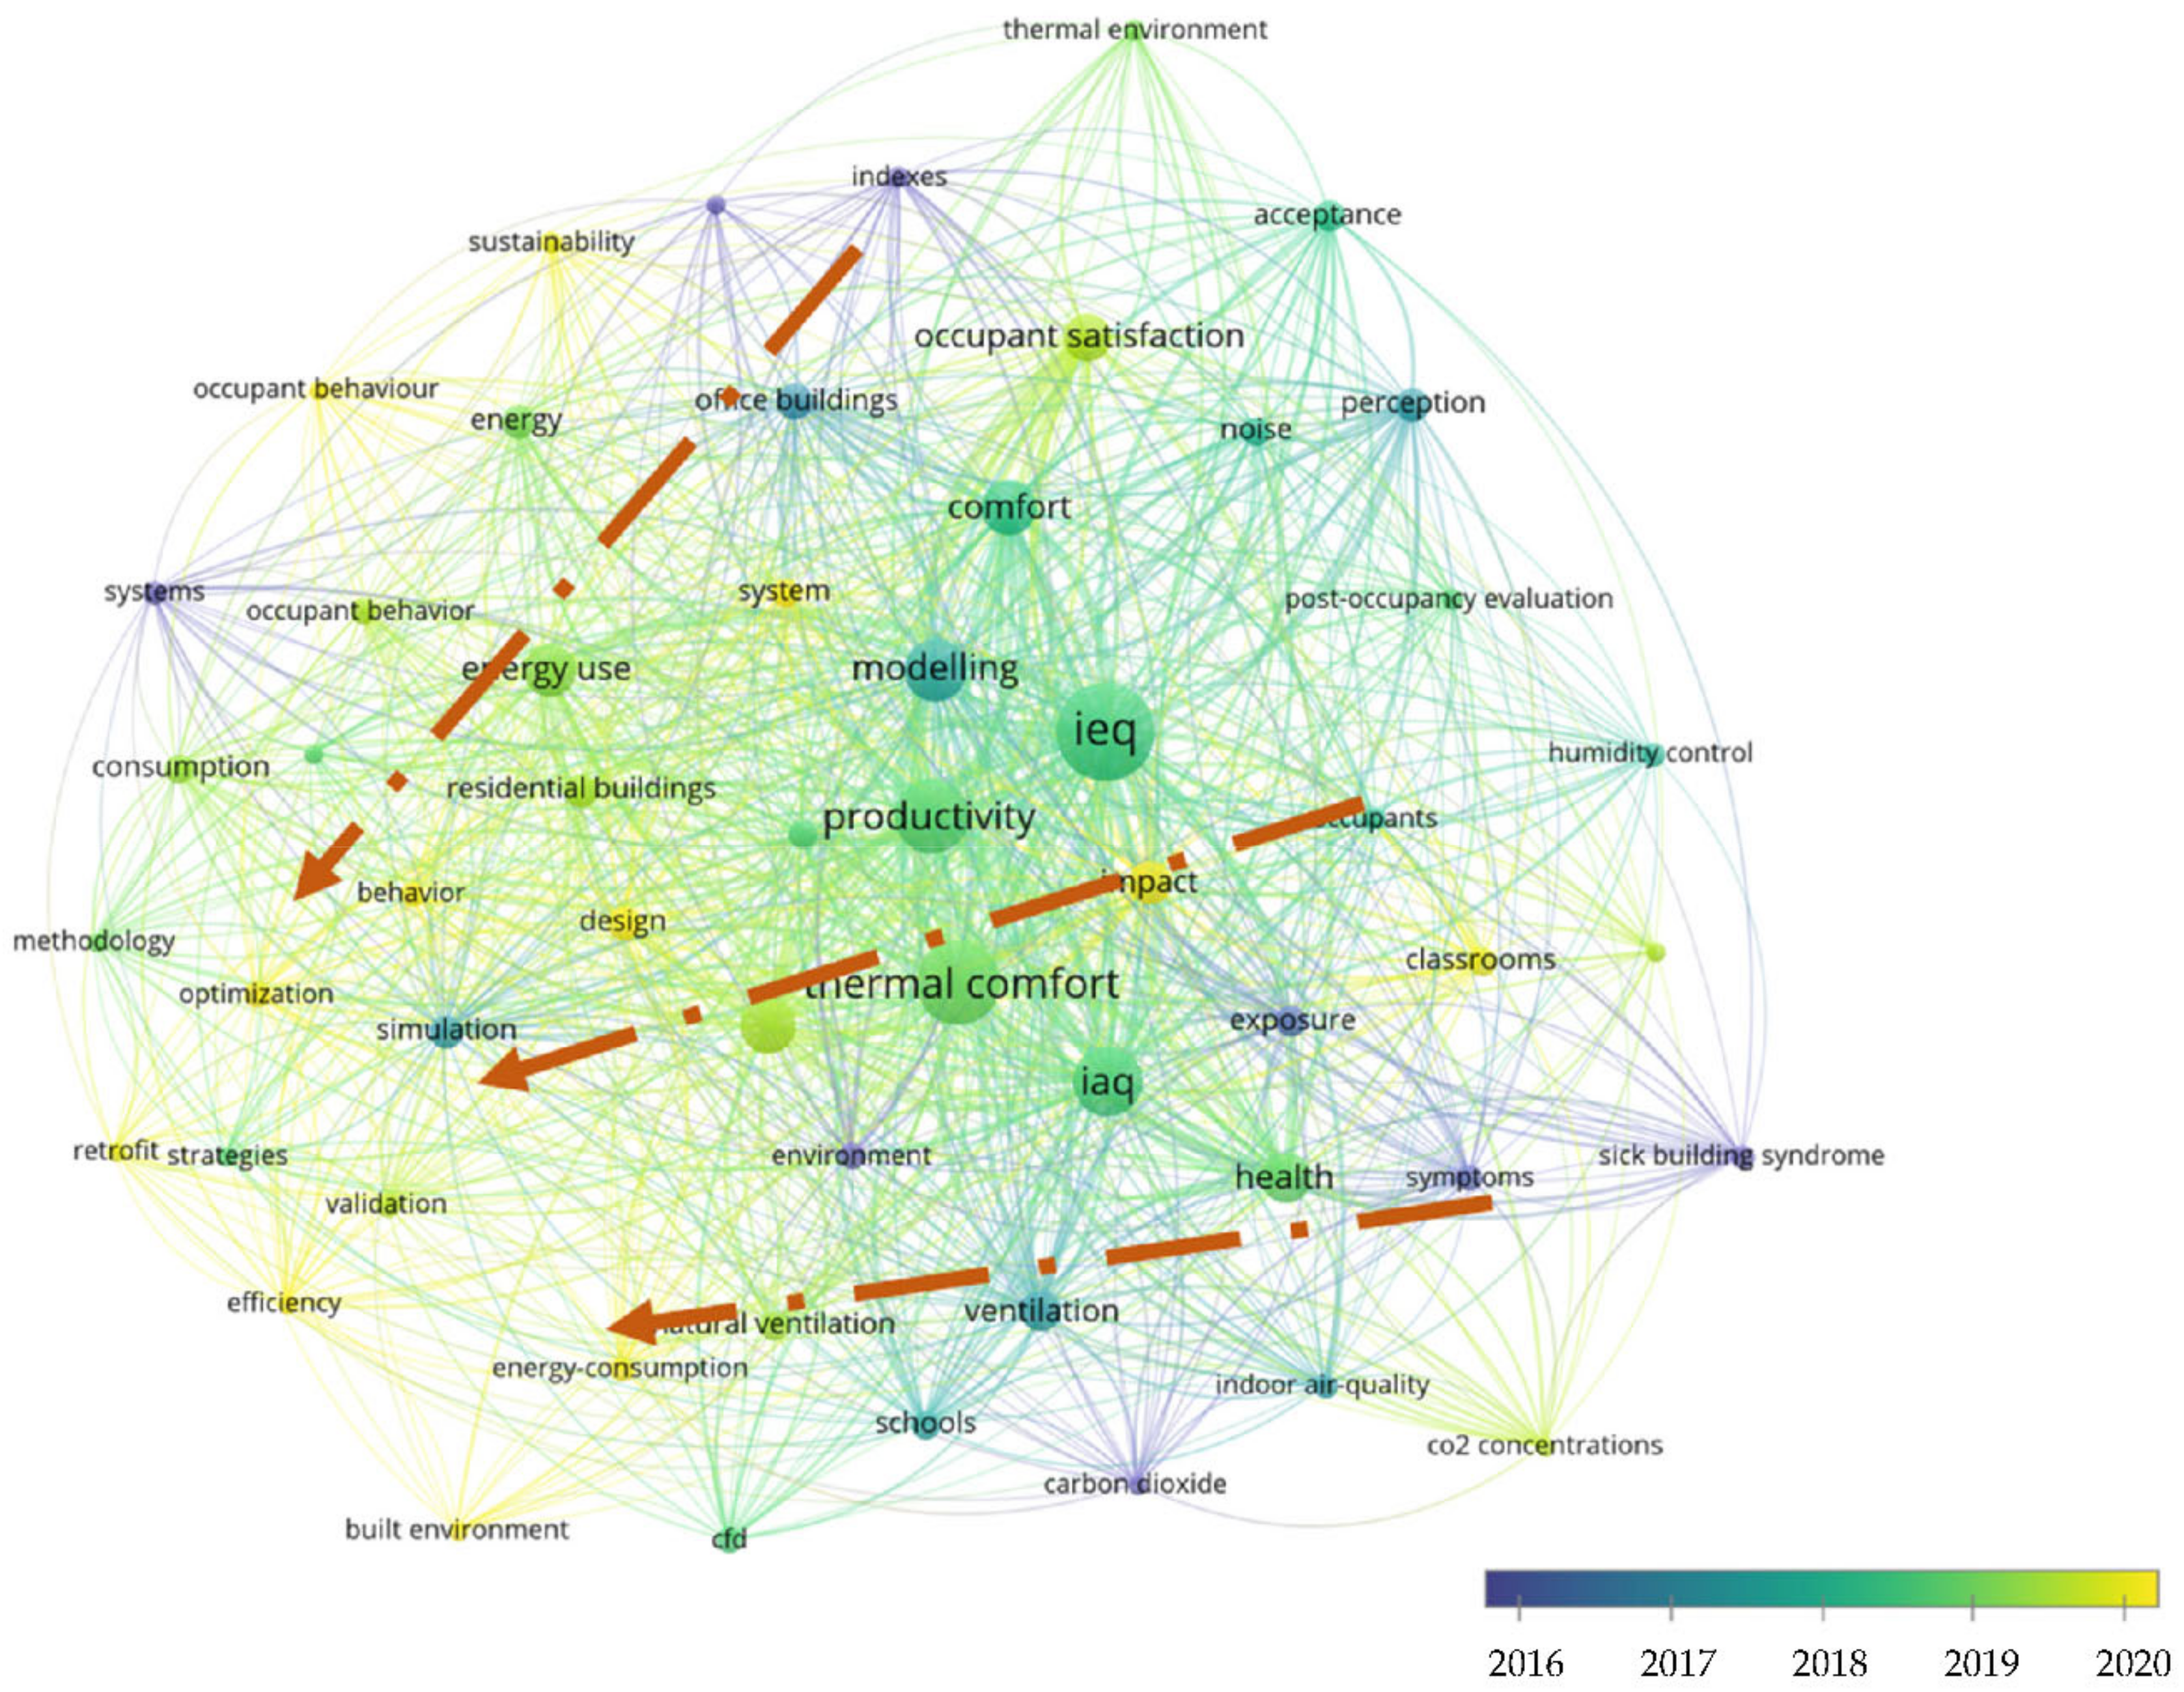
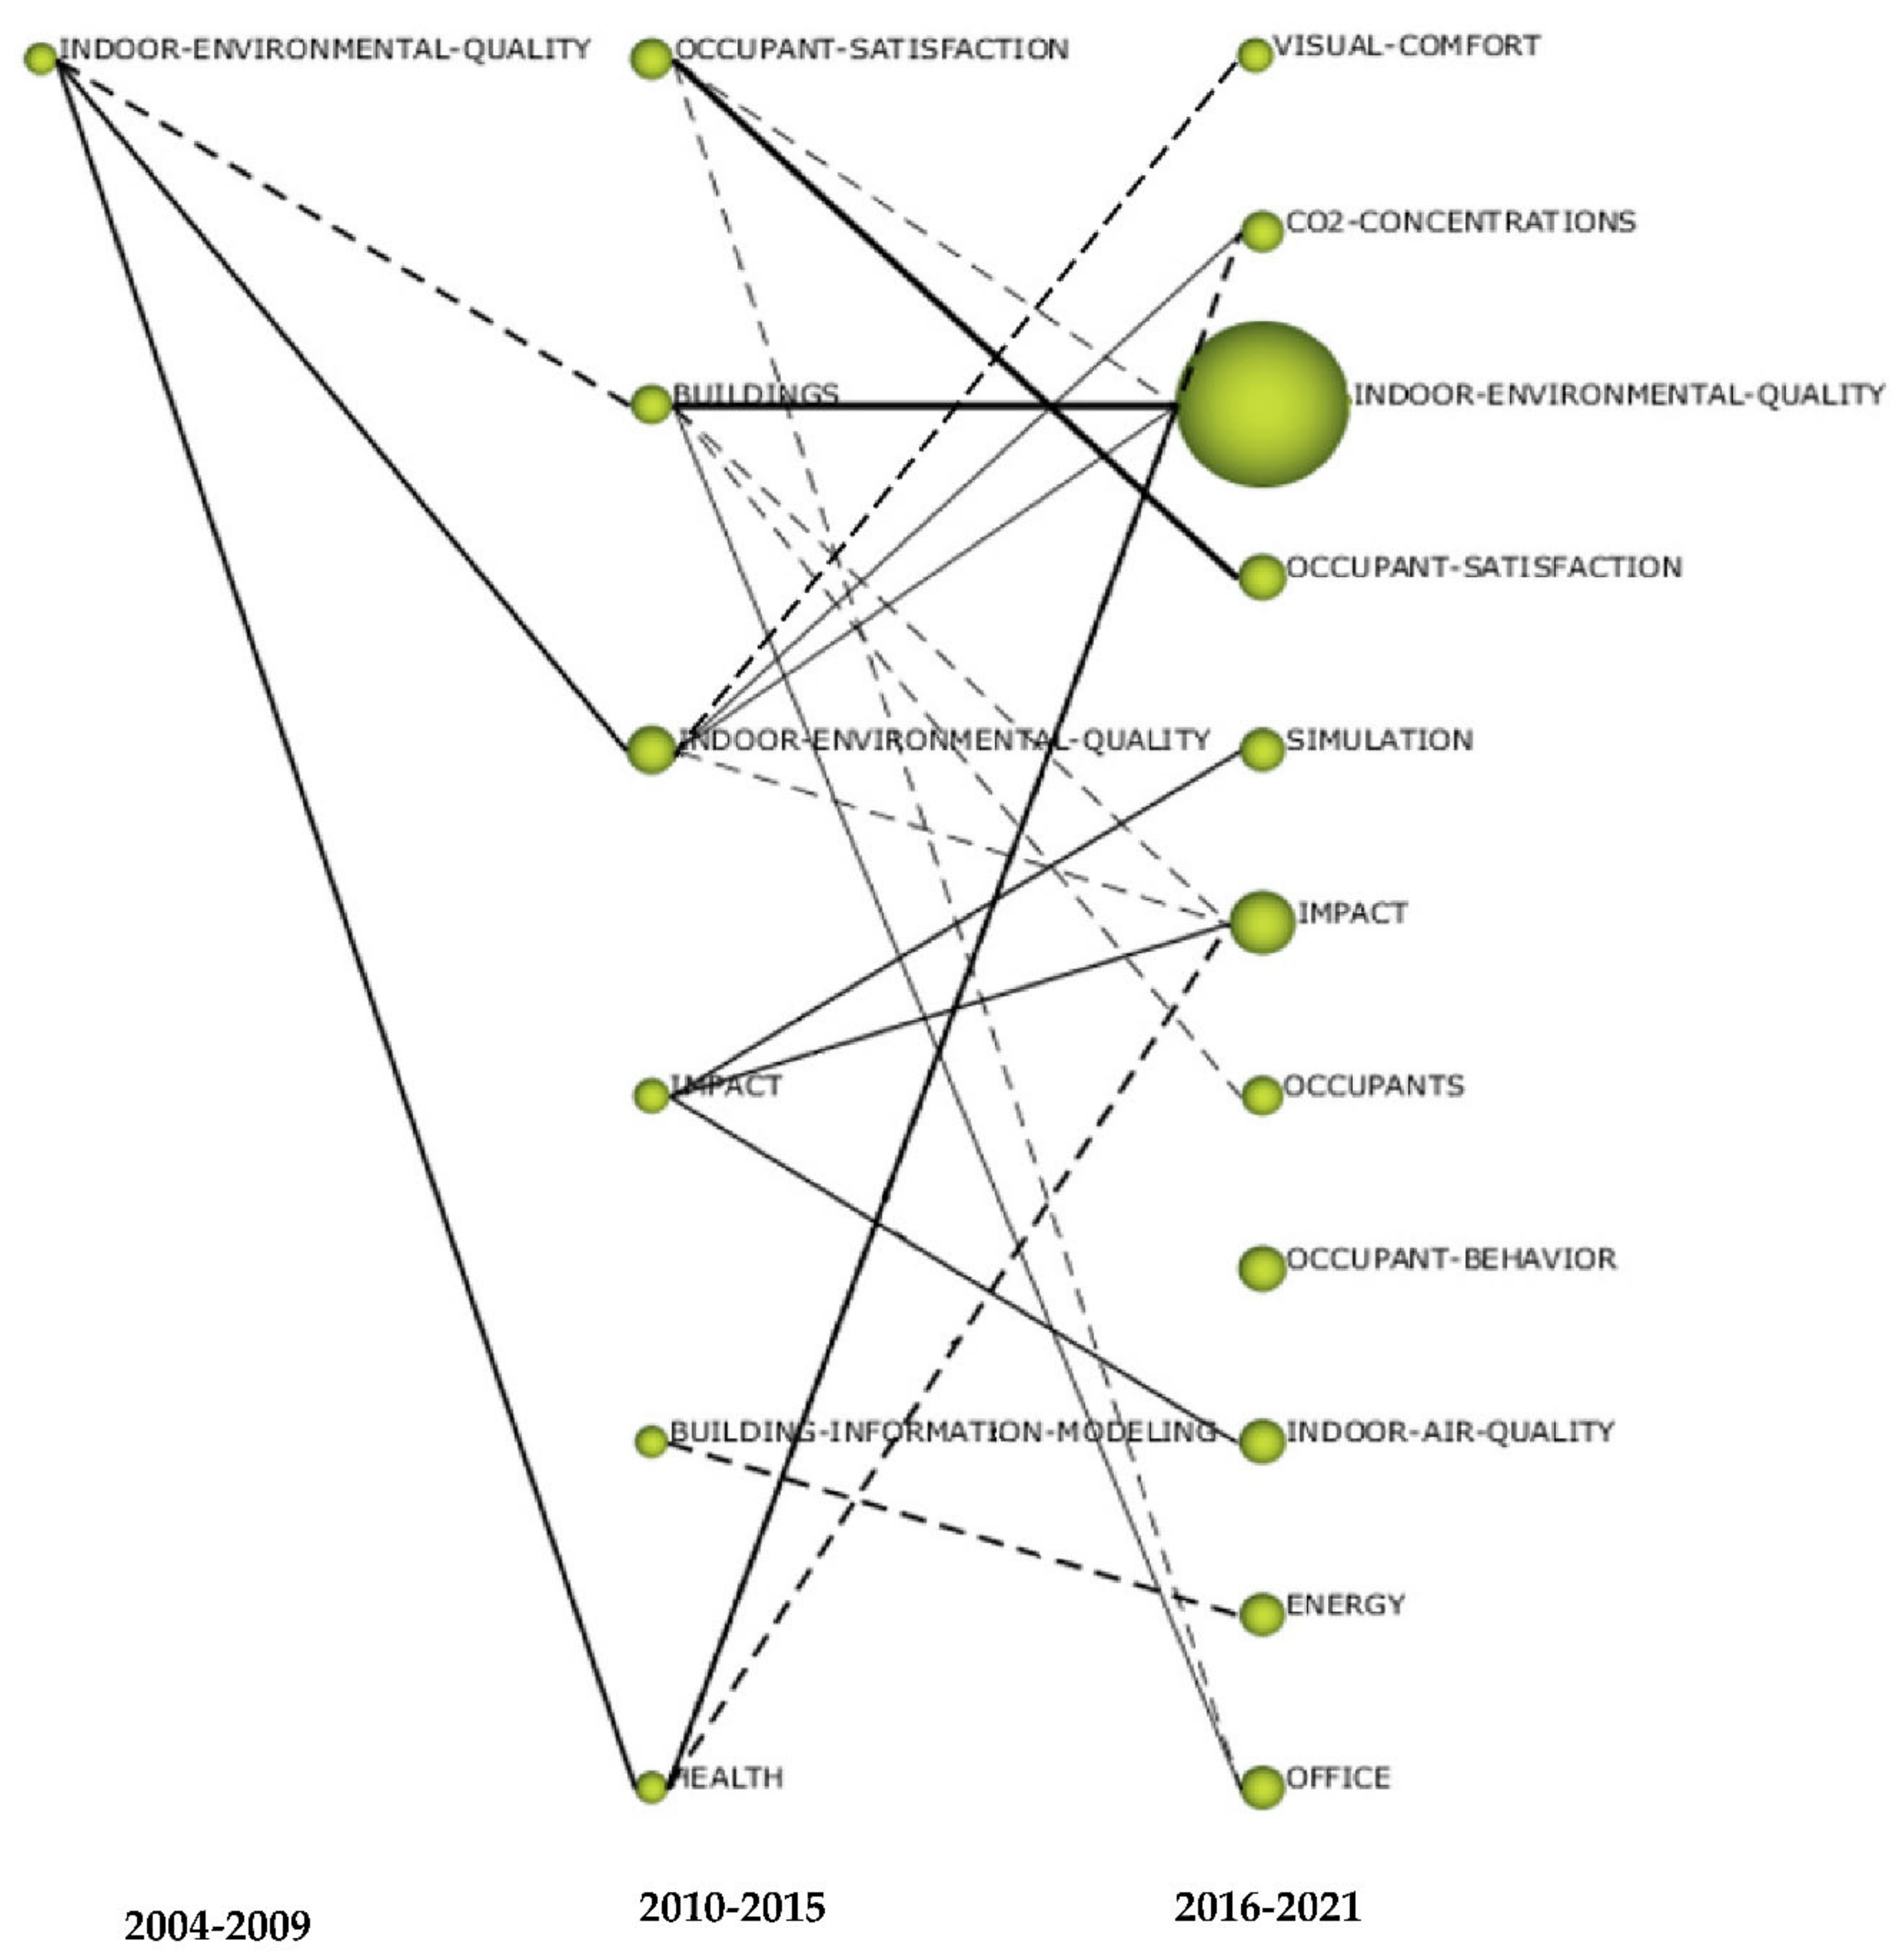
3.8. Keyword Changes Analysis
4. Discussion
4.1. Thermal Comfort and Energy Efficiency
4.2. Occupant Perception and Satisfaction
4.3. IAQ and Health Issues
4.4. Methods and Procedures
5. Conclusions
Author Contributions
Funding
Institutional Review Board Statement
Informed Consent Statement
Data Availability Statement
Conflicts of Interest
References
- Warwicker, B. 15-Desiccant materials for moisture control in buildings. In Materials for Energy Efficiency and Thermal Comfort in Buildings; Hall, M.R., Ed.; Woodhead Publishing: Cambridge, UK, 2010; pp. 365–383. [Google Scholar] [CrossRef]
- Mujan, I.; Anđelković, A.S.; Munćan, V.; Kljajić, M.; Ružić, D. Influence of indoor environmental quality on human health and productivity—A review. J. Clean. Prod. 2019, 217, 646–657. [Google Scholar] [CrossRef]
- Geng, Y.; Ji, W.; Lin, B.; Zhu, Y. The impact of thermal environment on occupant IEQ perception and productivity. Build. Environ. 2017, 121, 158–167. [Google Scholar] [CrossRef]
- Residovic, C. The New NABERS Indoor Environment tool—The Next Frontier for Australian Buildings. Procedia Eng. 2017, 180, 303–310. [Google Scholar] [CrossRef]
- Roumi, S.; Zhang, F.; Stewart, R.A.; Santamouris, M. Commercial building indoor environmental quality models: A critical review. Energy Build. 2022, 263, 112033. [Google Scholar] [CrossRef]
- Balaras, C.A.; Droutsa, K.; Argiriou, A.A.; Asimakopoulos, D.N. EPIQR surveys of apartment buildings in Europe. Energy Build. 2000, 31, 111–128. [Google Scholar] [CrossRef]
- Bluyssen, P.M. EPIQR and IEQ: Indoor environment quality in European apartment buildings. Energy Build. 2000, 31, 103–110. [Google Scholar] [CrossRef]
- Dodge, R.; Daly, A.; Huyton, J.; Sanders, L. The challenge of defining wellbeing. Int. J. Wellbeing 2012, 2, 222–235. [Google Scholar] [CrossRef] [Green Version]
- Bluyssen, P.M.; Janssen, S.; van den Brink, L.H.; de Kluizenaar, Y. Assessment of wellbeing in an indoor office environment. Build. Environ. 2011, 46, 2632–2640. [Google Scholar] [CrossRef]
- Al Horr, Y.; Arif, M.; Kaushik, A.; Mazroei, A.; Katafygiotou, M.; Elsarrag, E. Occupant productivity and office indoor environment quality: A review of the literature. Build. Environ. 2016, 105, 369–389. [Google Scholar] [CrossRef] [Green Version]
- Frontczak, M.; Wargocki, P. Literature survey on how different factors influence human comfort in indoor environments. Build. Environ. 2011, 46, 922–937. [Google Scholar] [CrossRef]
- Al horr, Y.; Arif, M.; Katafygiotou, M.; Mazroei, A.; Kaushik, A.; Elsarrag, E. Impact of indoor environmental quality on occupant well-being and comfort: A review of the literature. Int. J. Sustain. Built Environ. 2016, 5, 1–11. [Google Scholar] [CrossRef]
- Sakhare, V.V.; Ralegaonkar, R.V. Indoor environmental quality: Review of parameters and assessment models. Archit. Sci. Rev. 2014, 57, 147–154. [Google Scholar] [CrossRef]
- Heinzerling, D.; Schiavon, S.; Webster, T.; Arens, E. Indoor environmental quality assessment models: A literature review and a proposed weighting and classification scheme. Build. Environ. 2013, 70, 210–222. [Google Scholar] [CrossRef] [Green Version]
- Park, J.Y.; Nagy, Z. Comprehensive analysis of the relationship between thermal comfort and building control research—A data-driven literature review. Renew. Sustain. Energy Rev. 2018, 82, 2664–2679. [Google Scholar] [CrossRef]
- Enescu, D. A review of thermal comfort models and indicators for indoor environments. Renew. Sustain. Energy Rev. 2017, 79, 1353–1379. [Google Scholar] [CrossRef]
- Rupp, R.F.; Vásquez, N.G.; Lamberts, R. A review of human thermal comfort in the built environment. Energy Build. 2015, 105, 178–205. [Google Scholar] [CrossRef]
- Zhang, H.; Arens, E.; Zhai, Y. A review of the corrective power of personal comfort systems in non-neutral ambient environments. Build. Environ. 2015, 91, 15–41. [Google Scholar] [CrossRef] [Green Version]
- Tham, K.W. Indoor air quality and its effects on humans—A review of challenges and developments in the last 30 years. Energy Build. 2016, 130, 637–650. [Google Scholar] [CrossRef]
- Persily, A.K.; Emmerich, S.J. Indoor air quality in sustainable, energy efficient buildings. HVACR Res. 2012, 18, 4–20. [Google Scholar] [CrossRef]
- Sundell, J.; Levin, H.; Nazaroff, W.W.; Cain, W.S.; Fisk, W.J.; Grimsrud, D.T.; Gyntelberg, F.; Li, Y.; Persily, A.K.; Pickering, A.C.; et al. Ventilation rates and health: Multidisciplinary review of the scientific literature. Indoor Air 2011, 21, 191–204. [Google Scholar] [CrossRef]
- Chua, K.J.; Chou, S.K.; Yang, W.M.; Yan, J. Achieving better energy-efficient air conditioning—A review of technologies and strategies. Appl. Energy 2013, 104, 87–104. [Google Scholar] [CrossRef]
- Aries, M.; Aarts, M.; van Hoof, J. Daylight and health: A review of the evidence and consequences for the built environment. Lighting Res. Technol. 2015, 47, 6–27. [Google Scholar] [CrossRef]
- Todorovic, M.S.; Kim, J.T. Beyond the science and art of the healthy buildings daylighting dynamic control’s performance prediction and validation. Energy Build. 2012, 46, 159–166. [Google Scholar] [CrossRef]
- Carlucci, S.; Causone, F.; De Rosa, F.; Pagliano, L. A review of indices for assessing visual comfort with a view to their use in optimization processes to support building integrated design. Renew. Sustain. Energy Rev. 2015, 47, 1016–1033. [Google Scholar] [CrossRef] [Green Version]
- Vardaxis, N.-G.; Bard, D. Review of acoustic comfort evaluation in dwellings: Part II—Impact sound data associated with subjective responses in laboratory tests. Build. Acoust. 2018, 25, 171–192. [Google Scholar] [CrossRef]
- Vardaxis, N.-G.; Bard, D.; Persson Waye, K. Review of acoustic comfort evaluation in dwellings—Part I: Associations of acoustic field data to subjective responses from building surveys. Build. Acoust. 2018, 25, 151–170. [Google Scholar] [CrossRef] [Green Version]
- Reinten, J.; Braat-Eggen, P.E.; Hornikx, M.; Kort, H.S.M.; Kohlrausch, A. The indoor sound environment and human task performance: A literature review on the role of room acoustics. Build. Environ. 2017, 123, 315–332. [Google Scholar] [CrossRef]
- Markoulli, M.P.; Lee, C.I.S.G.; Byington, E.; Felps, W.A. Mapping Human Resource Management: Reviewing the field and charting future directions. Hum. Resour. Manag. Rev. 2017, 27, 367–396. [Google Scholar] [CrossRef]
- Wuni, I.Y.; Shen, G.Q.P.; Osei-Kyei, R. Scientometric review of global research trends on green buildings in construction journals from 1992 to 2018. Energy Build. 2019, 190, 69–85. [Google Scholar] [CrossRef]
- Chen, C. CiteSpace II: Detecting and visualizing emerging trends and transient patterns in scientific literature. J. Am. Soc. Inf. Sci. Technol. 2006, 57, 359–377. [Google Scholar] [CrossRef] [Green Version]
- Khan, A.; Sepasgozar, S.; Liu, T.; Yu, R. Integration of BIM and Immersive Technologies for AEC: A Scientometric-SWOT Analysis and Critical Content Review. Buildings 2021, 11, 126. [Google Scholar] [CrossRef]
- Omrany, H.; Chang, R.; Soebarto, V.; Zhang, Y.; Ghaffarianhoseini, A.; Zuo, J. A bibliometric review of net zero energy building research 1995–2022. Energy Build. 2022, 262, 111996. [Google Scholar] [CrossRef]
- Sharifi, A. Urban sustainability assessment: An overview and bibliometric analysis. Ecol. Indic. 2021, 121, 107102. [Google Scholar] [CrossRef]
- Xie, H.; Zhang, Y.; Duan, K. Evolutionary overview of urban expansion based on bibliometric analysis in Web of Science from 1990 to 2019. Habitat Int. 2020, 95, 102100. [Google Scholar] [CrossRef]
- Van Eck, N.J.; Waltman, L. Software survey: VOSviewer, a computer program for bibliometric mapping. Scientometrics 2010, 84, 523–538. [Google Scholar] [CrossRef] [Green Version]
- Mui, K.W.; Chan, W.T. A New Indoor Environmental Quality Equation for Air-Conditioned Buildings. Archit. Sci. Rev. 2005, 48, 41–46. [Google Scholar] [CrossRef]
- Wong, L.T.; Mui, K.W.; Hui, P.S. A multivariate-logistic model for acceptance of indoor environmental quality (IEQ) in offices. Build. Environ. 2008, 43, 1–6. [Google Scholar] [CrossRef]
- Kim, J.; de Dear, R. Nonlinear relationships between individual IEQ factors and overall workspace satisfaction. Build. Environ. 2012, 49, 33–40. [Google Scholar] [CrossRef] [Green Version]
- Cao, B.; Ouyang, Q.; Zhu, Y.; Huang, L.; Hu, H.; Deng, G. Development of a multivariate regression model for overall satisfaction in public buildings based on field studies in Beijing and Shanghai. Build. Environ. 2012, 47, 394–399. [Google Scholar] [CrossRef]
- Wong, L.T.; Mui, K.W.; Tsang, T.W. An open acceptance model for indoor environmental quality (IEQ). Build. Environ. 2018, 142, 371–378. [Google Scholar] [CrossRef]
- Tang, H.; Ding, Y.; Singer, B. Interactions and comprehensive effect of indoor environmental quality factors on occupant satisfaction. Build. Environ. 2020, 167, 1–15. [Google Scholar] [CrossRef]
- Jung, W.; Jazizadeh, F. Human-in-the-loop HVAC operations: A quantitative review on occupancy, comfort, and energy-efficiency dimensions. Appl. Energy 2019, 239, 1471–1508. [Google Scholar] [CrossRef]
- Sheikh Khan, D.; Kolarik, J.; Weitzmann, P. Design and application of occupant voting systems for collecting occupant feedback on indoor environmental quality of buildings—A review. Build. Environ. 2020, 183, 107192. [Google Scholar] [CrossRef]
- Roumi, S.; Stewart, R.A.; Zhang, F.; Santamouris, M. Unravelling the relationship between energy and indoor environmental quality in Australian office buildings. Sol. Energy 2021, 227, 190–202. [Google Scholar] [CrossRef]
- Frontczak, M.; Schiavon, S.; Goins, J.; Arens, E.; Zhang, H.; Wargocki, P. Quantitative relationships between occupant satisfaction and satisfaction aspects of indoor environmental quality and building design. Indoor Air 2012, 22, 119–131. [Google Scholar] [CrossRef] [PubMed] [Green Version]
- Lai, A.C.K.; Mui, K.W.; Wong, L.T.; Law, L.Y. An evaluation model for indoor environmental quality (IEQ) acceptance in residential buildings. Energy Build. 2009, 41, 930–936. [Google Scholar] [CrossRef]
- Huang, L.; Zhu, Y.X.; Ouyang, Q.; Cao, B. A study on the effects of thermal, luminous, and acoustic environments on indoor environmental comfort in offices. Build. Environ. 2012, 49, 304–309. [Google Scholar] [CrossRef]
- Paul, W.L.; Taylor, P.A. A comparison of occupant comfort and satisfaction between a green building and a conventional building. Build. Environ. 2008, 43, 1858–1870. [Google Scholar] [CrossRef]
- Kolokotsa, D.; Pouliezos, A.; Stavrakakis, G.; Lazos, C. Predictive control techniques for energy and indoor environmental quality management in buildings. Build. Environ. 2009, 44, 1850–1863. [Google Scholar] [CrossRef]
- Seppanen, O.A.; Fisk, W. Some quantitative relations between indoor environmental quality and work performance or health. Hvacr Res. 2006, 12, 957–973. [Google Scholar] [CrossRef] [Green Version]
- Shendell, D.G.; Prill, R.; Fisk, W.J.; Apte, M.G.; Blake, D.; Faulkner, D. Associations between classroom CO2 concentrations and student attendance in Washington and Idaho. Indoor Air 2004, 14, 333–341. [Google Scholar] [CrossRef]
- Zhang, J.S.S. Combined heat, air, moisture, and pollutants transport in building environmental systems. Jsme Int. J. Ser. b-Fluids Therm. Eng. 2005, 48, 182–190. [Google Scholar] [CrossRef]
- Moschandreas, J.; Yoon, S.H.; Demirev, D. Validation of the indoor environmental quality conceptual model. Build. Res. Inf. 2006, 34, 483–495. [Google Scholar] [CrossRef]
- Kim, H.; Haberl, J.S. Field-Test of the New ASHRAE/CIBSE/USGBC Performance Measurement Protocols: Intermediate and Advanced Level Indoor Environmental Quality Protocols. Ashrae Trans. 2012, 118, 58–65. [Google Scholar]
- U.S. Green Building Council. LEED Reference Guide for Building Design and Construction; U.S. Green Building Council: Washington, DC, USA, 2013.
- Wargocki, P.; Wei, W.J.; Bendzalova, J.; Espigares-Correa, C.; Gerard, C.; Greslou, O.; Rivallain, M.; Sesana, M.M.; Olesen, B.W.; Zirngibl, J.; et al. TAIL, a new scheme for rating indoor environmental quality in offices and hotels undergoing deep energy renovation (EU ALDREN project). Energy Build. 2021, 244, 1–13. [Google Scholar] [CrossRef]
- Kim, J.; de Dear, R. Impact of different building ventilation modes on occupant expectations of the main IEQ factors. Build. Environ. 2012, 57, 184–193. [Google Scholar] [CrossRef] [Green Version]
- Wang, T.; Ward, G.; Lee, E.S. Efficient modeling of optically-complex, non-coplanar exterior shading: Validation of matrix algebraic methods. Energy Build. 2018, 174, 464–483. [Google Scholar] [CrossRef] [Green Version]
- Yoshino, H.; Hong, T.; Nord, N. IEA EBC annex 53: Total energy use in buildings—Analysis and evaluation methods. Energy Build. 2017, 152, 124–136. [Google Scholar] [CrossRef] [Green Version]
- Wai, T.K.; Lee, J.Y.; Chan, Y.H.; Wargocki, P. Structural Equation Modelling of Occupant Satisfaction with Indoor Environmental Quality of Office Buildings in Singapore; International Society of Indoor Air Quality and Climate: Herndon, VA, USA, 2020. [Google Scholar]
- Andersen, R.K.; Fabi, V.; Corgnati, S.P. Predicted and actual indoor environmental quality: Verification of occupants’ behaviour models in residential buildings. Energy Build. 2016, 127, 105–115. [Google Scholar] [CrossRef] [Green Version]
- Erbas, I.; Stouffs, R.; Sariyildiz, S. Knowledge based integration of sustainability issues in the (re)design process. In Proceedings of the 2011 AAAI Spring Symposium Series, Stanford, CA, USA, 21–23 March 2011; pp. 34–38. [Google Scholar]
- Roelofsen, P. A comparison of the dynamic thermal sensation between the modified Stolwijk model and the Fiala thermal physiology and comfort (FPC) model. Intell. Build. Int. 2020, 12, 284–294. [Google Scholar] [CrossRef] [Green Version]
- Altomonte, S.; Schiavon, S.; Kent, M.G.; Brager, G. Indoor environmental quality and occupant satisfaction in green-certified buildings. Build. Res. Inf. 2019, 47, 255–274. [Google Scholar] [CrossRef] [Green Version]
- Laouadi, A.; Parekh, A. Complex fenestration systems: Towards product ratings for indoor environment quality. Lighting Res. Technol. 2007, 39, 109–122. [Google Scholar] [CrossRef]
- Kim, J.; Hong, T.; Jeong, J.; Lee, M.; Lee, M.; Jeong, K.; Koo, C.; Jeong, J. Establishment of an optimal occupant behavior considering the energy consumption and indoor environmental quality by region. Appl. Energy 2017, 204, 1431–1443. [Google Scholar] [CrossRef]
- Chen, C.F.; Yilmaz, S.; Pisello, A.L.; De Simone, M.; Kim, A.; Hong, T.Z.; Bandurski, K.; Bavaresco, M.V.; Liu, P.L.; Zhu, Y.M. The impacts of building characteristics, social psychological and cultural factors on indoor environment quality productivity belief. Build. Environ. 2020, 185, 1–18. [Google Scholar] [CrossRef]
- Pei, Z.; Lin, B.; Liu, Y.; Zhu, Y. Comparative study on the indoor environment quality of green office buildings in China with a long-term field measurement and investigation. Build. Environ. 2015, 84, 80–88. [Google Scholar] [CrossRef]
- Kamaruzzaman, S.N.; Lou, E.C.W.; Wong, P.F.; Edwards, R.; Hamzah, N.; Ghani, M.K. Development of a non-domestic building refurbishment scheme for Malaysia: A Delphi approach. Energy 2019, 167, 804–818. [Google Scholar] [CrossRef] [Green Version]
- Quang, T.N.; He, C.; Knibbs, L.D.; De Dear, R.; Morawska, L. Co-optimisation of indoor environmental quality and energy consumption within urban office buildings. Energy Build. 2014, 85, 225–234. [Google Scholar] [CrossRef] [Green Version]
- Tang, H.; Ding, Y.; Singer, B.C. Post-occupancy evaluation of indoor environmental quality in ten nonresidential buildings in Chongqing, China. J. Build. Eng. 2020, 32, 1–13. [Google Scholar] [CrossRef]
- Sakellaris, I.; Saraga, D.; Mandin, C.; de Kluizenaar, Y.; Fossati, S.; Spinazze, A.; Cattaneo, A.; Szigeti, T.; Mihucz, V.; Fernandes, E.D.; et al. Personal Control of the Indoor Environment in Offices: Relations with Building Characteristics, Influence on Occupant Perception and Reported Symptoms Related to the Building-The Officair Project. Appl. Sci. 2019, 9, 3227. [Google Scholar] [CrossRef] [Green Version]
- Piasecki, M.; Kostyrko, K.; Pykacz, S. Indoor environmental quality assessment: Part 1: Choice of the indoor environmental quality sub-component models. J. Build. Phys. 2017, 41, 264–289. [Google Scholar] [CrossRef]
- Piasecki, M. Practical implementation of the indoor environmental quality model for the assessment of nearly zero energy single-family building. Buildings 2019, 9, 214. [Google Scholar] [CrossRef] [Green Version]
- Salleh, N.M.; Kamaruzzaman, S.N.; Riley, M.; Ahmad Zawawi, E.M.; Sulaiman, R. A quantitative evaluation of indoor environmental quality in refurbished kindergarten buildings: A Malaysian case study. Build. Environ. 2015, 94, 723–733. [Google Scholar] [CrossRef]
- Howard, G.S.; Cole, D.A.; Maxwell, S.E. Research productivity in psychology based on publication in the journals of the American Psychological Association. Am. Psychol. 1987, 42, 975–986. [Google Scholar] [CrossRef]
- van Leeuwen, T.; Costas, R.; Calero-Medina, C.; Visser, M. The role of editorial material in bibliometric research performance assessments. Scientometrics 2013, 95, 817–828. [Google Scholar] [CrossRef]
- Zhang, W.; Yuan, H. A Bibliometric Analysis of Energy Performance Contracting Research from 2008 to 2018. Sustainability 2019, 11, 3548. [Google Scholar] [CrossRef] [Green Version]
- Larsen, T.S.; Rohde, L.; Jonsson, K.T.; Rasmussen, B.; Jensen, R.L.; Knudsen, H.N.; Witterseh, T.; Beko, G. IEQ-Compass—A tool for holistic evaluation of potential indoor environmental quality. Build. Environ. 2020, 172, 1–11. [Google Scholar] [CrossRef]
- Collinge, W.O.; Landis, A.E.; Jones, A.K.; Schaefer, L.A.; Bilec, M.M. Productivity metrics in dynamic LCA for whole buildings: Using a post-occupancy evaluation of energy and indoor environmental quality tradeoffs. Build. Environ. 2014, 82, 339–348. [Google Scholar] [CrossRef]
- Hellwig, R.T. Perceived control in indoor environments: A conceptual approach. Build. Res. Inf. 2015, 43, 302–315. [Google Scholar] [CrossRef]
- Wingler, D.; Hector, R. Demonstrating the Effect of the Built Environment on Staff Health-Related Quality of Life in Ambulatory Care Environments. Herd-Health Environ. Res. Des. J. 2015, 8, 25–40. [Google Scholar] [CrossRef]
- Naspi, F.; Arnesano, M.; Zampetti, L.; Stazi, F.; Revel, G.M.; D’Orazio, M. Experimental study on occupants’ interaction with windows and lights in Mediterranean offices during the non-heating season. Build. Environ. 2018, 127, 221–238. [Google Scholar] [CrossRef]
- Caro, R.; Sendra, J.J. Are the dwellings of historic Mediterranean cities cold in winter? A field assessment on their indoor environment and energy performance. Energy Build. 2021, 230, 1–18. [Google Scholar] [CrossRef]
- Khan, D.S.; Kolarik, J.; Hviid, C.A.; Weitzmann, P. Method for long-term mapping of occupancy patterns in open-plan and single office spaces by using passive-infrared (PIR) sensors mounted below desks. Energy Build. 2021, 230, 1–12. [Google Scholar] [CrossRef]
- Kim, J.; Hong, T.; Lee, M.; Jeong, K. Analyzing the real-time indoor environmental quality factors considering the influence of the building occupants’ behaviors and the ventilation. Build. Environ. 2019, 156, 99–109. [Google Scholar] [CrossRef]
- Dai, X.L.; Liu, J.J.; Zhang, X. A review of studies applying machine learning models to predict occupancy and window-opening behaviours in smart buildings. Energy Build. 2020, 223, 1–15. [Google Scholar] [CrossRef]
- Congedo, P.M.; Baglivo, C. Implementation hypothesis of the Apulia ITACA Protocol at district level-part I: The model. Sustain. Cities Soc. 2021, 70, 1–22. [Google Scholar] [CrossRef]
- De Lima Montenegro Duarte, J.G.C.; Ramos Zemero, B.; Dias Barreto de Souza, A.C.; de Lima Tostes, M.E.; Holanda Bezerra, U. Building Information Modeling approach to optimize energy efficiency in educational buildings. J. Build. Eng. 2021, 43, 1–14. [Google Scholar] [CrossRef]
- Elharidi, A.M.; Tuohy, P.G.; Teamah, M.A. The energy and indoor environmental performance of Egyptian offices: Parameter analysis and future policy. Energy Build. 2018, 158, 431–452. [Google Scholar] [CrossRef] [Green Version]
- ASHRAE. Thermal Environmental Conditions for Human Occupancy. American Society of Heating, Refrigerating and Air-Conditioning Engineers. 2004. Available online: www.ashrae.org (accessed on 25 February 2022).
- van der Linden, A.C.; Boerstra, A.C.; Raue, A.K.; Kurvers, S.R.; de Dear, R.J. Adaptive temperature limits: A new guideline in The Netherlands a new approach for the assessment of building performance with respect to thermal indoor climate. Energy Build. 2006, 38, 8–17. [Google Scholar] [CrossRef]
- Carlucci, S.; Bai, L.; de Dear, R.; Yang, L. Review of adaptive thermal comfort models in built environmental regulatory documents. Build. Environ. 2018, 137, 73–89. [Google Scholar] [CrossRef] [Green Version]
- Kim, J.; Tartarini, F.; Parkinson, T.; Cooper, P.; de Dear, R. Thermal comfort in a mixed-mode building: Are occupants more adaptive? Energy Build. 2019, 203, 1–11. [Google Scholar] [CrossRef]
- Esfandiari, M.; Zaid, S.M.; Ismail, M.A.; Hafezi, M.R.; Asadi, I.; Mohammadi, S.; Vaisi, S.; Aflaki, A. Occupants’ Satisfaction toward Indoor Environment Quality of Platinum Green-Certified Office Buildings in Tropical Climate. Energies 2021, 14, 2264. [Google Scholar] [CrossRef]
- Sediso, B.G.; Lee, M.S. Indoor environmental quality in Korean green building certification criteriacertified office buildingsoccupant satisfaction and performance. Sci. Technol. Built Environ. 2016, 22, 606–618. [Google Scholar] [CrossRef]
- Chokor, A.; El Asmar, M.; Tilton, C.; Srour, I. Dual Assessment Framework to Evaluate LEED-Certified Facilities’ Occupant Satisfaction and Energy Performance: Macro and Micro Approaches. J. Archit. Eng. 2016, 22, A4015003. [Google Scholar] [CrossRef]
- Navai, M.; Veitch, J. Acoustic Satisfaction in Open-Plan Offices: Review and Recommendations; National Research Council of Canada: Ottawa, ON, Canada, 2003. [CrossRef]
- Sun, X.Y.; Wu, H.Z.; Wu, Y. Investigation of the relationships among temperature, illuminance and sound level, typical physiological parameters and human perceptions. Build. Environ. 2020, 183, 1–14. [Google Scholar] [CrossRef]
- Wu, H.Z.; Wu, Y.; Sun, X.Y.; Liu, J. Combined effects of acoustic, thermal, and illumination on human perception and performance: A review. Build. Environ. 2020, 169, 1–19. [Google Scholar] [CrossRef]
- Nezis, I.; Biskos, G.; Eleftheriadis, K.; Kalantzi, O.-I. Particulate matter and health effects in offices—A review. Build. Environ. 2019, 156, 62–73. [Google Scholar] [CrossRef]
- Zhai, Z.; Metzger, I.D. Insights on critical parameters and conditions for personalized ventilation. Sustain. Cities Soc. 2019, 48, 101584. [Google Scholar] [CrossRef]
- Shan, X.; Melina, A.N.; Yang, E.-H. Impact of indoor environmental quality on students’ wellbeing and performance in educational building through life cycle costing perspective. J. Clean. Prod. 2018, 204, 298–309. [Google Scholar] [CrossRef]
- Li, N.P.; Cui, H.J.; Zhu, C.H.; Zhang, X.H.; Su, L. Grey preference analysis of indoor environmental factors using sub-indexes based on Weber/Fechner’s law and predicted mean vote. Indoor Built Environ. 2016, 25, 1197–1208. [Google Scholar] [CrossRef]
- Bronsema, B.; Bokel, R.; van der Spoel, W. Earth, Wind & Fire—Natural Air-Conditioning; International Society of Indoor Air Quality and Climate: Eindhoven, The Netherlands, 2015. [Google Scholar]
- Zenissa, R.; Syafei, A.D.; Surahman, U.; Sembiring, A.C.; Pradana, A.W.; Ciptaningayu, T.; Ahmad, I.S.; Assomadi, A.F.; Boedisantoso, R.; Hermana, J. The effect of ventilation and cooking activities towards indoor fine particulates in apartments. Civ. Environ. Eng. 2020, 16, 238–248. [Google Scholar] [CrossRef]
- Bluyssen, P.M.; Roda, C.; Mandin, C.; Fossati, S.; Carrer, P.; de Kluizenaar, Y.; Mihucz, V.G.; Fernandes, E.D.; Bartzis, J. Self-reported health and comfort in ‘modern’ office buildings: First results from the European OFFICAIR study. Indoor Air 2016, 26, 298–317. [Google Scholar] [CrossRef] [PubMed]
- Buchanan, I.S.H.; Mendell, M.J.; Mirer, A.G.; Apte, M.G. Air filter materials, outdoor ozone and building-related symptoms in the BASE study. Indoor Air 2008, 18, 144–155. [Google Scholar] [CrossRef] [PubMed]
- Pedersen, E.; Gao, C.; Wierzbicka, A. Tenant perceptions of post-renovation indoor environmental quality in rental housing: Improved for some, but not for those reporting health-related symptoms. Build. Environ. 2021, 189, 107520. [Google Scholar] [CrossRef]
- Thach, T.Q.; Mahirah, D.; Dunleavy, G.; Nazeha, N.; Zhang, Y.C.; Tan, C.E.H.; Roberts, A.C.; Christopoulos, G.; Soh, C.K.; Car, J. Prevalence of sick building syndrome and its association with perceived indoor environmental quality in an Asian multi-ethnic working population. Build. Environ. 2019, 166, 1–8. [Google Scholar] [CrossRef]
- Akanmu, W.P.; Nunayon, S.S.; Eboson, U.C. Indoor environmental quality (IEQ) assessment of Nigerian university libraries: A pilot study. Energy Built Environ. 2021, 2, 302–314. [Google Scholar] [CrossRef]
- Hu, J.; He, Y.; Hao, X.; Li, N.; Su, Y.; Qu, H. Optimal temperature ranges considering gender differences in thermal comfort, work performance, and sick building syndrome: A winter field study in university classrooms. Energy Build. 2022, 254, 111554. [Google Scholar] [CrossRef]
- Vilcekova, S.; Meciarova, L.; Burdova, E.K.; Katunska, J.; Kosicanova, D.; Doroudiani, S. Indoor environmental quality of classrooms and occupants’ comfort in a special education school in Slovak Republic. Build. Environ. 2017, 120, 29–40. [Google Scholar] [CrossRef]
- Zhao, Y.; Wen, J.; Xiao, F.; Yang, X.B.; Wang, S.W. Diagnostic Bayesian networks for diagnosing air handling units faults—part I: Faults in dampers, fans, filters and sensors. Appl. Therm. Eng. 2017, 111, 1272–1286. [Google Scholar] [CrossRef]
- Kim, D.H.; Bluyssen, P.M. Clustering of office workers from the OFFICAIR study in The Netherlands based on their self-reported health and comfort. Build. Environ. 2020, 176, 1–13. [Google Scholar] [CrossRef]
- Rawati, E.; Chou, Y.C.; Lu, C.H. Moderation and Mediation Effect of Distance to Windows and Employees’ Mood between Indoor Environment and Task Performance; International Society of Science and Applied Technologies: Toronto, ON, Canada, 2018. [Google Scholar]
- Kallio, J.; Vildjiounaite, E.; Koivusaari, J.; Rasanen, P.; Simila, H.; Kyllonen, V.; Muuraiskangas, S.; Ronkainen, J.; Rehu, J.; Vehmas, K. Assessment of perceived indoor environmental quality, stress and productivity based on environmental sensor data and personality categorization. Build. Environ. 2020, 175, 1–14. [Google Scholar] [CrossRef]
- Ncube, M.; Riffat, S. Developing an indoor environment quality tool for assessment of mechanically ventilated office buildings in the UK—A preliminary study. Build. Environ. 2012, 53, 26–33. [Google Scholar] [CrossRef] [Green Version]
- Xu, H.; Huang, Q.; Zhang, Q. A study and application of the degree of satisfaction with indoor environmental quality involving a building space factor. Build. Environ. 2018, 143, 227–239. [Google Scholar] [CrossRef]
- Huang, M.; Liao, Y. Development of an indoor environment evaluation model for heating, ventilation and air-conditioning control system of office buildings in subtropical region considering indoor health and thermal comfort. Indoor Built Environ. 2021, 31, 807–819. [Google Scholar] [CrossRef]


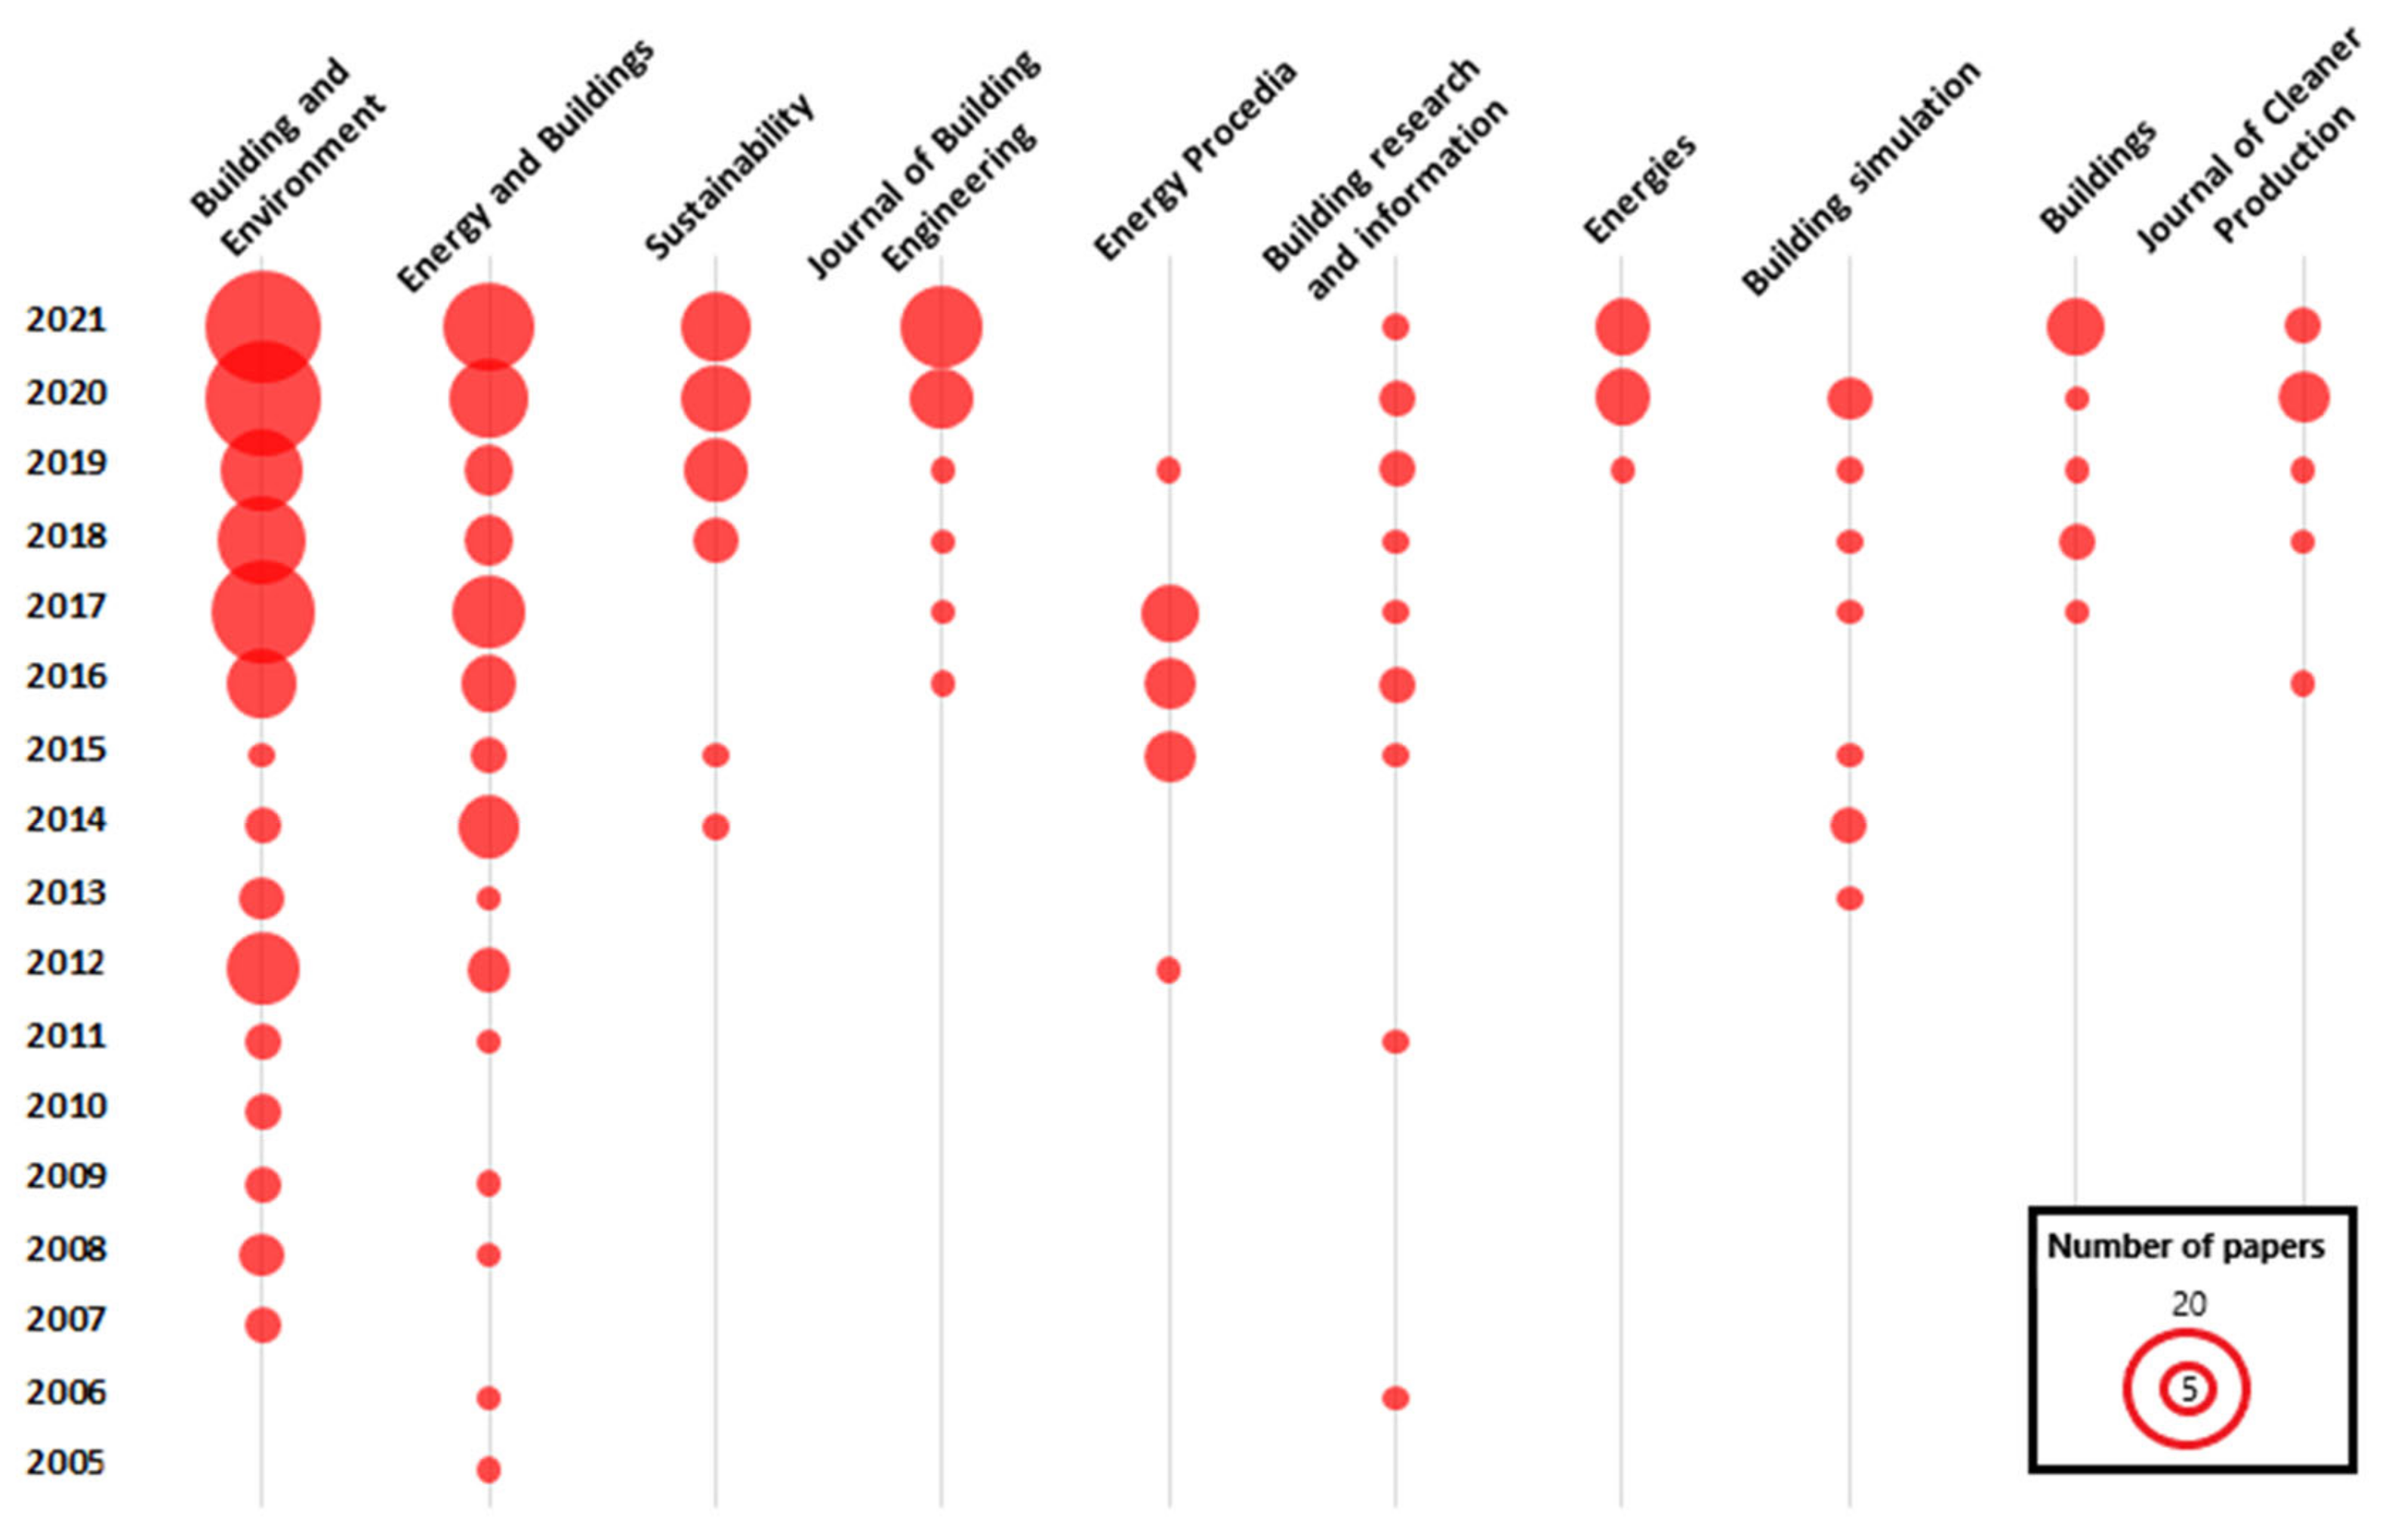
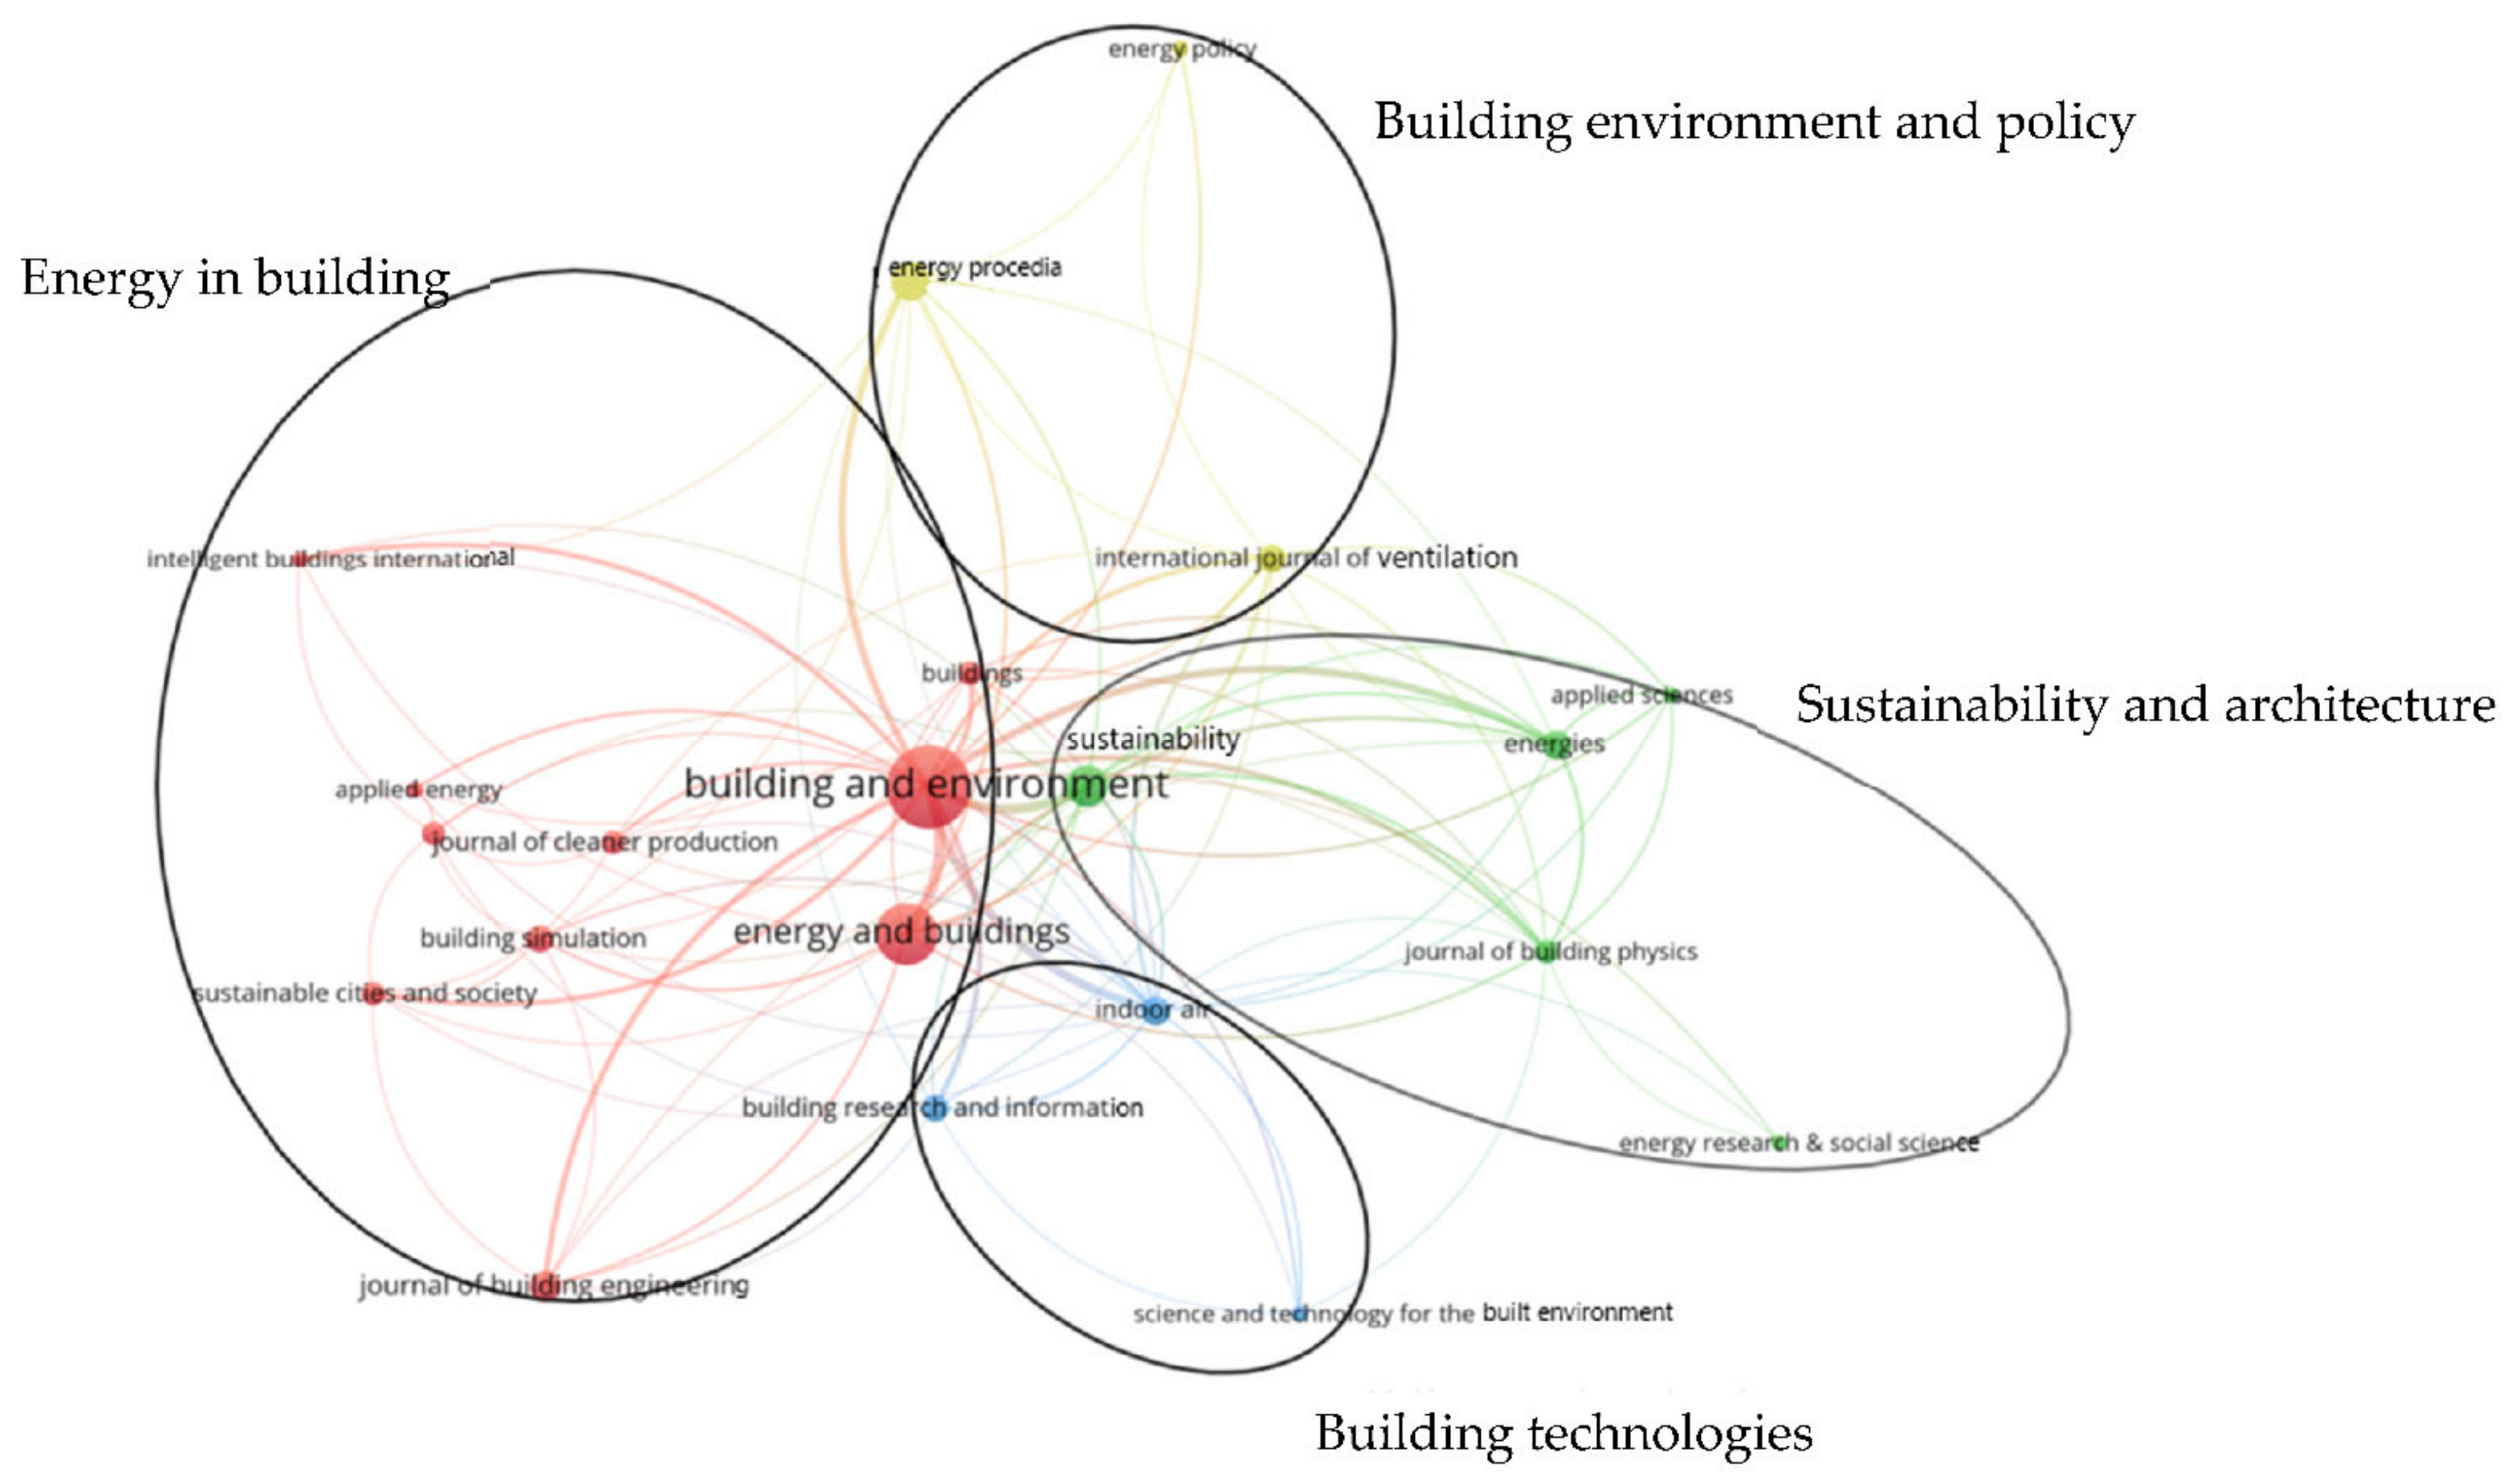

| Journal | No. of Publications | Total Citation | Average Citation | Links | Total Link Strength |
|---|---|---|---|---|---|
| Building and Environment | 110 | 3236 | 36 | 19 | 348 |
| Energy and Buildings | 59 | 1650 | 33 | 12 | 117 |
| Sustainability | 25 | 114 | 5 | 15 | 88 |
| Journal of Building Engineering | 20 | 77 | 6 | 8 | 30 |
| Energy Procedia | 15 | 756 | 69 | 18 | 84 |
| Building Research and Information | 12 | 134 | 13 | 8 | 28 |
| Energies | 11 | 53 | 5 | 10 | 62 |
| Building Simulation | 10 | 181 | 18 | 8 | 15 |
| Buildings | 10 | 38 | 5 | 9 | 32 |
| Journal of Cleaner Production | 9 | 88 | 11 | 7 | 13 |
| Energy | 8 | 174 | 25 | 8 | 10 |
| Sustainable Cities and Society | 8 | 141 | 18 | 7 | 22 |
| Indoor Air | 7 | 122 | 15 | 10 | 21 |
| Journal of Building Physics | 7 | 69 | 10 | 11 | 44 |
| Applied Energy | 4 | 76 | 19 | 4 | 10 |
| Energy Policy | 4 | 32 | 8 | 3 | 6 |
| Applied Science | 4 | 29 | 7 | 6 | 19 |
| International Journal of Ventilation | 4 | 23 | 15 | 5 | 15 |
| Science and Technology for the Built Environment | 4 | 22 | 6 | 5 | 10 |
| Intelligent Building International | 4 | 18 | 5 | 6 | 19 |
| Energy Research and Social Science | 4 | 19 | 5 | 3 | 4 |
| No. | Author Affiliation | Documents | Citation | Country |
|---|---|---|---|---|
| 1 | The Hong Kong Polytechnic University | 25 | 785 | China |
| 2 | Technical University of Denmark | 14 | 525 | Denmark |
| 3 | University of California Berkeley | 13 | 1173 | USA |
| 3 | Delft University of Technology | 13 | 248 | The Netherlands |
| 5 | Polytechnic of Turin | 12 | 210 | Italy |
| 5 | Yonsei University | 12 | 145 | South Korea |
| 6 | Tsinghua University | 10 | 438 | China |
| 7 | University of Malaya | 8 | 81 | Malaysia |
| 8 | University of Sydney | 7 | 290 | Australia |
| 8 | Lawrence Berkeley National Laboratory | 7 | 222 | USA |
| 8 | University Paris-Est | 7 | 188 | France |
| 8 | Instytut Techniki Budowlanej | 7 | 79 | Poland |
| 8 | University Technology of Malaysia | 7 | 38 | Malaysia |
| Total Number of Authors | Order of a Specific Scholar | ||||||
|---|---|---|---|---|---|---|---|
| 1st | 2nd | 3rd | 4th | 5th | 6th | 7th | |
| 1 | 1.00 | ||||||
| 2 | 0.60 | 0.40 | |||||
| 3 | 0.47 | 0.32 | 0.21 | ||||
| 4 | 0.42 | 0.28 | 0.18 | 0.12 | |||
| 5 | 0.38 | 0.26 | 0.17 | 0.11 | 0.08 | ||
| 6 | 0.37 | 0.25 | 0.16 | 0.10 | 0.07 | 0.05 | |
| 7 | 0.35 | 0.24 | 0.16 | 0.10 | 0.07 | 0.05 | 0.03 |
| Scholars | Published Papers | Contribution Score | Total Citations | Average Citation | Affiliation |
|---|---|---|---|---|---|
| K. W. Mui | 11 | 4.26 | 501 | 45.5 | The Hong Kong Polytechnic University |
| L. T. Wong | 10 | 3.43 | 488 | 48.8 | The Hong Kong Polytechnic University |
| T. Hong | 10 | 3.05 | 117 | 11.7 | Yonsei University |
| M. Piasecki | 9 | 4.02 | 96 | 10.7 | Instytut Techniki Budowlanej |
| Jimin Kim | 9 | 3.26 | 104 | 11.6 | Yonsei University |
| P. Bluyssen | 7 | 3.05 | 138 | 19.7 | Delft University of Technology |
| V. Fabi | 7 | 2.75 | 169 | 24.1 | Polytechnic of Turin |
| S. Schiavon | 7 | 1.84 | 448 | 64.0 | University of California Berkeley |
| R. de Dear | 5 | 2.26 | 252 | 50.4 | University of Sydney |
| K. Ito | 5 | 1.8 | 37 | 7.4 | Kyushu University |
| S. N. Kamaruzzaman | 5 | 1.13 | 72 | 14.4 | University of Malaya |
| Y. Zhu | 5 | 0.89 | 368 | 73.6 | Tsinghua University |
| A. L. Pisello | 5 | 0.73 | 28 | 5.6 | University of Perugia |
| S. Habibi | 4 | 4 | 92 | 23.0 | University of Ferrara |
| Jungsoo Kim | 4 | 2.75 | 236 | 59.0 | University of Sydney |
| S P. Corgnati | 4 | 1.88 | 51 | 12.8 | Polytechnic of Turin |
| K. B. Kostyrko | 4 | 1.8 | 43 | 10.8 | Instytut Techniki Budowlanej |
| F. Favoino | 4 | 1.41 | 143 | 35.8 | University of Cambridge |
| M. Overend | 4 | 0.86 | 152 | 38.0 | University of Cambridge |
| B. Cao | 4 | 0.81 | 214 | 53.5 | Tsinghua University |
| M. Lee | 4 | 0.78 | 66 | 16.5 | Yonsei University |
| Study | Method | R2 | IEQ Prediction Model |
|---|---|---|---|
| [37] | Linear regression | - | IEQ = 0.28 × AC + 0.09 × IAQ + 0.42 × TC |
| [40] | Linear regression | 0.46 | IEQ = 0.224 × AC + 0.118 × IAQ + 0.316 × TC + 0.171 × VC +0.075 |
| [14] | Linear regression | - | IEQ = 0.39 × AC + 0.2 × IAQ + 0.12 × TC + 0.29 × VC |
| [119] | Linear regression | 0.94 | IEQ = 0.18 × AC + 0.36 × IAQ + 0.3 × TC + 0.16 × VC |
| [42] | Linear regression | 0.911 | IEQ = 0.529 × AC − 0.136 × IAQ + 0.463 × TC + 0.423 × VC − 2.384 |
| Linear regression | 0.908 | IEQ = 0.525 × AC + 0.438 × TC + 0.401 × VC − 3.106 | |
| Arithmetic mean model | 0.893 | ||
| Geometric mean model | - | ||
| [120] | Linear regression | 0.89 | IEQ = 0.063 × TC + 0.126 × VC + 0.736 × space |
| [39] | Linear regression | 0.63 | IEQ = 0.15 × AC + 0.07 × IAQ + 0.20 × VC + 0.27 × space +0.12 × cleanliness and maintenance + 0.07 × colours and texture + 0.12 × Furnishing |
| [121] | Linear regression | - | IEQ = +0.49 × CO2 + 0.12 × Temperature + 0.19 × PM2.5 + 0.12 × air movement + 0.11 × Humidity |
| [38] | Logistic regression | - |
Publisher’s Note: MDPI stays neutral with regard to jurisdictional claims in published maps and institutional affiliations. |
© 2022 by the authors. Licensee MDPI, Basel, Switzerland. This article is an open access article distributed under the terms and conditions of the Creative Commons Attribution (CC BY) license (https://creativecommons.org/licenses/by/4.0/).
Share and Cite
Roumi, S.; Zhang, F.; Stewart, R.A. Global Research Trends on Building Indoor Environmental Quality Modelling and Indexing Systems—A Scientometric Review. Energies 2022, 15, 4494. https://doi.org/10.3390/en15124494
Roumi S, Zhang F, Stewart RA. Global Research Trends on Building Indoor Environmental Quality Modelling and Indexing Systems—A Scientometric Review. Energies. 2022; 15(12):4494. https://doi.org/10.3390/en15124494
Chicago/Turabian StyleRoumi, Soheil, Fan Zhang, and Rodney A. Stewart. 2022. "Global Research Trends on Building Indoor Environmental Quality Modelling and Indexing Systems—A Scientometric Review" Energies 15, no. 12: 4494. https://doi.org/10.3390/en15124494
APA StyleRoumi, S., Zhang, F., & Stewart, R. A. (2022). Global Research Trends on Building Indoor Environmental Quality Modelling and Indexing Systems—A Scientometric Review. Energies, 15(12), 4494. https://doi.org/10.3390/en15124494