Article

Carbon Capture Utilisation and Storage Technology Development in a Region with High CO2 Emissions and Low Storage Potential—A Case Study of Upper Silesia in Poland

by
Anna Śliwińska
1,
Aleksandra Strugała-Wilczek
1,*,
Piotr Krawczyk
1,
Agnieszka Leśniak
1,
Tomasz Urych
2,
Jarosław Chećko
2 and
Krzysztof Stańczyk
1
1
Department of Energy Saving and Air Protection, Central Mining Institute, Plac Gwarków 1, 40-166 Katowice, Poland
2
Department of Geology, Geophysics and Surface Protection, Central Mining Institute, Plac Gwarków 1, 40-166 Katowice, Poland
*
Author to whom correspondence should be addressed.
Energies 2022, 15(12), 4495; https://doi.org/10.3390/en15124495
Submission received: 6 May 2022 / Revised: 3 June 2022 / Accepted: 17 June 2022 / Published: 20 June 2022

Abstract

:
The region of Upper Silesia, located in southern Poland, is characterised by very high emissions of carbon dioxide into the air—the annual emission exceeds 33 Mt CO2 and the emission ‘per capita’ is 7.2 t/y in comparison to the EU average emission per capita 6.4 t/y and 8.4 t/y for Poland in 2019. Although in the region there are over 100 carbon dioxide emitters covered by the EU ETS, over 90% of emissions come from approximately 15 large hard coal power plants and from the coke and metallurgical complex. The CCUS scenario for Upper Silesia, which encompasses emitters, capture plants, transport routes, as well as utilisation and storage sites until 2050, was developed. The baseline scenario assumes capture of carbon dioxide in seven installations, use in two methanol plants and transport and injection into two deep saline aquifers (DSA). The share of captured CO2 from flue gas was assumed at the level of 0.25–0.9, depending mainly on the limited capacity of storage. To recognise the views of society on development of the CCUS technologies in Upper Silesia, thirteen interviews with different types of stakeholders (industry, research and education, policy makers) were conducted. The respondents evaluated CCU much better than CCS. The techno-economic assessment of CCUS carried out on a scenario basis showed that the economic outcome of the scenario with CCUS is EUR 3807.19 million more favourable compared to the scenario without CO2 capture and storage.

1. Introduction

1.1. Carbon Dioxide in the Context of Climate Changes

Dynamic economic growth entails a rise in living standards in many countries; however, it also causes increasing carbon dioxide emissions and reductions in natural resources. Many people that, since the 1970s, when the first major environmental regulations were established, such policies have had damaging impacts on companies’ competitiveness and global economic growth. The pollution haven hypothesis suggests that developed countries impose tougher environmental policies than do developing countries, which results in polluting industries shifting their operations from developed countries that are working hard to reduce emissions to developing countries with less stringent environmental restrictions. That is particularly worrying in the case of global pollutants such as carbon dioxide, because in addition to its negative impact on the country’s economy, the efforts to reduce emissions could, according to the pollution haven hypothesis, be significantly offset by increased emissions in other countries. However, many authors [1,2,3,4] claim that mitigation of GHG would boost efficiency, productivity, and innovation. Porter and van der Linde [5] argue that more stringent climate policies can actually encourage investment in developing new clean technologies and cost-cutting efficiency improvements, leading to energy savings, and in turn can help companies achieve global technology leadership and expand their market share and finally reduce or completely offset some of the climate protection costs.
The IPCC Sixth Assessment Report [6], published in August 2021 clearly indicates that unless there is an immediate, rapid, and large-scale reduction of greenhouse gas (GHG) emissions, the achievement of the goals adopted in 2016 in the Paris Climate Agreement will be impossible. According to the Report, human-induced GHG emissions are responsible for around 1.1 °C of warming if we compare the two periods 1850–1900 (these years are taken to represent the earliest period of sufficiently globally complete observations to estimate global surface temperature, and is used as an approximation for pre-industrial conditions) and 2011–2020.
All scenarios assume an inevitable 1.5 °C rise in the Earth’s temperature over the next 20 years. Assuming the current path of CO2 emissions, by 2100, the temperature will rise by at least 2.7 °C and could cross a critical threshold, causing rapid changes and climate events that will threaten the existence of our civilisation [3,6,7].
Up to 80% of global carbon dioxide emissions are caused by human activities [3,8,9]. Despite global measures to contain the spread of COVID-19 and the associated temporary emission reductions, the concentration of CO2 in the atmosphere has continued to increase in recent years, and the expected decrease in the growth rate was not detectable. It is estimated that each 1000 Gt of cumulative CO2 emissions will cause an increase in global surface temperature of about 0.45 °C, and this value is defined as the transient climate response to cumulative CO2 emissions (TCRE). This means that achieving at least zero net anthropogenic CO2 emissions is a prerequisite for limiting human-made global warming [6].

1.2. Activities on a Global Scale

In recent years, measures have been taken to protect the climate on a global scale, starting with the Kyoto Protocol in 1997, through the Doha Amendment in 2012, and finally the Paris Climate Agreement in 2015, the main goal of which was to limit the increase in global average temperature to well below 2 °C or even 1.5 °C through the implementation of Nationally Determined Contributions (NDCs) and cutting GHG emissions by up to 90% within three decades [10]. In 2020, Low Emissions Development Strategies (LEDS) were prepared, and in December 2019 the European Green Deal (EGD) was announced in terms of supporting the EU’s transition to a climate neutral economy by reducing carbon emissions by at least 50% by 2030 and achieving carbon neutrality by 2050 [11,12]. In July 2021, the European Commission adopted a package “Fit for 55”, a part of EGD which modernises existing legislation in line with the European Union’s 2030 climate goals, as well as introduces new policy measures that can help with the economic, social and industrial change accompanying the climate transition, reducing net emissions by at least 55% (compared to 1990) by 2030 and achieving climate neutrality by 2050, and therefore aims to strengthen the EU’s position as a global climate leader. It is also impossible not to mention the United Nations Climate Change Conference in Glasgow (COP26) and the Glasgow Climate Pact adopted there in November 2021.
The basis for achieving zero emissions by 2050 is primarily the implementation by decision makers of plans and a decisive acceleration of the departure from technologies emitting large amounts of carbon dioxide. CO2 removal is a key tool on the path to net zero emissions, provided that emissions are simultaneously reduced quickly and efficiently [6,13]. CCUS (Carbon Capture Utilisation and Storage) is not the latest technology [14], but its potential and the fact that it can be an important part of international climate improvement policies have only been recognised relatively recently. The most significant global carbon emitters are China, the United States, the EU, Russia, India, Japan, the UK and Australia [15]. It is worth noting that China is responsible for 27% of global CO2 emissions, and has been the largest carbon emitter since 2008 [8,16], and although Europe is making an immense effort to fight climate change, it still remains the world’s third-largest emitter of GHG.

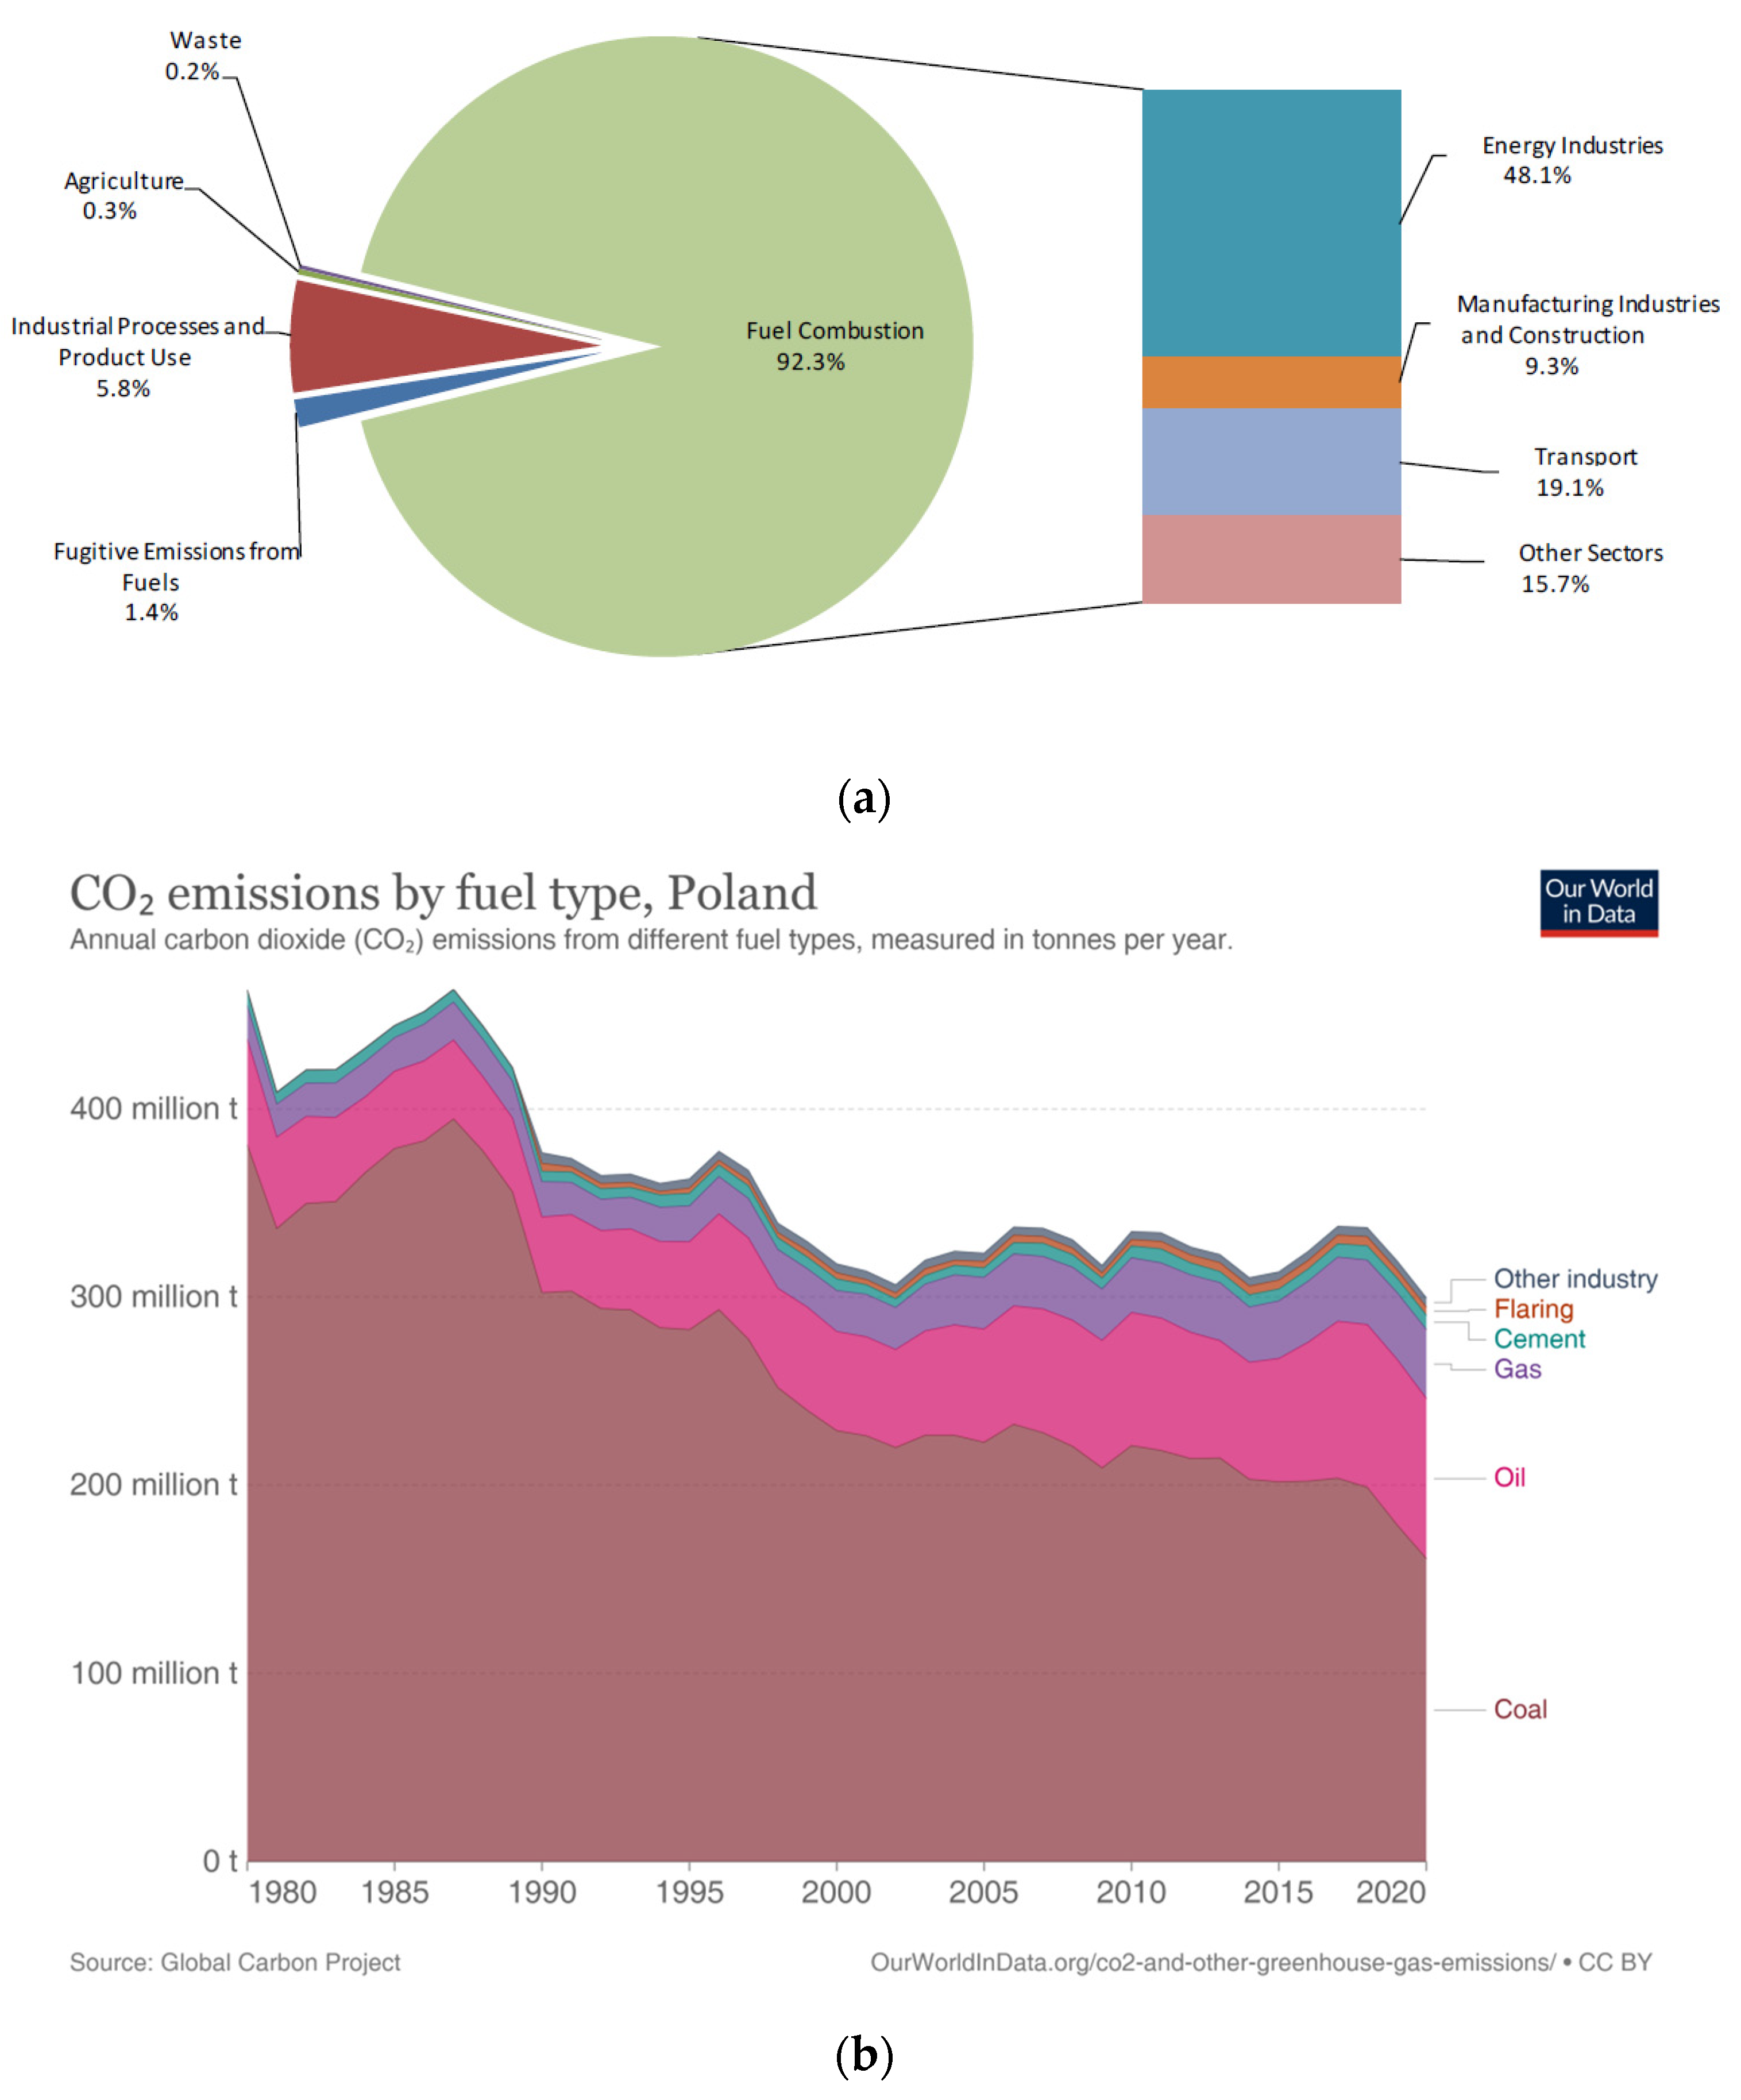
1.3. Poland’s Situation and Policy with Regard to the European Zero-Emission Strategy by 2050

The high share of coal in the Polish energy balance contributes to large greenhouse gas emissions. The CO2 emissions in 2018 amounted to 337.71 million tonnes, mainly from fuel combustion. Emission of another important greenhouse gas, methane, amounted to 48.75 million tonnes CO2 eq in 2018, with 47% of emissions coming from the energy sector (mainly fugitive emissions from fuels), 30% from agriculture and 23% from the waste sector. It should be noted that a large share of methane emissions takes place in the Upper Silesia area—about 455 kt of CH4 according to [17], which corresponds to 11.34 million tonnes CO2 eq, assuming GWPCH4 = 25. The main sources of CO2 emissions are given in Figure 1.
Although the total share of energy produced from coal in the Polish energy mix fell from 87.63% to 79.56% from 2012 to 2018 [20], in 2018, Poland was still the sixth largest consumer of electricity in the EU and the second (after Germany) largest producer of electricity from hard coal (80 TWh) and lignite (49 TWh).
Poland’s GHG reduction strategy is set out in three strategic documents: a. National Energy and Climate Plan for the years 2021–2030 (NECP PL); b. Polish Energy Policy until 2040 (PEP2040); and c. Polish Hydrogen Strategy. PEP2040 targets are consistent with NECP PL and assume an evolutionary transformation of the electricity generation sector in a lower-emissions direction, at a pace that ensures energy security and does not threaten the competitiveness of the economy. The targets assume that by 2030 there will be a 30% reduction in CO2 emissions (compared to 1990), a 23% reduction in primary energy consumption, the share of RES in gross final energy consumption will be 23%, and the share of coal in electricity generation will not exceed 56%. It is also planned to implement nuclear energy in 2033. The reduction of carbon dioxide emissions will be achieved mainly through actions in the energy sector (Figure 2).
As potentially low- or zero-carbon use of coal would allow partial continued use of coal-fired generating units, the implementation of new technologies such as coal gasification and carbon sequestration (CCS) or carbon utilisation (CCU) is being considered, but will depend on economic viability and carbon dioxide emission allowance prices. Hydrogen production using CCS/CCU technology integrated with steam reforming of hydrocarbons, coal and biomass gasification is included in the Polish Hydrogen Strategy, and in August 2021, the Minister of Climate and Environment appointed a team to develop CO2 capture, utilisation and storage technologies.
As natural gas was to be an important transition fuel in Poland’s energy transformation, Poland’s energy policy will have to be revised in the face of Russia’s interruption of gas supplies to Poland. The instability of the energy market is a factor that makes long-term investment planning difficult, but in the current political situation, consideration of CCUS technologies becomes even more expedient.

1.4. STRATEGY CCUS and Aims of the Paper

One of the projects supporting the development of CCUS which is a key solution in the way of completely abandoning the use of coal is the three-year European project STRATEGY CCUS (www.strategyccus.eu (accessed on 16 June 2022)). The project covers eight selected regions located in seven countries from Southern and Eastern Europe (Spain, France, Greece, Portugal, Croatia, Romania and Poland), which together account for 45% of CO2 emissions from industrial production and energy in Europe. The project includes the development of local business plans and models, providing methodologies and sharing best practices, engaging with local and national stakeholders, and helping to build a common pan-European CO2 transport and storage infrastructure.
The main goal of this paper is to present strategic plans for the development of CCUS technologies in one of the polish regions. The scope of this work includes mapping the technical potential of CCUS clusters in the Upper Silesia which is Poland’s most industrialised region, estimating the economic and environmental costs of CCUS projects, stakeholder participation, social acceptance issues and planning CCUS scenarios along with a full technical and economic assessment in long term perspective of implementation.

2. Upper Silesia Emitters and CO2 Storage Possibilities

2.1. Description of Upper Silesia Region

The Silesian Voivodeship is a highly urbanised region located in the southern part of Poland. It covers an area of 12 333 km2 (3.9% of the country), and has a population of 4.5 million (11.8% of Poland’s population). As much as 76.6% of the population lives in towns and cities, and the GDP (gross domestic product) of the Silesian Voivodeship is PLN 260,532 million (12.3% of Poland’s GDP), of which PLN 78,130 million is related to industry, and PLN 62,437 million is related to trade. Despite high urbanisation, the region is characterised by rich biodiversity and a high level of forest cover (32.1%). Upper Silesia is part of the Silesian Voivodeship and is the most industrialised region in Poland, with total annual CO2 emissions exceeding 33 Mt. The region’s industry is diversified and represented by almost all mining and processing industries, with a strong mining industry (16 coal mines) and a strong energy sector (about 7 GW of capacity, representing 20% of the total installed capacity in utility power plants). In 2017, the region consumed 27,564 GWh of electricity, which was 16.9% of the energy consumed at the national level.
In the Silesian Voivodship, as many as 79,500 workers are employed in coal mines, out of a total of 185,000 in the entire European Union. Upper Silesia has already undergone industrial transformation in the years 1990–2000, when the greatest reduction in mining employment took place. However, the social and economic problems following the restructuring of the coal mining industry carried out since the 1990s are still being felt, and the current plans to close mines continue to arouse strong social resistance.
Upper Silesia concentrates large industrial emitters, such as coal-fired power plants and heating plants, steelworks (blast furnace, rolling mill, sinter plant) and coking plants. The voivodeship faces the problem of air pollution not only due to emissions associated with the developed industrial sector, but also due to low stack emissions (e.g., SO2, NOx, particulate matter). Electricity and heat are produced mainly from hard coal and natural gas, but it is worth emphasising that the share of renewable energy sources is currently growing rapidly, e.g., electricity production from small-scale RES installations in Poland increased from 176.6 GWh in 2016 to 532.1 GWh in 2021 [22].

2.2. Methodology of Scenario Development

The development of the scenario within the project consisted of four steps:
  • Identification of individual elements in the region: emitters, utilisation plants, storage sites and transport connections; emitters were identified mainly on the basis of EU-ETS data for 2018.
  • Characterisation of elements [23] involving the collection of key data and maps on the following components: characteristics and location of emitters; reported CO2 emissions with year and data source; decarbonisation alternatives; CO2 concentration; gas composition and characteristics such as temperature, pressure, flow rate and variability; number of emission points; heat availability; fuels used with composition and consumption; products and co-products; utilities, including electricity, water, etc.; transport network–rail connections; available pipeline network; ports; and storage sites, including area, depth, thickness, perforation, porosity, permeability, temperature, pressure, seal and capacity.
  • Scenario development—possible future development of the CCUS chain modelled as a network from now until 2050. The main elements of the scenario were emitters, hubs, clusters, transport modes, storage sites, utilisation plants [24].
  • Techno-economic assessment of the possible role of CCUS in the region in achieving the “net zero” target by 2050; calculation of Key Performance Indicators (KPIs) using the methodology and Microsoft Excel tool developed in the STRATEGY CCUS project [25].

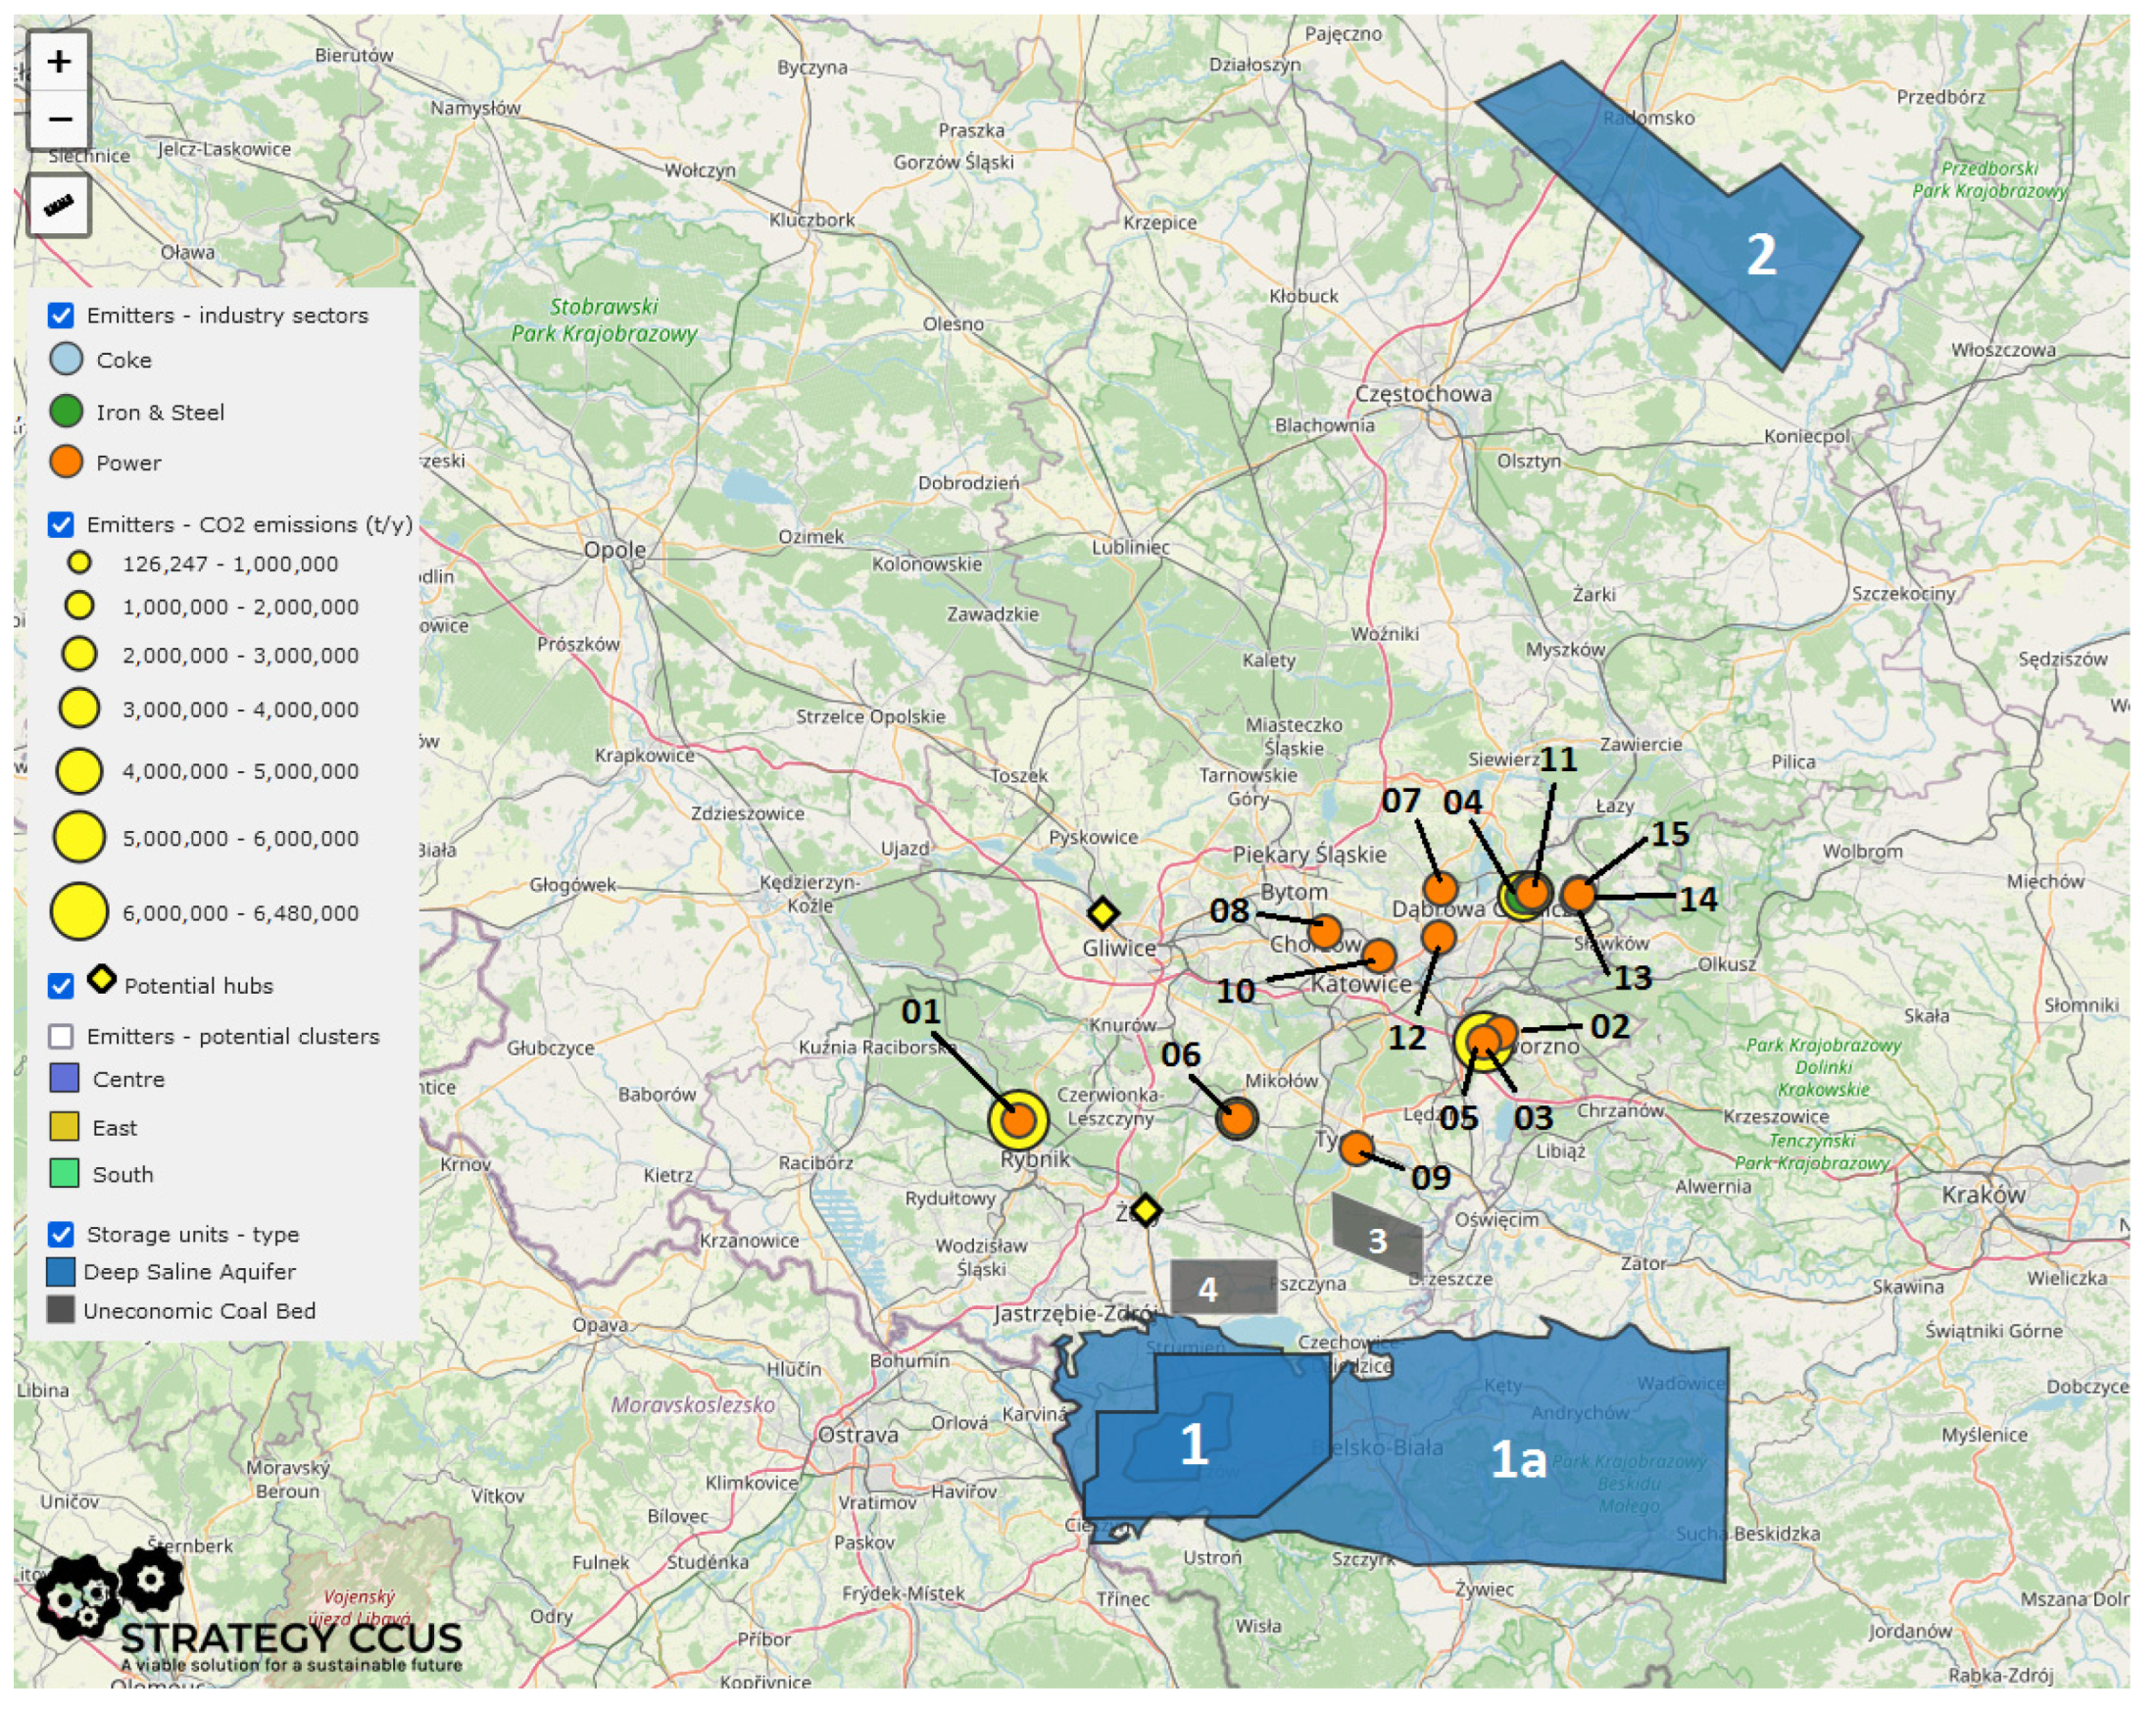
2.3. Identification and Characteristics of the Main CO2 Emitters and the Storage Potential in Upper Silesia

Although in Upper Silesia there are over 100 carbon dioxide emitters covered by the EU ETS identified in Step 1 and emitting 33 Mt yearly, over 90% of emissions come from the 15 large power facilities presented in Table 1, and owned by the companies Tauron, CEZ and PGE GiEK, as well as from the coke and metallurgical complexes (ArcelorMittal, JSW Koks, TAMEH). The most important CO2 emitters in Upper Silesia and their annual emissions reported in the years 2017 and 2018, characterised in Step 2, as well as the unit New Jaworzno launched in 2021, are presented in Table 1. Existing emitters that are considered in the proposed CCUS scenario are highlighted in bold. Two additional emitters expected to be built in the future were also taken into account in the scenario: CCGT New Rybnik (800 MW) and IGCC Łaziska (250 MW).
The possibility of CO2 sequestration in geological formations in the region of Upper Silesia in Poland have been investigated by several authors [26,27,28,29,30,31]. Based on these studies, four possible CO2 storage sites have been identified, with a total estimated capacity of 111.5 Mt (Table 2).
In terms of the storage capacity of sites, it is only sufficient for the needs of a single medium-sized emitter in Upper Silesia, e.g., a CHP plant. It should be noted that at present, preliminary studies are being carried out on the use of various transport technologies for additional CO2 storage sites, e.g., saline aquifers located in other parts of Poland [26] or on the concept of constructing a pipeline over 300 km long to transport CO2 from a power plant to a depleted natural gas reservoir.
Both the locations of the largest emitters of CO2 and the approximate locations of the storage sites are shown in Figure 3.
The most adequate conditions are present in deep saline aquifers in the Miocene deposits of the Dębowiec Beds, which is located to the west of Bielsko-Biała between Cieszyn and Czechowice-Dziedzice (SU#01) [27,28,29]. The results obtained in the initial numerical simulations for Debowiec layers made it possible to analyse the changes in parameter characteristics for the geological process of CO2 storage in this region, i.e., pressures at the bottom of injection wells, maximum pressure in the rock mass, pressure gradient with depth, and excess pressure in the roof layers of the structure caused by CO2 injection in relation to the primary pressure in the rock mass. The optimal variant of the simulation regarding safe CO2 storage in the rock mass, i.e., excluding the possibility of unsealing overburden rocks and uncontrolled leakage of injected carbon dioxide, is a variant with a total amount of injected CO2 of approximately 8.54 million Mg during 25 years of injection using one horizontal well [28]. Within the framework of conducted numerical simulations, several scenarios of CO2 injection processes were performed using numerical models of real deposit structures. Model tests and numerical simulations were carried out using the Petrel Reservoir Engineering software [32] and the ECLIPSE reservoir simulator [33]. The scope of the research included the determination of the initial conditions in the rock mass within the analysed aquifer. The injection parameters and the location of the injection wells have been determined. A series of simulations of the injection process were carried out to obtain the information about the injection efficiency and the properties of CO2 stream, the vertical profiles of CO2 concentration as a function of time, the CO2 flow in the rock mass (including information about phase behaviour), the tightness of the overburden deposit, storage capacity and pressure drops in the saline aquifer. The next step of the work was to assess the sensitivity of the model on some initial parameters including the temperature and the degree of hydrodynamic openness of the structure. As a part of the risk assessment of the modelled process, the critical parameters influencing potential leakage of CO2, including the maximum pressure in the reservoir and the maximum injection rate were identified [28].
Storage capacity has also been identified in DSAs in marine deposits of the Jurassic Czestochowa District (SU#02). Estimated storage capacity for the two UCB areas located in the Pawłowice-Mizerów (SU#04) and Studzienice-Międzyrzecze (SU#03) is relatively small; however, it can be exploited by the local industry along with methane extraction (ECBM) [30,31].
Considering the low storage capacity of the UCB areas (SU#03, SU#04), only storage of carbon dioxide in DSA was included in the scenario (SU#01, SU#02). For the SU#01 saline aquifer (Skoczów area), it will be necessary to further confirm the injection parameters with borehole tests. It has been assumed that such studies will take about 3 years, and CO2 injection will be possible from 2025. Additional model studies will be required for the SU#02 saline aquifer near Częstochowa; thus, CO2 injection can be considered there starting from 2027. The characteristics of DSAs assumed for the baseline CCUS scenario are presented in Table 3.

3. The Scenario of CCUS in Upper Silesia

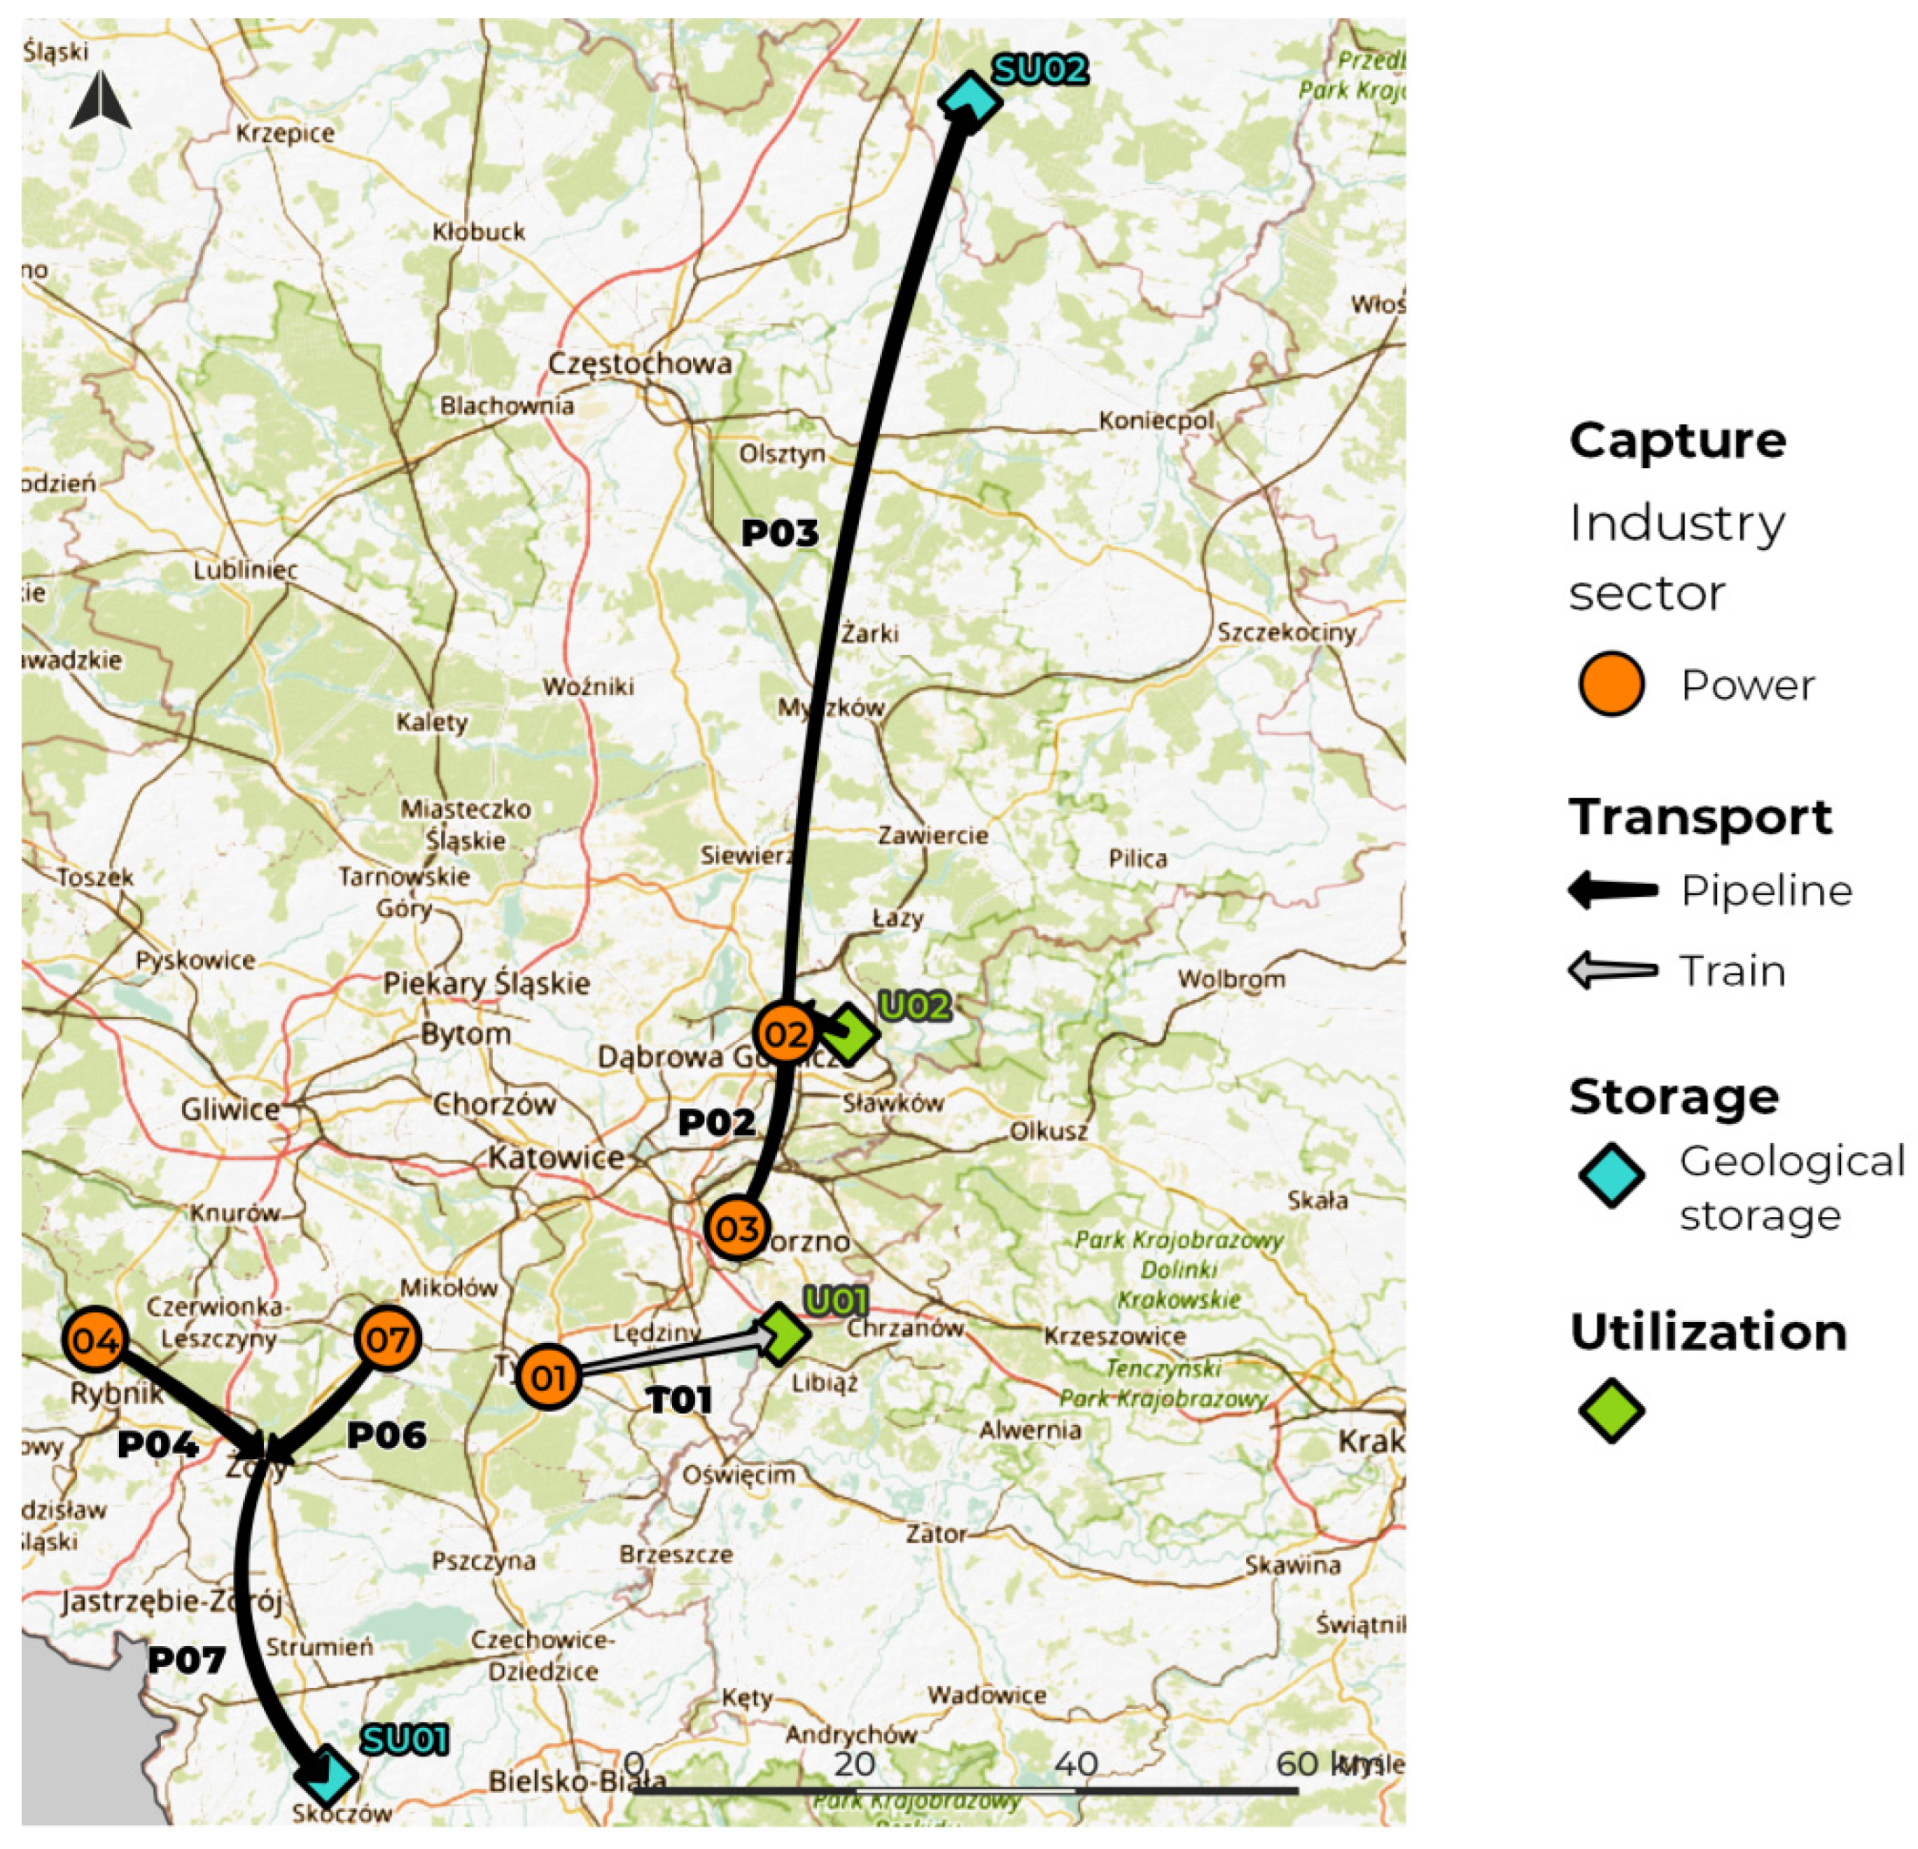
3.1. Clusters of Emitters, Transport, and Sequestration in Geological Structures

The high carbon dioxide emissions in Upper Silesia are mainly linked to the production of electricity and heat in large, centrally managed power units built in the 1970s and 1980s, which are now obsolete. The energy system is currently undergoing constant transformation—the new coal power plant ‘New Jaworzno’ (910 MW) was commissioned in 2020, and two old 450 MW energy blocks in the power plant ‘Rybnik’ were shut down in 2021. Moreover, further changes are planned, for example, the launch of a new CCGT unit with a capacity of 800 MW in Rybnik city from 2027. Ongoing transformation of the power sector was taken into account during construction of the CCUS scenario in Upper Silesia; however, it should be highlighted that the future actions in the power industry related to planned power plant shutdowns or construction are uncertain. Nonetheless, given the high investment in CCUS technology, it is justified to implement it in new power plants that have an expected lifetime that would allow them to recoup their investment. In accordance with EU law, new installations are designed to be CCUS-ready, which has the added advantage of reducing deployment costs. Therefore, new or future power plants E#03, E#04 and E#07 are included in the scenario. Due to the interest of the coking plant owner in the possibility of CO2 capture and methanol production, two additional small emitters E#05 and E#06 are included in the scenario. A smaller emitter, i.e., the heat plant E#01 is included in the scenario to assess the possibility of rail transport and the proximity of chemical plant. The location of power plant E#02 allows the creation of a hub and benefit from common infrastructure. Moreover, this power plant produces electricity for the steel mill, and reducing CO2 emissions from it would affect the carbon footprint of the steel produced, increasing the competitiveness of Polish steel. In summary, during the construction of the scenario, the following criteria were taken into account: emitter age, available storage capacity, short distance from the emitter, the possibility of sharing the infrastructure, including the possibility of CO2 utilisation.
The baseline scenario established in Step 3 assumes the capture of carbon dioxide at seven installations (from more than one hundred identified in the region during the Step 1), usage of captured CO2 in two methanol plants, and transport and injection of CO2 into two deep saline aquifers (DSAs). Two hubs, where the pipelines could be connected, would facilitate transport of CO2. The first hub, connecting the pipelines from Rybnik E#04 and Łaziska E#07, could be located near the city of Żory, from where CO2 would be transported further south to the DSA SU#01. The second hub would connect the pipelines from Jaworzno E#03 and Dąbrowa Górnicza E#02 to transport CO2 north to the DSA SU#02. In addition, the methanol plant U#02 is planned to be connected to the second hub by a pipeline to enable the transfer of CO2 to the storage site in the event of a breakdown or interruption in the operation of the methanol plant located in JSW in Dąbrowa Górnicza city (emitters E#05, E#06 and methanol plant U#02). Figure 4 shows the location of emitters and pipelines adopted in the baseline scenario (until 2050).
According to the baseline scenario assumptions (Table 4), CO2 capture from emitters in Upper Silesia could start in 2025–2027. The share of captured CO2 from flue gases is assumed to be between 25% and 90%, and depends mainly on limited storage capacity. Better identification of storage sites will be necessary at the initial stage of investment. As the area is poorly serviced by boreholes, increasing the potential storage capacity will only be possible after promising reservoir parameters are obtained in additional boreholes. In the case of the Częstochowa DSA, model tests will additionally have to be carried out.
Due to the large quantities of captured CO2, the primary means of transport should be by pipeline, which is why the scenarios assume the construction of new pipelines. For one capture installation, the assumption of a relatively small amount of CO2 rail transport from Tychy heat plant to the Chemical Plant in Oświęcim city was considered. The last transport option considered was river transport from the Port of Gliwice (class III) along the Gliwice Canal, then along the Oder river to the Port of Świnoujście (Baltic Sea), where an LNG terminal is currently operating, and from where CO2 could be transported to an offshore storage site. However, due to the lack of a potential offshore storage site and the risk of transport interruptions due to low water levels, it was finally decided not to consider the river transport option.

3.2. Possible Utilisation of Carbon Dioxide

Construction of two methanol production plants in Upper Silesia was considered in scenarios as a possibility for CO2 utilisation. For the first one (U#01), transport of CO2 by train-tanker was assumed from the combined heat and power plant Tychy (E#01) to a chemical plant producing chemical raw materials, including rubber and polystyrene, and located approximately 30 km away. The second methanol plant (U#02) was included in the scenario as a result of consultations with stakeholders in the STRATEGY CCUS project. For the purposes of the scenario, CO2 capture from power plants and CHP plants producing electricity and heat for coking plants was assumed (E#05, E#06). The transport of CO2 was not considered, as the production of methanol would take place in the vicinity of the capture installation. The characteristics of the utilisation units considered in the long-term baseline scenario are presented in Table 5.
CAPEX and OPEX of the methanol production plant from CO2 were determined on the basis of literature data [34]. The production of methanol (MeOH) using H2 and captured CO2 as feedstocks was analysed. The MeOH production plant evaluated produces 440 ktMeOH per year and its configuration is a result of implementation in CHEMCAD (v. 6.13). For the production volume of 350 ktMeOH/y, the following cost indicators were adopted [34]:
-
Total investment (CAPEX): 175 MEuro;
-
FIX OPEX: 640 MEuro/tMeOH.
VARIABLE OPEX, including electricity costs, was calculated in the tool developed in the STRATEGY CCUS at the level of 4.59 M EUR/y.

4. Social Acceptance of the Proposed Scenario

Part of the research into public acceptance involved the Regional Stakeholder Committee in the STRATEGY CCUS project in order to recognise the views of stakeholders and society on the development of CCUS technologies in Upper Silesia. The next stage was to identify appropriate actors for social discussion on CCU and CCS issues, and to conduct semi-structured interviews with thirteen selected representatives of different sectors (politics and policies, research and education, industry—demand side and supply systems, support organisations, NGOs, experts). In total, over one hundred such interviews were conducted in seven participating countries [35]. Respondents were rather positive about the development of CCUS technologies in Upper Silesia as one of many options for reducing CO2 emissions, with the vast majority of interviewees having some concerns and a sceptical or negative attitude to CCS, evaluating CCU technologies much more positively. The interviewees emphasised the role of CCUS in slowing down the decline of the coal industry in the region and providing new employment opportunities in CCUS-related industries. On the other hand, they indicated many challenges and barriers to CCUS implementation, like high economical costs (initial costs related to infrastructure investments, higher energy costs due to reduction of power plant energy efficiency), insufficient market potential of CCU-based products, uncertainties about the environmental effects of CCS, limited CO2 geological sites storage possibilities, social opposition, lack of financial support, and legal regulations.
Regarding the scenario proposed for Upper Silesia, stakeholders’ opinions varied widely; however, the vast majority of stakeholders considered the presented scenario to be likely to happen, desirable, and positive, with the proviso that CCUS is only one way of reducing the amount of CO2 in the environment. Experts emphasised that the scenario should additionally take into account the strong development of renewable energy sources, the closure of individual power plants and heat and power plants, environmental impact assessment, research on the carbon footprint of the investment and development of the hydrogen economy. Some of the stakeholders drew attention to the environmental issues, as well as the most cost-effective solutions for CO2 capture in coking plants, where there have been no such implementations in Poland so far. It is worth mentioning that stakeholders emphasised that the 10-year perspective is too short for the development of CCUS, while the distant perspective cannot be afforded [35].

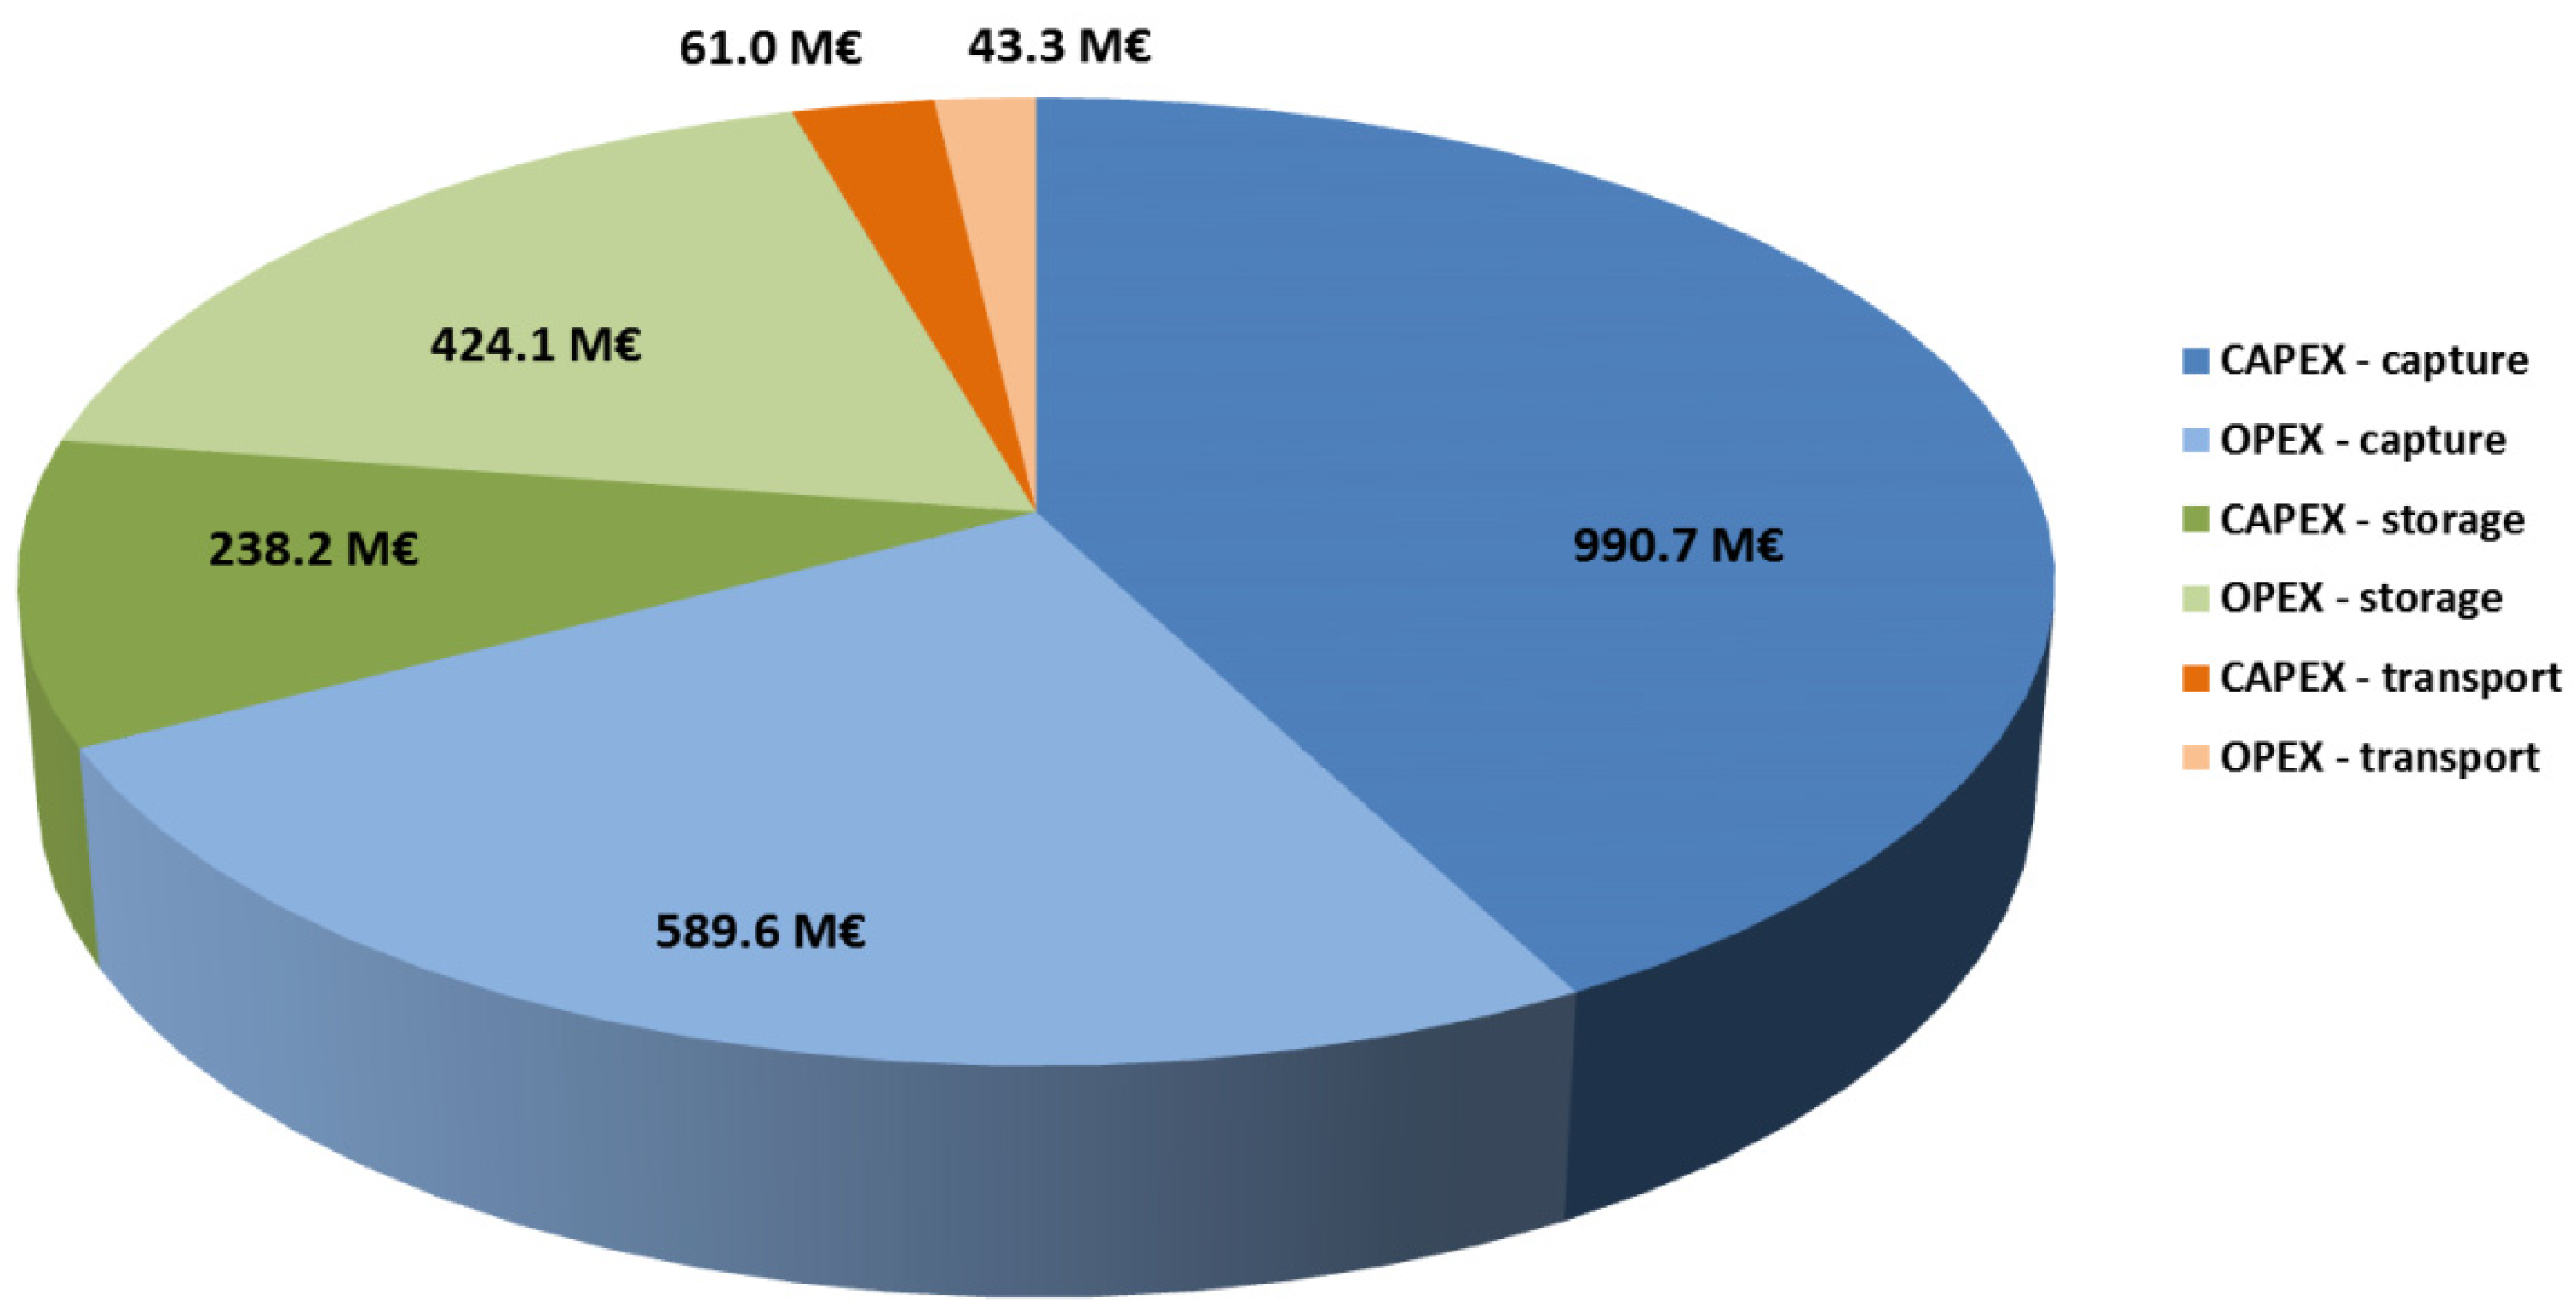
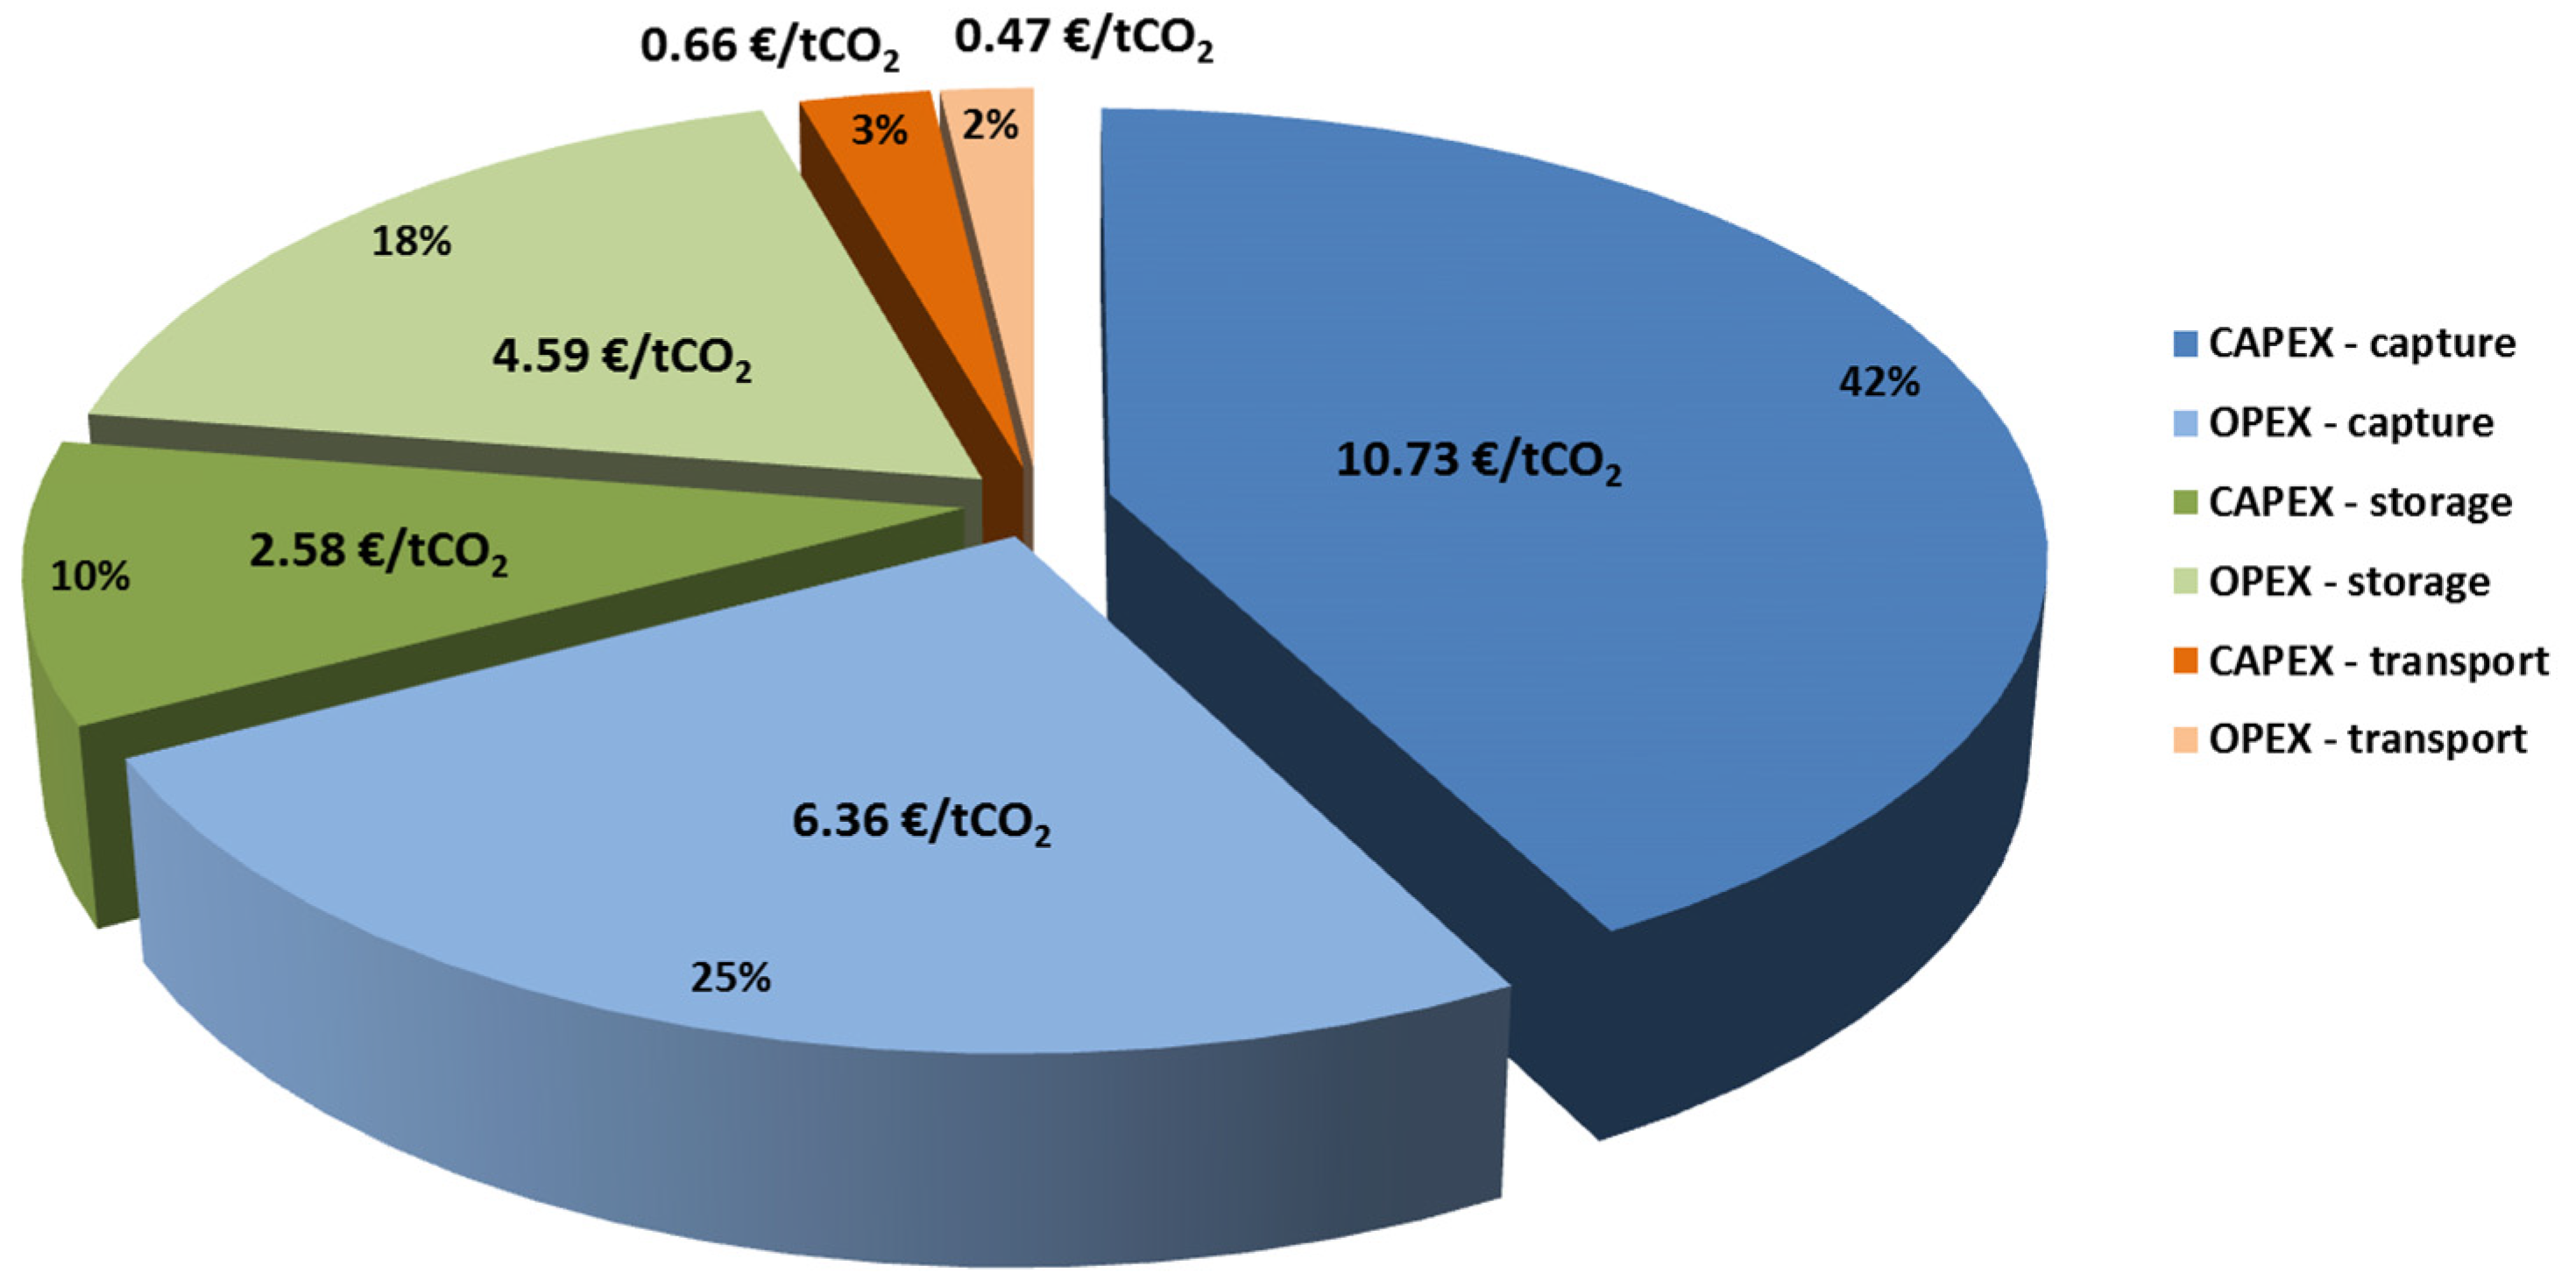
5. Economic Evaluation of the Proposed Solutions

The economic evaluation of proposed solutions was carried out with the calculation assumptions resulting from the current forecasts and legal regulations for the territory of Poland [36]. The common economic data and regional sites specific data used in the analyses are presented in Table 6.
Detailed calculation assumptions are presented in the reports on the implementation of the STRATEGY CCUS project [37,38]. In addition, the detailed cash flows that represent the computations of the reported results are provided in Table A1.
Economic evaluation covers the scenario containing the following installations and CCS infrastructure, described in the previous chapters of this article:
-
CO2 capture installations located at seven power plants;
-
Infrastructure for the transport of captured CO2 (railways, pipelines);
-
Two installations for underground CO2 storage.
Total discounted CAPEX was estimated at EUR 1289.8 M, including capture (EUR 990.7 M), transport (EUR 61.0 M) and storage (EUR 238.2 M). The total discounted OPEX for the analysed period amount to EUR 1054.3 M, including capture (EUR 586.9 M), transport (EUR 43.3 M) and storage (EUR 424.1 M). Therefore, the total discounted CAPEX and OPEX amount to EUR 2344.2 M (Figure 5).
Per 1 tonne of CO2 avoided (undiscounted value equal to 92.315 Mt CO2), the total discounted CAPEX and OPEX are 25.39 EUR/tonne CO2 calculated (Figure 6), including:
-
Capture: 17.09 €/t CO2,
-
Transport: 1.13 €/t CO2,
-
Storage: 7.17 €/t CO2.
The CAPEX of the CO2 capture installations are the main component of the total cost of the scenario. They constitute as much as 42.3% of the sum of discounted capital expenditures and operating costs. The operating costs of CO2 capture installations are also significant: they account for approximately 55.8% of the discounted capital expenditures and operating costs.
In the scenario with CCUS, the discounted ETS costs of emit non-captured CO2 were calculated at EUR 16,033.28 M. The total cost of the CCUS scenario is thus EUR 18,377.46 M. On the other hand, the discounted ETS costs in the scenario without CCUS were estimated at EUR 22,184.65 M. This means that the scenario without CCUS is more expensive than the scenario with CCUS. Net present value (NPV) calculated for the analysed scenario with CCUS is equal to EUR 3807.19 M. Detailed calculation of NPV is presented in Appendix A. The positive economic result of the CCUS scenario was decisively influenced by projected very high price increases on allowances for CO2 emission (249.85 EUR/tCO2 in 2050 against 46.30 EUR/tCO2 in 2021) and long service life of the CO2 capture installations.
The obtained NPV calculation results were subjected to a sensitivity analysis to determine the impact of changes in selected input variables on the level of NPV of the analysed scenario. In the first step, the expected value of this indicator, which is the most realistic under the given conditions of investment uncertainty, is calculated. Then, changes in the values of successively selected variables are made and the strength and direction of the impact of these variables on the level of efficiency is examined. Each of the input variables may be changed by a certain number of percentage points above or below the expected value while maintaining other conditions unchanged. In addition, a new value of the economic efficiency indicator is calculated for each of changed values, compared to the baseline scenario. The scope of the analysis is limited to the variable that has the greatest impact on the result, i.e., the NPV. In this case, the price of CO2 emission allowances is the so-called critical variable [39].
Changes in the price of CO2 emission allowances were analysed in terms of deviation ranges: ±10%, ±30%, and ±50%. Additionally, allowance prices were determined at which the value of NPV was equal to 0. Table 7 presents the results of the sensitivity analysis, which show how the identified critical variables affect the NPV values obtained.
The results of the sensitivity analysis show that even with a significant reduction (by about 61.89%) in the price of CO2 emission allowances compared to the assumed forecast, the scenario with CCUS remains economically efficient.

6. Conclusions

Upper Silesia is a region that contains a lot of CO2 emitters, while at the same time being characterised by a low storage potential. It seems that the CO2 capture rate should be such as to fill up the storage sites. CCUS is seen as one of the many options for reducing CO2 emissions, with the vast majority of local communities having some concerns and a sceptical or negative approach to CCS technology, while perceiving CCU technologies much more positively. Ongoing work on legislative changes concerning CO2 storage in Poland on definitions, concessions and environmental decisions, as well as changes in energy law, give hope for the possibility of developing CCUS technology in Poland. Undoubtedly, the development of CCUS technology in the region, but also on a larger scale, requires support from EU politics and policy and government, as well as regional or national authorities. It seems that clean coal technologies, including carbon capture, utilisation and storage (CCUS), can support and enable such evolutionary transformation while meeting European climate goals.
The main component of the total cost of the CCUS scenario are the capital expenditures associated with the CO2 capture installations, which amount to over 42% of the sum of discounted capital expenditures and operating costs. The costs associated with maintaining these installations (OPEX) are also significant, amounting to almost 56% of the discounted CAPEX and OPEX. The EUR 3807.19 million more favourable economic outcome of the scenario with CCUS compared to the scenario without CO2 capture and storage is related to the projected high increase in CO2 emission allowance prices (EUR 249.85/tonne of CO2 in 2050 versus EUR 46.30/tonne of CO2 in 2021) and the assumed long lifetime of CO2 capture facilities (until 2050). The results of the sensitivity analysis show that even with a significant reduction in the prices of CO2 emission allowances in relation to the adopted forecast, the scenario with CCUS is economically efficient.
The presented scenario of the CCUS strategy in Upper Silesia is the first attempt to find a partial solution to the excessive CO2 emissions in the region by showing possible projects related to the sequestration and use of carbon dioxide.

Author Contributions

Conceptualization, K.S., A.Ś., T.U., J.C. and P.K.; methodology, K.S., A.Ś., P.K., A.L.; software, A.Ś., P.K.; validation, A.Ś., P.K.; investigation, K.S., A.S.-W., A.L., T.U., A.Ś., P.K.; resources, K.S., A.Ś., P.K.; data curation, A.Ś., A.L.; writing—original draft preparation, A.Ś., T.U., A.S.-W. and P.K.; writing—review and editing, A.S.-W., A.Ś., T.U., P.K.; supervision, K.S.; project administration, K.S.; funding acquisition, K.S. All authors have read and agreed to the published version of the manuscript.

Funding

This research was funded by the European Union’s Horizon 2020 research and innovation programme under grant agreement No. 837754.

Informed Consent Statement

Not applicable.

Data Availability Statement

Not applicable.

Conflicts of Interest

The authors declare no conflict of interest.

Abbreviations

CAPEXcapital expenditures
CCGTCombined Cycle Gas Turbine
CCUSCarbon Capture, Utilisation and Storage
CHP plantCombined Heat and Power Plant
CSRCorporate Social Responsibility
DSADeep saline aquifer
Eemitter
ECBMenhanced coal bed methane
EGDEuropean Green Deal
EU ETSEuropean Union Emissions Trading System
GDPgross domestic product
GHGgreenhouse gas
GWPGlobal Warming Potential
Hhub
JCDJurassic Czestochowa District
KPIKey Performance Indicators
LEDSLow Emissions Development Strategies
LNGliquefied natural gas
LULUCFLand use, land-use change and forestry
MeOHmethane
NDCsNationally Determined Contributions
NECP PLNational Energy and Climate Plan for the years 2021–2030
NPVnet present value
OPEXoperating expenditures
PEP2040Polish Energy Policy until 2040
PGI-NRIPolish Geological Institute—National Research Institute
RESRenewable energy sources
SUstorage site
TCREtransient climate response to cumulative CO2 emissions
Uutilisation unit
UCBUneconomic coal bed
USCBUpper Silesian Coal Basin
yyear

Appendix A

Table A1. Cash flows and detailed calculation of NPV.
ItemUnitValue
2021202220232024202520262027202820292030
CO2 EU ETS emission price€/tonne46.3052.2558.2064.1570.1076.0582.0087.9593.9099.85
Total Reported CO2Mt/y11.6011.6011.6011.6011.6011.6011.6011.6011.6011.60
Total avoided emissionMt/y0.000.000.000.000.060.063.593.593.594.19
CAPEX undiscounted
CaptureM€/y0.006.967.0745.2068.2269.2370.2671.3072.3673.43
TransportM€/y0.000.070.083.293.653.744.004.104.204.31
StorageM€/y0.000.000.006.466.6214.6014.9615.3318.5217.55
OPEX undiscounted
CaptureM€/y0.000.000.000.004.474.5346.2246.9147.6051.12
TransportM€/y0.000.000.000.000.840.873.073.153.233.44
StorageM€/y0.000.000.000.000.000.0030.7731.5432.3335.77
NPV calculation
Discount factor 5%1.0000.95240.90700.86380.82270.78350.74620.71070.67680.6446
ETS costs without CCUS discounted (M€)537.31577.48612.61643.09669.27691.50710.10725.36737.55746.94
ETS costs with CCUS discounted (M€)537.31577.48612.61643.09666.07688.20490.40500.94509.36477.40
Cost of CCUS discounted (M€)0.006.706.4847.4768.9472.84126.32122.47120.64119.65
Cash flow discounted (M€)0.00−6.70−6.48−47.47−65.74−69.5393.38101.95107.55149.90
NPVM€3807.19
ItemUnitValue
2031203220332034203520362037203820392040
CO2 EU ETS emission price€/tonne107.35114.85122.35129.85137.35144.85152.35159.85167.35174.85
Total Reported CO2Mt/y11.6011.6011.6011.6011.6011.6011.6011.6011.6011.60
Total avoided emissionMt/y4.194.194.194.194.194.194.194.194.194.19
CAPEX undiscounted
CaptureM€/y74.5375.6376.7677.9079.0580.2381.4282.6383.8585.10
TransportM€/y4.414.524.644.754.874.995.125.255.385.51
StorageM€/y19.4618.4320.4419.3719.8520.3520.8621.3821.9122.46
OPEX undiscounted
CaptureM€/y51.8852.6553.4354.2355.0355.8556.6857.5258.3759.24
TransportM€/y3.523.613.713.803.904.004.104.204.314.42
StorageM€/y35.3837.5837.1839.4939.0640.0441.0542.0743.1344.21
NPV calculation
Discount factor 5%0.61390.58470.55680.53030.50510.48100.45810.43630.41550.3957
ETS costs without CCUS discounted (M€)764.81779.28790.63799.14805.05808.58809.95809.35806.98802.99
ETS costs with CCUS discounted (M€)488.81498.06505.32510.75514.53516.78517.66517.28515.76513.21
Cost of CCUS discounted (M€)116.14112.51109.22105.81101.9198.8395.8492.9590.1587.43
Cash flow discounted (M€)159.85168.70176.09182.57188.61192.97196.45199.12201.07202.35
ItemUnitValue
2041204220432044204520462047204820492050
CO2 EU ETS emission price€/tonne182.35189.85197.35204.85212.35219.85227.35234.85242.35249.85
Total Reported CO2Mt/y11.6011.6011.6011.6011.6011.6011.6011.6011.6011.60
Total avoided emissionMt/y4.194.194.194.194.194.194.192.022.022.02
CAPEX undiscounted
CaptureM€/y86.3687.6588.9590.2791.6192.9784.2885.5431.840.00
TransportM€/y5.655.795.946.086.246.396.552.922.993.07
StorageM€/y23.0225.5324.1924.7925.4126.0524.5119.2813.7814.12
OPEX undiscounted
CaptureM€/y60.1261.0161.9262.8463.7764.7265.6836.7337.2837.83
TransportM€/y4.534.654.774.895.015.145.273.023.093.17
StorageM€/y45.3246.4549.3448.8150.0351.2952.5731.8432.6433.45
NPV calculation
Discount factor 5%0.37690.35890.34180.32560.31010.29530.28120.26780.25510.2429
ETS costs without CCUS discounted (M€)797.56790.82782.92773.97764.10753.42742.02730.00717.44704.42
ETS costs with CCUS discounted (M€)509.73505.43500.37494.66488.35481.52474.23603.16592.78582.03
Cost of CCUS discounted (M€)84.8082.9480.3777.3875.0672.8167.1848.0331.0222.27
Cash flow discounted (M€)203.02202.45202.17201.93200.69199.09200.6178.8193.63100.13

References

  1. Dechezlepretre, A.; Sato, M. The impacts of environmental regulations on competitiveness. Rev. Environ. Econ. Policy 2017, 11, 183–206. [Google Scholar] [CrossRef] [Green Version]
  2. Jaffe, A.B.; Peterson, S.R.; Portney, P.R.; Stavins, R.N. Environmental regulation and thecompetitiveness of US manufacturing: What does the evidence tell us? J. Econ. Lit. 1995, 33, 132–163. [Google Scholar]
  3. Obama, B. The irreversible momentum of clean energy. Science 2017, 355, 126–129. [Google Scholar] [CrossRef] [Green Version]
  4. Li, W.; Qiao, Y.; Li, X.; Wang, Y. Energy consumption, pollution haven hypothesis, and Environmental Kuznets Curve: Examining the environment–economy link in belt and road initiative countries. Energy 2022, 239, 122559. [Google Scholar] [CrossRef]
  5. Porter, E.M.; van der Linde, C. Toward a new conception of the environment–competitiveness relationship. J. Econ. Perspect. 1995, 94, 97–118. [Google Scholar] [CrossRef] [Green Version]
  6. The IPCC Sixth Assessment Report. A Report of the Intergovernmental Panel on Climate Change 2021. Available online: https://www.ipcc.ch/ar6-syr/ (accessed on 6 May 2022).
  7. Rehman, A.; Ma, H.; Ahmad, M.; Irfan, M.; Traore, O.; Chandio, A.A. Towards environmental Sustainability: Devolving the influence of carbon dioxide emission to population growth, climate change, Forestry, livestock and crops production in Pakistan. Ecol. Indic. 2021, 125, 107460. [Google Scholar] [CrossRef]
  8. Zhang, Y.J.; Da, Y.B. The decomposition of energy-related carbon emission and its decoupling with economic growth in China. Renew. Sustain. Energy Rev. 2015, 41, 1255–1266. [Google Scholar] [CrossRef]
  9. Heede, R. Tracing anthropogenic carbon dioxide and methane emissions to fossil fuel and cement producers, 1854–2010. Clim. Chang. 2014, 122, 229–241. [Google Scholar] [CrossRef] [Green Version]
  10. Honegger, M.; Michaelowa, A.; Poralla, M. Net-Zero Emissions: The role of Carbon Dioxide Removal in the Paris Agreement. In Policy Briefing Report; Perspectives Climate Research: Freiburg, Germany, 2019. [Google Scholar]
  11. Sikora, A. European Green Deal—Legal and financial challenges of the climate change. ERA Forum 2020, 21, 681–697. [Google Scholar] [CrossRef]
  12. Wolf, S.; Teitge, J.; Mielke, J.; Schütze, F.; Jaeger, C. The European Green Deal—More Than Climate Neutrality. Intereconomics 2021, 56, 99–107. [Google Scholar] [CrossRef]
  13. Erans, M.; Sanz-Pérez, E.S.; Hanak, D.P.; Clulow, Z.; Reiner, D.M.; Mutch, G.A. Direct air capture: Process technology, techno-economic and socio-political challenges. Energy Environ. Sci. 2022, 15, 1360. [Google Scholar] [CrossRef]
  14. Bui, M.; Adjiman, C.S.; Bardow, A.; Anthony, E.J.; Boston, A.; Brown, S.; Fennell, P.S.; Fuss, S.; Galindo, A.; Hackett, L.A.; et al. Carbon capture and storage (CCS): The way forward. Energy Environ. Sci. 2018, 11, 1062. [Google Scholar] [CrossRef] [Green Version]
  15. Abeydeera, L.H.U.W.; Mesthrige, J.W.; Samarasinghalage, T.I. Global Research on Carbon Emissions: A Scientometric Review. Sustainability 2019, 11, 3972. [Google Scholar] [CrossRef] [Green Version]
  16. Zhao, X.; Burnett, J.W.; Fletcher, J.J. Spatial analysis of China province-level CO2 emission intensity. Renew. Sustain. Energy Rev. 2014, 33, 1–10. [Google Scholar] [CrossRef] [Green Version]
  17. Central Statistical Office. Local Data Bank (GUS, Bank Danych Lokalnych). Available online: https://bdl.stat.gov.pl/bdl/start (accessed on 6 May 2022).
  18. Ministry of Climate. Poland’s National Inventory Report 2020, Greenhouse Gas Inventory for 1988–2018, Submission under the UN Framework Convention on Climate Change and Its Kyoto Protocol. Report Elaborated by: National Centre for Emission Management (KOBiZE) at the Institute of Environmental Protection—National Research Institute; Ministry of Climate: Warszawa, Poland, 2020.
  19. Global Carbon Project. Supplemental Data of Global Carbon Budget 2021 (Version 1.0) [Data Set]; Global Carbon Project: Canberra, Australia, 2021. [Google Scholar] [CrossRef]
  20. Tomaszewski, K. The Polish road to the new European Green Deal—Challenges and threats to the national energy policy. Polityka Energetyczna Energy Policy J. 2020, 23, 5–18. [Google Scholar] [CrossRef]
  21. National Energy and Climate Plan for the Years 2021–2030. Polish Ministry for State Assets. Available online: https://www.gov.pl/web/klimat/krajowy-plan-na-rzecz-energii-i-klimatu (accessed on 6 May 2022).
  22. Energy Regulatory Office. Electricity generation in Poland in small-scale RES installations. In Report of the President of the Energy Regulatory Office for 2021; Energy Regulatory Office: Warszawa, Poland, 2022. (In Polish) [Google Scholar]
  23. Carneiro, J.F.; Mesquita, P. 2020 Key Data for Characterising Sources, Transport Options, Storage and Uses in Promising Regions. EU H2020 STRATEGY CCUS Project 837754, Report D2.2. Available online: https://www.strategyccus.eu/sites/default/files/STRATEGY_CCUS_D2_2_Data%20colection_WebsiteDRAFT-1_ReducedFileSize.pdf (accessed on 6 May 2022).
  24. European Union; Brownsort, P.A.; Cavanagh, A.J.; Wilkinson, M.; Haszeldine, R.S. Methodologies for Cluster Development and Best Practices for Data Collection in the Promising Regions, EU H2020 STRATEGY CCUS Project 837754, Report; European Union: Maastricht, The Netherlands, 2020. [Google Scholar]
  25. European Union; Berenblyum, R.; Coussy, P.; Guichet, X.; Canteli, P.; Carneiro, J.; Mesquita, P.; Nermoen, A. Elaboration and Implementation of Data Collected of the Business Case for Each Region, EU H2020 STRATEGY CCUS Project 837754, Report D5.1; European Union: Maastricht, The Netherlands, 2021. [Google Scholar]
  26. Urych, T.; Chećko, J.; Magdziarczyk, M.; Smoliński, A. Numerical Simulations of Carbon Dioxide Storage in Selected Geological Structures in North-Western Poland. Front. Energy Res. 2022, 10, 827794. [Google Scholar] [CrossRef]
  27. Koteras, A.; Chećko, J.; Urych, T.; Magdziarczyk, M.; Smolinski, A. An Assessment of the Formations and Structures Suitable for Safe CO2 Geological Storage in the Upper Silesia Coal Basin in Poland in the Context of the Regulation Relating to the CCS. Energies 2020, 13, 195. [Google Scholar] [CrossRef] [Green Version]
  28. Urych, T.; Smoliński, A. Numerical Modeling of CO2 Migration in Saline Aquifers of Selected Areas in the Upper Silesian Coal Basin in Poland. Energies 2019, 12, 3093. [Google Scholar] [CrossRef] [Green Version]
  29. Jureczka, J.; Chećko, J.; Krieger, W.; Warzecha, R. Formacje i struktury solankowe perspektywiczne dla składowania CO2 w regionie Górnośląskiego Zagłębia Węglowego (Feasibility study of CO2 storage in saline formations and structures of the Upper Silesian Coal Basin). Biul. Państw. Inst. Geol. 2012, 448, 47–56. (In Polish) [Google Scholar]
  30. Chećko, J.; Urych, T.; Magdziarczyk, M.; Smolinski, A. Research on the Processes of Injecting CO2 into Coal Seams with CH4 Recovery Using Horizontal Wells. Energies 2020, 13, 416. [Google Scholar] [CrossRef] [Green Version]
  31. Jureczka, J.; Chećko, J.; Krieger, W.; Kwarciński, J.; Urych, T. Perspektywy geologicznej sekwestracji CO2 w połączeniu z odzyskiem metanu z pokładów węgla w warunkach Górnośląskiego Zagłębia Węglowego (Prospects for geological storage of CO2 with enhanced coal bed methane recovery in the Upper Silesian Coal Basin). Biul. Państw. Inst. Geol. 2012, 448, 117–132. (In Polish). Available online: https://geojournals.pgi.gov.pl/bp/article/view/29099/20770 (accessed on 16 June 2022).
  32. Schlumberger Information Solutions. Petrel Seismic-to-Simulation Software, version 2010.1; Schlumberger: New York, NY, USA, 2010. [Google Scholar]
  33. Schlumberger Information Solutions. ECLIPSE Reservoir Engineering Software, version 2011.3; Schlumberger: New York, NY, USA, 2011. [Google Scholar]
  34. Pérez-Fortes, M.; Schöneberger, J.C.; Boulamanti, A.; Tzimas, E. Methanol synthesis using captured CO2 as raw material: Techno-economic and environmental assessment. Appl. Energy 2016, 161, 718–732. [Google Scholar] [CrossRef]
  35. European Commission; Oltra, C.; Preuß, S.; Germán, S.; Wesche, J.; Dütschke, E.; Prades, A. Stakeholders’ Views on CCUS Developments in the Studied Regions, EU H2020 STRATEGY CCUS Project 837754, Report D3.2; European Commission: Brussels, Belgium, 2020. [Google Scholar]
  36. Energy Policy of Poland until 2040 (EPP2040). Ministry of Climate and Environment. Available online: https://www.gov.pl/web/climate/energy-policy-of-poland-until-2040-epp2040 (accessed on 6 May 2022).
  37. European Commission; Coussy, P.; Fortes, P.; Alvarez, P.F.C.; Śliwińska, A.; Arnaut, M. Description of CCUS Business Cases in Eight Southern European Regions, EU H2020 STRATEGY CCUS Project 837754, Report D5.2; European Commission: Brussels, Belgium, 2021. [Google Scholar]
  38. European Commission; Fortes, P.; Mesquita, P.; Pereira, P.; Carneiro, J.; Aguiar, R.; Rocha, P.; Martínez, R.; Canteli, P.; Dumas, C.; et al. Economic Evaluation of CCUS Scenarios in Eight Southern European Regions. EU H2020 STRATEGY CCUS Project 837754, Report D5.3; European Commission: Brussels, Belgium, 2022. [Google Scholar]
  39. Krawczyk, P.; Howaniec, N.; Smoliński, A. Economic efficiency analysis of substitute natural gas (SNG) production in steam gasification of coal with the utilization of HTR excess heat. Energy 2016, 114, 1207–1213. [Google Scholar] [CrossRef]
Figure 1. (a) CO2 emissions excluding LULUCF by sectors in 2018 [18], (b) CO2 emissions by fuel type [19] in Poland.
Energies 15 04495 g001
Figure 2. Reduction of CO2 emission by sectors (without LULUCF) to 2040 (source: [21]).
Energies 15 04495 g002
Figure 3. Locations of the largest CO2 emitters and storage sites in Upper Silesia (based on: https://www.strategyccus.eu/sites/default/files/Upper_Silesia/index.html#9/50.3795/19.6655 (accessed on 16 June 2022)).
Energies 15 04495 g003
Figure 4. Location of the emitters, transport routes, storage sites and utilisation facilities assumed in the baseline scenario (source: STRATEGY CCUS).
Energies 15 04495 g004
Figure 5. Graphical representation of CAPEX and OPEX of the analysed CCUS scenario.
Energies 15 04495 g005
Figure 6. Graphical representation of CAPEX and OPEX in reference to 1 tonne of CO2 avoided.
Energies 15 04495 g006
Table 1. Largest CO2 emitters located in Upper Silesia with their annual emissions.
Emitter ID/Industry SectorFacilityCO2/GHG Emission (Mt CO2e/y)Data SourceShare of Total Upper Silesia Emission in 2018 (%)
01/PowerPGE GiEK S.A Power Plant ‘Rybnik’6.48co. website20
02/PowerTauron Wytwarzanie S.A. Power Plant Jaworzno III, power plant II0.91CSR report3
03/PowerTauron Wytwarzanie S.A. Power Plant branch Jaworzno III6.04CSR report18
04/Iron & steelArcelorMittal Poland S.A. Ironworks Arcellor Mittal in Dąbrowa Górnicza (blast furnace, steelworks, sinter plant, lime plant, rolling mill)4.64CSR report14
05/PowerTauron Wytwarzanie S.A. Power Plant New Jaworzno4.7 *co. website*
06/PowerTauron Wytwarzanie S.A. Power Plant branch Łaziska3.88CSR report12
07/PowerTauron Wytwarzanie S.A. Power Plant branch Łagisza in Będzin1.87CSR report6
08/PowerCEZ Chorzów S.A.1.35EU ETS4
09/PowerTauron Ciepło Sp. z o.o. Zakład Wytwarzania Tychy, Combined heat and power plant Tychy0.20co. website1
10/PowerTauron Ciepło Sp. z o.o. Combined heat and power plant Katowice0.27co. website1
11/PowerTAMEH Polska Sp. z o. o. Zakład Wytwarzania Nowa in Dąbrowa Górnicza3.34EU ETS10
12/PowerCombined heat and power plant Będzin Sp. z o.o.0.61EU ETS2
13/Coke plantJSW Koks S.A. Coke Plant ‘Przyjaźń’ in Dąbrowa Górnicza0.43EU ETS1
14/PowerJSW Koks S.A. Power Plant of Coke Plant ‘Przyjaźń’ in Dąbrowa Górnicza0.23EU ETS1
15/PowerJSW Koks S.A. Combined heat and power plant of Coke Plant ‘Przyjaźń’ in Dąbrowa Górnicza0.13EU ETS<1
* The new unit of 910 MW launched in 2021.
Table 2. General geological properties of selected CO2 storage sites.
No.Storage Site ID, Storage Type/UnitStrat. Formation/LithologyUnit Area (km2), Depth/Thickness (m)Seal Lithology/Thickness (m)Estimated Capacity
(Mt CO2)
1 *SU#01
Cieszyn-Skoczów-Czechowice,
DSA/USCB
Dębowiec Beds/Miocene macroclastic molasse composed of four lithofacies: olistostromes, boulders, conglomerates and sandstones371,
750–1300/150
mudstones and claystones with intercalations of sandstones/50–950 (mainly 300–850)46.2
(40–60) **
[27,28,29]
2SU#02
Częstochowa region, DSA/JCD
No name formation/fine to coarse and various grain sandstones451,
1000–1500/80
mudstones, clays and claystones and marls/350–62050 (43.9–62.8) ** STRATEGY CCUS not published]
3SU#03
Studzienice-Międzyrzecze site,
UCB/USCB
Orzesze Beds, Ruda Beds, Saddle Beds/Orzesze Beds, Ruda Beds: Typical cyclic coal-bearing rocks in which off-channel fine-grained sediments (80%) prevail over sandstones. Coal seams are numerous, thin and variable. The total coal potential reaches 5–7% of the profile. Saddle Beds: Sandstones and congllomerates predominate over siltstones and claystones. Thick coal seams make up to 9% of the profile.56,
1350 m (depth of coal seam 405 in well Pw-9)/27.3
mudstones, claystones/>1006.96
[30,31]
4SU#04
Pawłowice-Mizerów site,
UCB/USCB
Orzesze Beds, Ruda Beds, Saddle Beds/Orzesze Beds, Ruda Beds: Typical cyclic coal-bearing rocks in which off-channel fine-grained sediments (80%) prevail over sandstones. Coal seams are numerous, thin and variable. The total coal potential reaches 5–7% of the profile. Saddle Beds: Sandstones and congllomerates predominate over siltstones and claystones. Thick coal seams make up to 9% of the profile.68,
1400 m (depth of coal seam 405: 1333–1516 m)/26
mudstones, claystones/>1008.34
[30,31]
* The area with ‘1a’ label on Figure 3 is defined as the maximum range of Miocene deposits in the area of Dębowiec layers—parameters of that extended area are currently being investigated to identify the possibilities of increasing a storage potential of SU#01 site; ** calculated static, effective CO2 storage capacity range.
Table 3. Characteristics of DSAs considered in the baseline scenario.
Unit IDSU#01SU#02
Storage unitUpper Silesian Coal Basin (USCB)Jurassic Częstochowa District (JCD)
LocationOnshoreOnshore
Capacity estimated (Mt)46.250.0
Initial year20272027
Final year20502047
Table 4. The long-term baseline scenario assumptions (up to 2050).
Emitter IDEmitterCO2 Captured to 2050 (Mt)Share of Captured CO2 PeriodCO2 TransportCaptured CO2
(Mt/y)
Destiny
E#01Combined heat and power plant Tychy4.7790%2025–2050rail0.18Methanol—chemical plant U#01
E#02Zakład Wytwarzania Nowa17.5325%2027–2047pipeline0.84Storage SU#02
E#03New Jaworzno24.6825%2027–2047pipeline1.18Storage SU#02
E#04New Rybnik24.0050%2027–2050pipeline1.00Storage SU#01
E#05Power Plant of Coke Plant ‘Przyjaźń’5.5090%2025–2050pipeline0.32Methanol—JSW plant U#02
E#06Combined heat and power plant of Coke Plant ‘Przyjaźń’2.9590%2025–2050
E#07IGCC Łaziska15.7575%2030–2050pipeline0.75Storage SU#01
TOTAL95.18
Table 5. Utilisation units in the long-term baseline scenario.
U#01U#02
TypeMethanolMethanol
CompanyChemical PlantJSW
Longitude19.2652719.340949
Latitude50.1350950.344878
Yearly use (tCO2/y)183,421325,088
Initial year20252025
Source of CO2E#01E#05; E#06
Final year20502050
Table 6. Common economic data and regional sites specific data.
Common Economic DataUnitValue
Reference yearyear2021
Discount rate%5
Inflation, cost increase factor%2.5
Annual OPEX/CAPEX cost reduction factor due to learning & scale%−5.0
Business tax level (income from revenue creation)%19.0
Regional CO2 emission for electricity production in 2021gCO2e/kWh671
CO2 EUA/ETS emission prices in years
2025€/tCO270.10
203099.85
2035137.35
2040174.85
2045212.35
2050249.85
Regional electricity prices in years:
2025€/MWh101.00
2030102.25
2035103.50
2040104.75
2045106.00
2050107.25
Table 7. The results of sensitivity analysis of NPV calculation for the scenario with CCUS.
DeviationsCO2 EU ETS Emission Prices, €/tonNPV,
M€
2025 Year2050 Year
−61.89%26.7195.210.00
−50%35.05124.93731.50
−30%49.07174.901961.78
−10%63.09224.873192.05
0%70.10249.853807.19
+10%76.05274.844422.32
+30%82.00324.815652.59
+50%87.95374.786882.87
Publisher’s Note: MDPI stays neutral with regard to jurisdictional claims in published maps and institutional affiliations.

