Article

Available Transfer Capability Enhancement in Deregulated Power System through TLBO Optimised TCSC

1
Electrical Engineering Department, Jamia Millia Islamia, New Delhi 110025, India
2
Department of Electrical Engineering Technology, University of Johannesburg, Johannesburg 2006, South Africa
3
Department of Electrical and Electronics Engineering, Mewat Engineering College, Nuh 122107, India
*
Author to whom correspondence should be addressed.
Energies 2022, 15(12), 4448; https://doi.org/10.3390/en15124448
Submission received: 9 May 2022 / Revised: 1 June 2022 / Accepted: 1 June 2022 / Published: 18 June 2022
(This article belongs to the Special Issue Challenges and Research Trends of Renewable Energy Power System)

Abstract

:
Rapid industrial development and innovations in technology bring about the menace of congestion in deregulated power systems (DPS). The transmission lines are continuously working under a stressed condition with reduced power transfer capacity. In this situation, the power losses and voltage deviations at the load buses are increased and hence reduce the system stability. To mitigate congestion, improving available transfer capability (ATC) of the transmission system is one of the most feasible and practical solution. This paper focuses on the implementation of Thyristor Controlled Series capacitor (TCSC) to mitigate congestion by enhancing ATC and via reducing power losses. AC Power Transfer Distribution Factor (ACPTDF) is applied to calculate ATC and to find the location of TCSC. To optimize the TCSC parameter (reactance), a Teaching Learning Based Optimization (TLBO) is proposed in the present work. The proposed optimization is validated on the IEEE 30 Bus system. The results are validated by matching with the results obtained through standard grey wolf optimization (GWO) and particle swarm optimization (PSO) techniques. The results show that despite two antagonistic objectives of ATC enhancement and power loss reduction, TLBO outperformed the other optimization techniques under different contingency conditions. The overall ATC of the IEEE 30 Bus system for the bilateral transactions is enhanced by 11.86%. Further active and reactive power losses are reduced by 16.7% and 29.6% for DPS.

1. Introduction

Initially, the vertically integrated power system worked as a monopoly under the local public sector energy authorities. A single entity was controlling all the operations of generation, transmission, and distribution. With the advancement of technology in developing countries, the demand for power increased manifolds, making power management very difficult with the monopolized arrangement. This necessitated amendments in the regulated industry to deregulate the power system, hence a deregulated power system (DPS) came into existence. Thus, the DPS was adopted by a number of countries to meet growing power demand, maintain voltage profile at buses, reduction in power losses, enhance the security margin and to make tariff policies as per the requirement of the customers. In a deregulated environment, the power system is unbundled into generation companies (GENCOS), transmission companies (TRANSCOS), and distribution companies (DISCOS). These separate entities are further segregated under two power market models: the independent system operator (ISO) model, where the GENCOS and DISCOS are governed and controlled by ISO by encouraging healthy competition between different market players. The second model is the transmission system operator (TSO) model, which ensures unbiased open access right to entitled market players to use the power transmission network [1]. The deregulated power system has numerous advantages such as the freedom for the consumer to select the most economic generator for their needs. However, in this system, the power generation and demands have very complex patterns. Heavy power transactions in the competitive markets resulted in the overloading of the transmission lines. To supply the demanded power, the transmission lines are working near or at their thermal stability limits. This creates congestion in the system [2]. To avoid this congestion, the power transfer capability of the lines must be known before any transaction is made. To manage a safe and economical transaction, the Available Transfer Capability (ATC) of the system must be calculated at regular periods. ATC can be defined as the capability of a line to transfer power securely above the base case power for its utilization in other commercial activities [3]. The effective transmission to the demanded power can be ensured if ATC is calculated at regular intervals and the documented data for the same is made available all the time to the market players. Precisely calculated ATC helps in accurately forecasting the future up-gradation of the system. As up-gradation of the power system involves huge capital, so to make the system economically reasonable ATC enhancement is a feasible option market is left with. When ATC is over-valued, the system become unstable and if the ATC is undervalued there is an economical loss due to underutilization of the power resources [4]. ATC evaluation and enhancement is very crucial when system stability and security is concerned.

2. Literature Survey

Previously, to enhance ATC of a power system, the infrastructure expansion was suggested, which included addition of parallel transmission lines to the estimated overloaded lines. These methods have now become obsolete due to geographical constraints and the invention of new semiconductor technologies such as FACTS devices [5,6]. Different FACTS devices are implemented for the objective of ATC enhancement [7]. The influence of different series and shunt FACTS devices on ATC enhancement under N-1 contingency condition has been validated on the standard power systems. The effective enhancement of ATC not only depends on the type of FACTS devices used, but also on the location of these devices. The FACTS devices are very expensive. To make their implementation economically viable, these must be optimized for location together with their respective parameters. The FACTS devices may either be located on the basis of the system condition or may be located on the basis of certain optimization techniques with an aim to maximize ATC [8]. Static Var Compensator (SVC) and TCSC are implemented to enhance ATC by applying cat swarm optimization (CSO). The ATC value is calculated using the continuous power flow (CPF) method in [9]. ATC enhancement is proposed by implementing SSSC with the proposed multi-agent system (MAS). MAS together with power controllers is used as a smart system for enhancing ATC. Various FACTS devices are located to implement Power Transfer Distribution Factors (PTDFs) for enhancing the ATC of the system [10]. The effect on the ATC value of the system has been proposed by employing Static Synchronous Compensator (STATCOM) in the system [11]; however, this method is less economical due to high cost of STATCOM. Other FACTS devices, Unified Power Flow Controller (UPFC), SSSC, and STATCOM are suggested to effectively enhance ATC in the system and to replace the costly method to lay down the new transmission lines. The parameters of these devices have been optimized by applying Particle Swarm Optimization (PSO) [12]. The improvement of ATC is not only proposed by a single FACTS device, but also by a combination of two or more FACTS devices. Implementing multiple FACTS devices is very costly and is suitable for very large and complex systems only. Series FACTS controller, TCPAR FACTS Controller, and TCSR FACTS Controller are employed in IEEE 5 Bus system to mitigate congestion. The TCSR FACTS Controller was found most effective in mitigating congestion [13]. A generalized unified power flow controller (GUPFC) and interline power flow controller (IPFC) are implemented for N-1 contingency case applying constant P, Q load model, and ZIP load model for the power system [14]. A Hybrid Mutation Particle Swarm Optimization (HMPSO) is proposed to improve the ATC in the system by suitably locating and optimizing TCSC and SVC parameters [15]. In a multi-objective function including ATC enhancement, voltage deviation minimization, and active power loss reduction, the weighting factors are calculated employing fuzzy logic. To achieve the objective, a self-adaptive PSO is applied to optimize the location and parameter setting of TCSC [16]. A flower pollination algorithm is proposed to optimize TCSC parameters with the aim to enhance the ATC of the system. The location of the device is optimized using ACPTDF as a sensitivity factor in [17].
In the view of the above discussion, this paper contributes a method to determine the optimized location and size of TCSC with a prime objective of enhancement of ATC in DPS. Two completely antagonistic objectives of ATC maximization and active power loss minimization are solved in this research work. TLBO algorithm is applied first time to optimize the objective function under base case and N-1 contingency conditions. The proposed algorithm is validated on IEEE 30 Bus system. A comparison of results is done with those obtained by applying GWO and PSO techniques and the application outcomes are shown to verify the effectiveness of the proposed work over GWO and PSO. This research further contributes in mitigating congestion without changing the operational costs of the system, which in turn results in social welfare of both the generators and the consumers. As ATC is enhanced, the lines are transmitting power very near to the thermal and voltage limits without effecting the security of the system.

3. Method and Materials

3.1. ATC Calculation

ATC of a system depends upon a number of parameters such as total transfer capability (TTC), transmission reliability margin (TRM), capacity benefit margin (CBM), and existing transmission commitments (ETC). ATC of a system can be mathematically represented as [18,19]:
ATC = TTC ( ETC , TRM , CBM )
TTC is the major power that can be transferred between the seller and the buyer without the violation of security constraints during normal and contingency conditions also. ETC is calculated by the traditional power flow calculations. TRM is considered to be 10% of the TTC value and the value of CBM is taken as zero for simplicity in calculations [15]. There are different methods to calculate ATC in a system. Basically, three methods are implemented to calculate ATC.
  • Repeated Power Flow (RPF) method;
  • Calculation based on optimization method;
  • Linear sensitivity factor based method.
In this paper, linear sensitivity factor-based method is applied to calculate ATC [20]. These factors are Power Transfer Distribution Factors. These can be calculated either by applying AC load flow analysis or DC load flow analysis. Depending on the outcome required AC or DC load flow analysis is done. In DC load flow analysis, transmission power losses are neglected. The voltage is considered constant and angle variations are considered negligible. This method takes a very small time for the calculations but the outcome is not very accurate. On the other hand, AC load flow-based ATC calculation is time-consuming, and complex but gives nearly accurate results.
This paper applies AC load flow analysis. The PTDFs thus calculated are called ACPTDF. In the interconnected power system, let us consider a bus p and bus n. These two buses are connected directly and also through indirect paths. Whenever there is a power transaction between sending bus p and receiving bus n, the power flow is affected in other transmission lines as well. Let us consider such an indirect path between buses l and k. The ratio of the change in power flow between buses l and k due to a power transaction between buses p and n is termed ACPTDF.
ACPTDF = Δ P lk Δ P pn
ACPTDF can be calculated in the following steps:
  • Considering m node test system with 1, …., g are PV buses and g + 1, …., m are
  • PQ buses.
The value of Δ P lk (change in power flow in any random line lk) is calculated by NR load flow analysis.
[ Δ δ Δ | V | ] = [ J A J B J C J D ] 1 × [ Δ P Δ Q ]
The elements of the Jacobian matrix in Equation (3) are determined in the follows:
J A   =   P lk δ lk = V l V k Y lk sin ( θ lk + δ k δ l ) J B   =   P lk δ lk = V l V k Y lk sin ( θ lk + δ k δ l ) J c   =   P lk V l = V k Y lk cos ( θ lk + δ k δ l ) 2 V k Y lk cos θ lk J D   =   P lk V k = V l Y lk cos ( θ lk + δ k δ l ) } }
From Equations (3) and (4):
Δ P lk = [ P lk δ 2 .. P lk δ n   P lk V g + 1 .. P lk V n ] [ Δ δ 2 : Δ δ n Δ | V g + 1 | : Δ | V n | ]
Now the transacted power between buses l and k is, Δ P l = + P t and Δ P k = P t .
Hence, Equation (5) can be rewritten as:
Δ P lk = [ P lk δ 2 .. P lk δ n   P lk V g + 1 .. P lk V n ] J 1 [ Δ δ 2 : Δ δ n Δ | V g + 1 | : Δ | V n | ] = ACPTDF × P t
If P lk is the real power flow in line l − k; TL lk max is the maximum transaction limit of line l − k; P lk pn m is the maximum constrained power transaction between p-n; N s is the total number of load buses in system.
Then,
P lk pn m = { TL lk max P lk ACPTDF lk , pn         ACPTDF lk , pn > 0                                         ACPTDF lk , pn = 0 TL lk max P lk ACPTDF lk , pn         ACPTDF lk , pn < 0
and
ATC pn = min { P lk pn m   lk     N s }

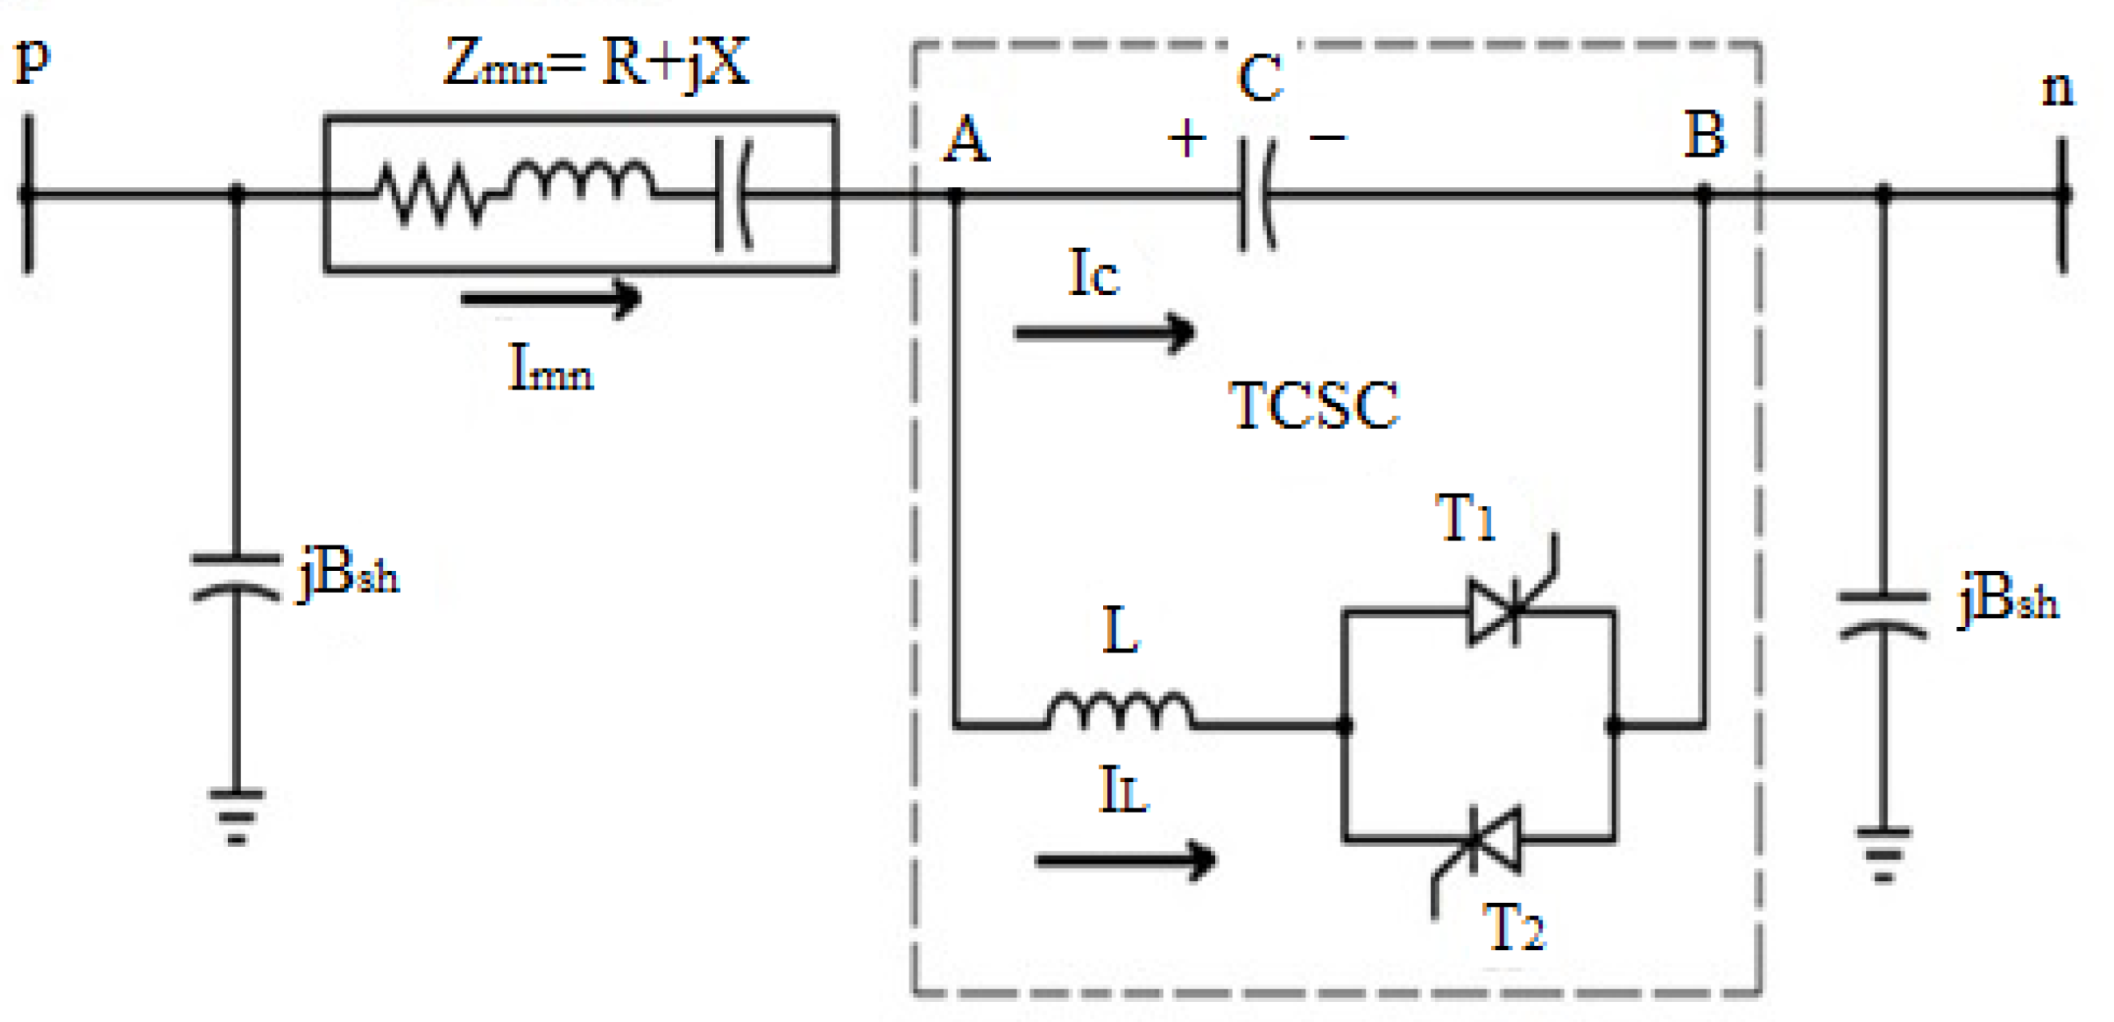
3.2. Reactance Model of TCSC under Consideration

TCSC is one of the very versatile reactance-based-series FACTS devices with variable inductive or capacitive reactance, jXTCSC. The capability of TCSC to promptly manipulate the line reactance makes it a suitable device to be implemented for mitigating congestion. Here, the transmission line is modelled with lumped parameters as a classical π model. A TCSC connected between bus p and n is shown in Figure 1.
Equation (9) determines the change in magnitude of line admittance, Δ y pn :
Δ y pn = y pn y pn
y pn = ( g pn + jb pn )
y pn = ( g pn + jb pn )  
Δ y pn is the change in admittance of line p–n; y pn is the new admittance of the line p–n after implementation of TCSC; y pn is the original admittance of the line p–n before implementation of TCSC.
In Equations (10) and (11);
g pn = r pn r pn 2 + x pn 2 b pn = x pn r pn 2 + x pn 2   g pn = r pn r pn 2 + ( x pn + x TCSC ) 2 b pn = x pn + x TCSC r pn 2 + ( x pn + x TCSC ) 2 }
g pn and b pn represents modified conductance and susceptance, respectively, of the line p–n. Thus, with the application of TCSC, the system admittance matrix is manipulated, which in turn modifies the quantities in the NR load flow.

3.3. Objective Function

(1)
The major objective is to maximize ATC of the test system.
ATC max = min   { P lk pn m   lk     N s }
(2)
The second objective is to minimize active power loss:
Min   P L = i = 1 N L g i { ( ( V p V n ) 2 + V p V n ( θ p θ n ) 2 }
The multi-objective function can now be formed as:
f = w 1 ( ATC max ) + w 2 ( Min   P L )
w 1 and w 2 are the weight factors. When the value of ATC is enhanced, the value of active power loss increases automatically. Thus, the objective function is solved for two cases:
  • For ATC maximization;
  • For Power loss minimization.

3.4. Constraints

The function is subjected to the following constraints:
(a)
Equality constraints:
P Gi j = 1 N b V i V j Y ij cos ( δ i δ j θ ij ) = P Di
Q Gi j = 1 N b V i V j Y ij sin ( δ i δ j θ ij ) = Q Di
here, P Gi and Q Gi are the real and reactive power generations at ith bus, respectively; P Di and Q Di are the real and reactive power demands at ith bus, respectively; V i , δ i , and V j , δ j are voltage magnitudes and their corresponding angles at ith and jth buses, respectively; Y ij , θ ij is the admittance of line between ith and jth bus and its corresponding angle; N b is the number of buses.
(b)
Inequality constraints:
P Gi min P Gi P Gi max   i = 1 , 2 , .. , n g
Q Gi min Q Gi Q Gi max   i = 1 , 2 , .. , n g  
V b min V b V b max   i = 1 , 2 , .. , n b  
(c)
Practical constraints of the TCSC [21]:
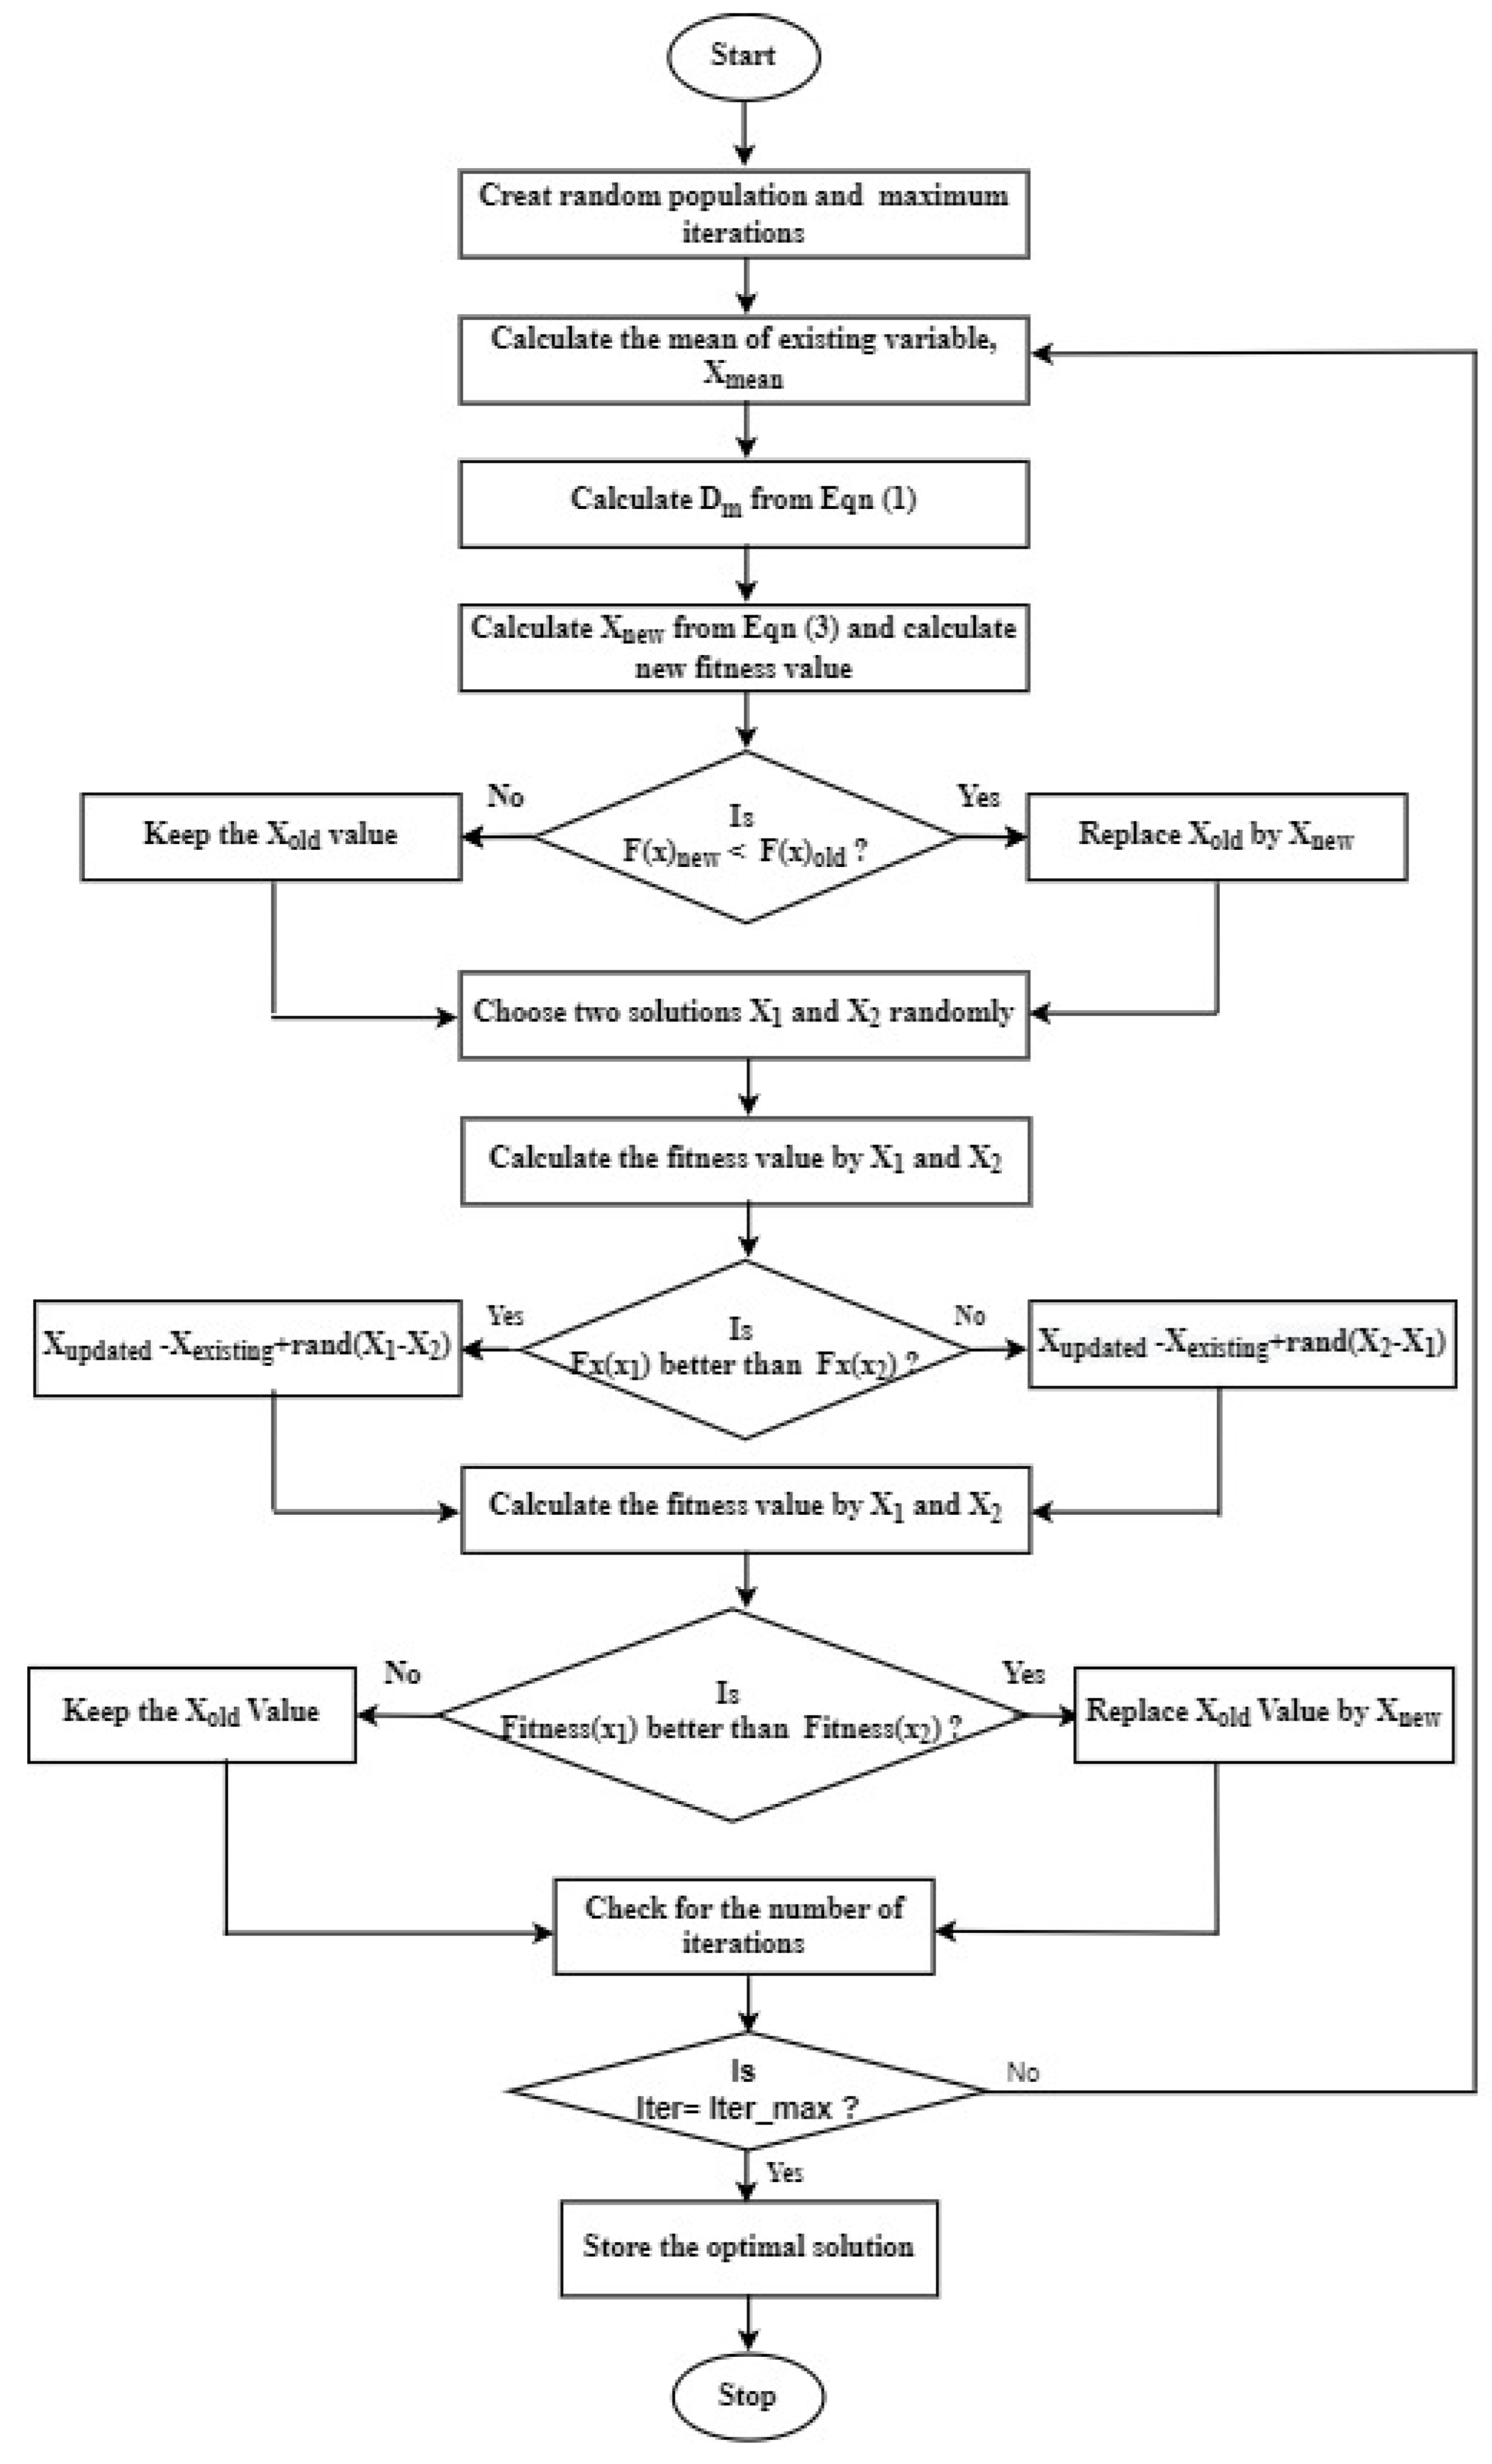
0.8 X pn ( p . u . ) X TCSC 0.2   X pn ( p . u . )

3.5. TLBO Algorithm

Teaching Learning based Optimization is based on the teacher–student relation in a class for imparting knowledge to the student. Hence, TLBO comprises two main factors, the ‘Teachers Phase’ and the ‘Learners Phase’. Here, the class room size denotes the space for search. The teacher plays part of ‘Influencer’ to influence students for obtaining ‘Effective’ learning output from them [22]. The algorithm operates in two phases:

3.5.1. Teacher Phase

In this phase, for enhancing the average output of the class of learners, teacher delivers information to the class (learners). Therefore, this phase deals with imparting learning through the teacher only. Here, it is assumed that the teacher is more knowledgeable (better fitness) as compared to the learner. At the end of the simulation, the teacher will be replaced by the best learner. This can be mathematically explained as:
D m = r a n d [ X t e a c h e r T f ( X m ) ]
In Equation (22), D m is difference between teachers’ best result ( X teacher ) and the existing mean result of the learner ( X m ). T f represents the teaching factor. Specific value of T f is not mentioned in literature but more accurate results are obtained if value is considered between (1, 2). T f can be calculated as in Equation (23):
T f = round   { 1 + rand [ 0 , 1 ] ( 2 1 ) }
rand is any random value in (0, 1). Next, the solution is updated through Equation (24) as:
X updated = X existing + D m
The updated value obtained here is substituted to calculate new fitness function value. For current fitness better than the former, the new solution is memorized. These updated values act as the input for the next phase, i.e., learner phase.

3.5.2. Learner Phase

This phase includes the learners who only interact among themselves with their randomly selected partner. In this phase, the learner has two inputs from the teacher and from the randomly selected partner. A learner will improve his/her information if the randomly selected partner is more knowledgeable then him/her. Consider two learners, X 1   and   X 2   .
The fitness functions for X 1   and   X 2 are evaluated and compared. Updated values for minimization function are evaluated by Equation (25).
X updated = X current + rand ( X 1 X 2 ) X updated = X current + rand ( X 2 X 1 ) }
Here, X updated is the updated value of the results of learner for minimizing the fitness function.
The steps involved in application of TLBO are given in Figure 2.

4. Steps Involved in the Implementation of Algorithm in Objective Function

The method applied is carried out in two parts:

4.1. For ATC Maximization

  • TLBO driven optimal power flow (OPF) is carried out.
  • Considering prime objective of ATC maximization, TCSC is optimized for suitable location and size by using ACPTDF and TLBO.
  • Line flows are obtained by NR with OPF.
  • A bilateral transaction between seller bus and buyer bus is created and NR is applied to calculate new line flows.
  • Change in active power flow ( Δ P lk ) is calculated.
  • ACPTDF values are obtained by using Equation (2).
  • ATC is then calculated by applying Equation (8) for nearby and farthest bus connected to the common generator bus (sending bus).

4.2. For Power Loss Minimization
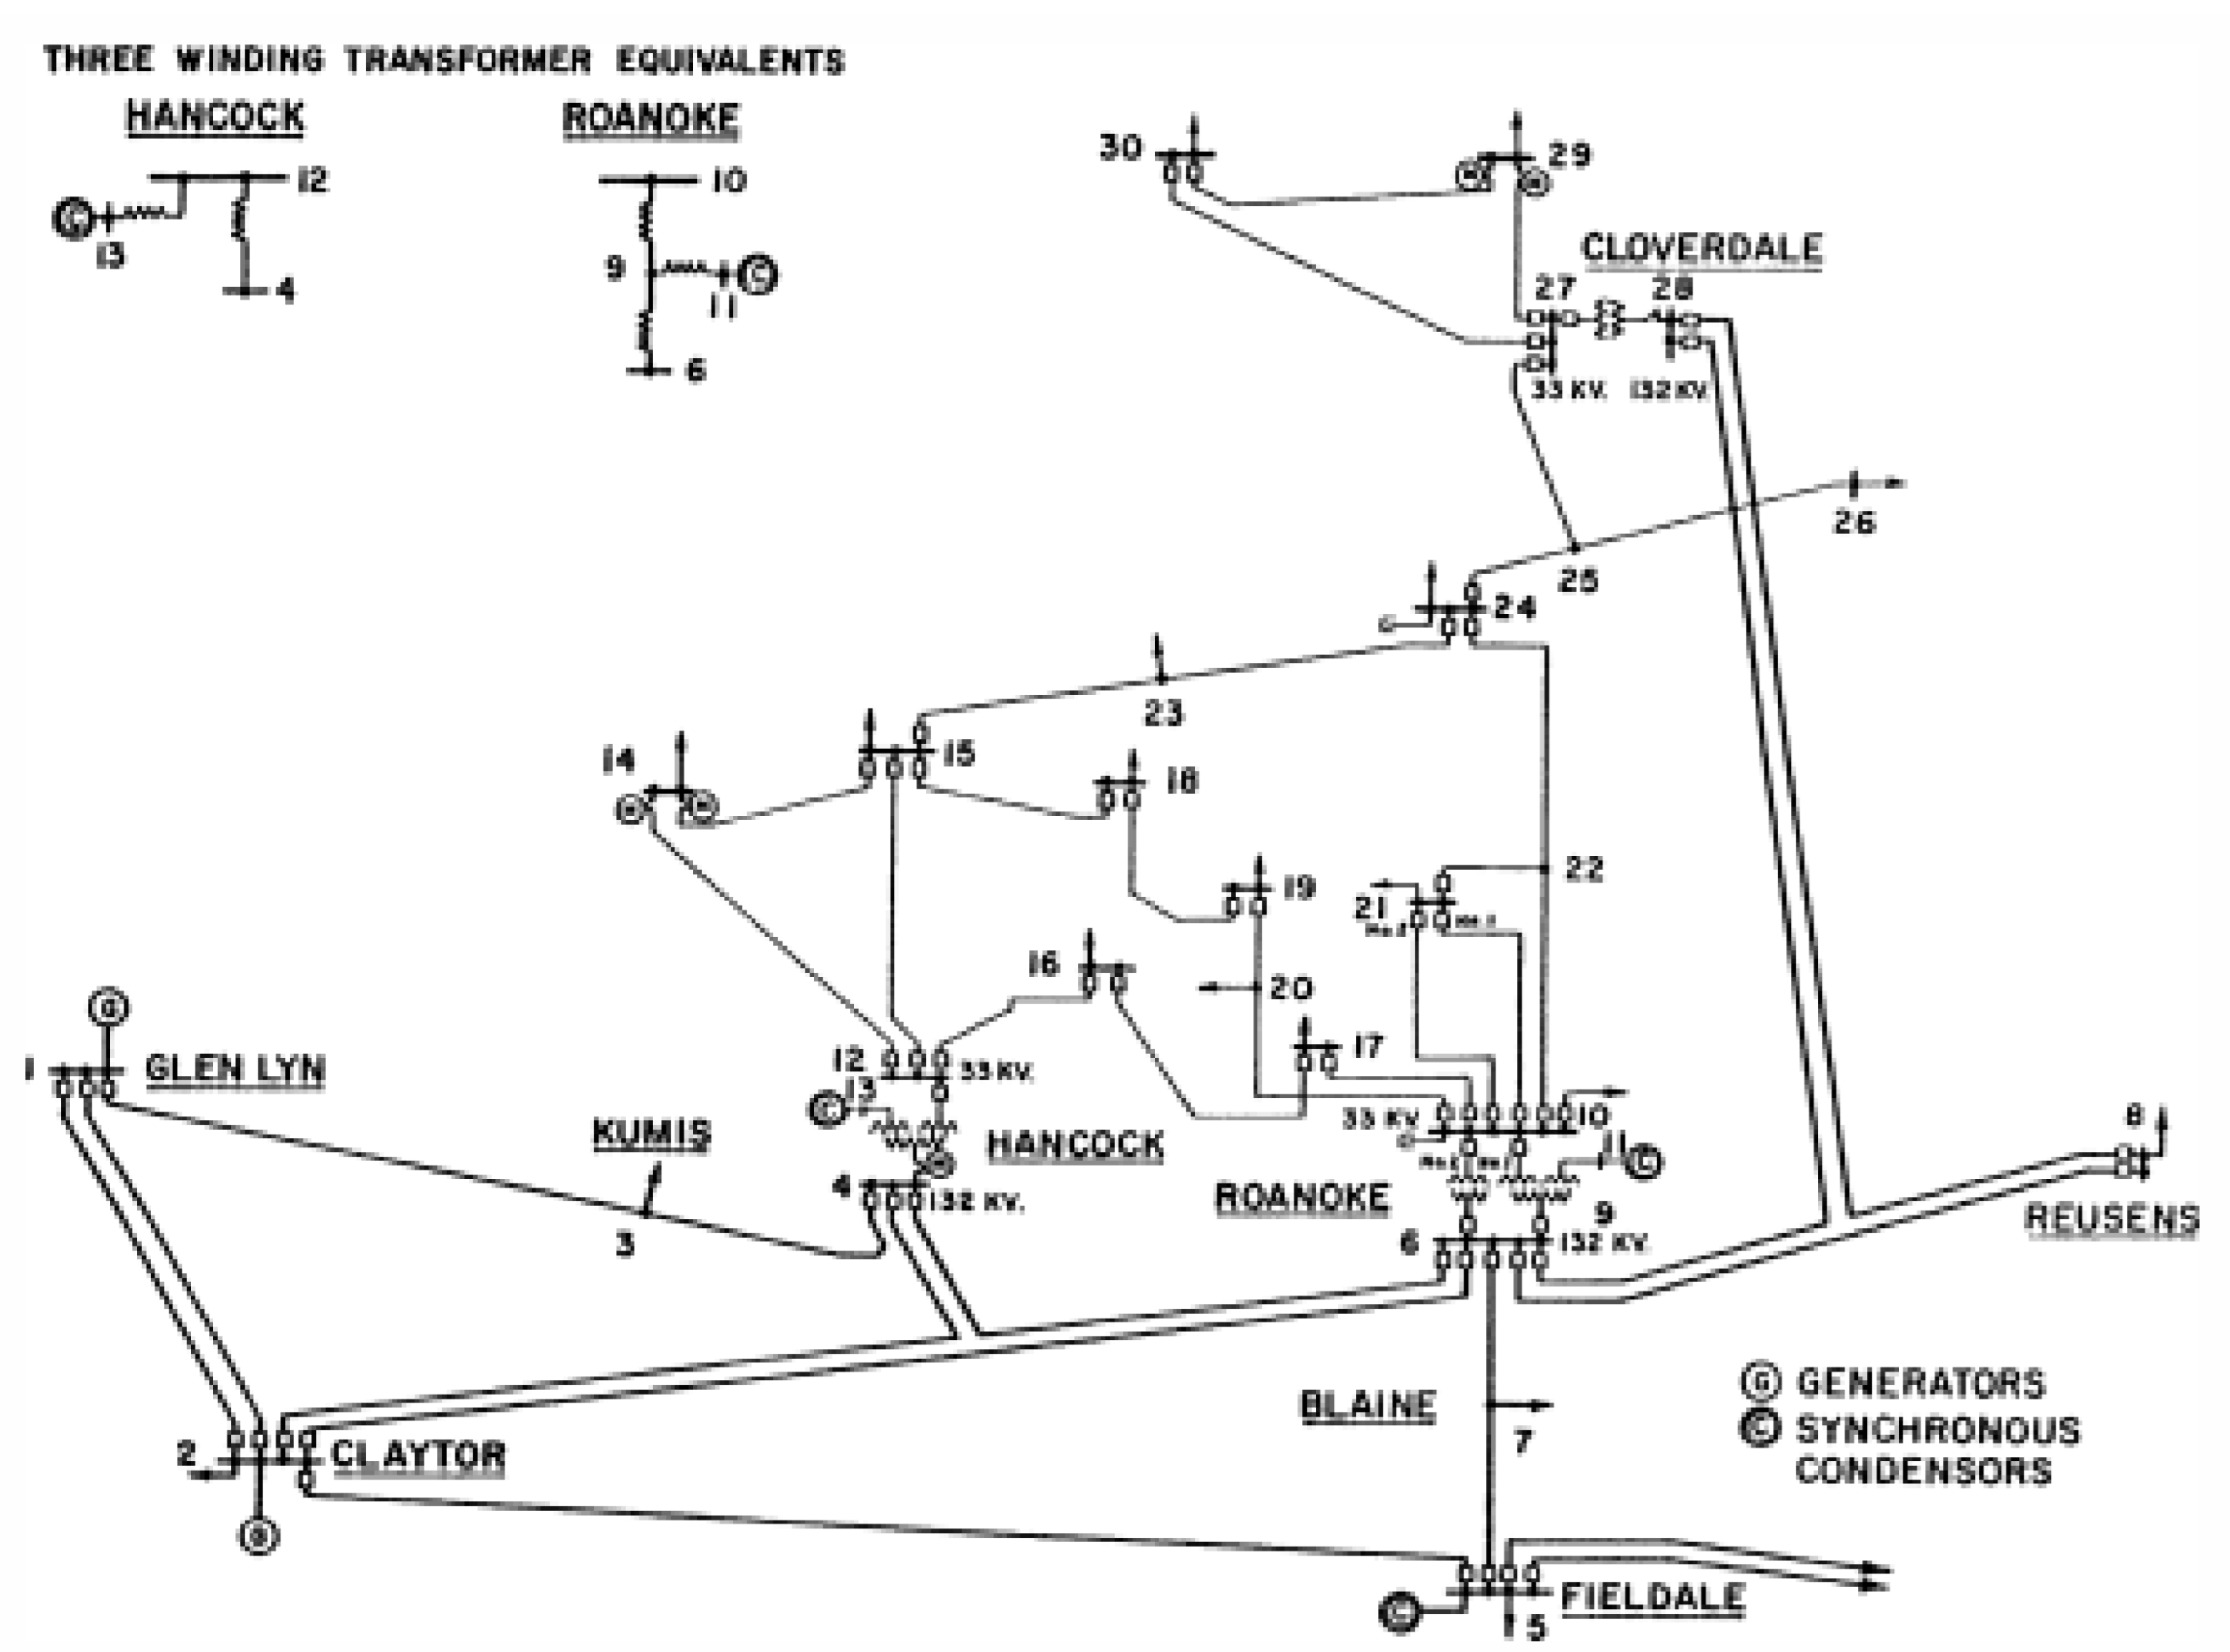
For this case also, the same steps are involved as in case of ATC maximization with a difference in weight factor ( w 2 ) as given in Equation (15) for minimization of active power loss.
The proposed algorithm is validated on standard IEEE 30 Bus system as shown in Figure 3.
This system comprises of 30 buses, 41 interconnected lines and 6 generators. Out of 30 buses, 24 buses are load buses. Bus number 1 is considered as slack bus. Bilateral transactions between the generator buses, i.e., 2, 5, 8, 11, and 13 and the load buses situated nearest and farthest to these buses is carried out. The generator buses are considered as sender/seller buses while the load buses are considered as receiver/buyer buses.
The ATC values calculated for base case without the application of TCSC by considering effects of generator at particular bus are shown in Figure 4, Figure 5, Figure 6, Figure 7 and Figure 8. It is observed that the ATC value for nearby bus is higher as compared to the ATC for line connected at the farthest bus.

5. Result Analysis

The proposed TLBO algorithm is validated on IEEE 30 Bus test system for two cases.

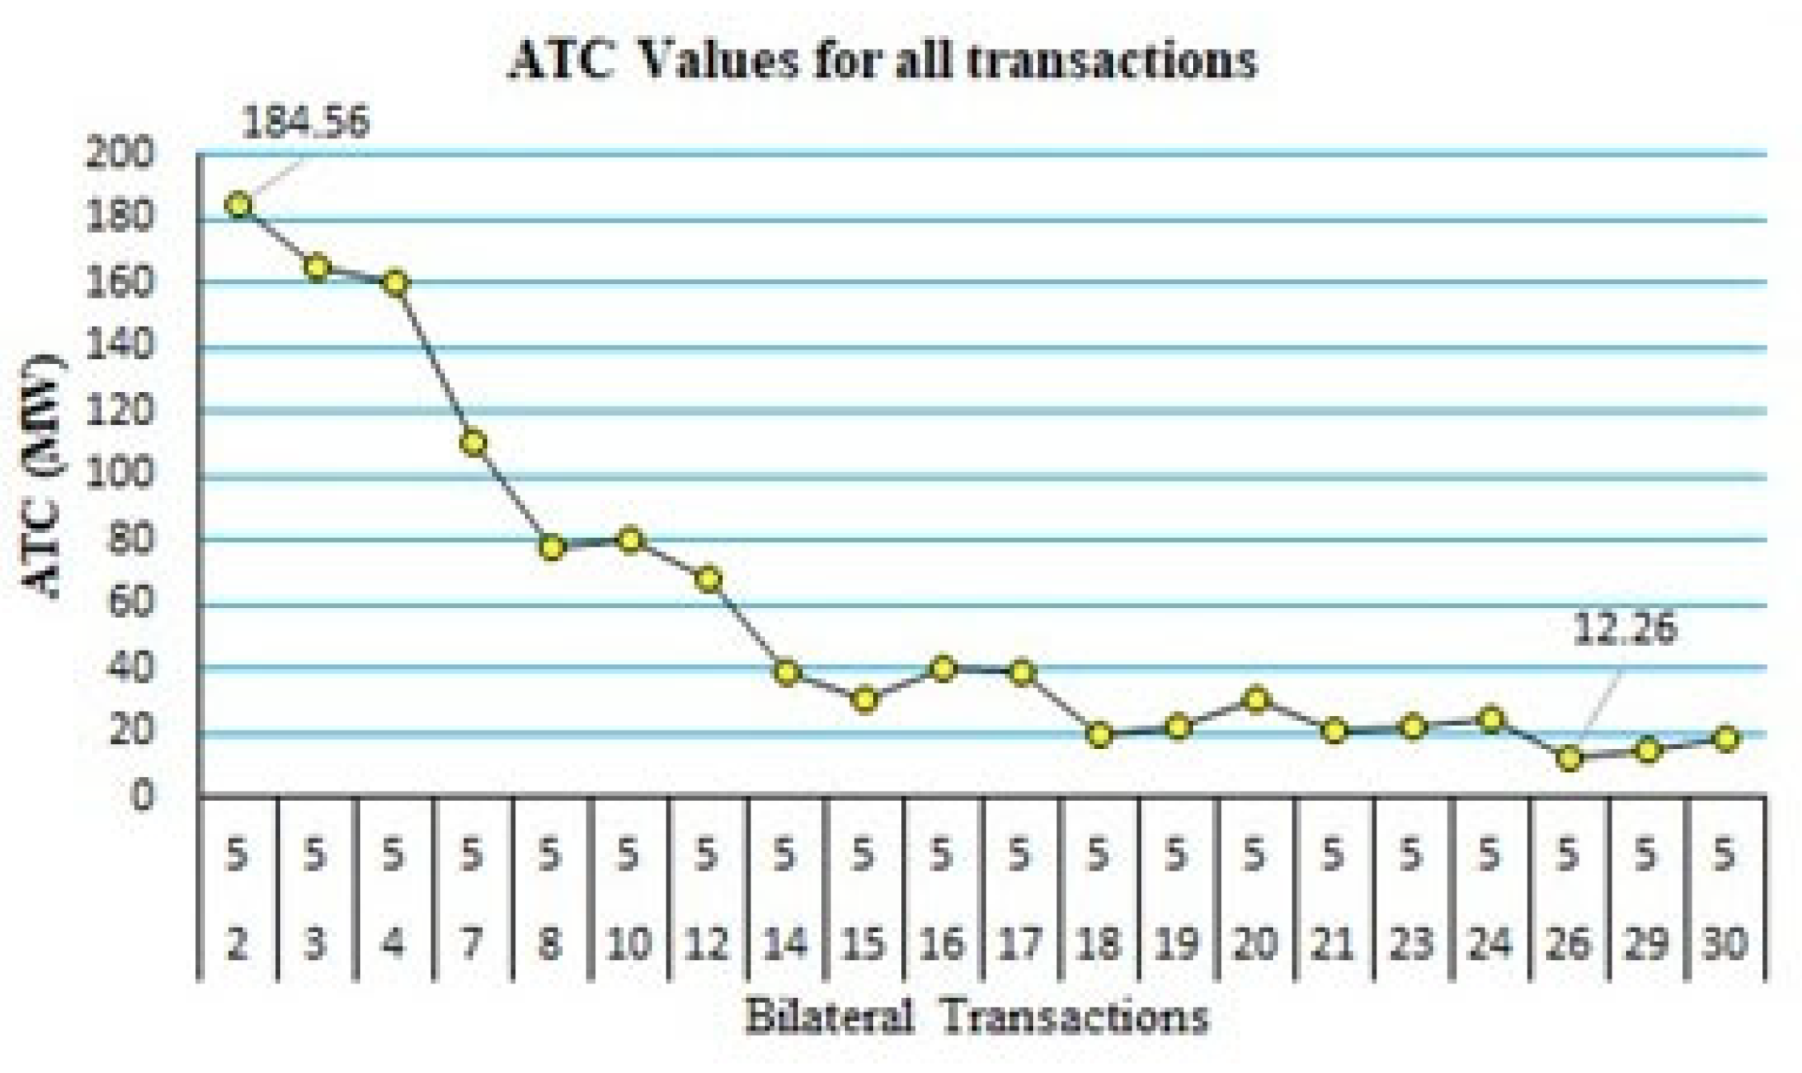
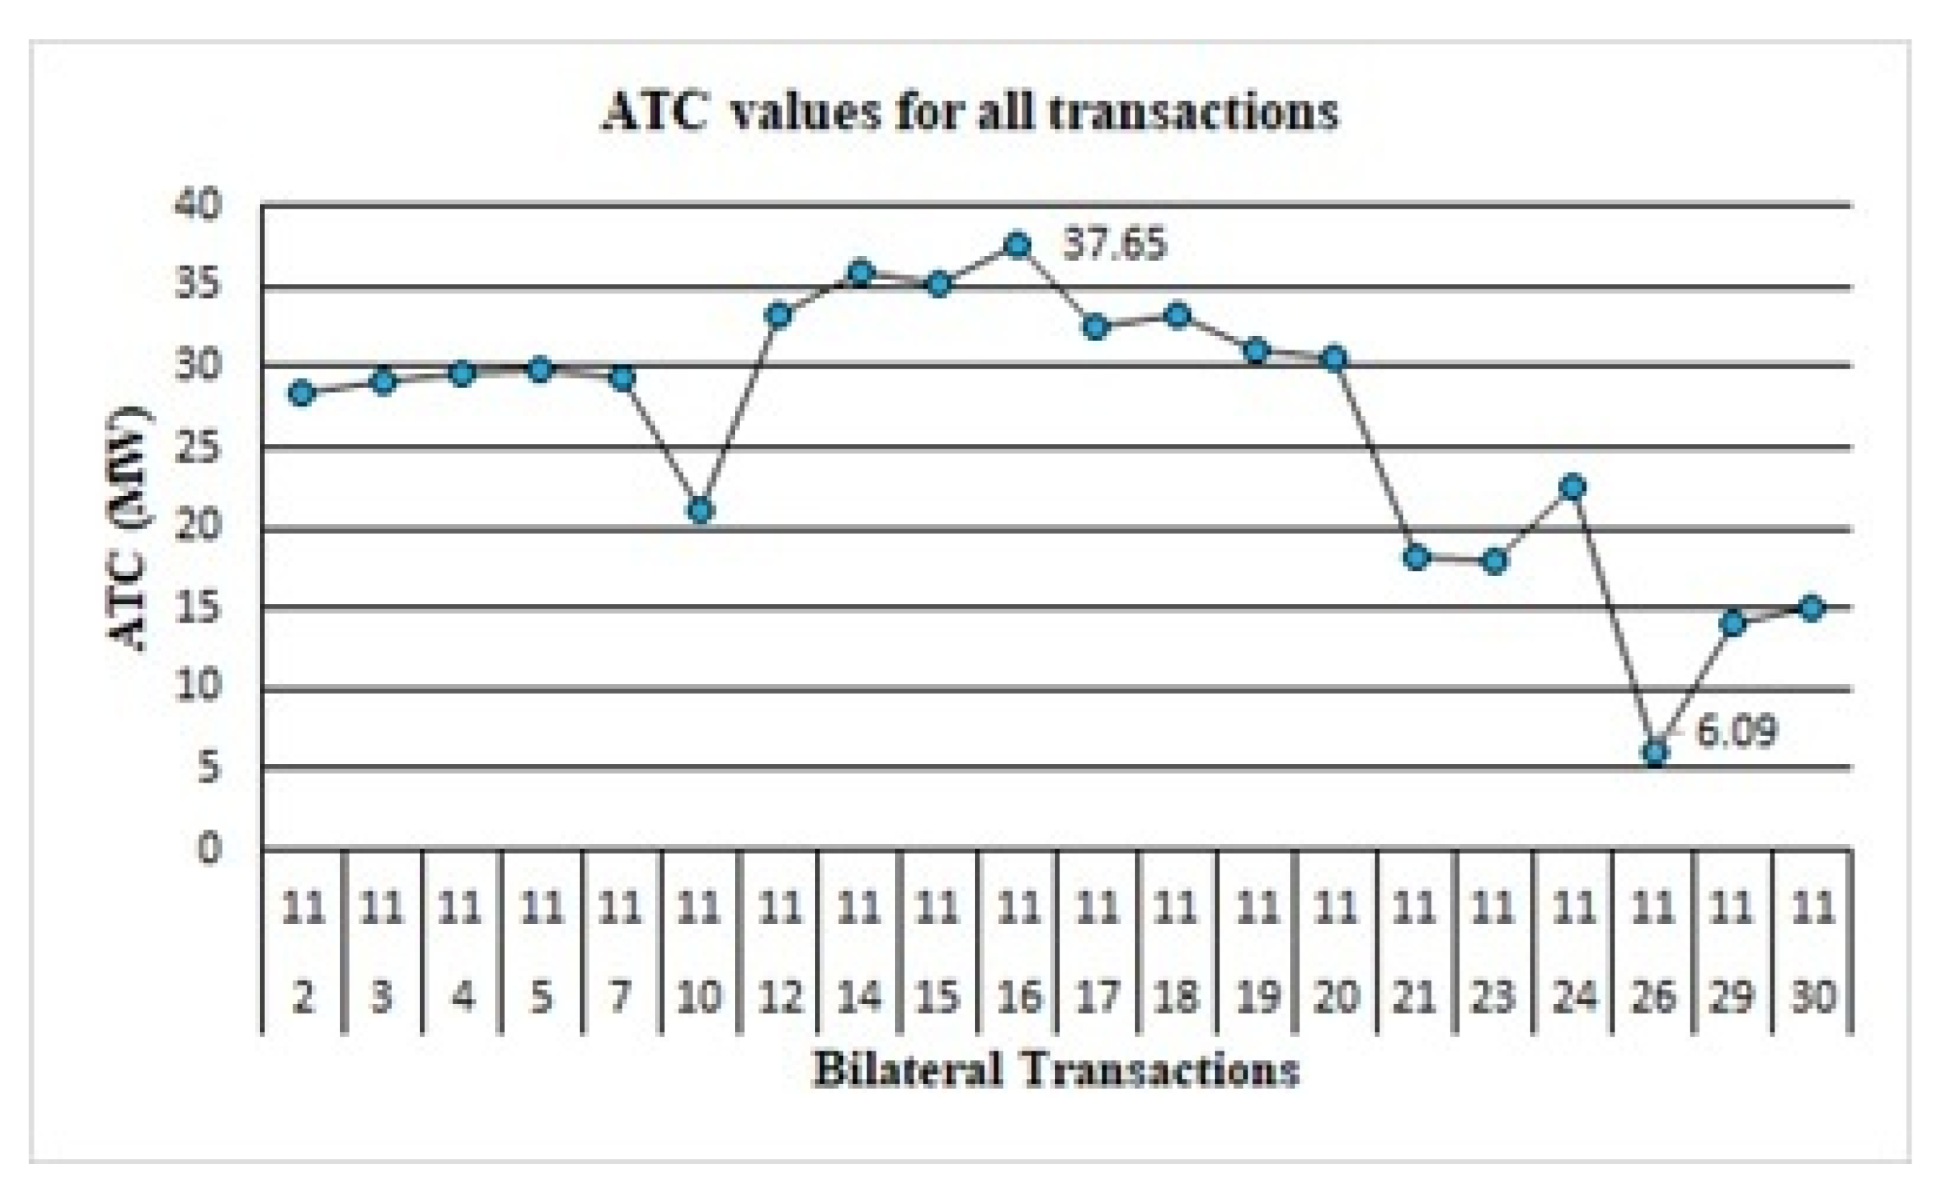
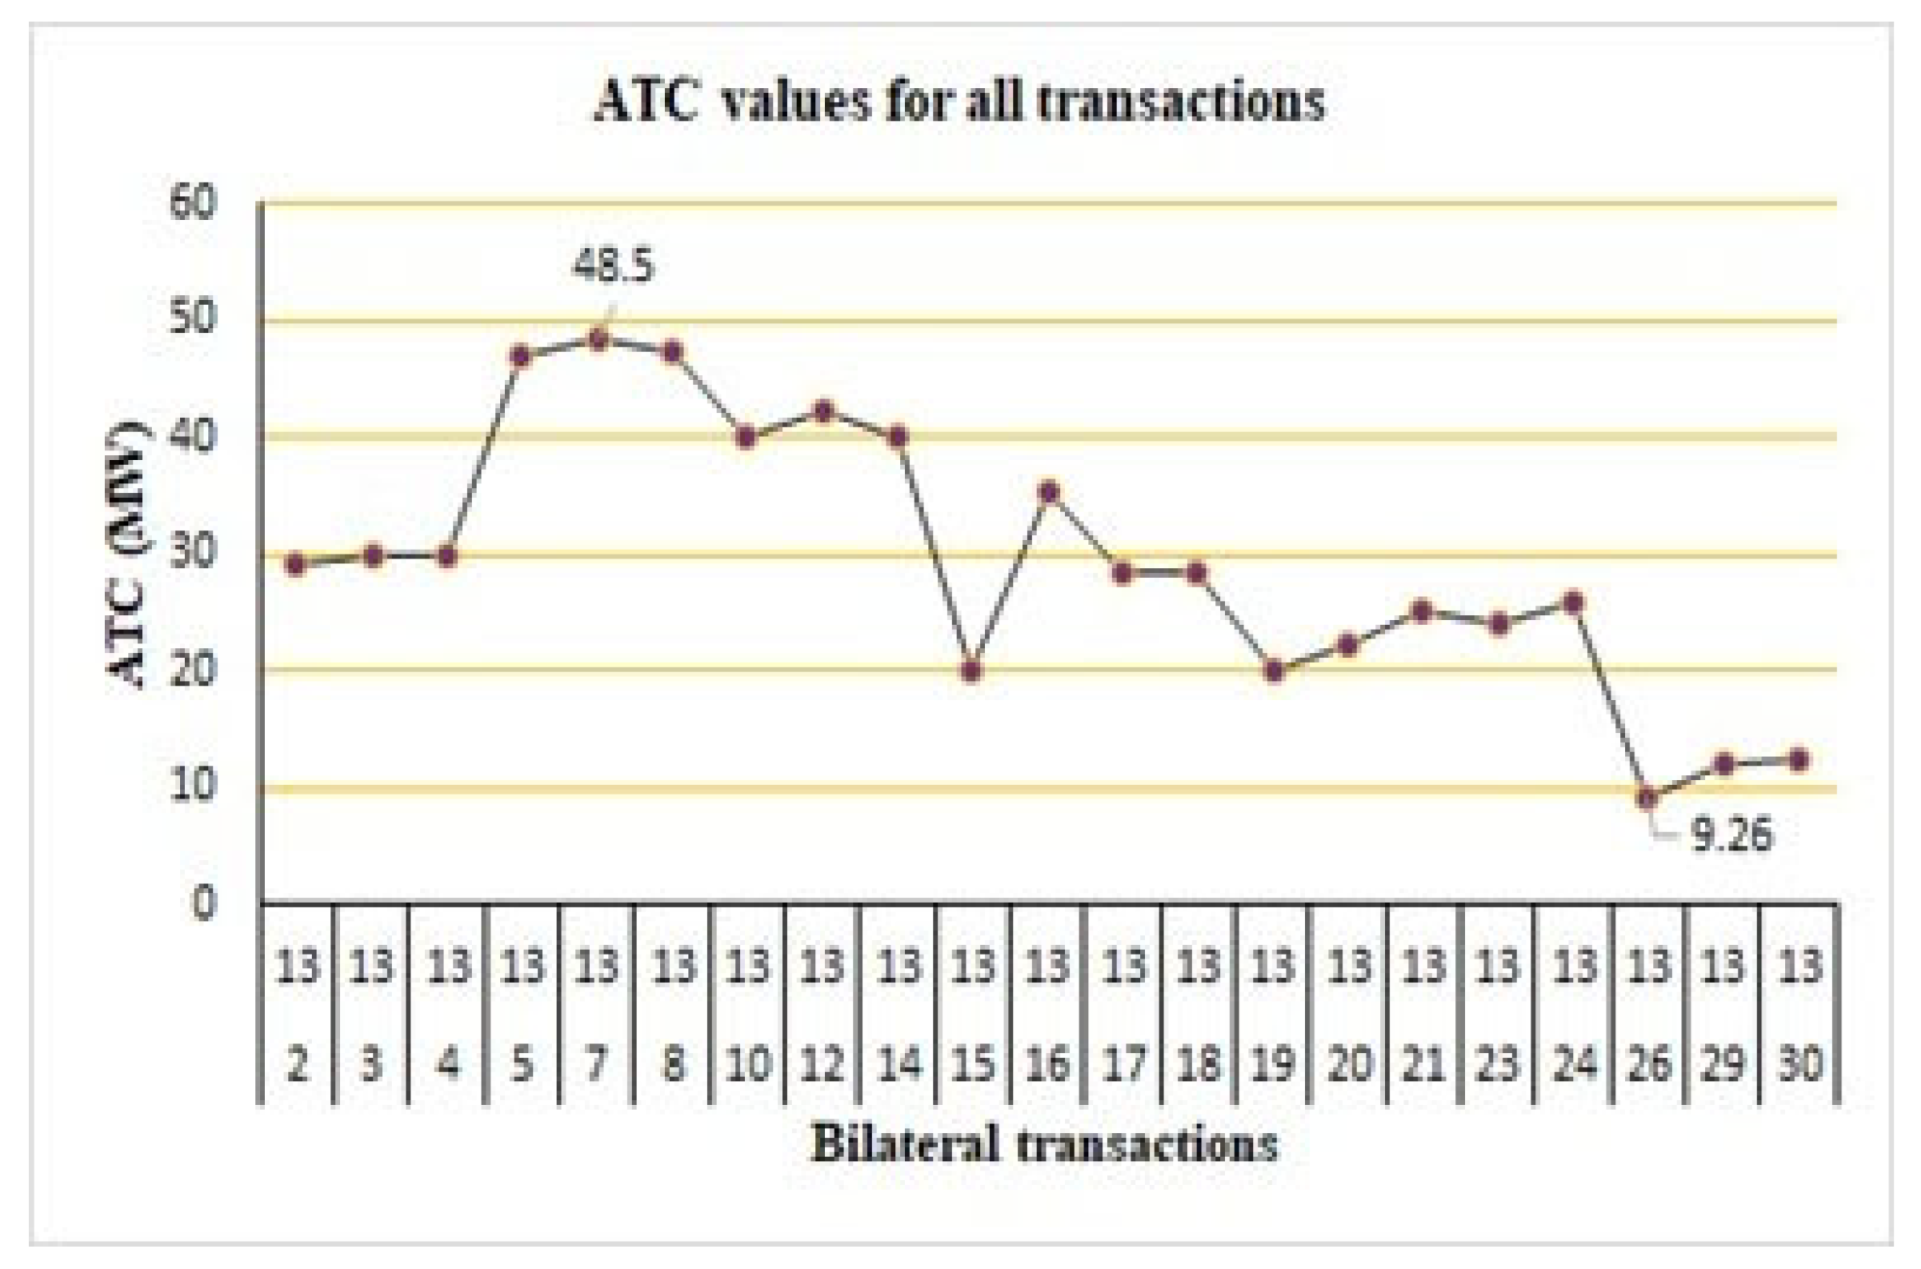
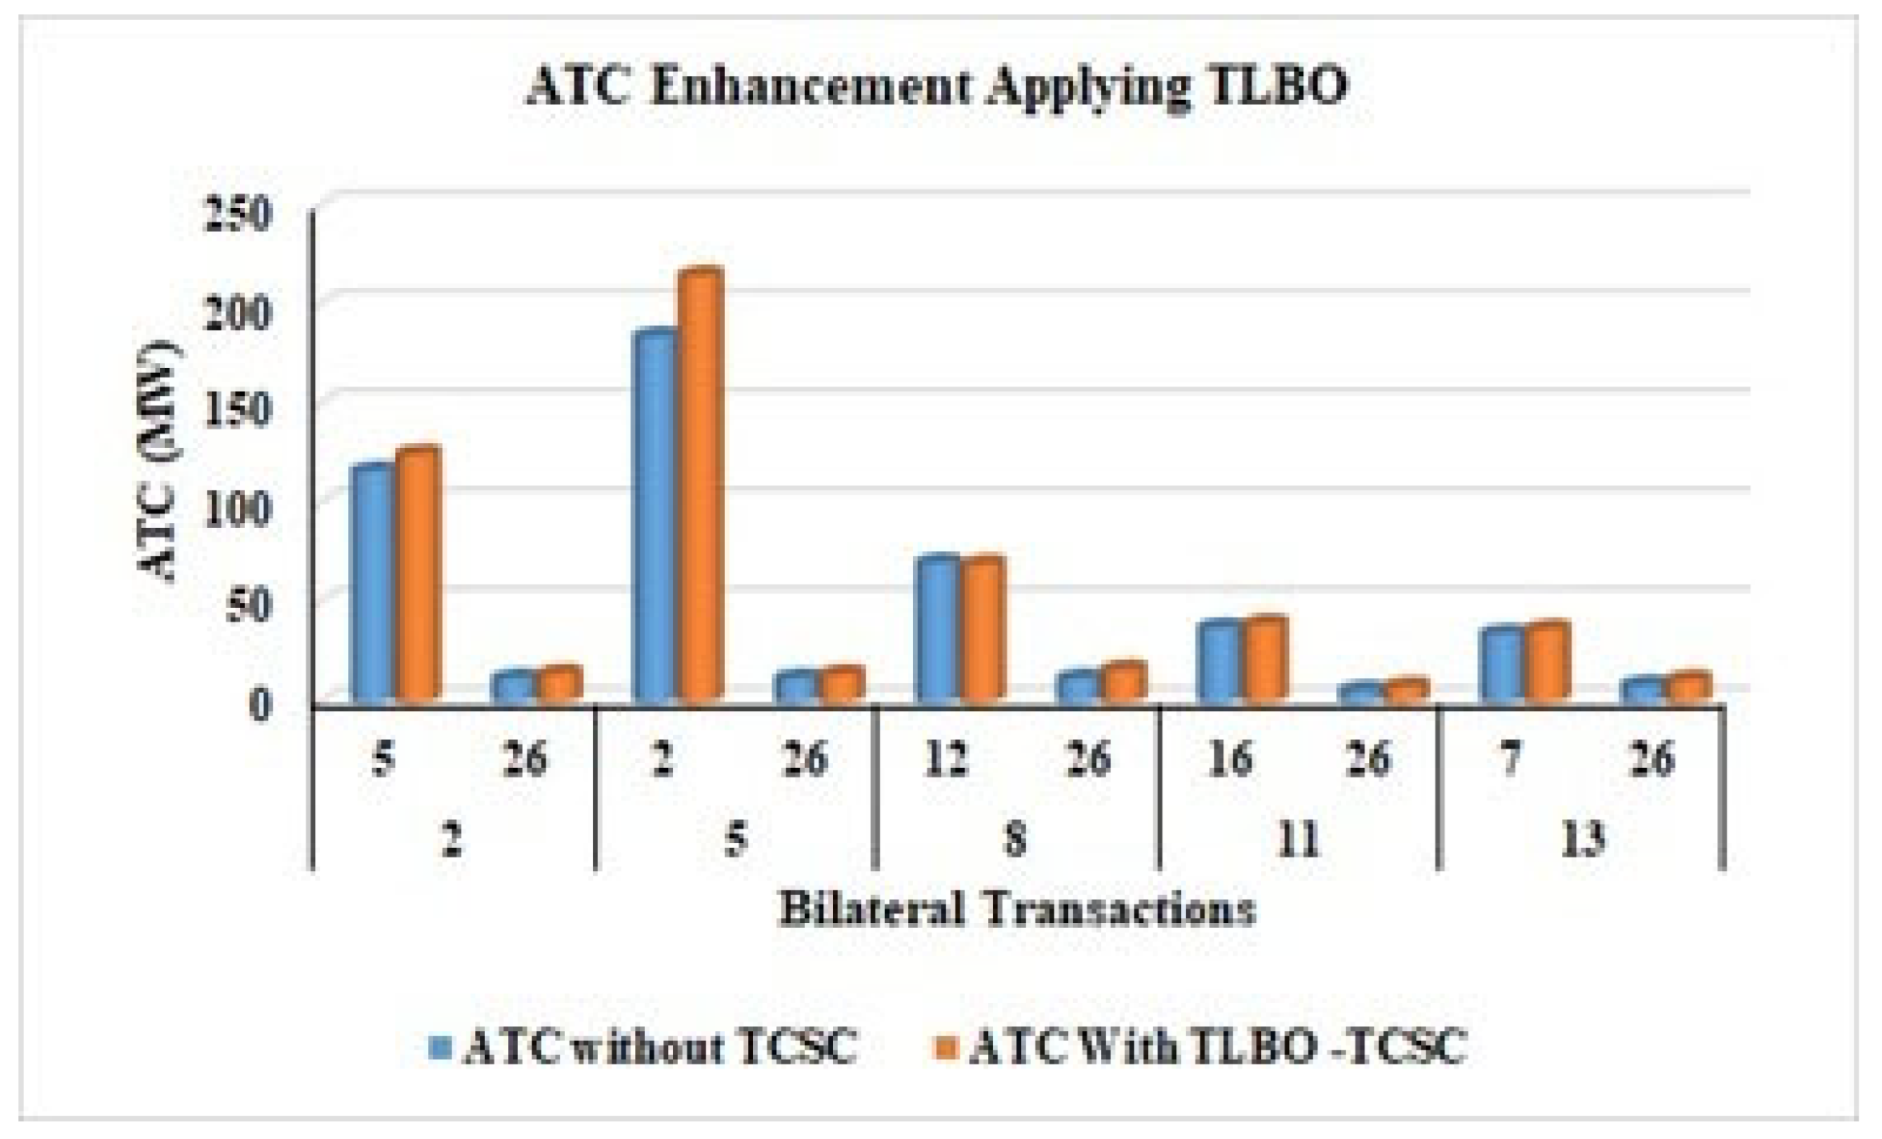
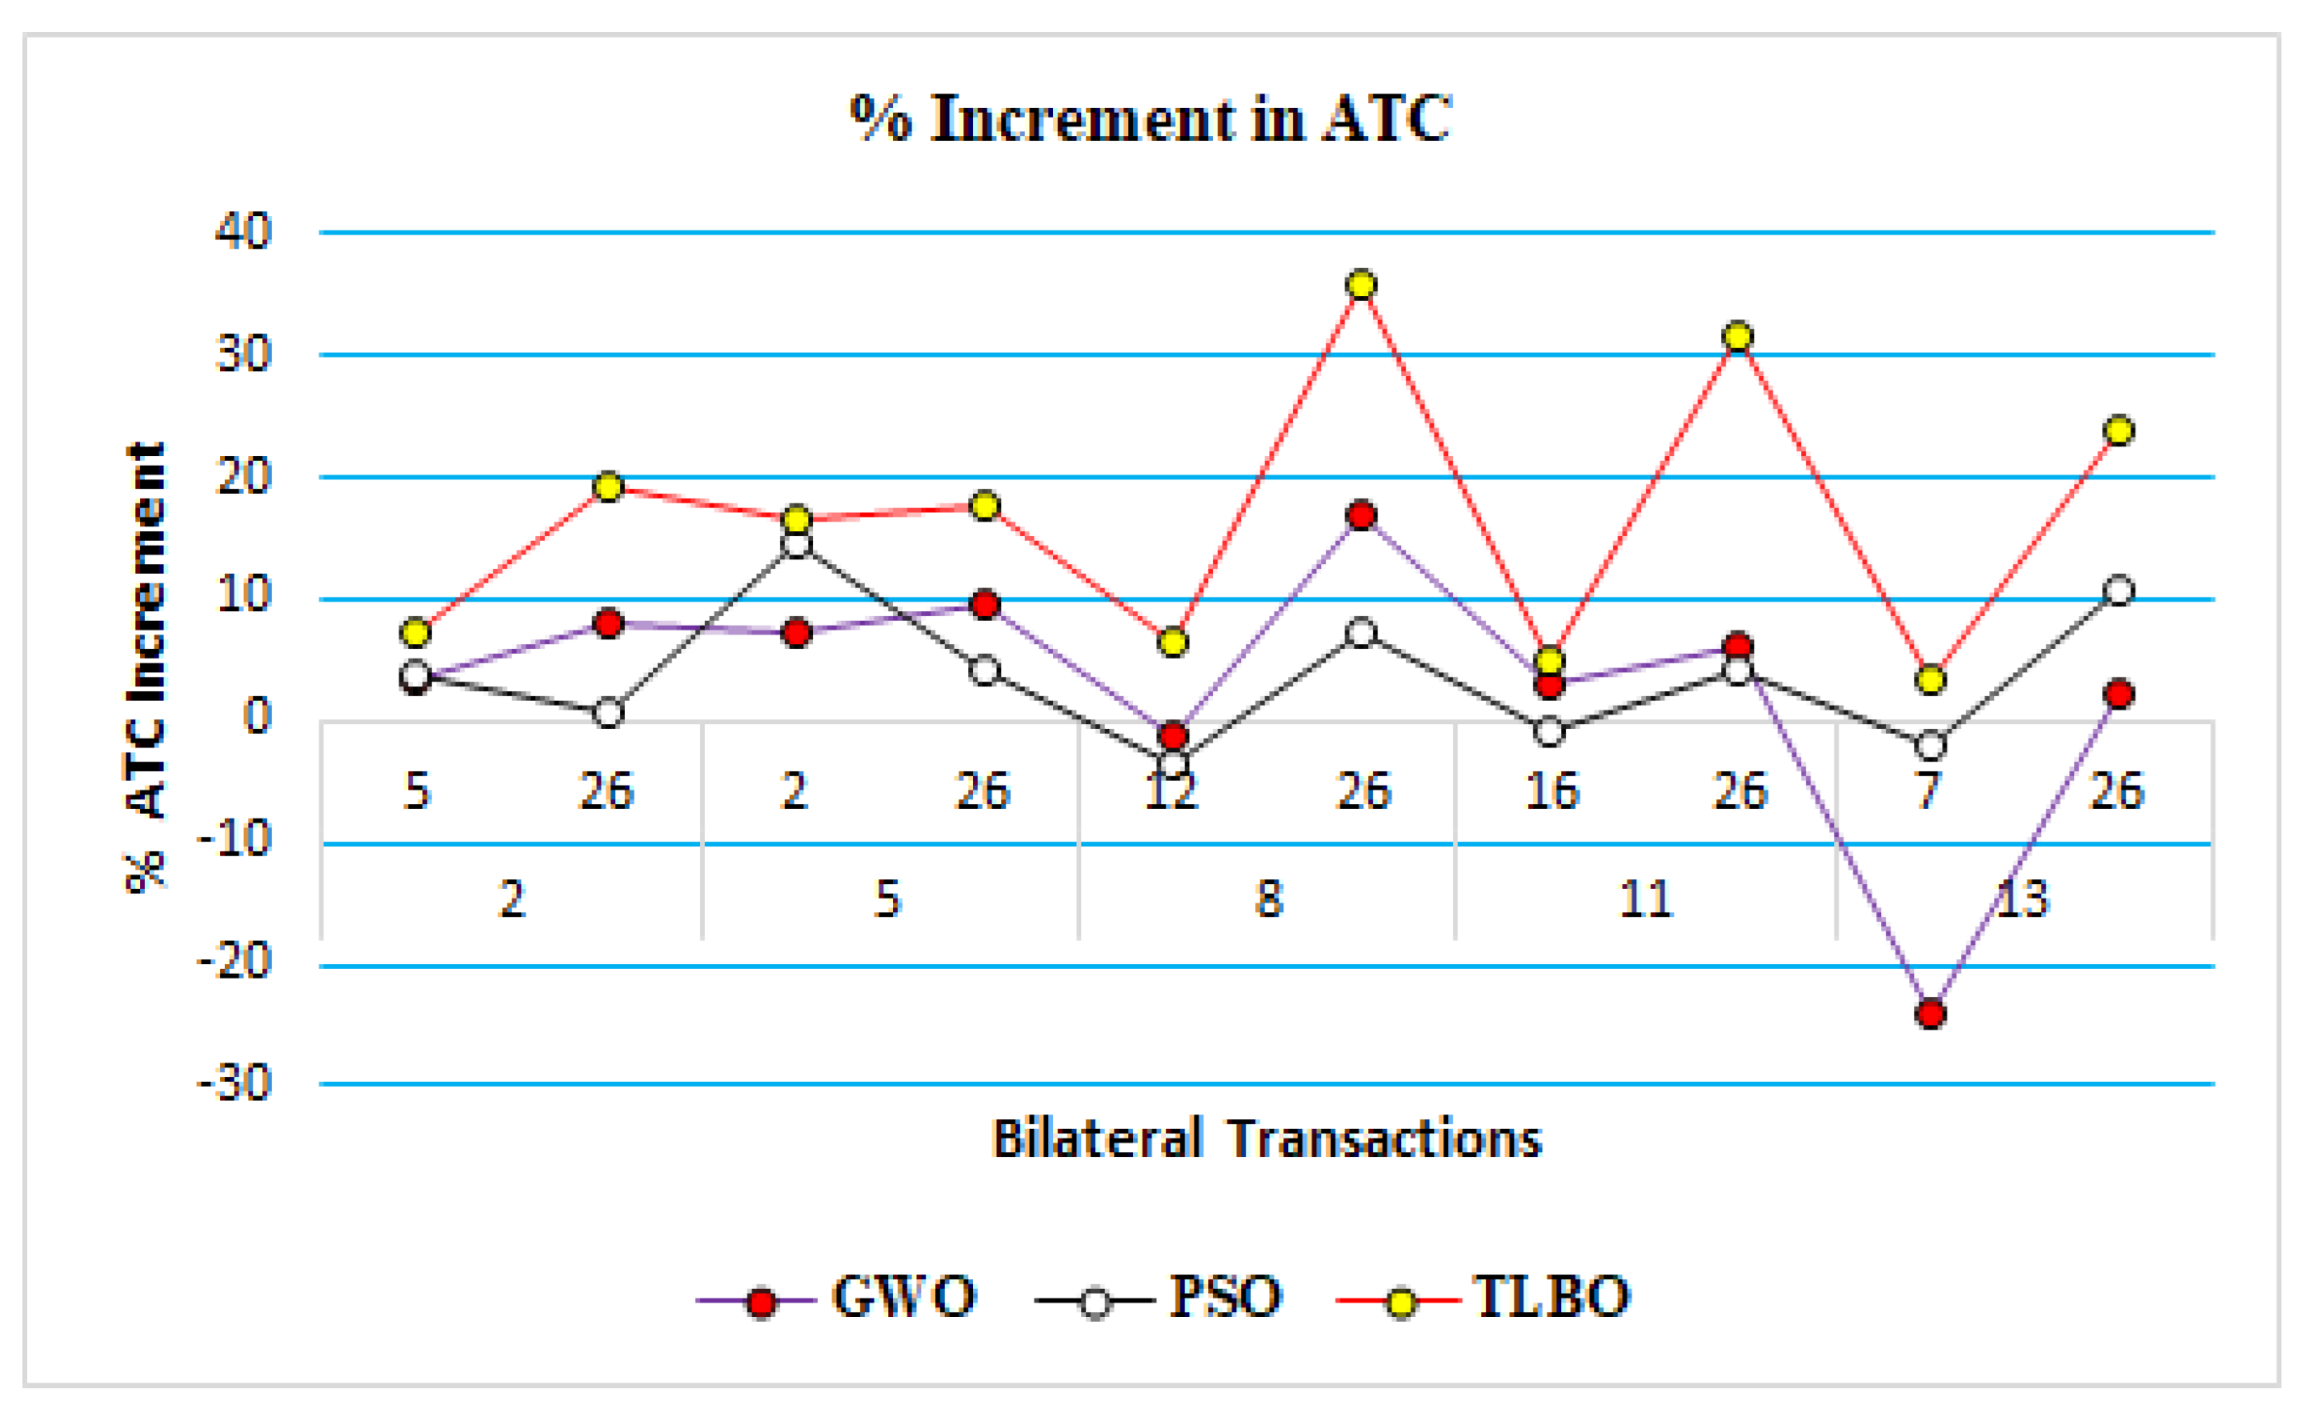
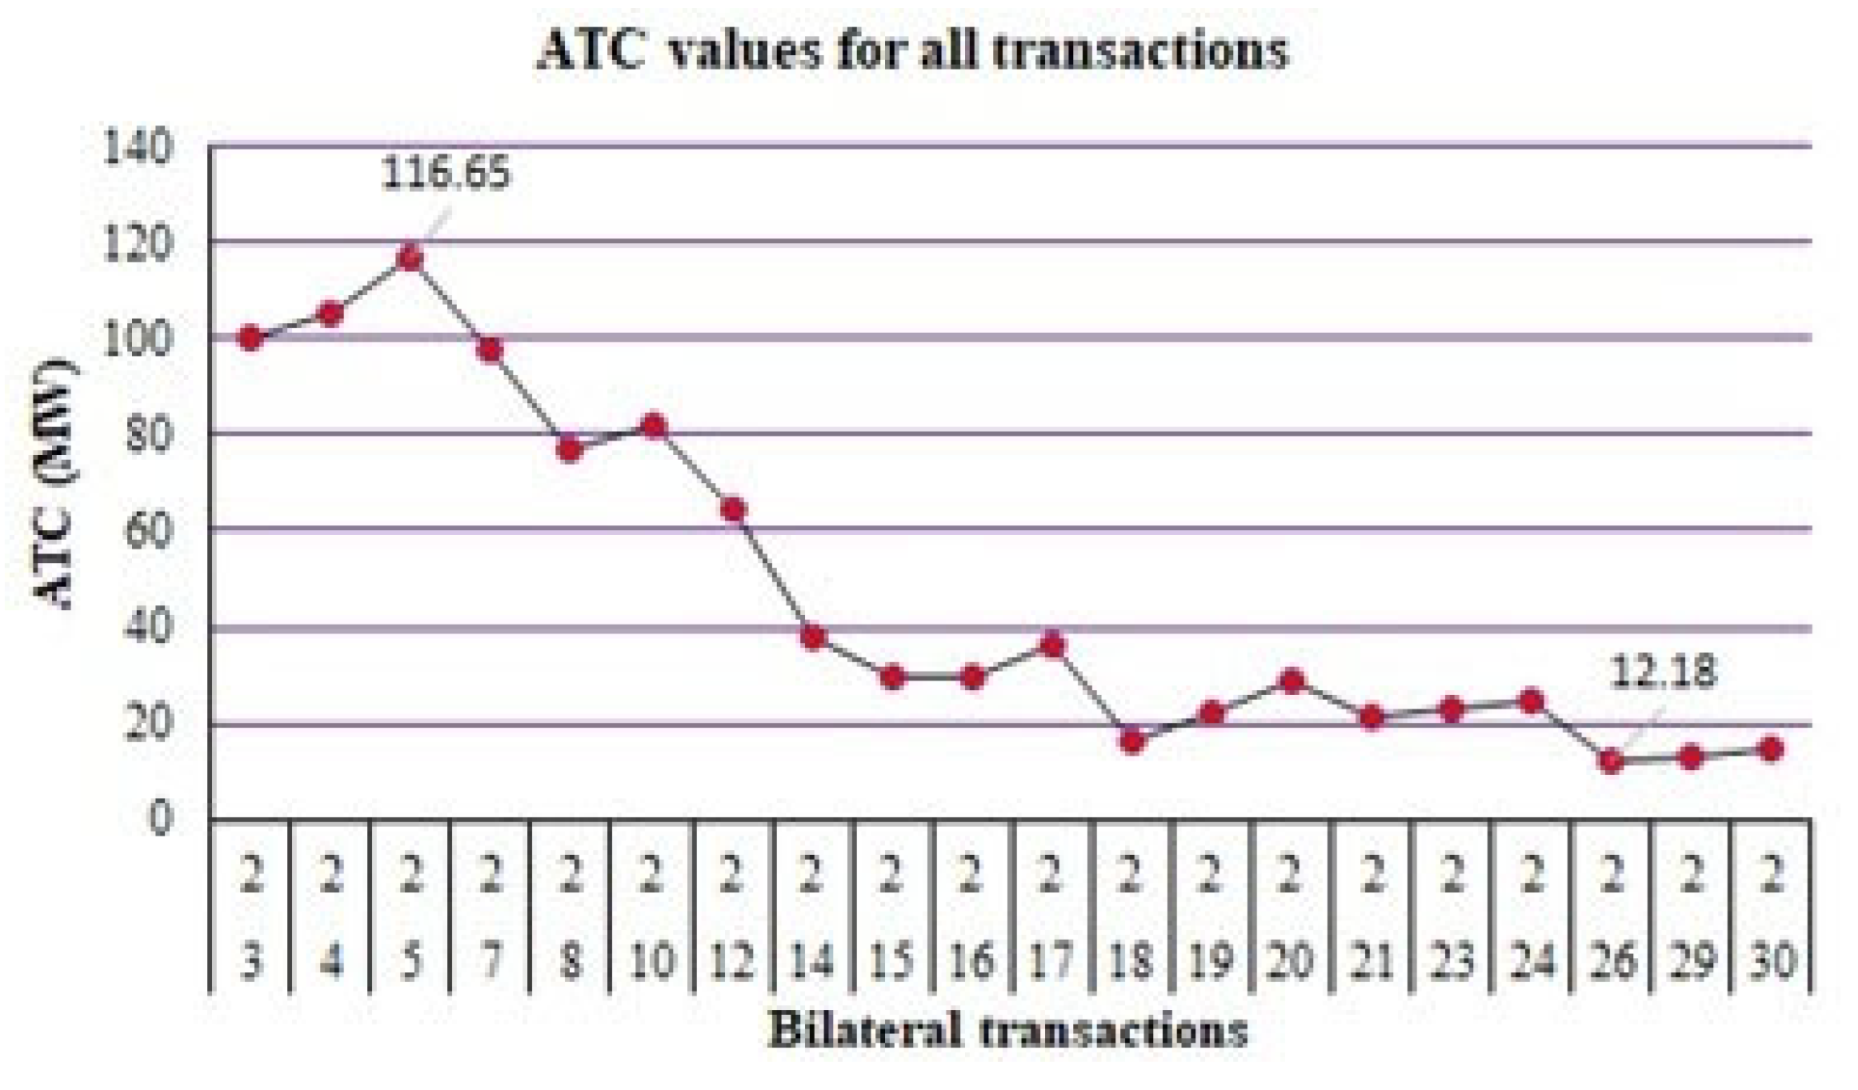
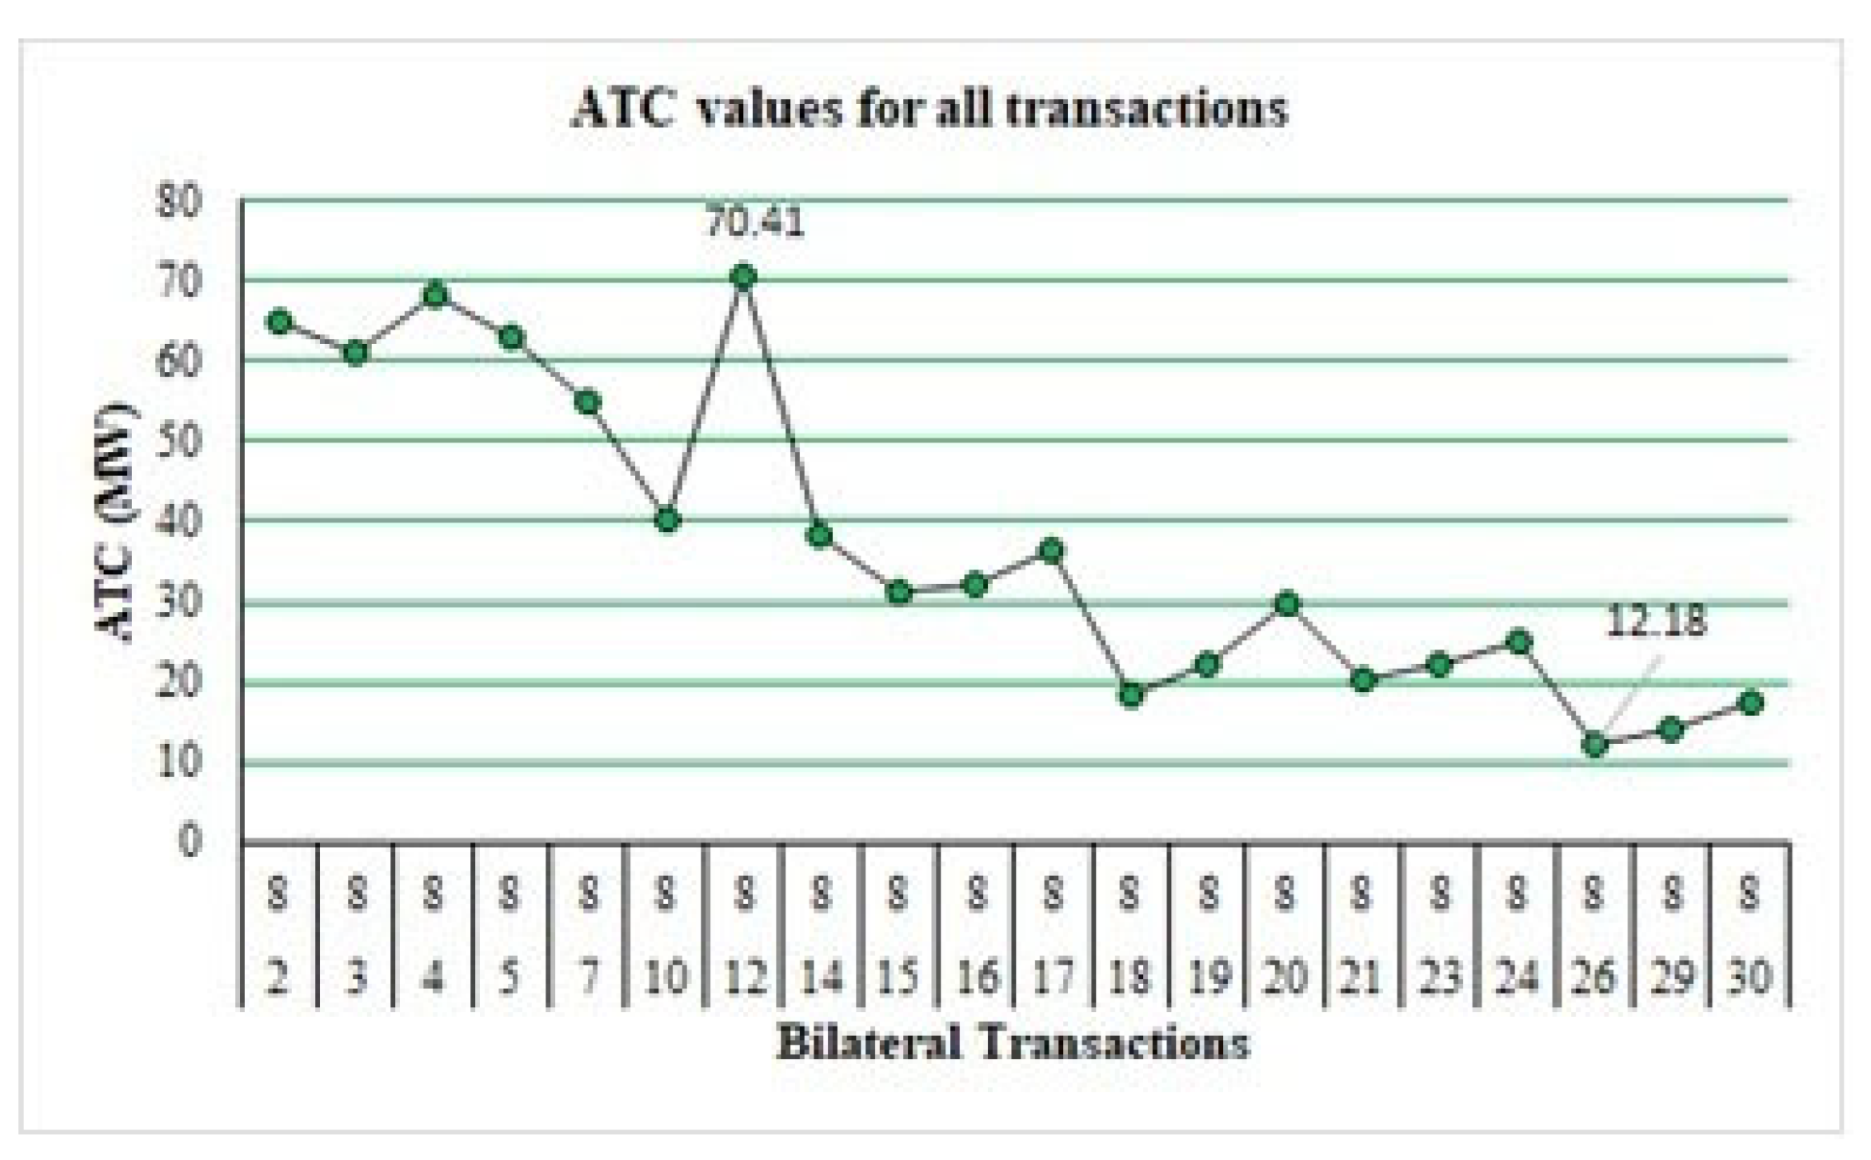
5.1. For ATC Maximization

Figure 9 elaborates the enhanced ATC values when TCSC is optimized with the TLBO technique. From the results, it is observed that the ATC value for different bilateral transactions is enhanced. For transaction between 2–5, the ATC value is increased from the base case value of 116.5 MW to 125.13 MW and for the transaction 2–26, the ATC value is increased from 12.18 MW in base case to 14.53 MW with TLBO optimized TCSC. Similarly, significant ATC enhancement is achieved for both nearby bus and far away bus for each bilateral transaction. The ATC value for distant situated lines is increased significantly and can be concluded from Table 1. The proposed algorithm not only has increased the ATC value for nearby situated lines, but also for distant situated lines and hence enhance the overall ATC of the test system. With the enhancement of ATC, the active power losses also increase due to increased power flow through the lines during bilateral transactions.
Figure 10 compares the percentage increment of ATC for both nearby and distant lines. It can be seen that maximum ATC enhancement obtained by the proposed TLBO algorithm is 36% for the bilateral transaction between buses 8–26, which is a line at the distant location. For the same transaction, the percentage enhancement of ATC by GWO and PSO is 16.83% and 7.14%, respectively. Additionally, for transaction between 2–26, 5–26, 11–26, and 13–26 (transactions for faraway lines) are enhanced by 19%, 16.56% 31.52%, and 23.75%, respectively, by the proposed algorithm. Total ATC in base case for the bilateral transactions considered is 509.74 MW in base case. This increases to 520.84 MW with GWO, 539.64 MW with PSO, and 570.16 MW with the TLBO optimized TCSC. Here, an approximate enhancement of ATC with proposed TLBO algorithm is 11.853%.
The reactive power losses are also calculated here and given in Figure 11. The results show that with the enhancement of ATC, the active power losses are increased, but the reactive power losses are decreased. Figure 11 presents the comparative analysis of reactive power losses reduction by the proposed TLBO, GWO and PSO algorithms. It is observed that maximum reduction in reactive power loss is obtained with the application of TLBO optimized TCSC. The average power loss in base case for all the transactions considered is 30.481 MVAr. With the application of TLBO, GWO, and PSO, the average reactive power loss is reduced to 21.44 MVAr, 28.556 MVAr, and 28.593 MVAr, respectively. This means that the reactive power losses are reduced by 29.65%, 6.28%, and 6.19% by the application of TCSC optimized by TLBO, GWO, and PSO, respectively, and hence the results of TLBO are better than GWO and PSO.

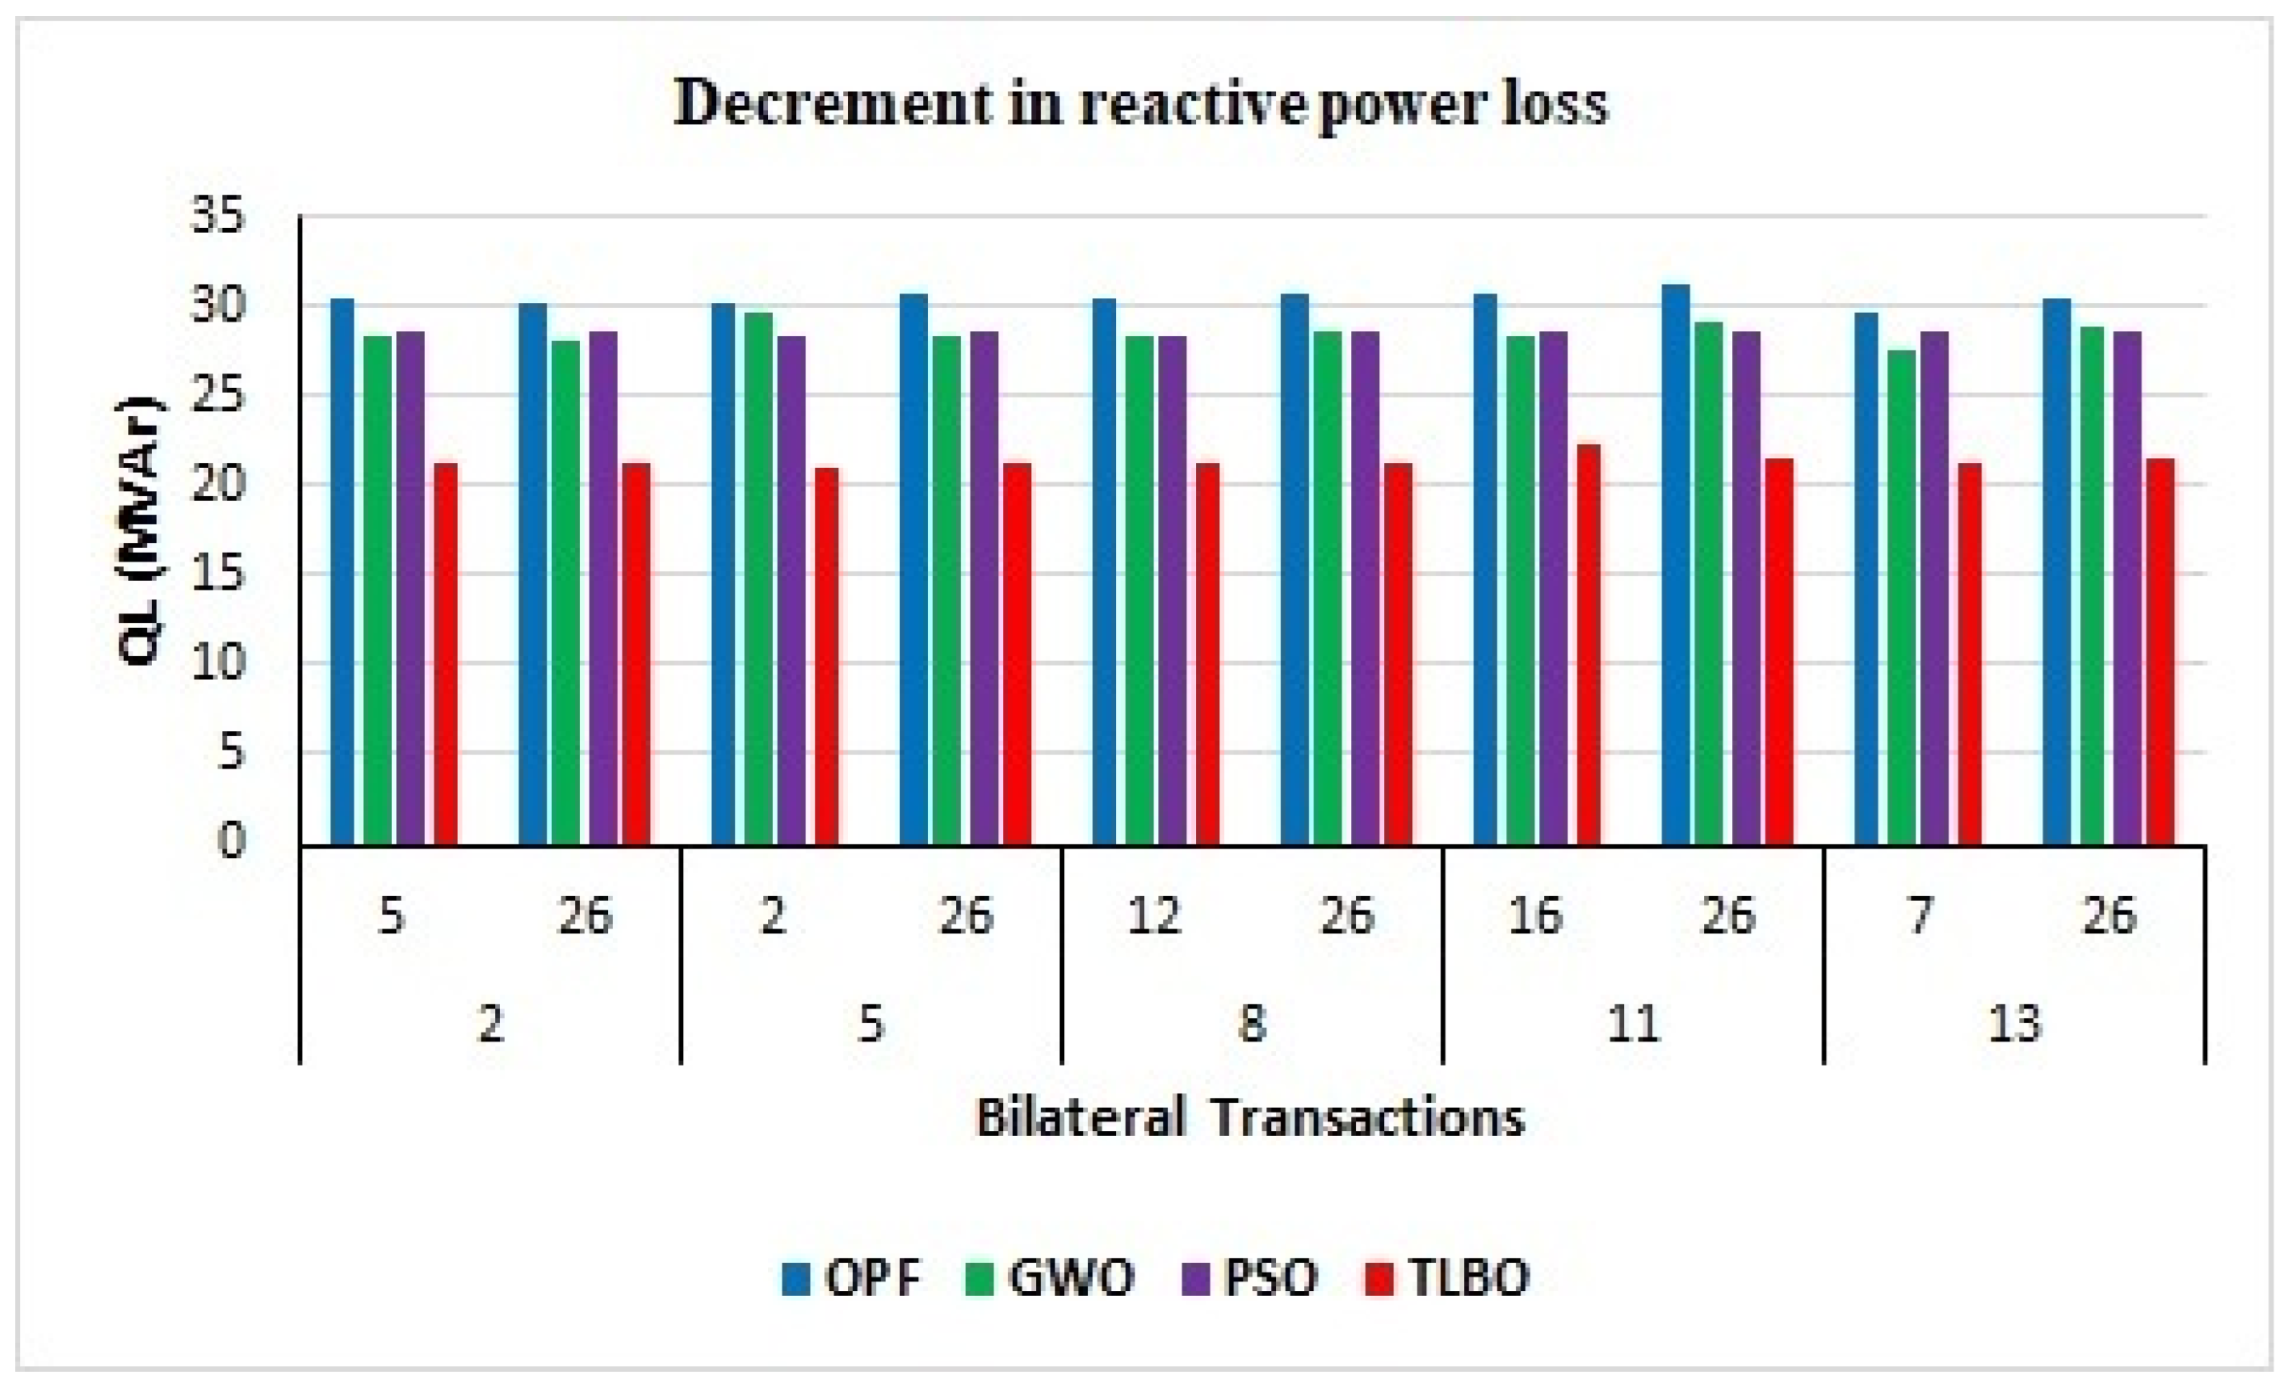
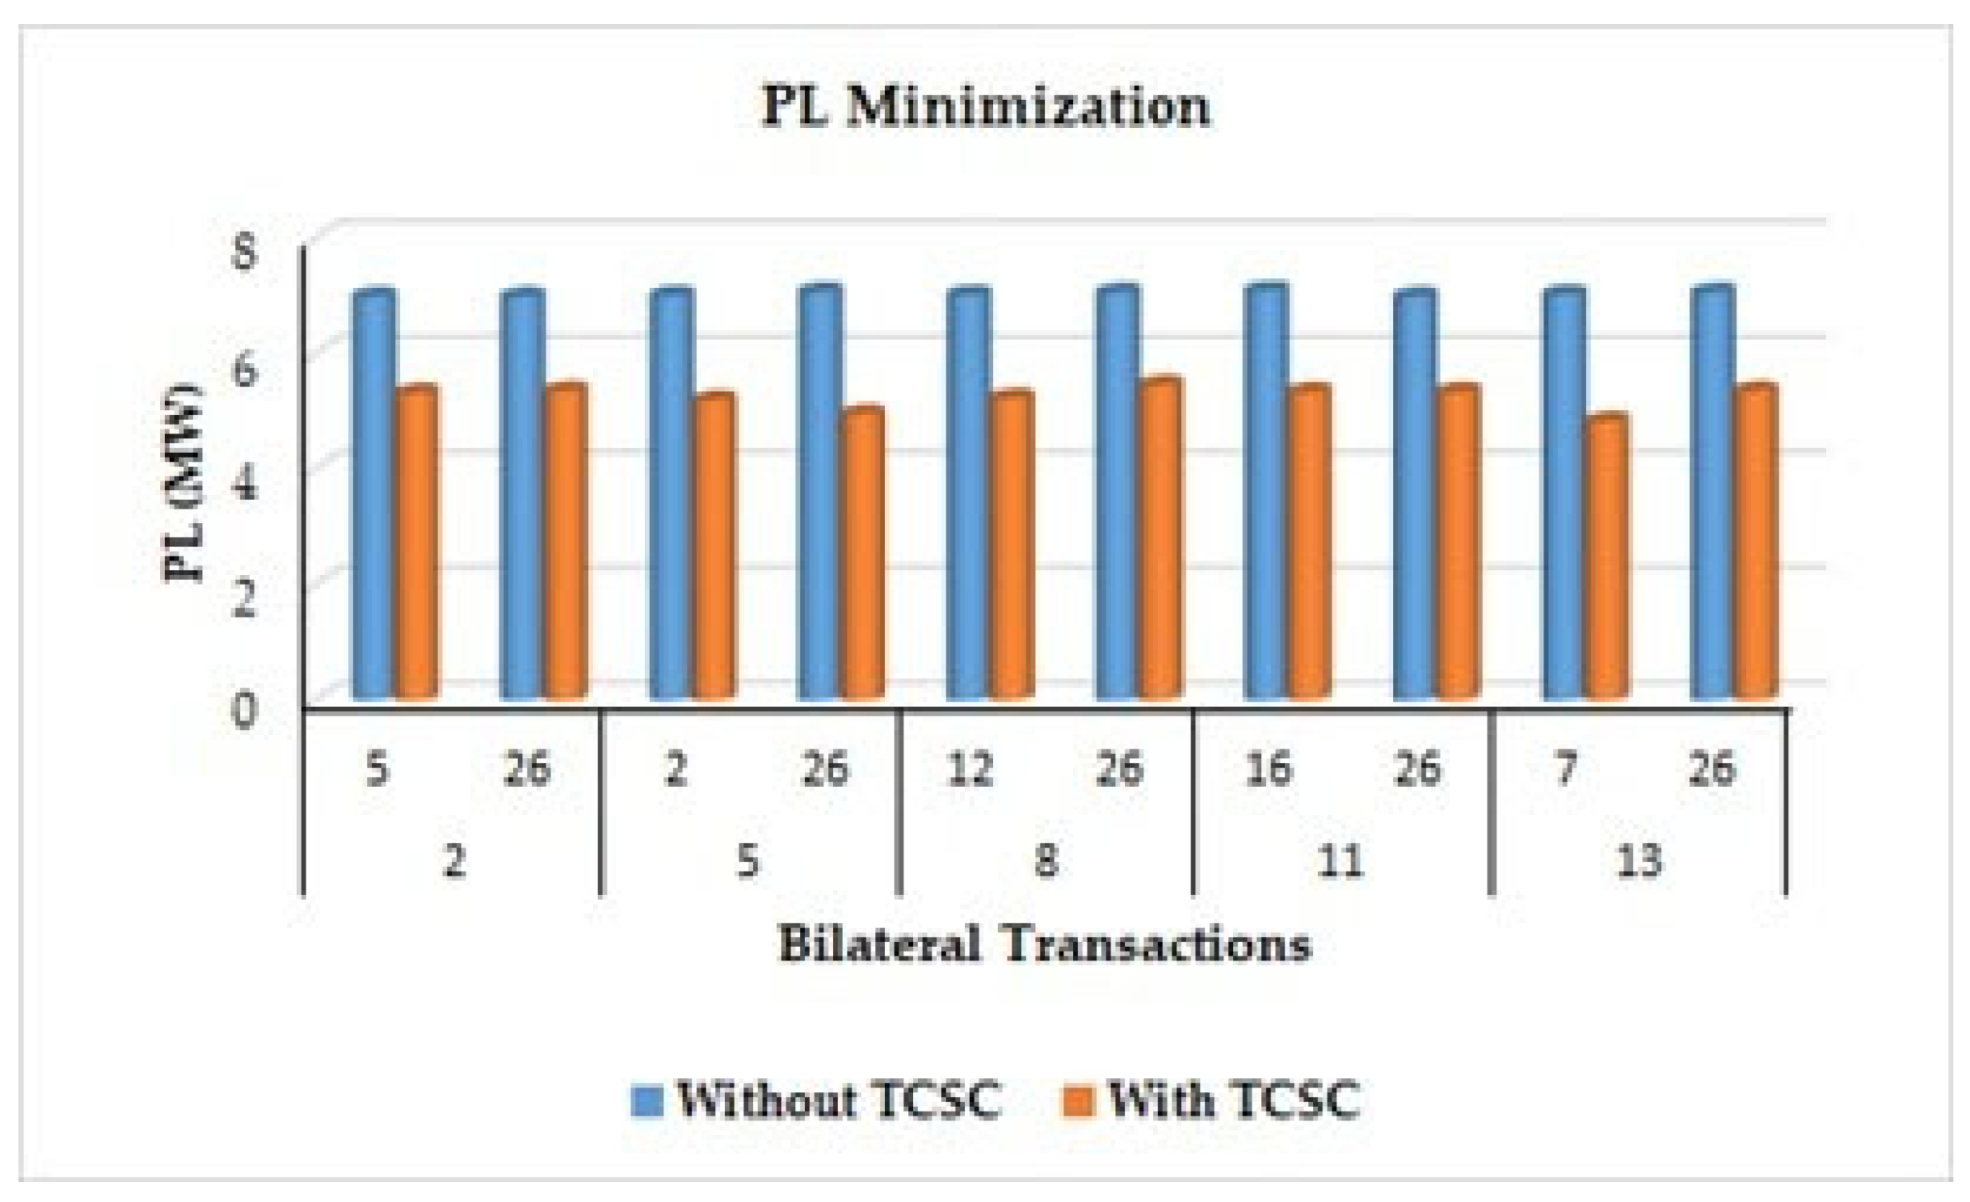
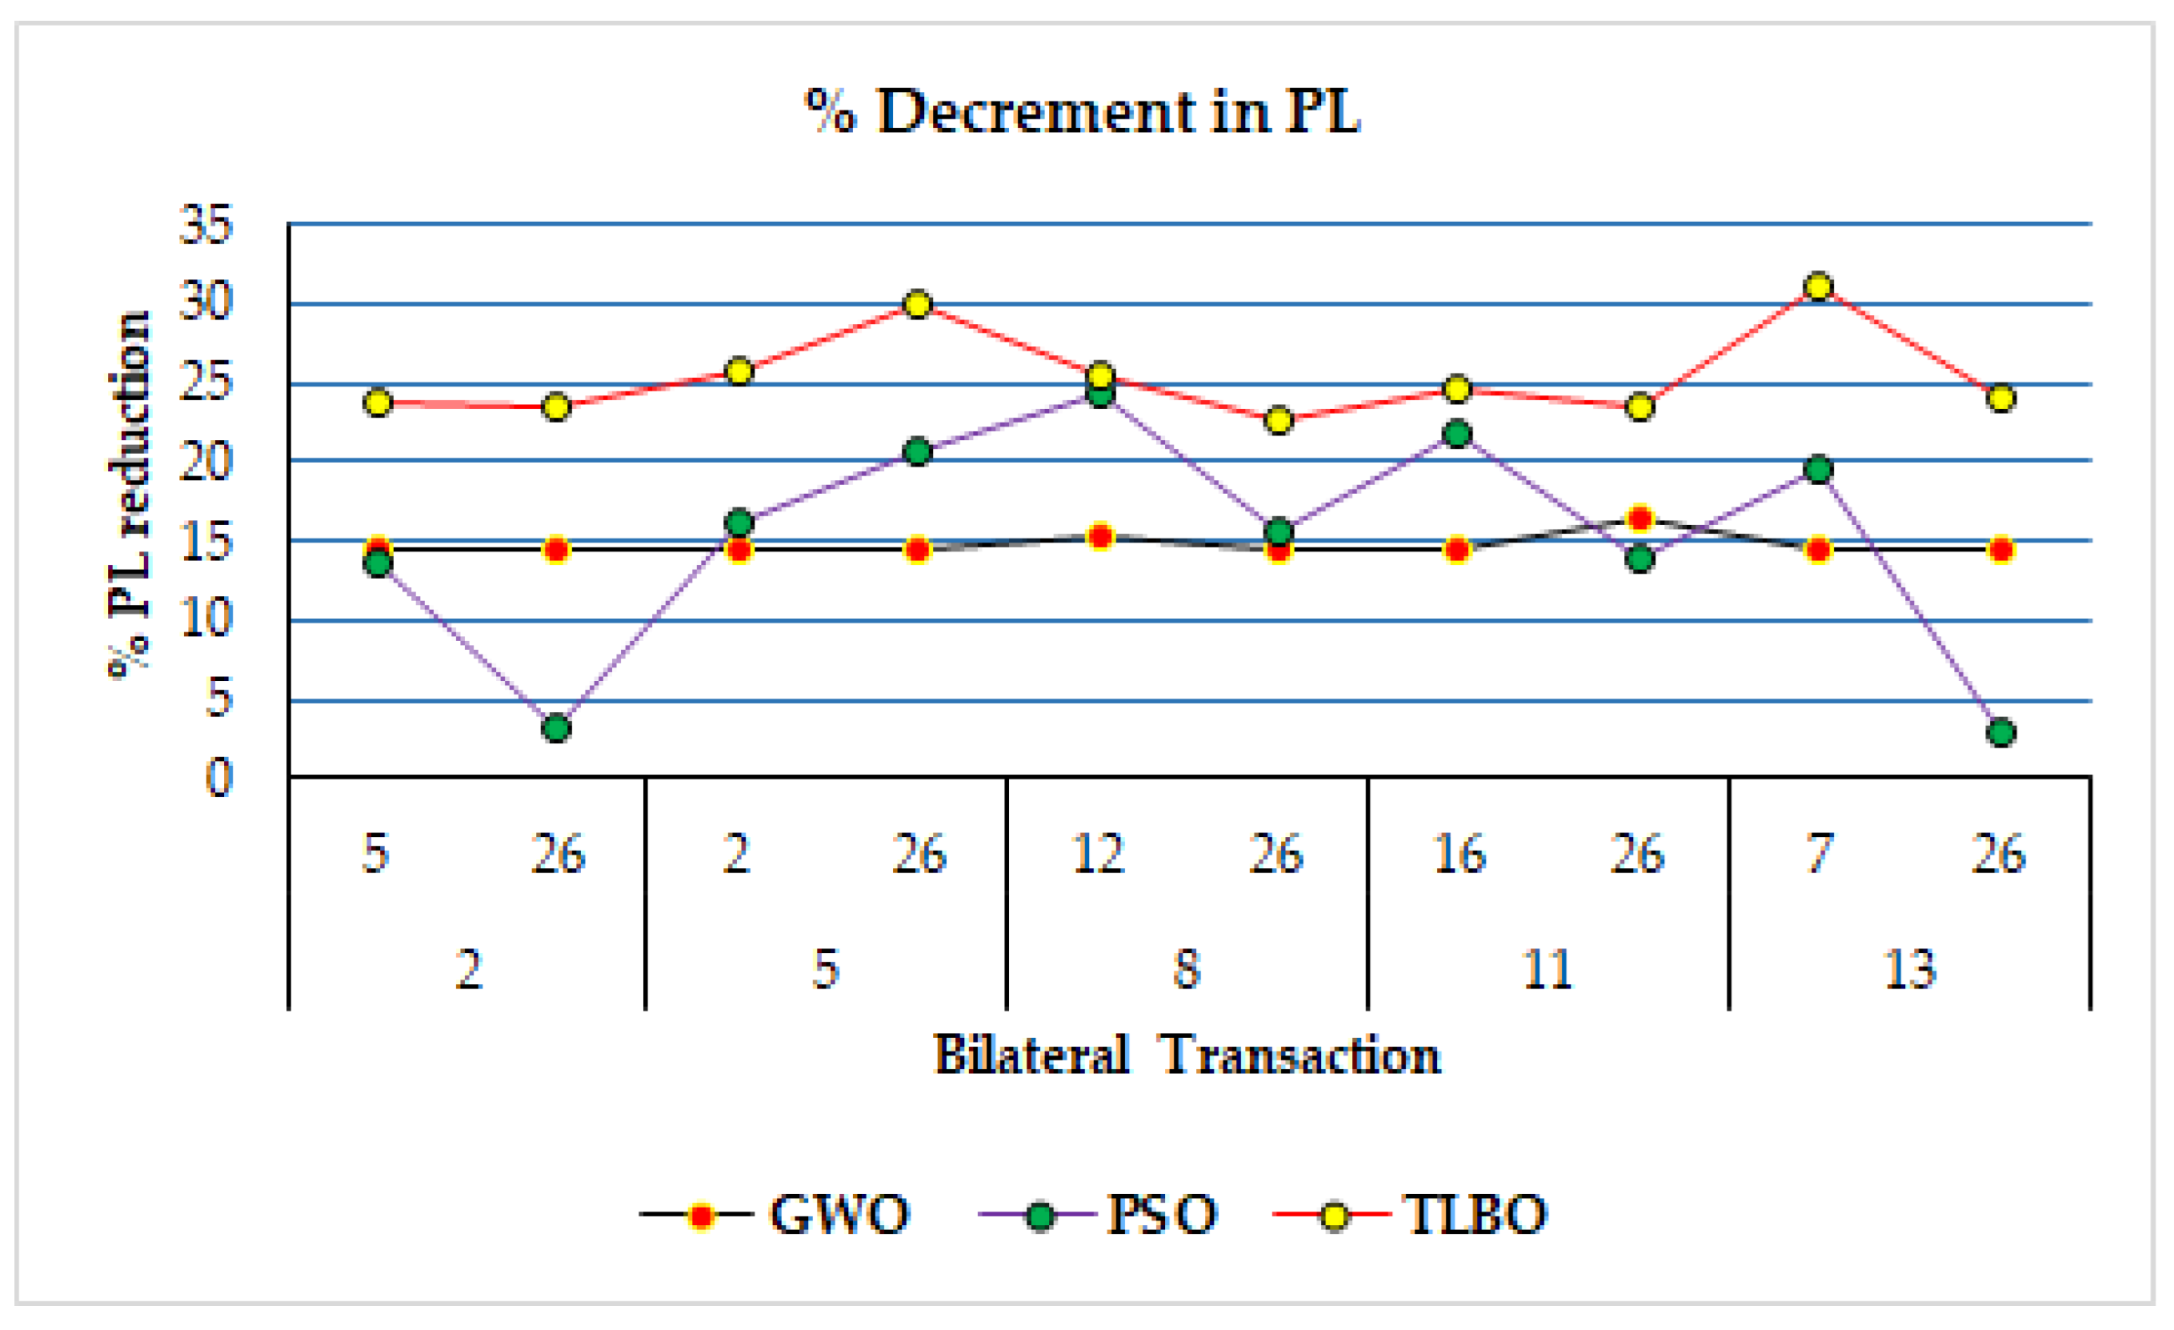
5.2. For Active Power Loss Minimization

Figure 12 shows the variation of active power loss in the test system for the bilateral transactions. It is observed that as compared to the base case without TCSC, the active power loss is reduced significantly. When the weight factor ( w 2 ) in Equation (15) is changed, the active power losses are reduced. This also results in the reduction of ATC of the system. The maximum power loss reduction is obtained in the transaction 5–26 where the active power loss is reduced from the base case value of 7.09 MW to 4.97 MW. Similarly, in the transaction 13–7, the active power loss is reduced from base case value of 7.05 MW to 4.80 MW. In all the transactions considered, the average base case active power loss is 7.05 MW, which is reduced to an average of 5.25 MW after TLBO optimized TCSC is implemented in the system. This reduction is approximately 25%, which is quite significant when system efficiency is concerned. Reduced power losses mitigate the congestion in the lines.
A detailed comparative analysis between the results obtained by GWO, PSO, and TLBO algorithm is presented in Table 2. From Table 2, it is observed that with the objective to reduce active power losses, the ATC of the system is also reduced.
Taking example of transaction between 2–5, the base case ATC is 116.65 MW. With the power loss minimization objective, the ATC value is reduced to 98.99 MW in GWO, 90.67 MW in PSO, and it reduces to 100.23 MW in case of TLBO application. Hence, it can be depicted that TLBO optimized TCSC in the system results in less reduction of ATC as compared to GWO and PSO. The total ATC of the system for the bilateral transactions considered is 509.74 MW. This reduces to 432 MW in case of GWO, 408.3 MW in case of PSO, and 453.65 MW in case of TLBO.
Figure 13 indicates the percentage reduction in active power loss achieve with the implementation of TCSC optimized by GWO, PSO and TLBO for all the bilateral transactions considered. It can be depicted from Figure 13, that overall active power reduction for the bilateral transactions under consideration is 3.15% in case of GWO, 3.822% in case of PSO, and it is 16.76% when TLBO is applied to locate and optimize the size of TCSC.
Table 3 shows the results of line number and size of TCSC well optimize through TLBO technique for ATC enhancement and power losses minimization.
The results as presented in Table 1 clearly indicates that as compared to PSO and GWO the ATC value obtained by proposed TLBO algorithm is higher. ATC is not only enhanced for the near bus, but also is increased significantly for the far bus. Similarly, Table 2 validates the effectiveness of TLBO in reducing system active power loss significantly as compared to the two other algorithms presented in the paper. This proves effectiveness of TLBO to mitigate congestion by reducing power loss and enhancing ATC over PSO and GWO for IEEE 30 bus system.

6. Conclusions

This paper proposes a novel method to enhance ATC of the DPS using the application of TLBO and TCSC. The problem is formulated and processed with the help of MATLAB software. The method is implemented using ACPTDF as the sensitivity factor to calculate ATC. The algorithm is applied effectively to significantly enhance the ATC of DPS and to reduce active power losses by a significant value of 11.86% and 16.7%. With the enhancement of ATC, the congestion in the line is reduced, which in turn increased the efficiency and overall stability of the power system. As the need to lay down alternate parallel lines in the system is eliminated, the system becomes more economically viable. The results obtained strongly suggest and prove that TLBO has outperformed the GWO and PSO for various considered cases. Moreover, the implementation of TCSC well optimize through TLBO resulted in ATC reduction when active power loss minimization is the main objective of the work. The ATC values for far away lines are also enhanced in comparison to the base case and through those obtained from GWO and PSO techniques. A detailed investigations and comparative analysis strongly suggest the application of TLBO for deregulated and modern power system.

Author Contributions

All authors planned the study, contributed to the idea and field of information; introduction, A.G.; software, A.G. and G.S.; analysis, A.G., I. and G.S.; conclusion, A.G. and G.S.; writing—original draft preparation, P.N.B. and M.F.A. writing—review and editing, I. and G.S.; supervision. A.G., I., G.S., P.N.B. and M.F.A.; All authors have read and agreed to the published version of the manuscript.

Funding

This research received no external funding.

Institutional Review Board Statement

Not applicable.

Informed Consent Statement

Not applicable.

Data Availability Statement

Not applicable.

Conflicts of Interest

The authors declare no conflict of interest.

Nomenclature

DPSDeregulated power system
GENCOSGeneration companies
TRANSCOSTransmission companies
DISCODistribution company
ISOIndependent system operator
FACTSFlexible Alternating Current transmission system
TCSCThyristor controlled series capacitor
TLBOTeaching learning based algorithm
PSOParticle swarm optimization
GWOGrey wolf optimization
ATCAvailable transfer capability
TTCTotal transfer capability
ETCExisting transmission commitments
TRMTransmission reliability margin
CBMCapacity benefit margin
PTDFPower transmission distribution factor
CPFContinuous power flow
NRNewton Raphson
OPFOptimal power flow
P Gi and Q Gi real and reactive power generations at ith bus, respectively
P Di and Q Di real and reactive power demands at ith bus, respectively
V i , δ i voltage magnitude and corresponding angle of ith bus, respectively
Y ij , θ ij admittance of line between ith and jth bus and its corresponding angle
N b number of buses
Xpuper unit reactance
PLActive power loss

References

  1. Silva, R.; Alves, E.; Ferreira, R.; Villar, J.; Gouveia, C. Characterization of TSO and DSO Grid System Services and TSO-DSO Basic Coordination Mechanisms in the Current Decarbonization Context. Energies 2021, 14, 4451. [Google Scholar] [CrossRef]
  2. Khan, M.T.; Siddiqui, A.S. Congestion management in deregulated power system using FACTS device. Int. J. Syst. Assur. Eng. Manag. 2017, 8, 1–7. [Google Scholar] [CrossRef]
  3. Shweta, N.V.; Prakash, V.; Kuruseelan, S.; Vaithilingam, C. ATC Evaluation in a Deregulated Power System. Energy Procedia 2017, 117, 216–223. [Google Scholar] [CrossRef]
  4. Mohammed, O.O.; Mustaf, M.W.; Mohammed, D.S.S.; Otuoze, A.O. Available transfer capability calculation methods: A comprehensive review. Electr. Energy Syst. 2019, 29, e2846. [Google Scholar] [CrossRef] [Green Version]
  5. Alekhya, B.; Rao, J.S. Enhancement of ATC in a deregulated power system by optimal location of multi-facts devices. In Proceedings of the International Conference on Smart Electric Grid (ISEG), Oshawa, ON, Canada, 12–15 August 2014; pp. 1–9. [Google Scholar] [CrossRef]
  6. Nireekshana, T.; Rao, G.K.; Raju, S.S. Available transfer capability enhancement with FACTS using Cat Swarm Optimization. Ain Shams Eng. J. 2016, 7, 159–167. [Google Scholar] [CrossRef] [Green Version]
  7. Acharya, N.; Mithulananthan, N. Locating series FACTS devices for congestion management in deregulated electricity markets. Electr. Power Syst. Res. 2007, 77, 352–360. [Google Scholar] [CrossRef]
  8. Sawhney, H.; Jeyasurya, B. Application of unified power flow controller for available transfer capability enhancement. Electr. Power Syst. Res. 2004, 69, 155–160. [Google Scholar] [CrossRef]
  9. Pandey, R.K.; Kumar, K.V. Multi agent system driven SSSC for ATC enhancement. In Proceedings of the National Power Systems Conference (NPSC), Bhubaneswar, India, 19–21 December 2016; pp. 1–6. [Google Scholar] [CrossRef]
  10. Kumar, A.; Kumar, J. ATC determination with FACTS devices using PTDFs approach for multi-transactions in competitive electricity markets. Int. J. Electr. Power Energy Syst. 2013, 44, 308–317. [Google Scholar] [CrossRef]
  11. Kumar, R.; Kumar, A. Impact of STATCOM Control Parameters on Available Transfer Capability Enhancement in Energy Markets. Procedia Comput. Sci. 2015, 70, 515–525. [Google Scholar] [CrossRef] [Green Version]
  12. Bavithra, K.; Raja, S.C.; Venkatesh, P. Optimal Setting of FACTS Devices using Particle Swarm Optimization for ATC Enhancement in Deregulated Power System. IFAC-Pap. Online 2016, 49, 450–455. [Google Scholar] [CrossRef]
  13. Gupta, M.; Gupta, A.K.; Sharma, N.K. A Comparative Study of Series Compensation, TCPAR and TCSR FACTS Controllers for Mitigation of Congestion. J. Inst. Eng. (India) Ser. B 2020, 101, 717–728. [Google Scholar] [CrossRef]
  14. Kumar, A.; Kumar, J. ATC enhancement in electricity markets with GUPFC and IPFC—A comparison. Int. J. Electr. Power Energy Syst. 2016, 81, 469–482. [Google Scholar] [CrossRef]
  15. Farahmand, H.; Rashidinejad, M.; Mousavi, A.; Gharaveisi, A.A.; Irving, M.R.; Taylor, G.A. Hybrid Mutation Particle Swarm Optimisation method for Available Transfer Capability enhancement. Int. J. Electr. Power Energy Syst. 2012, 42, 240–249. [Google Scholar] [CrossRef]
  16. Kumar, Y.N.; Bala, A. Self-adaptiveness in particle swarm optimisation to enhance available transfer capability using thyristor-controlled series compensation (TCSC). Sadhana 2018, 43, 152. [Google Scholar]
  17. Venkatraman, K.T.; Paramasivam, B.; Chidambaram, I.A. Optimal allocation of TCSC devices for the enhancement of ATC in deregulated power system using flower pollination algorithm. J. Eng. Sci. Technol. 2018, 13, 2857–2871. [Google Scholar]
  18. North American Electric Reliability Council (NERC). Available Transfer Capability Definition and Determination (Report June 1996); North American Electric Reliability Council: Atlanta, GA, USA, 1996. [Google Scholar]
  19. Ejebe, G.C.; Tong, J.; Waight, J.G.; Frame, J.G.; Wang, X.; Tinney, W.F. Available transfer capability calculations. IEEE Trans. Power Syst. 1998, 13, 1521–1527. [Google Scholar] [CrossRef]
  20. Gautam, A.; Sharma, P.R.; Kumar, Y. Sensitivity based ATC Maximization by Optimal Placement of TCSC applying Grey Wolf Optimization. In Proceedings of the 3rd International Conference on Recent Developments in Control, Automation & Power Engineering (RDCAPE), Noida, India, 10–11 October 2019; pp. 313–318. [Google Scholar] [CrossRef]
  21. Vetrivel, K.; Ganapathy, S.S.; Rao, K.U. Congestion Management and ATC Enhancement in Deregulated Power System Using Optimal Allocation of FACTS Devices. Middle-East J. Sci. Res. 2017, 25, 22–33. [Google Scholar] [CrossRef]
  22. Rao, R.V. Review of applications of TLBO algorithm and a tutorial for beginners to solve the unconstrained and constrained optimization problems. Decis. Sci. Lett. 2016, 5, 1–30. [Google Scholar]
  23. Al-Roomi, A.R. Power Flow Test Systems Repository; Dalhousie University, Electrical and Computer Engineering: Halifax, NS, Canada, 2015. [Google Scholar]
Figure 1. Schematic of TCSC model.
Energies 15 04448 g001
Figure 2. Operations of TLBO algorithm.
Energies 15 04448 g002
Figure 3. IEEE 30 BUS System [23].
Energies 15 04448 g003
Figure 4. ATC values for all transactions with respect to generator at bus 2.
Energies 15 04448 g004
Figure 5. ATC values for all transactions with respect to generator at bus 5.
Energies 15 04448 g005
Figure 6. ATC values for all transactions with respect to generator at bus 8.
Energies 15 04448 g006
Figure 7. ATC values for all transactions with respect to generator at bus 11.
Energies 15 04448 g007
Figure 8. ATC values for all transactions with respect to generator at bus 13.
Energies 15 04448 g008
Figure 9. ATC enhancement using TLBO with and without TCSC.
Energies 15 04448 g009
Figure 10. Comparative percentage increment in ATC by GWO, PSO and TLBO.
Energies 15 04448 g010
Figure 11. Comparative decrement in reactive power loss by TLBO, GWO, and PSO.
Energies 15 04448 g011
Figure 12. Active power loss minimization by applying TLBO with and without TCSC.
Energies 15 04448 g012
Figure 13. Comparative percentage decrement in PL by GWO, PSO and TLBO.
Energies 15 04448 g013
Table 1. Consolidated results for ATC maximization.
Bilateral TransactionsATC (MW)Active Power Loss (MW)
OPFOPF with TCSCOPFOPF with TCSC
SellerBuyerGWO PSOTLBOGWO PSOTLBO
25116.65120.75121125.137.017.137.257.3
2612.1813.1812.2514.537.017.137.457.32
52184.56198.04211.3215.137.037.457.147.23
2612.2613.4512.7514.457.097.197.227.29
81270.4169.5767.975.077.047.177.177.25
2612.1814.2313.0516.577.087.217.247.32
111637.6538.837.339.587.117.247.27.3
266.096.456.358.017.017.787.257.32
13748.536.8947.550.237.057.697.247.23
269.269.4610.2411.467.087.977.267.29
Table 2. Consolidated results for active power loss minimization.
Bilateral TransactionsATC (MW)Active Power Loss (MW)
OPFOPF with TCSCOPFOPF with TCSC
SellerBuyerGWO PSOTLBOGWO PSOTLBO
25116.6598.9990.67100.237.016.0006.065.34
2612.1810.338.3410.857.016.0006.785.37
52184.56156.61165.67164.837.036.0175.895.22
2612.2610.49.4510.647.096.0695.634.97
81270.4159.7545.8960.877.046.0265.325.25
2612.1810.337.5410.587.086.0605.985.48
111637.6531.9532.7832.567.116.0865.565.36
266.095.166.035.047.016.0006.045.36
13748.541.1532.4345.927.056.0345.675.32
269.267.859.548.137.086.0606.875.37
Table 3. Consolidated results for TCSC location and size.
Bilateral TransactionsATC EnhancementPower Loss Minimization
SellerBuyerTCSC Loc.TCSC SizeTCSC Loc.TCSC Size
2515−0.75746−0.60243
26200.189690.1024
5220.1270360.2000
269−0.776190.1069
81216−0.070821−0.0986
2636−0.078936−0.6704
111660.102560.1069
26200.0754360.1128
13735−0.734826−0.7658
2650.20050.1869
Publisher’s Note: MDPI stays neutral with regard to jurisdictional claims in published maps and institutional affiliations.

