Article

DC Optimal Power Flow Model to Assess the Irradiance Effect on the Sizing and Profitability of the PV-Battery System

by
Fernando García-Muñoz
1,2,
Miguel Alfaro
1,
Guillermo Fuertes
1,3,* and
Manuel Vargas
1
1
Industrial Engineering Department, University of Santiago de Chile, Avenida Ecuador 3769, Santiago 9170124, Chile
2
IREC Catalonia Institute for Energy Research, C. Jardins de les Dones de Negre, 1, Pl. 2a, 08930 Sant Adrià del Besòs, Spain
3
Facultad de Ingeniería, Ciencia y Tecnología, Universidad Bernardo O’Higgins, Avenida Viel 1497, Ruta 5 Sur, Santiago 8370993, Chile
*
Author to whom correspondence should be addressed.
Energies 2022, 15(12), 4408; https://doi.org/10.3390/en15124408
Submission received: 13 May 2022 / Revised: 27 May 2022 / Accepted: 8 June 2022 / Published: 16 June 2022
(This article belongs to the Special Issue Energy Performance of the Photovoltaic Systems)

Abstract

:
The decreasing cost of renewable energy resources and the developments in storage system technologies over recent years have increased the penetration of photovoltaic systems to face the high rise in the electricity load. Likewise, there has also been an increase in the demand for tools that make this integration process in the current power systems profitable. This paper proposes a mathematical model based on the DC optimal power flow equations to find the optimal capacity of the PV panels and batteries for a standalone system or a system supported by the grid, while the investment and the energy required by the grid are minimized. In this regard, five different locations have been used as case studies to measure the influence of the irradiance level on the PV-Battery capacity installed and on the economic indicators such as CAPEX, OPEX, NPV, IRR, and the payback period. Thus, a modified 14-bus system has been used to replicate the grid technical limitations and show that a PV-Battery system connected to the grid could produce 26.9% more savings than a standalone PV-Battery and that a location with irradiance levels over 6.08 (kWh/m2/yr) could reduce the payback period for two years.

1. Introduction

The exponential increase in energy consumption of fossil origins (limited nature) requires an urgent change towards environmentally sustainable substitute resources: renewable energies are the best alternative. Currently, photovoltaic solar energy (PV) is considered one of the most promising and feasible alternatives because it is an inexhaustible energy resource, has a clean transformation process, and its accessibility is free [1]. After the first technological advances in alternative electricity sources, the expansion of solar PV power systems has become increasingly popular [2]. Currently, machine learning techniques—particularly reinforcement learning algorithms—have been validated as methods that are effective for multi-energy system optimization [3,4].
PV resources depend on atmospheric conditions, and it can sometimes become challenging to provide a reliable and persistent power supply [5]. This problem can be solved by energy storage. PV resources are supported by the electric power grid, where they can be used individually or be connected to the grid; these are known as hybrid power systems. The most important feature of a hybrid renewable energy resource is the use of many non-conventional energy sources to improve system efficiency and economic constraints [6]. PV resources require the constant development of methodological proposals to find solutions to size units and optimize hybrid energy systems. Variations in PV production are not generally similar to load demand, and a reliability analysis is required to design and operate a hybrid renewable energy system (HRES). Additionally, optimization models of electrical networks [7] and energy efficiency models [8,9,10,11] are required.
Solar energy will lead the energy transition until 2050 [12]. Ram et al. [12] proposed that more than 65% of global energy generation will come from solar energy, followed by 18% from wind systems, validating that renewable energy allows for a cheap, clean, efficient, and sustainable future to face the energy demand projections. Likewise, the opening of new regulation markets and deployment politics that incentivize new investments in renewable energies has facilitated the increase and positioning of these new technologies, replacing fossil fuel systems [13]. Furthermore, the global weighted-average, whose indicator is the Levelized Cost of Energy (LCOE) of solar PV, has been decreasing continuously over recent years, along with with an increase in the capacity factor, allowing this technology to become more competitive and cheaper [14]. Thus, many studies have been developed to support optimal integration in PV distribution networks, with the estimation of the optimal size for this system being one of the challenges. Carneiro et al. [15] provide a comprehensive review of this issue and set out several methodologies that have been applied in this subject.
Storage devices also play a relevant role in reinforcing the energy generated by renewables. Recent studies consider the topics of thermal safety [16] and the degradation of useful life [17]. Battery optimization reduces random fluctuations, providing uninterrupted power, improving the quality and security of networks, and providing better resource management in peak or deficit hours. This complementary labor means that if the penetration of PV panels increases, then the batteries will also improve, generating more research and investments in this field and improving the efficiency and lifespan of these devices [18]. In this context, many researchers have studied the profitability of including storage devices and enhancing network reliability and efficiency. Many of these studies have been in microgrids and households, considering different geographic locations, environmental conditions, network topologies, and hybrid systems composed of solar PV, wind energy, and diesel generators, among others. The battery’s installed capacity is one of the most important variables to maintaining a beneficial cost–benefit relationship [1]. Therefore, different mathematical and algorithm techniques have been applied to tackle the optimal sizing problem in power systems with a high penetration of PV panels [19,20,21], wind turbines [22,23,24], or hybrid systems [25,26,27,28].
The economic assessments for the aforementioned research use different economic indicators, such as the cost of energy (COE) [29], the net present value (NPV) [30], the internal rate of return (IRR) [31], the annualized cost of the system (ACS) [32], the payback period [33], the annualized capital cost (ACC) [34], the annualized maintenance cost (AMC) [35], the capital expenditure (CAPEX) [36], the operational expenditure (OPEX) [37], and the operation and maintenance (O&M) [38], among others. To estimate these values, the proposed formulations consider annualized variables, such as the energy generated by the resources in one year or the energy dispatched by the battery during the year. Therefore, to minimize system failures, they commonly use the loss of power supply probability (LPSP) [39], which indicates when the load is not met by the renewable resource used. These formulations possess the great advantage of not being heavy in computational terms, and many scenarios can be tackled using this approach [40].

1.1. Related Works

Serageldin et al. [41] carried out an economic study to calculate the payback period for constructing a solar chimney combined with an earth–air heat exchanger. Finally, the simple payback period was 5.4 years, and the discounted payback period was 6.8 years. Schopfer et al. [42] studied the sensibility of profitability for different electricity load profiles for a photovoltaic battery (PVB) system, which is optimized using a simulation model. Ramli et al. [43] used a multi-objective optimization approach to obtain the optimal size for a hybrid system composed of diesel/PV and wind energy tested in different case studies for households, analyzing the LPSP and COE. Lima and Feijão [44] proposed a mixed-integer linear programming (MILP) stochastic model for designing an integrated PV system with battery energy storage using generation and consumption scenarios under a time-of-use tariff model applied in Brazil. For the model’s economic viability, comparisons were made with the different rate values of other public services using IRR [45]. Han et al. [46] presented a static investment model to analyze the economic viability of a PVB system for different groups of residential customers in Switzerland, grouped according to their annual electricity consumption. The results showed that the investment in PVB systems for some customer groups already yields a better NPV [47] than PV alone. In addition, Liu et al. [48] proposed an autonomous PV optimal sizing model for a sprinkler irrigation machine. The PV system is optimized considering the LPSP and life cycle cost (LCC) [49]. The optimal sizing result is verified using the PV power [50], the state-of-charge (SOC) [51], and the charging power. Sun et al. [52] carried out the design of a hybrid PV-biowaste-fuel cell system considering the economic indices (total net present cost (TNPC) [53], LPSP) and technical indices (whale optimization algorithm [54]). The results showed that the hybrid system was optimal with a minimum TNPC and better indices. Zhang et al. [55] proposed an organic PV system that efficiently converts indoor light into electricity. This work, motivated by the internet of things, evaluated the performance and operation of a wireless sensor network with organic PV for building an information management system. The energy efficiency model was evaluated through LPSP. The organic PV module showed remarkable stability during the measurement campaign, demonstrating that it could be an excellent market opportunity for this solar technology in the future. Furthermore, Farh et al. [56] studied the design of an off-grid HRES system containing a diesel generator-PV-wind turbine and batteries as a storage system. The authors propose the optimization of the dimensioning by maximizing DHW in an acceptable reliability limit, taken as LPSP. Sens et al. [36] project the CAPEX economic indicator of photovoltaic plants—onshore and offshore wind turbines for 2030–2050—using the experience curve theory for the main cost contributors of each technology. Subsequently, the projected CAPEX is compared with other projections in the literature. Dong et al. [57] proposed the use of a sparrow search algorithm to solve a storage capacity optimization configuration model in a wind-PV-diesel system. This multi-objective model was designed to minimize the cost and losses of the microgrid, guaranteeing the energy supply rate. In this paper, the power deviation ratio (PDR) was used to express the power supply reliability of the hybrid system, which is composed of two parts: the power wastage ratio (EWR) [58] and LPSP. Adefarati and Bansal [35] proposed a model with different scenarios to evaluate a hybrid battery system in a radial distribution network. The model minimizes and considers the previous economic indicators and applies a Markov model to include the stochastic behavior of the renewable resources in the formulation. Torres-Madroñero et al. [59] justified the use of HRES in the Colombian context. For the dimensioning of HRES, the methods of genetic algorithms and particle swarm optimization (PSO) stand out. The optimization approaches include the LPSP and total annual cost (TAC) [60] or the LCOE [61]. The results obtained show that HRES can supply the energy demand, where the PSO method provides configurations that are adjusted to the considered as electrical demands. Poonia et al. [62] evaluated different designs of agrovoltaic systems using a technical-economic analysis, where IRR was used to evaluate the future performance of the investment compared to other projects of different sizes, or a required reference rate of return. Meanwhile, Xiao et al. [63] proposed an intelligent approach to solving O&M problems through anomaly detection, which is called ensemble learning on a partition interval. The algorithm obtained good results with the real data set and in the O&M scenarios.

1.2. Study Problem

In the literature review, the formulation of problems related to the optimal sizing of hybrid systems considers the treatment of variables for a full year. These annual variables are mainly influenced by models that minimize failure indicators and energy costs, creating dependence on the LPSP estimator. To dispense with LPSP, this study addresses the problem of optimal PVB system sizing based on the optimal power flow, considering the electricity demand per hour and not per year and ensuring the right fulfil load requirement at all hours. The problem statement considers the technical and electrical load restrictions to minimize the investment and operating costs. Similarly, the sensitivity of profitability when using the level of irradiation and the topology of the power system is addressed.

1.3. Study Contribution

The main contributions of this article are highlighted as follows:
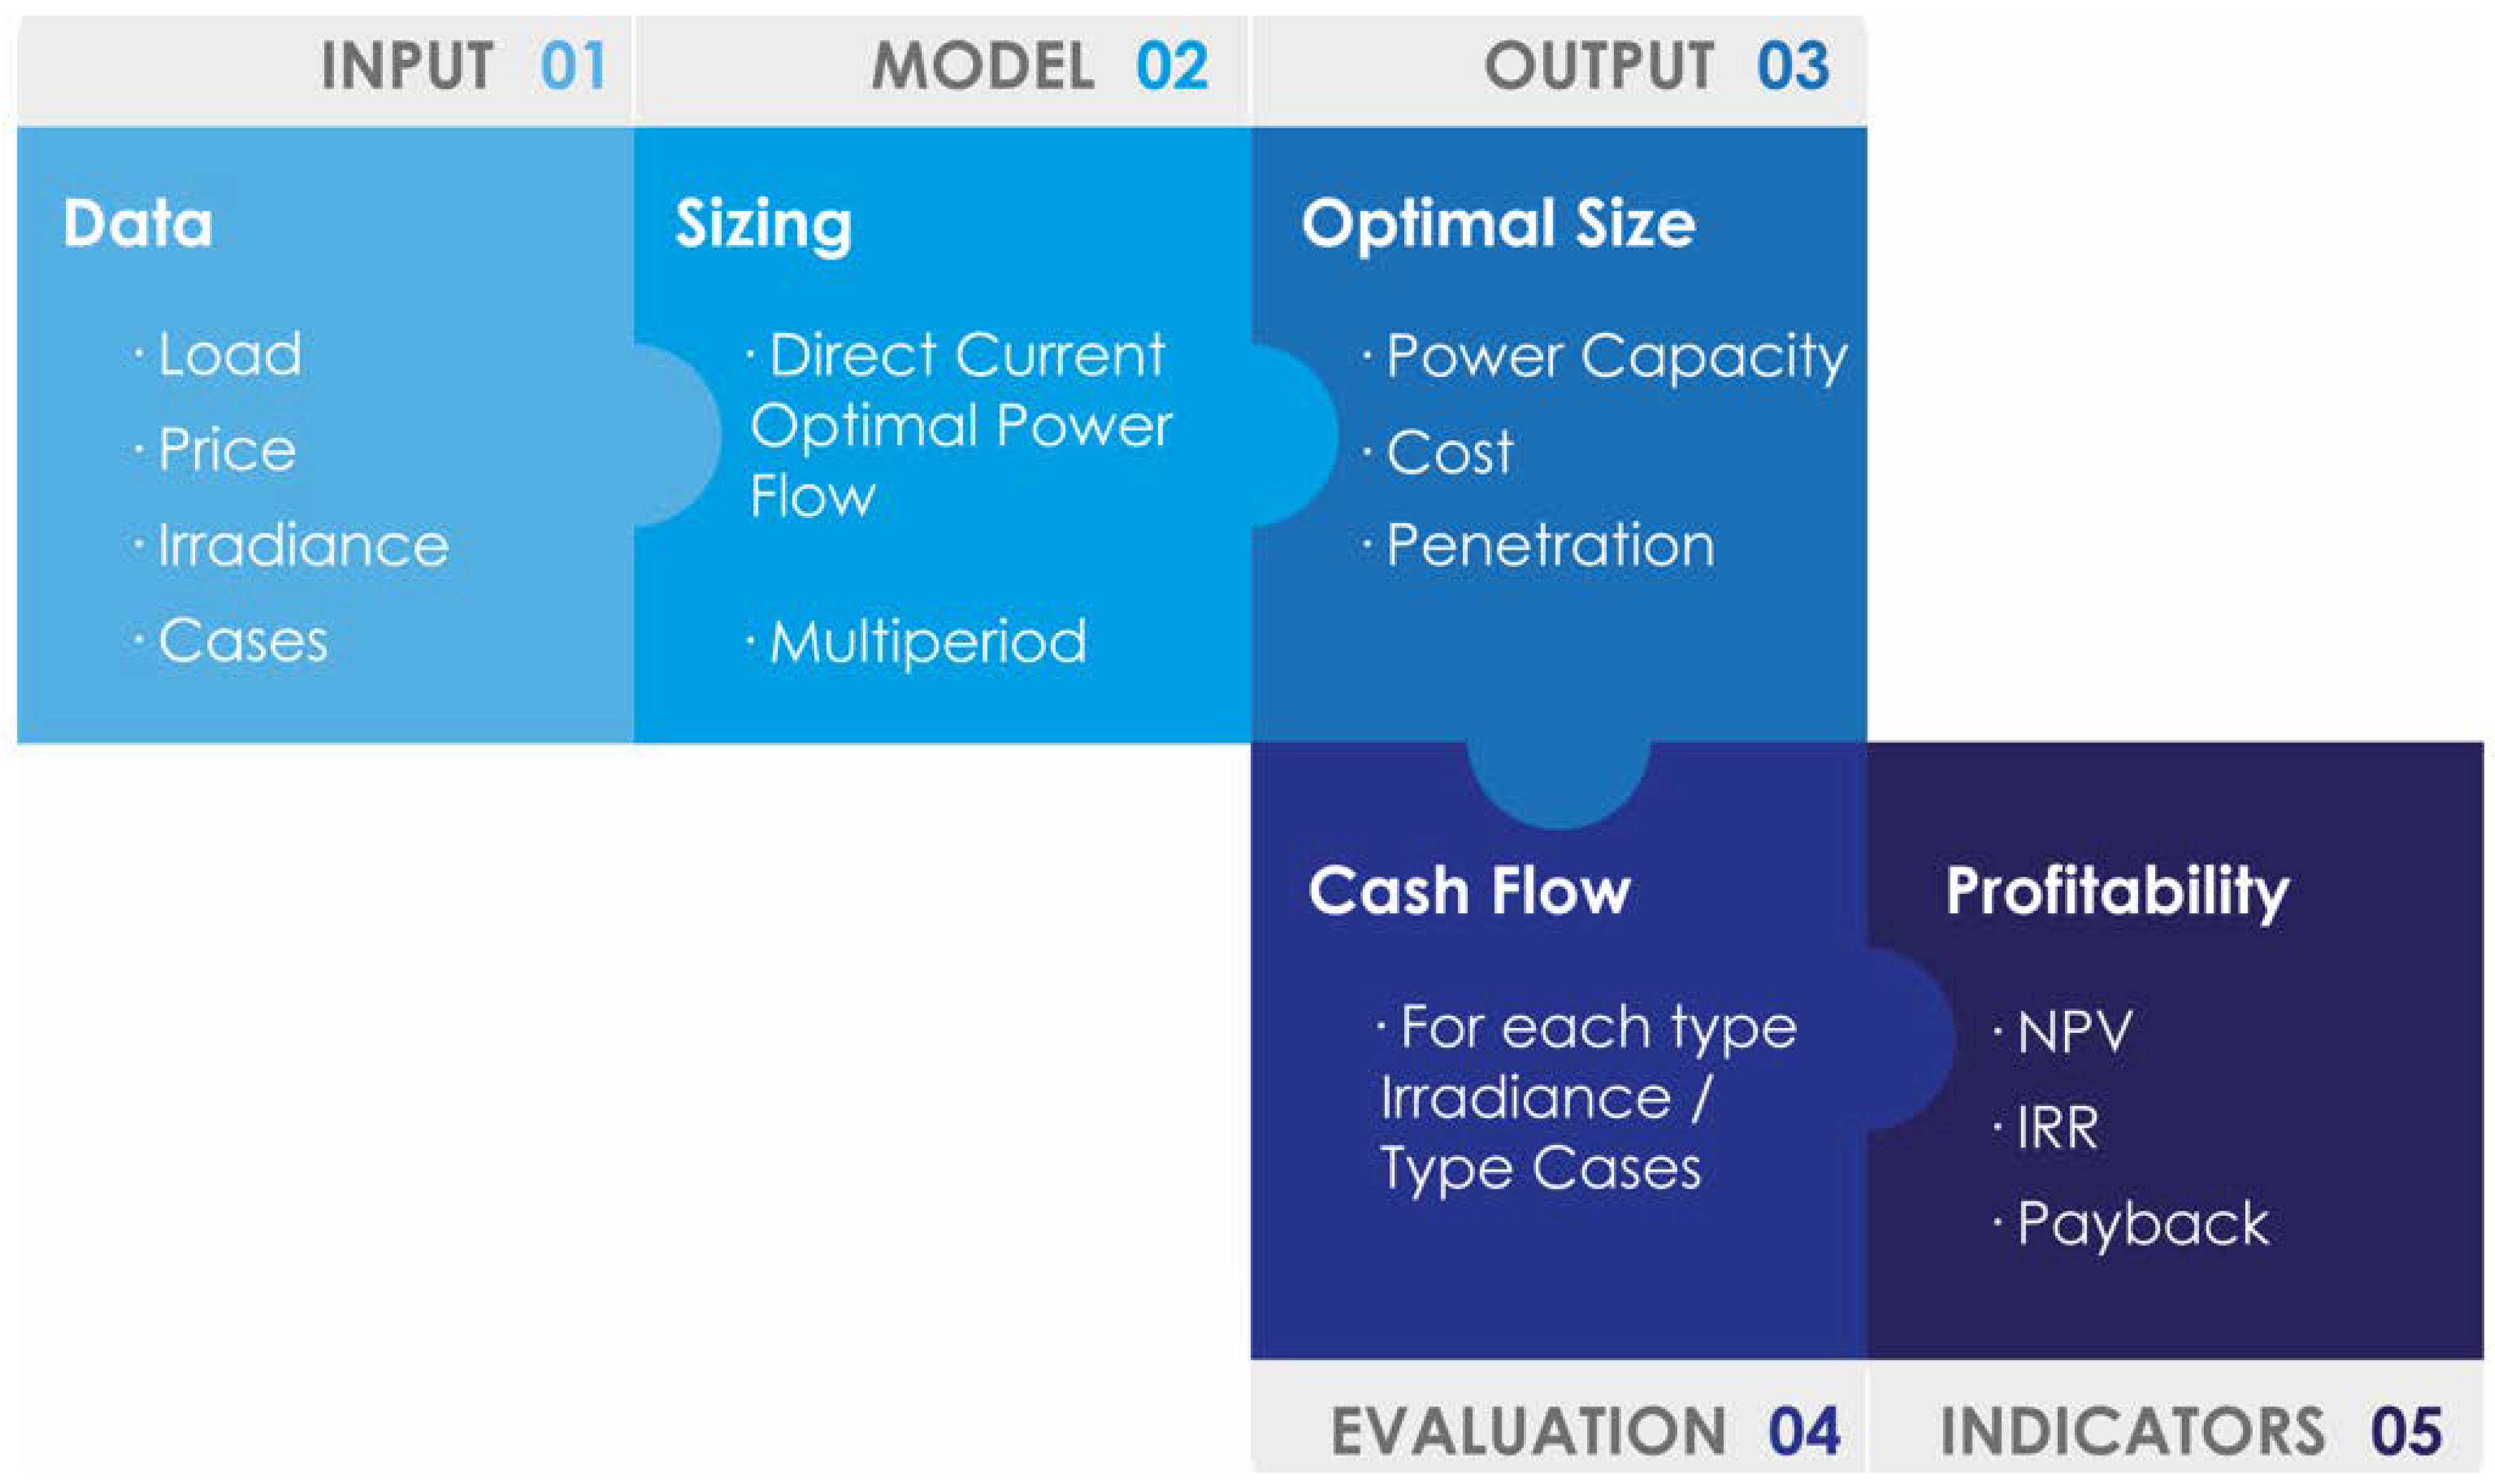
  • A mathematical model for integrating and sizing photovoltaic panels and storage devices in a power system based on a multi-period DC optimal power flow is proposed.
  • The investment variation when the energy demand is satisfied by using three different power systems—PV panels and batteries, PV panels with batteries connected to the grid (GD), and PV panels connected to the utility grid— is shown.
  • The question of how the irradiance level impacts the investment and optimal capacity of the power system is considered.
  • A methodology showing the profitability of integrating renewable energy in the long term, considering technical network constraints, is demonstrated
The rest of the paper is structured as follows. Section 2 presents the mathematical formulation. Section 3 presents the parameters and methodology used in the case study. Section 4 comments on the results obtained. Finally, the conclusions and future research are set out in Section 5.

2. Materials and Methods

The formulation presented in this article is MILP, which is a modified version of the optimal power flow applied in DC networks, extended to multi-period use. The model was programmed in Python version 3.7.4 using CPLEX as a solver and was run on an Intel Core i5-6200U 2.40 GHz processor with 8 GB of memory and a Windows 10 (64 bits) operating system. The software and the processor are located in Barcelona (Spain). The execution time for the 15 cases was between 8–12 min. Likewise, the power flow provided by the proposed model was validated in previous works [64,65], which offer similar deterministic and stochastic approaches applied in different networks. Table 1 summarizes the sets, parameters, and variables of the mathematical model.
The model obtains the optimal size of storage devices and PV panels in a power system, minimizing the investment and the operational and maintenance (O&M) costs, as shown in Equation (1).
M i n   F = I n v T o t a l + C O T o t a l
where:
I n v T o t a l   = i         I b t + B C a p i   C B c a p + I g n + P G a p i   C P G c a p
C O T o t a l = i     t     T ( O M B i   ( P B D i , t   φ ) + O M G i   P G i , t   Δ t )  
Equation (2) considers a variable cost associated with the battery and PV panel capacity, along with a fixed cost which represents the power electronic installed in each bus on the GD. The O&M cost is estimated in Equation (3). The energy cost injected into the GD is the energy from the battery multiplied by its efficiency factor and the energy cost of the PV panels. These cost ratios represent the O&M cost for each case (k€/MW).
The formulation constraints are divided into three groups: the power flow equations, the limits capacity, and the battery’s behavior. Thus, Equations (4) and (5) correspond to the active nodal and line power flow equations, respectively, such that i     ,   t     T .
( i , j )     P i , j , t = P G i , t P L i , t + ( P B D i , t P B C i , t ) ,
and ( i , j )   ,   t     T .
( θ i , t θ j , t ) x i , j , t = P i , j , t
In Equation (4), the left side shows the active power that comes from all the lines that converge to the node—which must be equal to the power injected from the PV panel and the battery—minus the load and the power used to charge the storage device. In Equation (5), as the branch’s resistance is ignored and the angle difference on the end of the branch is neglected, the equation becomes a simplified version that represents the line power through the angle difference divided by the reactance.
Constraints (6)–(8) correspond to the second group of limits equations; therefore, i     ,   t     T .
P G C a p i   P G t m i n P G i , t P G C a p i P G t m a x
The power generated on the buses is bound by the total capacity of the PV system multiplied by its temporality, i.e., a solar panel generates energy as a function of the irradiance level, which depends on the hour or the day. Therefore, the maximum and minimum power will be zero during the night in both cases. However, for approximately 13 h, the minimum power will remain at zero, but the maximum power will differ depending on the irradiance level. Therefore, the power generated is a function of the installed capacity and the time of day.
P G C a p i P G C a p m a x   i    
S i , j m a x P i , j , t   S i , j m a x   ( i , j )     ,   t     T
In Constraint (7), the capacity of the PV system is bound by a fixed maximum, and constraint (8) limits the power on the lines through the apparent power.
The behavior of the batteries connected to the GD is modelled by Equation (9) and Constraints (10)–(13); therefore, i     ,   t     T .
S O C i , t + 1 = S O C i , t + [ φ P B C i , t 1 φ   P B D i , t ] Δ t
B C a p i   S O C m i n S O C i , t   S O C m a x   B C a p i
B C a p i   B C a p m a x
Δ t   P B C i , t M w i , t
Δ t   P B D i , t M ( 1 w i , t )
The SOC is formulated in Equation (9) and depends on the previous state plus the energy absorbed or injected into the GD multiplied or divided by its efficiency factor. Likewise, in Constraint (10), the SOC is bound by the battery capacity multiplied by the maximum and minimum operational ranges, which the manufacturer establishes. Constraint (11) shows that the battery capacity is limited by an allowed maximum. Constraints (11) and (12) indicate when the battery is charging or discharging through a binary variable w i , t that is introduced together with a big M.
The model described above considers that each bus possesses a previously installed battery and PV system, where the unknown factor is their capacities. However, the formulation does not consider the voltage allowed in the nodes or lines and neglects the reactive power, which are important variables in estimating the system’s quality. The energy price from the GD and the load per hour are the fixed parameters in the model. The maximum and minimum power generated by the PV systems per hour are variable parameters expressed by a percentage and estimated using the irradiance and by keeping the ambient temperature constant using the following formulation [66,67].
P p v = N   F F   V t   I t
F F = V m p p     I m p p V o c     I s c
V t = V o c K v   T c , t
I t = I r r   ( I s c + K i     ( T c , t 25 ) )
T c , t = T A + I r r ( N o t 20 0.8 )
Equation (14) is the PV system’s output, which depends on the number of panels, the fill factor, the voltage, and the current at time t. In Equation (15), the fill factor is estimated by dividing the maximum voltage and current by the short-circuit and open-circuit voltage. Equations (16)–(18) compute the voltage, current, and cell temperature, respectively, as a function of the irradiance during a specific time period.
The MILP formulated in this section computes the PV and battery systems’ capacity to supply the entire electricity load. However, if the system tested considers the power provided by the grid, then Equations (3) and (4) must be rewritten as follows:
C O T o t a l = i     t     T ( O M B i   ( P B D i , t   φ ) + O M G i   P G i , t   Δ t + λ t P G D i , t )  
( i , j )     P i , j , t = P G i , t P L i , t + ( P B D i , t P B C i , t ) + P G D i , t
Naturally, the power provided by the grid is (i) penalized through the energy price in the objective function and (ii) included in the balance constraint (4). Note that the power provided by the grid is modeled through the consumption point and not through a static generator or the slack bus.

3. Results

This case study uses a modified version of the IEEE 14-bus system and extends it to one year, i.e., 8760 h. Specifically, since the proposed model is based on the DC OPF, it does not include the reactive power, and the power provided by the grid is modeled through the consumption point and not from the traditional generators or the substation. The reactive power and the power supplied by the generators of the original system have not been considered in order to focus the analysis only on the active power provided by the PV-Battery systems. In this regard, the mathematical formulation obtains the optimal size of the PV systems and the batteries considering three different scenarios. The first scenario involves a load that is satisfied by a system composed only of PV panels and batteries. The second scenario is similar to the previous one but is supported by access to the GD, i.e., the system considers PV panels, batteries, and the GD. In the last scenario, batteries are not included, and the load is achieved only by the GD and solar panels, as observed in Figure 1. It is worth noting that, for scenarios two and three, where the system is supported by the energy provided from the grid, Equations (3) and (4) are replaced by Equations (19) and (20), respectively. Thus, a tradeoff occurs between the energy purchased from the grid and the installed capacity of the PVB system.
Furthermore, the impact of irradiance on the investment cost is studied considering five locations. Therefore, the model is executed for three scenarios, each for five locations, producing fifteen different cases. Due to the computational burden, the model must only be run for one year; hence, the investment and O&M parameters used are considered as one year of their lifespan.
The location for the irradiances was chosen as a function of their intensity [68], and the electricity price provided by the GD was obtained from [69]. Thus, Figure 2 shows the average per month of the five different regions, where the maximum irradiance is the region of Calama in the north of Chile, followed by San Angelo in Texas, Sevilla and Lugo in Spain, and, finally, Amiens in France. Likewise, Figure 3 shows the average 24 h load per season, which is constant for scenarios such as the energy price.
The economic indicators such as NPV, IRR, and Payback are estimated using the CAPEX and the annual OPEX provided by the proposed model. Thus, the cash flow is built to calculate the previous indicators, extending the OPEX to ten years and considering an electricity load projection for ten years and a discount rate of 12%. However, the case study only considers the savings generated by the three scenarios regarding a base case for cash flow. This base is a situation where the load is 100% supplied by the utility grid; therefore, since it does not involve revenues, taxes are not included, and the depreciation concept is not relevant for the annual flow. However, this concept is relevant for the NPV, and it must be added in the last period through the book value concept since the lifespan of the PV panels is more than 10 years.
Figure 4 represents a process summary of the study cases. The input data are defined as the first step, followed by the mathematical formulation, whose output then allows the optimal size of the PV panel and battery to be calculated for each case. Then, the output is used to build an economic evaluation for 10 years and obtain the NPV, IRR, and payback period.

4. Discussion

The following three tables show the model output for the three scenarios regarding the irradiance level, sorted top-down, i.e., from the highest irradiance to the lowest. Table 2 shows the average irradiance for each location, the capacity of the PV system and battery, the demand percentage supplied by the system, and the total investment. We observed that the capacity and investment rise when the irradiance decreases. This trend occurs in the following two scenarios as well. Therefore, for these case studies, the irradiance level is inversely proportional to the installed capacity and the total investment.
Unlike the first scenario, Table 3 and Table 4 set out that the percentage supplied by the system decreases when the irradiance also decreases. The percentage is an output of the model, which indicates that the optimal combination in a scenario with PV panels, batteries, and the DG connected to the GD is 89% supplied by the PV panels and batteries and 11% from the GD when the annual irradiance average is 3.22 [ kW / m 2 ]. Table 4 contains the results for the third scenario, where the batteries are not included. The PV panels with the highest irradiance level provide only 50% of the load. Thus, it is easy to observe the high impact that the absence of a battery induces in a network regarding installed capacity and autonomy.
In terms of cost, the best scenario is the second one, when the system consisting of PV panels and batteries supports the GD. This connection decreases the installed capacity when the irradiance and the battery charge are low, directly impacting the total investment and O&M. For example, when comparing the first location between the first two scenarios, the percentage of the system is 100% and 99%, respectively. However, the total cost is 18,130.6 [k€] and 15,868.6 [k€], which means that when the system is connected to the GD, the system percentage decreases by 1%, but the investment drops by 12.5%, making it more efficient. When performing the same exercise for the last location, the investment required a supply of 100% or 43,024.1 [k€]. However, if the system is connected to the GD, the percentage supplied is 89%, but the investment decreases by 33%, reaching 28,788.7 [k€].
Figure 5 graphically shows how the investment changes as a function of the irradiance. The red line represents the base case where the load is 100% supplied by the utility grid and is constant because the price and load are fixed. The worst scenario is the third one because it uses approximately 50% of the GD, followed by the system with only batteries and PV panels. The blue line is the most efficient system and yields savings of 84% for the location with the highest irradiance and 71% for the location with the lowest irradiance, considering that the annual cost to supply the demand with the GD is 97,932 [k€].
Table 5 and Table 6 show the economic indicators for the highest and lowest irradiance for each scenario, respectively. The numbers consider an evaluation horizon of 10 years and a discount rate of 12%, since the PV panels depreciate by half their lifespan and the batteries completely depreciate. The NPV is the difference between the base case with the scenario because no cash flow considers revenues. Furthermore, the system’s payback period with the PV panels and batteries is greater than the system with the PV connected to the GD because the initial investment is higher, producing a lower IRR. However, the savings continue to be higher when batteries are included.
The results related to the savings generated by the systems are aligned with [70], which studies the PV-battery sizing effects on Australian houses without considering the network limitations. Likewise, the effect on the savings produced when the batteries are considered in the system is addressed in [71]. However, the methodology used does not consider the network constraints, which could overestimate its results.
Finally, it is worth mentioning that, in order to measure the irradiance effect on the PVB system profitability, the electricity prices provided by the grid have been considered to be the same for the five different locations. This assumption could seem strong because the electricity price could vary significantly, especially from one continent to another; however, to measure only the irradiance effect, this assumption must be considered in order to avoid distortion in the capacity installed of PVB. Likewise, based on the aforementioned reasons, taxes related to the use of PVB systems (apart from the O&M cost) or costs associated with the feed-in power to the grid from these technologies have not been considered because they vary from one country to another.

5. Conclusions

This study tackled the optimal sizing problem for a PVB system. We used a model based on an optimal power flow to dispense with the estimator LPSP and faced the problem with technical and electricity load constraints to minimize the investment and operational costs. Additionally, we studied the profitability sensitivity when the irradiance level and the topology of the power system are used.
Several case studies have been considered for testing the variation of investment and profitability. Thus, three scenarios and five locations were combined to conclude that systems with PVB that are connected to the GD could increase the operational savings by around 4.7% and decrease the CAPEX by 45.7% under high irradiance levels compared with a standalone PVB or a PV system connected to the GD. Furthermore, climate conditions directly impact OPEX and IRR, making projects in places with high irradiance levels more feasible in terms of return rate, and this could reduce the payback period between 1.42 and 2.55 years.
The proposed model is simplified with important variables, such as reactive power and voltage, to indicate the network quality. The inclusion of these components greatly increases the model complexity. In future works, the challenge is to provide a more robust model that integrates metaheuristics and techniques to reduce the computational time of the proposed model.

Author Contributions

Conceptualization, M.A. and M.V.; methodology, F.G.-M.; software, G.F.; validation, M.V., G.F. and F.G.-M.; formal analysis, M.A.; investigation, F.G.-M.; resources, M.V.; data curation, M.A.; writing—original draft preparation, F.G.-M.; writing—review and editing, G.F.; visualization, M.V.; supervision, M.A. All authors have read and agreed to the published version of the manuscript.

Funding

This research received no external funding.

Data Availability Statement

Not applicable.

Acknowledgments

This research was supported by the DICYT (Scientific and Technological Research Bureau) of the University of Santiago of Chile (USACH) and the Department of Industrial Engineering. This work was supported in part by Fondecyt (Chile) Grant No. 11200993 (MV).

Conflicts of Interest

The authors declare that there is no conflict of interest regarding the publication of this paper.

Abbreviations

PVPhotovoltaic
GDGrid
COECost of energy
NPVNet present value
IRRInternal rate of return
ACCAnnualized cost of the system
O&MOperation and maintenance
PVBPhotovoltaic battery
SOCState-of-charge
PSOParticle swarm optimization
TACTotal annual cost
EWREnergy wastage rate
DHWDomestic hot water
TNPCTotal net present cost
HRESHybrid renewable energy system
LPSPLoss of power supply probability
MILPMixed integer linear programming
LCOELevelized cost of energy
OPEXOperational expenditure
CAPEXCapital expenditure

References

  1. Khan, F.A.; Pal, N.; Saeed, S.H. Review of solar photovoltaic and wind hybrid energy systems for sizing strategies optimization techniques and cost analysis methodologies. Renew. Sustain. Energy Rev. 2018, 92, 937–947. [Google Scholar] [CrossRef]
  2. Lowe, R.J.; Drummond, P. Solar, wind and logistic substitution in global energy supply to 2050—Barriers and implications. Renew. Sustain. Energy Rev. 2022, 153, 111720. [Google Scholar] [CrossRef]
  3. Wei, Z.; Quan, Z.; Wu, J.; Li, Y.; Pou, J.; Zhong, H. Deep deterministic policy gradient-DRL enabled multiphysics-constrained fast charging of Lithium-Ion battery. IEEE Trans. Ind. Electron. 2022, 69, 2588–2598. [Google Scholar] [CrossRef]
  4. Wu, J.; Wei, Z.; Liu, K.; Quan, Z.; Li, Y. Battery-involved energy management for hybrid electric bus based on expert-assistance deep deterministic policy gradient algorithm. IEEE Trans. Veh. Technol. 2020, 69, 12786–12796. [Google Scholar] [CrossRef]
  5. Li, H.; Ren, Z.; Fan, M.; Li, W.; Xu, Y.; Jiang, Y.; Xia, W. A review of scenario analysis methods in planning and operation of modern power systems: Methodologies, applications, and challenges. Electr. Power Syst. Res. 2022, 205, 107722. [Google Scholar] [CrossRef]
  6. Mahesh, A.; Sandhu, K.S. Hybrid wind/photovoltaic energy system developments: Critical review and findings. Renew. Sustain. Energy Rev. 2015, 52, 1135–1147. [Google Scholar] [CrossRef]
  7. Sabattin, J.; Fuertes, G.; Alfaro, M.; Quezada, L.; Vargas, M. Optimization of large electric power distribution using a parallel genetic algorithm with dandelion strategy. Turk. J. Electr. Eng. Comput. Sci. 2018, 26, 1–13. [Google Scholar] [CrossRef]
  8. Lagos, C.; Carrasco, R.; Fuertes, G.; Gutiérrez, S.; Soto, I.; Vargas, M. Big data on decision making in energetic management of copper mining. Int. J. Comput. Commun. Control 2017, 12, 61–75. [Google Scholar] [CrossRef] [Green Version]
  9. Lagos, C.; Gutierrez, S.; Cordova, F.; Fuertes, G.; Carrasco, R. Data analysis methods related to energetic consumption in copper mining—A test case in Chile. In Proceedings of the IEEE International Conference on Computers Communications and Control, Oradea, Romania, 10–14 May 2016; pp. 244–249. [Google Scholar]
  10. Lagos, C.; Fuertes, G.; Carrasco, R.; Gutierrez, S.; Vargas, M.; Rodrigues, R. Facing the data analysis complexity for the energetic efficiency management at great copper mining, in Codelco Chuquicamata, Chile. In Proceedings of the IEEE International Conference on Automatica, Curico, Chile, 19–21 October 2016. [Google Scholar]
  11. Lagos, C.; Carrasco, R.; Soto, I.; Fuertes, G.; Alfaro, M.; Vargas, M. Predictive analysis of energy consumption in minining for making decisions. In Proceedings of the IEEE International Conference on Computers Communications and Control, Oradea, Romania, 8–12 May 2018; pp. 270–275. [Google Scholar]
  12. Ram, M.; Osorio-Aravena, J.C.; Aghahosseini, A.; Bogdanov, D.; Breyer, C. Job creation during a climate compliant global energy transition across the power, heat, transport, and desalination sectors by 2050. Energy 2022, 238, 121690. [Google Scholar] [CrossRef]
  13. Ram, M.; Bogdanov, D.; Aghahosseini, A.; Gulagi, A.; Oyewo, A.S.; Odai Mensah, T.N.; Child, M.; Caldera, U.; Sadovskaia, K.; Barbosa, L.D.S.N.S.; et al. Global energy transition to 100% renewables by 2050: Not fiction, but much needed impetus for developing economies to leapfrog into a sustainable future. Energy 2022, 246, 123419. [Google Scholar] [CrossRef]
  14. Le, H.T.T.; Sanseverino, E.R.; Nguyen, D.Q.; Di Silvestre, M.L.; Favuzza, S.; Pham, M.H. Critical assessment of feed-in tariffs and solar photovoltaic development in Vietnam. Energies 2022, 15, 556. [Google Scholar] [CrossRef]
  15. Carneiro, T.C.; de Carvalho, P.C.M.; Alves dos Santos, H.; Lima, M.A.F.B.; Braga, A.P.d.S. Review on photovoltaic power and solar resource forecasting: Current status and trends. J. Sol. Energy Eng. 2022, 144, 010801. [Google Scholar] [CrossRef]
  16. Wu, J.; Wei, Z.; Li, W.; Wang, Y.; Li, Y.; Sauer, D.U. Battery thermal-and health-constrained energy management for hybrid electric bus based on soft actor-critic DRL algorithm. IEEE Trans. Ind. Inform. 2021, 17, 3751–3761. [Google Scholar] [CrossRef]
  17. Chen, C.; Wei, Z.; Knoll, A.C. Charging optimization for Li-ion battery in electric vehicles: A review. IEEE Trans. Transp. Electrif. 2021, 1–23. [Google Scholar] [CrossRef]
  18. Ralon, P.; Taylor, M.; Ilas, A.; Diaz-Bone, H.; Kairies, K.-P. Electricity Storage and Renewables: Costs and Markets to 2030; IRENA: Abu Dhabi, United Arab Emirates, 2017; ISBN 9789292600389. [Google Scholar]
  19. Henao, M.; Espinosa Oviedo, M.; Bidding, J.J.; Henao, M.M.; José, J.; Oviedo, E. Bidding strategy for VPP and economic feasibility study of the optimal sizing of storage systems to face the uncertainty of solar generation modelled with IGDT. Energies 2022, 15, 953. [Google Scholar] [CrossRef]
  20. Fachrizal, R.; Shepero, M.; Åberg, M.; Munkhammar, J. Optimal PV-EV sizing at solar powered workplace charging stations with smart charging schemes considering self-consumption and self-sufficiency balance. Appl. Energy 2022, 307, 118139. [Google Scholar] [CrossRef]
  21. Talent, O.; Du, H. Optimal sizing and energy scheduling of photovoltaic-battery systems under different tariff structures. Renew. Energy 2018, 129, 513–526. [Google Scholar] [CrossRef]
  22. Molina Gómez, A.; Morozovska, K.; Laneryd, T.; Hilber, P. Optimal sizing of the wind farm and wind farm transformer using MILP and dynamic transformer rating. Int. J. Electr. Power Energy Syst. 2022, 136, 107645. [Google Scholar] [CrossRef]
  23. Kayal, P.; Chanda, C.K. Placement of wind and solar based DGs in distribution system for power loss minimization and voltage stability improvement. Int. J. Electr. Power Energy Syst. 2013, 53, 795–809. [Google Scholar] [CrossRef]
  24. Khosravi, M.; Afsharnia, S.; Farhangi, S. Optimal sizing and technology selection of hybrid energy storage system with novel dispatching power for wind power integration. Int. J. Electr. Power Energy Syst. 2021, 127, 106660. [Google Scholar] [CrossRef]
  25. Wang, Y.; Rousis, A.O.; Strbac, G. Resilience-driven optimal sizing and pre-positioning of mobile energy storage systems in decentralized networked microgrids. Appl. Energy 2022, 305, 117921. [Google Scholar] [CrossRef]
  26. Fares, D.; Fathi, M.; Mekhilef, S. Performance evaluation of metaheuristic techniques for optimal sizing of a stand-alone hybrid PV/wind/battery system. Appl. Energy 2022, 305, 117823. [Google Scholar] [CrossRef]
  27. Emrani, A.; Berrada, A.; Bakhouya, M. Optimal sizing and deployment of gravity energy storage system in hybrid PV-Wind power plant. Renew. Energy 2022, 183, 12–27. [Google Scholar] [CrossRef]
  28. Cao, Y.; Taslimi, M.S.; Dastjerdi, S.M.; Ahmadi, P.; Ashjaee, M. Design, dynamic simulation, and optimal size selection of a hybrid solar/wind and battery-based system for off-grid energy supply. Renew. Energy 2022, 187, 1082–1099. [Google Scholar] [CrossRef]
  29. Yadav, A.K.; Malik, H.; Chandel, S.S.; Khan, I.A.; Al Otaibi, S.; Alkhammash, H.I. Novel approach to investigate the influence of optimum tilt angle on minimum cost of energy-based maximum power generation and sizing of PV systems: A case study of diverse climatic zones in India. IEEE Access 2021, 9, 110103–110115. [Google Scholar] [CrossRef]
  30. Balsalobre-Lorente, D.; Shahzad, U.; Rehman, A.; Radulescu, M.; Dobrowolski, Z.; Drozdowski, G. Does the net present value as a financial metric fit investment in green energy security? Energies 2022, 15, 353. [Google Scholar] [CrossRef]
  31. Szafranko, E. Assessment of the economic efficiency of energy-saving projects, methodology based on simple and compound methods. Energy Sci. Eng. 2022, 10, 423–438. [Google Scholar] [CrossRef]
  32. Ould Bilal, B.; Sambou, V.; Ndiaye, P.A.; Kébé, C.M.F.; Ndongo, M. Optimal design of a hybrid solar–wind-battery system using the minimization of the annualized cost system and the minimization of the loss of power supply probability (LPSP). Renew. Energy 2010, 35, 2388–2390. [Google Scholar] [CrossRef]
  33. Wong, I.L.; Eames, P.C.; Perera, R.S. A review of transparent insulation systems and the evaluation of payback period for building applications. Sol. Energy 2007, 81, 1058–1071. [Google Scholar] [CrossRef]
  34. Yazdanpanah, M.A. Modeling and sizing optimization of hybrid photovoltaic/wind power generation system. J. Ind. Eng. Int. 2014, 10, 49. [Google Scholar] [CrossRef] [Green Version]
  35. Adefarati, T.; Bansal, R.C. Reliability and economic assessment of a microgrid power system with the integration of renewable energy resources. Appl. Energy 2017, 206, 911–933. [Google Scholar] [CrossRef]
  36. Sens, L.; Neuling, U.; Kaltschmitt, M. Capital expenditure and levelized cost of electricity of photovoltaic plants and wind turbines—Development by 2050. Renew. Energy 2022, 185, 525–537. [Google Scholar] [CrossRef]
  37. Rady, M.; Georges, J.P.; Lepage, F. Can energy optimization lead to economic and environmental waste in LPWAN architectures? ETRI J. 2021, 43, 173–183. [Google Scholar] [CrossRef]
  38. Rediske, G.; Michels, L.; Siluk, J.C.M.; Rigo, P.D.; Rosa, C.B.; Bortolini, R.J.F. Management of operation and maintenance practices in photovoltaic plants: Key performance indicators. Int. J. Energy Res. 2022, 46, 7118–7136. [Google Scholar] [CrossRef]
  39. Semaoui, S.; Hadj Arab, A.; Bacha, S.; Azoui, B. The new strategy of energy management for a photovoltaic system without extra intended for remote-housing. Sol. Energy 2013, 94, 71–85. [Google Scholar] [CrossRef]
  40. Sadeghi, D.; Amiri, N.; Marzband, M.; Abusorrah, A.; Sedraoui, K. Optimal sizing of hybrid renewable energy systems by considering power sharing and electric vehicles. Int. J. Energy Res. 2022, 46, 8288–8312. [Google Scholar] [CrossRef]
  41. Serageldin, A.A.; Abdeen, A.; Ahmed, M.M.S.; Radwan, A.; Shmroukh, A.N.; Ookawara, S. Solar chimney combined with earth to-air heat exchanger for passive cooling of residential buildings in hot areas. Sol. Energy 2020, 206, 145–162. [Google Scholar] [CrossRef]
  42. Schopfer, S.; Tiefenbeck, V.; Staake, T. Economic assessment of photovoltaic battery systems based on household load profiles. Appl. Energy 2018, 223, 229–248. [Google Scholar] [CrossRef]
  43. Ramli, M.A.M.; Bouchekara, H.R.E.H.; Alghamdi, A.S. Optimal sizing of PV/wind/diesel hybrid microgrid system using multi-objective self-adaptive differential evolution algorithm. Renew. Energy 2018, 121, 400–411. [Google Scholar] [CrossRef]
  44. Lima, D.A.; Feijão, V.R. Stochastic approach for economic viability of photovoltaic systems with battery storage for big electricity consumers in the regulated marketin Brazil. Electr. Power Syst. Res. 2022, 205, 107744. [Google Scholar] [CrossRef]
  45. Ebrahimi, M.; Keshavarz, A. CCHP evaluation criteria. Comb. Cool. Heat. Power 2015, 93–102. [Google Scholar] [CrossRef]
  46. Han, X.; Garrison, J.; Hug, G. Techno-economic analysis of PV-battery systems in Switzerland. Renew. Sustain. Energy Rev. 2022, 158, 112028. [Google Scholar] [CrossRef]
  47. Arbab, N.; Grabosky, J.; Leopold, R. Economic assessment of urban ash tree management options in New Jersey. Sustainability 2022, 14, 2172. [Google Scholar] [CrossRef]
  48. Liu, K.; Sun, B.; Gao, X.; Zhang, Y.; Sun, W.; Feng, Q.; Yang, W. Optimal sizing of the stand-alone photovoltaic system for a solar-powered translational sprinkler irrigation machine considering the loss of power supply probability. Math. Probl. Eng. 2022, 2022, 6133969. [Google Scholar] [CrossRef]
  49. Liu, Y.; Zhao, Y.; Chen, Y.; Wang, D.; Li, Y.; Yuan, X. Design optimization of the solar heating system for office buildings based on life cycle cost in Qinghai-Tibet plateau of China. Energy 2022, 246, 123288. [Google Scholar] [CrossRef]
  50. Qiu, T.; Wang, L.; Lu, Y.; Zhang, M.; Qin, W.; Wang, S.; Wang, L. Potential assessment of photovoltaic power generation in China. Renew. Sustain. Energy Rev. 2022, 154, 111900. [Google Scholar] [CrossRef]
  51. Rezaei, O.; Moghaddam, H.A.; Papari, B. A fast sliding-mode-based estimation of state-of-charge for Lithium-ion batteries for electric vehicle applications. J. Energy Storage 2022, 45, 103484. [Google Scholar] [CrossRef]
  52. Sun, H.; Ebadi, A.G.; Toughani, M.; Nowdeh, S.A.; Naderipour, A.; Abdullah, A. Designing framework of hybrid photovoltaic-biowaste energy system with hydrogen storage considering economic and technical indices using whale optimization algorithm. Energy 2022, 238, 121555. [Google Scholar] [CrossRef]
  53. Al-Masri, H.M.K.; Al-Sharqi, A.A.; Magableh, S.K.; Al-Shetwi, A.Q.; Abdolrasol, M.G.M.; Ustun, T.S. Optimal allocation of a hybrid photovoltaic biogas energy system using multi-objective feasibility enhanced particle swarm algorithm. Sustainability 2022, 14, 685. [Google Scholar] [CrossRef]
  54. Medani, K.b.o.; Sayah, S.; Bekrar, A. Whale optimization algorithm based optimal reactive power dispatch: A case study of the Algerian power system. Electr. Power Syst. Res. 2018, 163, 696–705. [Google Scholar] [CrossRef]
  55. Zhang, S.; Bristow, N.; Wyn David, T.; Elliott, F.; O’Mahony, J.; Kettle, J. Development of an organic photovoltaic energy harvesting system for wireless sensor networks; application to autonomous building information management systems and optimisation of OPV module sizes for future applications. Sol. Energy Mater. Sol. Cells 2022, 236, 111550. [Google Scholar] [CrossRef]
  56. Farh, H.M.H.; Al-Shamma’a, A.A.; Al-Shaalan, A.M.; Alkuhayli, A.; Noman, A.M.; Kandil, T. Technical and economic evaluation for off-grid hybrid renewable energy system using novel bonobo optimizer. Sustainability 2022, 14, 1533. [Google Scholar] [CrossRef]
  57. Dong, J.; Dou, Z.; Si, S.; Wang, Z.; Liu, L. Optimization of capacity configuration of wind–solar–diesel–storage using improved sparrow search algorithm. J. Electr. Eng. Technol. 2021, 17, 1–14. [Google Scholar] [CrossRef]
  58. Yuan, X.; Yang, F.; Xu, J.; Liu, H. Configuration optimization of wind-solar-storage system considering demand response. In Proceedings of the IEEE International Conference on Electric Power and Energy Conversion Systems, Kitakyushu, Japan, 23–25 April 2018; pp. 3224–3229. [Google Scholar]
  59. Torres-Madroñero, J.L.; Nieto-Londoño, C.; Sierra-Pérez, J. Hybrid energy systems sizing for the Colombian context: A genetic algorithm and particle swarm optimization Approach. Energies 2020, 13, 5648. [Google Scholar] [CrossRef]
  60. Mahmoudi, S.M.; Maleki, A.; Rezaei Ochbelagh, D. A novel method based on fuzzy logic to evaluate the storage and backup systems in determining the optimal size of a hybrid renewable energy system. J. Energy Storage 2022, 49, 104015. [Google Scholar] [CrossRef]
  61. Sanyal, A.; Kumar Goswami, A.; Kumar Tiwari, P. Risk and cost benchmarking of solar energy technology based on celestial phenomenon for a power market integration. Sustain. Energy Technol. Assess. 2022, 49, 101650. [Google Scholar] [CrossRef]
  62. Poonia, S.; Jat, N.K.; Santra, P.; Singh, A.K.; Jain, D.; Meena, H.M. Techno-economic evaluation of different agri-voltaic designs for the hot arid ecosystem India. Renew. Energy 2022, 184, 149–163. [Google Scholar] [CrossRef]
  63. Xiao, X.; Sun, J.; Yang, J. Operation and maintenance(O&M) for data center: An intelligent anomaly detection approach. Comput. Commun. 2021, 178, 141–152. [Google Scholar] [CrossRef]
  64. García-Muñoz, F.; Díaz-González, F.; Corchero, C. A novel algorithm based on the combination of AC-OPF and GA for the optimal sizing and location of DERs into distribution networks. Sustain. Energy Grids Netw. 2021, 27, 100497. [Google Scholar] [CrossRef]
  65. García-Muñoz, F.; Díaz-González, F.; Corchero, C. A two-stage stochastic programming model for the sizing and location of DERs considering electric vehicles and demand response. Sustain. Energy Grids Netw. 2022, 30, 100624. [Google Scholar] [CrossRef]
  66. Hung, D.Q.; Mithulananthan, N.; Lee, K.Y. Determining PV penetration for distribution systems with time-varying load models. IEEE Trans. Power Syst. 2014, 29, 3048–3057. [Google Scholar] [CrossRef]
  67. Atwa, Y.M.; El-Saadany, E.F.; Salama, M.M.A.; Seethapathy, R. Optimal renewable resources mix for distribution system energy loss minimization. IEEE Trans. Power Syst. 2010, 25, 360–370. [Google Scholar] [CrossRef]
  68. NREL National Renewable Energy Laboratory. Available online: https://www.nrel.gov/ (accessed on 24 February 2022).
  69. OMIE Energy Iberian Market Operator, Anual Spot Market Prices. Available online: https://www.omie.es/ (accessed on 26 May 2022).
  70. Ren, Z.; Grozev, G.; Higgins, A. Modelling impact of PV battery systems on energy consumption and bill savings of Australian houses under alternative tariff structures. Renew. Energy 2016, 89, 317–330. [Google Scholar] [CrossRef]
  71. Weniger, J.; Tjaden, T.; Quaschning, V. Sizing of residential PV battery systems. Energy Procedia 2014, 46, 78–87. [Google Scholar] [CrossRef] [Green Version]
Figure 1. Scenarios. Case 1: PV-Battery standalone system; Case 2: PV-Battery system connected to the grid; Case 3: PV system connected to the grid.
Energies 15 04408 g001
Figure 2. Irradiance for each location.
Energies 15 04408 g002
Figure 3. Average load per season.
Energies 15 04408 g003
Figure 4. Methodological framework.
Energies 15 04408 g004
Figure 5. Costs vs. scenarios.
Energies 15 04408 g005
Table 1. Sets, parameters, and variables.
Sets:
i : Set of buses.
t T : Set of time periods.
( i , j ) : Set of lines, such that  = { ( i , j ) ;   i , j     }
Parameters:
P G i , t m i n   : Minimum active power output of bus i at time t [%].
P G i , t m a x : Maximum active power output of bus i at time t [%].
P L i , t   : Active load of bus i at time t [MW].
S i , j m a x : Allowed maximum line power between buses i and j [MVA].
  S O C m i n : Minimum state of battery charge [%].
  S O C m a x : Maximum state of battery charge [%].
P G C a p m a x : Rated generator power [MW].
  B C a p m a x : Rated battery power [MW].
φ: Battery efficiency [%].
M: Maximum charge/discharge for the battery during a period [MWh].
O M G i : Operational and maintenance cost for the generation of bus i [€k/MW/yr].
O M B i : Operational and maintenance cost for the battery of bus i [€k/MWh].
I b t : Fixed installation cost of storage [€k].
  C B c a p : Variable installation cost of storage in bus i [€k/MWh].
I g n : Fixed installation cost of the generator [€k].
  C P G c a p : Variable installation cost of the generator in bus i [€k/MW].
C O B T : Operational cost of the storage units [€k].
C O G N : Operational cost of generation sources [€k].
λ t : Energy price from the grid [€k].
N : Number of panels.
F F : Fill factor.
T c , t : Cell temperature [°C].
T A : Ambient temperature [°C].
K i : Current temperature coefficient [A/°C].
K v : Voltage temperature coefficient [V/°C].
N o t : Nominal operating temperature [°C].
I r r : Irradiance [MW/ m 2 ].
V o c : Open-circuit voltage [V].
I s c : Short-circuit current [A].
V m p p : Voltage maximum power point [V].
I m p p : Current maximum power point [A].
Variables:
P G i , t : Active generator power of bus i at period t [MW].
P G D i , t : Active power provided by the grid of bus i at period t [MW].
P i , j , t : Active line power between buses i and j at period t [MW].
P B C i , t : Power absorbed for the storage of bus i at period t [MW].
P B D i , t : Power injected for the storage of bus i at period t [MW].
S O C i , t : State of battery charge in bus i at period t [MWh].
P G C a p i : Active power capacity of the generator in bus i [MW].
B C a p i : Storage power capacity of the battery in bus i [MWh].
w i , t : Binary variable: w i t = 1 if the storage charge is at period t ; w i t = 0 otherwise.
Table 2. Summary of total costs—first scenario.
Case 1: PV + BT
Place Irradiance   Index   [ k W / m 2 ] PV   Capacity   [ M W ] Battery   Capacity   [ M W ] System [%]Total Cost [k€]
16.0847.0420.5100%18,130.6
25.9752.5839.91100%23,619.1
35.49103.2828.99100%24,032.0
43.86254.8941.46100%37,171.0
53.22234.3868.68100%43,024.1
Table 3. Summary of total costs—second scenario.
Case 2: PV + BT + GD
Place Irradiance   Index   [ k W / m 2 ] PV   Capacity   [ M W ] Battery   Capacity   [ M W ] System [%]Total Cost [k€]
16.0822.2315.1999%15,868.6
25.9743.2617.6997%18,840.7
35.4951.0718.7297%19,549.6
43.8690.7419.1293%24,979.3
53.22120.9717.789%28,788.7
Table 4. Summary of total costs—third scenario.
Case 3: PV + GD
Place Irradiance   Index   [ k W / m 2 ] PV   Capacity   [ M W ] Battery   Capacity   [ M W ] System [%]Total Cost [k€]
16.0818.63050%62,259.7
25.9738.92050%65,369.9
35.4942.52049%68,136.3
43.8672.59048%70,777.2
53.2276.28045%71,708.5
Table 5. Economic indicators influenced by the irradiation level and system configuration, Calama.
Place 1
IndicatorPV + GDPV + BTPV + BT + GD
ΔNPV234,160.9506,607.6528,437.8
Savings39%85%89%
IRR146%138%250%
Payback period0.690.740.4
Table 6. Economic indicators influenced by the irradiation level and system configuration, Amiens.
Place 5
IndicatorPV + GDPV + BTPV + BT + GD
ΔNPV141,075.0307,224.0392,745.8
Savings24%52%66%
IRR38%31%56%
Payback period2.693.291.82
Publisher’s Note: MDPI stays neutral with regard to jurisdictional claims in published maps and institutional affiliations.

