Optimal Fuzzy-Based Energy Management Strategy to Maximize Self-Consumption of PV Systems in the Residential Sector in Ecuador

 , ,
, ,  , and
, and
Abstract
:1. Introduction
2. Materials and Methods
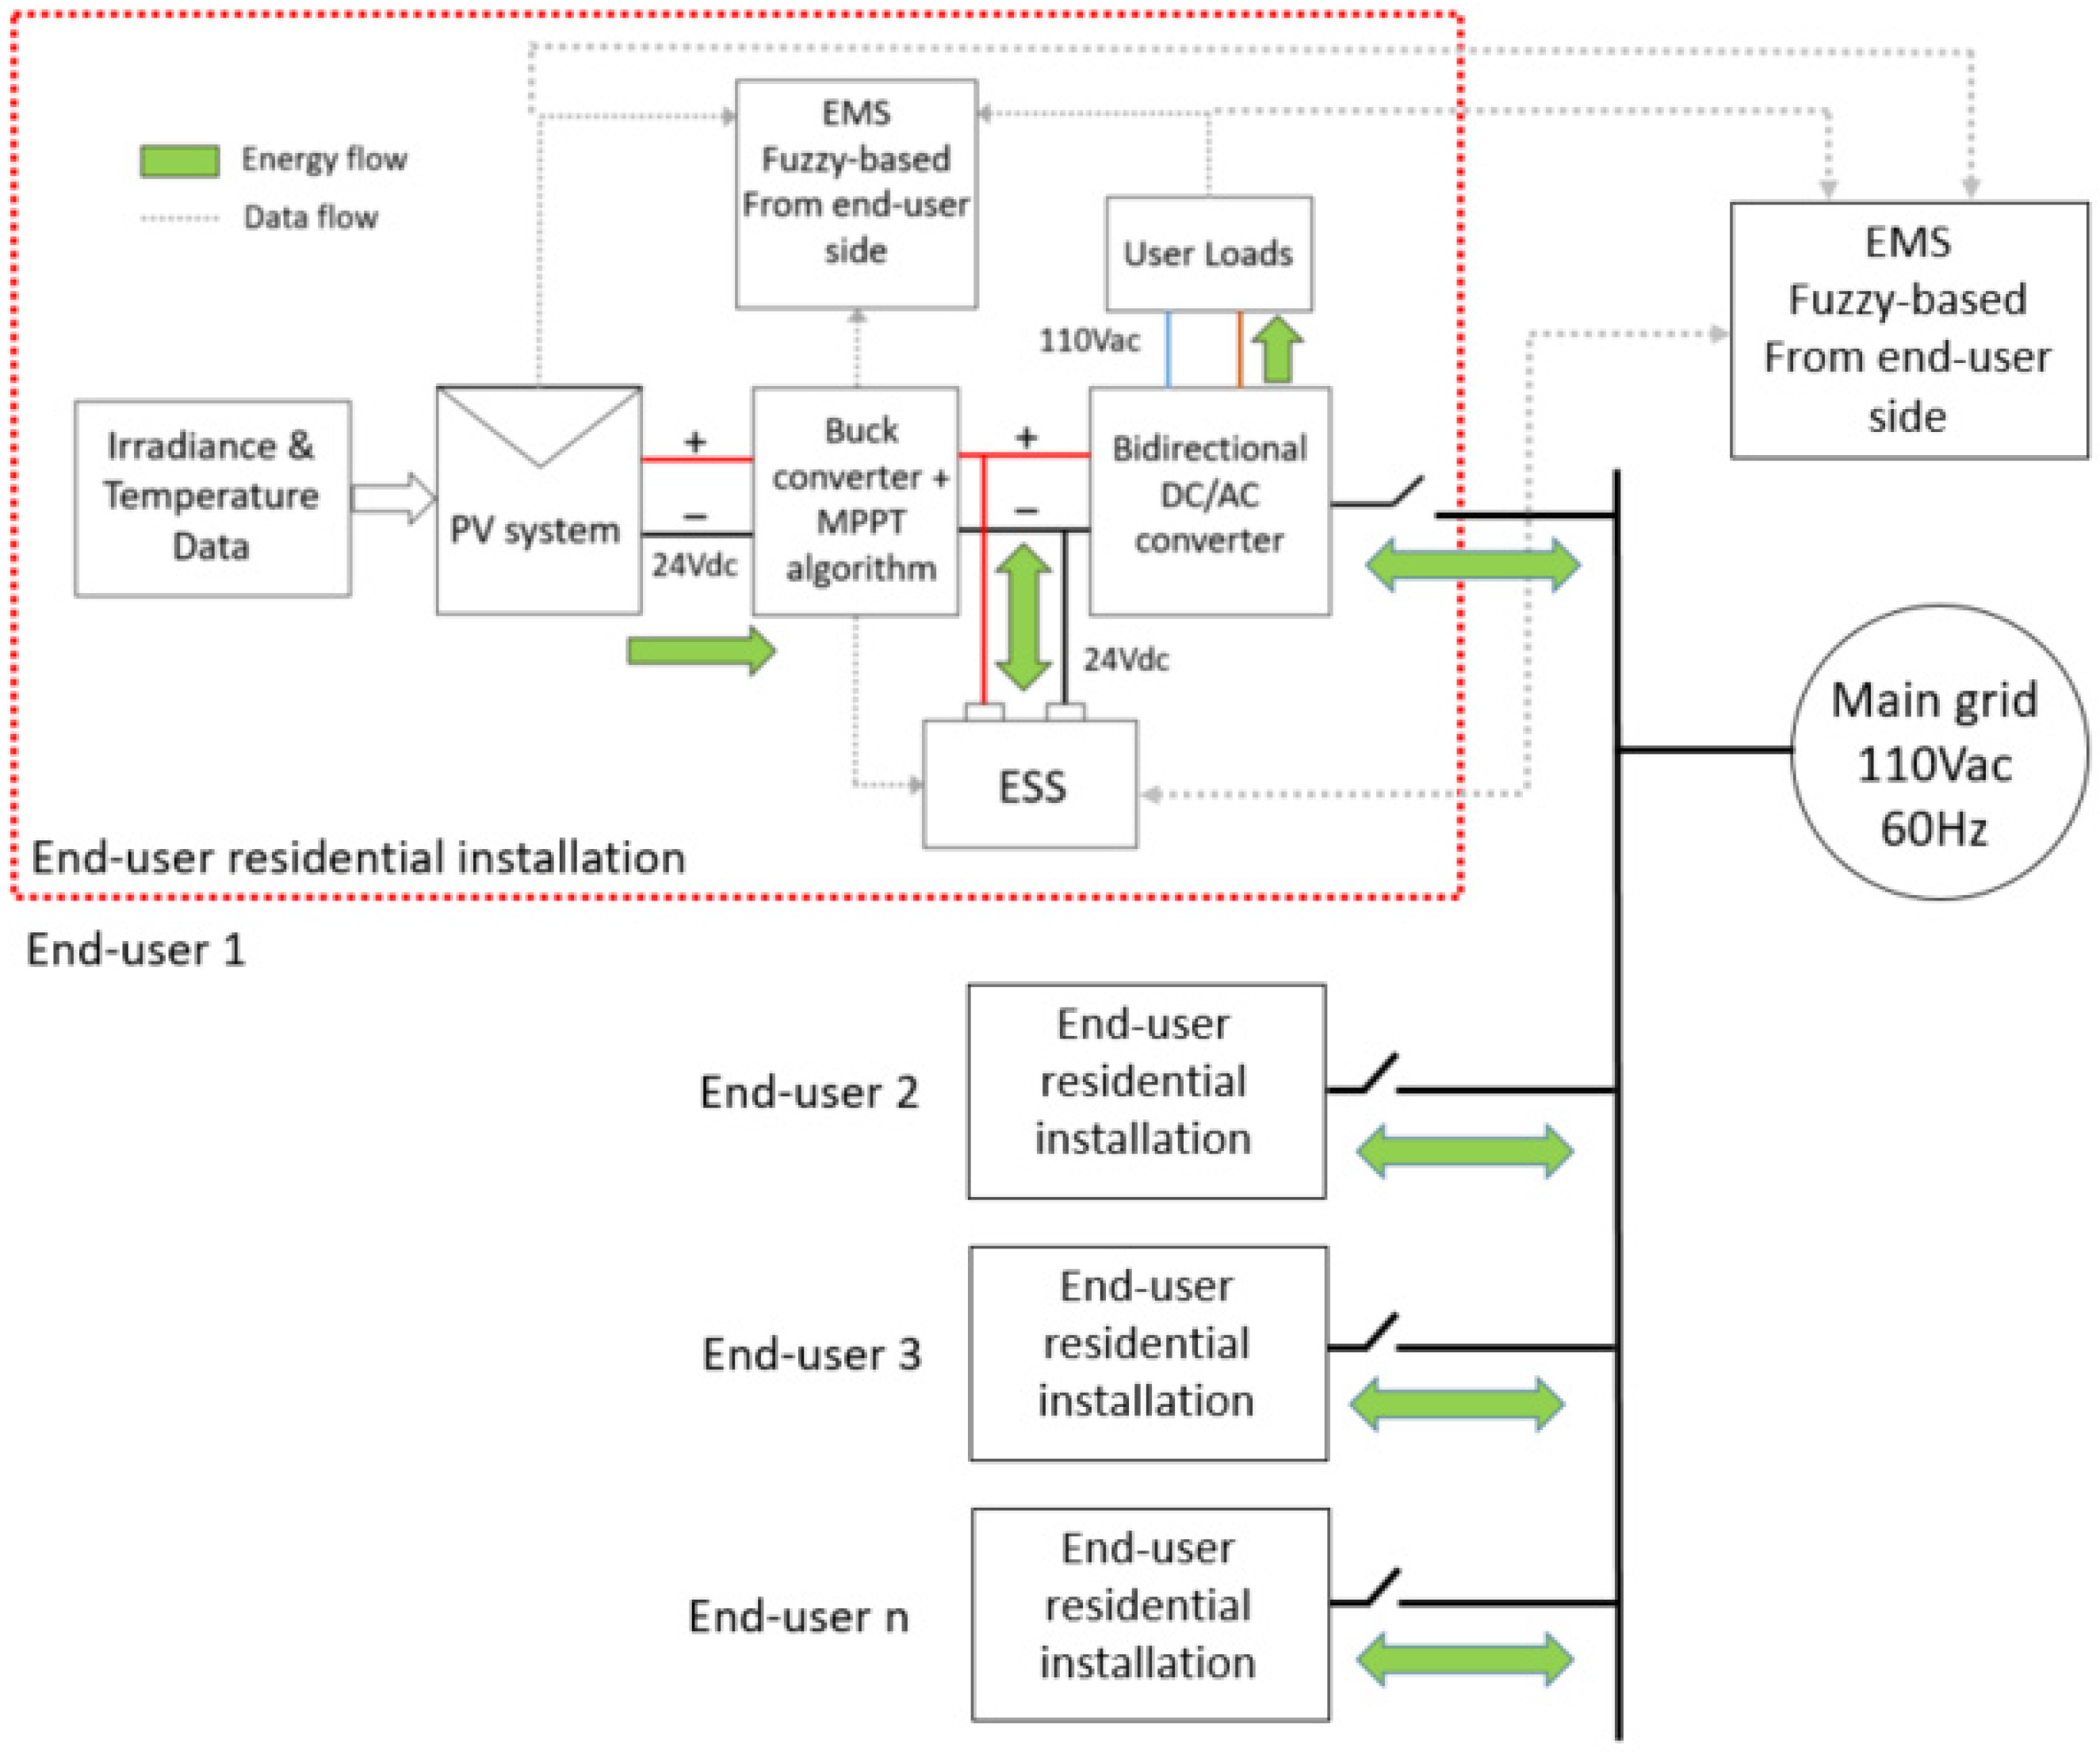
2.1. Grid Modeling
2.1.1. Irradiance and Temperature Data
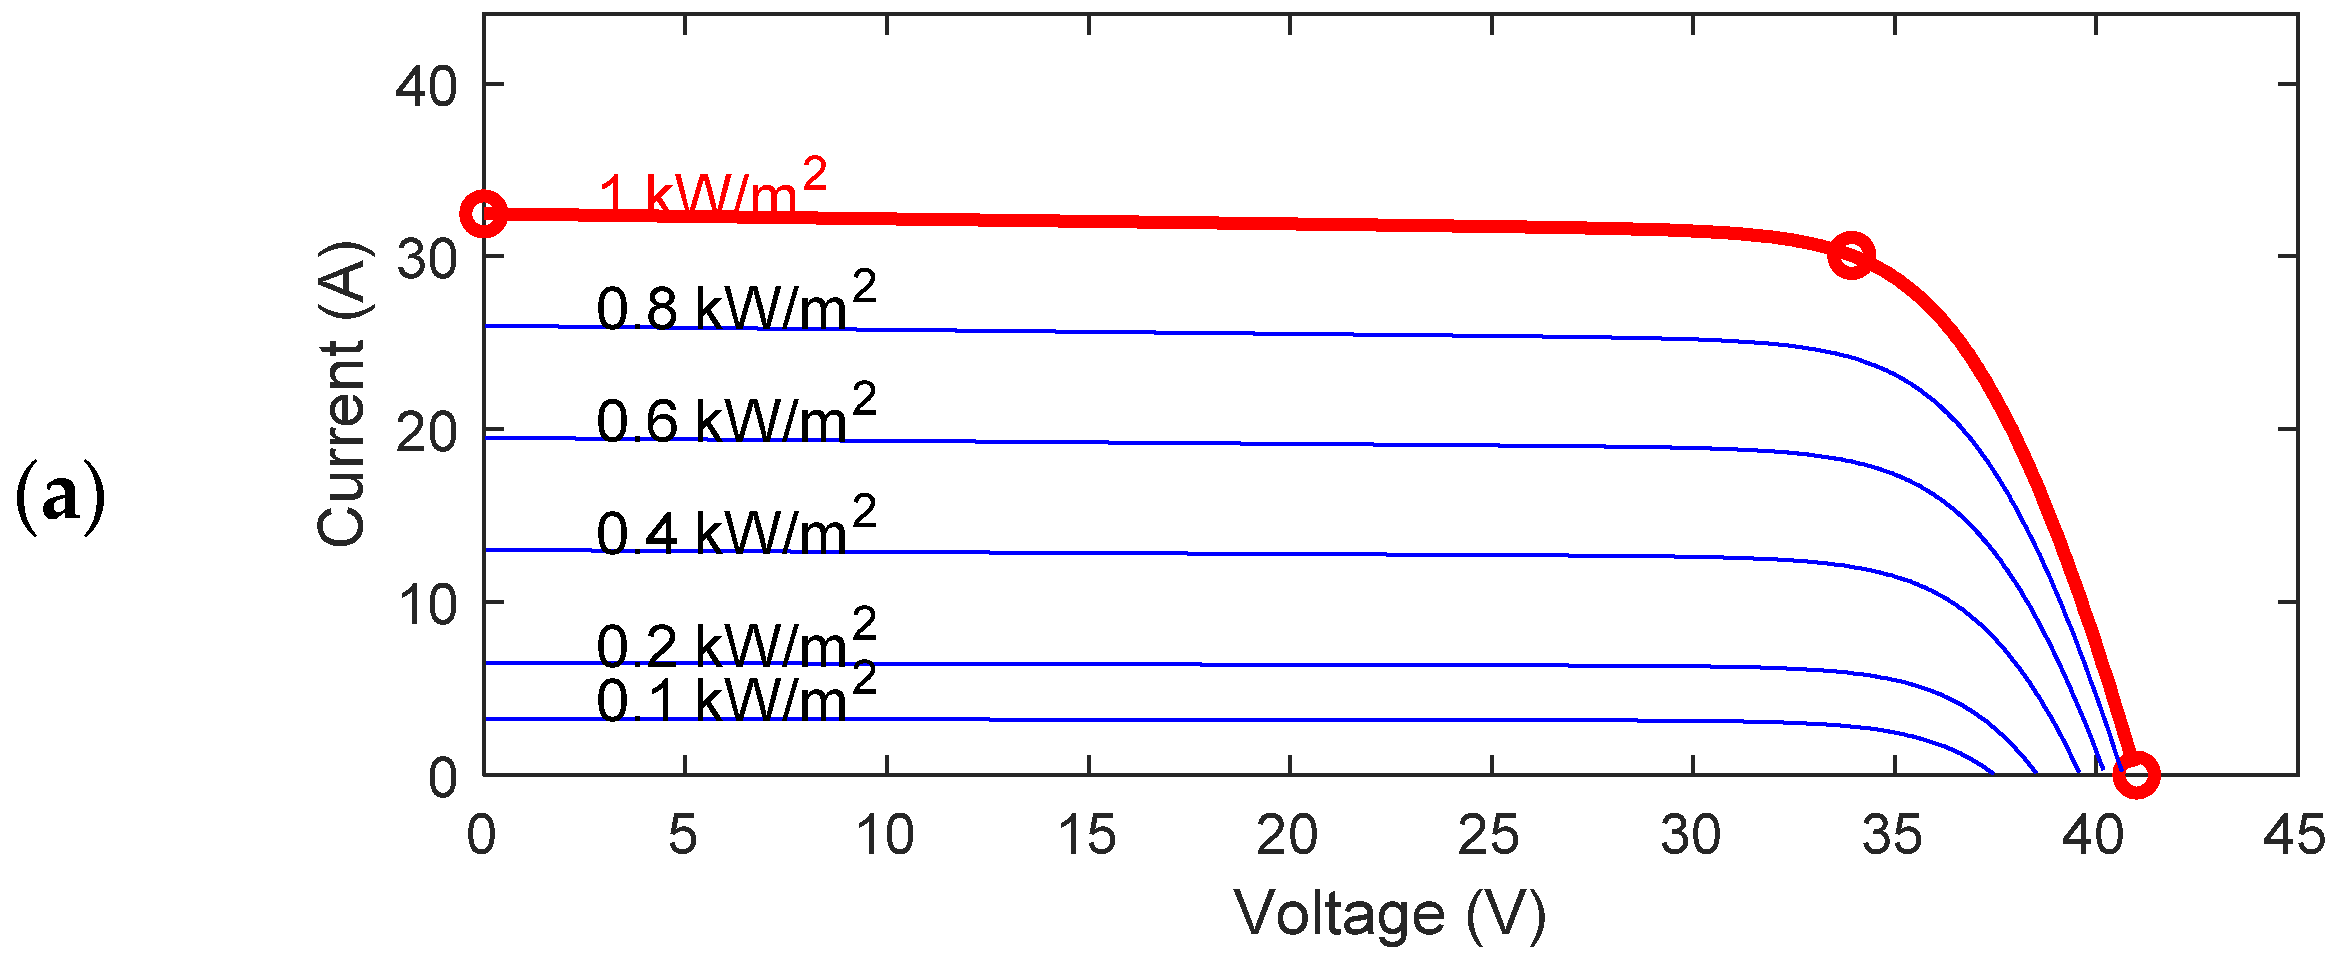
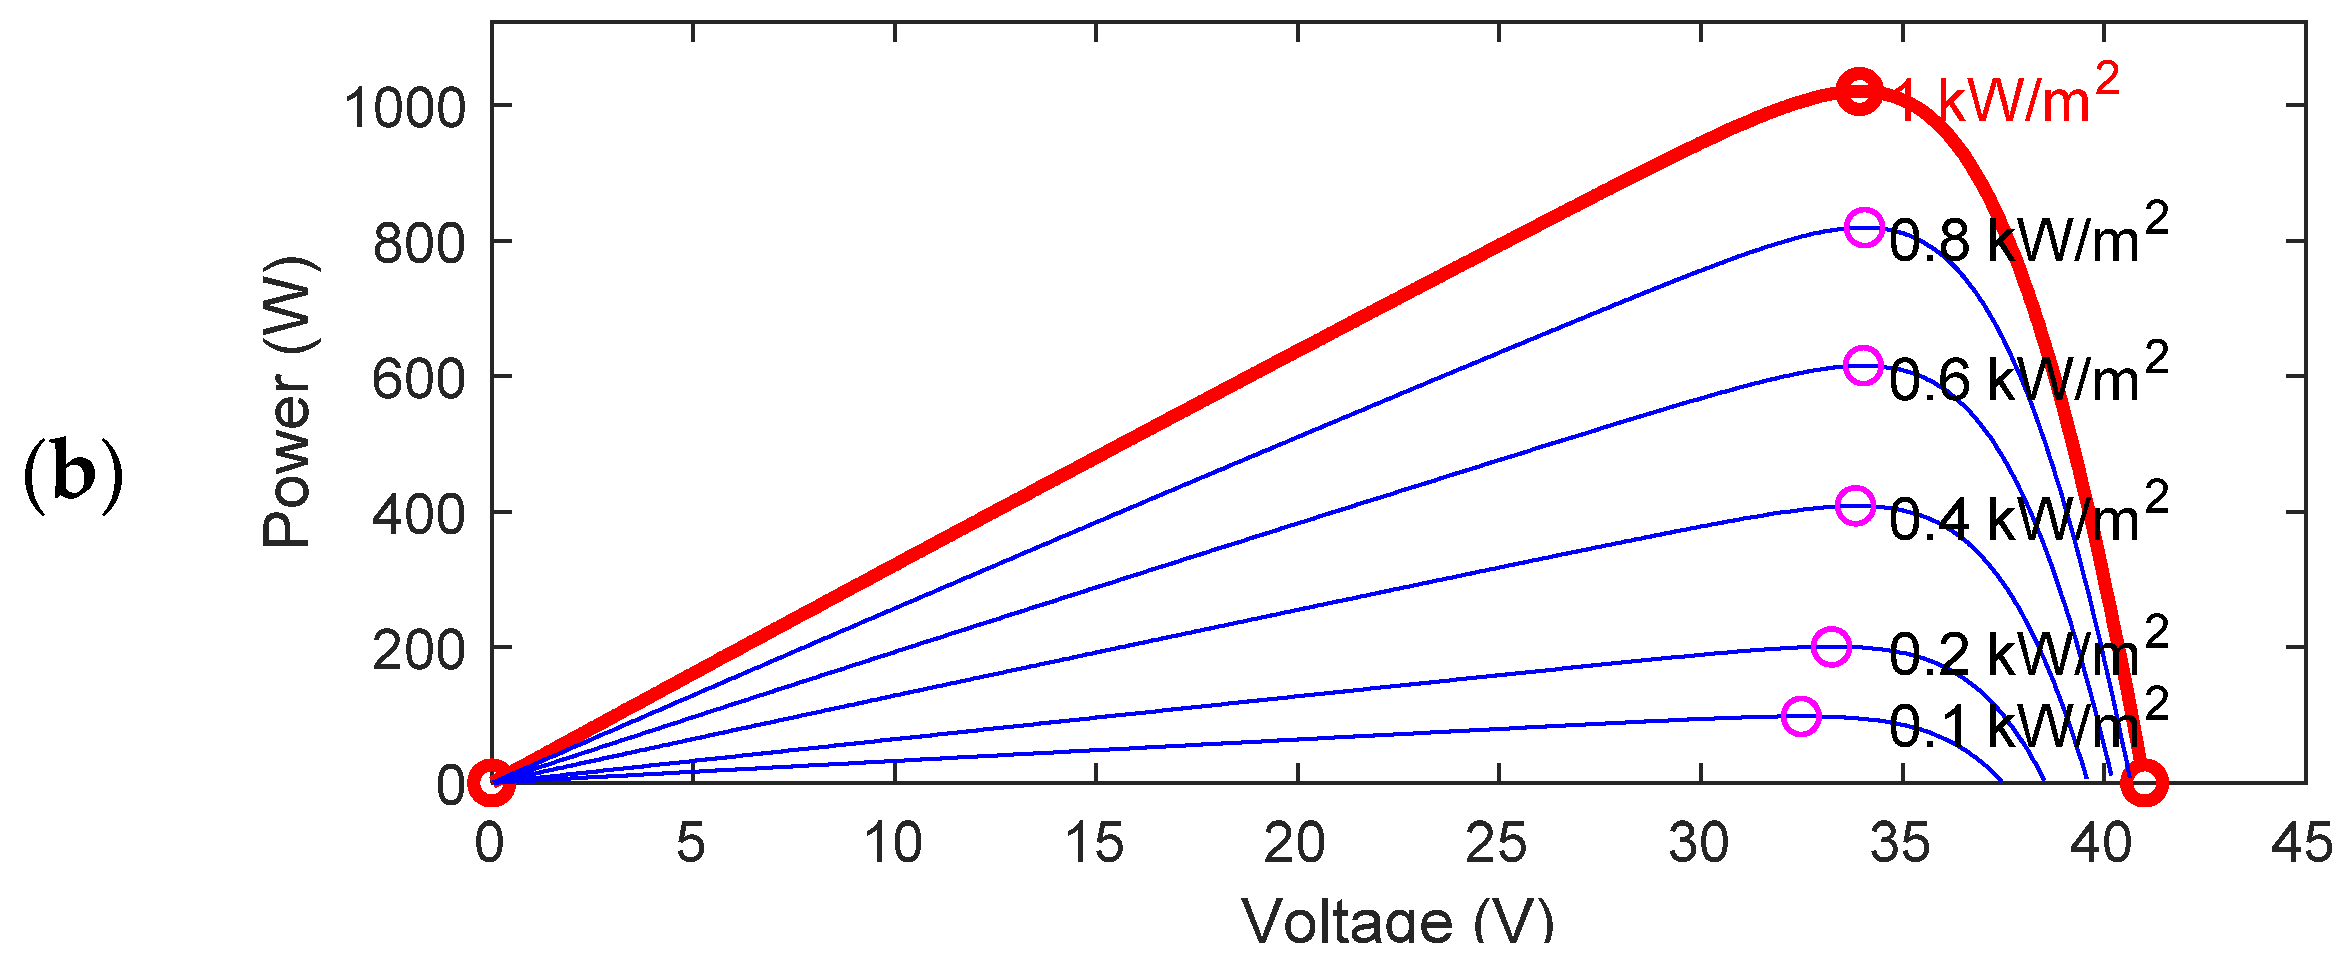
2.1.2. PV System
2.1.3. Buck DC-DC Converter and MPPT Charge Controller
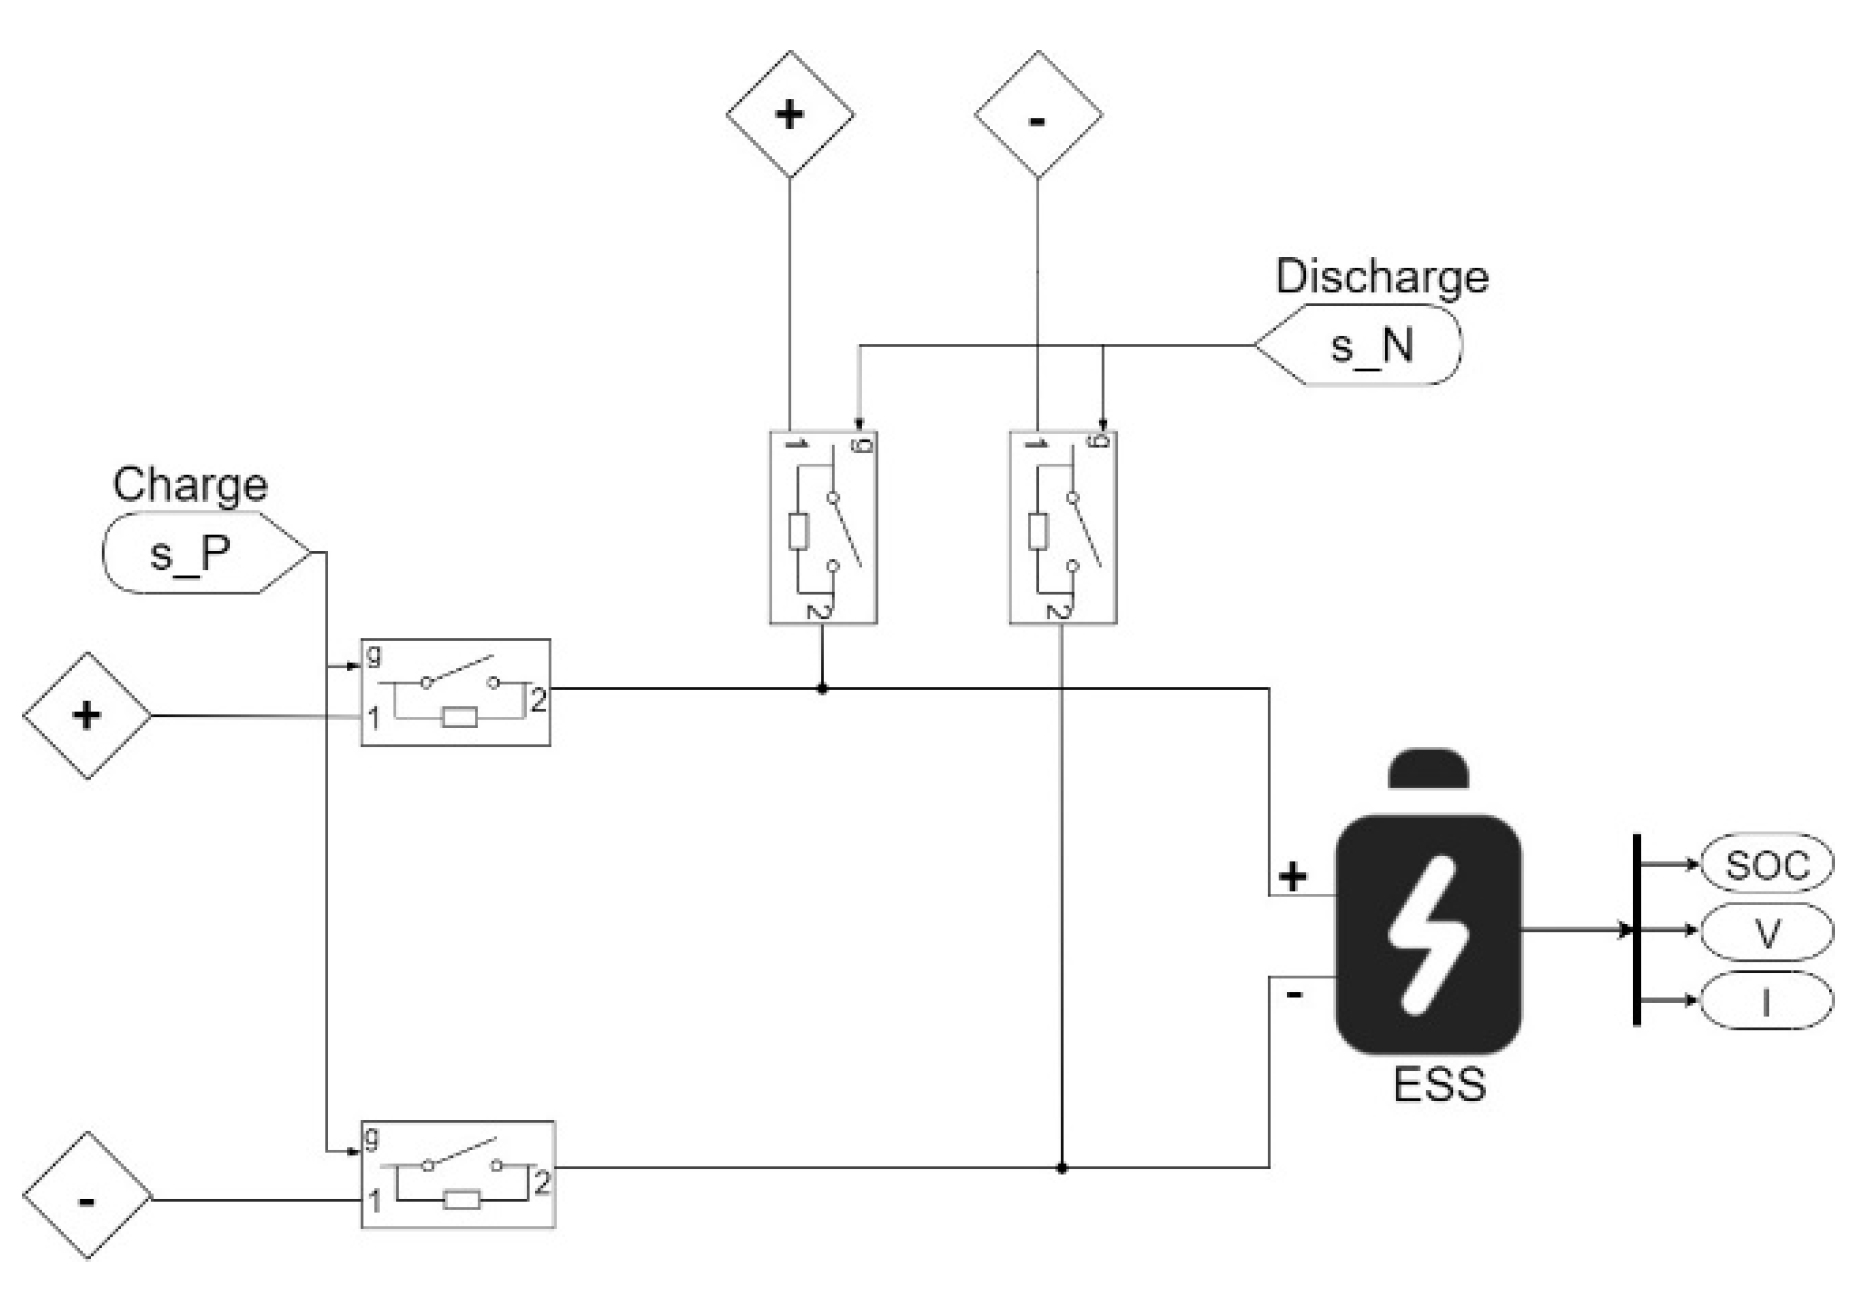
2.1.4. Energy Storage System
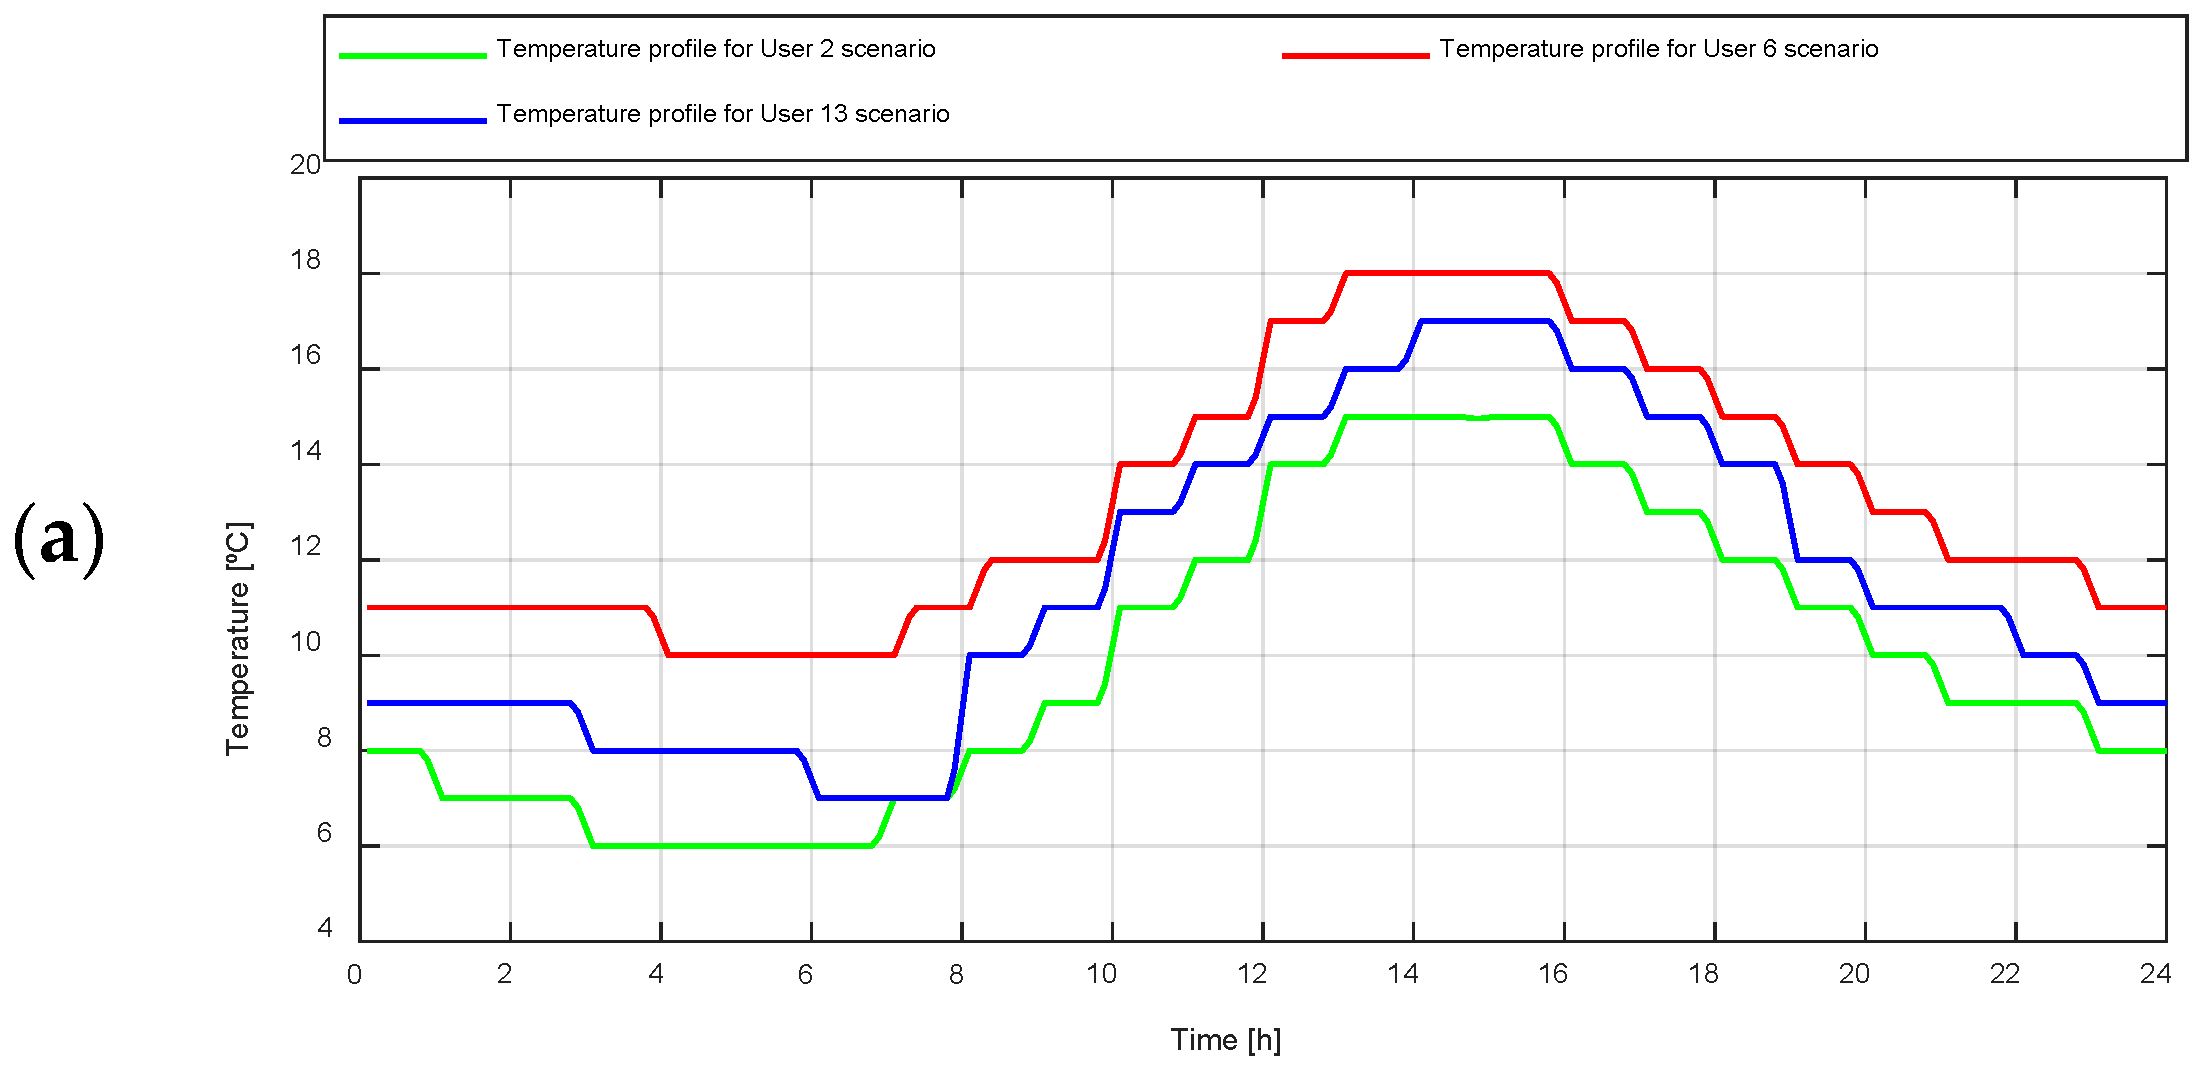
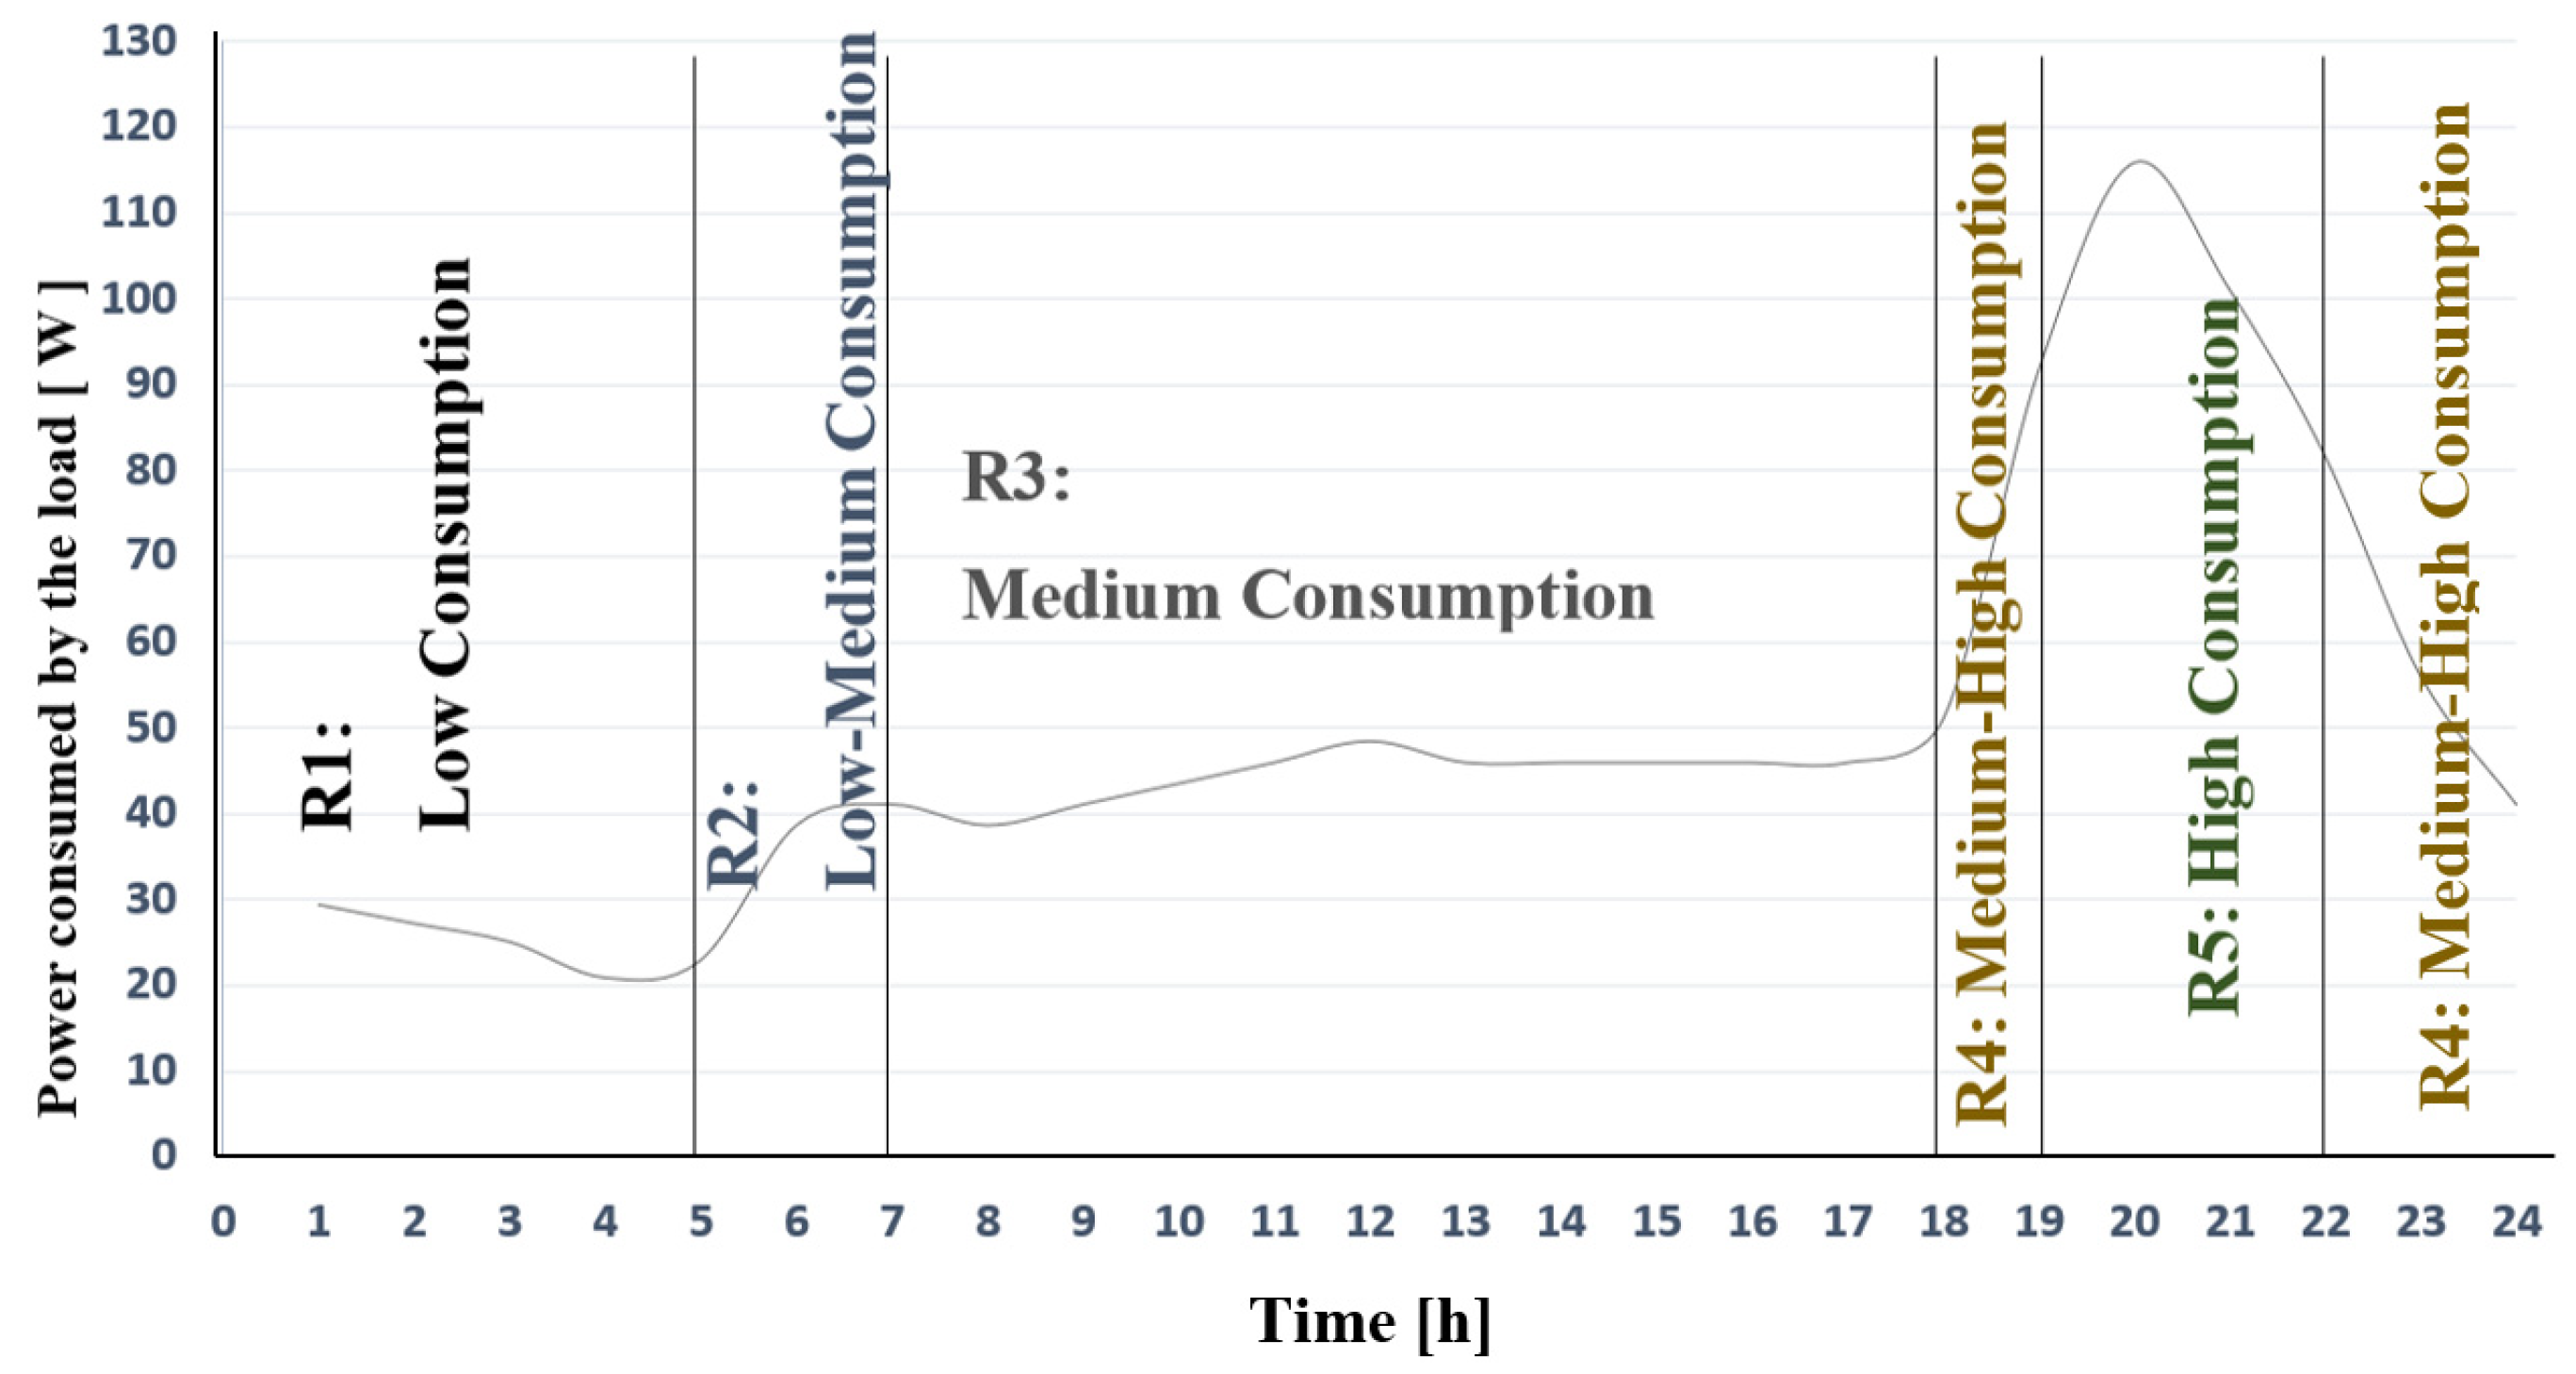
2.1.5. End-User Load Profile
- -
- The base maximum and minimum power consumption were considered taking into account the information presented in the report presented by the ARCONEL [34] with a value of 116 [W] and 21 [W], respectively. These values were upscaled by a factor of 12 to reach the average consumption levels of the residential sector for a middle-class family in Ecuador.
2.1.6. Microgrid Scenario
2.2. Self-Consumption Regulation in Ecuador
- : End-user energy balance (monthly).
- Energy consumed from the network [kWh].
- Energy injected into the network [kWh].
- negative remaining
- positive remaining
2.2.1. PV Installation Sizing
- Nominal Installed Capacity
- : Monthly energy billed to the user
- Plant design factor, determined by the technical study carried out by the distribution and marketing company (or a consulting company) taking into account the user’s average power consumption.
2.2.2. Calculation of Energy Flows from the Point of View of the End-User and Main Grid
- : End-user energy balance (from the end-user point of view)
- Energy consumed by the loads that the end-user has
- Power generated by the PV system
- : A constant from the ESS model and commanded by the EMS wich can be +1 or −1 depending on the energy flow to-from the ESS
- : energy injected or absorbed from/to the battery (depending of ).
2.2.3. General Low Voltage Rate with Hourly Demand Recorder
- -
- A charge [USD/kW-month] for each kW of monthly demand independent of energy consumption, multiplied by a demand management factor (DMF).
- -
- An energy charge [USD/kWh-month] based on the energy consumed in period 1 (08:00 to 22:00) and period 2 (22:00 to 08:00).
2.2.4. Billable Demand
- -
- Meter that registers maximum demand
- -
- Demand management factor
2.2.5. Economic Cost Calculation
- -
- A sales charge [USD/consume-month] independent of energy consumption.
- -
- Incremental charges for energy [USD/kWh] based on consumed energy.
- Economic cost per month [USD/month]
- : Referential cost of the kWh defined by the public distribution company [USD/kWh]
- Economic cost for commercialization defined by the public distribution company [USD]
- Economic for transformer losses defined by the public distribution company [USD]
- Penalty for low power factor defined by the distribution company [USD]
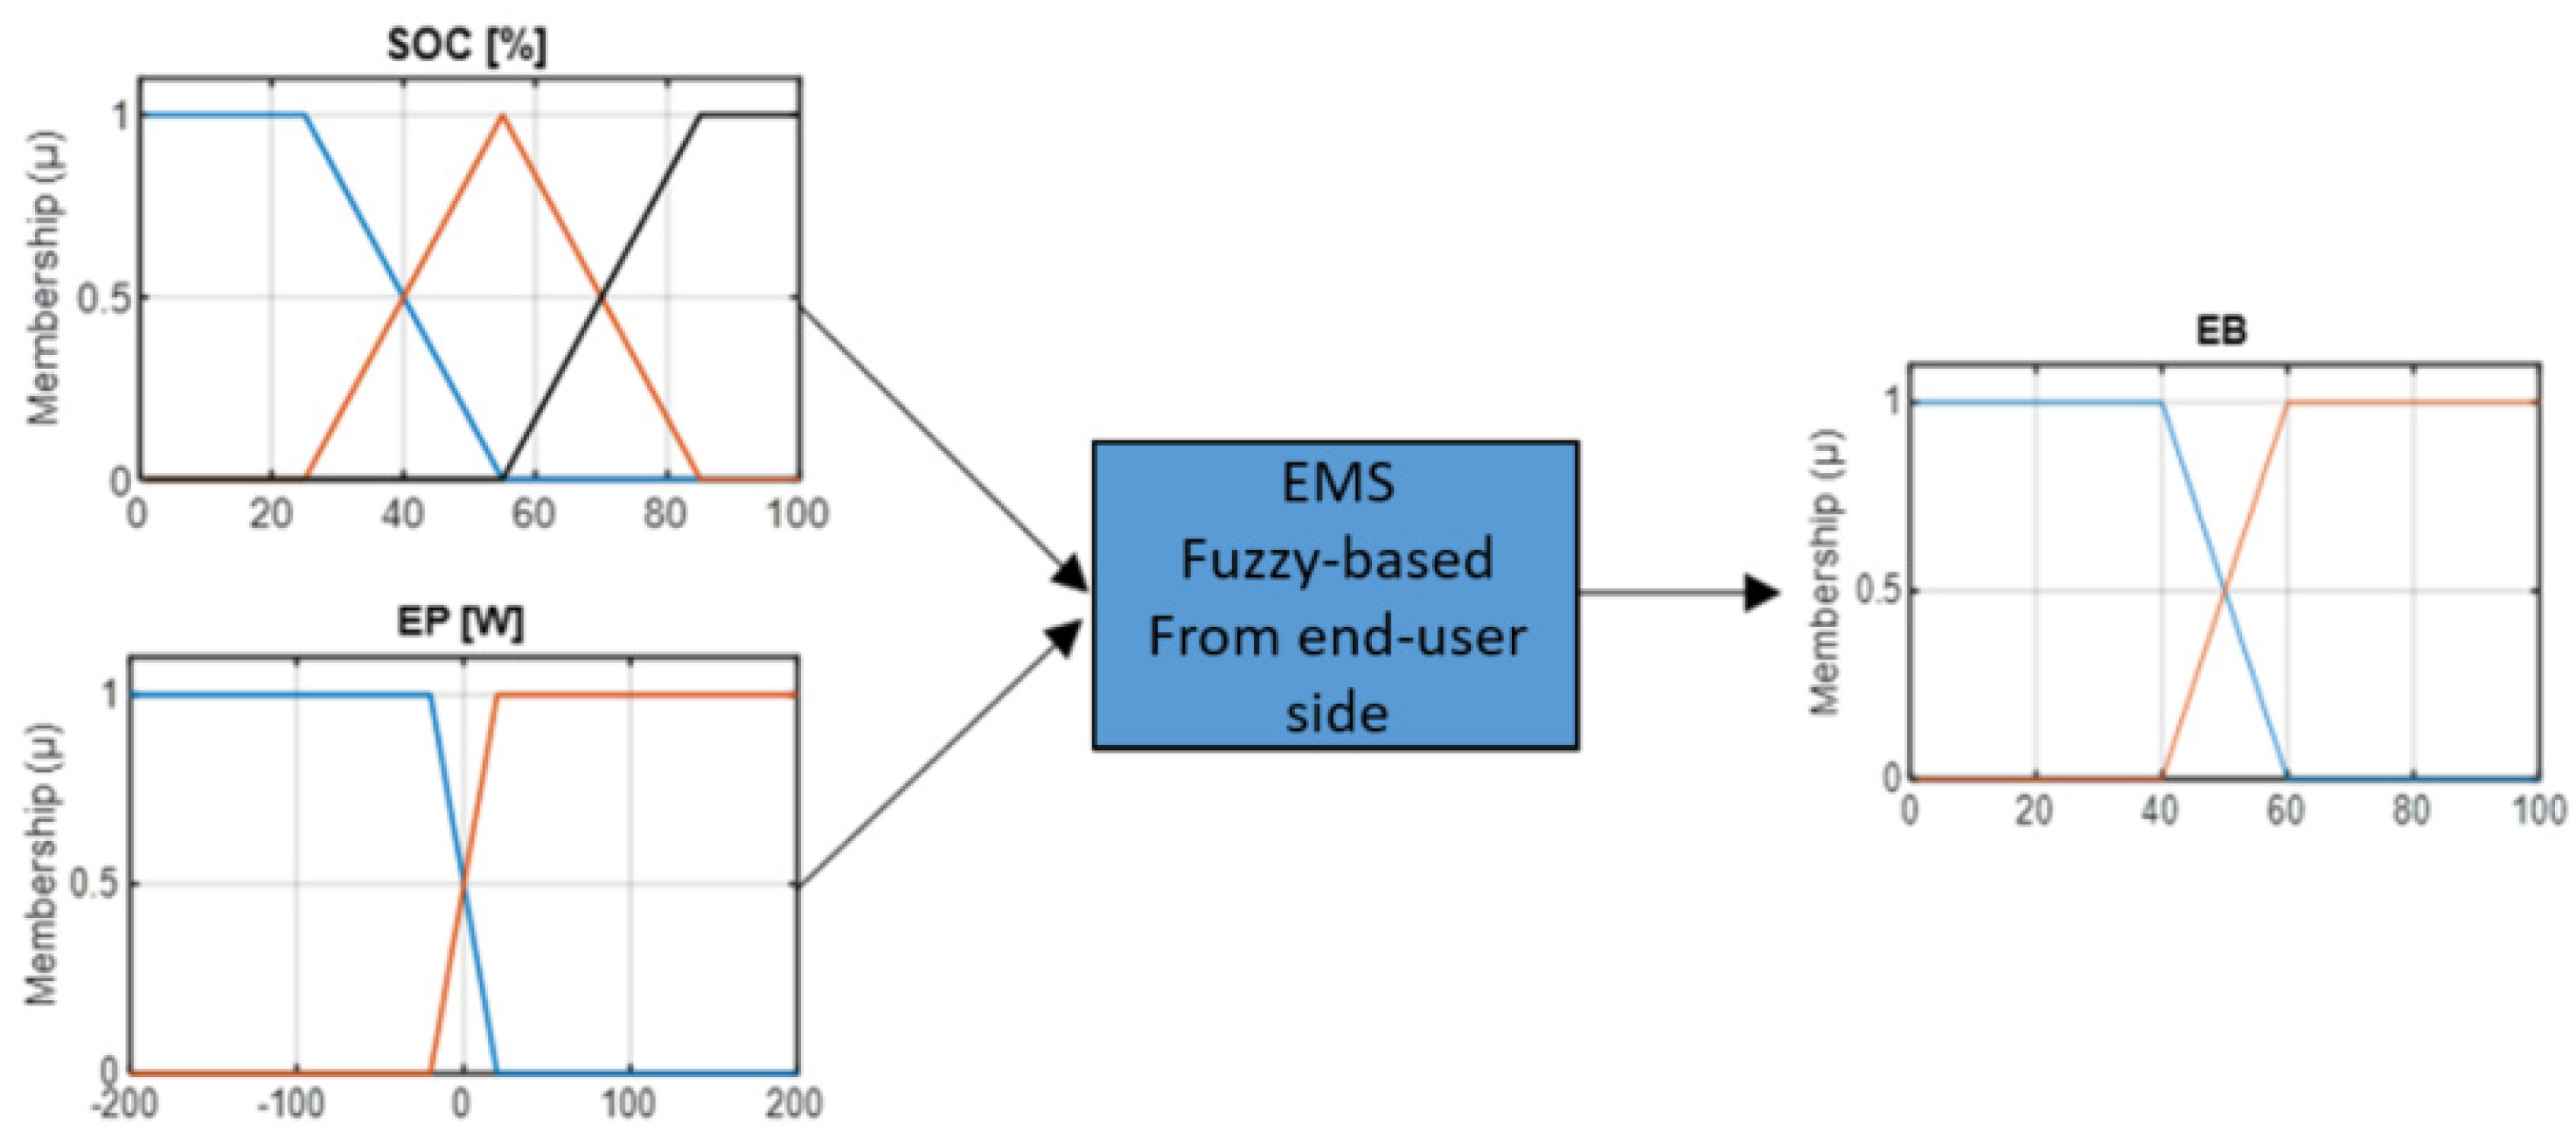
2.3. Energy Management Strategy (EMS)
- -
- Energy management at the end-user level: Fuzzy-based EMS and optimized by Genetic Algorithm
- -
- Energy management at distribution grid level: Fuzzy-based EMS
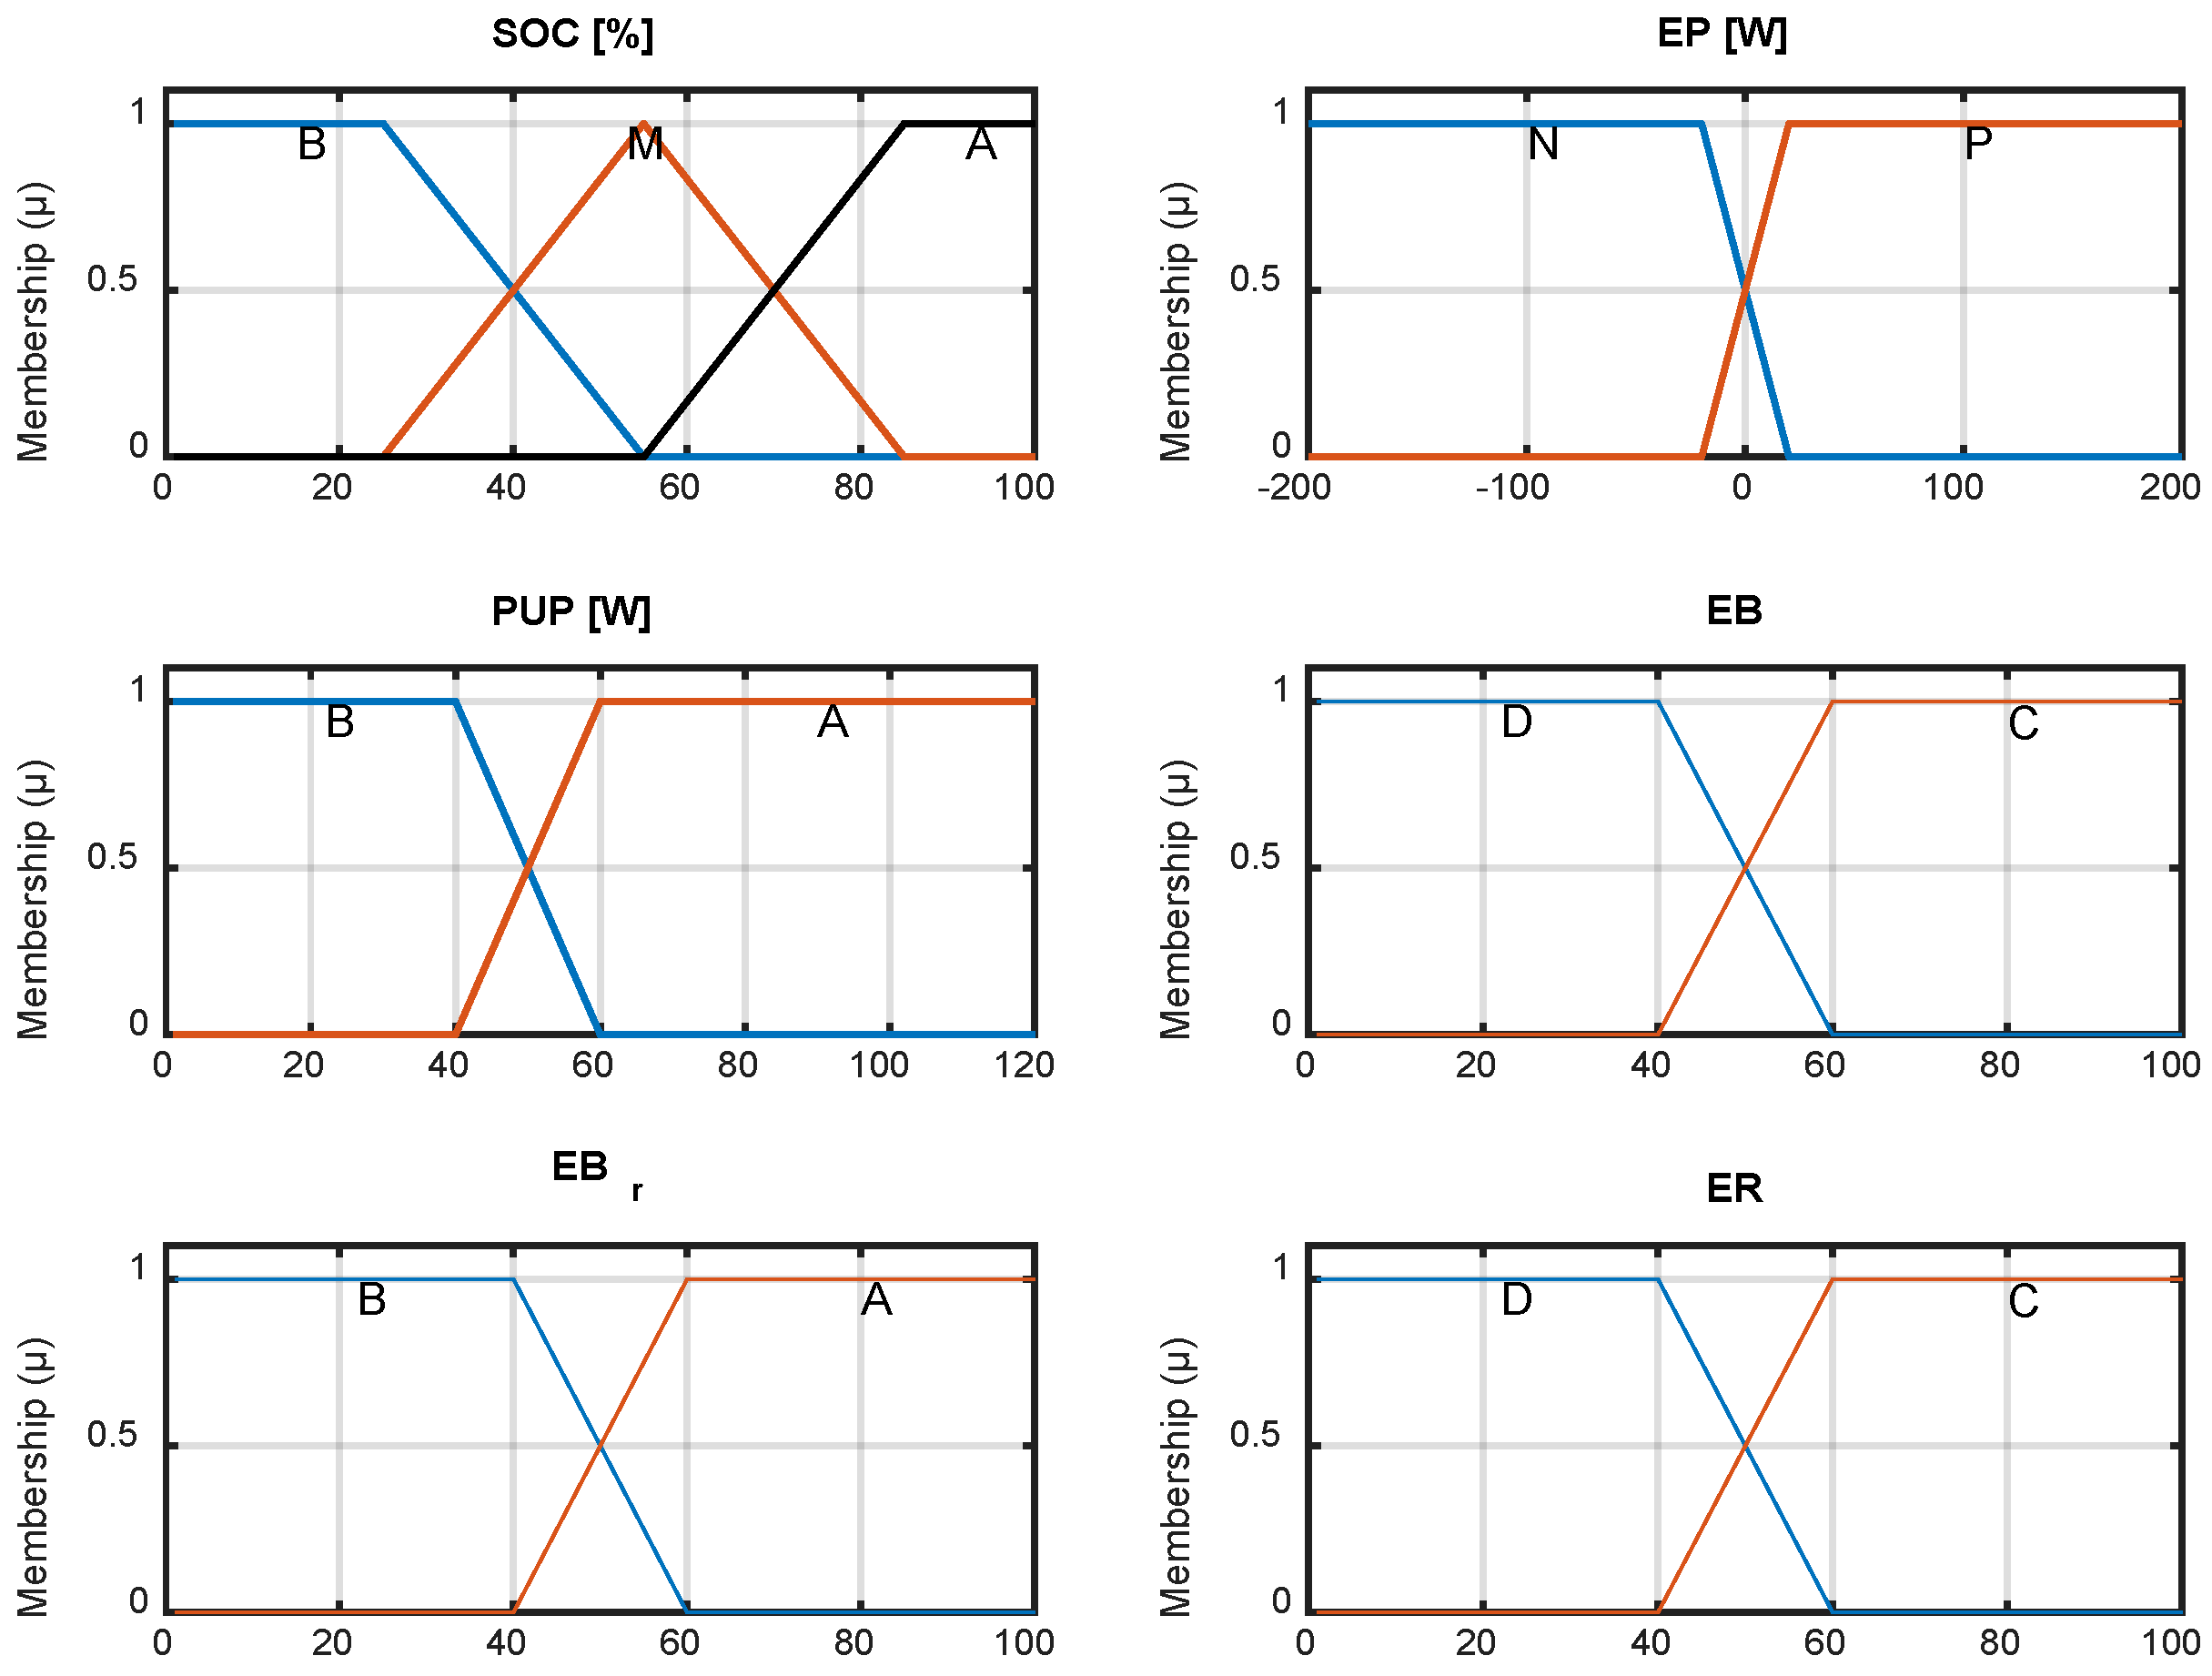
- State of charge variable (SOC):(B) low state-of-charge; (M) medium state-of-charge; (A) high state-of-charge.
- Error of power variable (EP):(N) negative power error; (P) positive power error.
- Prosumer user power variable (PUP):(B) low end-user power (A) high end-user power.
- Battery status variable (EB):(D) battery discharge status; (C) battery charge status.
- MG status variable (ER):(D) Disconnected MG status; (C) connected MG status
- -
- SOC [input]: In the ESS, the SOC is controlled in the range of 55–85% covered by the MF: SOC_M and SOC_A. The objective is to maintain enough stored energy for the power peak demand response and prevent deep discharge at SOC_B <25%.
- -
- EP [input]: This variable relates the power generated by the PV system minus the power demanded by the user’s loads. The input EP has the purpose of triggering the surplus or deficit of power from the balance to be managed by the ESS and/or main grid.
- -
- PUP [input]: Two membership functions have been considered to cover the power demand range: a range with a higher demand PUP > 60 W and another with a lower demand PUP < 60 W. Based on the behavior of the fuzzy rules, the local ESS is prioritized to supply the maximum power demand, and the main grid compensates the positive or negative surplus.
- -
- EB_r [input]: The battery status variable provides information about the loads’ behavior and whether the ESS injects energy to the DC bus to feed the loads with EB_r >60; otherwise, if the loads need to be fed from the main grid.
- -
- EB and ER [outputs]: These outputs control the ESS operation, enabling or disabling the ESS operation (ER) and determining the power rate to charge or discharge the ESS (EB).
2.4. Optimization Process Using Genetic Algorithms
3. Results and Discussion
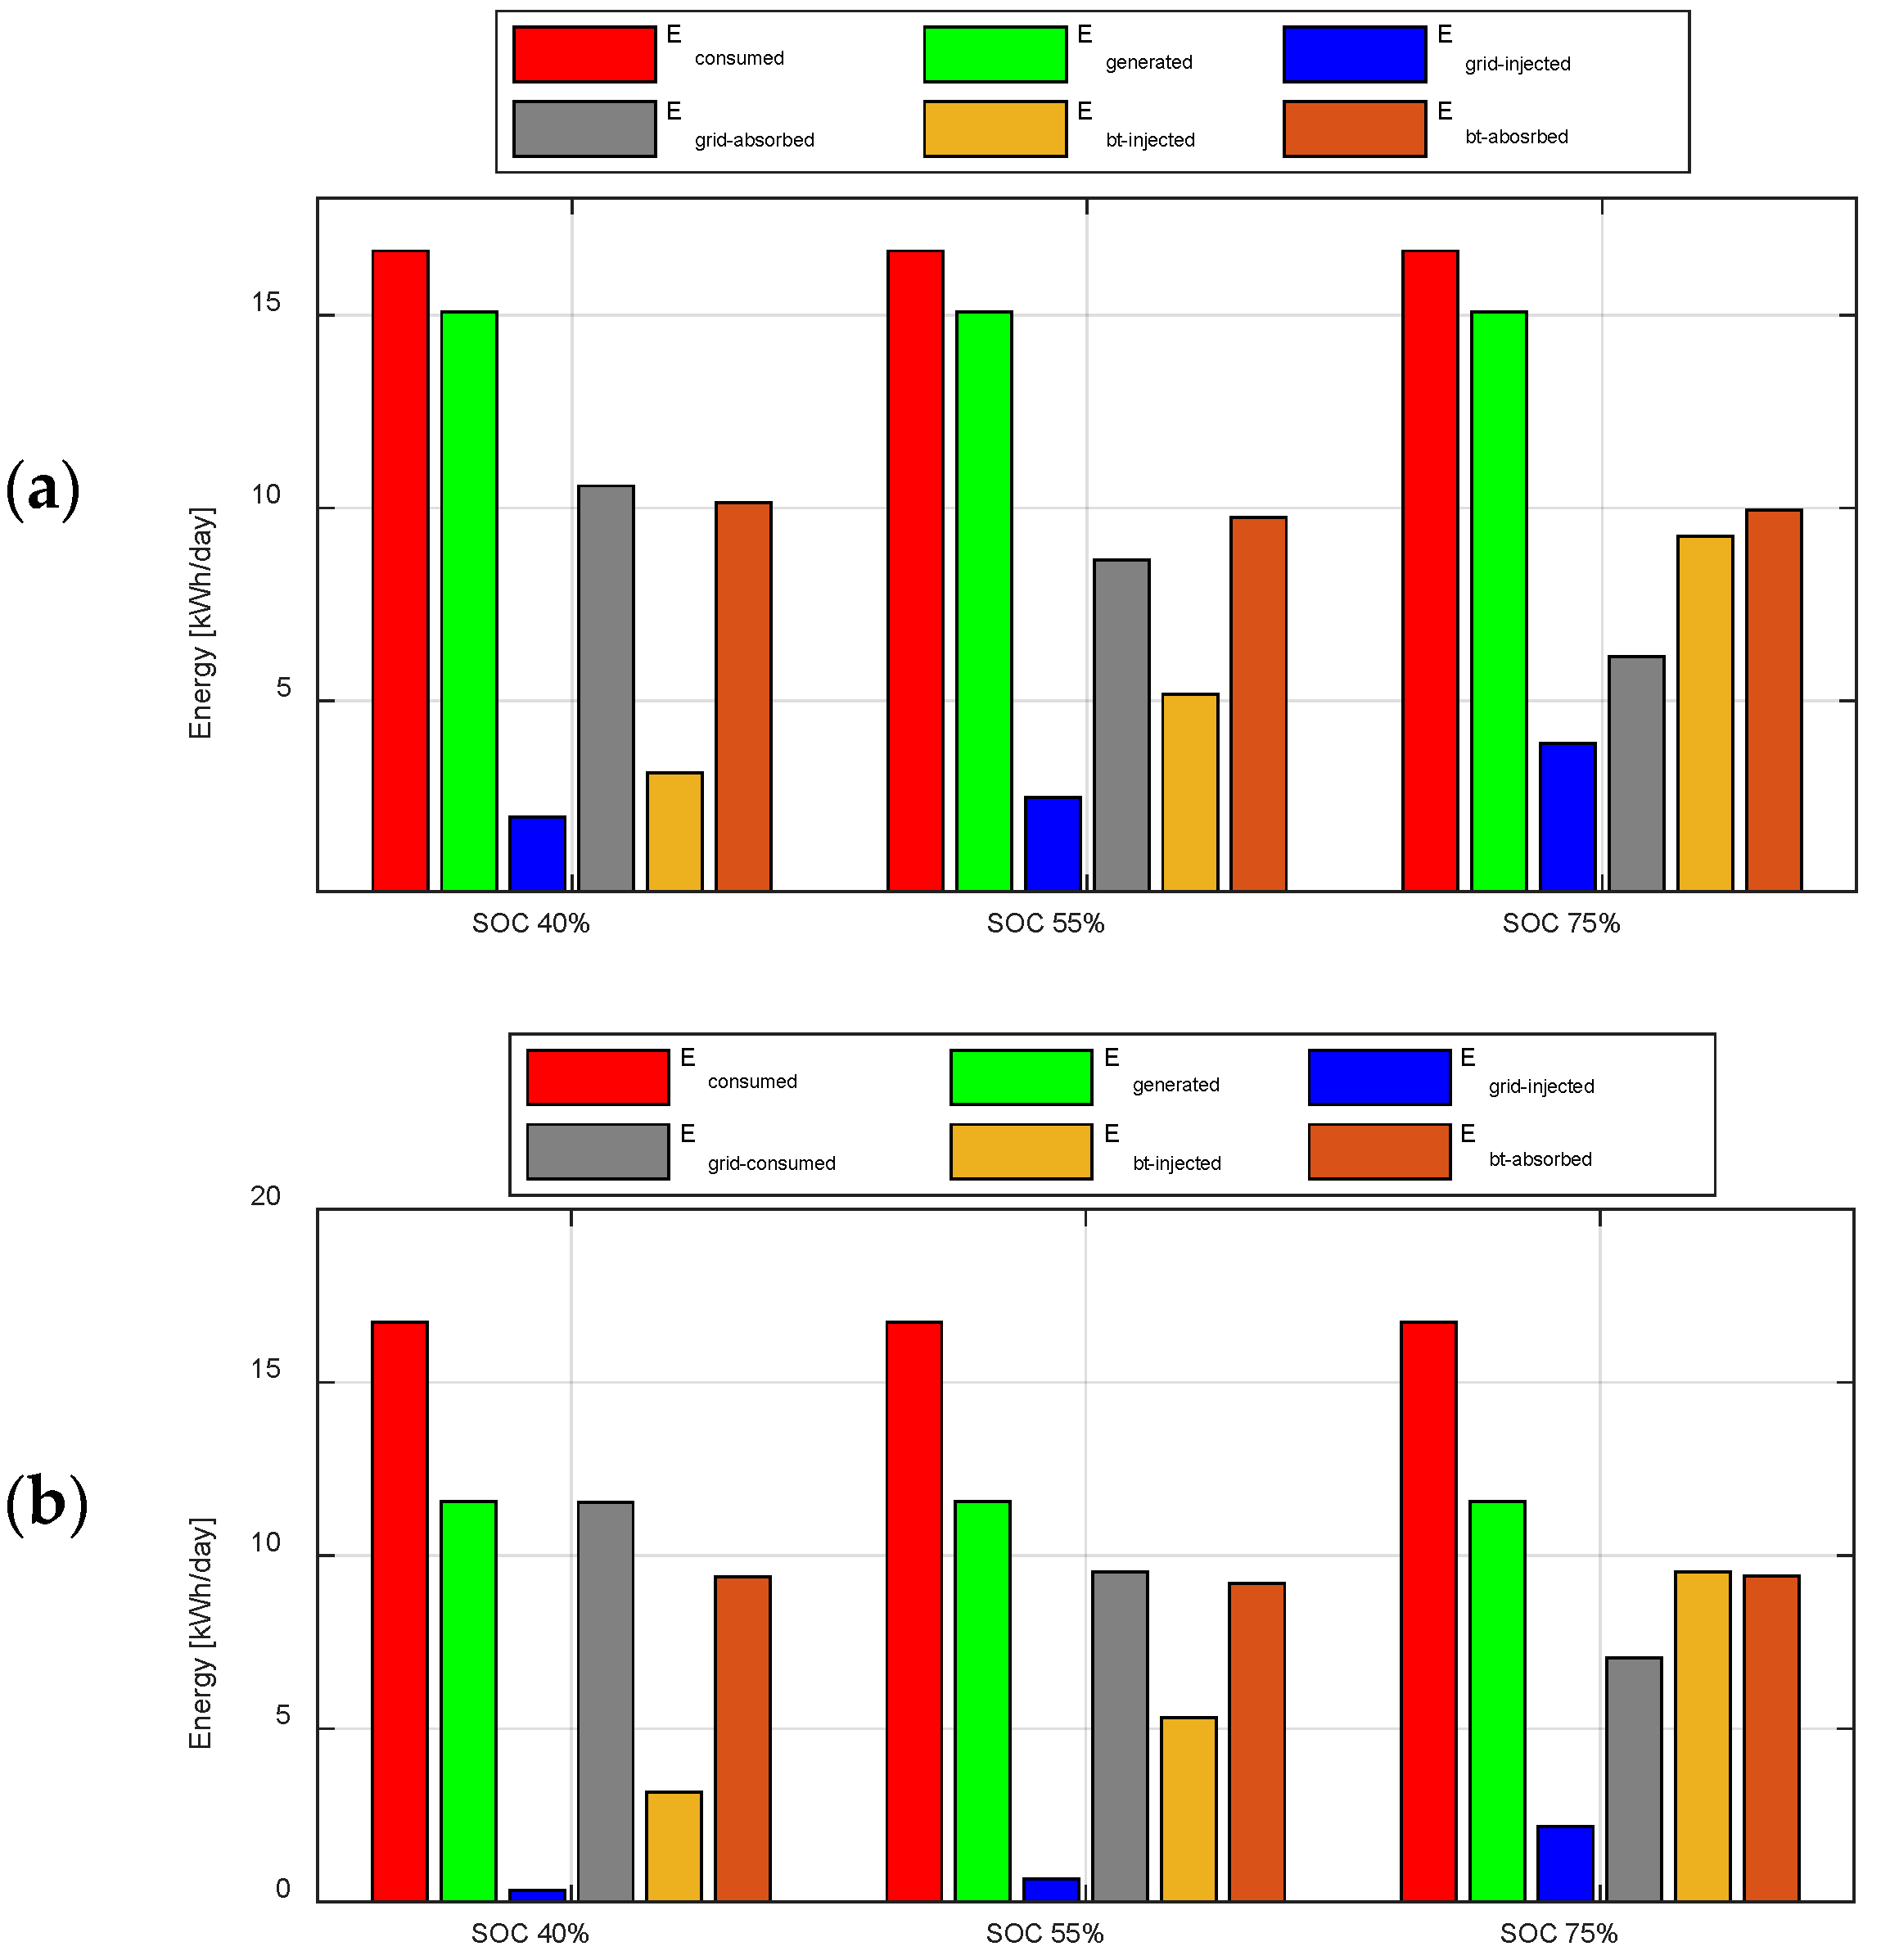
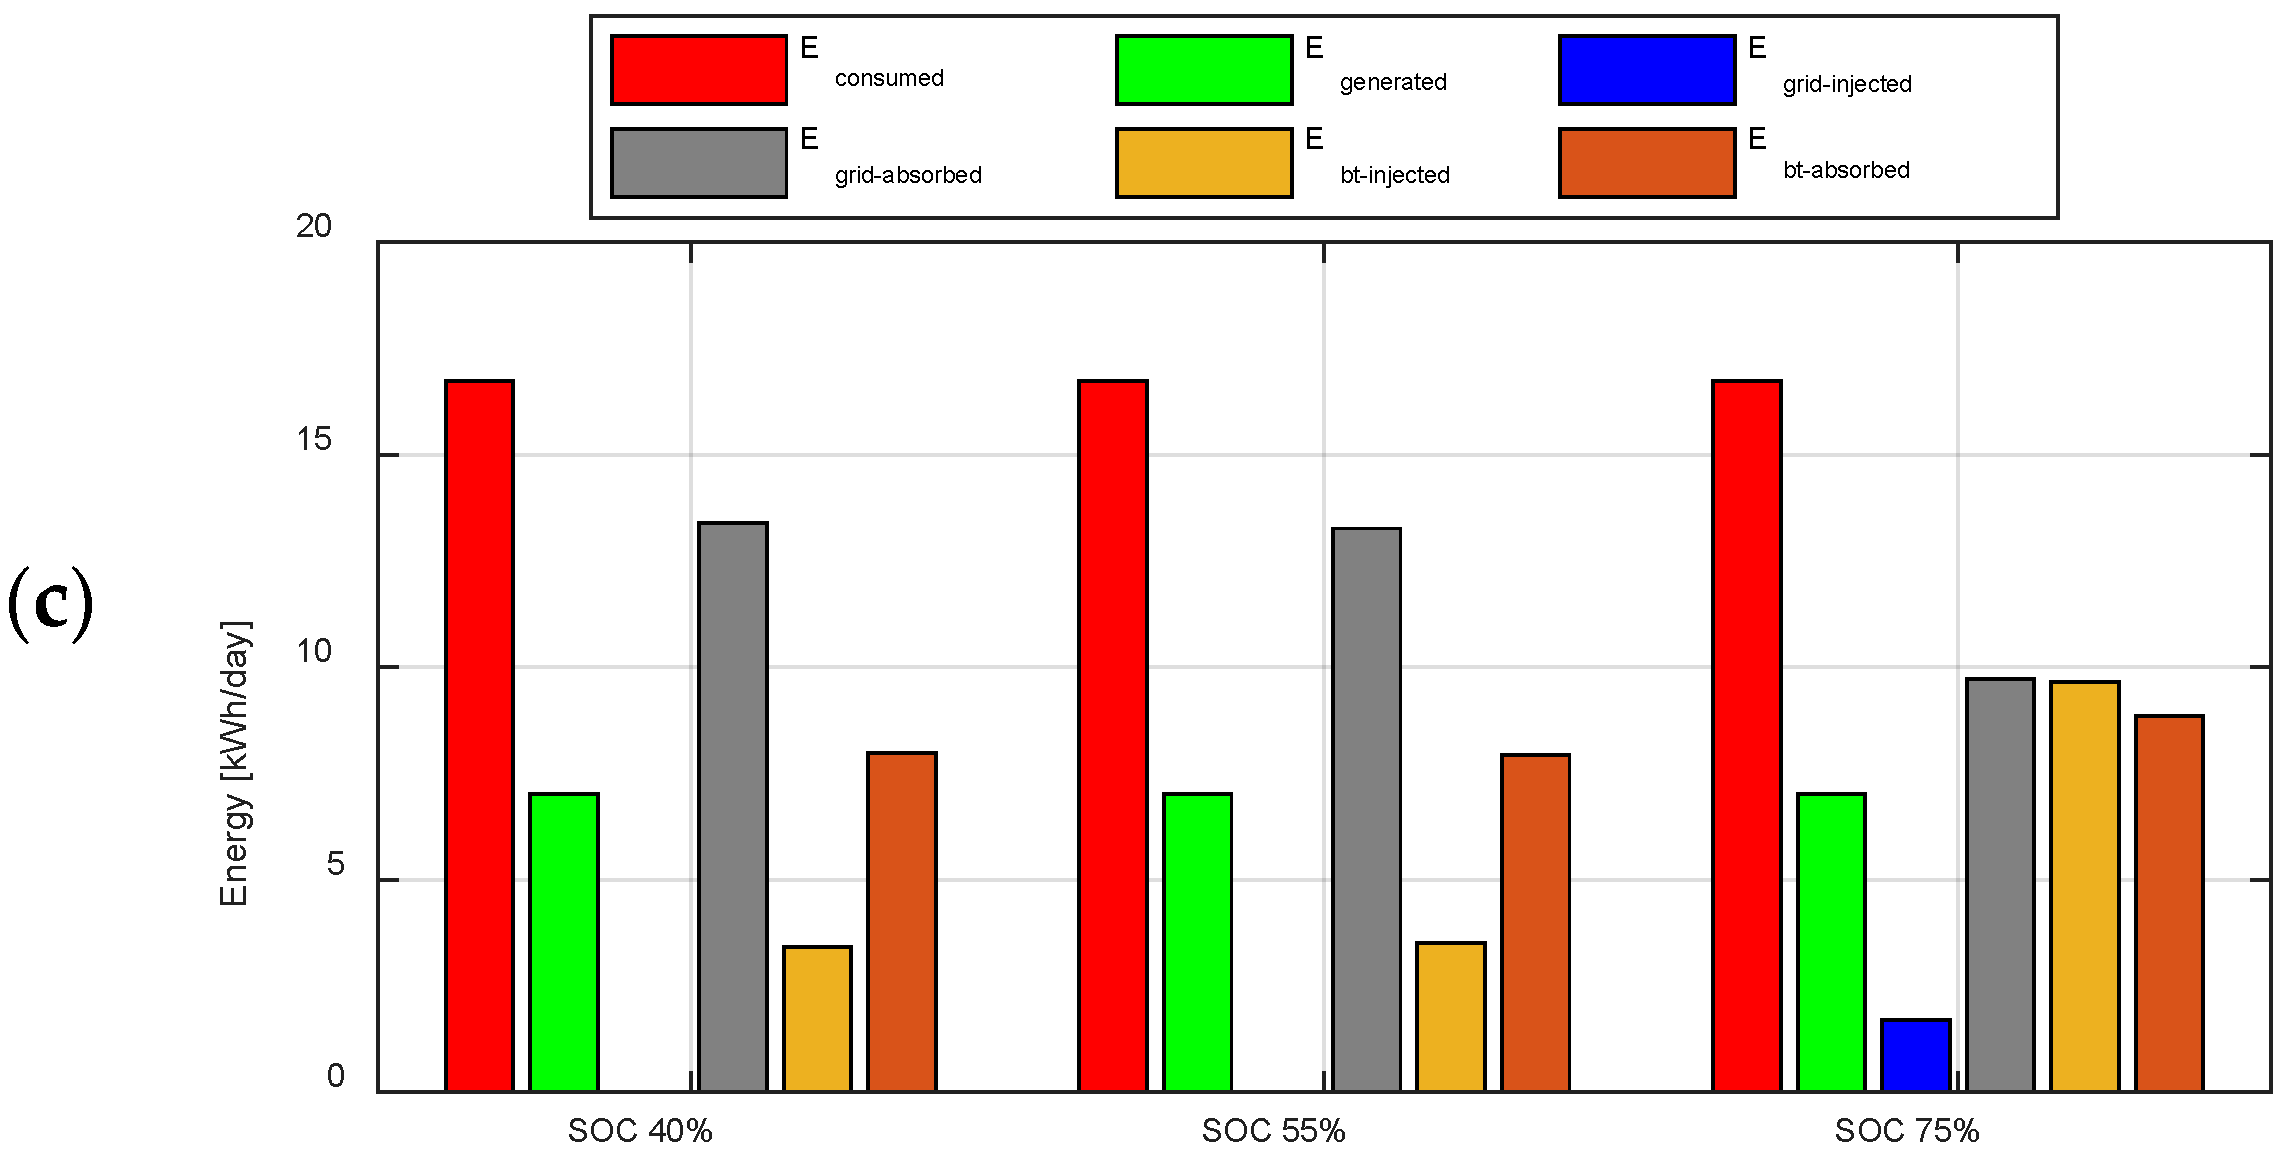
3.1. System Operation Results
- -
- ESS (charging/discharging process and power rate)
- -
- Main grid (absorbing energy to compensate for the end-user demand)
- -
- Main grid (absorbing energy to charge the ESS to use it in a different time frame)
- -
- Main grid (injecting the energy surplus when the ESS is close to fully charge and to be compensated by the energy credit contemplated in the Ecuadorian legislation as explained in Section 2.2)
3.2. Economical Assessment by End-User Type
3.2.1. Electricity Bill Cost Assessment
- -
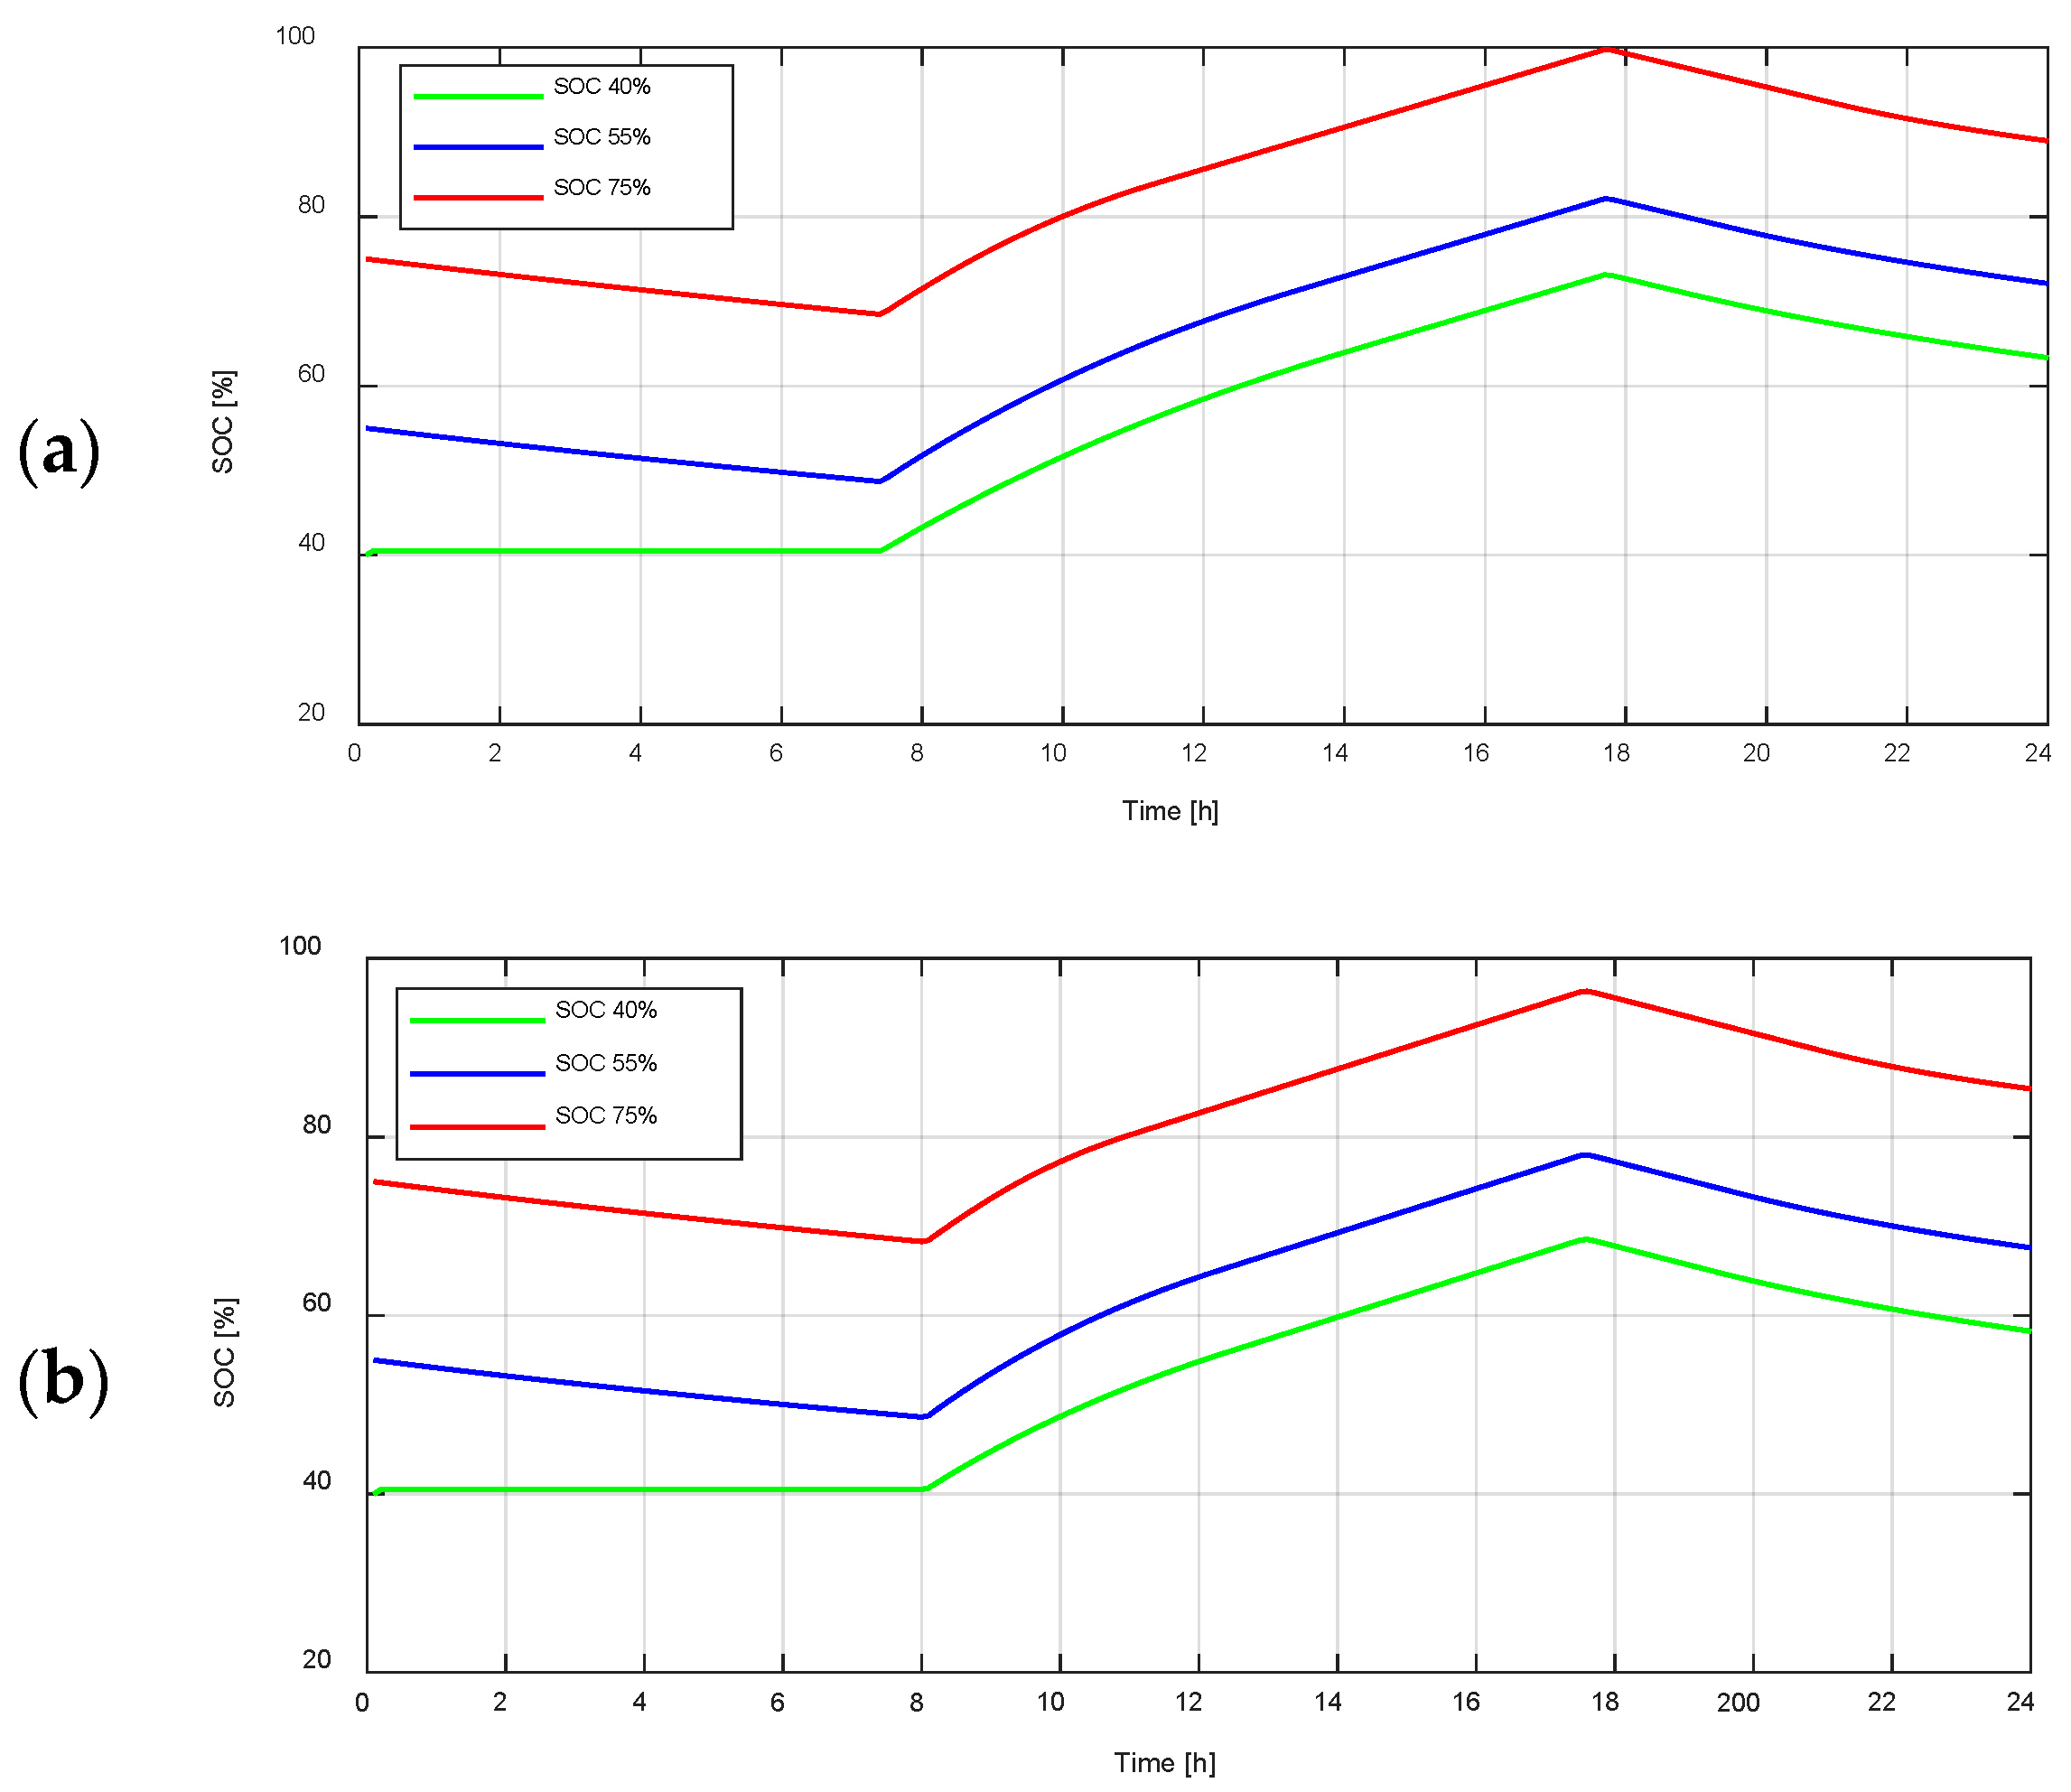
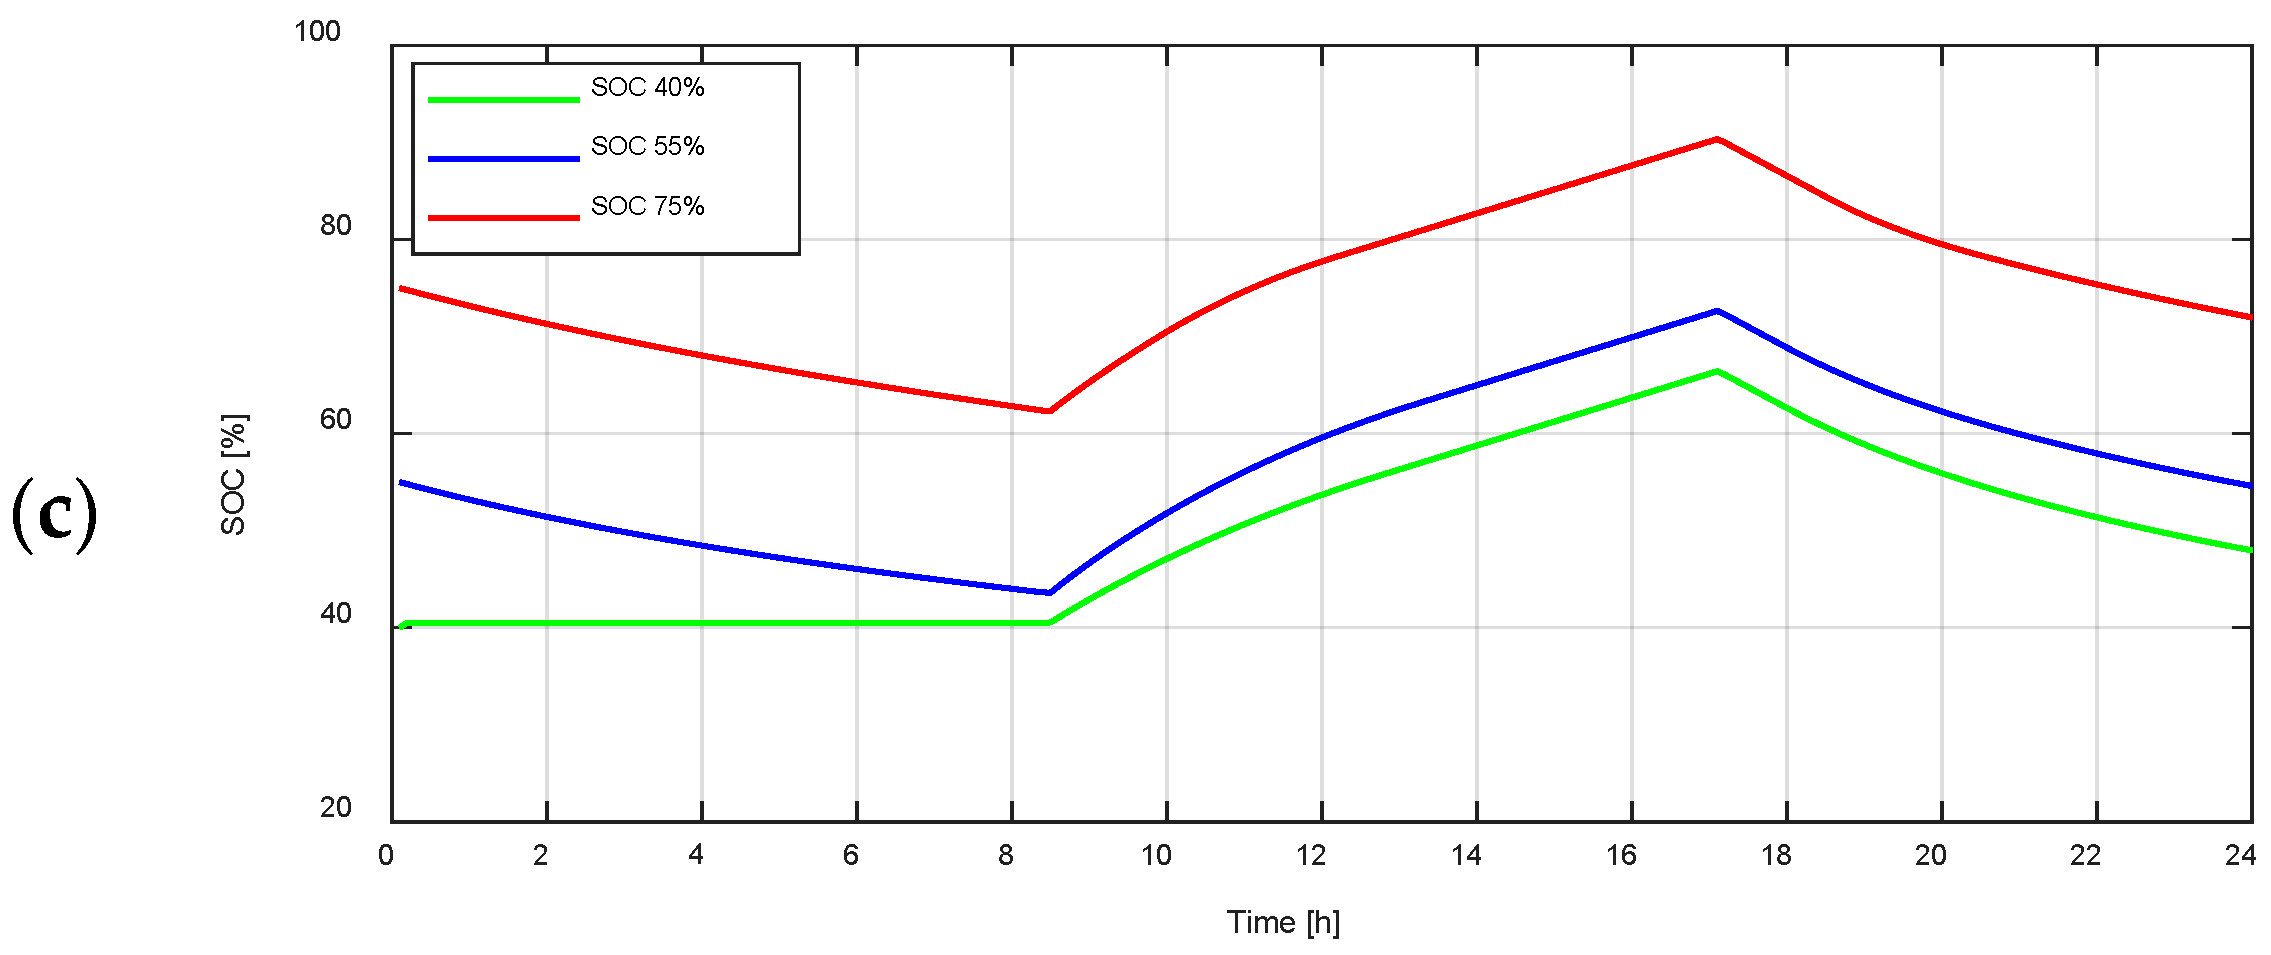
- SOC represents the different levels of battery state of charge considered.
- -
- The base cost was calculated with the total energy consumed from the main grid () presented in Figure 19 and using the economic model from Section 2.2 considering a traditional end-user (consumer without a PV system installed at home).
- -
- The case cost corresponds to the scenario of an end-user with a PV system installed at home and recognized as a prosumer (current contract) by the local distribution and marketing company. The economic model of Section 2.2 is applied and, as a result of the energy saving, the economic cost is calculated.
- -
- The percentage reduction represents the reduction in the electricity bill cost of the scenario with a PV system from the one without a PV system (traditional end-user).
- -
- The energy surplus at the end of the day was calculated taking into account the energy balance of the battery () [kWh] with the data presented in Figure 19. To this energy surplus was applied the economic model described in Section 2.2 with the referential costs of 1.414 [USD] and 0.083 [USD/kWh] for and , respectively. The resulting economic cost [USD/month] represents the potential electricity bill cost in the case of a CEM is considered where:
- The energy balance (and economic model of Section 2.2) is considered for the energetic compensation (current law) of a kWh consumed by a kWh injected.
- The energy surplus available in the battery at the end of the day (as calculated from data presented in Figure 19 and depicted in Figure 16 with the difference between the initial and final SOC values) can be negotiated with the main grid to be used by itself or other end-users (during the next day). This energy surplus will represent the amount of energy that can be compensated economically by the main grid (or by an intermediary) to the end-user who offers it. It is worth clarifying that this assumption is an expected scenario in the case of including the figure of CEM in the current law.
- -
- The potential reduction represents the reduction in the electricity bill cost of the scenario with a PV system (considering the two points previously described) from the one without a PV system (traditional end-user).
3.2.2. Lifecycle Cost Assessment
4. Conclusions
Author Contributions
Funding
Institutional Review Board Statement
Informed Consent Statement
Conflicts of Interest
Appendix A

| Energy Status | [1], [7], [23], [33], [34], [37], [38] |
| Self-Consumption | [4], [5], [11], [24], [40], [41], [42], [43], [44] |
| Microgrids | [2], [3], [4], [5], [6], [11], [12], [13], [14], [15], [16], [40], [41], [42], [43], [44], [45] |
| Policies and Regulation | [8], [21], [22], [25], [27], [28], [30], [31], [32], [33], [34], [37], [39], [41], [45] |
| Energy Communities | [4], [9], [10], [17], [18], [19], [20], [26], [28], [29],[31], [32], [33], [35], [36] |
References
- Suman, A. Role of renewable energy technologies in climate change adaptation and mitigation: A brief review from Nepal. Renew. Sustain. Energy Rev. 2021, 151, 111524. [Google Scholar]
- Akram, U.; Khalid, M.; Shafiq, S. An innovative hybrid wind-solar and battery-supercapacitor microgrid system—development and optimization. IEEE Access 2017, 5, 25897–25912. [Google Scholar] [CrossRef]
- Brearley, B.J.; Prabu, R.R. A review on issues and approaches for microgrid protection. Renew. Sustain. Energy Rev. 2017, 67, 988–997. [Google Scholar] [CrossRef]
- Berwal, A.K.; Kumar, S.; Kumari, N.; Kumar, V.; Haleem, A. Design and analysis of rooftop grid tied 50 kW capacity Solar Photovoltaic (SPV) power plant. Renew. Sustain. Energy Rev. 2017, 77, 1288–1299. [Google Scholar] [CrossRef]
- Liu, Y.; Li, H.; Peng, K.; Zhang, C.; Hua, H.; Wang, L. Demonstration Projects of Integrated Energy System in China. Energy Procedia 2018, 145, 88–96. [Google Scholar] [CrossRef]
- Mahmoud, M.S.; Hussain, S.A.; Abido, M.A. Modeling and control of microgrid: An overview. J. Frankl. Inst. 2014, 351, 2822–2859. [Google Scholar] [CrossRef]
- IEA. Greenhouse Gas Emissions from Energy—Data Product—IEA. Available online: https://www.iea.org/data-and-statistics/data-product/greenhouse-gas-emissions-from-energy (accessed on 13 January 2022).
- EU. Directive (EU) 2018/2001 of the European Parliament and of the Council on the promotion of the use of energy from renewable sources. Off. J. Eur. Union 2018, 2018, 82–209. Available online: https://eur-lex.europa.eu/legal-content/EN/TXT/PDF/?uri=CELEX:32018L2001&from=EN (accessed on 15 January 2022).
- Barbour, E.; Parra, D.; Awwad, Z.; González, M.C. Community energy storage: A smart choice for the smart grid? Appl. Energy 2018, 212, 489–497. [Google Scholar] [CrossRef] [Green Version]
- Mengelkamp, E.; Garttner, J.; Weinhardt, C. The role of energy storage in local energy markets. In Proceedings of the 14th International Conference on the European Energy Market, Dresden, Germany, 6–9 June 2017; pp. 1–6. [Google Scholar] [CrossRef]
- Alotaibi, M.A.; Eltamaly, A.M. A smart strategy for sizing of hybrid renewable energy system to supply remote loads in Saudi Arabia. Energies 2021, 14, 7069. [Google Scholar] [CrossRef]
- Grant, J. Design and Simulation of a DC Microgrid for a Small Island in Belize; Reykjavik University: Reykjavík, Iceland, 2018. [Google Scholar]
- Wu, X.; Wang, Z.; Ding, T.; Li, Z. Hybrid AC/DC microgrid planning with optimal placement of DC feeders. Energies 2019, 12, 1751. [Google Scholar] [CrossRef] [Green Version]
- Rey, J.M.; Vera, G.A.; Acevedo-Rueda, P.; Solano, J.; Mantilla, M.A.; Llanos, J.; Saez, D. A Review of Microgrids in Latin America: Laboratories and Test Systems. IEEE Lat. Am. Trans. 2022, 100, 1–13. Available online: https://latamt.ieeer9.org/index.php/transactions/article/view/6235 (accessed on 20 May 2022). [CrossRef]
- Ruiz-Alvarez, S.; Patiño, J.; Marquez, A.; Espinosa, J. Optimal Design for an Electrical Hybrid Micro Grid in Colombia Under Fuel Price Variation. Int. J. Renew. Energy Res. 2017, 7, 1535–1545. [Google Scholar]
- Rodríguez, M.; Salazar, A.; Arcos-Aviles, D.; Llanos, J.; Martínez, W.; Motoasca, E. A Brief Approach of Microgrids Implementation in Ecuador: A Review. In Lecture Notes in Electrical Engineering; Springer: Cham, Switzerland, 2021; Volume 762, pp. 149–163. [Google Scholar]
- Moret, F.; Pinson, P. Energy Collectives: A Community and Fairness Based Approach to Future Electricity Markets. IEEE Trans. Power Syst. 2019, 34, 3994–4004. [Google Scholar] [CrossRef] [Green Version]
- Botsaris, P.N.; Giourka, P.; Papatsounis, A.; Dimitriadou, P.; Goitia-Zabaleta, N.; Patsonakis, C. Developing a business case for a renewable energy community in a public housing settlement in greece—the case of a student housing and its challenges, prospects and barriers. Sustainability 2021, 13, 3792. [Google Scholar] [CrossRef]
- 824342 RENAISSANCE EU H2020 No, Renaissance H2020 Project Towards Sustainable Energy Communities. Available online: https://www.renaissance-h2020.eu/ (accessed on 25 April 2020).
- Home-Compile Project. Available online: https://www.compile-project.eu/ (accessed on 13 January 2022).
- Schelly, C.; Bessette, D.; Brosemer, K.; Gagnon, V.; Arola, K.L.; Fiss, A.; Pearce, J.M.; Halvorsen, K.E. Energy policy for energy sovereignty: Can policy tools enhance energy sovereignty? Sol. Energy 2020, 205, 109–112. [Google Scholar] [CrossRef]
- Busch, H.; Ruggiero, S.; Isakovic, A.; Hansen, T. Policy challenges to community energy in the EU: A systematic review of the scientific literature. Renew. Sustain. Energy Rev. 2021, 151, 111535. [Google Scholar] [CrossRef]
- Owusu, P.A.; Asumadu-Sarkodie, S. A review of renewable energy sources, sustainability issues and climate change mitigation. Cogent Eng. 2016, 3. [Google Scholar] [CrossRef]
- Frieden, D.; Tuerk, A.; Roberts, J.; D’Hebermont, S.; Gubina, A. Collective Self-Consumption and Energy Communities: Overview of Emerging Regulatory Approaches in Europe; Faculty of Electrical Engineering Laboratory of Energy Policy: Lubliana, Eslovenia, 2019. [Google Scholar]
- Ministerio para la Transición Ecológica, Real Decreto-ley 23/2020, 2020. Available online: https://www.boe.es/buscar/act.php?id=BOE-A-2020-6621&p=20210505&tn=1 (accessed on 10 November 2020).
- De Lotto, R.; Micciché, C.; Venco, E.M.; Bonaiti, A.; De Napoli, R. Energy Communities: Technical, Legislative, Organizational, and Planning Features. Energies 2022, 15, 1731. [Google Scholar] [CrossRef]
- Fina, B.; Fechner, H. Transposition of European Guidelines for Energy Communities into Austrian Law: A Comparison and Discussion of Issues and Positive Aspects. Energies 2021, 14, 3922. [Google Scholar] [CrossRef]
- Meitern, M. Does Access to Regulative Exemption Reduce Barriers for Energy Communities? A Dutch Case Study. Sustainability 2022, 14, 5608. [Google Scholar] [CrossRef]
- Boulanger, S.O.M.; Massari, M.; Longo, D.; Turillazzi, B.; Nucci, C.A. Designing Collaborative Energy Communities: A European Overview. Energies 2021, 14, 8226. [Google Scholar] [CrossRef]
- ORDIN 165 16/09/2020—Portal Legislativ. Available online: http://legislatie.just.ro/Public/DetaliiDocument/230504 (accessed on 14 January 2022).
- Husein, M.; Kim, H.-J.; Chung, I.-Y. The Impact of Policy and Technology Parameters on the Economics of Microgrids for Rural Electrification: A Case Study of Remote Communities in Bolivia. Energies 2020, 13, 877. [Google Scholar] [CrossRef] [Green Version]
- MacArthur, J.L. Trade, Tarsands and Treaties: The Political Economy Context of Community Energy in Canada. Sustainability 2017, 9, 464. [Google Scholar] [CrossRef] [Green Version]
- Mah, D.N.; Cheung, D.M.; Leung, M.K.; Wang, M.Y.; Wong, M.W.; Lo, K.; Cheung, A.T. Policy mixes and the policy learning process of energy transitions: Insights from the feed-in tariff policy and urban community solar in Hong Kong. Energy Policy 2021, 157, 112214. [Google Scholar] [CrossRef]
- Agencia de Regulación y Control-ARCONEL. (2018, agosto). ESTADÍSTICA ANUAL Y MULTIANUAL del Sector Eléctrico Ecuatoriano. 2021. Available online: https://www.regulacionelectrica.gob.ec/wp-content/uploads/downloads/2019/08/Estad%C3%ADsticaAnualMultianual2018.pdf (accessed on 18 May 2022).
- Lazdins, R.; Mutule, A.; Zalostiba, D. PV Energy Communities—Challenges and Barriers from a Consumer Perspective: A Literature Review. Energies 2021, 14, 4873. [Google Scholar] [CrossRef]
- Alonso, À.; de la Hoz, J.; Martín, H.; Coronas, S.; Matas, J. Individual vs. Community: Economic Assessment of Energy Management Systems under Different Regulatory Frameworks. Energies 2021, 14, 676. [Google Scholar] [CrossRef]
- SolarPower Europe. Global Market Outlook for Solar Power; Solar Power Europe: Brussels, Belgium, 2022. [Google Scholar]
- IRENA. Renewable Capacity Statistics 2022; IRENA: Camarillo, CA, USA, 2021. [Google Scholar]
- Agencia de Regulación y Control de Energía de Recursos Naturales No Renovables, Estadística Anual y Multianual del Sector Eléctrico Ecuatoriano 2020, 2020. Available online: https://www.controlrecursosyenergia.gob.ec/wp-content/uploads/downloads/2021/09/Estadistica-2020-baja.pdf (accessed on 23 May 2022).
- Grzanic, M.; Capuder, T.; Zhang, N.; Huang, W. Prosumers as active market participants: A systematic review of evolution of opportunities, models and challenges. Renew. Sustain. Energy Rev. 2022, 154, 111859. [Google Scholar] [CrossRef]
- Agwan, U.; Spangher, L.; Arnold, W.; Srivastava, T.; Poolla, K.; Spanos, C.J. Pricing in Prosumer Aggregations using Reinforcement Learning. In Proceedings of the e-Energy ’21 Proceedings of the Twelfth ACM International Conference on Future Energy Systems, Italy, 28 June–2 July 2021; pp. 220–224. [CrossRef]
- Bruno, S.; Giannoccaro, G.; la Scala, M. Predictive control of demand and storage for residential prosumers. In Proceedings of the Predictive Control of Demand and Storage for Residential Prosumers, Turin, Italy, 26–29 September 2017. [Google Scholar]
- Dragomir, O.; Dragomir, F.; Stefan, V.; Minca, E. Adaptive Neuro—Fuzzy Inference Systems—An Alternative Forecasting Tool for Prosumers. Stud. Inform. Control 2015, 24, 351–360. [Google Scholar]
- Dimitroulis, P.; Alamaniotis, M. A fuzzy logic energy management system of on-grid electrical system for residential prosumers. Electr. Power Syst. Res. 2022, 202, 107621. [Google Scholar] [CrossRef]
- Salazar, S.; Arcos, H. Technical and Economic Analysis for the Net Metering Implementation for several types of electricity customers in Ecuador. Rev. Técnica “Energía” Operador Nac. Electr. CENACE 2021, 18, 86–94. [Google Scholar]


| Element | Characteristics | Value |
|---|---|---|
| Solar panel | Maximum Power | 410 [W] |
| ) | 41 [V] | |
| ) | 33.93 [V] | |
| −0.29 [%/°C] | ||
| ) | 120 | |
| ) | 10.82 [A] | |
| ) | 10.02 [A] | |
| 0.048 [%/°C] | ||
| ) | 102.209 [Ω] | |
| ) | 0.23233 [Ω] | |
| Diode ideality factor | 0.49595 | |
| PV systems | Solar panels in series | 2 |
| Branches of solar panels in parallel | 3 | |
| Rated voltage | 81 [V] | |
| Rated power | 2.46 [kWp] |
| Element | Characteristics | Value |
|---|---|---|
| MPPT | Incremental Conductance Algorithm | - |
| Buck DC-DC converter | Input-Voltage | 41 [V] |
| Switching frequency | 50 [kHz] | |
| Lmin | 5.1875 [µH] | |
| Voltage ripple | 5% | |
| Capacitor | 826 [µF] | |
| Output-Voltage | 24 [V] |
| Element | Characteristics | Value |
|---|---|---|
| Battery cell | Rated voltage | 12 [V] |
| Rated capacity | 100 [Ah] | |
| Technology | AGM VRLA | |
| Battery pack (ESS) | Rated voltage | 24 [V] |
| Rated capacity | 300 [Ah] | |
| Batteries in series | 2 | |
| Branches of batteries in parallel | 3 | |
| Rated ESS energy | 2.4 [kWh] |
| Time Interval | Power Range | Demand Level |
|---|---|---|
| 01h00–04h00 | 21 W–30 W | LOW (R1) |
| 05h00–06h00 | 23 W–39 W | LOW/MEDIUM (R2) |
| 07h00–17h00 | 39 W–49 W | MEDIUM (R3) |
| 18h00–19h00 | 51 W–92 W | MEDIUM/HIGH (R4) |
| 20h00–22h00 | 82 W–116 W | HIGH (R5) |
| 23h00–24h00 | 51 W–92 W | MEDIUM/HIGH (R4) |
| Type | Variable | Linguistic Representation | Range |
|---|---|---|---|
| Input | SOC | Low | [0, 0, 25, 55] |
| Medium | [25, 55, 85] | ||
| High | [55, 85, 100, 100] | ||
| EP | Positive | [−20, 200] | |
| Negative | [−200, 20] | ||
| Output | EB | Discharge | [0, 0, 40, 60] |
| Charge | [40, 60, 100, 100] | ||
| Input | PUP | High | [40, 60,1 50, 150] |
| Low | [0, 0, 40, 60] | ||
| EP | Positive | [−20, 200] | |
| Negative | [−200, 20] | ||
| EB_r | Connected | [0, 0, 40, 60] | |
| Disconnected | [40, 60, 100, 100] | ||
| Output | ER | Connected | [0, 0, 40, 60] |
| Disconnected | [40, 60, 100, 100] |
| Parameter | Value |
|---|---|
| Type of population | string of 7 bits |
| Population size | 100 |
| Number of generations | 50 |
| Initial population | power range PUP |
| Mutation | 0.07 |
| Power Range [W] | R1 | R2 | R3 | R4 | R5 |
|---|---|---|---|---|---|
| [21–30] | [23–39] | [39–49] | [51–92] | [82–116] | |
| Time [h] | [0–5] | [5–7] | [7–18] | [18–20] | [20–23] |
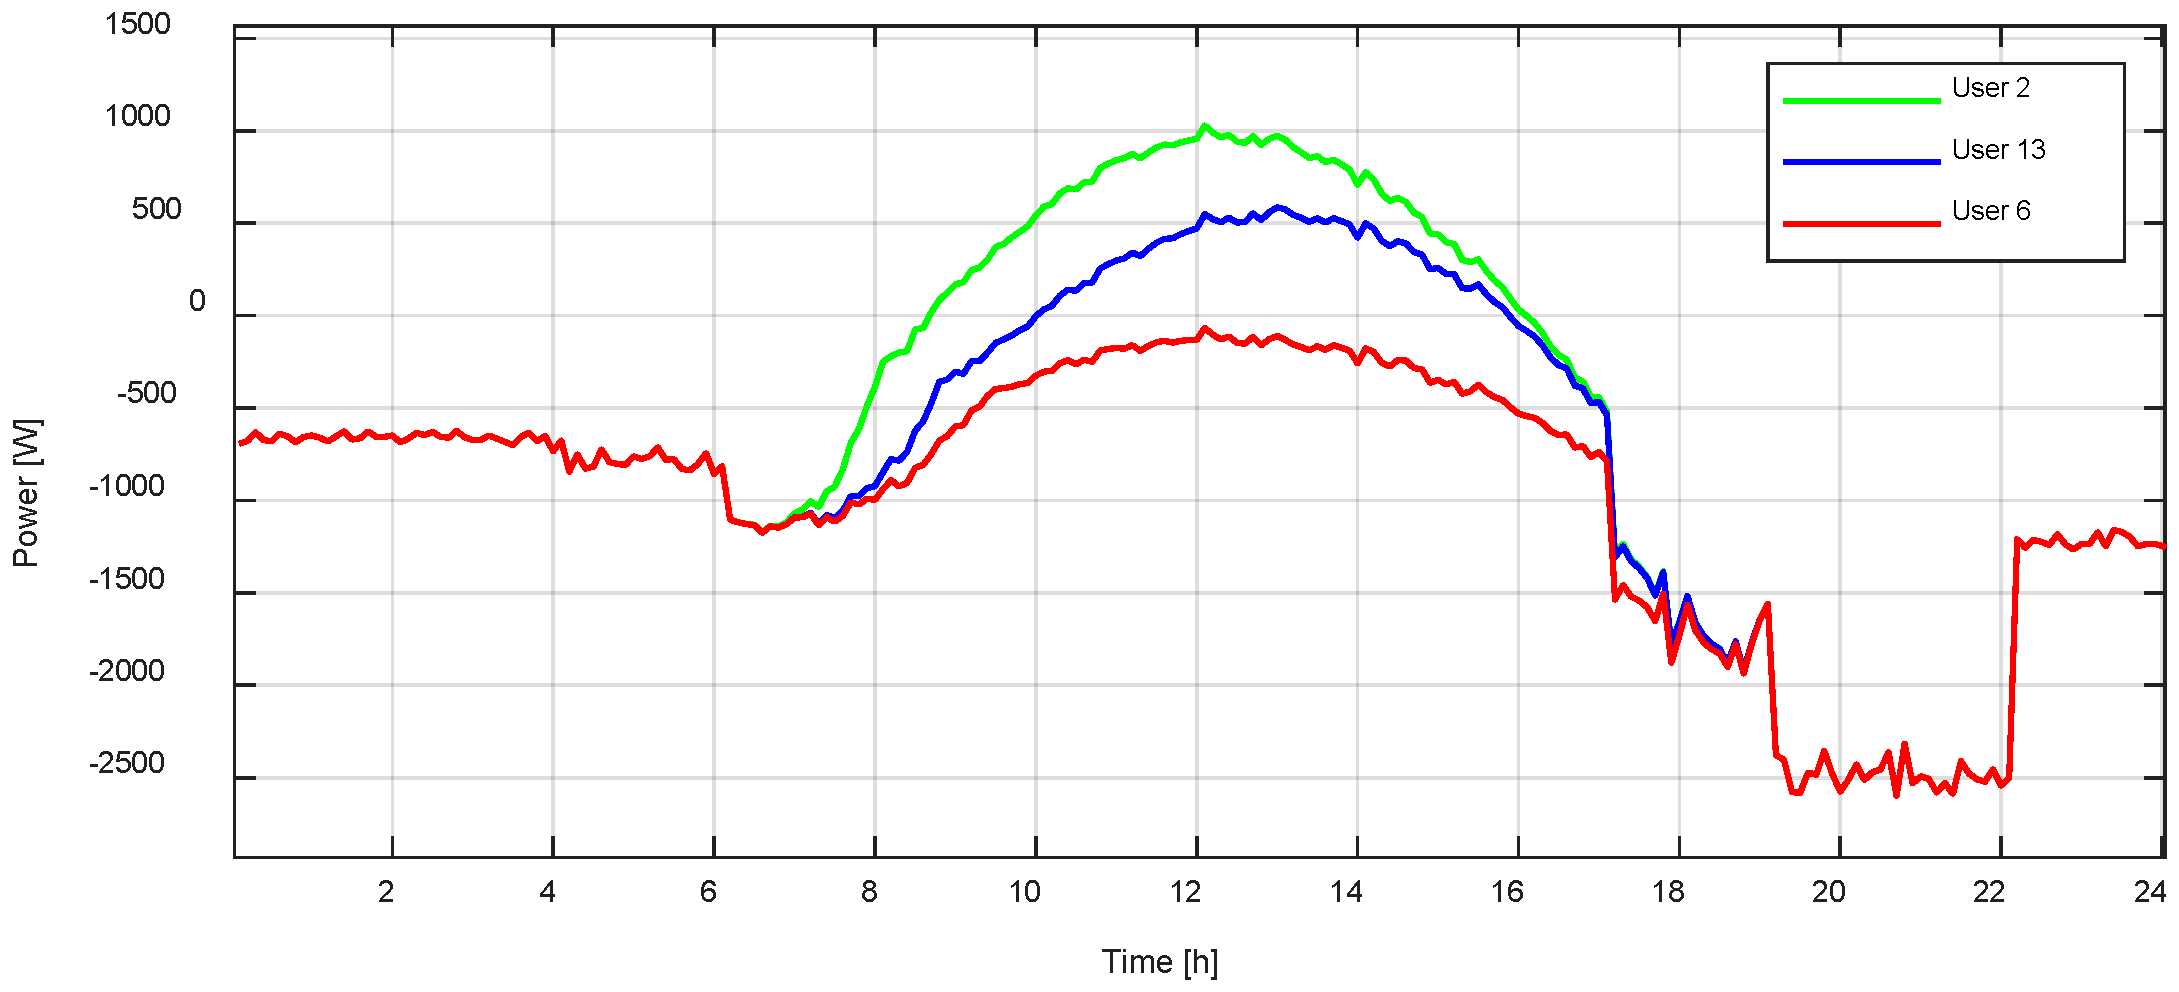
| Parameter | User 2 | User 13 | User 6 |
|---|---|---|---|
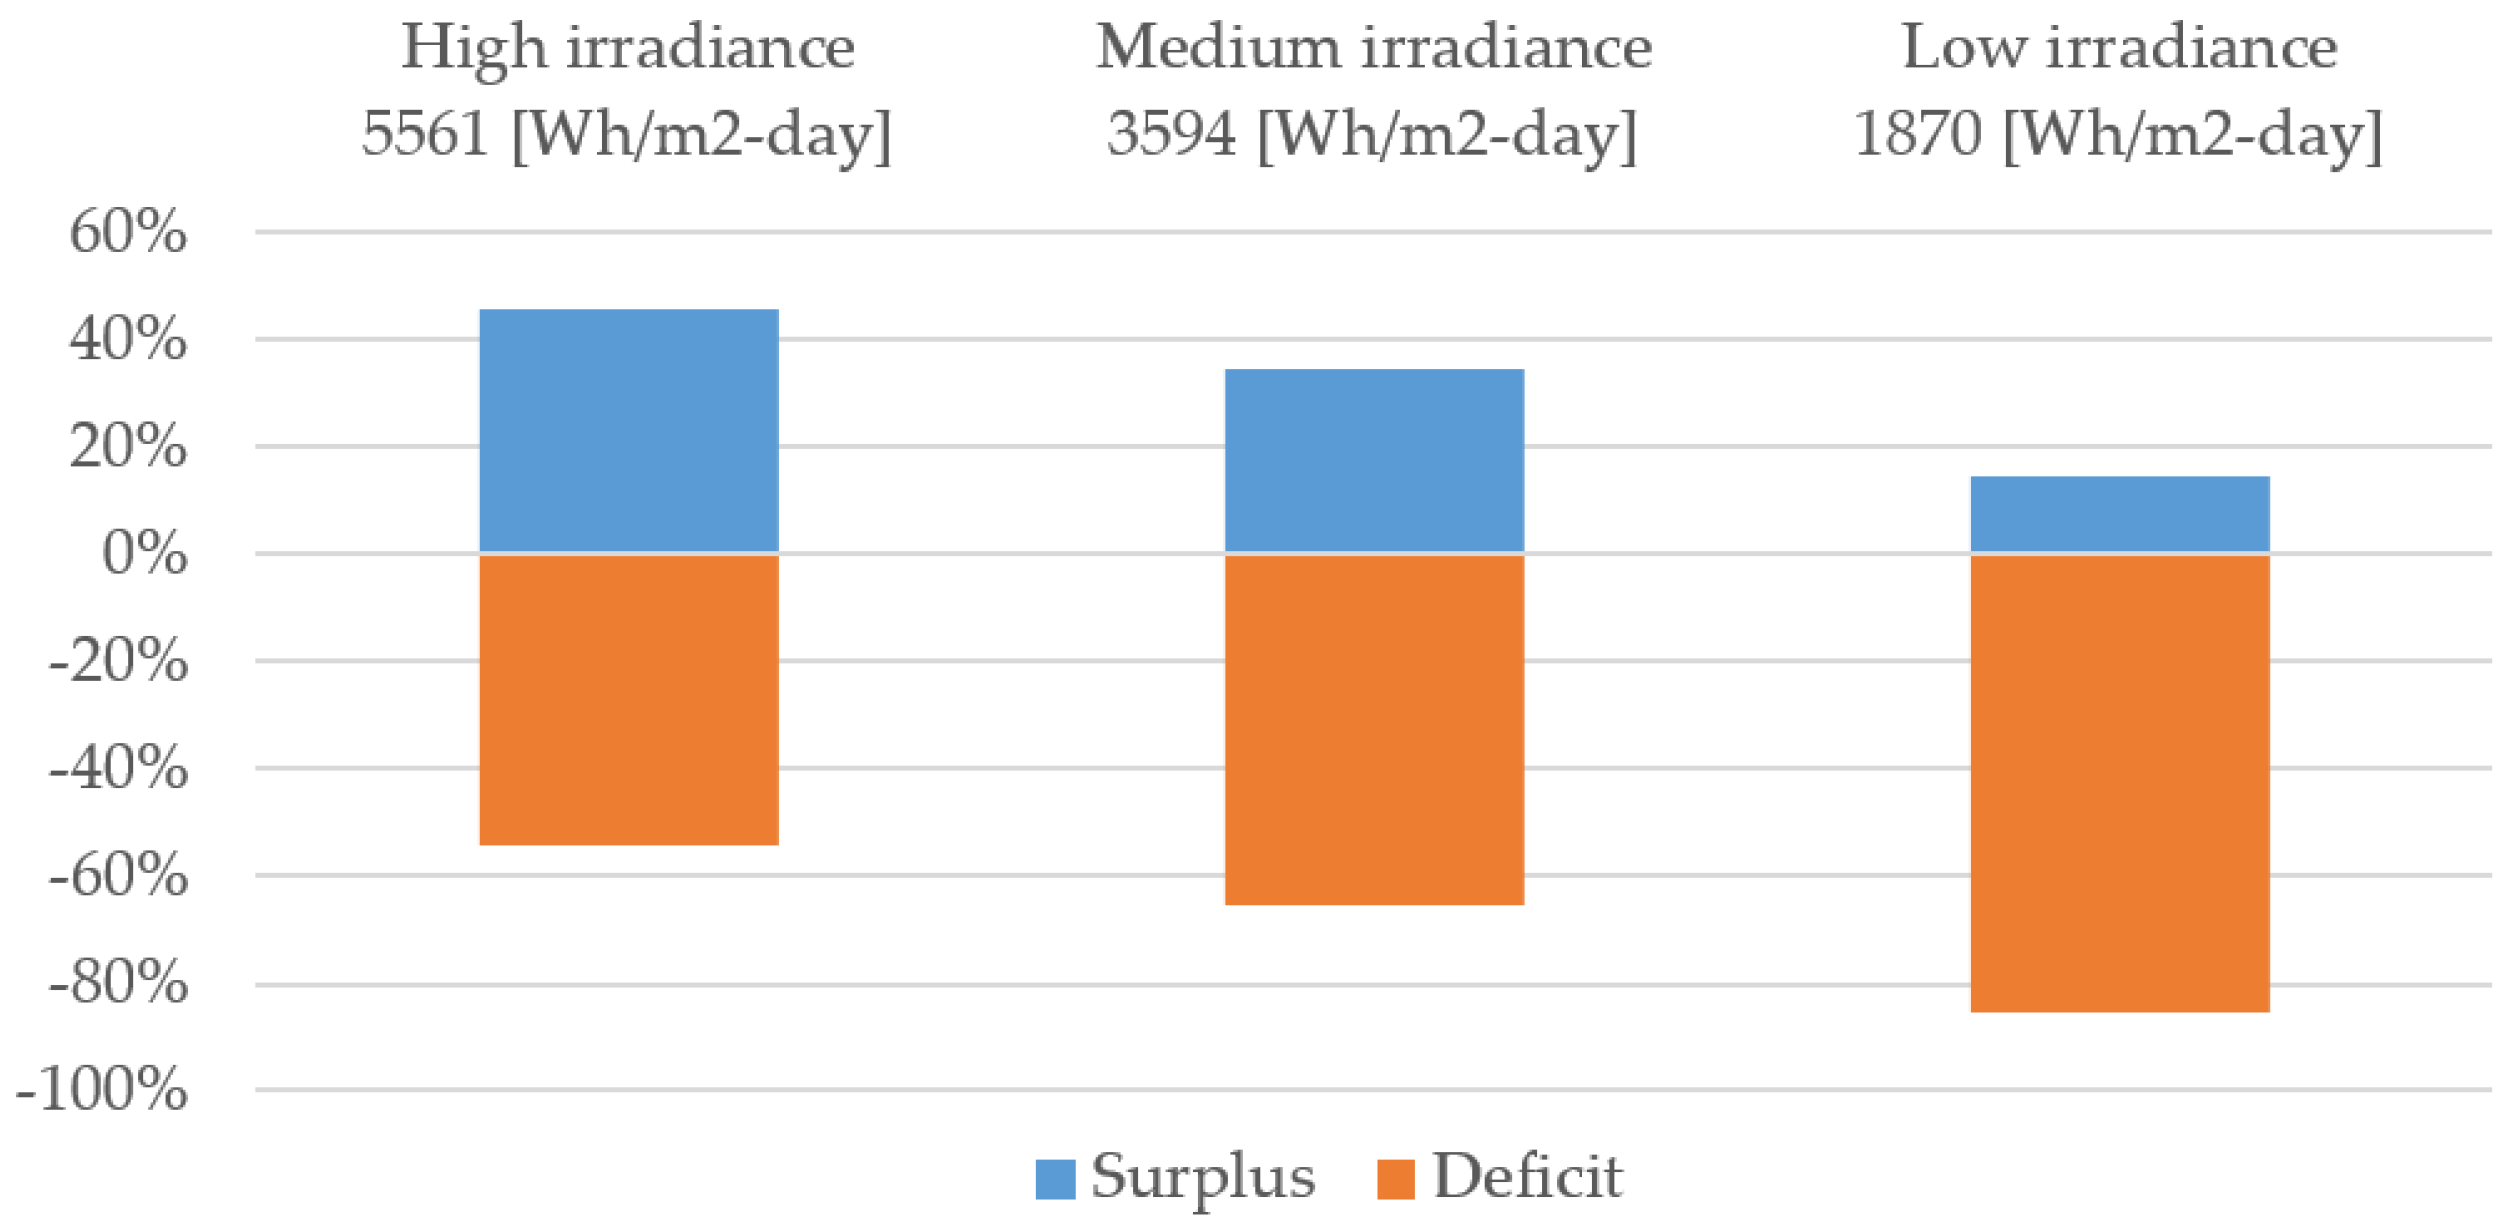
| Irradiance [Wh/m2-day] | 5561 | 3594 | 1870 |
| Initial battery state-of-charge [%] | 40 | 55 | 75 |
| Total Bill Cost [USD/Month] for a Single End-User | Potential Energy [kWh] and Total Bill Cost [USD/month] for a Single End-User in Case of a CEM in the Current Legislation | |||||
|---|---|---|---|---|---|---|
| SOC | Base Cost (without PV System) [USD/Month] | Case Cost (with PV System) [USD/Month] | Reduction in the Electricity Bill [%] (from Base Cost) | Energy Surplus at End of Day (Potential Amount of Energy for Negotiation in the CEM) [kWh]-[USD/Month] | Potential Reduction in the Electricity Bill [%] (from Base Cost) | |
| 40% | 42.92 | 22.83 | 46.81% | 7.02 | 17.48 | 87.54% |
| 55% | 42.92 | 16.77 | 60.93% | 4.59 | 11.43 | 87.55% |
| 75% | 42.92 | 7.02 | 83.64% | 0.67 | 1.67 | 85.23% |
| Total Bill Cost [USD/Month] for a Single End-User | Potential Energy [kWh] and Total Bill Cost [USD/month] for a Single End-User in Case of a CEM in the Current Legislation | |||||
|---|---|---|---|---|---|---|
| SOC | Base Cost (without PV System) [USD/Month] | Case Cost (with PV System) [USD/Month] | Reduction in the Electricity Bill [%] (from Base Cost) | Energy Surplus at End of Day (Potential Amount of Energy for Negotiation in the CEM) [kWh]-[USD/Month] | Potential Reduction in the Electricity Bill [%] (from Base Cost) | |
| 40% | 42.92 | 29.58 | 31.08% | 6.22 | 15.49 | 67.29% |
| 55% | 42.92 | 23.50 | 45.25% | 3.88 | 9.66 | 67.75% |
| 75% | 42.92 | 13.53 | 68.48% | 0 | 13.53 | 68.48% |
| Total Bill Cost [USD/Month] for a Single End-User | Potential Energy [kWh] and Total Bill Cost [USD/Month] for a Single End-User in Case of a CEM in the Current Legislation | |||||
|---|---|---|---|---|---|---|
| SOC | Base Cost (without PV System) [USD/Month] | Case Cost (with PV System) [USD/Month] | Reduction in the Electricity Bill [%] (from Base Cost) | Energy Surplus at End of Day (Potential Amount of Energy for Negotiation in the CEM) [kWh]-[USD/Month] | Potential Reduction in the Electricity Bill [%] (from Base Cost) | |
| 40% | 42.92 | 34.77 | 18.99% | 4.56 | 10.94 | 44.48% |
| 55% | 42.92 | 30.21 | 29.61% | 4.43 | 10.63 | 54.38% |
| 75% | 42.92 | 15.92 | 62.91% | −0.82 | 17.97 | 58.15% |
| Referential Cost for PV Installation | Referential Cost for a Battery-Based ESS | Estimated Total Cost of the System (Investment Cost) |
|---|---|---|
| 1000 [USD/kW] | 300 [USD/kWh] | 3180 [USD] |
| SOC | User 2 | User 13 | User 6 | |||||||||
|---|---|---|---|---|---|---|---|---|---|---|---|---|
| Estimated Monthly Saving [USD/Month] | ROI [Years] | Estimated Monthly Saving [USD/Month] | ROI [Years] | Estimated Monthly Saving [USD/Month] | ROI [Years] | |||||||
| PV | PV + CEM | PV | PV + CEM | PV | PV + CEM | PV | PV + CEM | PV | PV + CEM | PV | PV + CEM | |
| 40% | 20.09 | 25.44 | 13.2 | 10.4 | 13.34 | 27.43 | 19.8 | 9.7 | 8.15 | 31.98 | 32.5 | 8.3 |
| 55% | 26.15 | 31.49 | 10.1 | 8.4 | 19.42 | 33.26 | 13.6 | 7.9 | 12.71 | 32.29 | 20.8 | 8.2 |
| 75% | 35.90 | 41.25 | 7.4 | 6.4 | 29.39 | 29.39 | 9.0 | 9.0 | 27.00 | 24.95 | 9.8 | 10.6 |
Publisher’s Note: MDPI stays neutral with regard to jurisdictional claims in published maps and institutional affiliations. |
© 2022 by the authors. Licensee MDPI, Basel, Switzerland. This article is an open access article distributed under the terms and conditions of the Creative Commons Attribution (CC BY) license (https://creativecommons.org/licenses/by/4.0/).
Share and Cite
Tapia, C.; Ulloa, D.; Pacheco-Cunduri, M.; Hernández-Ambato, J.; Rodríguez-Flores, J.; Herrera-Perez, V. Optimal Fuzzy-Based Energy Management Strategy to Maximize Self-Consumption of PV Systems in the Residential Sector in Ecuador. Energies 2022, 15, 5165. https://doi.org/10.3390/en15145165
Tapia C, Ulloa D, Pacheco-Cunduri M, Hernández-Ambato J, Rodríguez-Flores J, Herrera-Perez V. Optimal Fuzzy-Based Energy Management Strategy to Maximize Self-Consumption of PV Systems in the Residential Sector in Ecuador. Energies. 2022; 15(14):5165. https://doi.org/10.3390/en15145165
Chicago/Turabian StyleTapia, Cristian, Diana Ulloa, Mayra Pacheco-Cunduri, Jorge Hernández-Ambato, Jesús Rodríguez-Flores, and Victor Herrera-Perez. 2022. "Optimal Fuzzy-Based Energy Management Strategy to Maximize Self-Consumption of PV Systems in the Residential Sector in Ecuador" Energies 15, no. 14: 5165. https://doi.org/10.3390/en15145165
APA StyleTapia, C., Ulloa, D., Pacheco-Cunduri, M., Hernández-Ambato, J., Rodríguez-Flores, J., & Herrera-Perez, V. (2022). Optimal Fuzzy-Based Energy Management Strategy to Maximize Self-Consumption of PV Systems in the Residential Sector in Ecuador. Energies, 15(14), 5165. https://doi.org/10.3390/en15145165