Abstract
With the target of carbon peaking and carbon neutrality, renewable energy generation (REG) develops rapidly. The increasing penetration of REG brings along the problems of fluctuation in power flow and the possible abandonment of wind and photovoltaics (PV) generation. In this context, the so-called integrated energy system (IES) becomes a promising solution to the accommodation of REG thanks to energy storage systems and coupling devices inside. In this paper, the optimal operation model of an IES is first presented, with the schemes of green certificate trading and carbon emission right trading included to provide economic incentives for accommodating REG. Next, in order to address the problem of uncertainty in REG, the devices in the IES are divided into three types based on regulation flexibility, and a multi-time period optimal dispatching scheme is proposed, including day-ahead optimal scheduling, rolling optimal dispatching, and real-time control strategy. Finally, it is demonstrated by simulation results of a numerical example that the proposed method not only promotes the accommodation capability for REG but can also cope well with contingencies.
1. Introduction
Under the target of carbon peaking and carbon neutrality, the development of renewable energy generation (REG) advances rapidly. It is anticipated that renewable capacity will expand by over 1800 GW, or over 60%, by 2026, among which China ranks the first, accounting for 43% of global growth [1]. However, the output of REG units, such as photovoltaics and wind farms, depends heavily on the meteorological condition, which is hard to predict accurately. The intermittency in REG and the difference between the generation prediction and the actual output may disrupt the supply–demand balance of a power system, bringing along fluctuations in power flow. Then, if the operation plan of the power system is not adjusted accordingly and timely, the REG may not be accommodated by the power system, and hence some wind and solar generation has to be curtailed. On the other hand, if the power output from REG is insufficient, power shortage may occur. Both cases have to be properly addressed so as to promote the development of REG [2,3]. In this context, the integrated energy system (IES), with the energy storage systems and coupling devices inside, becomes a promising solution to the increasing penetration of REG [4,5]. When there is excessive REG, the IES can store the electricity or convert it into other kinds of energy such as heat and cold; when there is insufficient REG output, the IES can still meet the users’ load demand with other energy sources, such as natural gas.
Many publications are available regarding the modeling, planning, operation, and assessment of an IES. In [6,7,8], the notions of the so-called Energy Hub and Energy Internet are introduced, and the general modeling and simulation approaches of the IES are reviewed. Some research is devoted to extending the scope of the IES, incorporating Power-to-Gas (P2G) devices and dynamic pipeline networks [9], energy storage systems in buildings [10], demand response of users [11], or distributed generators [12] into the optimal dispatching model, and proves that the extended IES is more robust and economic under multi-energy flow scenarios. Some research focuses on promoting the accommodation of REG. In [13], a weighting factor is introduced to balance the minimization of grid operation cost and REG curtailment. In [14], the hybrid multi-objective particle swarm optimization (HMOPSO) method is adopted to minimize economic cost, maximize REG utilization, and minimize expected energy not supplied (EENS) at the same time. In [15], the cost of REG curtailment caused by flexibility shortage of conventional generators is included in the objective function. However, the above optimal dispatching models cannot provide direct economic incentives for IES operators to maximally accommodate REG and reduce carbon emission. The market mechanisms of tradable green certificates (TGCs) [16,17,18] and carbon emission right trading [19,20,21] are designed to address this problem, but little research on the optimal operation of the IES has been conducted with both trading schemes considered.
To cope with uncertainties in IES operation, there are mainly two approaches. One is to mathematically characterize the uncertainty in the optimization model with chance-constrained programming [22], stochastic differential equations [23], stochastic programming [24], and so on. Another branch is the multi-time scale control scheme, because the smaller the time scale is, the more accurate the prediction could be. A two-stage scheduling strategy is proposed in [25], where the rolling optimization aims at minimizing the operation cost and startup/shutdown penalty under the time of use tariff mechanism to formulate the large time-scale schedule, and the dynamic adjustment stage deals with the small time-scale uncertainties of REG and loads. In [26], a day-ahead scheduling model and an intraday scheduling model are first presented, and the intraday model is then divided into three sub-layers of slow control, intermediate control, and fast control to perform rolling optimization.
In general, the existing research on the optimal dispatch of an IES mainly focuses on the economy and reliability, and there are relatively few studies on promoting REG accommodation with market mechanisms. Additionally, the current studies on multi-time scale control schemes mainly present a framework with control strategies of different time scales for the whole IES, but few of them study the flexibility characteristics of devices and formulate different control strategies for different devices. Therefore, the major contributions of our work are as follows:
- (1)
- The TGC trading scheme and carbon trading scheme are incorporated into the modeling of the IES operation so as to provide economic incentives for promoting REG accommodation as well as to quantify the REG accommodation.
- (2)
- Based on the ramping characteristics, the devices in the IES are classified into three types to participate in different stages of the operation optimization with different margins, allowing full play to the IES’s flexibility.
- (3)
- A multi-time period optimal dispatch scheme of an IES is presented to address the correction in REG output prediction, dividing the operation planning of the IES into day-ahead optimal scheduling, rolling optimal dispatching, and real-time control.
- (4)
- The effects of each stage in the proposed dispatch strategy are compared and analyzed under normal operation and emergency, respectively, providing useful guidance for further study in the IES control strategy formulation.
The rest of this paper is organized as follows. In Section 2, the optimal operation model of an IES with schemes of TGCs and carbon trading is established. In Section 3, devices in the IES are categorized into three types based on flexibility, and a multi-time period optimal dispatching scheme is presented. In Section 4, a numerical example is employed to demonstrate the presented method and the results are analyzed. Finally, in Section 5, concluding remarks are given.
2. Modeling of Integrated Energy Systems
2.1. Components
An IES, also known as an Energy Internet, is a comprehensive energy production, supply, and marketing unit. Various devices for the production, conversion, storage, and transmission of electricity, gas, heat, and cold energy coordinates with each other to provide integrated energy services. Different structures of IESs are designed for different regions with different load conditions, and the structure of the IES studied in this paper is shown in Figure 1, in which the photovoltaics are chosen as representative REG units.

Figure 1.
Structure of a sample IES.
As shown in Figure 1, the IES interacts with the power grid and natural gas network, and supplies electric load, gas load, heating load, and cooling load to users. There are mainly two kinds of devices: standalone devices for the production and storage of a single type of energy and coupling devices that involve the conversion of different types of energy. In the IES to be studied below, standalone devices include photovoltaic generators (pv), electric storage (es), heat storage (hs), and cold storage (cs); coupling devices include gas turbine (gas–electricity, ge), gas boiler (gas–heat, gh), electric boiler (electricity–heat, eh), electric chiller (electricity–cold, ec), absorption chiller (heat–cold, hc), and waste heat boiler (heat–heat, whb). It is worth noting that the waste heat boiler is used to collect the heat in flue gases from the combustion of the gas turbine to generate hot water or steam, allowing the subsequent use of heat energy. The waste heat boiler, together with the gas turbine and absorption chiller, comprises the Combined Cooling, Heating, and Power (CCHP) unit, which can supply electricity, heat, and cold energy at the same time.
2.2. Constraints
2.2.1. Capacity
First of all, each device in the IES is bounded by the capacity constraint in (1), where represents the output of each device as well as the power transmitted through the power grid and natural gas network at time , represents the state of charge of each storage device at time , , , , and are the corresponding lower bounds and upper bounds. Note that for conventional devices, the upper bound is determined by the installed capacity, while for the photovoltaic generators, the output is also bounded by the solar condition.
2.2.2. Conversion
The coupling device takes one type of energy as input and produces another type of energy, following the power conversion constraints defined in (2), where is the conversion efficiency of each coupling device, and are the corresponding output and input at time .
There is also auxiliary power consumption in the IES. For example, some devices may use a water pump during operation. The auxiliary power is calculated in (3), where is the output and is the corresponding coefficient.
2.2.3. Storage
The energy storing and releasing process of the storage system is described by (4), where , , and are respectively the state of charge, charging power, and discharging power at time ; , , and are respectively the loss coefficient, charging efficiency, and discharging efficiency of the device.
To ensure the operation of the IES on the next day and assuming that each day is identical, the storage system needs to restore the initial capacity at the end of each day, as shown in (5).
Considering that an energy storage system cannot be charging and discharging at the same time, constraint in (6) needs to be enforced.
However, (6) is a quadratic constraint which introduces nonlinearity into the optimization model. By introducing two binary indicators of the storage status, and , (6) can be converted into a set of linear constraints as in (7). When the storage device is storing energy (charging), and ; when the storage device is releasing energy (discharging), and .
2.2.4. Conservation
The energy conservation constraints of an IES include electricity, gas, heat, and cold, as shown in (8):
where and are respectively the electricity and natural gas purchased from the external energy network at time ; , , , and are respectively the electricity, gas, heating, and cooling load at time ; is the output of photovoltaics at time ; , , and are respectively the discharging power of electric storage, heat storage, and cold storage at time ; , , and are respectively the charging power of electric storage, heat storage, and cold storage at time ; and are respectively the gas consumed and electricity produced by the gas turbine at time ; and are respectively the electricity consumed and heat produced by the electric boiler at time ; and are respectively the electricity consumed and cold produced by the electric chiller at time ; is the auxiliary power consumption at time ; and are respectively the gas consumed and heat produced by the gas boiler at time ; is the cold output of the absorption chiller at time ; is the heat output of the waste heat boiler at time .
Specifically, the input of the absorption chiller and waste heat boiler comes from the waste heat generated by the gas turbine:
where is the heat input of the absorption chiller at time ; is the heat input of the waste heat boiler at time ; is the waste heat coefficient of the gas turbine.
2.3. Objective Function
To promote the economy and environmental friendliness of the IES, in addition to the external energy cost and the operation cost , the cost of tradable green certificates and carbon emission trading are also included in the objective function of optimal dispatching:
2.3.1. External Energy
As shown in Figure 1, the expenses of external energy include the costs of purchasing natural gas from the gas network and purchasing electricity from the grid as in (11), where and are respectively the price of buying natural gas and electricity at time .
2.3.2. Operation and Maintenance
The operation and maintenance cost is defined in (12), where is the unit output energy cost of device .
2.3.3. Tradable Green Certificate
The TGC is a market-based cost-efficient tool to regulate the deployment of renewable energy. The TGC cost model can be expressed as a piecewise function with three stages as shown in (13) [27]. Firstly, if the actual accommodated REG ratio is greater than the specified quota ratio, the IES is profitable by selling the REG power, which is reflected in the model as selling TGCs. Secondly, if the actual accommodated REG ratio is smaller than the specified quota ratio, but still within the penalty margin, the gap needs to be filled by purchasing TGCs. Thirdly, if the actual REG is woefully inadequate and exceeds the penalty margin, the IES not only needs to purchase TGCs but will also be penalized heavily.
where , , and are respectively the specified REG ratio, actual REG ratio, and the penalty margin; and are respectively the price of the TGC and the penalty; , , and are respectively the total generation output, accommodated photovoltaic output, and electricity purchased from the grid at time . The specified ratio is usually no less than 15% [28].
2.3.4. Carbon Emission Right
Similar to the mechanism of the TGC but targeting the carbon emission, the IES can gain profits if the carbon emission is smaller than the allocated quota, and may need to purchase carbon emission rights if the actual emission is larger than the quota [29], as shown in (14), where is the price of carbon emission rights, is the carbon emission quota of the system at time , and is the actual emission.
The allocated emission quota is calculated in (15), which is proportional to the electric load. The actual carbon emission of the system is calculated in (16), i.e., each carbon emission source contributes proportionally to its output. In our optimization model, the carbon emission mainly comes from the purchased electricity , the CCHP unit (the gas turbine (ge), waste heat boiler (whb), and the absorption chiller (hc)) , and the gas boiler . For the purchased electricity from the grid, the carbon emission quota is proportional to its quantity; for the CCHP unit, the emission quota is calculated based on the equivalent electricity generation; for the gas boiler (gh), the quota is proportional to its heat supply.
3. Multi-Time Period Optimal Dispatching Strategy
3.1. Multi-Time Period Optimal Dispatching Scheme
In view of the intermittency and uncertainty of REG such as photovoltaics, its output prediction is of high difficulty, making the single day-ahead scheduling method far from meeting the economic, technical, and environmental needs of the IES. However, the shorter the prediction period, the more accurate the prediction result. Therefore, in the following section, a multi-time period optimal dispatching scheme is proposed, dividing the operation of the IES into three stages, as shown in Figure 2. Firstly, the day-ahead scheduling plan of the IES is determined based on the day-ahead prediction of REG output and load demands, which is an hourly plan. Secondly, with more information during the operation day, a rolling prediction of REG output and load demands with higher precision can be obtained, and the dispatching of the IES is updated, which is at the hour or minute level. Finally, in case of an emergency, a real-time control strategy will respond in minutes or seconds to ensure the secure and economic operation of the IES.

Figure 2.
Multi-time period optimal dispatching scheme.
Based on the response time and ramping characteristics, the devices in the IES are classified into three types to participate in the dispatching schemes of different time scales, as shown in Table 1. Since the operation of the IES is based on the day-ahead scheduling, the type A device mainly includes the base-load units that are not suitable for frequent start-stop or power adjustment, and will operate with a low margin during day-ahead scheduling. The type B device includes some flexible units such as the gas turbine. It participates in day-ahead scheduling with a high margin and participates in rolling optimization with a low margin. Furthermore, some devices with strong flexibility such as the electricity storage units are selected as type C devices to deal with emergencies, participating in day-ahead scheduling and rolling dispatching with a high margin, and participating in real-time control with a low margin. The external energy network is adjustable in all scales of dispatching schemes to ensure energy balance.

Table 1.
Different types of devices.
3.2. Day-Ahead Optimal Scheduling
The day-ahead scheduling plan of the IES is based on the day-ahead prediction of energy supply and load demands. The steps are shown in Figure 3 and are listed as follows.
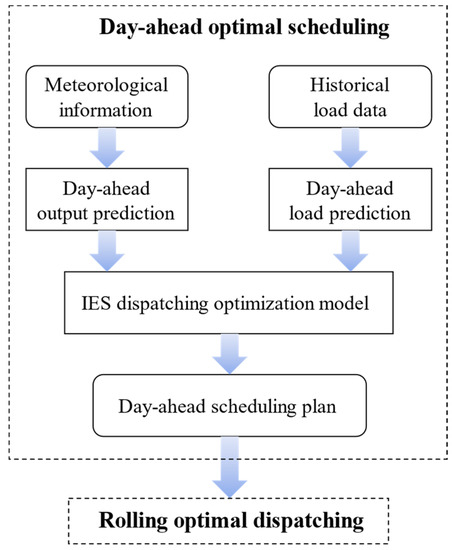
Figure 3.
Illustration of day-ahead optimal scheduling.
- Collect historical load data and predict the demand curve of electricity, gas, heat, and cold of the next day.
- Collect meteorological information and predict the REG output.
- Add margin constraints for type A, B, and C device into the optimization model described in Section 2 and feed in the source and load data above.
- Obtain a day-ahead scheduling plan of the IES.
3.3. Rolling Optimal Dispatching
Due to the uncertainty of REG output, the scheduling plan formulated above may not satisfy the power balance. When the actual generation output is less than prediction and there is a power shortage, it is necessary to purchase electricity from the external grid with a high price; when the actual generation output is greater than prediction and there is a power redundancy, there will be “abandonment of wind and light”. For the prediction of REG output, the closer the time is, the higher the accuracy. Therefore, based on the rolling prediction of REG output, the dispatching plan of the IES can be revised on the time scale of hours or minutes. The steps are shown in Figure 4 and are listed as follows.
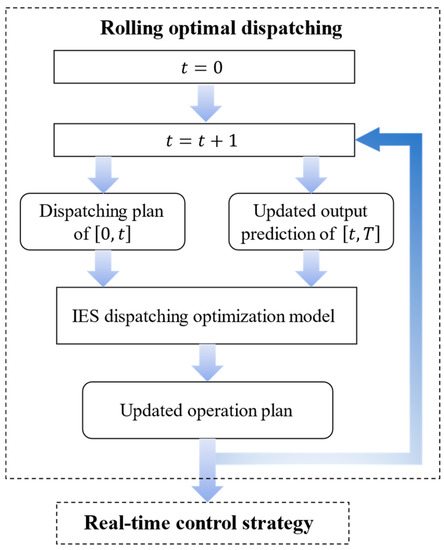
Figure 4.
Illustration of rolling optimal dispatching.
- At time update the REG output prediction and load prediction of based on the data of .
- Type A devices do not participate in the rolling dispatching, so fix its output to the day-ahead scheduling plan.
- Add margin constraints for type B and C devices into the optimization model and feed in the updated source and load data.
- Obtain an updated operation plan of the IES and dispatch accordingly in .
- Increment and repeat steps 1 to 4.
3.4. Real-Time Control Strategy
The IES should also be capable of dealing the emergencies such as a sudden drop in energy supply, sudden increase in load demands, or failures of devices. The integration of the IES with renewable generators, energy conversion devices, energy storage systems, and energy networks can strengthen the coupling relationship between the power system, natural gas system, and thermal system through the internal complementary multi-energy flow, providing robust energy services and improving energy utilization efficiency. In the case when the change is too sudden to be predicted, if the system still operates under the day-ahead and rolling plan, the economic and environmental benefits will be affected. Therefore, taking the sudden change in REG output as an example, a real-time control strategy to respond to emergencies is proposed, as shown in Figure 5.
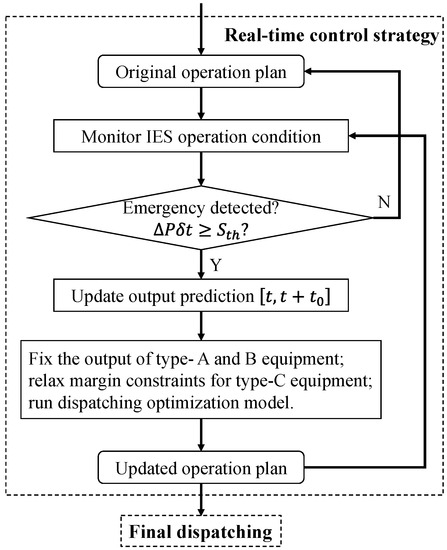
Figure 5.
Illustration of real-time control strategy.
- At time , determine whether to respond to the emergency by comparing the output change to the threshold . If the output change is greater than the threshold, a real-time control scheme will be generated, correcting the operation curve of the IES on the time scale of minutes or seconds.
- Update the prediction of emergency during .
- Type A and B devices do not participate in the real-time control, so fix its output to the rolling dispatching plan.
- Add margin constraints for type C devices into the optimization model and feed in the updated source and load data.
- Obtain an optimal operation plan and control the IES accordingly in .
- Increment and repeat steps 1 to 5.
- When the emergency is over, the IES returns to the original dispatching plan.
4. Numerical Results
4.1. Settings of the Example
The energy consumption data in a representative summer day of a residential area and the operation parameters of an IES are employed to illustrate the proposed multi-time period optimal dispatching scheme. The electricity load demand and the cooling load demand are shown in Figure 6, the time-of-day tariff is shown in Figure 7, the device parameters of the IES are shown in Table 2, the economic parameters are shown in Table 3, and the margin parameters of the proposed control strategy are shown in Table 4.
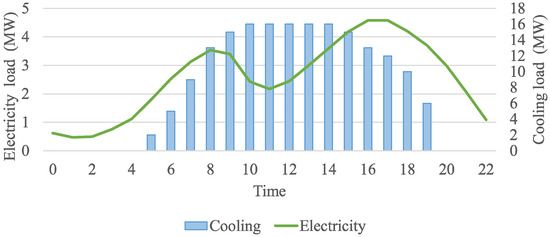
Figure 6.
Load demand profiles of the example.
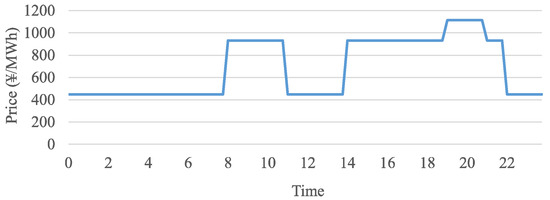
Figure 7.
Electricity price of the example.
Table 2.
Device parameters.
Table 3.
Economic parameters.
Table 4.
Margin parameters.
4.2. Dispatching Results in Normal Operation
The day-ahead prediction, rolling prediction, and actual photovoltaic output of a representative summer day are shown in Figure 8. The day-ahead prediction is a smooth curve with a peak at noon, but due to the meteorological uncertainties during the day, the actual output varies a lot from the day-ahead prediction. With the intraday information, the rolling prediction is much closer to the actual output.
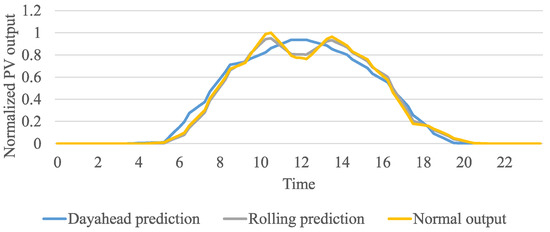
Figure 8.
Photovoltaic output in normal operation.
Economic results of the IES are listed in Table 5, from which we can see that, in terms of the total cost, the dispatching strategy of only day-ahead scheduling leads to the most expensive outcome, the dispatching strategy of day-ahead scheduling together with rolling optimization results in the outcome with much less costs, and the proposed three-stage control scheme produces the most economic outcome. The reduction in total cost mainly comes from the reduction in purchasing electricity from the power grid. Too much cost spent on purchasing electricity indicates that there is a large gap between the supply and demand of the IES, which is not only an economic burden but may also hinder the security and stability of power system operation. When the IES operates according to the day-ahead scheduling plan only, any variation of the PV generation output from the day-ahead prediction has to be compensated by the external power grid, hence there is a large expense in buying electricity from the power grid. When the IES operates with rolling optimization, the output prediction is updated throughout the day and the dispatching of the IES can be adjusted accordingly and continually, hence the purchased electricity from the external grid is much less, and the grid cost is dropped by 82%. When real-time control is further incorporated, the IES can respond much more timely and effectively to the output fluctuation with the help of the energy coupling and storage devices inside, further reducing the grid cost by 33%.
Table 5.
Operation Results in Normal Operation.
The costs of TGC trading and carbon trading also vary significantly between “day-ahead” and “day-ahead + rolling”, which can reflect the relationship between the generation outputs of REG units and conventional generators. The more the REG is dispatched, the smaller the TGC cost (larger income) would be; the more the generation outputs from conventional generators such as gas turbines are, the larger the carbon trading cost (less income) would be. For further examination, the detailed dispatching results of the IES for “day-ahead” and for “day-ahead + rolling” are demonstrated in Figure 9, and the corresponding PV generation dispatching results are shown in Figure 10. When the IES operates according to the day-ahead scheduling plan only, all types (A, B, and C) of devices follow the day-ahead hourly schedule, so the PV generation output cannot be fully dispatched even if there is more power output available, resulting in abandonment of PV generation. When the IES operates with rolling optimization, the operation of type B and C devices can be adjusted with rolling updates of PV generation output prediction. As a result, the generation outputs of gas turbine and electric storage systems are reduced when there is more PV generation output available, and are increased when the PV generation output drops, hence reducing the abandonment of PV generation as well as the purchasing cost from the power grid.
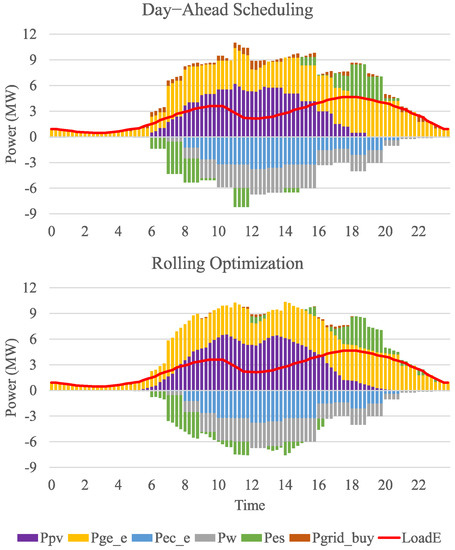
Figure 9.
Detailed dispatching results of the IES in normal operation.
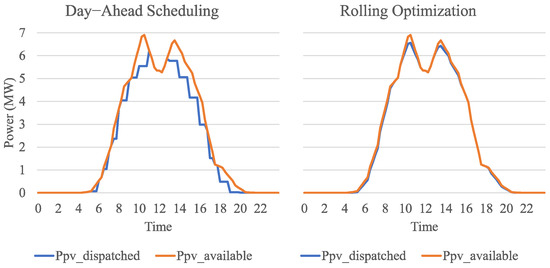
Figure 10.
PV dispatching results in normal operation.
4.3. Dispatching Results in Emergency
The photovoltaic outputs in normal operation and emergency are shown in Figure 11, from which we can see that due to some situations, the photovoltaic output suddenly drops at around 9:00.
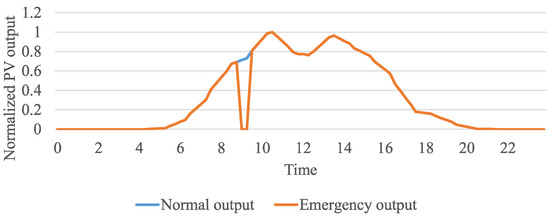
Figure 11.
Photovoltaic output in emergency.
Economic results of the IES are shown in Table 6, and the dispatching results for “day-ahead + rolling” and for “day-ahead + rolling + real-time” are demonstrated in Figure 12. It can be seen from Table 6 that the change in grid cost dominates. Comparing the day-ahead scheduling and rolling optimization, though in both schemes a certain amount of electricity has to be bought from the power grid in response to the emergency, rolling optimization needs less external electricity during normal hours, so its grid cost decreases by 54% compared to day-ahead scheduling. In the real-time control scheme, thanks to the flexibility of the type C devices, the power gap is quickly filled by discharging electric storage units, hence the grid cost is further reduced by 64%.
Table 6.
Operation Results in Emergency.
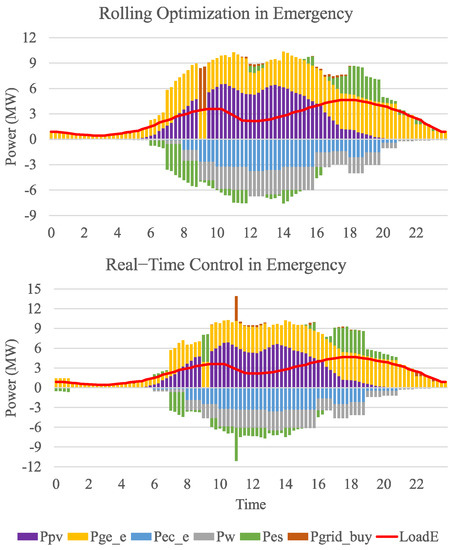
Figure 12.
Detailed dispatching results of the IES in emergency.
To see the advantage of the proposed multi-time period dispatching strategy, it can be seen from Figure 12 that the sudden drop of PV generation output results in a huge power gap. In the “day-ahead + rolling” scheme, the gap is filled by purchasing a large amount of external electricity from the power grid, which not only results in a large cost but may also lead to the violation of the transmission capacity. In the “day-ahead + rolling + real-time” scheme, the electric storage unit releases power to respond to the accident, and the IES buys electricity from the power grid later at noon when the electricity price is low to charge the storage unit, hence reducing grid cost and minimizing the risk of cascading faults.
5. Conclusions
As a comprehensive energy service provider with various energy coupling and storage devices, the IES is a feasible solution to accommodate the fluctuant REG output. In this paper, the operation model of the IES is first presented, and the schemes of TGC trading and carbon trading are incorporated. Secondly, a multi-time period optimal dispatching scheme is proposed, and the devices in the IES are classified into three types according to their flexibility to participate in different scales of the scheme. Finally, the performance of the presented dispatching scheme is demonstrated with a numerical example, and simulations of the IES operation are carried out under normal operation and emergency respectively. The results show that, firstly, the day-ahead scheduling drafts a plan for the IES operation, then the rolling optimization refines the plan with the updated prediction during the day, and finally the real-time control responds to the unpredicted conditions with the flexible electric storage devices. The results demonstrate that the proposed IES model, together with the multi-time period optimal dispatching scheme, can not only promote the accommodation of renewable energy but can also cope with contingencies smoothly.
Author Contributions
Conceptualization, C.Y., X.L., F.C., C.J., Y.S., L.Z. and F.W.; methodology, X.L., C.J. and F.W.; software, X.L. and C.J.; validation, X.L. and C.J.; formal analysis, X.L. and C.J.; investigation, C.Y., F.C., Y.S. and L.Z.; resources, C.Y., F.C. and Y.S.; data curation, C.Y. and L.Z.; writing—original draft preparation, X.L. and C.J.; writing—review and editing, X.L., F.W. and D.Q.; visualization, X.L. and C.J.; supervision, C.Y. and F.W.; project administration, C.Y. and F.W.; funding acquisition, F.W. and D.Q. All authors have read and agreed to the published version of the manuscript.
Funding
This work was funded by a Science and Technology Project from the State Grid Zhejiang Electric Power Company Ltd. (5211JY200001).
Institutional Review Board Statement
Not applicable.
Informed Consent Statement
Not applicable.
Data Availability Statement
The data involved in this paper are presented in Section 4.1.
Conflicts of Interest
The authors declare no conflict of interest.
Nomenclature
| A. Acronym | |
| CCHP | Combined heating: cooling and power |
| IES | Integrated energy system |
| REG | Renewable energy generation |
| SOC | State of charge |
| TGC | Tradable green certificate |
| cs | Cold storage unit |
| ec | Electricity–cold coupling device, electric chiller |
| eh | Electricity–heat coupling device, electric boiler |
| es | Electric storage unit |
| ge | Gas–electricity coupling device, gas turbine |
| gh | Gas–heat coupling device, gas boiler |
| hc | Heat–cold coupling device, absorption chiller |
| hs | Heat storage unit |
| pv | Photovoltaics |
| whb | Waste heat boiler |
| B. Indices and set | |
| i | Index of devices |
| t | Index of time slots |
| T | The maximum time index |
| Time step | |
| C. Parameters | |
| Auxiliary power ratio of device i | |
| Waste heat ratio of gas turbine | |
| Cooling load at time t | |
| Electricity load at time t | |
| Gas load at time t | |
| Heating load at time t | |
| Lower/upper bound of the power output of device i | |
| Lower/upper bound of the state of charge of storage device i | |
| Conversion efficiency of energy coupling device i | |
| Charging/discharging efficiency of energy storage device i | |
| Carbon emission coefficient of CCHP unit | |
| Carbon emission coefficient of gas boiler | |
| Carbon emission coefficient of grid purchased electricity | |
| Carbon emission coefficient of electric load | |
| Price of carbon emission rights | |
| Price of buying gas at time t | |
| Price of buying electricity at time t | |
| Price of operation and maintenance of device i | |
| Price of green certificates | |
| Self-dissipation coefficient of energy storage device i | |
| D. Variables | |
| Cost of external energy purchase | |
| Cost in trading carbon emission rights | |
| Cost of operation and maintenance | |
| Cost in trading green certificates | |
| Quota of carbon emission of the system at time t | |
| Actual carbon emission of the system at time t | |
| Carbon emission from CCHP unit at time t | |
| Carbon emission from gas boiler at time t | |
| Carbon emission from purchased electricity at time t | |
| Charging/discharging power of cold storage at time t | |
| Power of electricity consumed/cold produced of electric chiller at time t | |
| Power of electricity consumed/heat produced of electric boiler at time t | |
| Charging/discharging power of electric storage at time t | |
| Power of gas purchased at time t | |
| Power of gas consumed/electricity produced of gas turbine at time t | |
| Power of gas consumed/heat produced of gas boiler at time t | |
| Power of electricity purchased at time t | |
| Power of heat consumed/cold produced of absorption chiller at time t | |
| Charging/discharging power of heat storage at time t | |
| Power output of device i at time t | |
| Output/input of energy coupling device i at time t | |
| Charging/discharging power of energy storage device i at time t | |
| Output of photovoltaics at time t | |
| Auxiliary power at time t | |
| Power of input/output of waste heat boiler at time t | |
| State of charge of storage device i at time t | |
References
- IEA. Renewables 2021—Analysis and Forecast to 2026; IEA: Paris, France, 2021; p. 175. [Google Scholar]
- Pan, E.; Song, Y.; Yuan, K.; Guo, Y.; Cheng, H.; Zhang, S. Review and Prospect of Integrated Energy System Planning Considering the Integration of Renewable Energy. Electr. Power Constr. 2020, 41, 1–13. [Google Scholar]
- Asiaban, S.; Kayedpour, N.; Samani, A.E.; Bozalakov, D.; De Kooning, J.D.M.; Crevecoeur, G.; Vandevelde, L. Wind and Solar Intermittency and the Associated Integration Challenges: A Comprehensive Review Including the Status in the Belgian Power System. Energies 2021, 14, 2630. [Google Scholar] [CrossRef]
- Yang, J.; Zhang, N.; Wang, Y.; Kang, C. Multi-Energy System Towards Renewable Energy Accommodation: Review and Prospect. Autom. Electr. Power Syst. 2018, 42, 11–24. [Google Scholar]
- Zhu, J.; Xie, P.; Xuan, P.; Zou, J.; Yu, P. Renewable Energy Consumption Technology under Energy Internet Environment. In Proceedings of the 2017 IEEE Conference on Energy Internet and Energy System Integration (EI2), Beijing, China, 26–28 November 2017; pp. 1–5. [Google Scholar]
- Yu, X.; Xu, X.; Chen, S.; Wu, J.; Jia, H. A Brief Review to Integrated Energy System and Energy Internet. Trans. China Electrotech. Soc. 2016, 31, 1–13. [Google Scholar] [CrossRef]
- Zeng, M.; Liu, Y.; Zhou, P.; Wang, Y.; Hou, M. Review and Prospects of Integrated Energy System Modeling and Benefit Evaluation. Power Syst. Technol. 2018, 42, 1697–1708. [Google Scholar] [CrossRef]
- Aljabery, A.A.M.; Mehrjerdi, H.; Mahdavi, S.; Hemmati, R. Multi Carrier Energy Systems and Energy Hubs: Comprehensive Review, Survey and Recommendations. Int. J. Hydrogen Energy 2021, 46, 23795–23814. [Google Scholar] [CrossRef]
- Zhang, Z.; Wang, C.; Lv, H.; Liu, F.; Sheng, H.; Yang, M. Day-Ahead Optimal Dispatch for Integrated Energy System Considering Power-to-Gas and Dynamic Pipeline Networks. IEEE Trans. Ind. Appl. 2021, 57, 3317–3328. [Google Scholar] [CrossRef]
- He, X.; Gu, Y.; Zhao, Z.; Yu, Z.; Lu, S. Optimal scheduling of integrated energy system considering building energy storage. Electr. Meas. Instrum. 2021, 58, 1–8. [Google Scholar] [CrossRef]
- Kaluthanthrige, R.; Rajapakse, A.D. Demand Response Integrated Day-Ahead Energy Management Strategy for Remote Off-Grid Hybrid Renewable Energy Systems. Int. J. Electr. Power Energy Syst. 2021, 129, 106731. [Google Scholar] [CrossRef]
- Stennikov, V.; Barakhtenko, E.; Mayorov, G.; Sokolov, D.; Zhou, B. Coordinated Management of Centralized and Distributed Generation in an Integrated Energy System Using a Multi-Agent Approach. Appl. Energy 2022, 309, 118487. [Google Scholar] [CrossRef]
- Xue, C.; Ren, J.; Zhang, X.; Wang, P.; Zhou, X.; Liu, Y.; Kuang, H. An Optimal Dispatch Method for High Proportion New Energy Power Grid Based on Source-Network-Load-Storage Interaction. In Proceedings of the 2021 4th International Conference on Electron Device and Mechanical Engineering (ICEDME), Guangzhou, China, 19–21 March 2021; pp. 119–122. [Google Scholar]
- Hou, H.; Liu, P.; Xiao, Z.; Deng, X.; Huang, L.; Zhang, R.; Xie, C. Capacity Configuration Optimization of Standalone Multi-Energy Hub Considering Electricity, Heat and Hydrogen Uncertainty. Energy Convers. Econ. 2021, 2, 122–132. [Google Scholar] [CrossRef]
- Zhang, Z.; Zhang, N.; Wang, M.; Lei, Y.; Li, H.; Ge, L. Research on optimal planning model of integrated energy system for high proportion of renewable energy utilization. Renew. Energy Resour. 2020, 38, 1085–1091. [Google Scholar] [CrossRef]
- Karakosta, O.; Petropoulou, D. The EU Electricity Market: Renewables Targets, Tradable Green Certificates and Electricity Trade. Energy Econ. 2022, 111, 106034. [Google Scholar] [CrossRef]
- Bae, J.H.; Rishi, M.; Li, D. Consumer Preferences for a Green Certificate Program in South Korea. Energy 2021, 230, 120726. [Google Scholar] [CrossRef]
- Yu, X.; Dong, Z.; Zhou, D.; Sang, X.; Chang, C.-T.; Huang, X. Integration of Tradable Green Certificates Trading and Carbon Emissions Trading: How Will Chinese Power Industry Do? J. Clean. Prod. 2021, 279, 123485. [Google Scholar] [CrossRef]
- Teixidó, J.; Verde, S.F.; Nicolli, F. The Impact of the EU Emissions Trading System on Low-Carbon Technological Change: The Empirical Evidence. Ecol. Econ. 2019, 164, 106347. [Google Scholar] [CrossRef]
- Sabbaghi, O.; Sabbaghi, N. Carbon Financial Instruments, Thin Trading, and Volatility: Evidence from the Chicago Climate Exchange. Q. Rev. Econ. Financ. 2011, 51, 399–407. [Google Scholar] [CrossRef]
- Oke, A.E.; Aigbavboa, C.O.; Dlamini, S.A. Carbon Emission Trading in South African Construction Industry. Energy Procedia 2017, 142, 2371–2376. [Google Scholar] [CrossRef]
- Alabi, T.M.; Lu, L.; Yang, Z. Stochastic Optimal Planning Scheme of a Zero-Carbon Multi-Energy System (ZC-MES) Considering the Uncertainties of Individual Energy Demand and Renewable Resources: An Integrated Chance-Constrained and Decomposition Algorithm (CC-DA) Approach. Energy 2021, 232, 121000. [Google Scholar] [CrossRef]
- Xu, Y.; Liu, Z.; Wen, F.; Palu, I. Receding-Horizon Based Optimal Dispatch of Virtual Power Plant Considering Stochastic Dynamic of Photovoltaic Generation. Energy Convers. Econ. 2021, 2, 45–53. [Google Scholar] [CrossRef]
- Mirzaei, M.A.; Yazdankhah, A.S.; Mohammadi-Ivatloo, B.; Marzband, M.; Shafie-khah, M.; Catalão, J.P.S. Stochastic Network-Constrained Co-Optimization of Energy and Reserve Products in Renewable Energy Integrated Power and Gas Networks with Energy Storage System. J. Clean. Prod. 2019, 223, 747–758. [Google Scholar] [CrossRef] [Green Version]
- Wang, C.; Lv, C.; Li, P.; Li, S.; Zhao, K. Multiple Time-scale Optimal Scheduling of Community Integrated Energy System Based on Model Predictive Control. Proc. CSEE 2019, 39, 6791–6803, 7093. [Google Scholar] [CrossRef]
- Yang, H.; Li, M.; Jiang, Z.; Zhang, P. Multi-Time Scale Optimal Scheduling of Regional Integrated Energy Systems Considering Integrated Demand Response. IEEE Access 2020, 8, 5080–5090. [Google Scholar] [CrossRef]
- Jiang, Y.; Cao, H.; Yang, L.; Fei, F.; Li, J.; Lin, Z. Mechanism Design and Impact Analysis of Renewable Portfolio Standard. Autom. Electr. Power Syst. 2020, 44, 187–199. [Google Scholar]
- National Energy Administration of China. Notice on the 2021 Renewable Energy Power Consumption Responsibility Weight and Related Matters. Available online: http://www.gov.cn/zhengce/zhengceku/2021-05/26/content_5612441.htm (accessed on 18 March 2022).
- Wan, W.; Ji, Y.; Yin, L.; Wu, H. Application and prospect of carbon trading in the planning and operation of integrated energy system. Electr. Meas. Instrum. 2021, 58, 39–48. [Google Scholar] [CrossRef]
Publisher’s Note: MDPI stays neutral with regard to jurisdictional claims in published maps and institutional affiliations. |
© 2022 by the authors. Licensee MDPI, Basel, Switzerland. This article is an open access article distributed under the terms and conditions of the Creative Commons Attribution (CC BY) license (https://creativecommons.org/licenses/by/4.0/).