Article

Investigation of Oil and Facility Characteristics of Plastic Waste Pyrolysis for the Advanced Waste Recycling Policy

Environmental Resources Research Department, National Institute of Environmental Research, Hwangyeong-ro 42, Seo-gu, Incheon 22689, Korea
*
Author to whom correspondence should be addressed.
Energies 2022, 15(12), 4317; https://doi.org/10.3390/en15124317
Submission received: 10 May 2022 / Revised: 30 May 2022 / Accepted: 9 June 2022 / Published: 13 June 2022
(This article belongs to the Section B: Energy and Environment)

Abstract

:
Alternative chemical and fuel oil produced from plastic waste may play a key role in national sustainable development. The Korean government has promoted several waste recycling policies including waste to energy. Here, we focus on the investigation of the oil and facility characteristics of plastic waste pyrolysis. Four pyrolysis facilities, which had different pyrolysis processes and produced various oil properties, were chosen in order to develop an advanced waste recycling policy. Pyrolysis oil recovery efficiency and chemical characteristics were influenced by feedstock and pyrolysis conditions. In terms of pyrolysis gases, the gas quantity was different due to the pyrolyzer operation conditions, but the characteristics of gas composition were not especially distinguished. In addition, air pollutants, such as carbon monoxide (CO), nitrogen oxides (NOx), sulfur oxides (SOx), and hydrogen sulfide (H2S) from the pyrolysis process were analyzed to evaluate the environmental effects on the surrounding area. The air pollutant concentration varied, but those from the process were adequately controlled. From the aforementioned results, several improvements have been deduced to manage the pyrolysis oil facility and product in advanced policy decisions.

Graphical Abstract

1. Introduction

Most countries have paid attention to the rapid waste generation derived from polymer material, which is directly proportional to an increase in plastic production [1]. A total of 6300 million tonnes of plastic waste was generated between 1950 and 2015 and was then treated by recycling (9%), incineration (12%), and landfill and natural environment depositing (79%) [2]. In particular, the COVID-19 pandemic facilitated more concern about how to efficiently control its generation and treatment. The recycling rate of plastic waste varies by nation. European countries significantly focus on material and energy recovery by using plastic waste [3]. In the case of South Korea, around 22.7% of plastic waste was recycled as material and 39.3% as energy in 2017. The rest was either simply incinerated or thrown into landfills [4]. Incineration is a better solution than using landfills. In the case of landfilling, it leads to several problems associated with environmental impacts such as soil and aquifer contamination [5]. Currently, the recycling of plastic waste is an important issue in South Korea because the lifetime of landfill sites in metropolitan areas will be terminated shortly, and alternative sites for landfills are insufficient. The Korean government has tried to develop environmental policies in order to foster the recycling rate of plastic waste. The residential sector should classify and discharge plastic waste by type. In addition, an extended producer responsibility (EPR) system has been carried out to enhance the recycling rate of waste. Additionally, policies regarding plastic consumption have attempted to restrain the demand for disposable products that are derived from plastics.
Many kinds of plastics are produced, but several plastic types such as high-density polyethylene (HDPE), low-density polyethylene (LDPE), polypropylene (PP) and polystyrene (PS) form the majority of waste generation [6]. Unfortunately, material recycling mainly focuses on solid refused fuel (SRF) production and faces difficulty in the diversification of reuse. Energy recovery via thermo-chemical conversion techniques is an alternative method for recycling diversification. Among the thermo-chemical conversion techniques (e.g., pyrolysis, gasification, and combustion), large amounts of liquid oil can be easily and quickly obtained by pyrolysis via thermal degradation and depolymerization of long-chain polymer molecules in an oxygen-free atmosphere [7]. Therefore, pyrolysis can be a promising option for energy recovery from combustible wastes, especially plastic wastes, to liquid fuel and chemicals [8]. In general, the pyrolysis reaction can produce three different kinds of products such as oil, gas, and solids. The pyrolysis heating condition is adjusted to the final target products, which can be classified as slow, fast, and flash pyrolysis [9]. Slow pyrolysis means that the reaction occurs at a low (for solids) or high (for gas) temperature, a long residence time, and a slow heating rate. The main products are pyrolysis gas and solids (i.e., char and torrefied fuel). Fast and flash pyrolysis are favorable for oil production at low and moderate temperatures, a high heating rate, and with a short residence time. However, for flash pyrolysis, the size of feedstocks is restricted, which requires pretreatment such as shredding and cutting. Therefore, fast pyrolysis is a better option for oil production using waste lumps on a commercial scale. Occasionally, a catalytic cracking system is installed and used in the pyrolysis oil production facility in order to enhance the oil quality because it controls the range of hydrocarbon polymer molecules. On the other hand, it lowers the economic facility (i.e., increases the oil production cost).
Several pyrolysis facilities have been installed and operated to produce pyrolysis oil using plastic waste in South Korea. In general, pyrolysis oil produced by those facilities is utilized in boiler systems as a fuel. However, the characteristics of oil quality and yield are various due to the function of feedstock, pyrolysis process, and operation conditions. Therefore, guidelines and standards related to facility installation, management, and safety for plastic waste pyrolysis are required to achieve an advanced waste recycling policy and sustainable development.
In this study, we have analyzed the characteristics of pyrolysis oil products and facilities in order to promote energy recovery rate and facilitate industry related to plastic waste through advanced policy decisions. Four different types of pyrolysis facilities were chosen to investigate the characteristics of each facility. First, we carried out sampling of waste feedstock, pyrolysis residue, oil, and gas from the facilities. In addition, the concentration of air pollutants such as carbon monoxide (CO), nitrogen oxides (NOx), sulfur oxides (SOx), and hydrogen sulfide (H2S) was analyzed during pyrolysis operation. Second, each pyrolysis process and its operating conditions were investigated to ensure standards for pyrolysis facilities using plastic waste.

2. Experimental Section

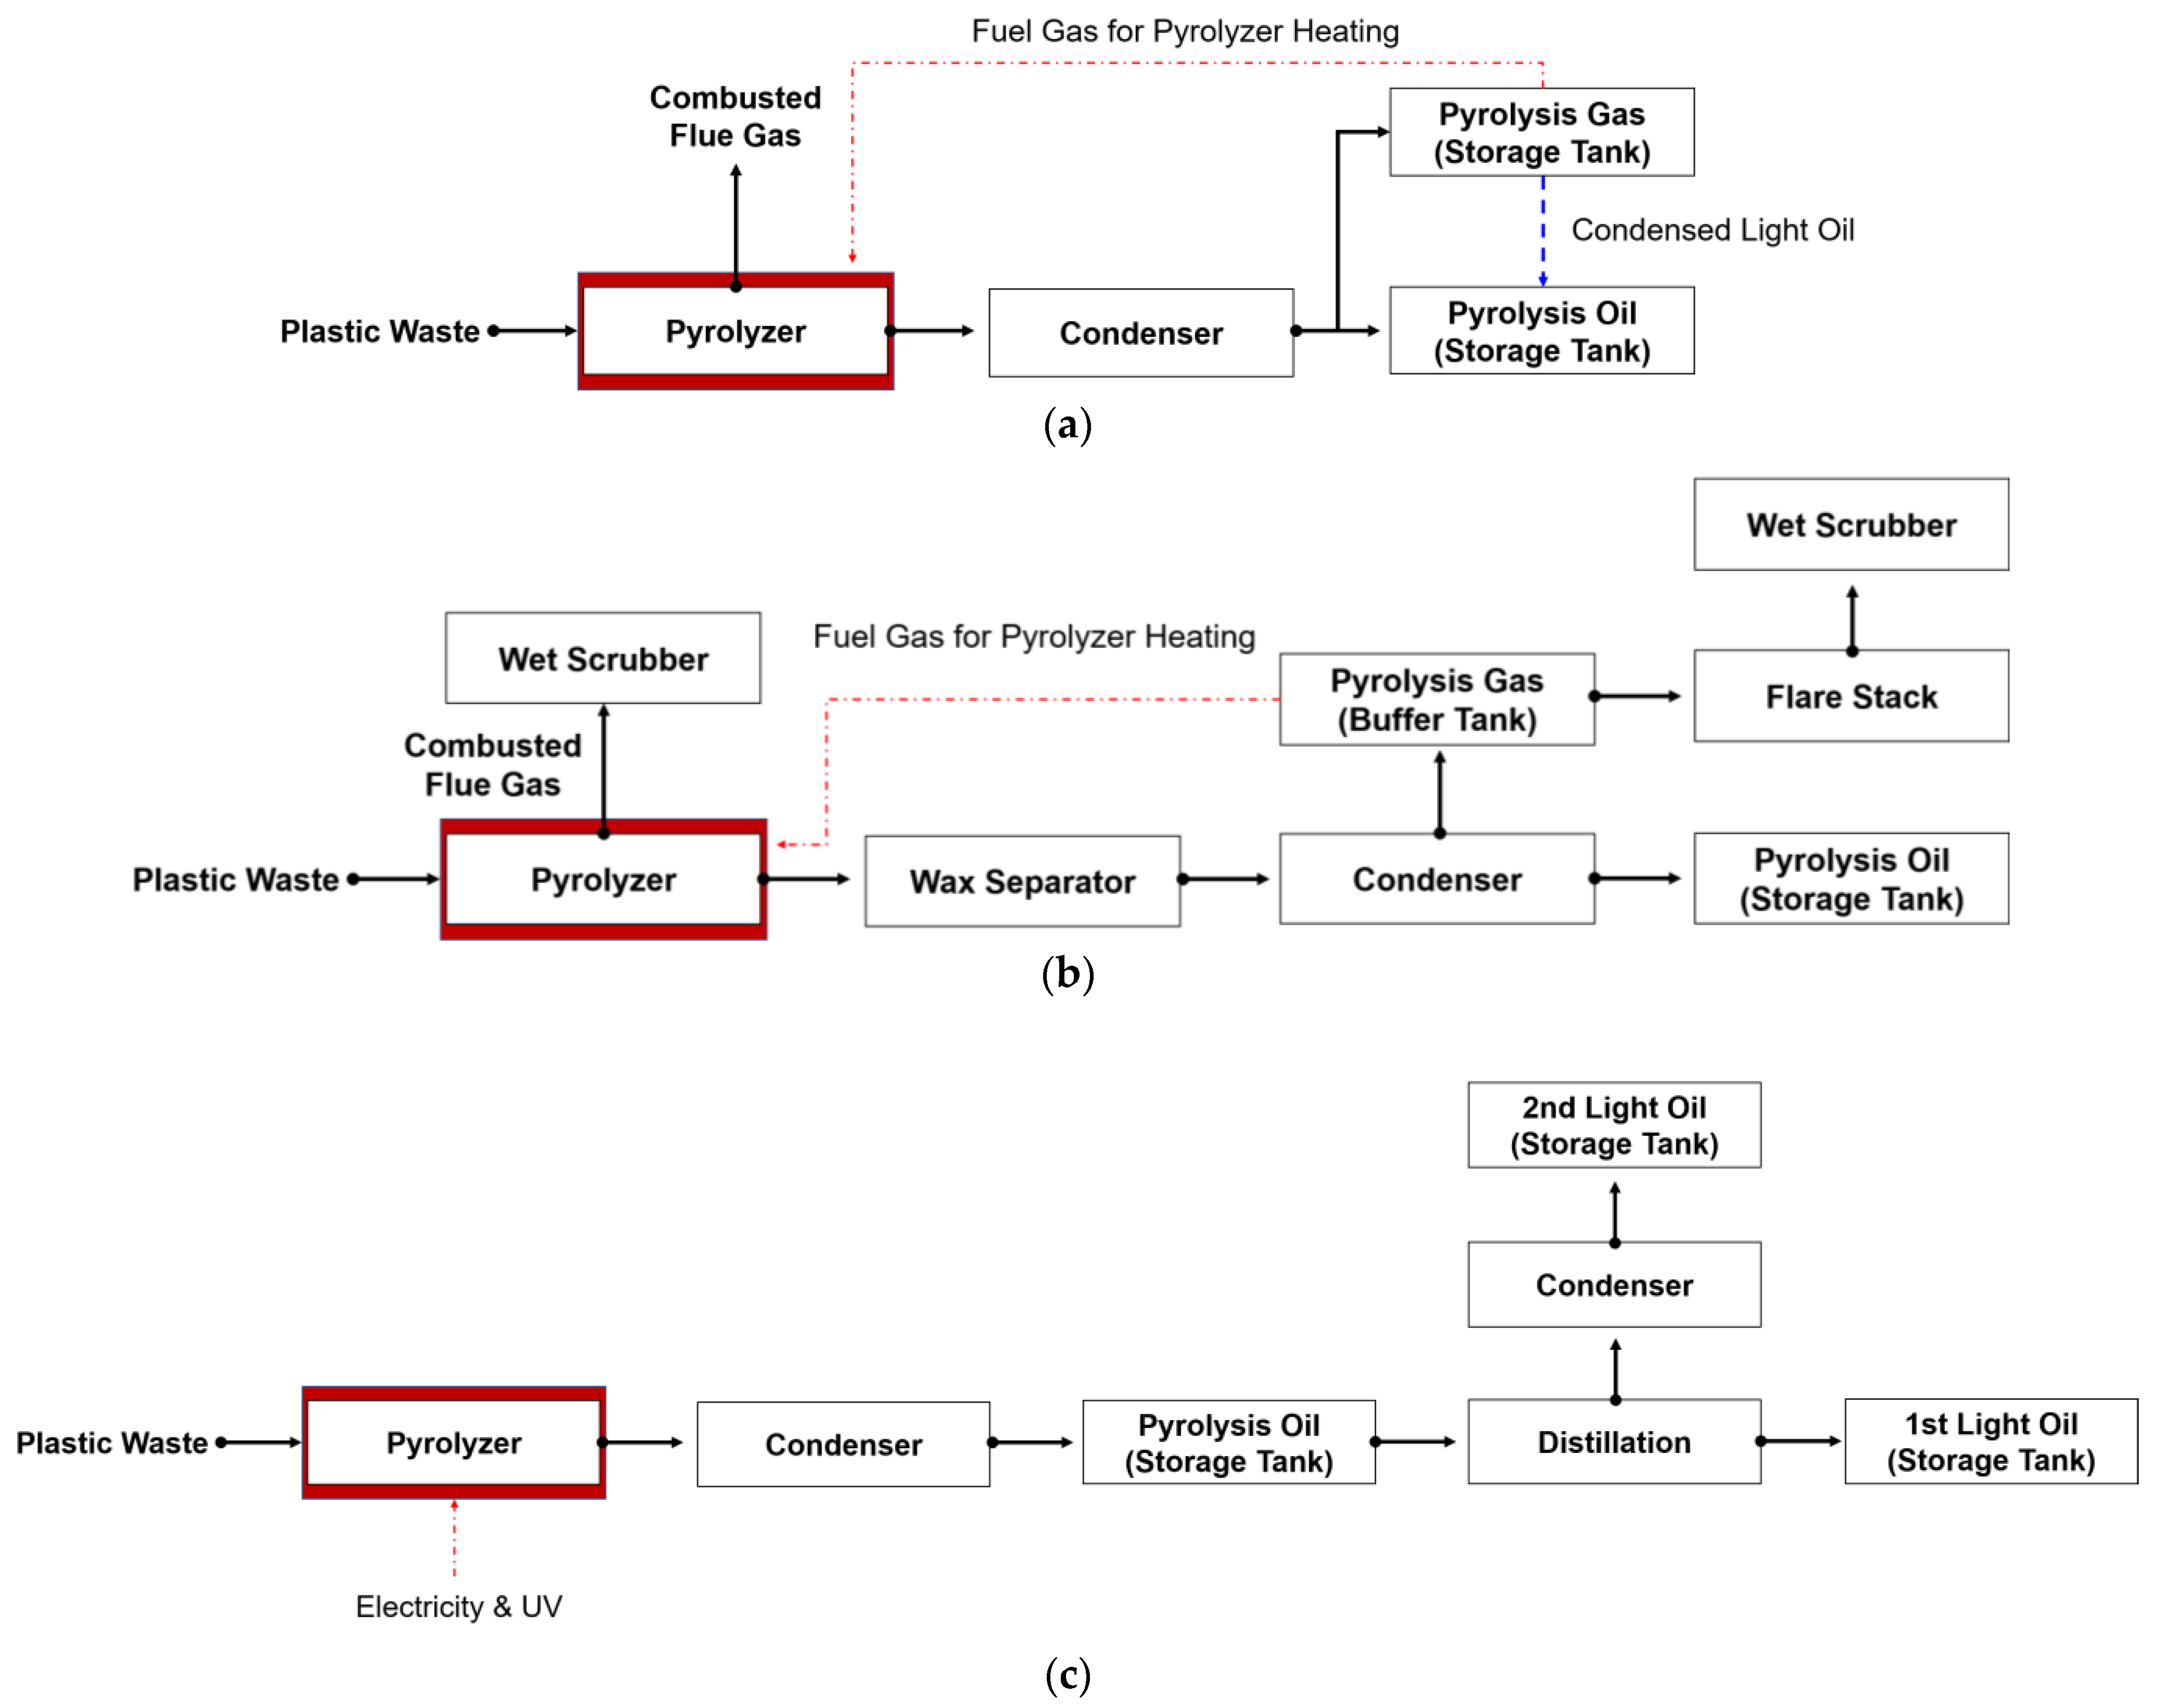
2.1. Pyrolysis Facilities Using Plastic Waste

Three commercial pyrolysis facilities (A, B, and C) and one research pyrolysis facility (D) were chosen to investigate the characteristics of pyrolysis products and processes. The detailed pyrolysis process of each of them is illustrated in Figure 1. All pyrolysis processes include a pyrolyzer and a condenser for gathering the oil product. However, details of equipment shape and process systems were varied. The pyrolyzer of facility A was a screw reactor. In order to maintain the pyrolysis temperature, pyrolysis gas was used as the heating fuel for the pyrolyzer. The pyrolyzer of facility B and C was a rotary drum reactor. Pyrolysis gas was also used as the pyrolyzer-heating fuel. In the case of facility D, the pyrolyzer was a fixed-bed reactor. For the pyrolyzer heating, electricity and UV were used. In addition, facility D included a distillation system for light oil production.

2.2. Sample Preparation and Analysis

In order to analyze the characteristics of feedstock, pyrolysis residue, oil, and gas, we took a certain number of samples in the facilities. In addition, air pollutant concentration was analyzed during pyrolysis facility operation.

2.2.1. Feedstock and Pyrolysis Residue

A sample of feedstock was sorted by hand into subfractions such as PP, PS, HDPE, LDPE, and other materials (i.e., multi-resin and synthetic plastic items) to determine the constituent, as listed in Table 1. Physical and chemical properties of pyrolysis feedstock and residue were investigated using three components, proximate analysis, ultimate analysis, metal concentration, calorific value, and ignition temperature, as listed in Table 2. Moisture, combustible, and ash fraction were analyzed using an oven and a muffle furnace. The moisture was determined at 105 °C for 24 h. In the case of ash, the sample was heated from room temperature to 600 °C (with an addition of 25 wt% ammonium nitrate solution) at a heating rate of 10 °C/min. The ashing time was set to 3 h. The combustible fraction was calculated by subtraction of the moisture and ash from the initial sample weight. In the proximate analysis, the volatile matter was determined at 950 °C (a heating rate of 30 °C/min) for 7 min without oxygen, and the ashing treatment was carried out at 875 °C for 3 h. Fixed carbon was deduced by a calculation of subtraction from the moisture, volatile matter, and ash of the initial sample weight. The ultimate analyzer (vario MACRO cube, Hanau, Germany) determined the carbon (C), hydrogen (H), nitrogen (N) and sulfur (S) contents. The metal concentration was analyzed by inductively coupled plasma optical emission spectrometry (ICP-OES; Optima 8300, Waltham, MA, USA). In the case of calorific value, a calorimeter (AC 500, ABB, Västerås, Sweden) was adopted. For the determination of ignition temperature, a thermogravimetric analyzer (TGA; STA 2500 Regulus, Berlin, Germany) was used. The sample was heated to 700 °C at a heating rate of 10 °C/min.

2.2.2. Pyrolysis Oil

The characteristics of oil products, such as ash, moisture, sediment, sulfur, residual carbon, and metal concentration, from the pyrolysis facility were investigated, as listed in Table 3. First, in order to identify the amount of ash, the oil sample was heated up to 600 °C at a heating rate of 10 °C/min. The ashing time was set to 3 h. The moisture and sediment were analyzed using a centrifuge (Sorvall Legend XTR, Thermo Fisher Scientific, Waltham, MA, USA) with 3000 rpm for 30 min. Before the treatment, toluene and hexylamine solution were added to the oil sample. In the case of sulfur analysis, energy-dispersive X-ray fluorescence (EDXRF; Epsilon 3XLE, Malvern Panalytical, Malvern, UK) was used. Residual carbon from the oil was identified using a tube-type furnace. A certain amount of oil sample from a crucible was injected into the furnace, and then the reactor temperature was raised up to 500 °C at a heating rate of 10 °C/min with N2 gas purge (15 min holding). For the metal concentration analysis in the pyrolysis oil, ICP-OES (Optima 8300, PerkinElmer, Waltham, MA, USA) analysis was carried out.

2.2.3. Pyrolysis Gas and Air Pollutants

The components and concentration of pyrolysis gas and air pollutants during facility operation were identified. For the investigation of pyrolysis gas, gas sampling was carried out using a Tedlar bag (1 L) at a certain time interval during the operation. The gas composition and concentration of hydrogen (H2), methane (CH4), ethene (C2H4), ethane (C2H6), and propene (C3H6) were analyzed using gas chromatography (GC; GC 2010, Shimadzu, Kyoto, Japan). In the case of air pollutant emissions, a portable gas analyzer (MK 6000, Iserlohn, Germany), which was installed at an air pollutant outlet, was used in order to identify the concentration of CO, NOx, SOx, and H2S during the pyrolysis facility operation.

3. Results

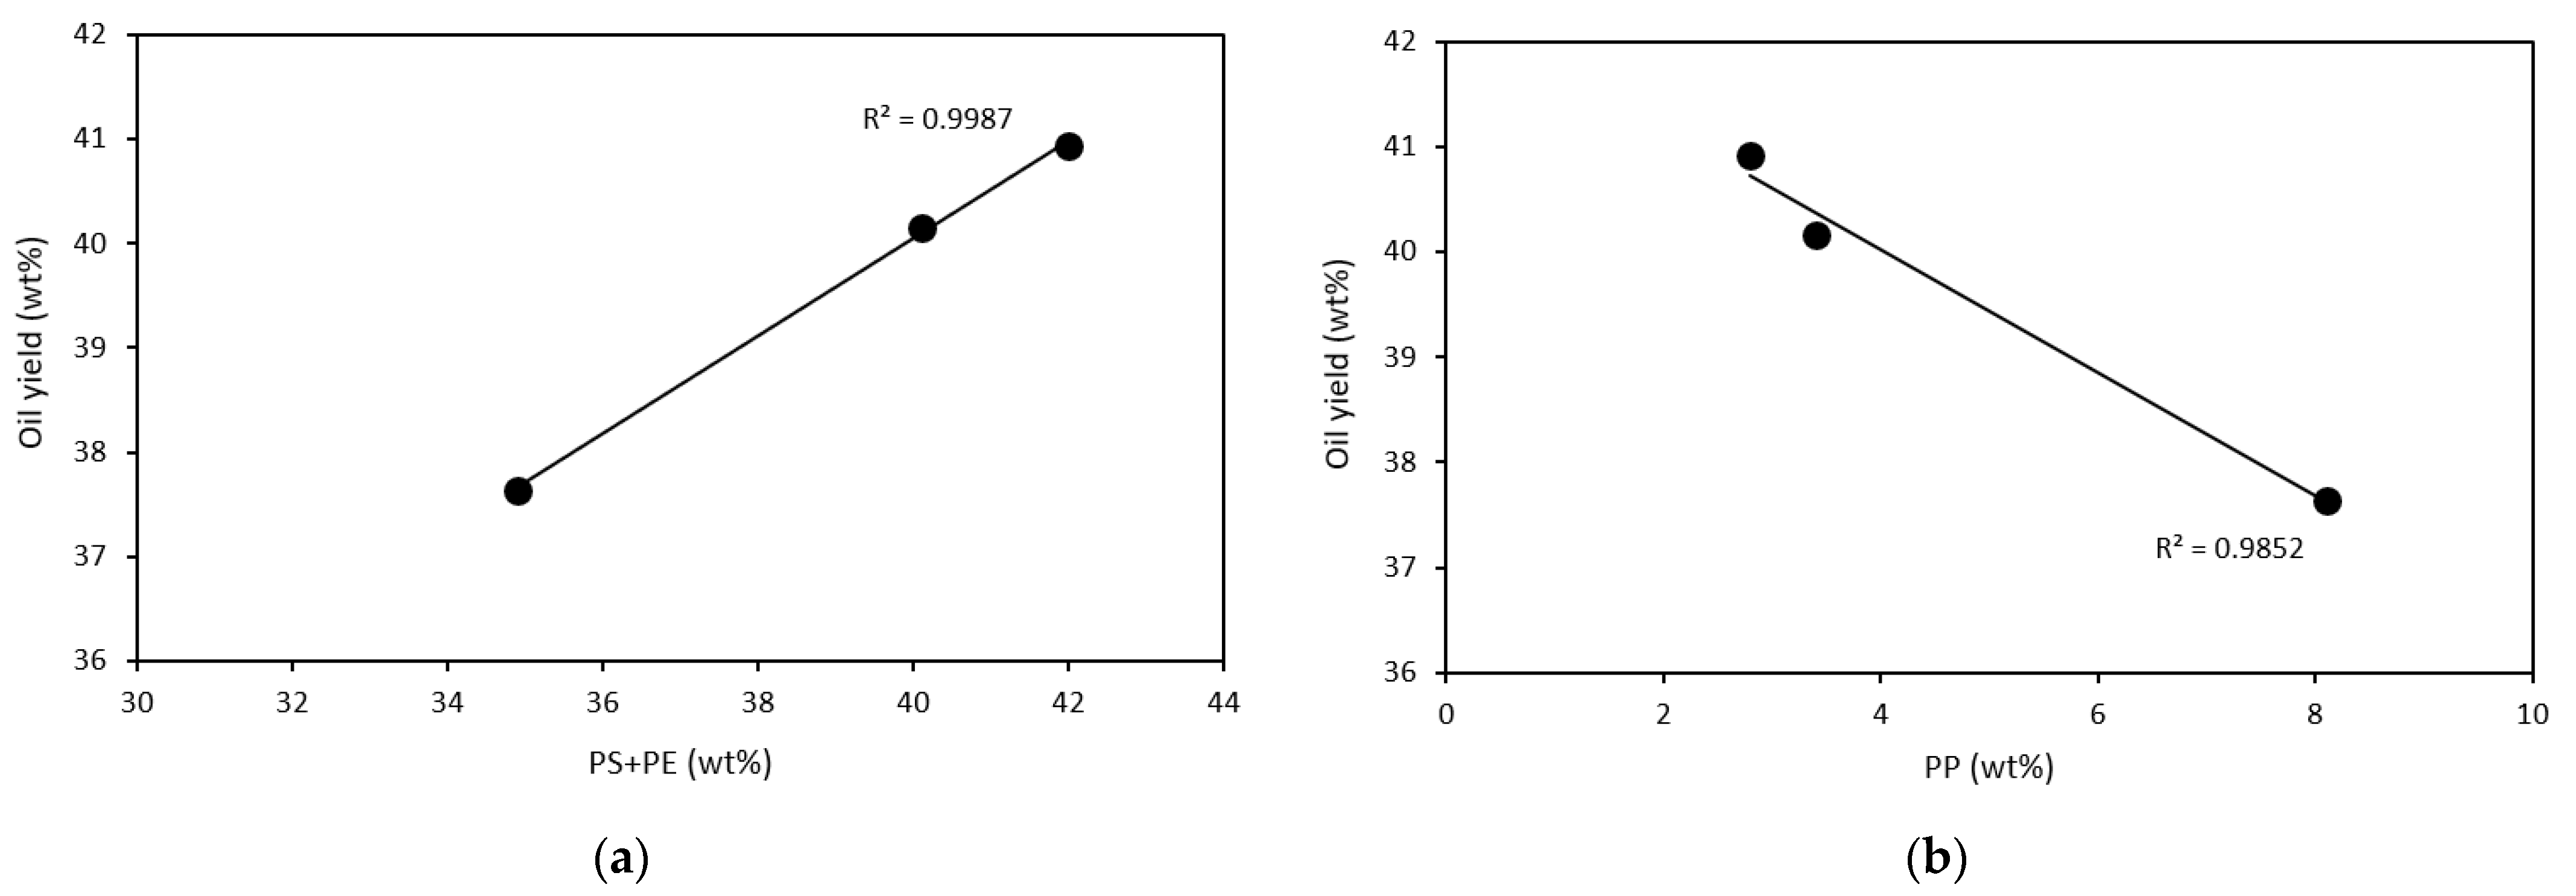
3.1. Characteristics of Feedstock and Pyrolysis Products

The feedstock in the pyrolyzer was mainly composed of plastic waste, as listed in Table 1. Polyethylene (PE) was the majority of the plastic waste. In particular, most of the plastic composition was LDPE in facility D. The plastic waste of facility A, B and C was derived from the residential sector. Hence, diverse plastic types were brought into the pyrolysis facilities. On the other hand, the plastic waste of facility D was derived from the agricultural sector, which might result in a majority of LDPE. The detailed characteristics of pyrolysis feedstock and residue are listed in Table 2. The combustible fraction of feedstock was higher than 85 wt%. During the pyrolysis reaction, it was converted to oil, gas, and residue in the pyrolyzer. The combustible fraction of residue ranged between 40.7 and 55.8 wt% after the pyrolysis reaction. In the proximate analysis, volatile matter in the combustible material was the majority, which was higher than 90 wt% in the feedstock. In general, high volatile matter leads to an increasing oil yield [10]. However, operational conditions also influence the oil yield [11]. The feedstock of facility B and D included a high amount of volatile matter. In particular, in the ultimate analysis, C and H were higher in the feedstocks of facility B and D compared to those of facility A and C. These characteristics might influence pyrolysis product yields such as oil and gas. In the case of metals, Cd, Pb, As, and Cu are not significantly involved in the feedstock and residue. However, the concentration of metals relatively increases after the pyrolysis reaction. In general, metal concentration can be changed by high-temperature thermal treatment. In previous research [12], metal concentration during the waste pyrolysis reaction increased in the char residue under low-temperature pyrolysis conditions, but it decreased in the char residue under high-temperature pyrolysis conditions. Low-temperature (below 400 °C) pyrolysis was carried out for oil production in this study. This might have resulted in an increase in metal concentration in the pyrolysis residue. In comparison with the calorific value of feedstock and residue, the calorific value substantially decreased after the pyrolysis reaction. The decreasing calorific value of feedstock was converted to energy products such as pyrolysis oil and gas. In addition, the ignition temperature was changed after the pyrolysis reaction because of devolatilization behavior of the feedstock. Resultingly, after the pyrolysis reaction, constituents related to energy production were substantially reduced, but metal concentration increased in the solid sample.
The characteristics of pyrolysis oil and gas products were investigated. Table 3 indicates the analysis results of various pyrolysis oil products from each facility. Depending on the facility process, pyrolysis oil characteristics such as ash, moisture, sediment, sulfur, residual carbon, and metal were varied. However, these satisfy the regulations of the Wastes Control Act of Korea. The ash content was below 0.03 wt% in all oil products. In particular, moisture and sediment were rarely detected in the oil samples. Sulfur content ranged between 0.05 and 0.09 wt%. Residual carbon was less than 0.03 wt% in all oil products. In the case of metals, Cd, Pb, Cr, and As contents were rarely involved in all oil products. Hence, pyrolysis oils not only apply to boiler fuel but can also be used as raw materials (i.e., chemical substitution) in chemical and refinery industries.
Pyrolysis gas is produced during process operation because all thermally treated and depolymerized molecules are not condensed. Figure 2 illustrates the concentration of H2, CH4, C2H4, C2H6, and C3H6 in the pyrolysis gas. The pyrolysis gas concentration of facility B, C and D was similar, but that of facility A showed a different tendency; CH4 concentration was high. This behavior might be related to different operation conditions (i.e., residence time). The concentration of hydrocarbon gas components such as C2H6 and C3H6 was lower due to a thermal-cracking reaction. This led to facilitating pyrolysis gas generation in facility A. Previous research [13] revealed that a longer residence time is an important factor in reducing liquid oil yield due to the formation of secondary reactions such as thermal cracking and the rearrangement of chemical compounds. This explains why the total gas production of facility A was high compared to that of the other facilities, as listed in Table 4.

3.2. Material Balance from Pyrolysis Process

In this section, we identified the material balance of pyrolysis residue, oil, and gas during the facility operation. Several factors such as operational conditions (e.g., temperature, residence time, and catalyst), feedstock, and pyrolysis process are related to pyrolysis oil and gas yield. Here, we attempt to find the relationship between feedstock type and oil yield. Facility D was not investigated in this section because the feedstock of facility D was mainly composed of LDPE, as listed in Table 1. In addition, the pyrolysis condition (i.e., heating method) and distillation process of facility D differ, as shown in Figure 1. This would influence oil production characteristics [14].
Table 4 indicates the material balance of pyrolysis residue, oil, and gas from each facility. The pyrolysis residue was in a range between 11.38 and 21.88 wt%. This resulted in a high pyrolysis reaction performance. Sometimes, pyrolysis residue remained more than 30 wt% [15]. In the case of oil and gas fraction, long residence time and high temperature led to increasing high fraction of gas during the pyrolysis reaction [16]. Here, the reaction temperatures of all the facilities were similar, but the residence time differed. This resulted in a high gas yield of facility A compared to that of facility B and C. The other factor is type of plastic waste feedstock. Several previous studies [17,18,19] have been conducted using different types of plastic waste for pyrolysis oil production, which have revealed various oil yields. Figure 3 and Figure 4 show the relationship between plastic waste and oil yield for facility A, B and C. Figure 3 indicates a ternary plot of PP, PE (HDPE + LDPE), and PS related to oil yield. In Figure 3, the presented number signifies the order of the pyrolysis oil yield of each facility. Low oil yield was presented, which was proportional to high PP content in the feedstock (Figure 3a). Therefore, the relationship between PS, LDPE, and HDPE and oil yield was compared, as shown in Figure 3b. The relationship between them was not clearly identified. In previous research [20], the inclusion of PP influenced low oil yield. PS and PE mixture showed better oil yield than PP, PS, and PE mixture [21]. This phenomenon is clarified in Figure 4. The high fraction of PS and PE mixture from the facilities showed an obvious correlation with high oil yield. On the other hand, the high fraction of PP led to decreasing oil yield. The pyrolysis oil yield significantly influences the minimum selling price (MSP) of oil. The oil yield is varied depending on the type of plastic waste. As oil yield increased, the MSP decreased sharply [22]. Among facility A, B, and C, the highest pyrolysis oil yield was approximately 41 wt% in facility B. Therefore, high oil yield should be required for economic gain in the commercial pyrolysis oil production facility.

3.3. Air Pollutant Emissions from Pyrolysis Process

Facility A, B, and C had combustion systems that used pyrolysis gas for pyrolyzer heating. Many previous studies have not focused on the air pollutant emissions from the pyrolysis process, which included a combustion system of pyrolysis gas. Hence, we investigated the air pollutant concentration from the gas outlet. Facility A showed low CO, SOx, and H2S concentrations. In particular, SOx and H2S were not detected by the gas analyzer during the pyrolysis facility operation. In the case of CO, it was controlled by thermal treatment. In facility A, a multi-stage combustion device was installed in the gas outlet in order to reduce unfavorable gas emissions. This might control the incomplete combustion behavior, which could lower the CO emissions. However, the NOx concentration of facility A was higher than that of facility B and C. During the combustion reaction of waste, NOx can be mainly generated by two different factors such as fuel NOx and thermal NOx [23]. According to the ultimate analysis, the feedstock in facility A, B and C contained similar nitrogen (N) content (ranging between 0.16 and 0.21 wt%) for the pyrolysis, which did not critically influence NOx formation. On the other hand, the multi-stage combustion device in facility A affected NOx generation because of high thermal treatment temperature. This would lead to increasing NOx concentration. In the case of facility B and C, a similar air pollutant control device (i.e., a wet scrubber) was installed. This might result in similar air pollutant concentration in facility B and C. Resultingly, the concentrations of CO, NOx, SOx, and H2S were not high (as listed in Table 5) because the facility controlled the air pollutant emissions using a thermal-cracking system in facility A and a wet scrubber in facility B and C.

4. Conclusions

Plastic waste pyrolysis is essential for the diversification of waste recycling. In particular, oil production derived from plastic waste is necessary in South Korea because conventional oil (i.e., petroleum resource) is not produced and is only imported from foreign countries. In addition, amendments regarding the waste recycling policy should be carried out for efficient utilization of plastic waste. In this work, four different plastic waste pyrolysis facilities (i.e., three commercial and one developing facility) were investigated in order to analyze the characteristics of feedstock, solid residue, gas, oil, air pollutants, process, and their relationships. The feedstock of plastic waste was mainly composed of PP, PS, PE, and others in commercial pyrolysis facilities. In particular, PP, PS, and PE were substantially related to pyrolysis oil yield. The quality of pyrolysis oil product from each facility satisfied the government regulations of Korea. In addition, the concentration of pyrolysis gas such as H2, CH4, C2H4, C2H6, and C3H6 was influenced by the residence time of feedstock in the pyrolyzer. In particular, the quantity of pyrolysis gas from the facilities was high in facility A due to a difference in pyrolysis residence time. In terms of the environmental impact of pyrolysis facilities, solid residue and air pollutant emissions were additionally researched because solid residue is currently landfilled, and air pollutants are emitted to surrounding areas of the facilities. Fortunately, the solid residue and air pollutants were not of significant concern for the environment.
However, detailed guidelines and standards related to facility installation, management, and safety might be required for the advanced recycling policy of plastic waste because they are not prepared entirely. In particular, the standard of oil yield should be recommended to pyrolysis facilities. In this study, the oil yield of the commercial facility was around 40 wt%. This should be enhanced to maximize the potential worth of plastic waste and facility economics. Currently, we are preparing more detailed accounts of facility installation, management, and safety. The enactment of plastic waste pyrolysis might be an essential countermeasure against increasing plastic waste and a way of fostering alternative energy.

Author Contributions

Conceptualization, H.N.; Data curation, S.-I.P., Y.L. and J.-I.S.; Formal analysis, T.U.H., Funding acquisition, J.-G.K.; Investigation, S.-I.P., Y.L. and J.-I.S.; Project administration, J.-G.K.; Writing—original draft, H.N.; Writing—review and editing, J.-G.K. All authors have read and agreed to the published version of the manuscript.

Funding

This work was supported by the National Institute of Environmental Research (NIER) funded from the Ministry of Environment (MOE), Korea (NIER-RP2021-232).

Institutional Review Board Statement

Not applicable.

Informed Consent Statement

Not applicable.

Data Availability Statement

Not applicable.

Conflicts of Interest

The authors declare no conflict of interest.

References

  1. Tiseo, I. Global Plastic Production 1950–2020. Available online: https://www.statista.com/statistics/282732/global-production-of-plastics-since-1950/ (accessed on 20 April 2022).
  2. Geyer, R.; Jambeck, J.R.; Law, K.L. Production, use, and fate of all plastics ever made. Sci. Adv. 2017, 3, e1700782. [Google Scholar] [CrossRef] [PubMed] [Green Version]
  3. SYSTEMIQ. Reshaping Plastics: Pathways to a Circular, Climate Neutral Plastics System in Europe. Available online: https://plasticseurope.org/wp-content/uploads/2022/04/SYSTEMIQ-ReShapingPlastics-April2022.pdf (accessed on 3 May 2022).
  4. Yoon, J.S. Plastic Waste Recycling Rate South Korea 2008–2019. Available online: https://www.statista.com/statistics/1074985/south-korea-plastic-waste-recycling-rate/ (accessed on 3 May 2022).
  5. Al-Salem, S.M.; Yang, Y.; Wang, J.; Leeke, G.A. Pyro-oil and wax recovery from reclaimed plastic waste in a continuous auger pyrolysis reactor. Energies 2020, 13, 2040. [Google Scholar] [CrossRef] [Green Version]
  6. OECD. Improving Plastics Management: Trends, Policy Responses, and the Role of International Co-Operation and Trade. Available online: https://www.oecd.org/environment/waste/policy-highlights-improving-plastics-management.pdf (accessed on 3 May 2022).
  7. Han, T.U.; Kim, Y.-M.; Watanabe, A.; Teramae, N.; Park, Y.-K.; Kim, S. Pyrolysis kinetic analysis of poly (methyl methacrylate) using evolved gas analysis-mass spectrometry. Korean J. Chem. Eng. 2017, 34, 1214–1221. [Google Scholar] [CrossRef]
  8. Li, D.; Lei, S.; Wang, P.; Zhong, L.; Ma, W.; Chen, G. Study on the pyrolysis behaviors of mixed waste plastics. Renew. Energy 2021, 173, 662–674. [Google Scholar] [CrossRef]
  9. Kılıç, M.; Pütün, E.; Pütün, A.E. Optimization of Euphorbia rigida fast pyrolysis conditions by using response surface methodology. J. Anal. Appl. Pyrolysis 2014, 110, 163–171. [Google Scholar] [CrossRef]
  10. Erdogan, S. Recycling of Waste Plastics into Pyrolytic Fuels and Their Use in IC Engines. Available online: https://www.intechopen.com/chapters/70583 (accessed on 4 May 2022).
  11. Sharuddin, S.D.A.; Abnisa, F.; Daud, W.M.A.W.; Aroua, M.K. A review on pyrolysis of plastic wastes. Energy Convers. Manag. 2016, 115, 308–326. [Google Scholar] [CrossRef]
  12. Joung, H.T.; Seo, Y.C.; Kim, K.H.; Hong, J.H.; Yoo, T.W. Distribution and characteristics of pyrolysis products from automobile shredder residue using an experimental semi-batch reactor. Korean J. Chem. Eng. 2007, 24, 996–1002. [Google Scholar] [CrossRef]
  13. Onay, O.; Kockar, O.M. Slow, fast and flash pyrolysis of rapeseed. Renew. Energy 2003, 28, 2417–2433. [Google Scholar] [CrossRef]
  14. Palos, R.; Gutiérrez, A.; Vela, F.J.; Olazar, M.; Arandes, J.M.; Bilbao, J. Waste Refinery: The valorization of waste plastics and end-of-life tires in refinery units. A review. Energy Fuels 2021, 35, 3529–3557. [Google Scholar] [CrossRef] [PubMed]
  15. Papari, S.; Bamdad, H.; Berruti, F. Pyrolytic conversion of plastic waste to value-added products and fuels: A review. Materials 2021, 14, 2586. [Google Scholar] [CrossRef] [PubMed]
  16. Mohan, D.; Pittman, C.U., Jr.; Steele, P.H. Pyrolysis of wood/biomass for bio-oil: A critical review. Energy Fuels 2006, 20, 848–889. [Google Scholar] [CrossRef]
  17. Miandad, R.; Rehan, M.; Barakat, M.A.; Aburiazaiza, A.S.; Khan, H.; Ismail, I.M.I.; Dhavamani, J.; Gardy, J.; Hassanpour, A.; Nizami, A.-S. Catalytic pyrolysis of plastic waste: Moving toward pyrolysis based biorefineries. Front. Energy Res. 2019, 7, 27. [Google Scholar] [CrossRef] [Green Version]
  18. Fulgencio-Medrano, L.; García-Fernández, S.; Asueta, A.; Lopez-Urionabarrenechea, A.; Perez-Martinez, B.B.; Arandes, J.M. Oil production by pyrolysis of real plastic waste. Polymers 2022, 14, 553. [Google Scholar] [CrossRef] [PubMed]
  19. Olalo, J.A. Pyrolytic oil yield from waste plastic in quezon city, Philippines: Optimization using response surface methodology. Int. J. Renew. Energy Dev. 2022, 11, 325–332. [Google Scholar] [CrossRef]
  20. Kiran, N.; Ekinci, E.; Snape, C.E. Recycling of plastic wastes via pyrolysis. Resour. Conserv. Recycl. 2000, 29, 273–283. [Google Scholar] [CrossRef]
  21. Miandad, R.; Barakat, M.A.; Aburiazaiza, A.S.; Rehan, M.; Ismail, I.M.I.; Nizami, A.S. Effect of plastic waste types on pyrolysis liquid oil. Int. Biodeterior. Biodegrad. 2017, 119, 239–252. [Google Scholar] [CrossRef]
  22. Almohamadi, H.; Alamoudi, M.; Ahmed, U.; Shamsuddin, R.; Smith, K. Producing hydrocarbon fuel from the plastic waste: Techno-economic analysis. Korean J. Chem. Eng. 2021, 38, 2208–2216. [Google Scholar] [CrossRef]
  23. Son, J.-I.; Lee, S.-J.; Park, S.-I.; Kwon, E.-H.; Namkung, H.; Kang, J.-G.; Lee, W. Emission characteristics of polychlorinated dibenzo-p-dioxins/dibenzofurans (PCDD/DFs) in commercial bio-SRF and SRF incineration plants. Energies 2022, 15, 2787. [Google Scholar] [CrossRef]
Figure 1. Schematic diagram of pyrolysis facilities using plastic waste. (a) Facility A (pyrolyzer: screw reactor); (b) facility B and C (pyrolyzer: rotary drum reactor); (c) facility D (pyrolyzer: fixed-bed reactor).
Energies 15 04317 g001
Figure 2. Pyrolysis gas components and concentration.
Energies 15 04317 g002
Figure 3. Ternary plot of plastic waste feedstock with respect to oil yield: (a) PP, HDPE + LDPE and PS; (b) PS, LDPE and HDPE.
Energies 15 04317 g003
Figure 4. Relationship between plastic waste and oil yield: (a) relationship between PS + PE and oil yield; (b) relationship between PP and oil yield.
Energies 15 04317 g004
Table 1. Classification of waste feedstock into pyrolyzer (Unit: wt%).
FacilityPlastic TypeOther Materials 1
PPPSHDPELDPEOTHERUnknown
A3.411.114.114.98.224.224.1
B2.81.316.923.827.025.23.0
C8.15.115.514.327.413.416.2
D---99.6--0.4
1 Solid residue except plastic waste in the feedstock.
Table 2. Physical and chemical properties of pyrolysis feedstock and residue.
Facility AFacility BFacility CFacility D
FeedstockResidueFeedstockResidueFeedstockResidueFeedstockResidue
Three components
(Air-dry basis, wt%)
Moisture6.30.51.79.6 19.27.3 26.00.6
Combustible86.542.695.540.788.049.192.955.8
Ash7.256.92.849.72.843.61.143.6
Proximate analysis
(Dry basis, wt%)
Volatile matter90.035.196.124.494.335.797.330.0
Fixed carbon2.99.12.419.12.515.71.524.1
Ash7.155.81.556.53.248.61.245.9
Ultimate analysis
(Dry basis, wt%)
C70.9250.8280.5521.5475.8531.1484.9343.84
H11.391.6313.161.4011.702.4613.451.14
N0.200.710.160.310.210.360.080.36
S0.260.290.050.140.040.140.080.45
Metal (mg/L)CdN.D.0.0020.0040.007N.D.0.020N.D.0.001
Pb0.0110.1860.0090.0420.0760.2880.0830.215
As0.006N.D.0.006N.D.N.D.N.D.0.016N.D.
Cu0.1630.5270.1350.2610.1410.2750.1960.736
Higher heating value (kcal/kg)867834549848131689562324101564018
Ignition temperature (°C)422.4421.9395.1397.5467.0543.3398.6470.6
1,2 Water is added into the pyrolyzer for the elimination of flying fine dust after pyrolysis.
Table 3. Characteristics of pyrolysis oil product.
FacilityOil TypeAsh (wt%)Moisture and Sediment
(vol.%)
Sulfur (wt%)Residual Carbon (wt%)Metal (mg/L)
CdPbCrAs
AMixed oil (Light + Heavy)0.03N.D.0.090.03N.D.0.0100.0020.010
BHeavy oilN.D.N.D.0.05N.D.0.0010.0030.001N.D.
CHeavy oilN.D.N.D.0.060.030.0010.0010.002N.D.
D1st light oilN.D.N.D.0.09N.D.0.0010.0070.002N.D.
2nd light oilN.D.N.D.0.08N.D.0.0010.0030.001N.D.
Heavy oilN.D.0.300.090.01N.D.N.D.0.001N.D.
Table 4. Material balance of pyrolysis residue, oil, and gas (Unit: wt%).
FacilityResidueOilGas
A11.3840.1648.46
B17.5840.9341.49
C21.8837.6440.48
D14.5084.900.60
Table 5. Air pollutant concentration from each pyrolysis facility (Unit: ppm).
FacilityCONOxSOxH2S
A2.2107.9N.D.N.D.
B90.268.50.40.3
C99.272.43.80.2
D 1----
1 Facility D did not include an air pollutant emission device in the process.
Publisher’s Note: MDPI stays neutral with regard to jurisdictional claims in published maps and institutional affiliations.

