Article

An Assessment Method for the Impact of Electric Vehicle Participation in V2G on the Voltage Quality of the Distribution Network

College of Electrical Engineering and Information Engineering, Lanzhou University of Technology, Lanzhou 730050, China
*
Author to whom correspondence should be addressed.
Energies 2022, 15(11), 4170; https://doi.org/10.3390/en15114170
Submission received: 17 May 2022 / Revised: 29 May 2022 / Accepted: 2 June 2022 / Published: 6 June 2022
(This article belongs to the Section E: Electric Vehicles)

Abstract

:
In order to further evaluate the impact of vehicle-to-grid (V2G) on the distribution network, this paper studies a method to assess the influence of electric vehicles participating in charge and discharge on the voltage quality of the distribution network. First, considering the state of charge of the EV, the participation of the owner and other factors, the charging and discharging model is built. Then, the probabilistic power flow calculation based on Latin hypercube sampling is used to obtain the probability distribution of the voltage amplitude of the charge and discharge load connected to the distribution network, and finally the evaluation index is established to quantify and calculate the voltage quality of the distribution network participating in the V2G process of electric vehicles. Simulation results show that the evaluation method has the advantage of fast calculation speed while ensuring known accuracy, introduces the probability distribution of expected value and variance quantification of voltage amplitude, more intuitively understands the degree of influence on voltage quality before and after V2G, and can effectively assess the impact of electric vehicles accessing the distribution network in V2G mode on the power quality of low-voltage residential areas and industrial and commercial areas, and this evaluation method can provide useful reference for the formulation of future V2G control strategies and the planning of future urban power grids.

1. Introduction

With the rapid development of the electric vehicle industry, the power quality problems caused by the access of electric vehicles to the power grid have received more and more attention from the industry. As the charging load increases, the original power flow distribution in the power network will also change, resulting in problems such as three-phase imbalance and voltage deviation becoming increasingly prominent [1]. In addition, the batteries in the electric vehicles can also be used to discharge into the distribution grid, which is the V2G option. This will require a good realization of vehicle-network interaction between energy and information [2], so that the discharging into the network is orderly and occurs during peak demand periods, and charging occurs during trough periods. This would permit V2G to be used to balance the load curve and would reduce the impacts of electric vehicle charging and discharging on the power quality of the distribution network.
Charging load modeling is a prerequisite for the study of orderly vehicle-network interaction, the impact of electric vehicle access on the distribution network, and the location and capacity of charging facilities [3]. On the basis of Ref. [4], analyzing the travel rules of electric vehicles, a charging load probability model based on time variables is proposed, and the simulation method of Monte Carlo is used to complete the prediction of electric vehicle charging load [5]. Considering the correlation between electric vehicle charging load and historical charging behavior, a charging load prediction method for electric vehicles based on multi-related day scenarios is proposed. Ref. [6] based their study on the topological information of the road network and the randomness of the travel chain, and the coupling relationship between the road network and the power grid was constructed by graph theory in order to establish a spatio-temporal prediction model of electric vehicle load. Ref. [7] comprehensively considered the uncertainties such as SOC, parking time and time-sharing price of the vehicle, and analyzed the time and spatial distribution of the response power and charging load of electric vehicles in V2G by using fuzzy algorithm. Ref. [8] studied dynamic programming and put forward a distributed EV orderly participation in V2G regulation mode, and its simulation analysis in the V2G mode. Electric vehicle charge and discharge control is also an important topic. Ref. [9] coordinated the charging behavior of plug-in electric vehicles in smart grids in real time to minimize power losses and improve voltage curves. Ref. [10] aiming at the problem of orderly charging and discharging of large-scale electric vehicles, this paper proposes a kind of power system load spike problem caused by electric vehicle access in the distribution network, to realize the peak shaving and valley filling of the power system load. Refs. [11,12] load stabilization control strategies are established through the rational use of the vehicle’s ability to store energy. In summary, research work on the potential impact of electric vehicle charge and discharge on distribution networks is in fact quite important. However, there are few studies on the method of assessing the effect of EVs on the voltage quality of the distribution network in V2G mode.
In view of the above problems, this paper establishes a charging and discharging model based on the charging state of electric vehicles, user willingness, and other factors. It starts from the main influencing indexes of V2G connection on the voltage quality of the power system, and proposes a new idea for the voltage quality evaluation of a power system based on V2G technology, based on the probability power flow calculation of Latin super cube sampling, to obtain the probability distribution of the voltage amplitude of charge and discharge load connected to the distribution network, and finally establishes an evaluation index to quantify the voltage quality of the distribution network for electric vehicles participating in the V2G process. In order to adapt to the evaluation of the voltage quality of the distribution network of electric vehicles in the V2G mode, it provides a reference value for the wide promotion of V2G technology and the planning and construction of urban distribution networks.

2. V2G Model Based on EV Driving Characteristics

2.1. Electric Vehicle Charge-Discharge Model

2.1.1. Vehicle Arrival and Departure Times

The time for vehicles to go out is mainly in the morning and evening rush hours. The office space is generally the end of the first time to go out, and the entry time is mainly at 07:00–10:00 [13]. The closing hours are during the rush hour of another trip, between 17:00 and 19:00.
Charging is approximately normally distributed when the first travel arrival time of an electric vehicle follows a normal distribution [14,15], and its probability density function is represented by Equation (1).
y N f u x N 1 = U 0 , f x n 1 ( u )
where: μx = 7.9; бx = 1.
Assuming that the time td of the electric vehicle leaving the working area obeys the normal distribution of the variance of 1 h and the mean is 7.9, then the residence time of the electric vehicle Δtp can be calculated using Equation (2).
Δ t p = t d t a

2.1.2. Daily Mileage

Based on the traffic data of residents, the daily mileage of an EV x (unit: km) can be expressed as a log normal distribution, and Equation (3) is its probability density function.
f d x = 8 5 x σ d 2 π exp ln 5 x 3 ln 2 μ d 2 2 σ d 2
where in μd = 3.58; бd = 0.89.

2.1.3. The State of Charge before the Vehicle Participates in V2G

The remaining power of the electric vehicle battery determines the charging behavior of the owner, and the degree of discharge of the electric vehicle depends on the expected surplus power before the user travels. Although turning on the air conditioner in summer consumes the vehicle’s electricity due to seasonal and temperature reasons, according to previous car travel data, it is shown that the vehicle’s state of charge is not significantly affected by the climate [16], so the decisive factor affecting the state of charge of the vehicle is the daily mileage of the vehicle.
This article considers the departure of the vehicle to the arrival as a stage, then the state of charge at the time of the departure of the vehicle Eend is the initial state of the vehicle. Through the statistical analysis of the historical charging data of the vehicle, it is found that Eend ≤ 1 and basically follows N (0.94, 0.12). If Eend > 1, then Eend = 1. The state of charge at the time the vehicle arrives at the destination is expressed in Equation (4).
E s t a r t = E e n d x x max
In the Equation, xmax is the maximum travel distance when the electric vehicle is fully charged.

2.1.4. Charge and Discharge Time

In general, vehicles can participate in the discharge during the time period after arriving at the work area in the morning and returning home in the evening. Combined with the willingness of the owner and the method of probability analysis, assuming that the initial discharge time of the vehicle that can participate in the scheduling within 24 h is uniformly distributed in the discharge period, the probability density function when the vehicle begins to release electrical energy is:
f D x = 1 , x 8 , 16 18 , 23 0 , x 8 , 16 18 , 23
Based on the above constraints, Table 1 shows the potential charging and discharging behavior of the vehicle.
Assuming that the electric vehicle can be connected with the charging pile when it enters the destination, the time of charging and discharging the electric vehicle depends on the user’s willingness to participate, the charging and discharging power of the vehicle, and the amount of electricity. Take the maximum charge, discharge power Pc, where Pd is 8.1 kW. In order to improve the battery life of electric vehicles, it is assumed that vehicles participating in V2G scheduling can participate in up to two charges and discharges a day, in order to slow down the battery performance decline caused by excessive charge and discharge. In order to ensure the subsequent driving needs of the owner and the new peak period of electricity caused by multiple charge and discharge, the vehicles participating in the V2G adopt the first release and then charge mode.
Equation (6) is the charging length of the electric vehicle Tc during the second τ charge and discharge cycle, Equation (7) is the second τ charge and discharge cycle discharge time Td, and the scheduling time of the electric vehicle Δts is calculated by Equation (8).
T c = E e n d , τ + 1 E s t a r t , τ C P c η c , S e v = S c E e n d , τ + 1 E 1 C P c η c , S e v = S c , d
T d = E s t a r t , τ E e n d , τ + 1 C P d η d , S e v = S c E s t a r t , τ E 1 C P d η d , S e v = S c , d
Δ t s = T c + T d ,
where ηc and ηd are the charging and discharging efficiency of the vehicle, both take 0.92; the charging and discharging behavior type of the electric vehicle is Sev; the battery usable capacity of the electric vehicle is C; Sc,d, Sd, and Sc represents the vehicle charge and discharge, discharge only and charge only mode.

2.1.5. Feature Parameters and Classification Criteria

Table 2 shows the characteristic factors based on the charging history data of electric vehicles, which cause car owners to participate in the charging and discharging decision results [17].
According to the characteristic parameters in Table 2, the following rules for charging and discharging electric vehicles are established.
(1)
When Estart > E1, the EV can immediately participate in the V2G scheduling when it drives into the destination;
(2)
When EstartE1 and EendE1, the remaining power when the electric vehicle leaves can meet the owner’s subsequent car requirements;
(3)
If the electric vehicle participates in the V2G scheduling, calculate Δts and Δtp. If Δts ≤ Δtp, then the electric car is able to end charging and discharging during parking;
(4)
Compare the compensated electricity price with the charging price, if the pd > pc, then the owner is more willing to participate in the discharge. Referring to China’s time-sharing electricity price, the highest pc takes 0.9947 yuan/(kW·h).
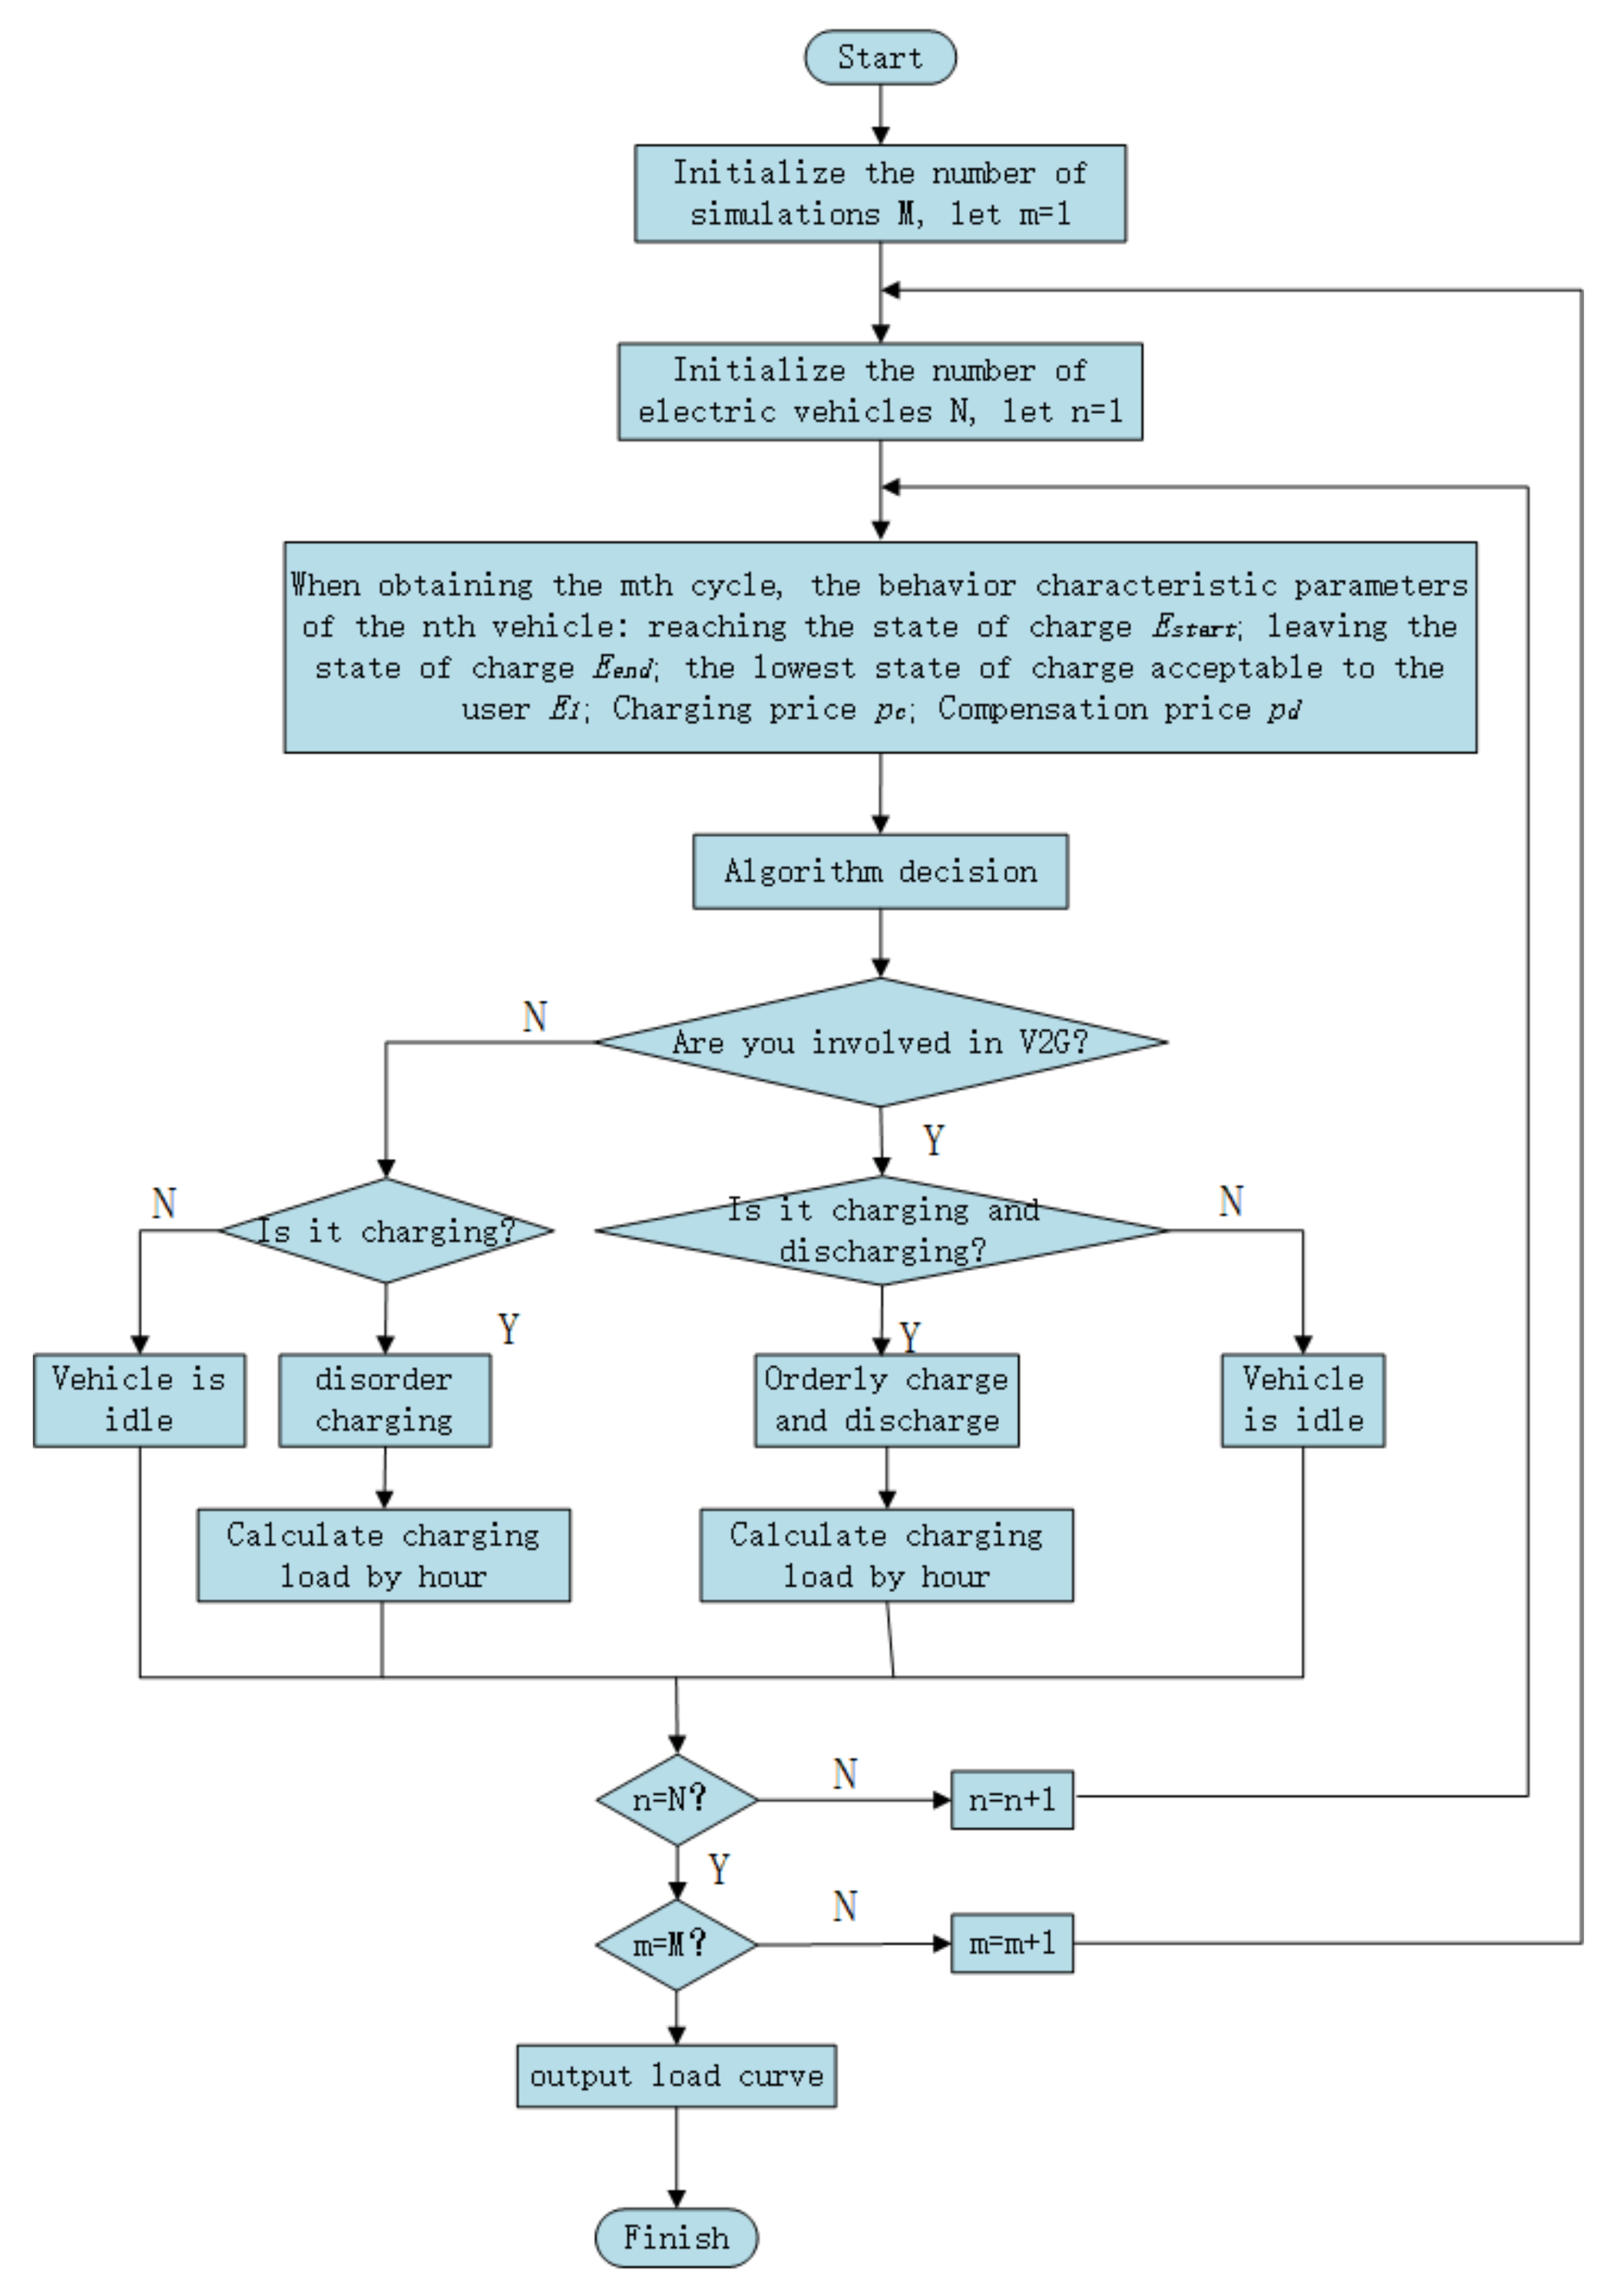
In summary, only when the four conditions of pd > pc, Δts ≤ Δtp, EendE1, EstartE1 are met, then electric vehicles are likely to participate in V2G scheduling, otherwise electric vehicles will not participate in V2G.
Figure 1 shows the vehicle participating in the V2G prediction process.
The single EV prediction process is as follows:
(1)
Simulated driving state: First, the arrival and departure time of the electric vehicle, the driving distance of the single day, the SOC before participating in the V2G, the charging and discharging time, and the charging price and compensation price expected by the user are extracted, and the remaining battery power when the electric vehicle is driven in, the time required for charging and discharging, and the docking time are calculated;
(2)
Whether to participate in V2G: Based on the number of features of vehicle charge and discharge behavior, random sampling is used to determine whether electric vehicles participate in V2G;
(3)
Calculation of V2G load: In the case of electric vehicle participation in charge and discharge scheduling, the V2G time and load of the vehicle are calculated; in the case that the electric vehicle does not participate in the charge and discharge scheduling, only the charging time and load of the EV are calculated;
(4)
Judge the total number of participating vehicles and go back to step 1 to cycle until the last electric vehicle is judged.
Based on the size of the electric vehicle scale, the vehicle is predicted, the above steps are repeated, and the charge and discharge load are accumulated in hours, and finally the vehicle charge and discharge load curve of the region is obtained.

3. EV Participates in the Power System Voltage Quality Assessment Method of Charge and Discharge

Traditional probabilistic research methods include approximation, analysis and simulation. The approximation method cannot estimate the magnitude of the error, the analytical method calculates faster, but the accuracy is not high, while the simulation method calculates with high accuracy but slower calculation speed. Simulation methods include Latin hypercube sampling method and Monte Carlo simulation method. Compared with the Monte Carlo method, the Latin hypercube sampling method can ensure that the sample values are within the distribution range of all input random variables, with good robustness, small error, high sampling efficiency, and can obtain higher accuracy with a small sample scale. Therefore, after obtaining the load model of electric private car participating in V2G, the probability power flow calculation of Latin super cube sampling is used to obtain the optimal node voltage in V2G mode, and finally the voltage deviation index is used to evaluate the voltage quality of the distribution network.

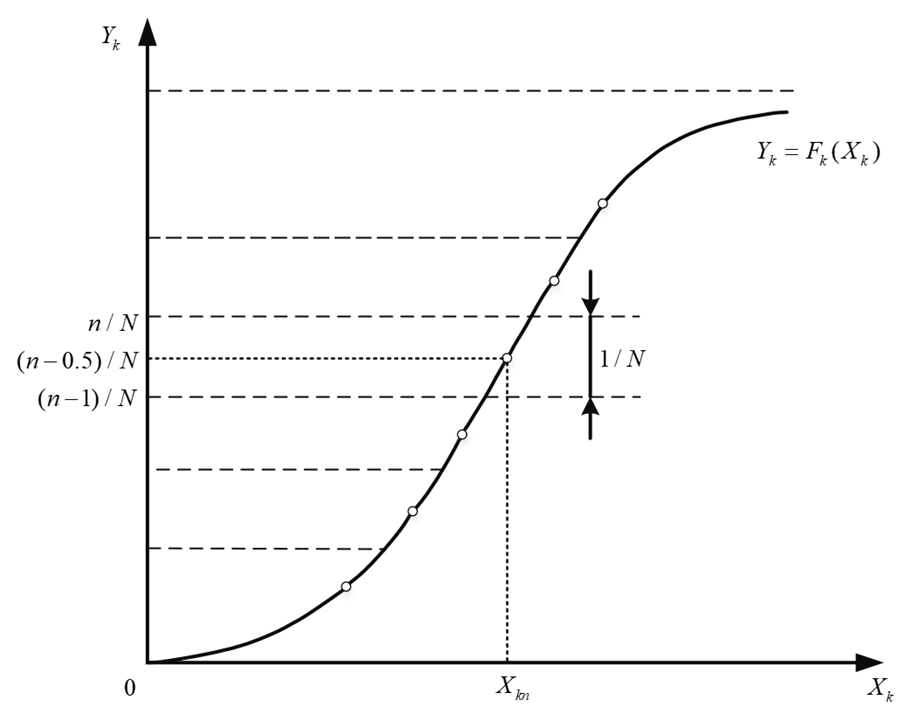
3.1. Latin Hypercube Sampling

Latin hypercube sampling is an efficient method for reflecting the overall distribution of an entire random variable in sampled numerical values. The goal is to ensure that the sample points can cover the entire sampling area. This method consists of two steps: sampling and arranging. The first step is to sample each input random variable to ensure that the entire sample point is completely covered to the area of the random distribution. In the second step, the order in which the sampled values of the random variables are arranged is adjusted so that the correlation between the samples is as low as possible.

3.1.1. Sampling

Assuming that X1, X2, ..., XK are the random variables K for which the solution is required, and XK is any of the random variables in X1, X2, ..., XK, then its cumulative probability distribution function is:
Y k = F k X k
If the sample size is expressed in N, the sampling method is: first divide the ordinate coordinate of Yk = Fk (Xk) into N equal intervals that are not overlapping parts, then the length of each interval is 1/N, the sampling value of Yk is the middle point of each interval, and the inverse function of Yk = Fk (Xk) is used to find the sample value of Xk:
x k n = F k 1 n 0.5 N ,   n = 1 , 2 , , N
A sampling diagram is shown in Figure 2.
The sampled values for each random variable are listed in a row in the matrix. After sampling of K random variables, all sampling values xkn constitute the initial sampling matrix of the K × N order, also known as the experimental matrix, which is expressed as:
X K N = X 11 X 12 X 1 N X 21 X 22 X 2 N X K 1 X K 2 X K N
Because the elements in the sampling matrix above are randomly combined, the degree of association between each column is uncontrolled and random.

3.1.2. Arrangement

Surveys have shown that when using the Monte Carlo method to solve for random variables with multiple inputs, the accuracy depends not only on the sampled values, but also on the relationship between the sampled values of each random variable. In general, the less the correlation, the higher the accuracy [18,19], so the main goal of the permutation is to reduce the correlation between any variable in the sampling matrix, the permutation in Equation (11) aims to reduce the correlation between the rows.
The degree of association of the rows of the K × N-order matrix V can be measured by a K × K correlation coefficient matrix ρ [20], the expression of which is as follows:
ρ = ρ i j , i = 1 , 2 , , K ; j = 1 , 2 , , K
In the equation, ρij is the coefficient of association between row i and row j, such as:
ρ i j = k = 1 K V i k V ¯ i V j k V j ¯ k = 1 K V i k V ¯ i 2 k = 1 K V j k V ¯ j 2
In order to facilitate the analysis of the correlation of the sample matrix, this paper uses the square mean root of the correlation coefficient matrix to represent:
ρ r m s = i = 1 K j = 1 K ρ i j 2 K K K 1
Florian proposed a way to reduce the correlation between the matrices using the Cholesky decomposition method [21], the basic idea was to reduce the correlation between the sample matrices by adjusting the positions of the elements in the sample matrix without changing the size of the LKN of the sample matrix.
The permutation matrix LKN is a matrix of the K × N order, and the numerical value of each row represents the arrangement of the corresponding row elements of the sample matrix XKN. Using the Cholesky decomposition method, the following steps can be obtained:
(1)
Initialize the permutation matrix LKN, each row of which contains an arbitrary permutation of l, 2, 3, ⋯, N;
(2)
Assuming that the correlation coefficient matrix of each row of LKN is ρL, then ρL is positively fixed and is a symmetric matrix, which is decomposed into a non-singular solid trigonometric matrix D using the Cholesky decomposition method:
ρ L = ρ L i j , i = 1 , 2 , , K ; j = 1 , 2 , , K = D D T
Since D is not singular and has an inverse matrix, combined with LKN, it is possible to form a set of matrices with low correlation coefficients:
G K N = D 1 L K N
Since the data in GKN is not necessarily a positive integer, the arrangement position of the elements cannot be directly represented in the sample matrix, so an effective method is to use the size ordering of the elements in the GKN to represent the arrangement position of the elements in the sample matrix, and repeat this step until the column correlation of the permutation matrix is less than the predetermined value.
The rows of the resulting sample matrix X represent all the sampled values of a random variable, while this column represents the input values of each random variable in a random simulation. Assuming that ρx is the correlation coefficient matrix between the columns of the sample matrix XKN, ρLrms and ρXrms are the degree of association between the rows of the arrangement matrix and the sample matrix, which can be found from Equation (15). It should be noted that ρx and ρL are not exactly the same, so ρLrms and ρXrms are also different, but we were able to find that smaller ρLrms lead to smaller ρXrms.

3.2. Comprehensive Evaluation Index of Voltage Quality

The evaluation of voltage quality includes three-phase imbalance, voltage deviation, harmonic limit, etc. This paper focuses on the study of voltage deviation, which is an important indicator of the power quality evaluation of the distribution network, that is, the power system in the normal working state, the difference between the measured voltage of a node, and the rated voltage of the percentage of the system rated voltage, that is:
Δ U = U r e U N U N × 100 %
Referring to GBT 29316-2012 “Technical Requirements for Power Quality of Electric Vehicle Charging and Replacing Facilities”, combined with the operation status of the actual distribution system, nodes with voltage amplitudes in the range of [0.95, 1.05] are considered to meet the voltage standards [22]. Through the method of probabilistic power flow model based on Latin hypercube sampling, the probability distribution of the voltage amplitude of each node in the power system is obtained, and the voltage deviation caused by the charge and discharge load is analyzed to quantify the voltage quality of the distribution network participating in the V2G process of electric vehicles.

4. Study Analysis

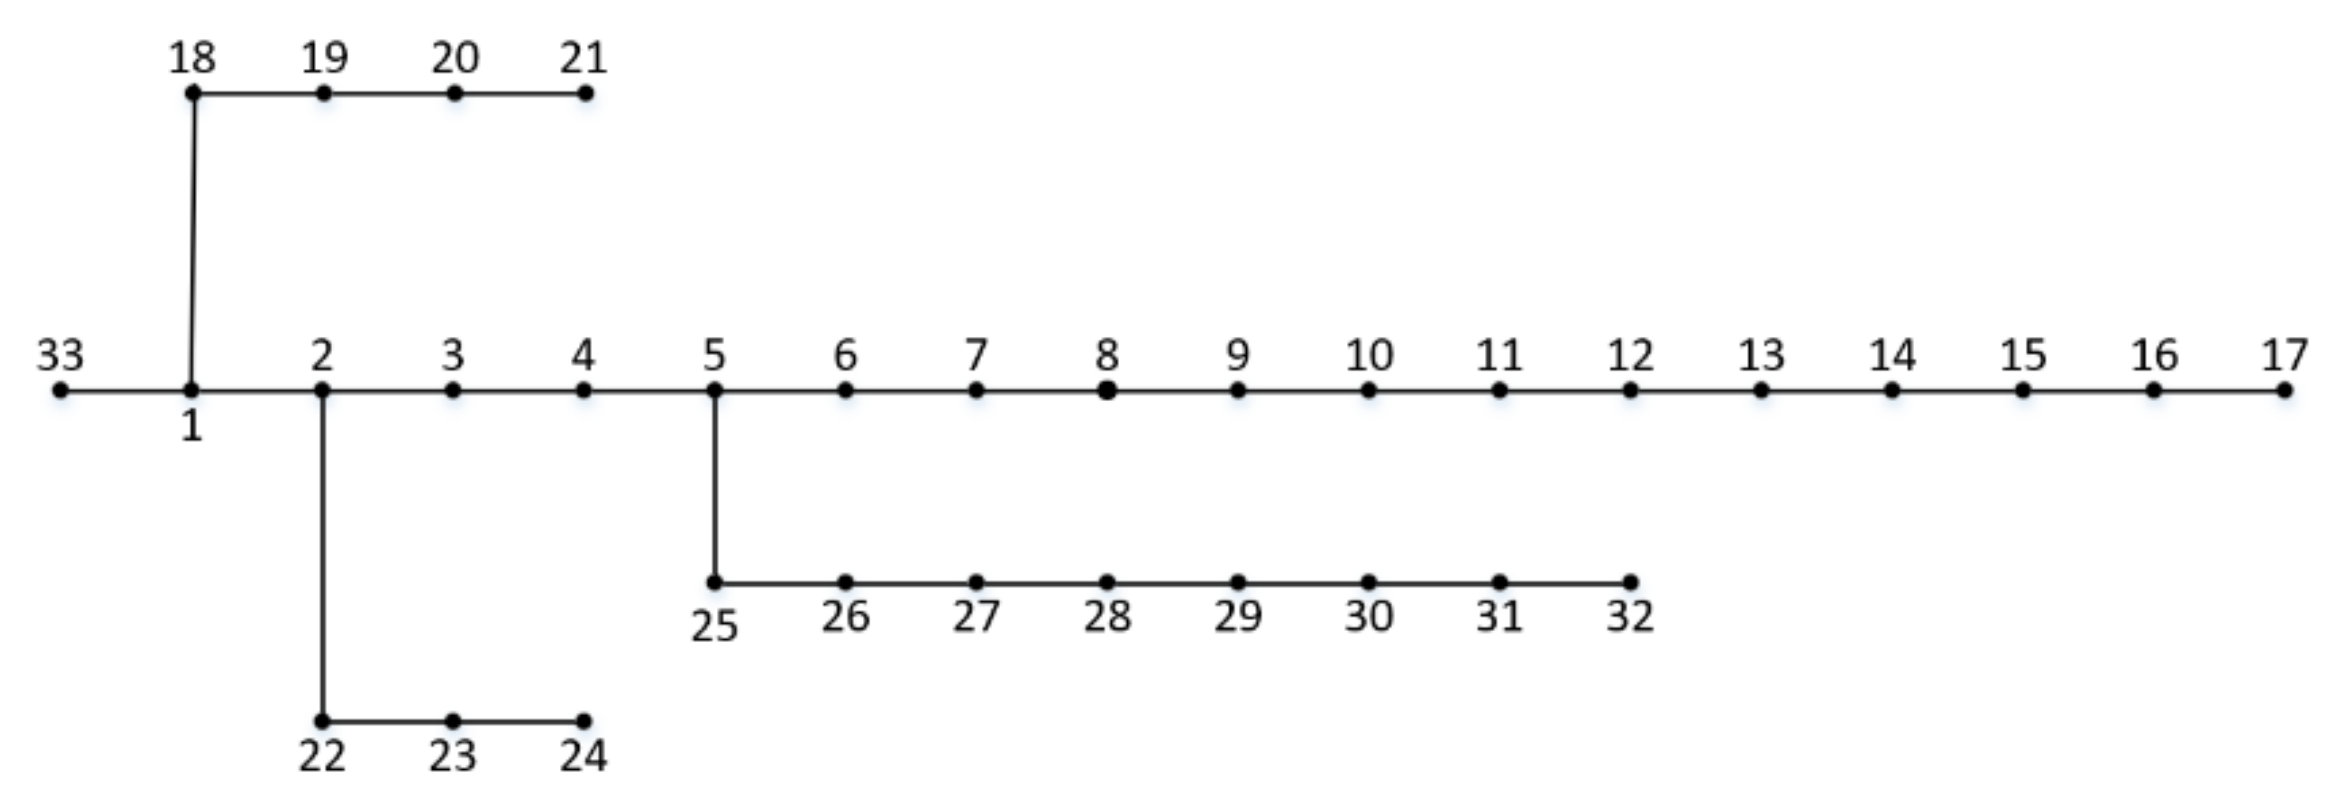
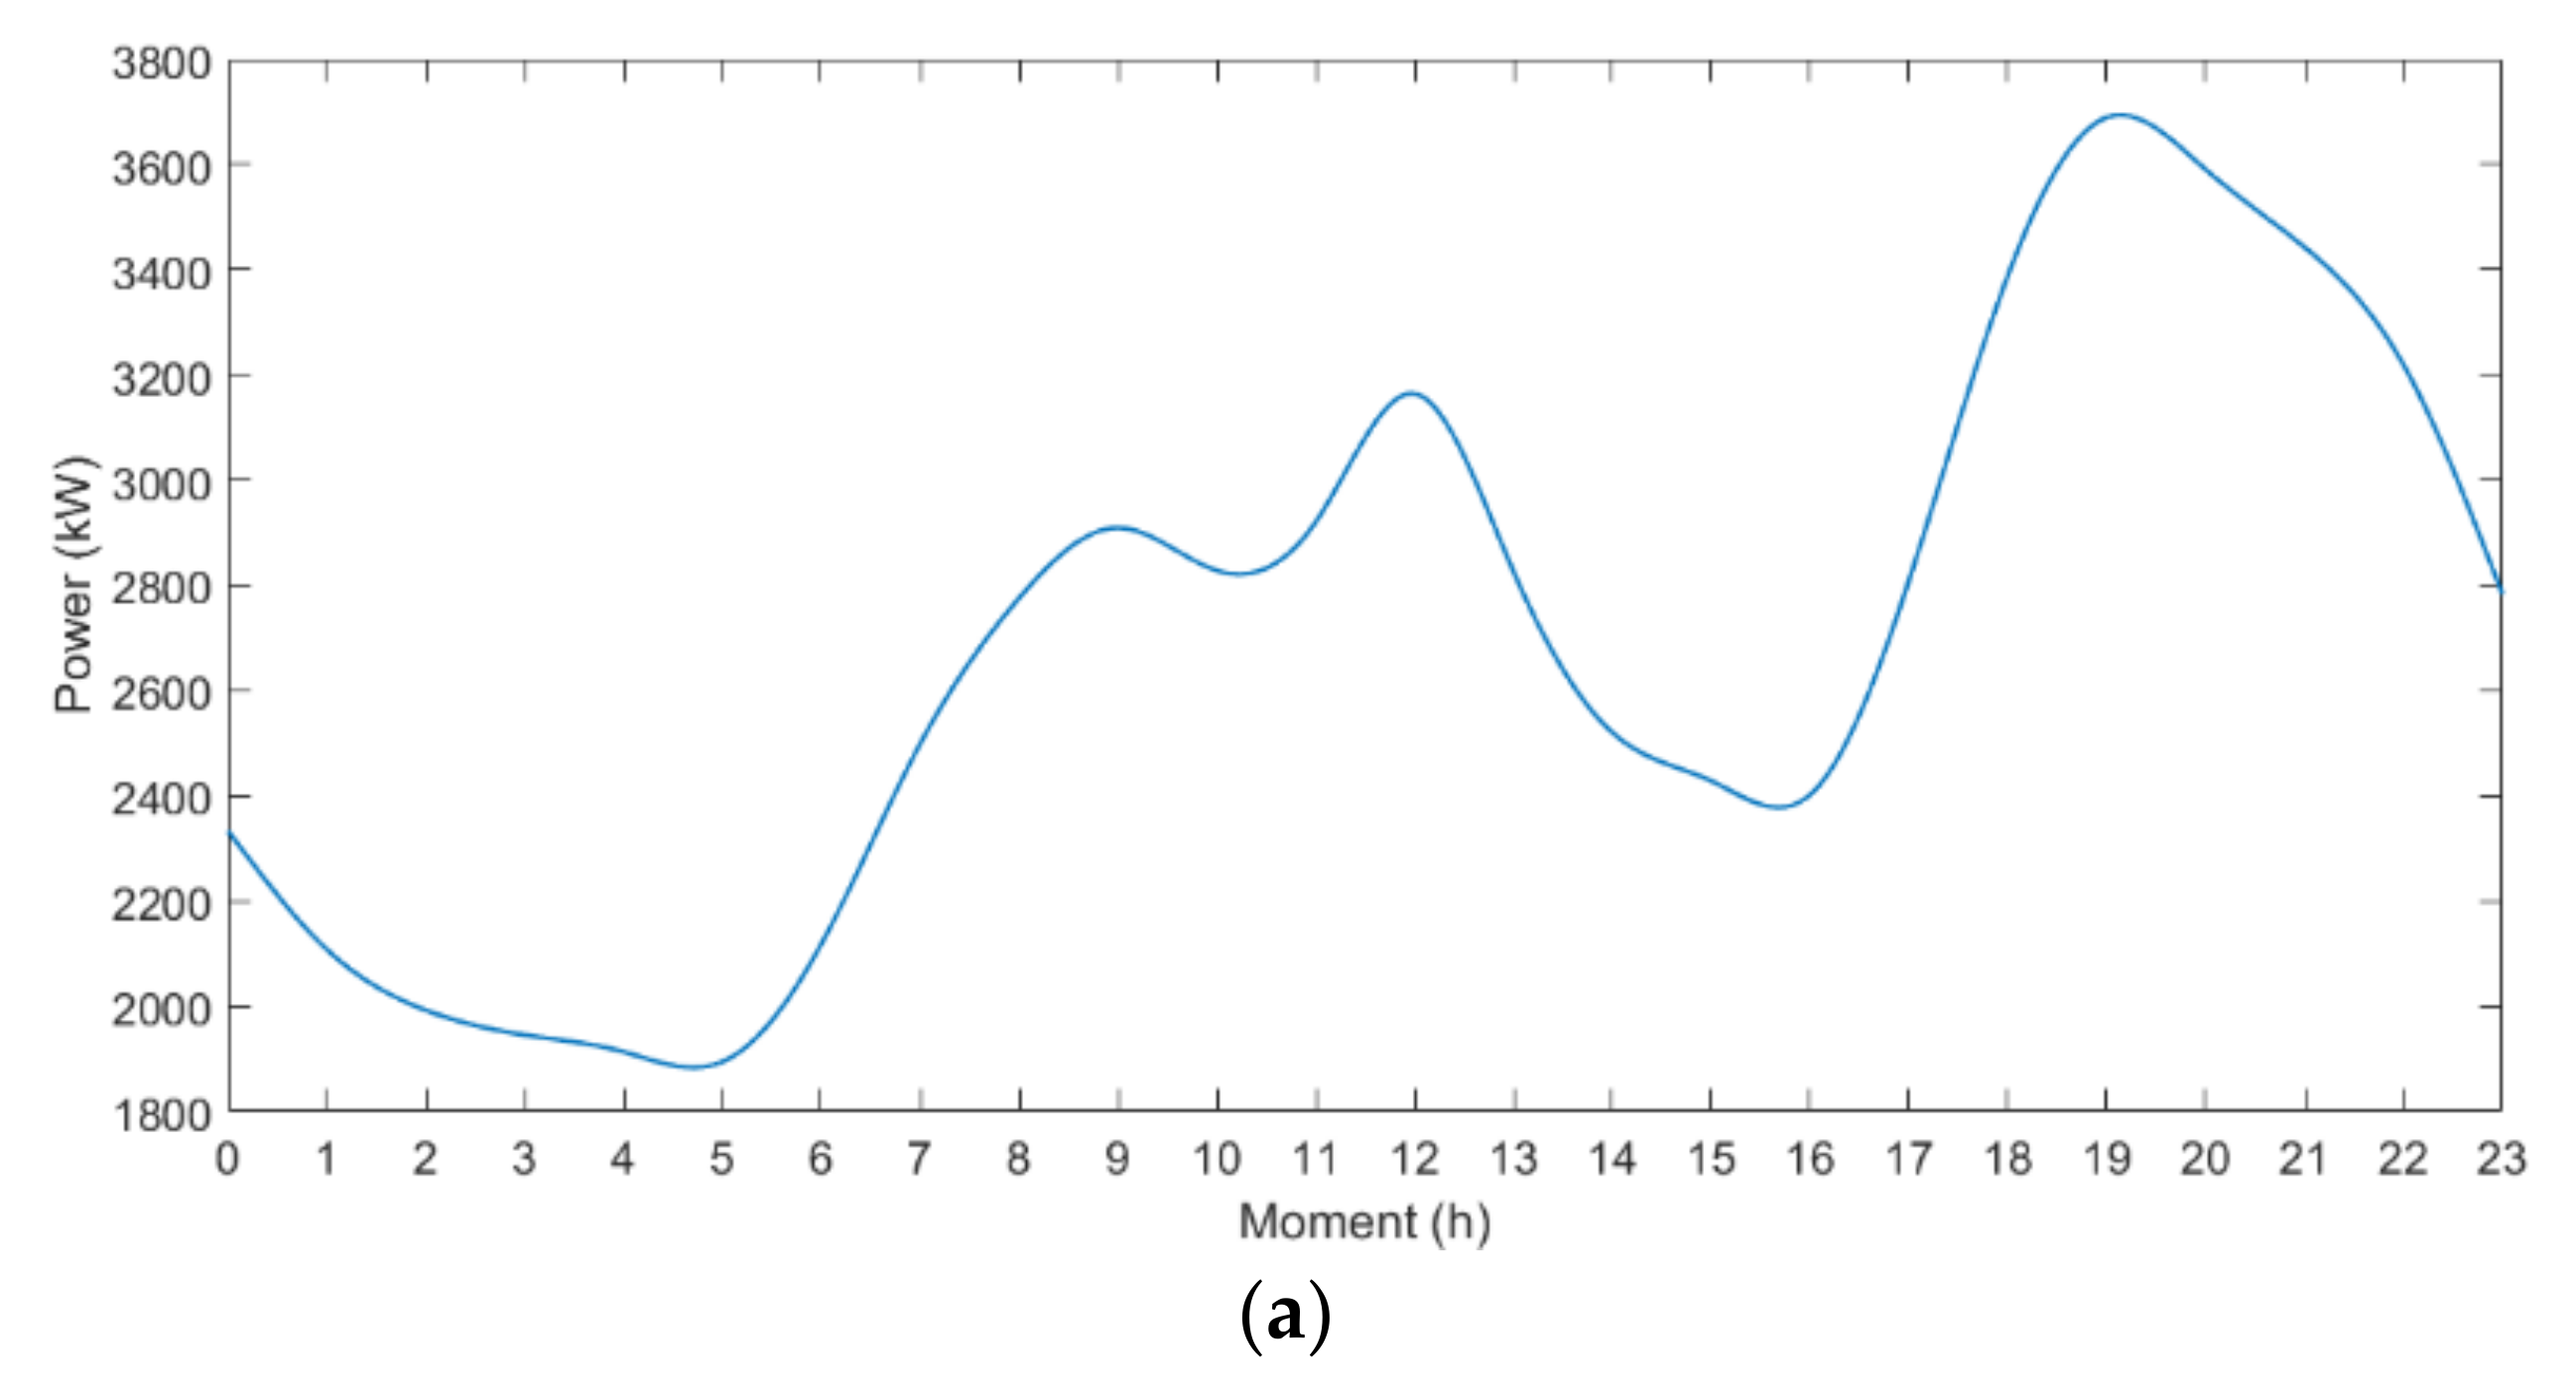
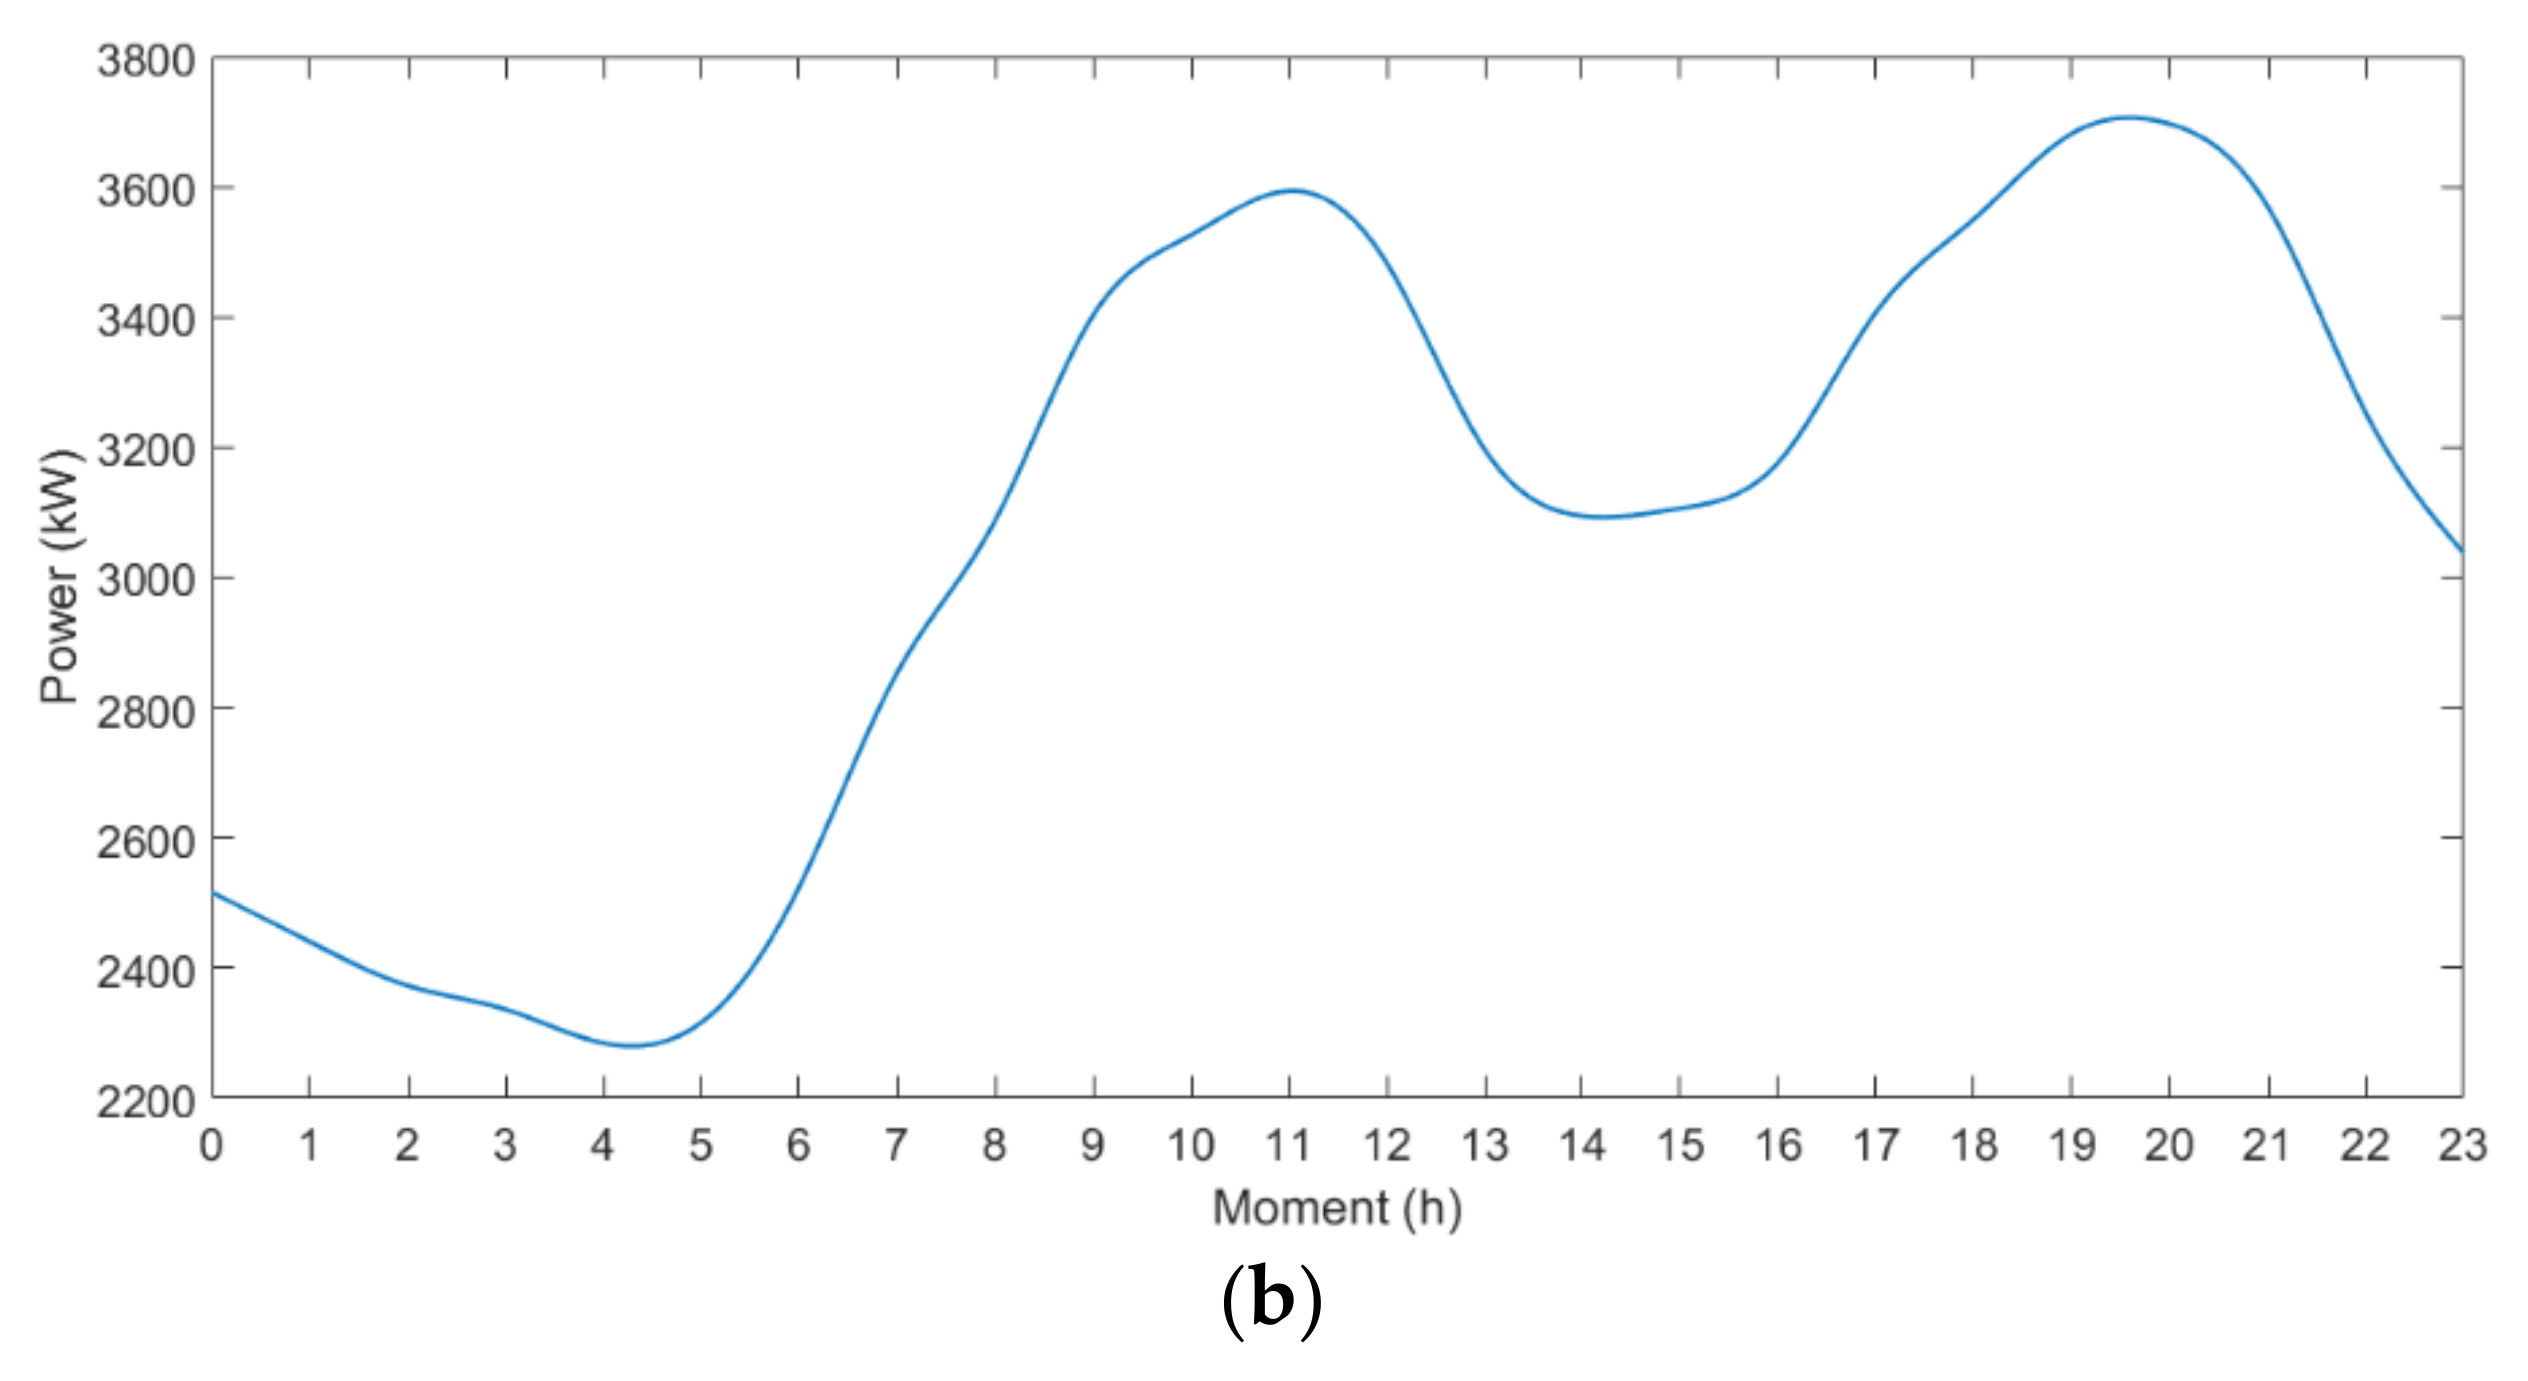
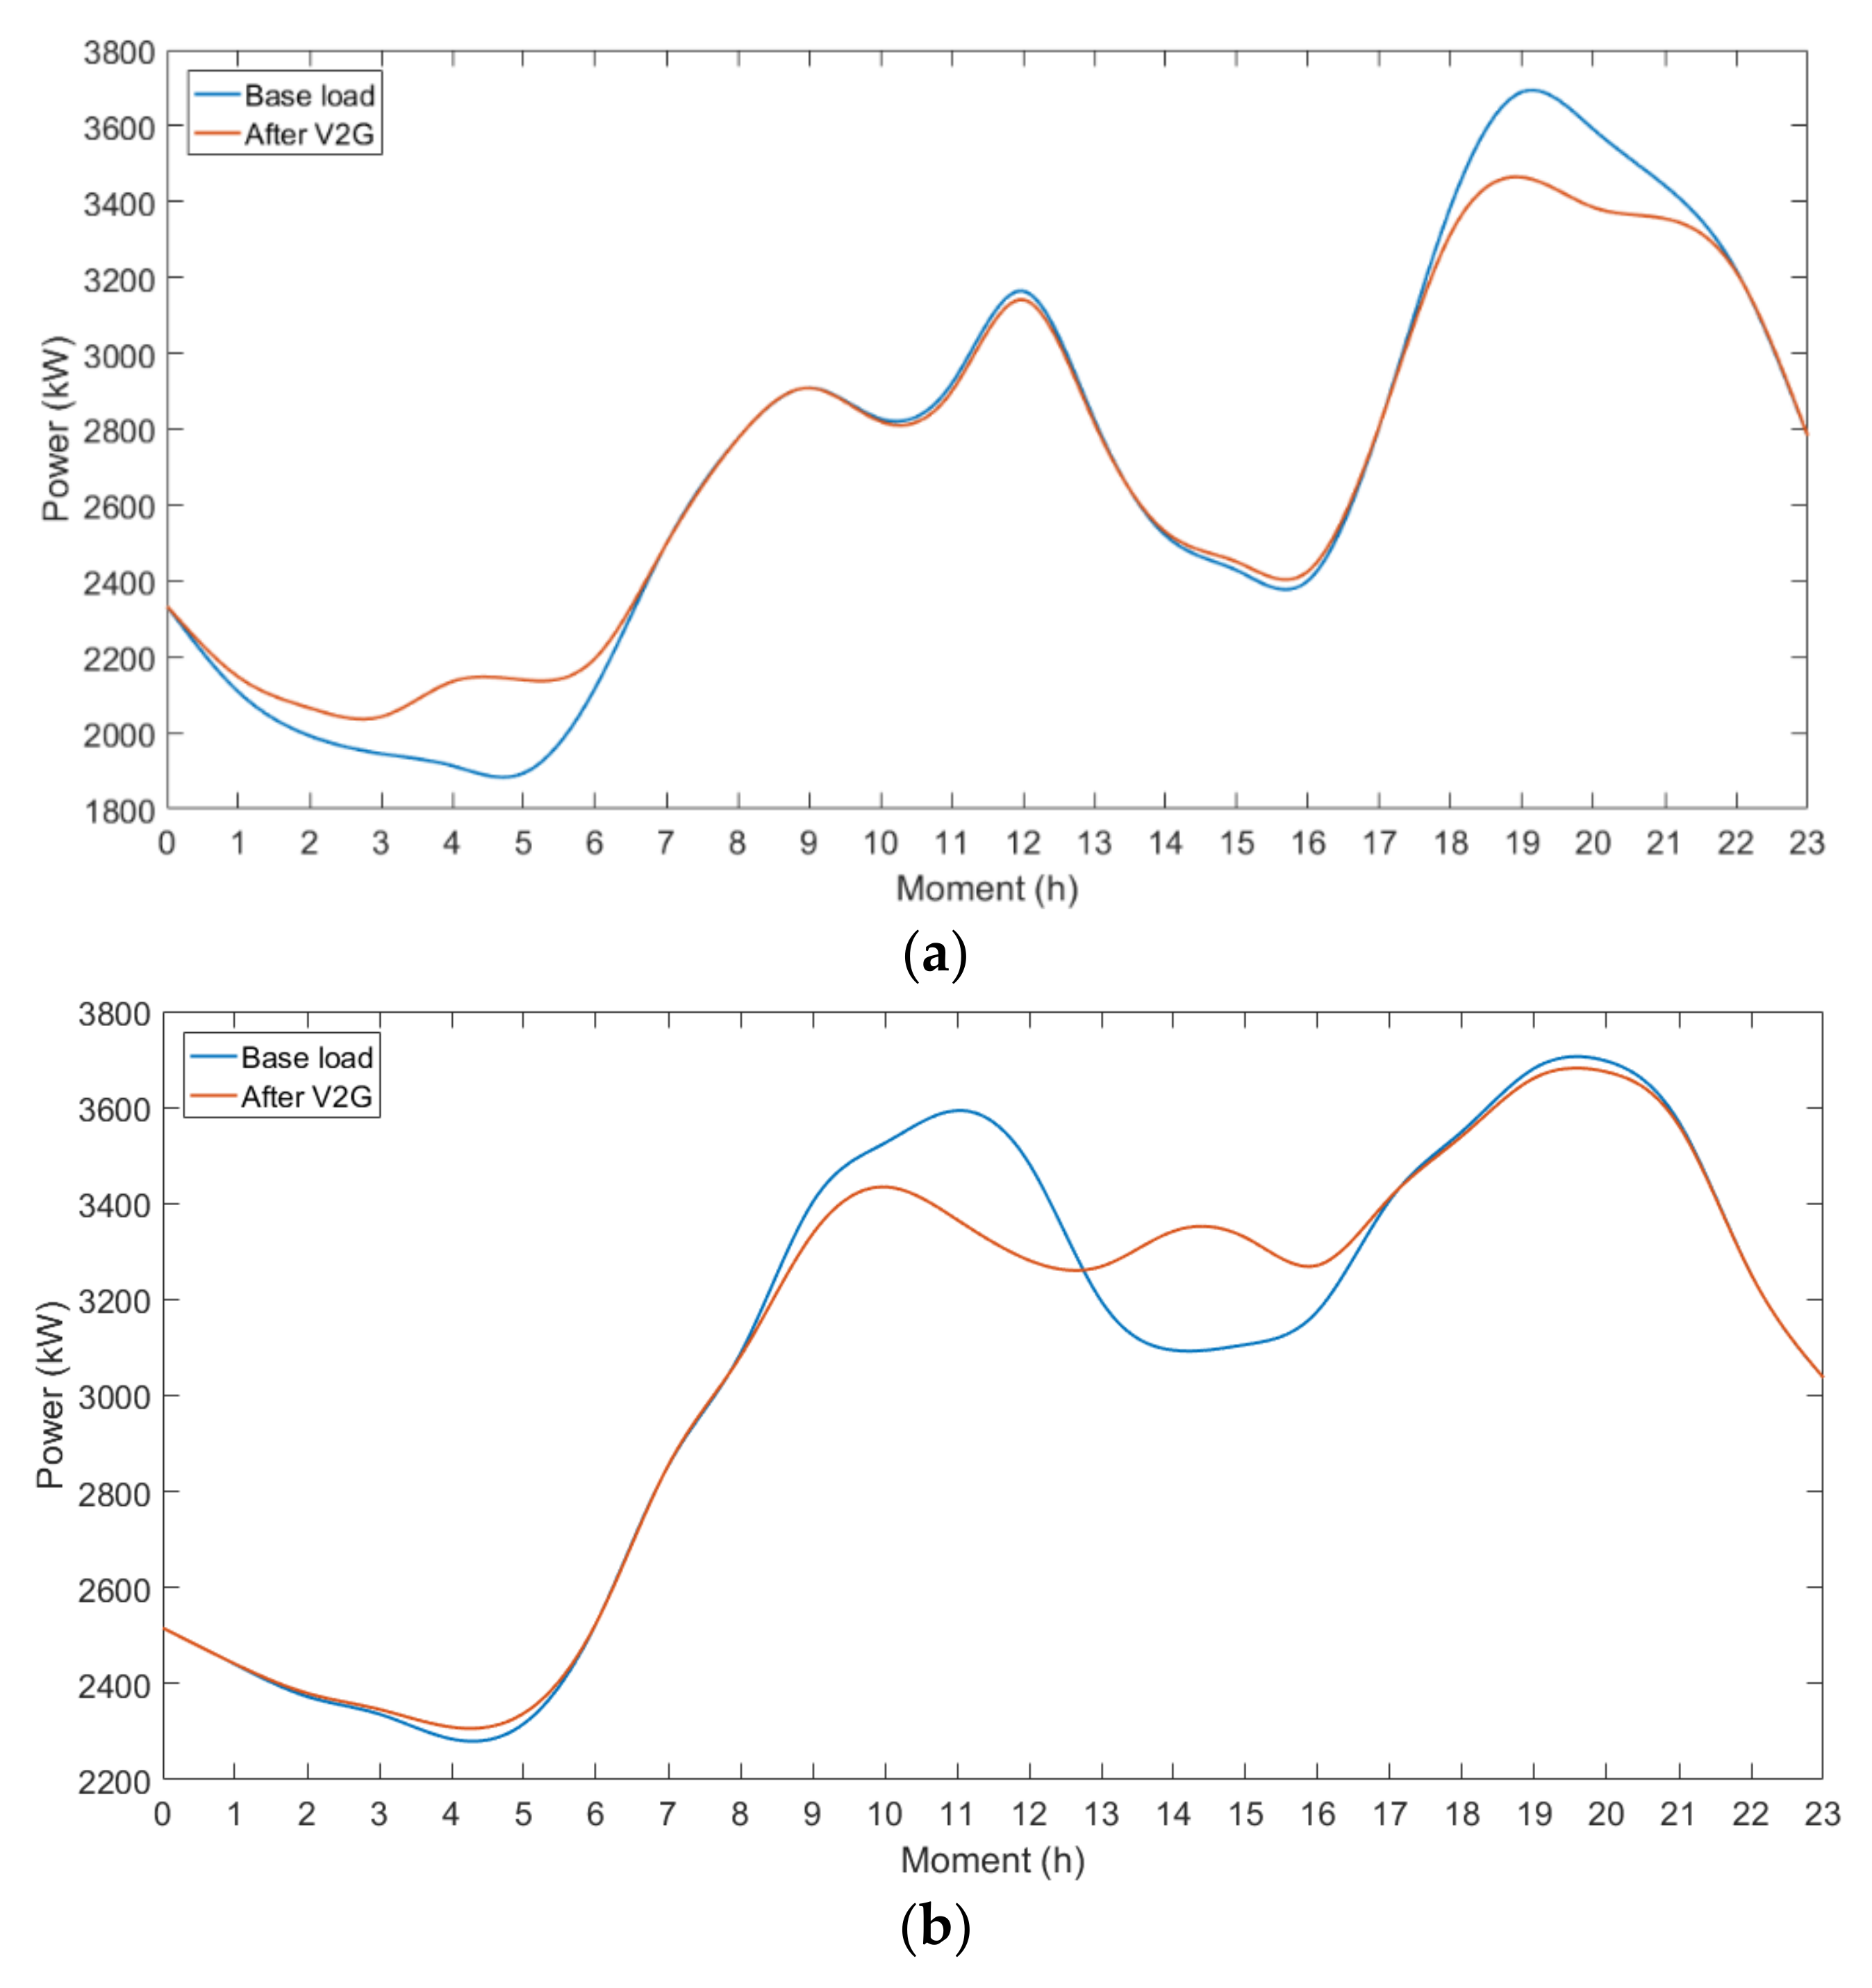
4.1. Example Description

In this paper, taking a certain type of electric private car with a battery capacity of 57 kW·h and a cruising range of 500 km as an example, in view of the impact of large-scale participation in V2G electric private car access on the voltage quality of the distribution network, this paper sets the scale of electric private cars to 200. User V2G engagement was 75% [23]. The V2G power of electric private cars is 8.1 kW; assuming that the V2G efficiency is 0.92, the battery emergency capacity coefficient μmin is 20%, that is, 11.4 kW·h. The 24 h of the day are divided into 24 identical periods, and the periods that can be connected to the power grid are after 8:00 to the unit and after 18:00 to home, that is, 8:00–13:00 and 18:00–23:00 for reasonable discharge, and reasonable charging after 13:00 and 23:00 respectively after the discharge is completed to meet the needs of subsequent travel. Combined with factors such as the battery margin of the electric vehicle and the user’s willingness to participate in V2G, the discharge time is determined.
In this paper, the IEEE 33 node system of the distribution network is used as an example for simulation and analysis [24], and Figure 3 shows the topology diagram of the system.
The typical daily (a) low-voltage residents and (b) low-voltage industrial and commercial load curves of a certain area in Gansu Province, as shown in Figure 4, are used. As can be seen from the curve, peaks are reached around 12:00 and 19:00 in low-pressure residential areas, and troughs are reached around 5:00 and 16:00. The low-pressure industrial and commercial area peaks around 11:00 and 19:30, and reaches a trough at 4:30 and 14:00.

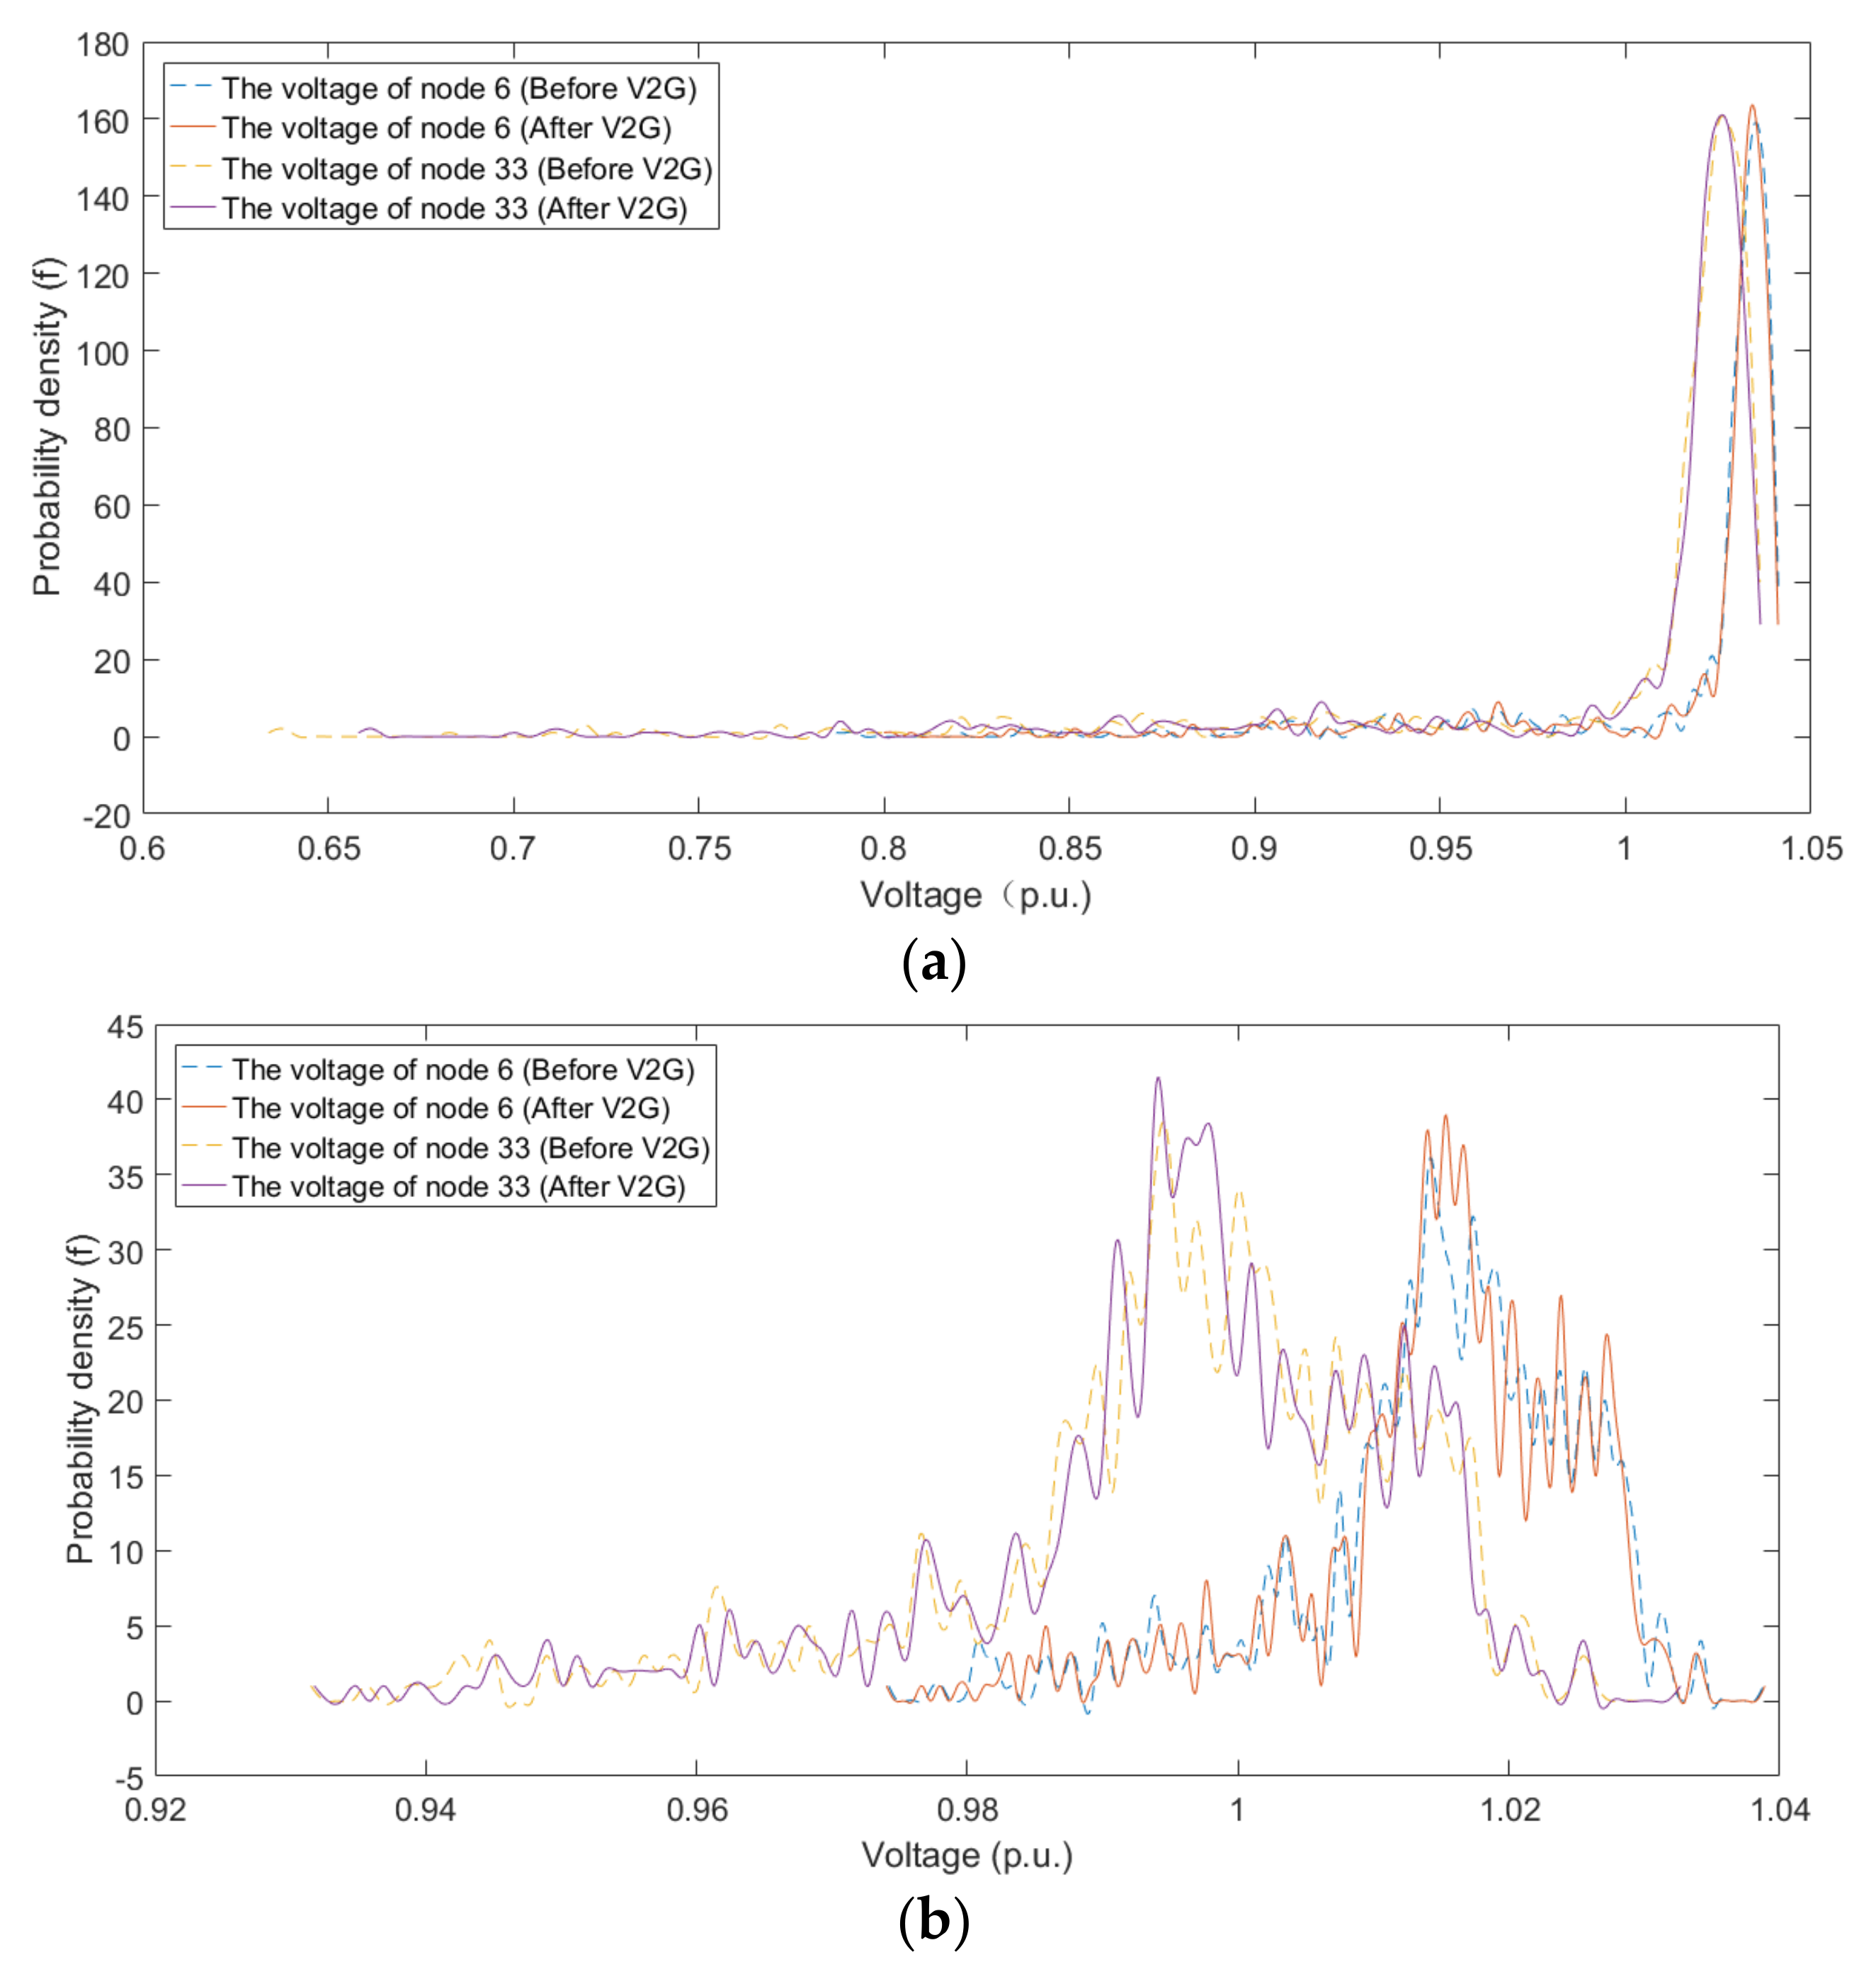
4.2. Simulation Result Analysis

Using the Monte Carlo method [25], the initial charge and discharge time, driving distance, and SOC at the end of the EV are sampled, the charge and discharge power of each time period is simulated, and the total charge and discharge power curve of each time period is obtained. The daily load of charging and discharging electric vehicles for low-voltage industrial and commercial and low-voltage residents is shown in Figure 5a low-voltage residents and Figure 5 blow-voltage industrial and commercial vehicles:
As can be seen from Figure 5, in the case of considering V2G, electric private cars in the two periods 08:00–13:00 and 18:00–23:00 [26], according to the remaining battery power and user participation to the grid discharge, after the end of discharge for reasonable charging, in low-voltage residential areas, the reasonable charge and discharge of electric vehicles effectively played a role in peak shaving and valley filling. Additionally, in low-voltage industrial and commercial areas most of the electric vehicles were parked in this area during the day and drove away at night. Therefore, the participation of electric vehicles in V2G can only improve the peak-to-valley difference during the day, while the improvement effect of the peak-to-valley difference at night is not obvious. Under the condition of V2G, the connection of electric vehicles with the power grid can not only transfer the charging load during peak periods, but also provide power to the grid during peak periods to reduce peak-to-valley difference and achieve the purpose of peak shaving and valley filling.
In this paper, the load data of low-voltage residential areas and low-voltage industrial and commercial areas before and after participating in V2G are compared and analyzed based on the probability power flow calculation of Latin hypercube sampling, and Figure 6 shows the voltage amplitude probability distribution of nodes 6 and 33 before and after (a) low-voltage residential area and (b) low-voltage industrial and commercial area V2G. As can be seen from the figure, the voltage amplitude difference between the front and back nodes of V2G is small.
Figure 6 only reflects the probability distribution of the voltage amplitude of certain nodes, and to fully evaluate the accuracy of the evaluation method, the mean value of the voltage amplitude (the expected value of the voltage at this node) and the variance are calculated for analysis [27]. Table 3 and Table 4 are the mean and variance of the voltage amplitudes of the remaining nodes, except node 1 in low-voltage residential areas and low-voltage industrial and commercial areas.
As can be seen from Table 3, in low-voltage residential areas, after considering V2G, the mean value of the voltage amplitude increases. The mean value increases when it is less than 1, when it is closer and closer to 1, and, when it is 1, the maximum increase is no more than 1.05, so the pass rate increases and the variance decreases; the smaller the variance, the smaller the node voltage fluctuation. Therefore, the participation of electric vehicles in low-voltage residential areas with V2G can effectively improve the voltage quality of the distribution network.
It can be seen from Table 4 that in the low-voltage industrial and commercial areas, after considering V2G, the average value of the voltage amplitude is close, and the voltage pass rate is not much different; the variance is reduced and increased, and the overall voltage fluctuation is not significantly reduced.

5. Conclusions

In this paper, an evaluation method is proposed to evaluate the impact of large-scale EV participation in the V2G process on the voltage quality of the distribution network by analyzing the situation in which electric vehicles are connected to the distribution network as charging and discharging loads. Combined with the charging state of electric vehicles, user willingness and other factors, a charge-discharge model is established. The probabilistic power flow model based on Latin super cube sampling is used to solve the power flow, obtain the probability distribution of the voltage amplitude of the charge and discharge load connected to the distribution network, and then evaluate the voltage quality of the distribution network by the participation of electric vehicles in the V2G process. Finally, taking the IEEE33 node as an example, the simulation analysis of electric vehicles connected to the distribution network is carried out, and the simulation results show that the evaluation method quantifies the probability distribution of voltage amplitude before and after V2G, and more intuitively and effectively depicts the impact of electric vehicles accessing the distribution network in V2G mode on improving the voltage quality of low-voltage residential areas and low-voltage industrial and commercial areas, which can provide theoretical support for the formulation of future V2G control strategies and the planning of urban power grids.

Author Contributions

Writing—original draft, L.Z.; Writing—review & editing, W.C., H.L. and X.P. All authors have read and agreed to the published version of the manuscript.

Funding

National Natural Science Foundation of China: 51767017; National Natural Science Foundation of China: 52167014; Gansu Basic Rese arch Innovation Group Project: 18JRA133.

Institutional Review Board Statement

Not applicable.

Informed Consent Statement

Not applicable.

Acknowledgments

This work was supported by National Natural Science of China (51767017, 52167014), Gansu Basic Rese arch Innovation Group Project (18JRA133).

Conflicts of Interest

The authors declare no conflict of interest.

References

  1. Lyu, L.; Yang, X.; Xiang, Y.; Liu, J.; Jawad, S.; Deng, R. Exploring high-penetration electric vehicles impact on urban power grid based on voltage stability analysis. Energy 2020, 198, 117301. [Google Scholar] [CrossRef]
  2. Du, J.; Li, F.; Li, J.; Wu, X.; Song, Z.; Zou, Y.; Ouyang, M. Evaluating the technological evolution of battery electric buses: China as a case. Energy 2019, 176, 309–319. [Google Scholar] [CrossRef]
  3. Chen, L.D.; Zhang, Y. Antonio Figueiredo. A Review on Charging and Discharging Load Prediction of Electric Vehicles. Autom. Electr. Power Syst. 2019, 43, 177–197. [Google Scholar]
  4. Mckay, M.D.; Beckman, R.J.; Conover, W.J. A comparison of t hree met hods for selecting values of input variables in the analysis of output from a computer code. Technometrics 1979, 21, 2392245. [Google Scholar]
  5. Jirutitijaroen, P.; Singh, C. Comparison of simulation methods for power system reliability indexes and their distributions. IEEE Trans. Power Syst. 2008, 23, 486–493. [Google Scholar] [CrossRef]
  6. Leou, R.C.; Teng, J.H.; Lu, H.J.; Lan, B.R.; Chen, H.T.; Hsieh, T.Y.; Su, C.L. Stochastic analysis of electric transportation charging impacts on power quality of distribution systems. IET Gener. Transm. Distrib. 2018, 12, 2725–2734. [Google Scholar] [CrossRef]
  7. Liu, S.Y.; Chen, Y.P.; Leng, Z.W.; Su, Y.X.; Wang, H.T.; Liu, W.J. Orderly Charging and Discharging Scheduling Strategy for Electric Vehicles Considering the Demands of Both Users and Power Grid. In Proceedings of the 2021 China Automation Congress (CAC), Beijing, China, 22–24 October 2021; pp. 3434–3439. [Google Scholar]
  8. Chen, T.; Zhang, B.; Pourbabak, H.; Kavousi-Fard, A.; Su, W. Optimal routing and charging of an electric vehicle fleet for high-efficiency dynamic transit systems. IEEE Trans. Smart Grid 2016, 9, 3563–3572. [Google Scholar] [CrossRef]
  9. Deilami, S.; Masoum, A.S.; Moses, P.S.; Masoum, M.A.S. Real-time coordination of plug-in electric vehicle charging in smart grids to minimize power losses and improve voltage profile. IEEE Trans. Smart Grid 2011, 2, 456–467. [Google Scholar] [CrossRef]
  10. Lulăua, L.I.; Bică, D. Effects of Electric Vehicles on Power Networks. Procedia Manuf. 2020, 46, 370–377. [Google Scholar]
  11. Yu, H.; Chung, C.Y.; Wong, K.P.; Lee, H.W.; Zhang, J.H. Probabilistic load flow evaluation with hybrid latin hypercube sampling and cholesky decomposition. IEEE Trans. Power Syst. 2009, 24, 661–667. [Google Scholar] [CrossRef]
  12. Jirutitijaroen, P.; Singh, C. Reliability constrained multi-area adequacy planning using stochastic programming with sample-average approximations. IEEE Trans. Power Syst. 2008, 23, 504–513. [Google Scholar] [CrossRef]
  13. Beijing Institute of Transportation Development. 2020 Beijing Transportation Development Annual Report [EB/OL]; Beijing Institute of Transportation Development: Beijing, China, 2021. [Google Scholar]
  14. Rabiee, A.; Sadeghi, M.; Aghaeic, J.; Heidari, A. Optimal operation of microgrids through simultaneous scheduling of electrical vehicles and responsive loads considering wind and PV units uncertainties. Renew. Sustain. Energy Rev. 2016, 57, 721–739. [Google Scholar] [CrossRef]
  15. Pinto, D.R.; Arioli, V.T.; Hax, G.R.; Borges, R.T.; Teixeira, W.W. Analysis of the impact on power quality during the recharge of electric vehicles and vehicle-to-grid functionality. In Proceedings of the 2017 IEEE PES Innovative Smart Grid Technologies Conference Europe (ISGT-Europe), Turin, Italy, 26–29 September 2017; pp. 1–6. [Google Scholar]
  16. Tao, Y.; Huang, M.; Chen, Y.; Yang, L. Orderly charging strategy of battery electric vehicle driven by real-world driving data. Energy 2020, 193, 116806. [Google Scholar] [CrossRef]
  17. Iman, R.L.; Conover, W.J. Small sample sensitivity analysis techniques for computer models, with an application to risk assessment. Commun. Stat. Theory Methods 1980, 9, 1749–1842. [Google Scholar] [CrossRef]
  18. Florian, A. An efficient sampling scheme: Updated latin hypercube sampling. Probabilistic Eng. Mech. 1992, 7, 123–130. [Google Scholar] [CrossRef]
  19. Iman, R.L. Uncertainty and sensitivity analysis for computer modeling applications. ASME Aerosp. 1992, 28, 153–168. [Google Scholar]
  20. Gan, L.; Li, N.; Topcu, U.; Low, S.H. Exact convex relaxation of optimal power flow in radial networks. IEEE Trans. Autom. Control 2014, 60, 72–87. [Google Scholar] [CrossRef] [Green Version]
  21. Morales, J.M.; Perez-Ruiz, J. Point estimate schemes to solve the probabilistic power flow. IEEE Trans. Power Syst. 2007, 22, 1594–1601. [Google Scholar] [CrossRef]
  22. Chen, X.; Ye, L.H.; Huang, T.C. Reliability Analysis of Microgrid Based on Minimum Peak Load Model of Electric Vehicle. Power Syst. Prot. Control 2019, 47, 47–54. [Google Scholar]
  23. Ju, Y.T.; Wu, W.C.; Zhang, B.M. Problem of divergence of forward-pushing back generation trend caused by internal impedance of distributed generation. Proc. CSEE 2014, 34, 6185–6190. [Google Scholar]
  24. Deb, S.; Tammi, K.; Kalita, K.; Mahanta, P. Impact of electric vehicle charging station load on distribution network. Energies 2018, 11, 178. [Google Scholar] [CrossRef] [Green Version]
  25. Shi, P.; Zhou, J.; Gan, D.; Wang, Z. A rational fractional representation method for wind power integrated power system parametric stability analysis. IEEE Trans. Power Syst. 2018, 33, 7122–7131. [Google Scholar] [CrossRef]
  26. Zhu, J.Z.; Zhang, Y. Probabilistic load flow with correlated wind power sources using a frequency and duration method. IET Gener. Transm. Distrib. 2019, 13, 4158–4170. [Google Scholar] [CrossRef]
  27. Gruosso, G.; Maffezzoni, P.; Zhang, Z.; Daniel, L. Probabilistic load flow methodology for distribution networks including loads uncertainty. Int. J. Electr. Power Energy Syst. 2019, 106, 392–400. [Google Scholar] [CrossRef]
Figure 1. Electric vehicle charge and discharge prediction flow chart.
Energies 15 04170 g001
Figure 2. Schematic diagram of Latin hypercube sampling.
Energies 15 04170 g002
Figure 3. Topology diagram of an IEEE 33-node power distribution system.
Energies 15 04170 g003
Figure 4. Typical daily load in the region. (a) Typical daily load curve of low-voltage residential areas. (b) Typical daily load curve of low-voltage industrial and commercial areas.
Energies 15 04170 g004aEnergies 15 04170 g004b
Figure 5. Charge and discharge load of an electric private car. (a) Low-voltage residential EV participation in the V2G load curve. (b) Low-voltage industrial and commercial area EVs participate in the V2G load curve.
Energies 15 04170 g005
Figure 6. Probability distribution of voltage amplitude before and after nodes 6 and 33 V2G. (a) Low-pressure residential areas. (b) Low-pressure industrial and commercial area.
Energies 15 04170 g006
Table 1. Classification of charging and discharging behavior of electric vehicles.
CategoryDescription
Sc,dThe vehicle is involved in charge and discharge
SdVehicles are only involved in discharge
ScThe vehicle is only involved in charging
S0Vehicles are idle
Table 2. The characteristic factors for car owners to participate in V2G.
SymbolDescription
pdThe compensatory electricity price expected by the owner, yuan/(kW·h)
pcThe charging price expected by the owner, yuan/(kW·h)
ΔtpThe length of the vehicle’s downtime, h
ΔtsVehicle dispatch duration, h
EendThe state of charge when the vehicle leaves
E1The lowest state of charge acceptable to the owner
EstartThe state of charge at the time of arrival of the vehicle
Table 3. Mean and variance of node voltage amplitude before and after V2G in low-voltage residential areas.
NodeMeanVarianceNodeMeanVariance
Before V2GAfter V2GBefore V2GAfter V2GBefore V2GAfter V2GBefore V2GAfter V2G
21.04231.04260.00420.0040180.78580.79680.14540.1389
31.00491.00690.02460.0234191.04111.04150.00480.0046
40.98440.98710.03580.0342201.03301.03360.00920.0088
50.96390.96740.04710.0451211.03131.03200.01010.0096
60.91410.91960.07450.0743221.02981.03050.01090.0104
70.90260.90850.08080.0774230.99620.99890.02930.0277
80.88680.87320.08950.0856240.97970.98350.03820.0359
90.84550.85410.10130.0968250.97160.97620.04260.0398
100.84550.85410.11220.1073260.90940.91510.07700.0737
110.84260.85130.11390.1088270.90320.90910.08050.0770
120.83730.84630.11680.1116280.87810.88490.09420.0903
130.81540.82540.12900.1231290.86030.86770.10400.0997
140.80710.81740.13360.1276300.85210.85980.10850.1040
150.80140.81180.13670.1306310.83880.84740.11580.1109
160.79610.80670.13970.1335320.83580.84460.11750.1124
170.78820.79900.14410.1377330.83510.84390.11790.1128
Table 4. Mean and variance of voltage amplitudes of nodes before and after V2G in low-voltage industrial and commercial areas.
NodeMeanVarianceNodeMeanVariance
Before V2GAfter V2GBefore V2GAfter V2GBefore V2GAfter V2GBefore V2GAfter V2G
21.04741.04740.00110.0011180.97140.97080.03420.0345
31.03491.03490.00650.0065191.04691.04690.00140.0013
41.02851.02840.00940.0093201.04341.04360.00290.0027
51.02201.02200.00120.0012211.04271.04290.00320.0030
61.00681.00660.01880.0188221.04211.04230.00340.0033
71.00351.00320.02020.0203231.03161.03170.00790.0079
80.99900.99860.02220.0223241.02541.02560.01070.0105
90.99280.99250.02490.0250251.02251.02260.01190.0118
100.98730.98680.02730.0275261.00531.00510.01950.0195
110.98650.98600.02760.0278271.00331.00320.02030.0203
120.98500.98450.02830.0285280.99550.99540.02380.0237
130.97910.97850.03090.0311290.99000.99000.02620.0261
140.97680.97630.03180.0321300.98740.98740.02730.0273
150.97540.97480.03250.0328310.98350.98340.02900.0290
160.97400.97340.03310.0334320.98260.98260.02940.0294
170.97200.97140.03400.0342330.98240.98230.02950.0295
Publisher’s Note: MDPI stays neutral with regard to jurisdictional claims in published maps and institutional affiliations.

