1. Introduction
In view of the multifaceted challenge provided by the climate change, with more frequent, intense, and longer-lasting heat waves [
1], the technology of current HVAC (heating, ventilation and air conditioning) systems needs to be updated towards an improved resilience of their operation and reduced emissions [
2]. A target of restricting the median warming to 1.5 °C by the year 2100 has been set by global regulations [
3]; furthermore, it has been shown that the increasing trends in cooling energy demand in the last 30 years are more pronounced than the decreasing trends in heating [
4]. This happens due to a high correlation between overheating living spaces and worsening health conditions of the occupants [
5].
Investigating new technologies and HVAC design methods for the optimization of cooling systems towards energy efficiency, emissions reduction, and thermal comfort is therefore of the outmost importance in the current climate emergency.
The European Standard EN 15316-2 [
6] evaluates the efficiency of space emission systems as a sum of different cooling set-point offsets; these reflect any system inefficiencies regarding distribution, control, and emissions. Such a shifted set-point temperature is then used to compute the annual cooling energy demand by means of a discrete set of default values that are provided in the standard. Product-specific values or different tabulated values from national annexes can be used as well; however, the specific methods for their measurements and derivations of these parameters are not fully specified.
This paper tackles this issue by providing experimental evidence for a two-fold task: (i) comparing several different cooling devices to support the design of HVAC strategies and (ii) developing analytical/numerical methods for computing the values that are used in the annual cooling energy demand estimations.
Specifically, our measurements address four devices: radiant ceiling cooling panels (RCCPs), fan-assisted radiators, underfloor cooling, and fan coil units (FCUs). Traditionally, the focus of the vast majority of investigations has been on heating rather than on cooling; even comprehensive reviews of the actual research status typically address cooling and heating (see [
7] and references quoted therein). Whether and in what measure the radiant systems are better-performing than convective systems is not yet established [
8].
Ceiling radiant cooling panels (CRCPs) are widely investigated due to the various applications in both heating and cooling together with technical design perspectives on many aspects. A large number of studies exists, addressing simulations [
9] as well as experimental assessments: the cooling capacity and energy performance of CRCP systems can be improved in many different ways. An open-type CRCP system with air circulators provided a maximum increment of 26.2% in cooling capacity [
10], while segmented and concave surfaces provided an improvement in energy performance relatively to flat panels [
11]. The interaction of ceiling panels with changing boundary conditions within the room was investigated in [
12].
Panel radiators have been subject to performance testing not only for heating but also for cooling for decades, with earlier studies focusing on both experimental [
13] and modelling aspects [
14]. However, the interest has always been overwhelmingly in favor of heating; the fan-assisted design is also less commonly addressed although it has been experimentally proven to be very effective for cooling (see e.g., [
15]).
Underfloor cooling has been the object of intense research due to the structural similarity and operation with underfloor heating [
16] but also due to condensation risk and low cooling capacity [
17]; moisture condensation at the floor surface is usually avoided by supplying conditioned dry air within ventilation ducts [
18]. All in all, research papers on this topic are quite numerous, ranging from the implementation of phase-change materials (PCM) into the system design [
19] to thorough testing of the heat-transfer process occurring over the floor surface [
20].
Fan coil units (FCU) probably constitute the most traditional active cooling system; however, they are still widely adopted and constantly investigated due to their performance and variety of applications. These convective devices have proven to be a valid cooling solution until today and are even capable of outperforming radiative devices [
21], both concerning indoor temperature uniformity as well as energy performance [
22]. The authors of [
23] also found no significant difference between convective and radiant heating systems regarding thermal sensation. Unfortunately, problems with thermal comfort at higher cooling loads do exist with this system, mostly due to high air-flow rates being needed, which yield high velocities into occupied zones from the devices. This typically causes draught and is not pleasant for the occupant [
24].
Despite all these in-depth individual investigations, it is hard to find systematic analyses covering a wide choice of different systems. For instance, several studies about implementation of cooling devices for personal usage, such as the so-called personal comfort systems (PCS), have investigated their energy-saving potential in regards to usage behaviors [
25,
26]. However, a direct comparison between PCS devices is prevented by various experimental conditions such as temperature differences and clothing insulation [
27].
Radiant ceiling panels were compared to a fan-coil unit in [
28], which measured a more resilient and performing operation for the radiative (ceiling panel) compared to the convective unit (FCU). They also obtained a 14% decrease in pump energy use when using an operative temperature sensor to provide a feedback signal to the control system. Interestingly, this was one of the few studies to address the operative temperature, which is still rather overlooked.
In other words, although there exists a wide research and technical literature describing each single apparatus, comprehensive studies that indicate how these four cooling systems compare to each other under the same operating conditions cannot be found yet. The role of the operative temperature on thermal comfort has also been overlooked quite systematically. No studies indicating the parameter values that are needed to calculate the temperature deviation setpoints are present either, leaving the calculation of annual cooling energy demand to default values reported in the standards.
In this paper, we contribute to filling this research gap by means of a thorough experimental comparison of the cooling efficiency of four devices, both radiative and convective. After discussing each of them in detail as well as the overall methodology and measuring setup in
Section 2,
Section 3 reports vertical thermal gradients, operative temperatures, air velocities, surface temperatures, and the results of smoke visualizations. Our results are discussed in
Section 4, and conclusions are drawn in
Section 5.
2. Materials and Methods
An office-like situation with six desks was created in the testing facility, where heating dummies were used to imitate the thermal output from humans, and an additional cooling load was created with convective electric radiators. Temperature sensors were configured to collect data every 10 s. The study first considered the power output of four different cooling systems; afterwards, we addressed the effect of air movement that was generated by the systems on the indoor climate, including a visualization through smoke tests.
2.1. nZEB Test Facility at TalTech and General Setup
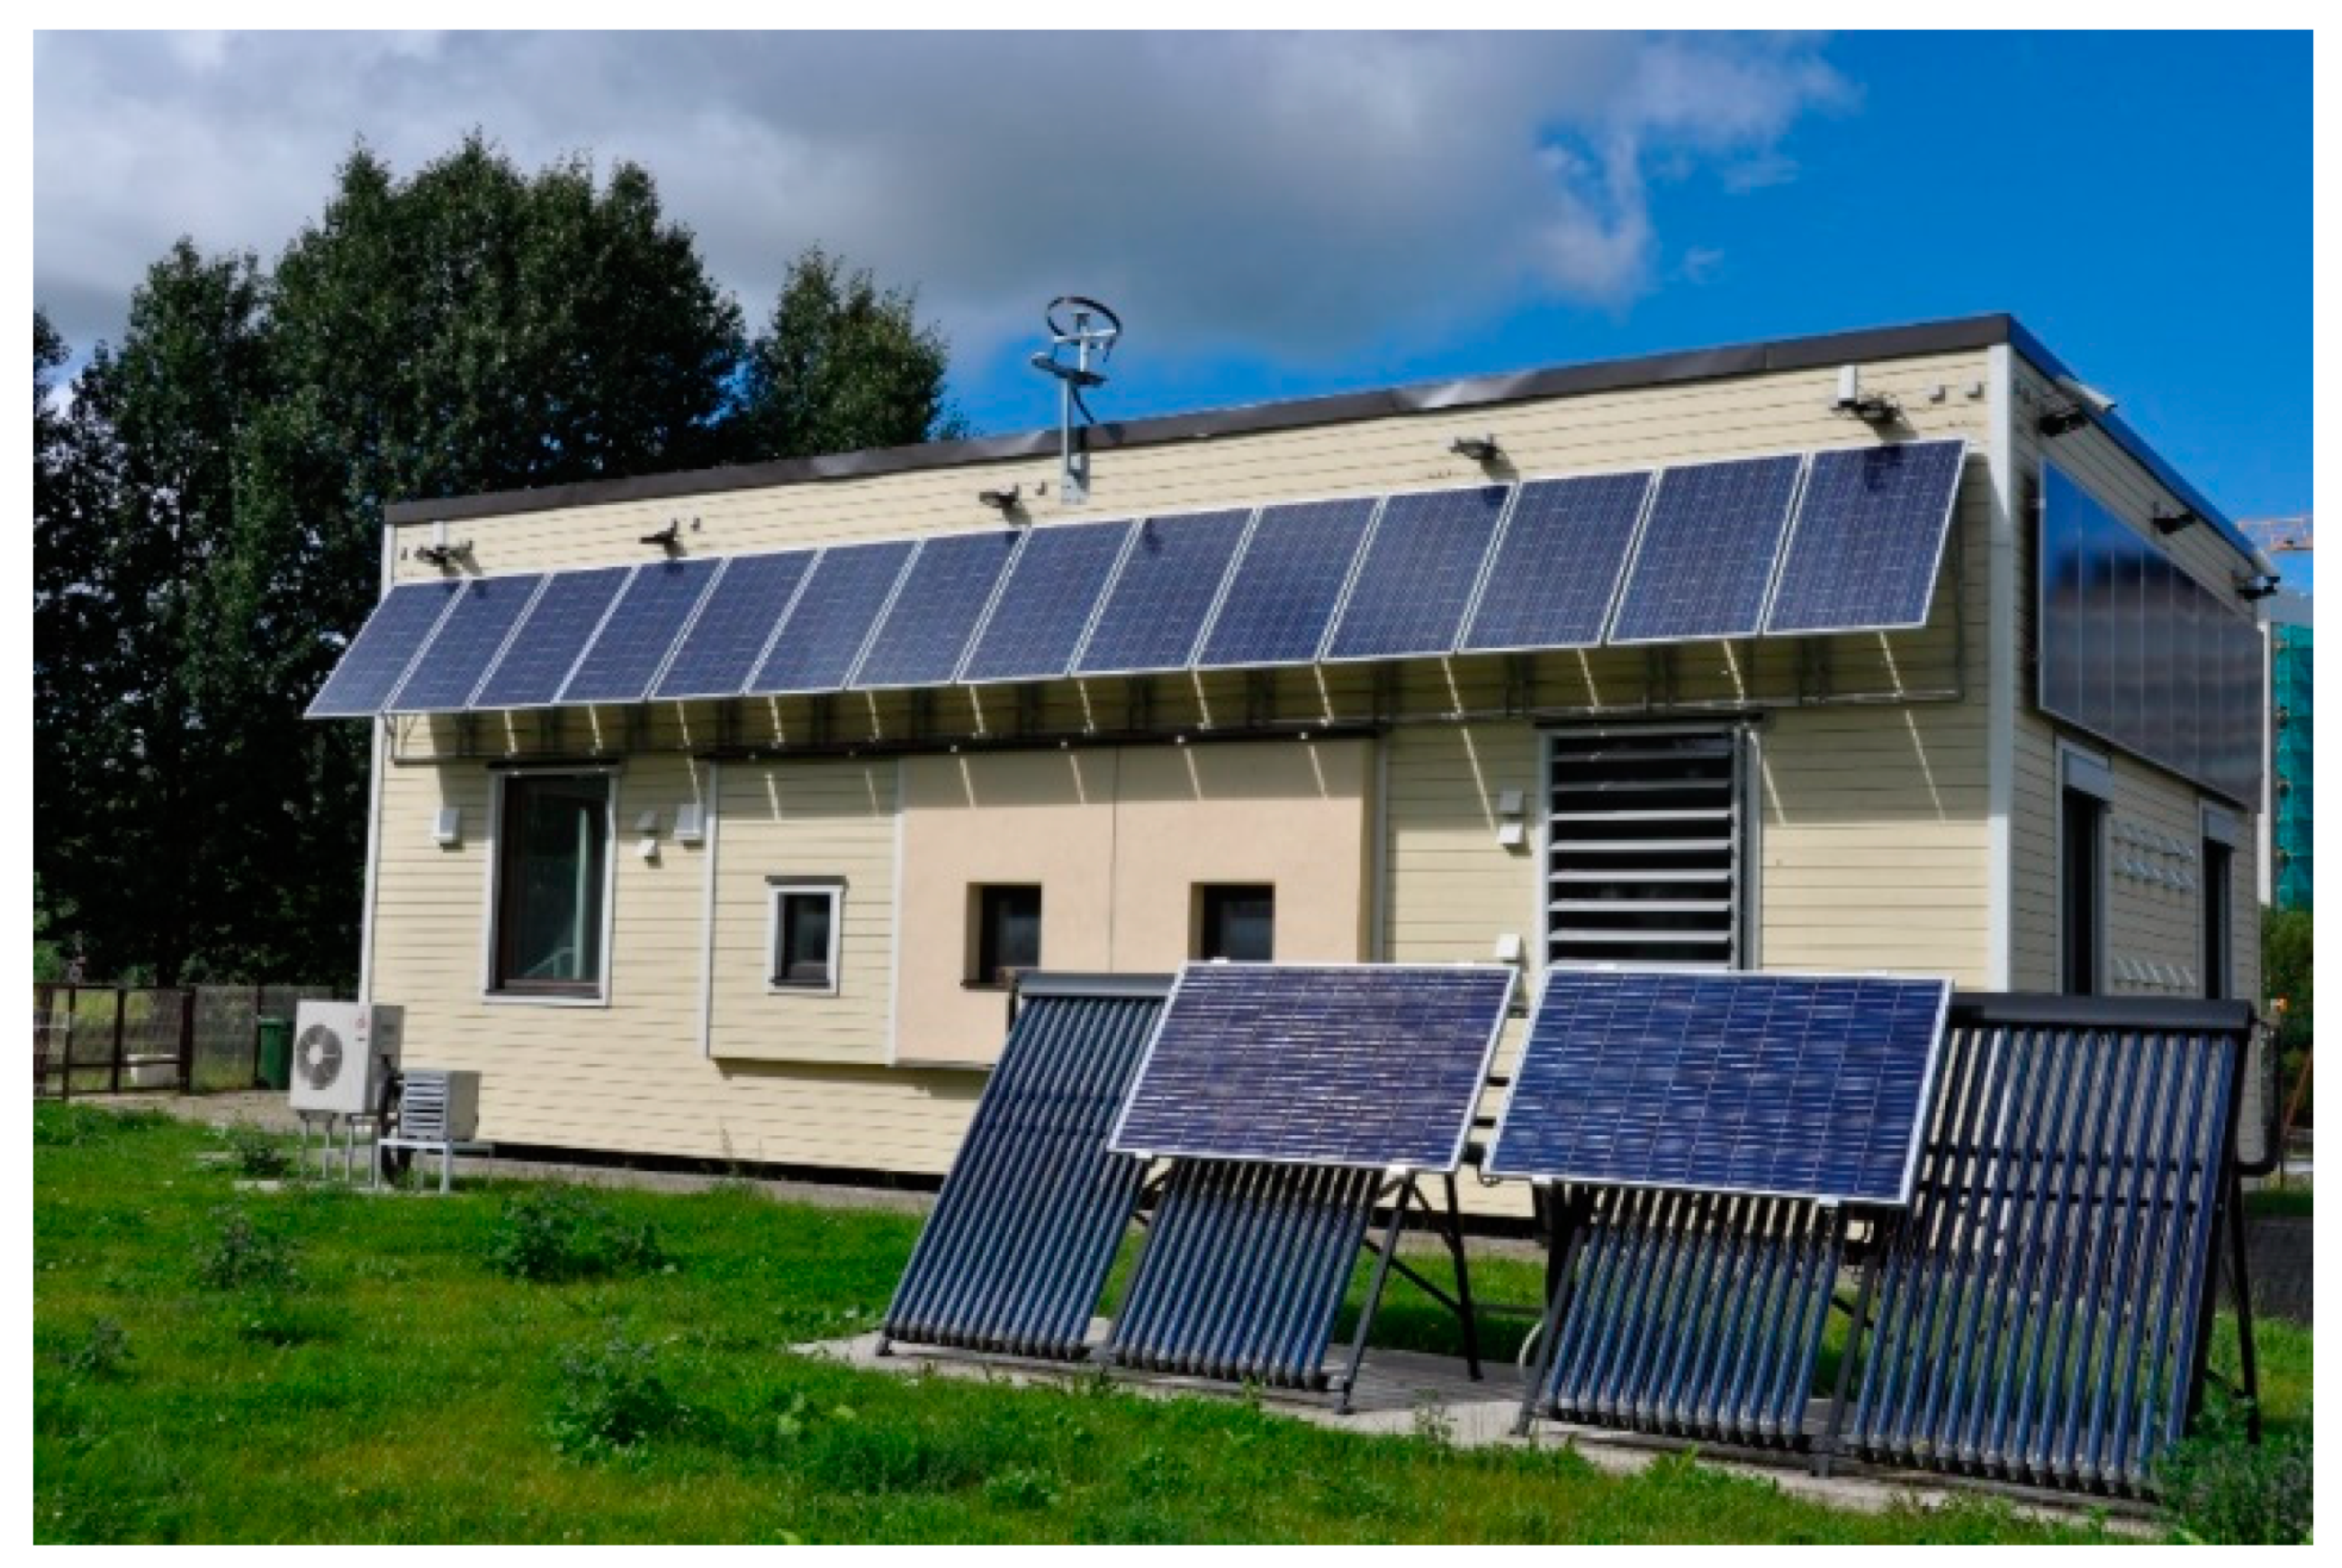
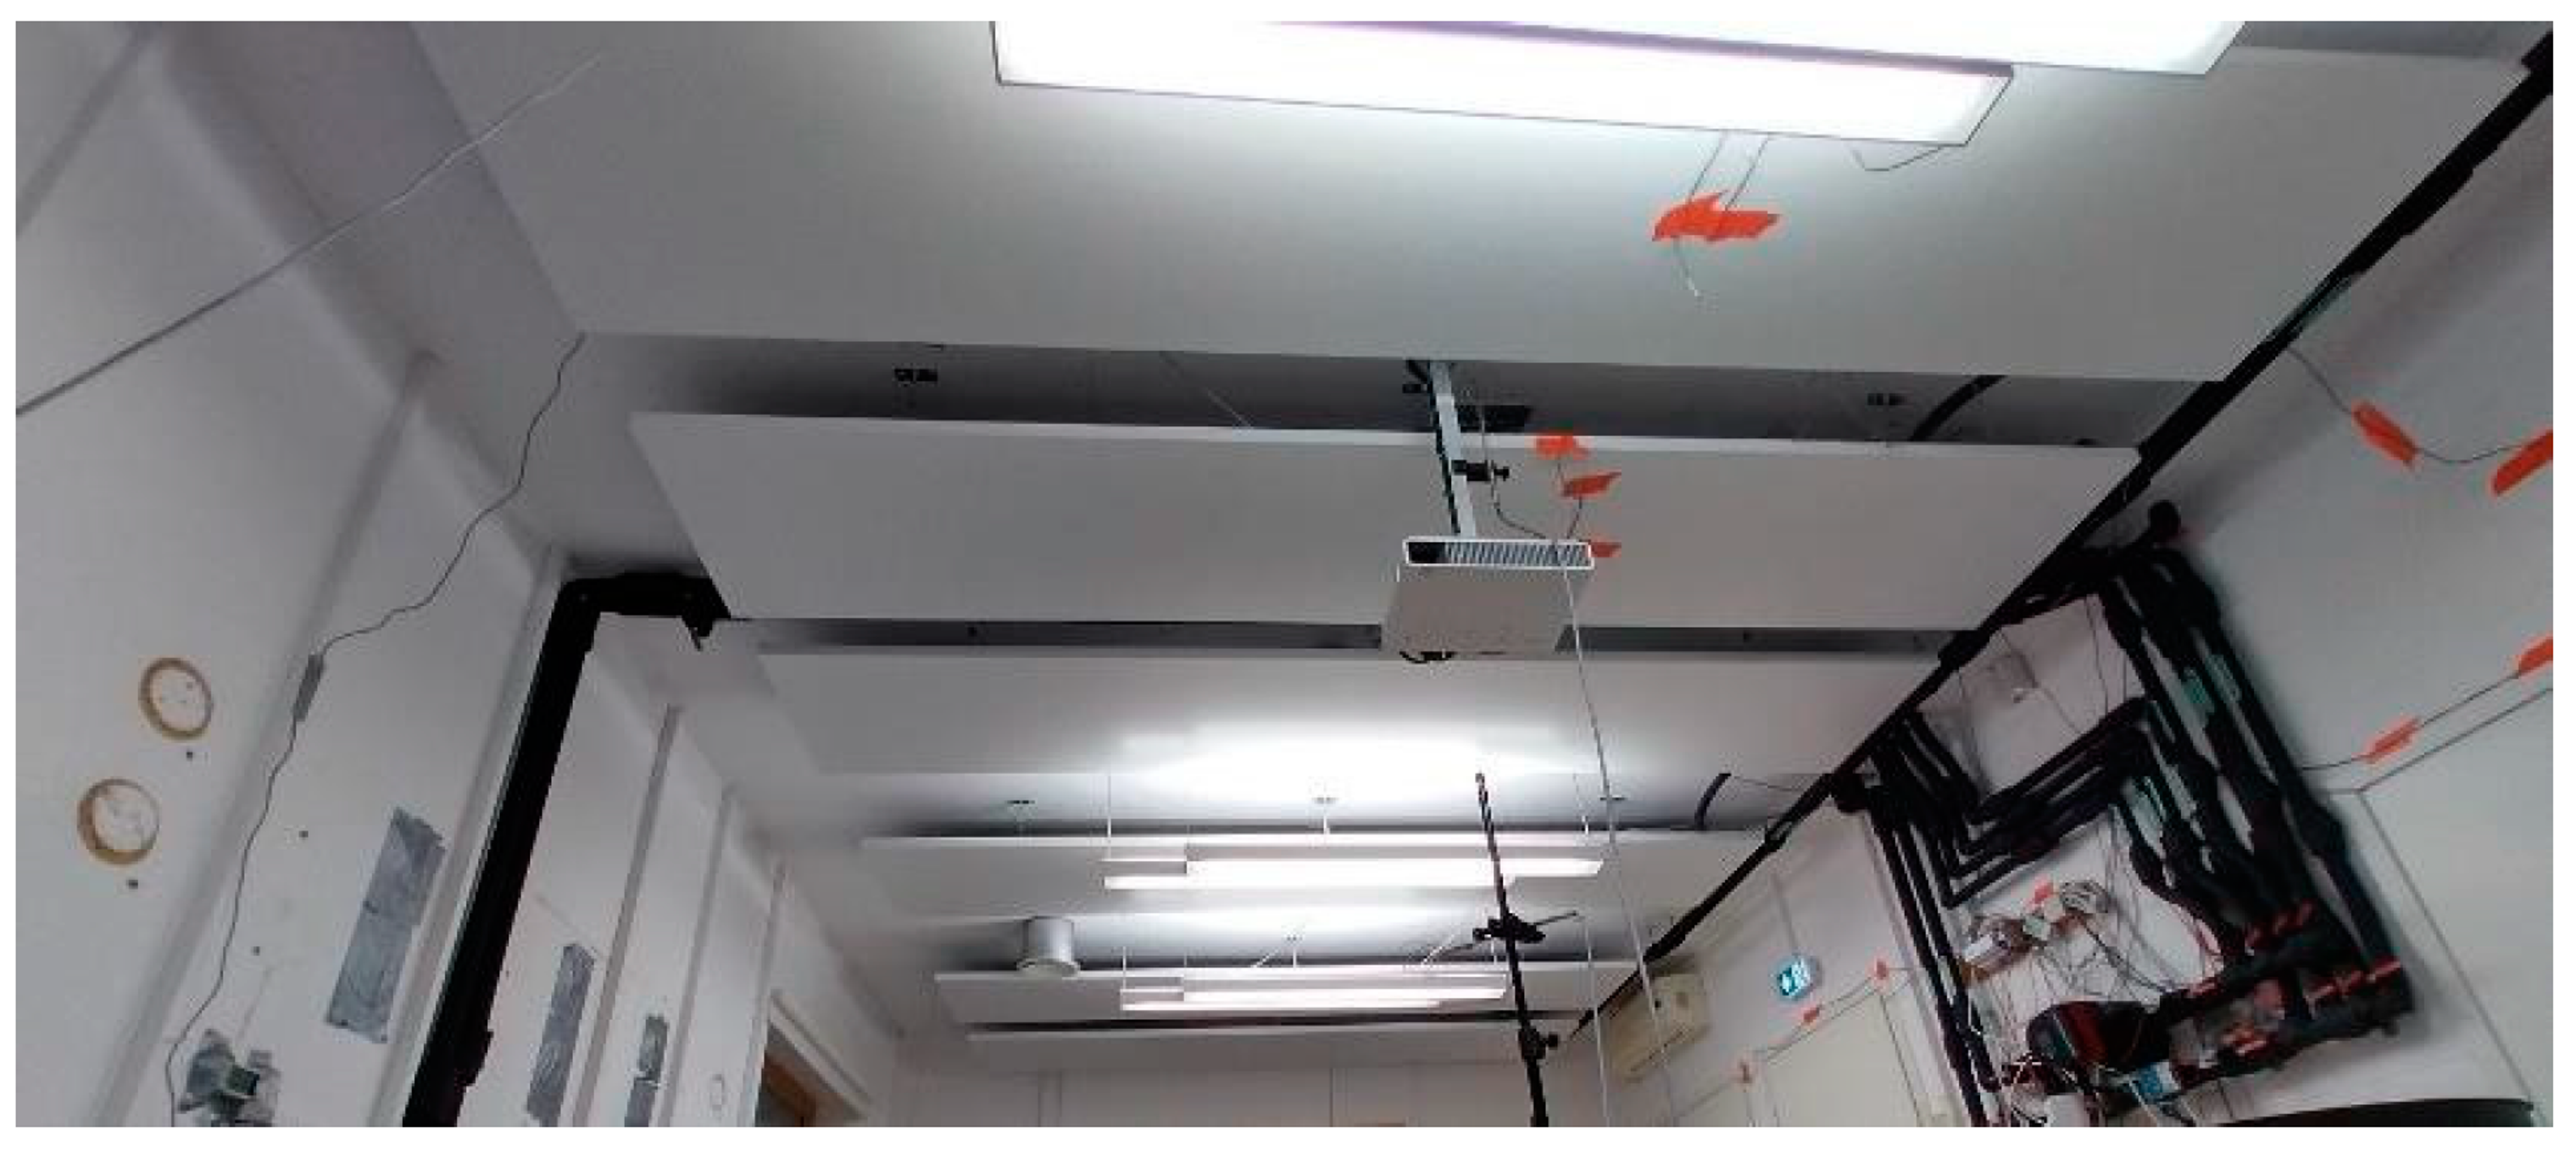
The cooling devices were tested at the nZEB test facility in the Tallinn University of Technology campus [
29], which is pictured in
Figure 1. Four different cooling devices were installed in a 30 m
2 seminar/classroom located on the east side of the building, featuring four windows: one on each north and south facades and two on the east-facing external wall. This test room has a false ceiling, while the whole facility has a suspended floor with a ventilated crawlspace.
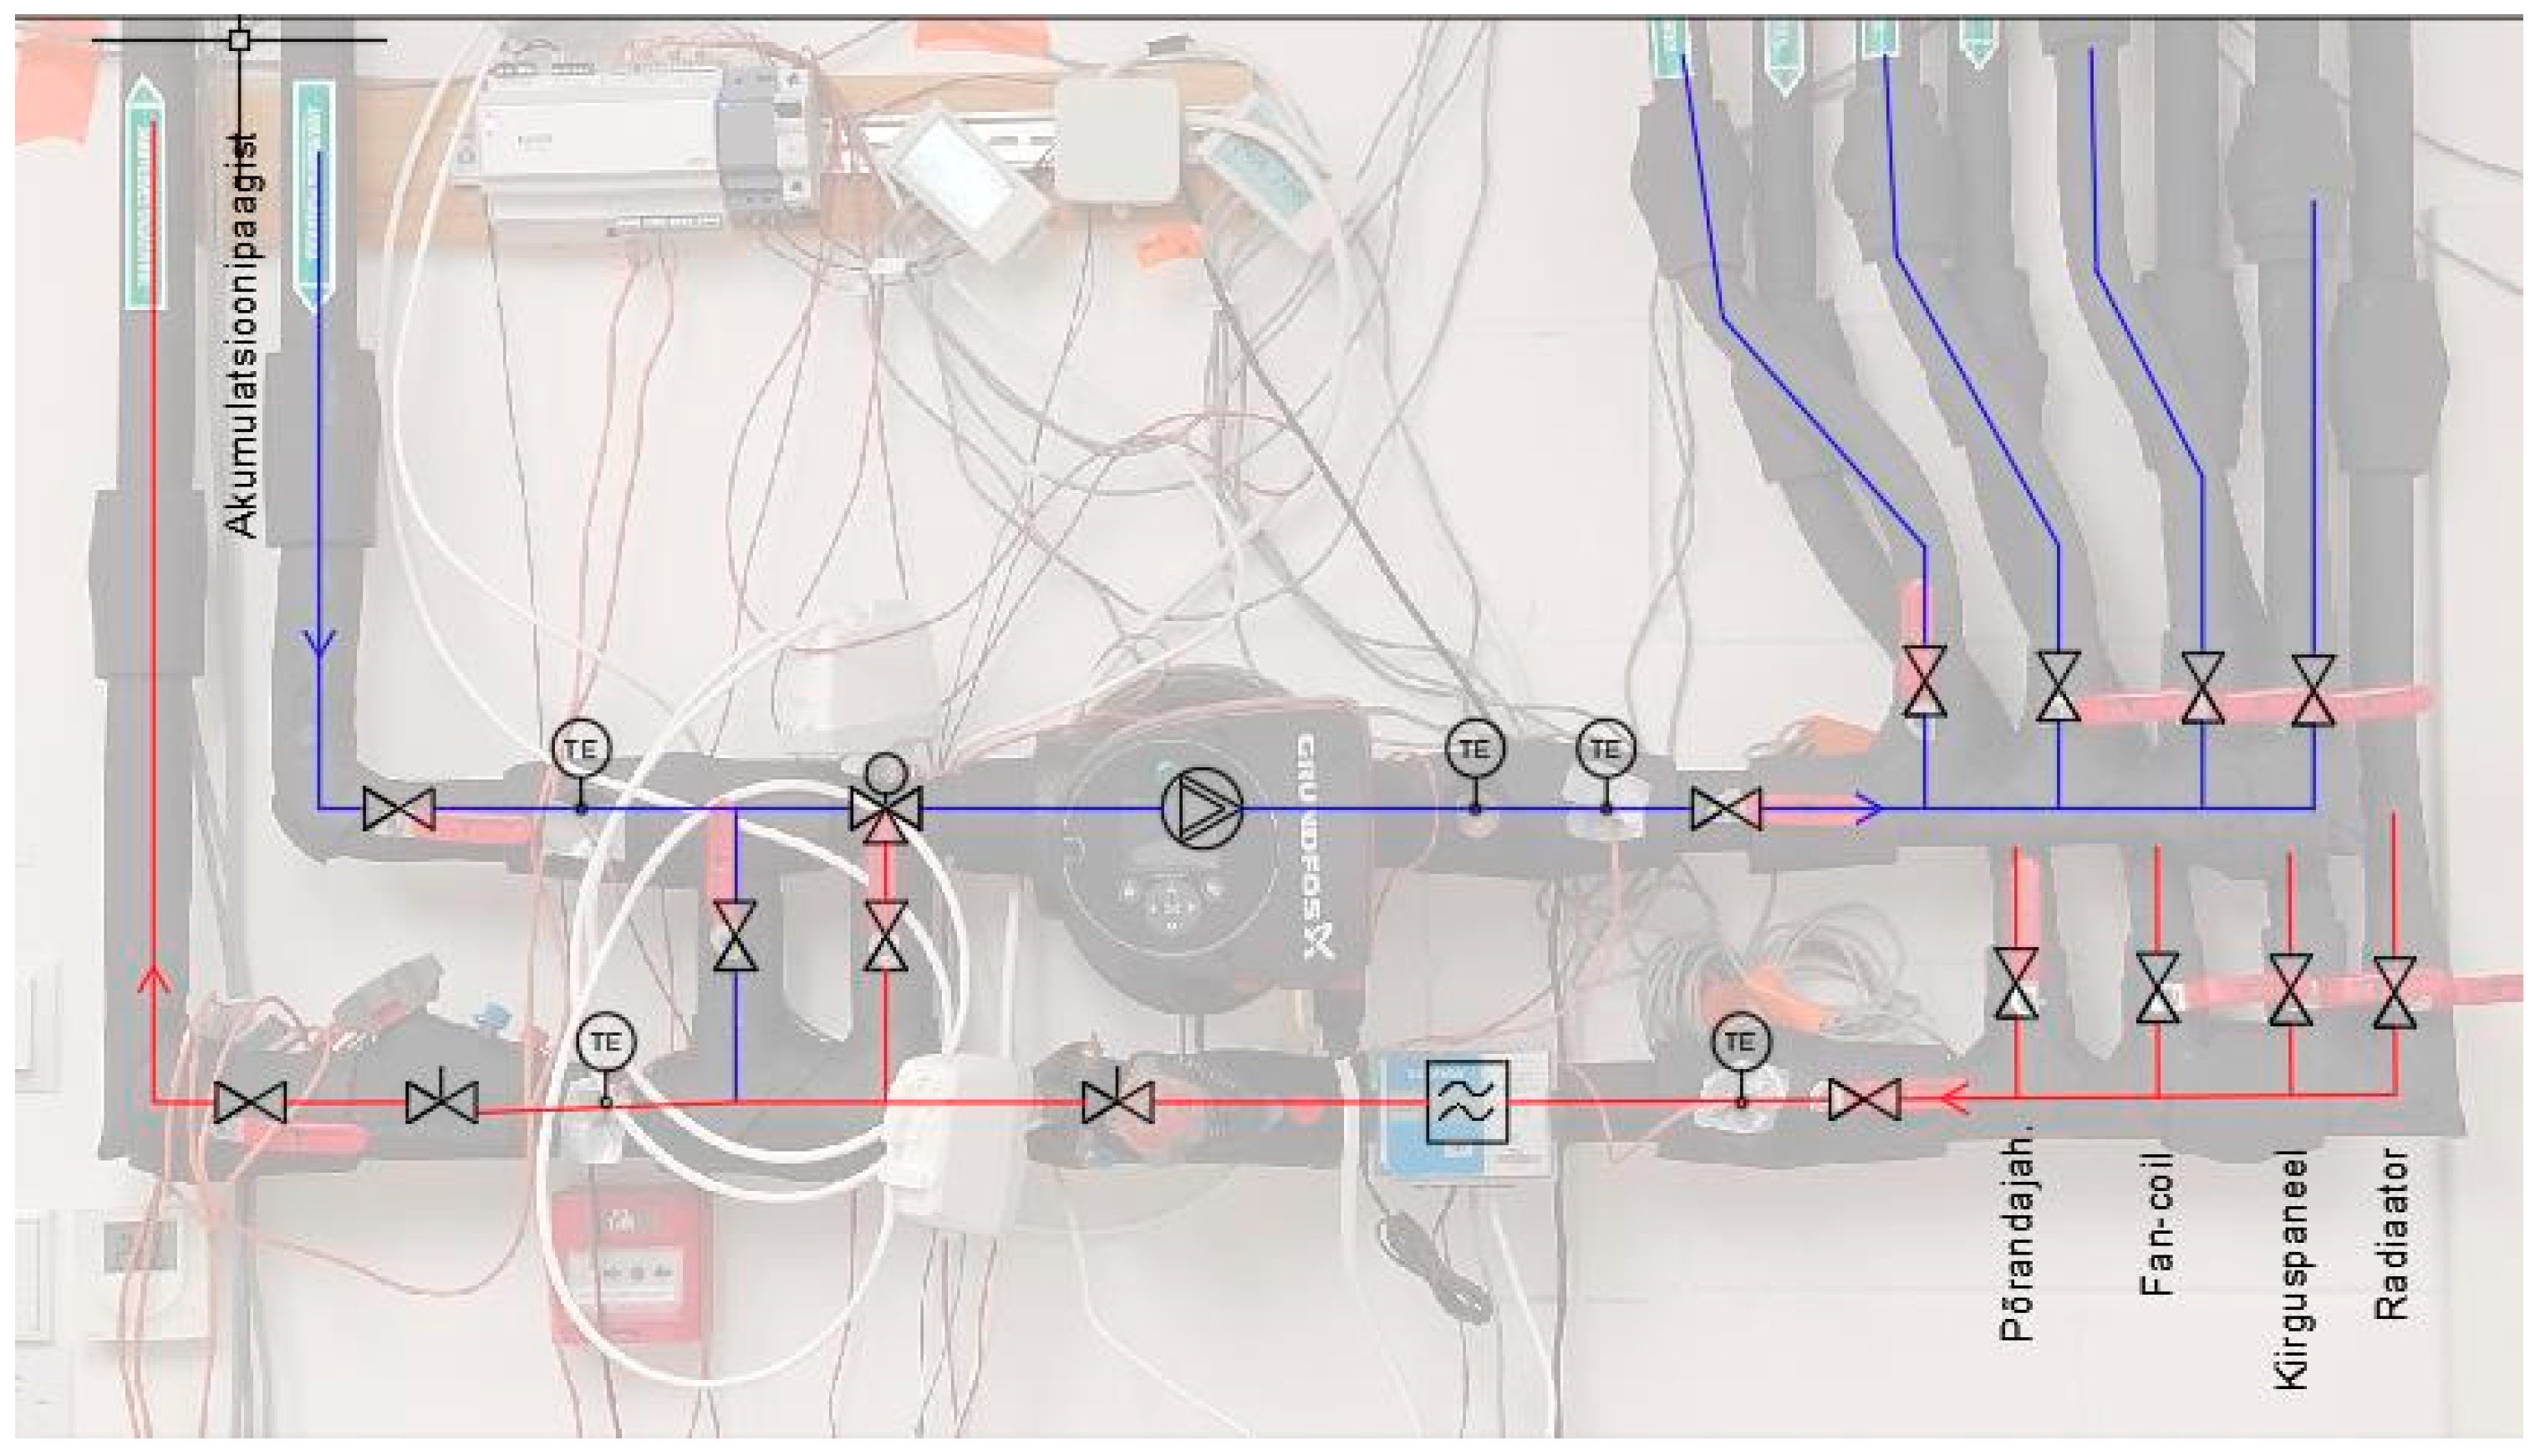
Chilled water for the cooling systems is produced on-site with an air-to-water heat pump, with an additional free cooling circuit available with a separate plate heat exchanger and dry cooler when ambient temperature is sufficiently low. Both produce chilled water into an accumulation tank. In the building, there is a built-in mixing unit that allows supply water to be mixed at the required temperature in the secondary system while measuring both primary and secondary temperatures upstream and downstream. The mixing station is also equipped with an ultrasonic volume flow meter to measure the secondary flow and enables the calculation of the cooling capacity.
The operating principle of the hydraulic installation is shown in
Figure 2. Air-to-water heat pump operated at a single compressor speed and produced chilled water with a set-point temperature of +10 °C to the buffer tank. A hysteresis of ±2 °C was set to ensure that a sufficiently low temperature was delivered to the mixing valve.
The supply temperature to the cooling devices was controlled by a three-way mixing valve with 3 mm travel, which was operated with a TA Slider 160 actuator. The input signal of the actuator was generated by a temperature control loop that was implemented in Python (simple-PID library) according to Equation (1), with chosen controller parameters
= 1800,
= 60, and
= 13,500,
Additionally, a balancing valve TA STAD-15 was installed on the return of the secondary loop to confirm the flow-rate values to the devices. However, due to the low flow measurement accuracy (≥4%) from the differential pressure over the balancing valve, for measuring the volumetric flow rate in the secondary loop, we used a separate ultrasonic flow meter.
The test facility is equipped with mechanical heat recovery ventilation capable of a maximum air exchange of 550 m
3/h. Ventilation flow rates were set in this study to ensure a constant air circulation of value 45 L/s (or 1.5 L/m
2) in the tested room following the recommendation of [
31] to ensure good air quality. Supply air was pre-heated, and measured temperatures varied between 19 °C and 21 °C.
2.2. Measurement Equipment
A total of 28 temperature sensors were installed in the building for measuring various air and surface temperatures inside the tested room as well as air temperatures of the bounding rooms (two testing rooms, corridor, toilet) behind the false ceiling and in the crawlspace. Five more sensors were installed in the mixing unit measuring point and another one in the flow measuring point. Measuring the temperatures in the mixing unit allowed to calculate the cooling capacity of the different systems by using the following Equation (2):
where
ϕ is the cooling capacity (W),
G is the water flow (m
3/s),
c is the specific heat capacity of the water (J/(kg°C)),
ρ is the water density (kg/m
3), and Δ
t is the difference between the flow and return water temperatures (°C).
In the case of cooling radiators, four measuring points were installed directly on the device. Three sensors were placed on the front panel surface at heights of 50, 300, and 550 mm to map the temperature distribution on its surface. One measuring point was above the radiator at 20 mm from the top grille to measure the temperature of the air that was blown out by the fans.
Four additional sensors were installed on the ceiling panels. Two measuring points were installed at the center of both panels to measure the difference in surface temperatures of the panels. A third one was installed at 100 mm below the center of the first panel to characterize the air temperature near the panel. The fourth sensor was located between the first panel and the ceiling at 10 cm below the ceiling.
For floor cooling, we installed six surface temperature sensors, two of which were located on one third of the side of the room, to characterize the overall floor surface temperature. The other two measuring points were installed in the inlet pipe of the floor circuit, and the last two in the return circuits. They measured the heating of the coolant, which leads to a change in the floor surface temperatures. Two sensors were installed behind the plafond: one for the inflow and the other for the outflow.
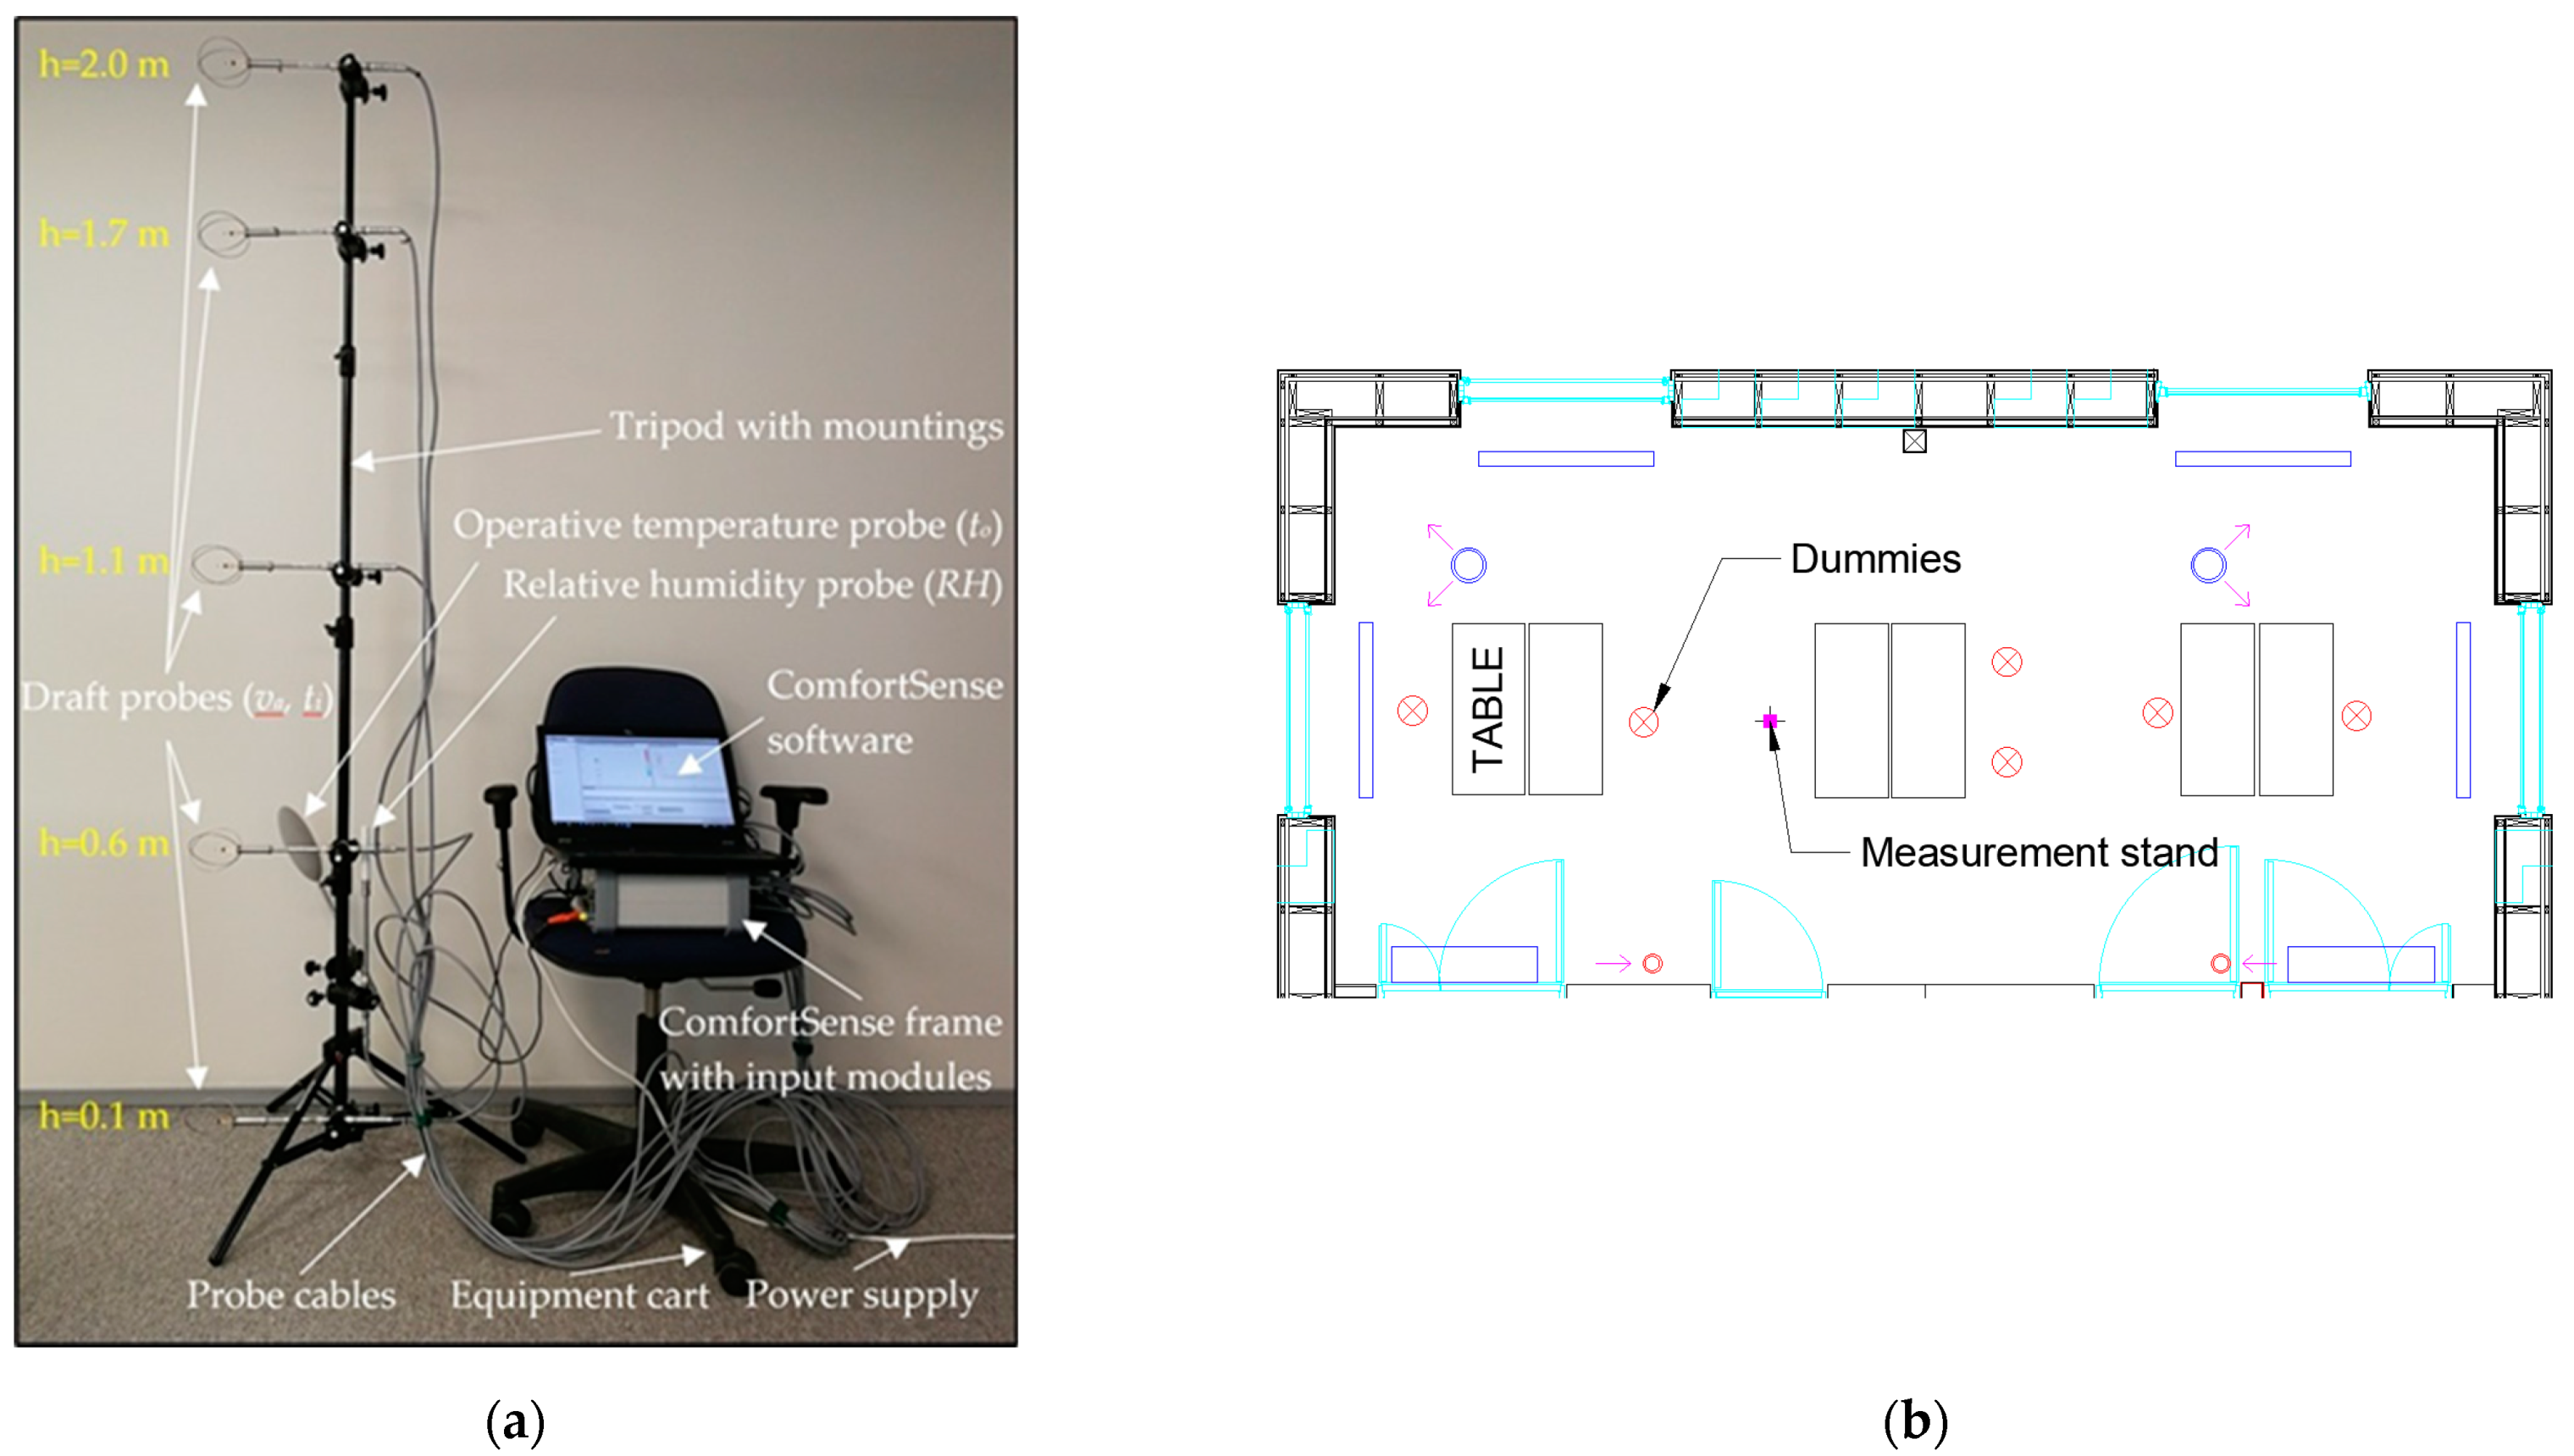
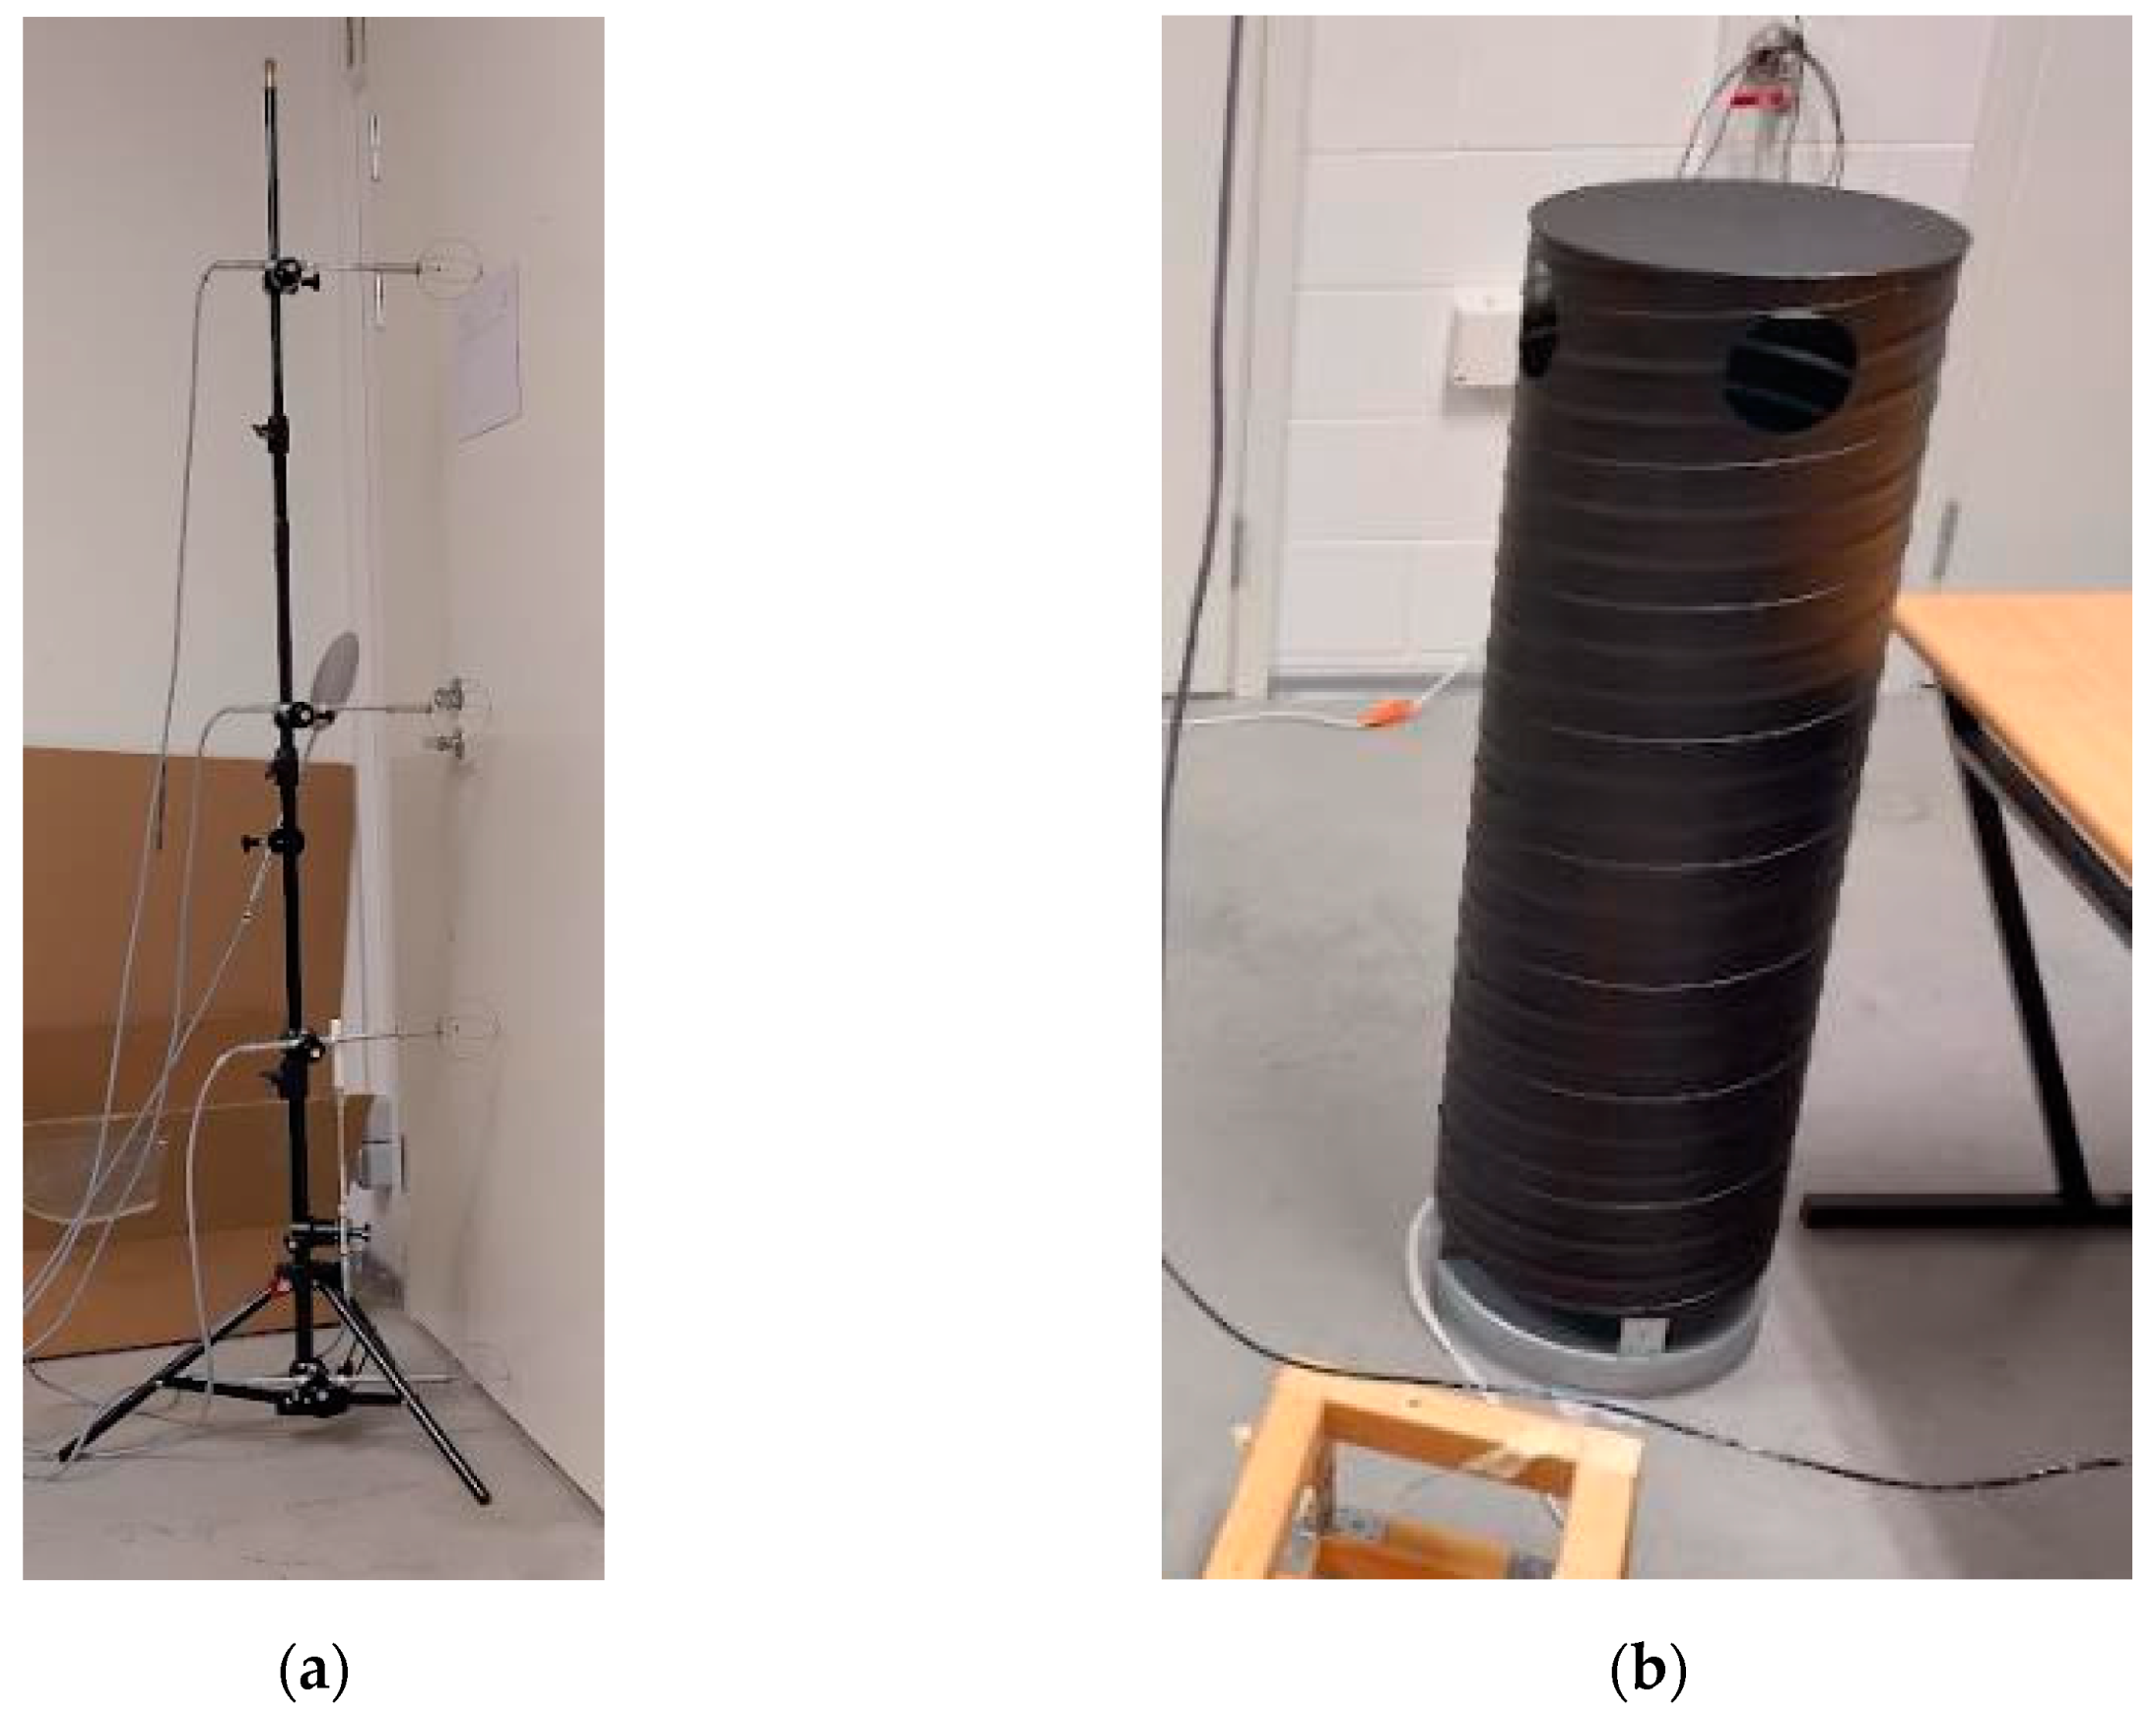
For all systems, the gradients and air flow speeds were measured by five dedicated thermo-anemometers along with operative temperature and relative humidity sensors that were installed on the same tripod (
Figure 3a). The operative temperature was recorded at the heights of 0.1, 0.6, 1.1, 1.7, and 2.9 m. A FLIR E95 thermal camera captured the temperature distribution from the thermal images of each cooling device; using a fog generator also allowed visualizing the air distribution of the four cooling systems. The ventilation air-flow rates were set by means of a capture hood and a differential pressure manometer with valve position measurement. The characteristics of the sensors employed in this study are reported in
Table 1, where the bold text identifies different sensor types.
Six heating dummies as seen in
Figure 3b were used. These feature three incandescent lamps, which, according to the EN 14240 Standard [
32], provide a total rated output of 3 × 60 W per dummy. To provide a sufficient cooling load, two electric radiators with rated heat output of 1000 W were additionally used.
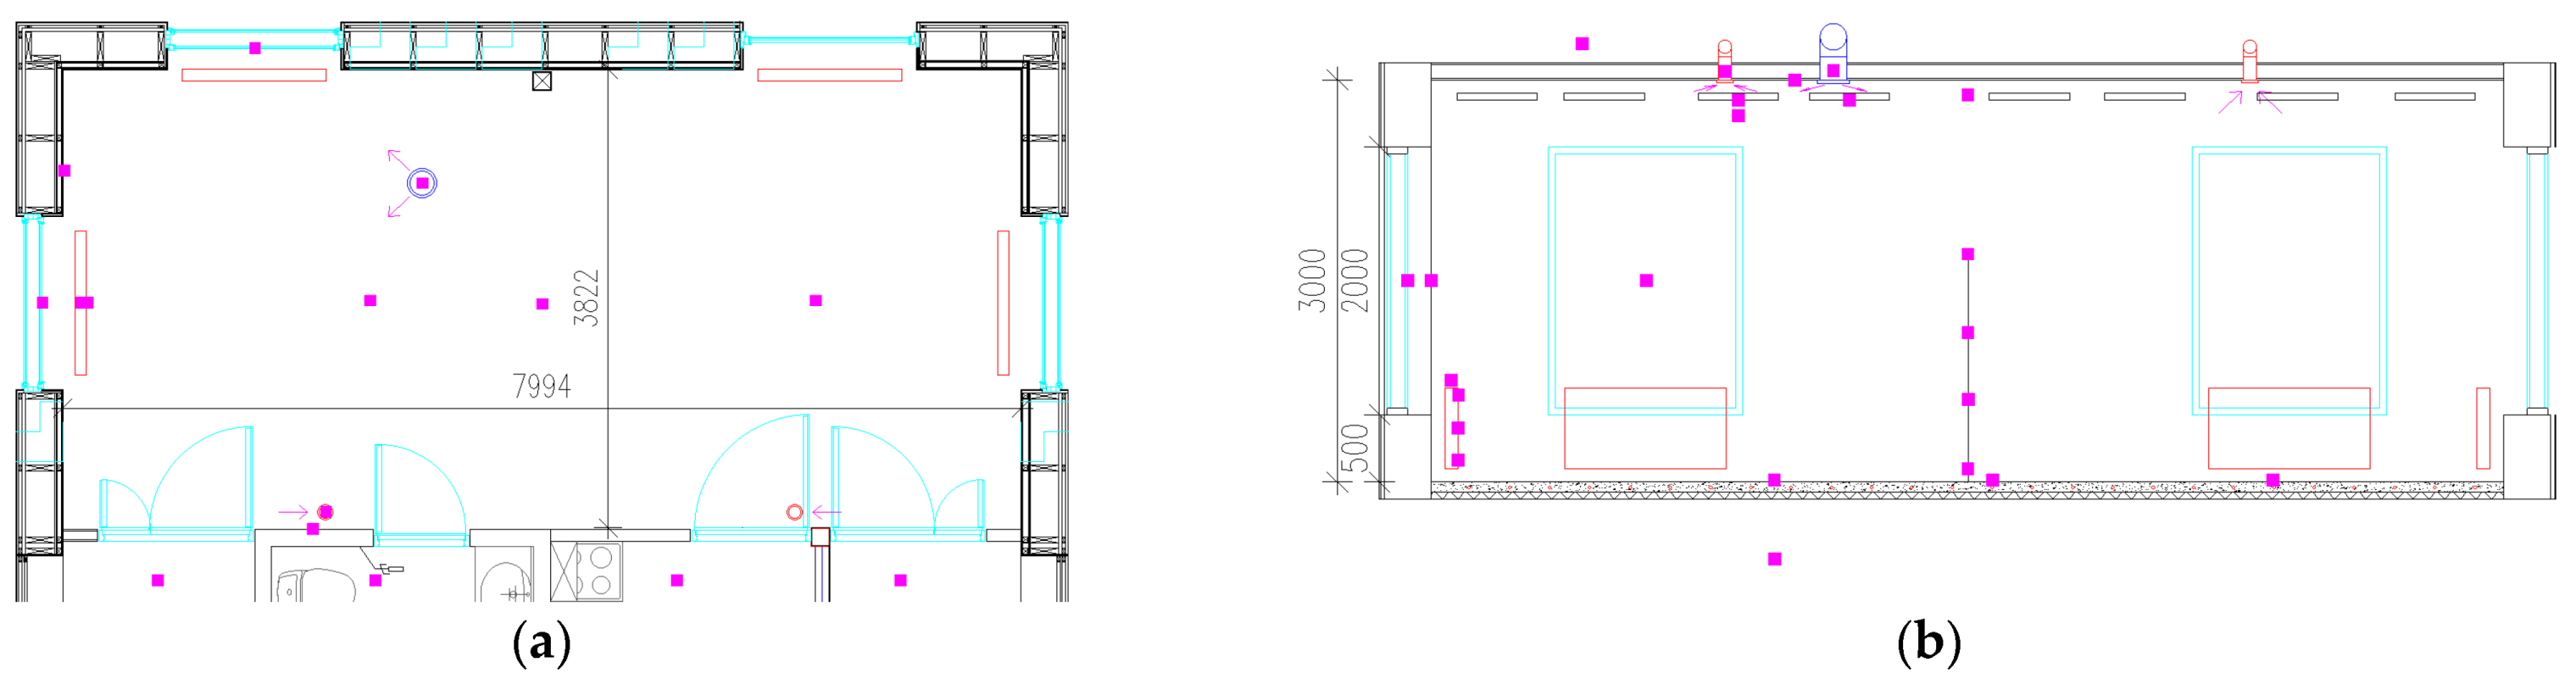
Figure 4b illustrates the positioning of dummies and radiators; that of sensors is given in
Figure 5a, and the vertical positioning of the sensors is provided in
Figure 5b.
2.3. Thermal Comfort
Air stratification and vertical temperature distribution were computed according to two different procedures in the EN16798-1 standard. The vertical air temperature difference γ
1 (head-ankle) [
33] and the total ceiling-floor gradient γ
TOT are determined as follows:
with t
z the air temperature at height z (m). The operative temperature probe was installed at h = 1.10 m, and it was displaced by 30° from the vertical. Comparing this value to the air temperature at the same height allowed to assess whether a higher room air temperature can be allowed while keeping the same sensed temperature of the occupant. Velocity data from the thermo-anemometers were logged and analyzed from the tripod setup as well. The setup is pictured in
Figure 4a.
2.4. Ceiling Panels
Eight ceiling panels in total, with dimensions 600 × 3000 mm, were installed using suspension cables at a height of 2.85 m, namely at 0.15 m from the ceiling. The side facing the ceiling was insulated with mineral wool insulation plates that were provided by the manufacturer. The ceiling panels were arranged into four pairs, where the two panels were connected in series. Nominal conditions and cooling output for a serially connected pair are reported in
Table 2.
Finally, a visual of the panels’ layout is given in
Figure 6 below.
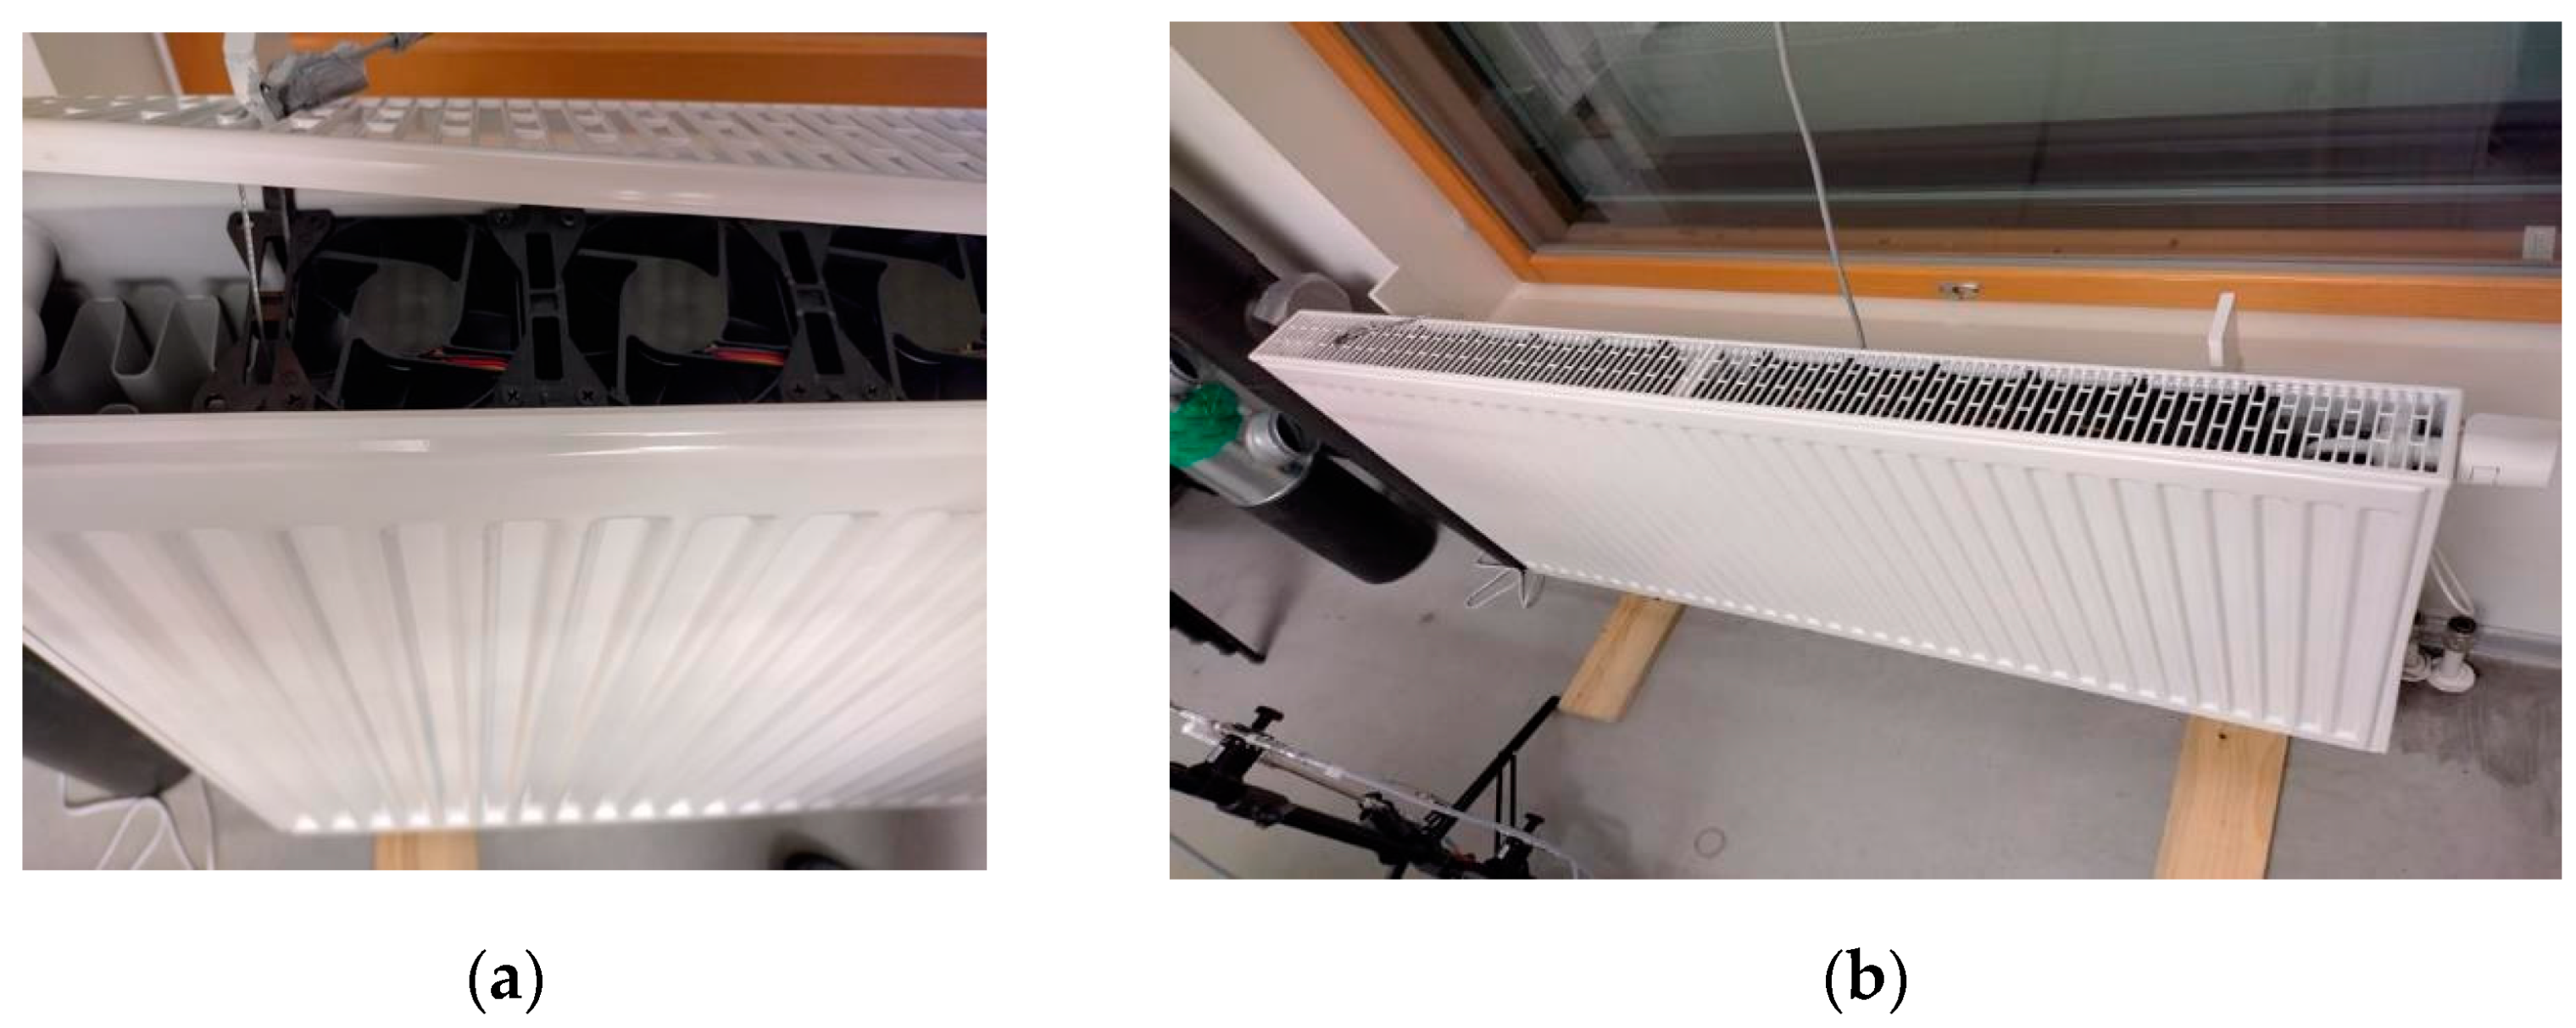
2.5. Fan-Assisted Radiator
Four 22-type radiators (two panels with two convective fins) with steel panels measuring 600 × 1200 mm were installed under the test room windows. On top of the radiator, under the cover grille, an array of fans is installed for enhancing the cooling output of the radiator. These fans displace air upwards into the room to prevent a cold down-draught to the floor, while the temperature difference between the air entering the channel and the cooling panel surface controls the fan speed. The radiators’ specifications are listed in
Table 3, and pictures of the fans array and an overall view of the device are given in
Figure 7.
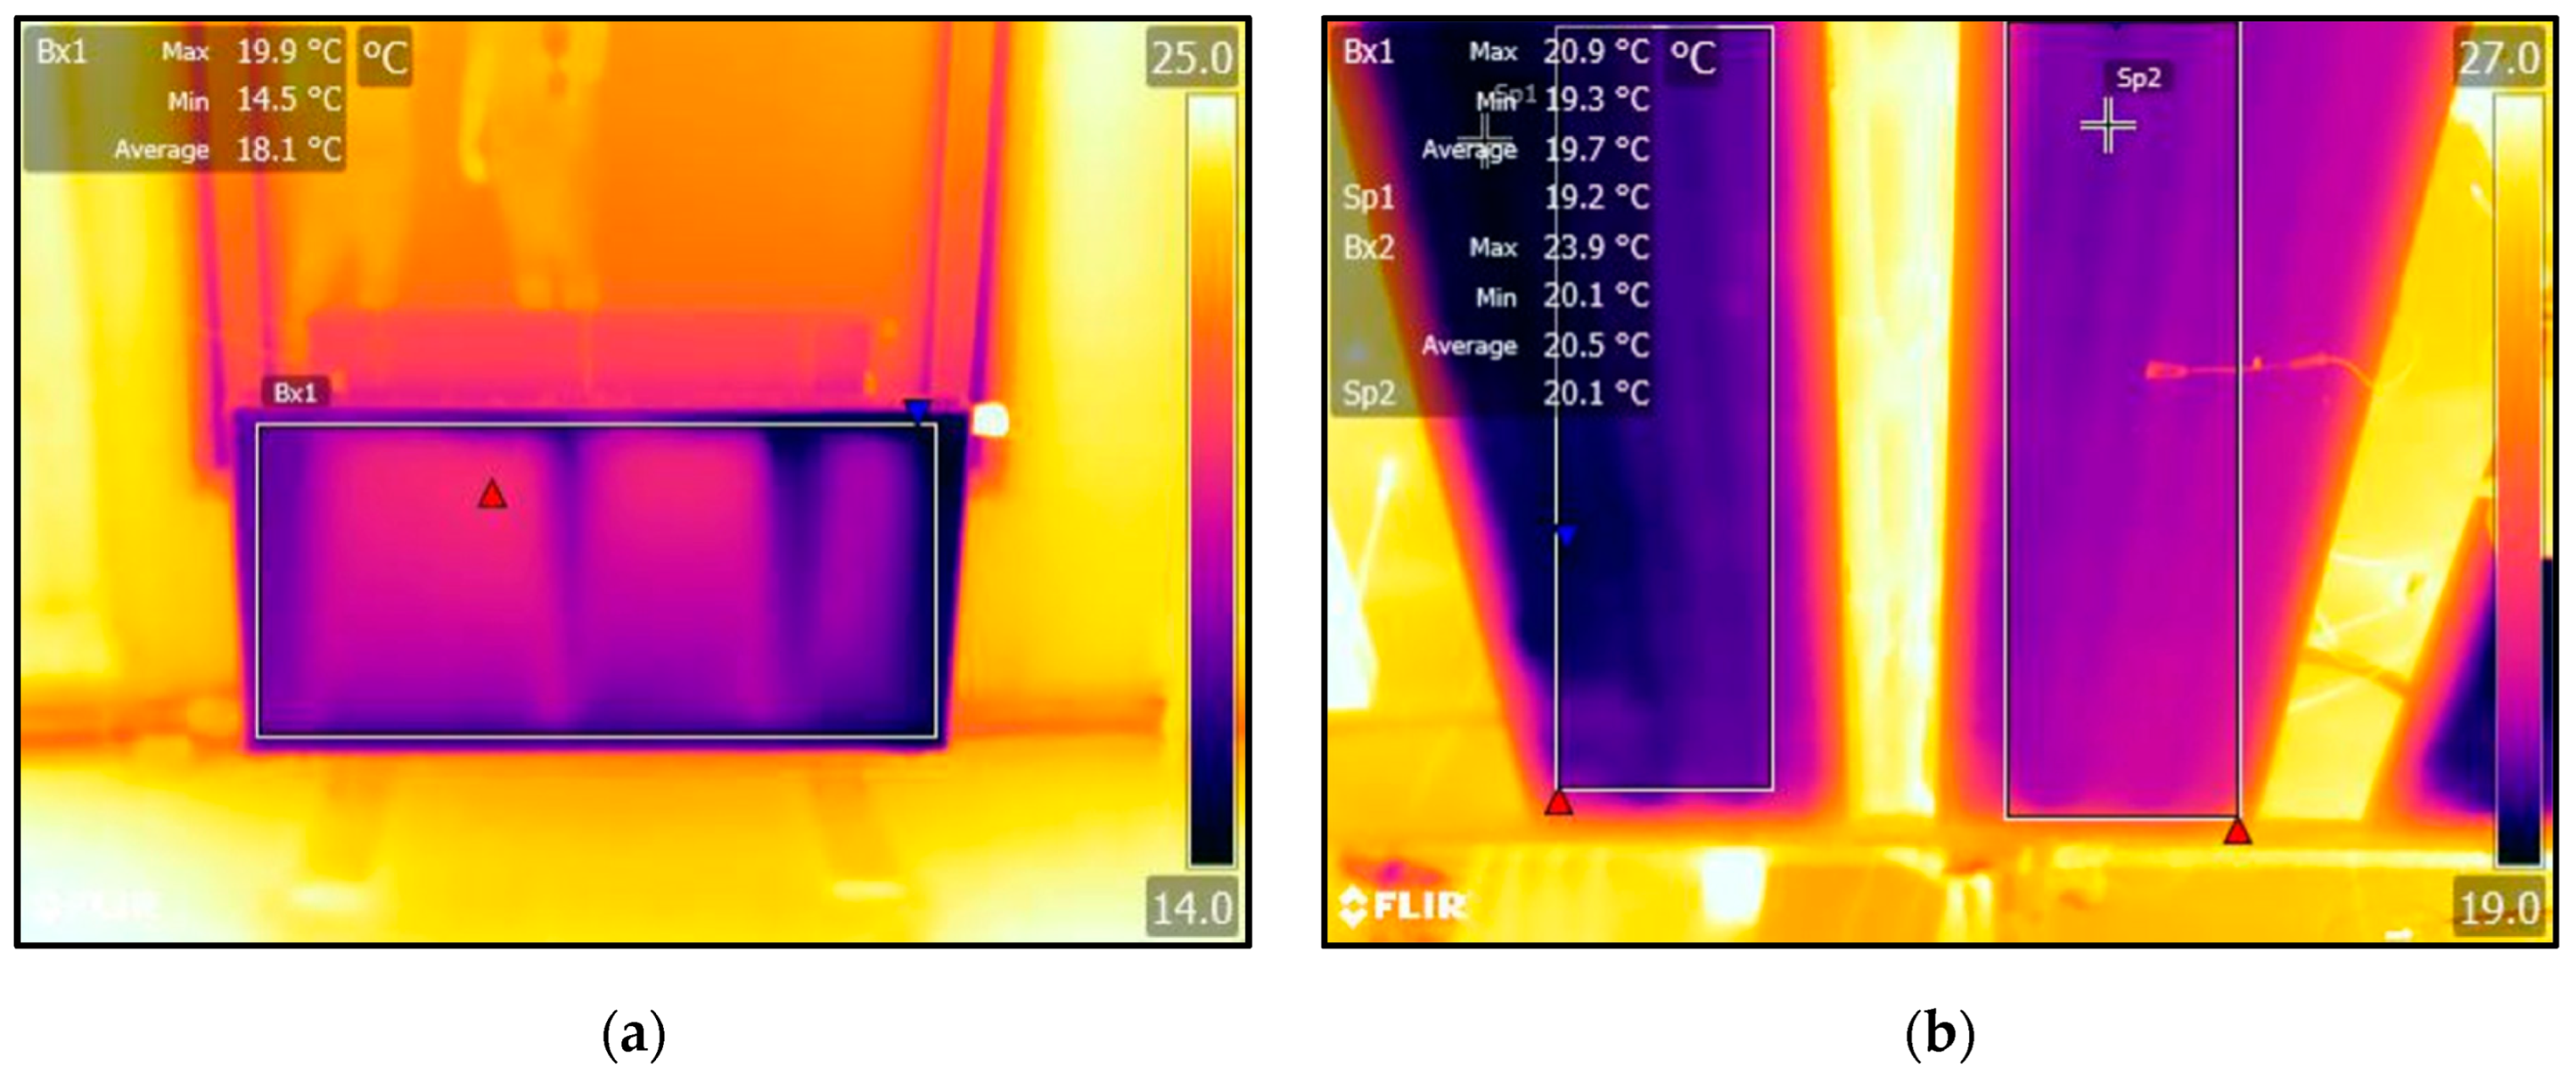
2.6. Underfloor Cooling
Existing underfloor heating loops were used for testing the underfloor cooling. For switching to the cooling circuit, supply and return lines before the manifold were retrofitted with three-way and isolating ball valves. Pe-PEX pipes of dimensions 20 × 2.0 mm were installed in a 40 mm screed layer with a 300 mm pipe spacing. The resulting cooling output was estimated to be 750 W (25 W/m
2) at operating conditions (14.0/17.0/26.0 °C supply/return/room air temperature).
Figure 8 features both a thermographic image of the piping as well as its overall arrangement in the nZEB testing facility.
2.7. Fan Coil Unit
We used two existing FCUs, which were mounted on the wall, with nominal cooling capacity and operating conditions at the lowest fan speed as reported in
Table 4. During the measurements, the FCUs were operated at this lowest fan speed.
4. Discussion
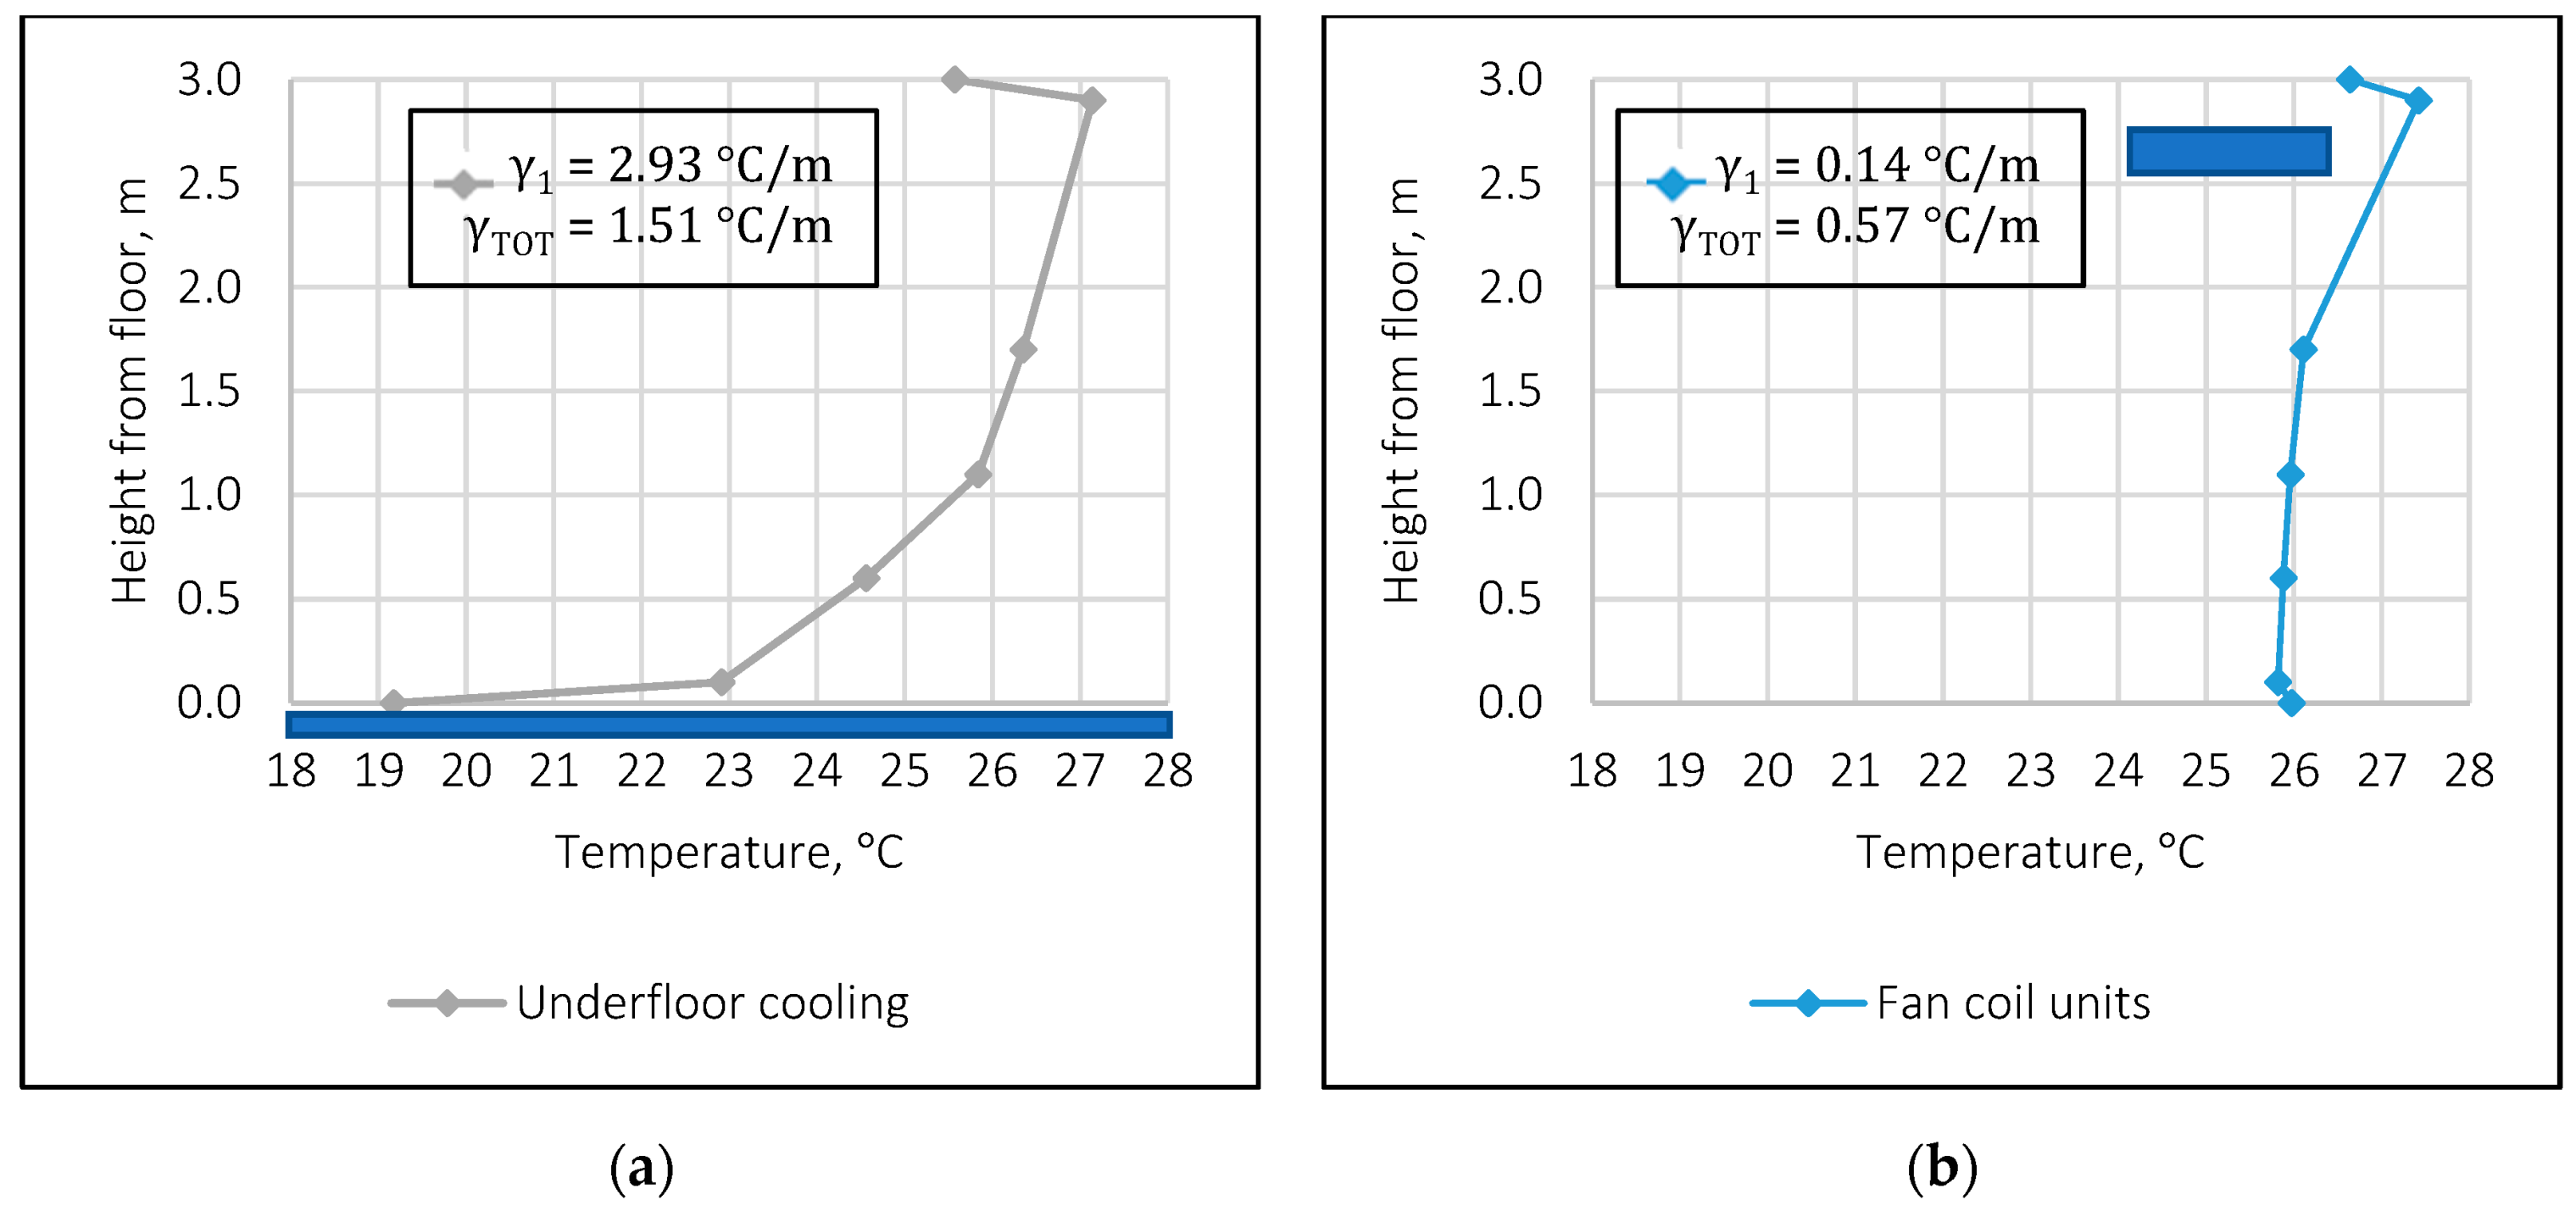
Considering the whole set of cooling devices, the vertical thermal stratification in the room showed a clear difference between the underfloor cooling system and the other devices. A substantial thermal gradient, i.e., 2.93 °C for a seated occupant (head to ankle), was generated via buoyancy effects (
Figure 9) by the underfloor cooling, which, at the measured cooling outputs, was the only system providing a comfort class II (EN 16798-1 standard [
33]). Importantly, such temperature difference is also influenced by the vertical temperature distribution, thus requiring a simultaneous assessment in terms of energy efficiency. The air speed measurements in
Table 6 show very clearly that the underfloor cooling provided minimal circulation, with average values of 0.02 m/s for both a seated and standing occupant, while higher air velocities were observed in the radiator HIGH tests compared to those for the radiator LOW. Although this is expected due to the maximum fan speed output, in the HIGH case, the measured air velocities were still low enough to stay within the first category of thermal comfort. The underwhelming FCU performance is instead critically affected by jet direction and sensors positioning; when during the testing, the measurement point was located away from the device, class II was reached. On the other hand, when evaluated within the entire occupied zone according to EN 16798-1:2019, the FCU drops to class IV. Therefore, whilst inducing some excellent buoyancy-driven mixing, the high air velocities are unacceptable for thermal comfort and require no occupancy under the air jet.
The radiation panel and the fan radiator operating at higher cooling capacity/higher fan speed (HIGH) provided an operative temperature that was lower than the air temperature, see
Figure 11. Both underfloor cooling and LOW-speed radiator achieved operative temperatures that were higher by, respectively, 0.2 °C and 0.1 °C. Finally, the FCU showed that although the room air temperatures varied over a very small range, the operative temperature was always higher.
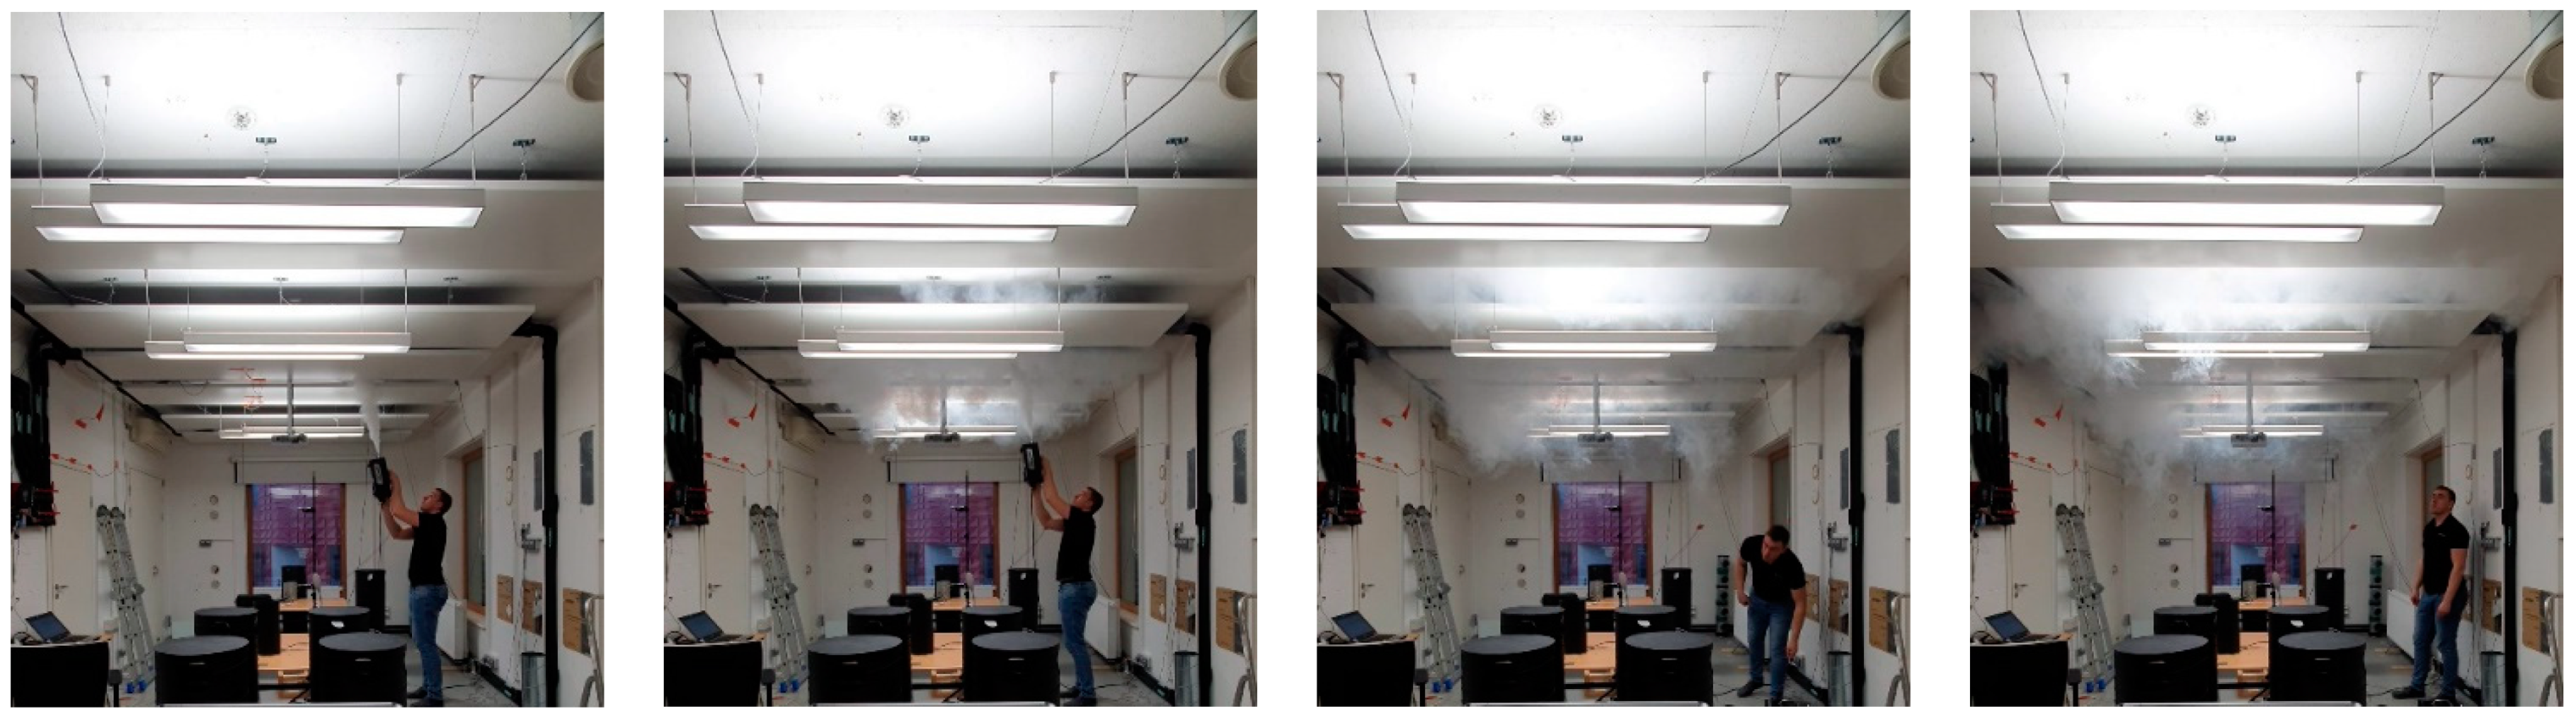
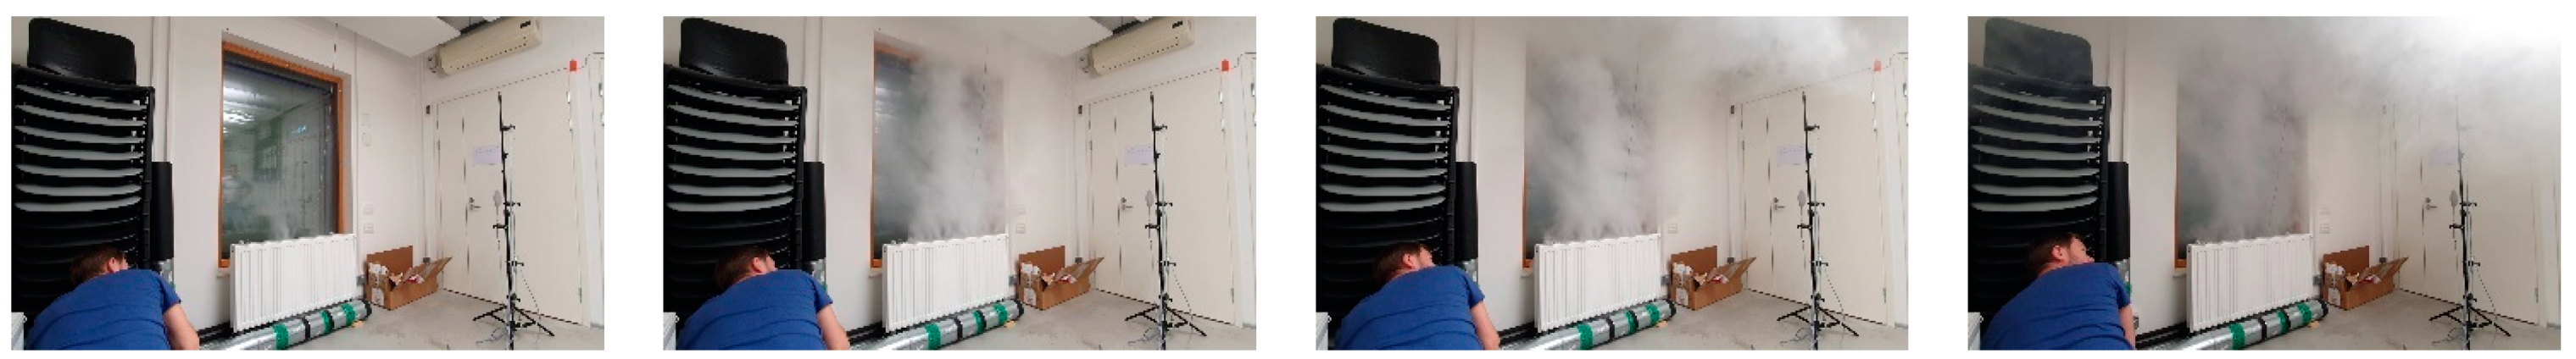
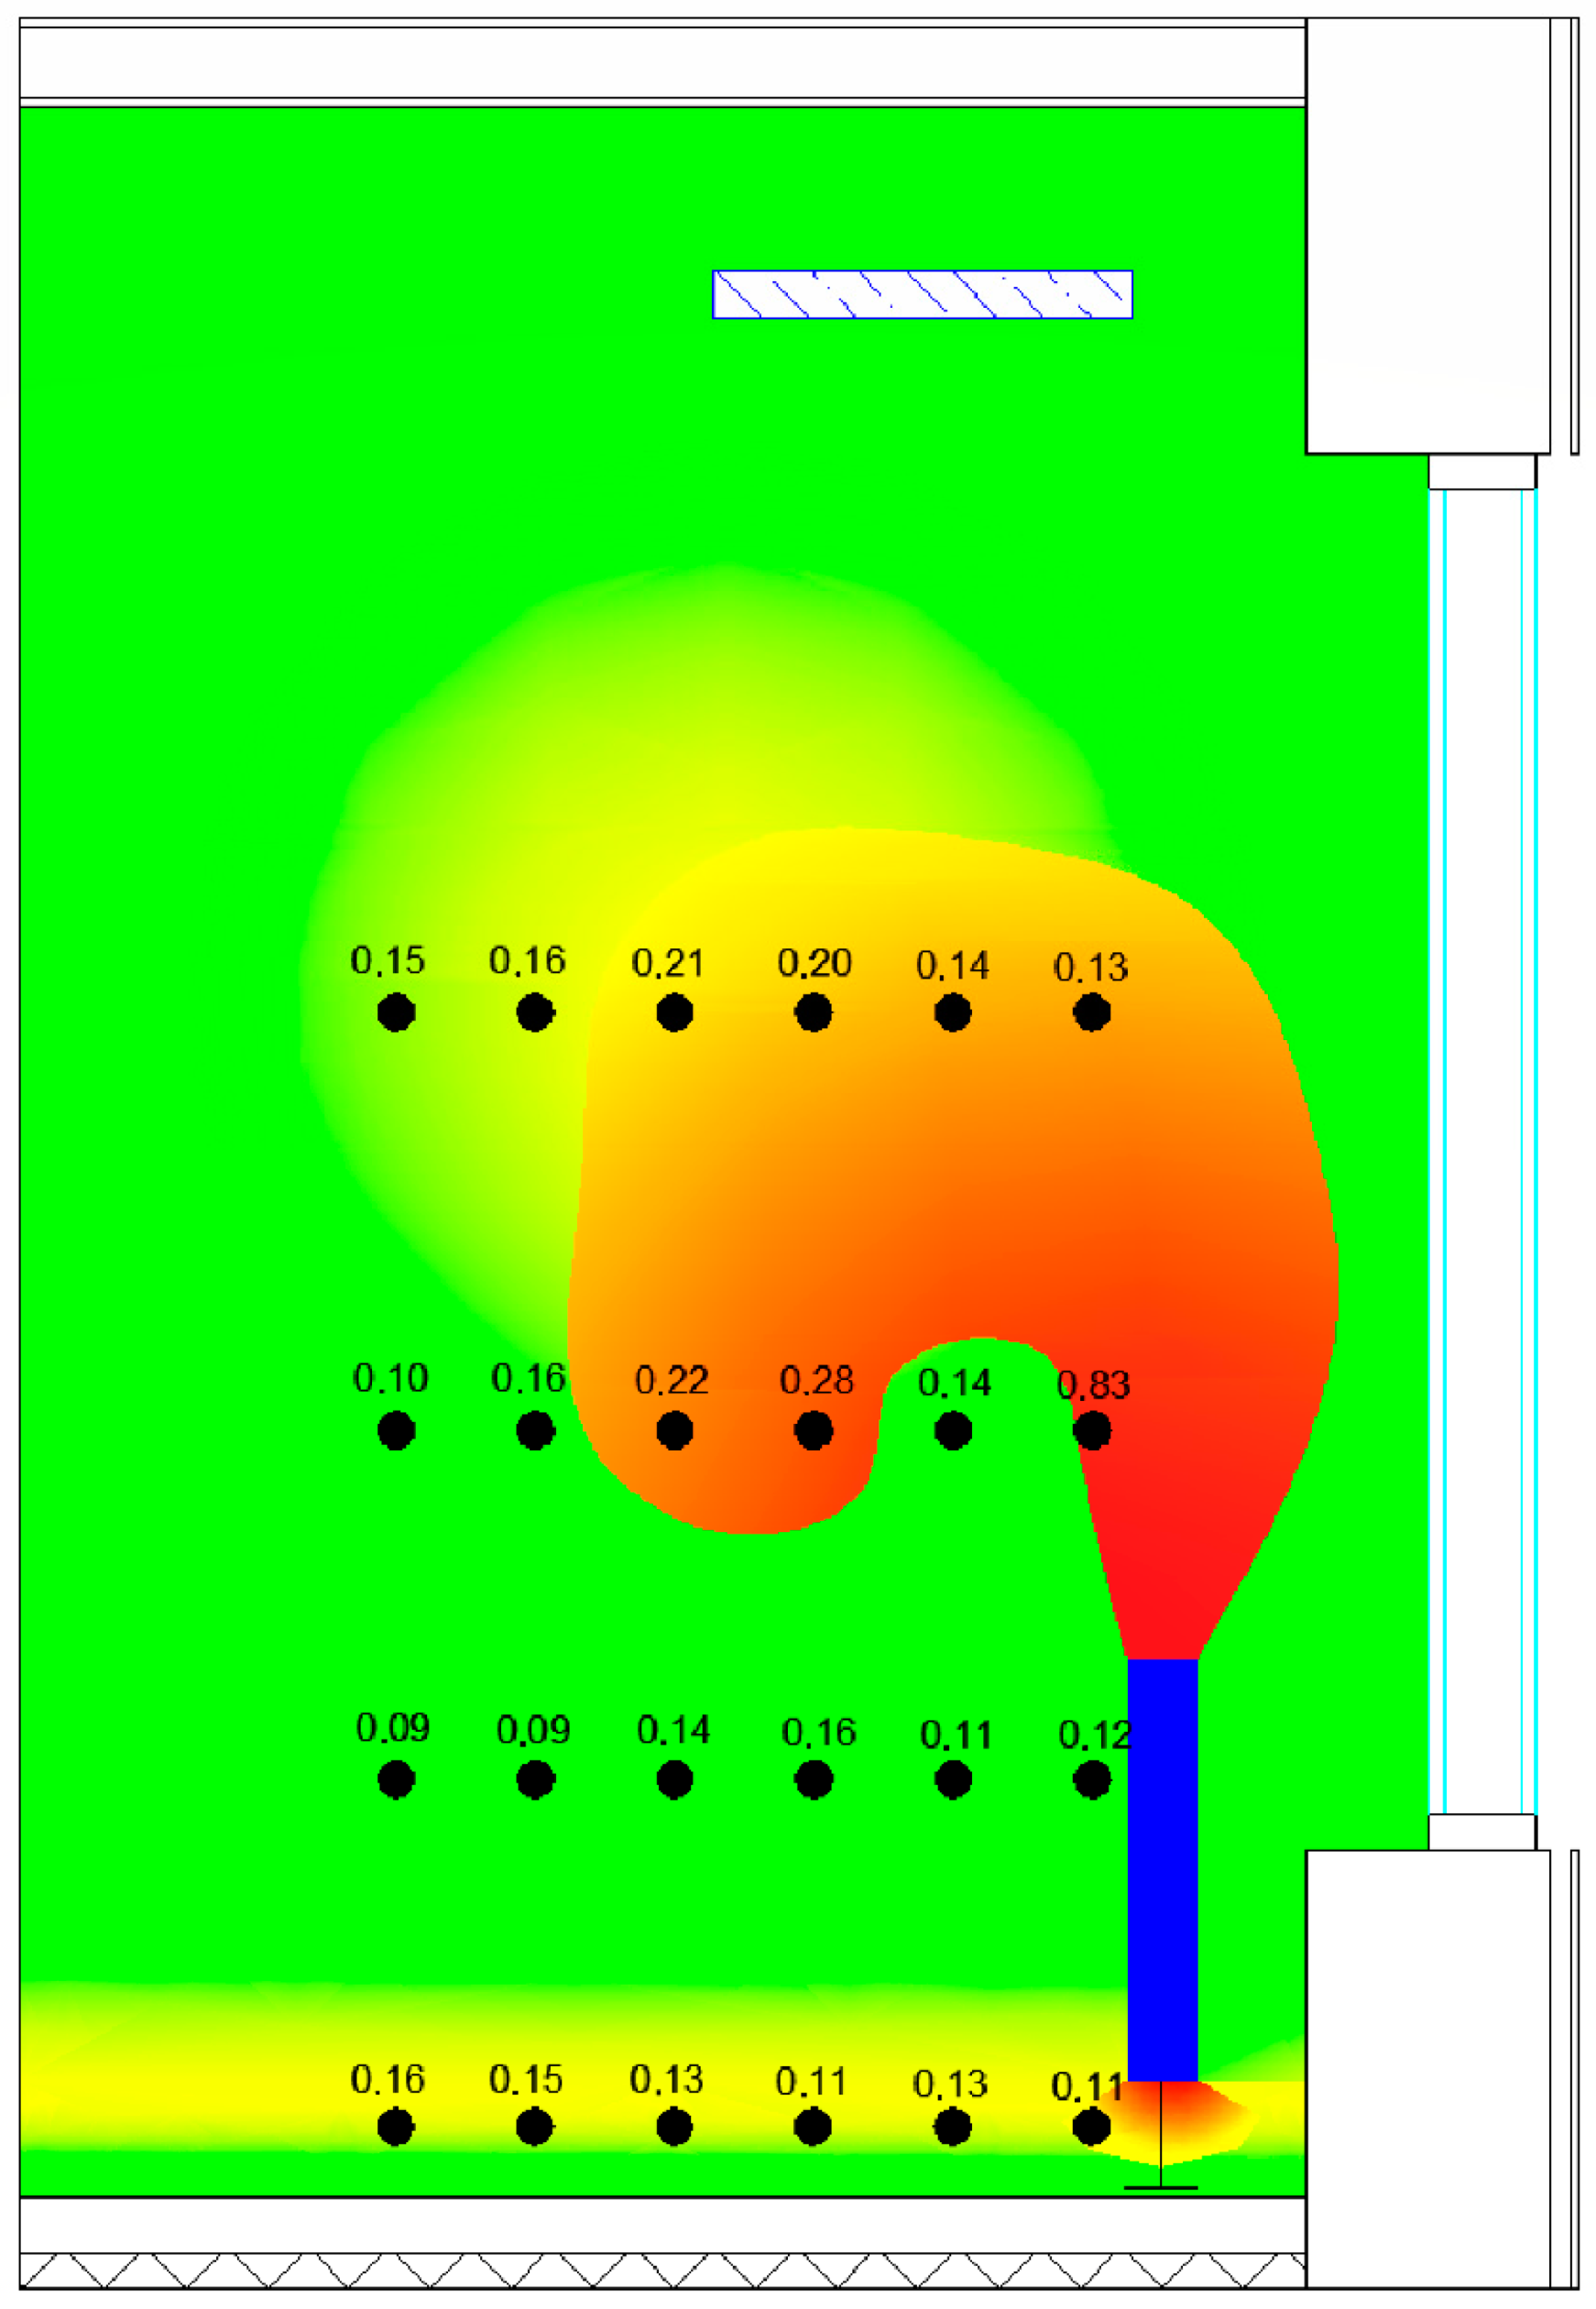
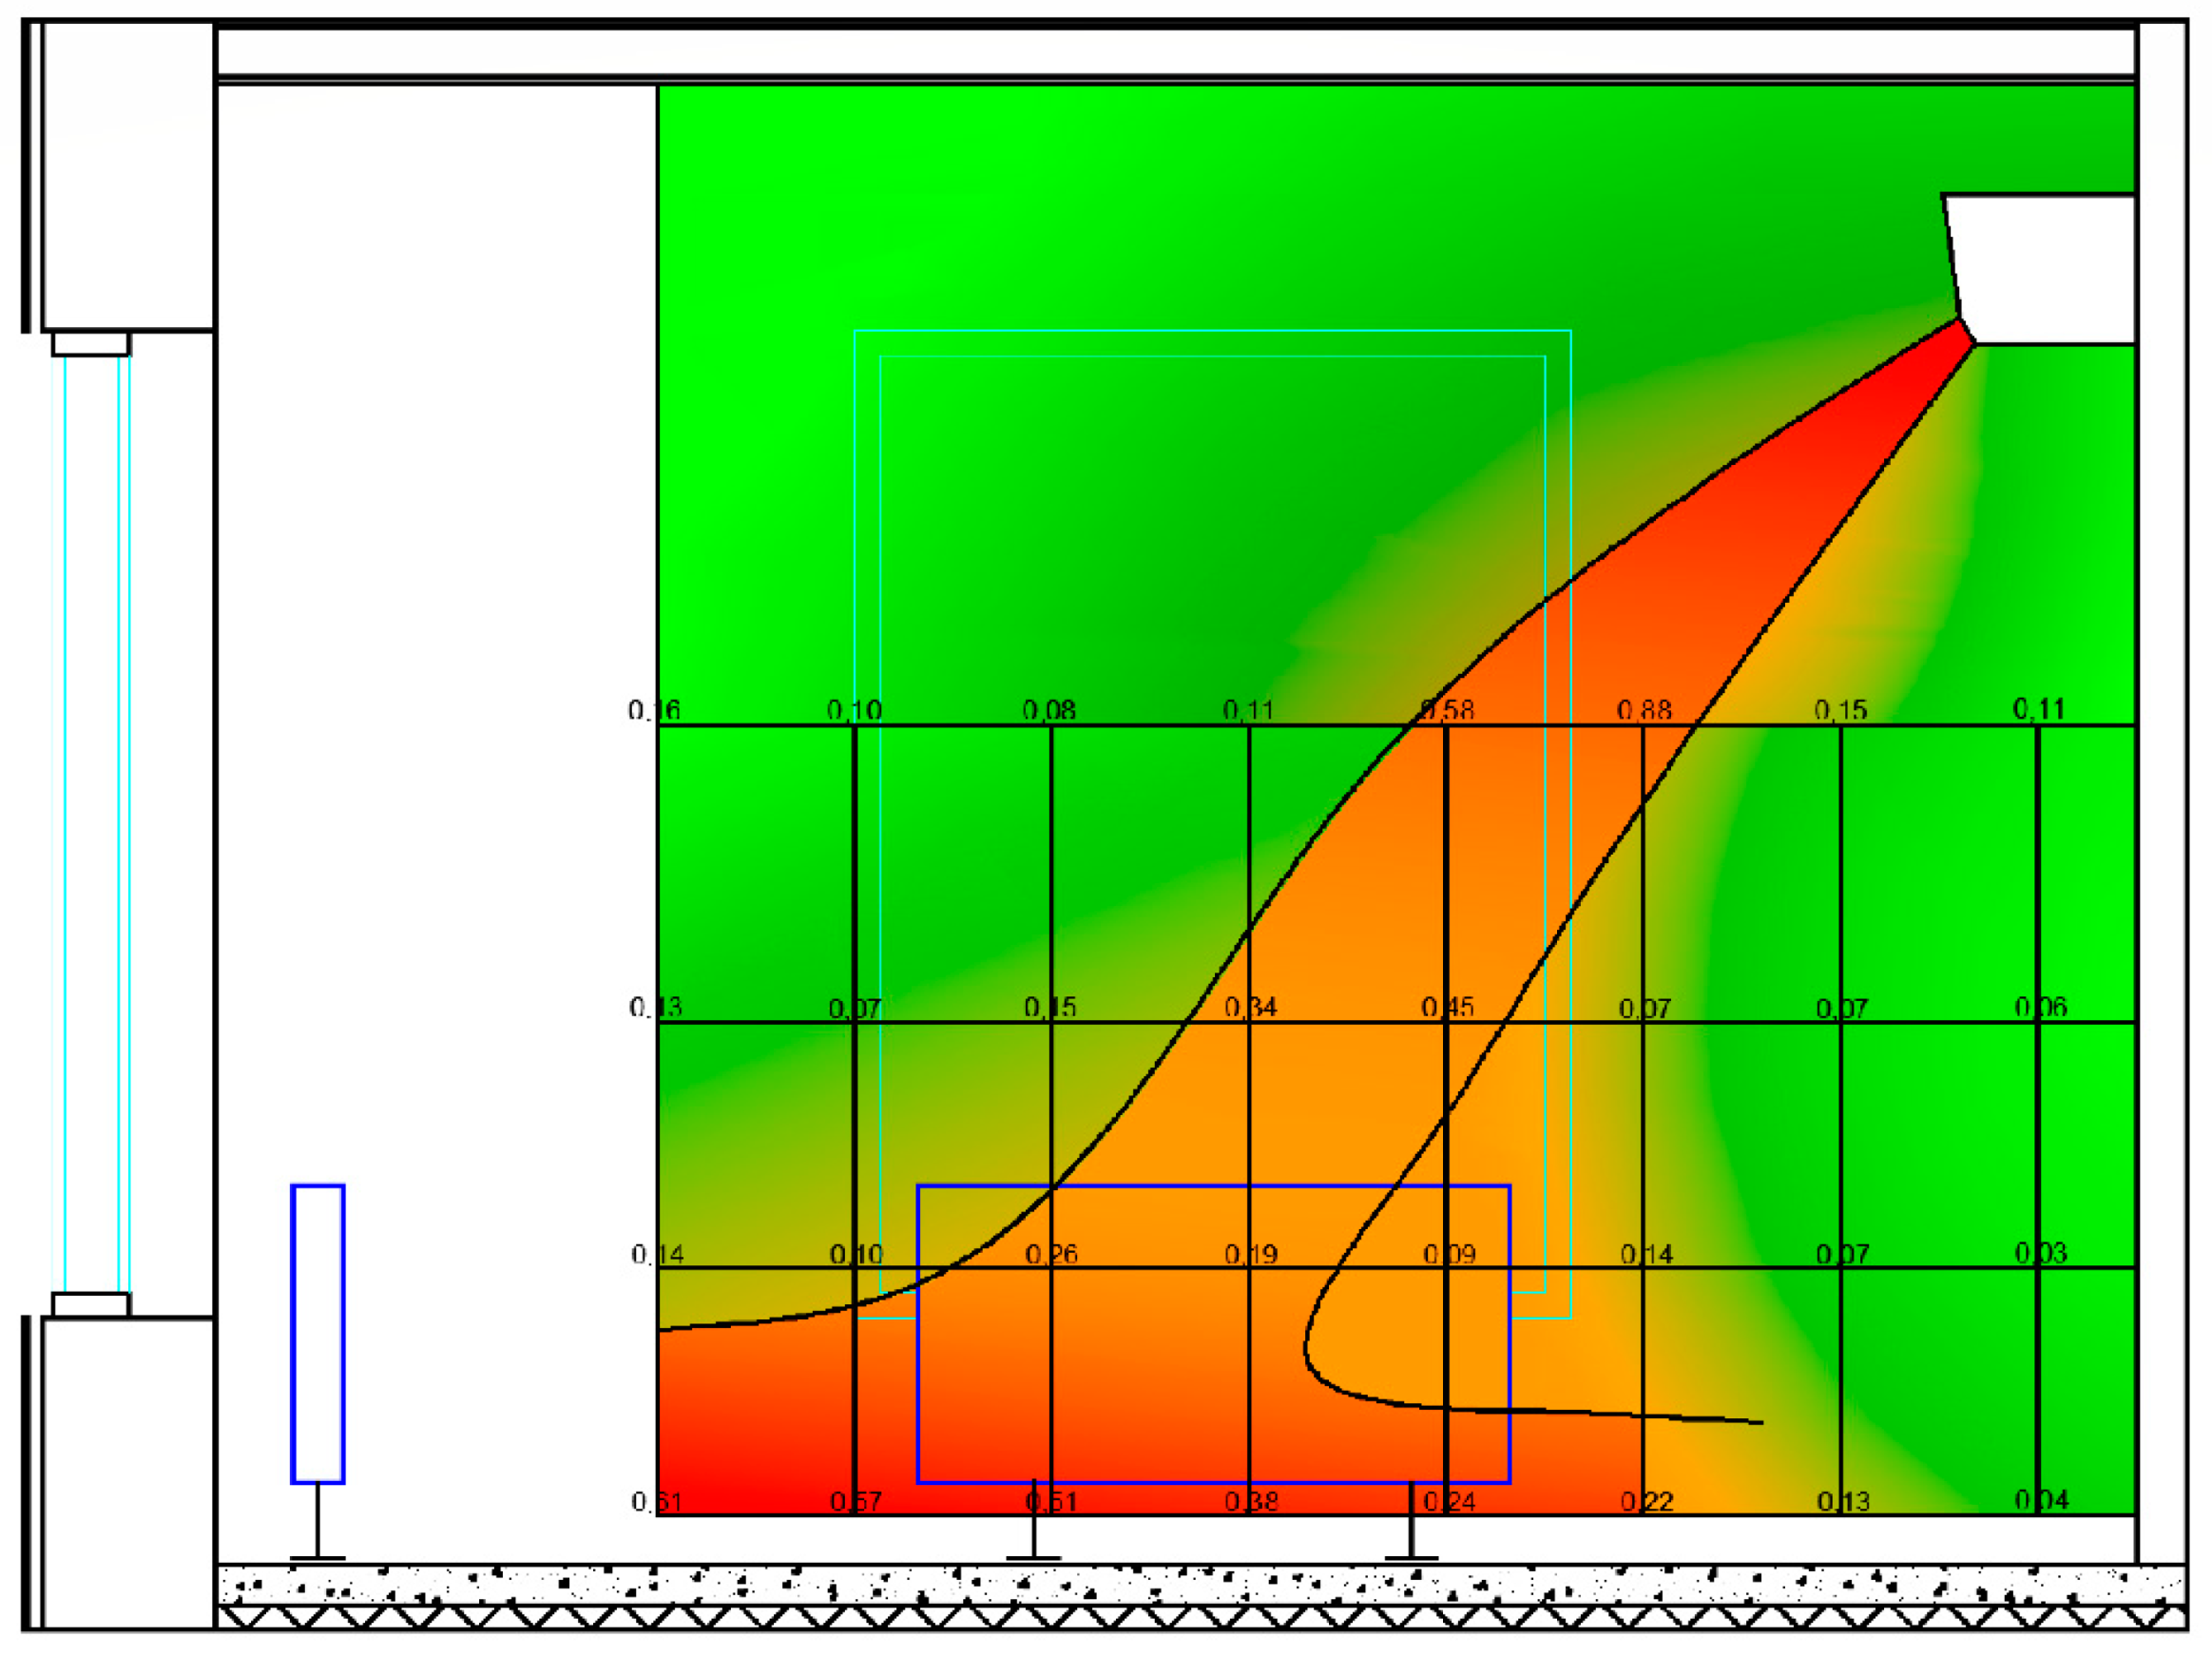
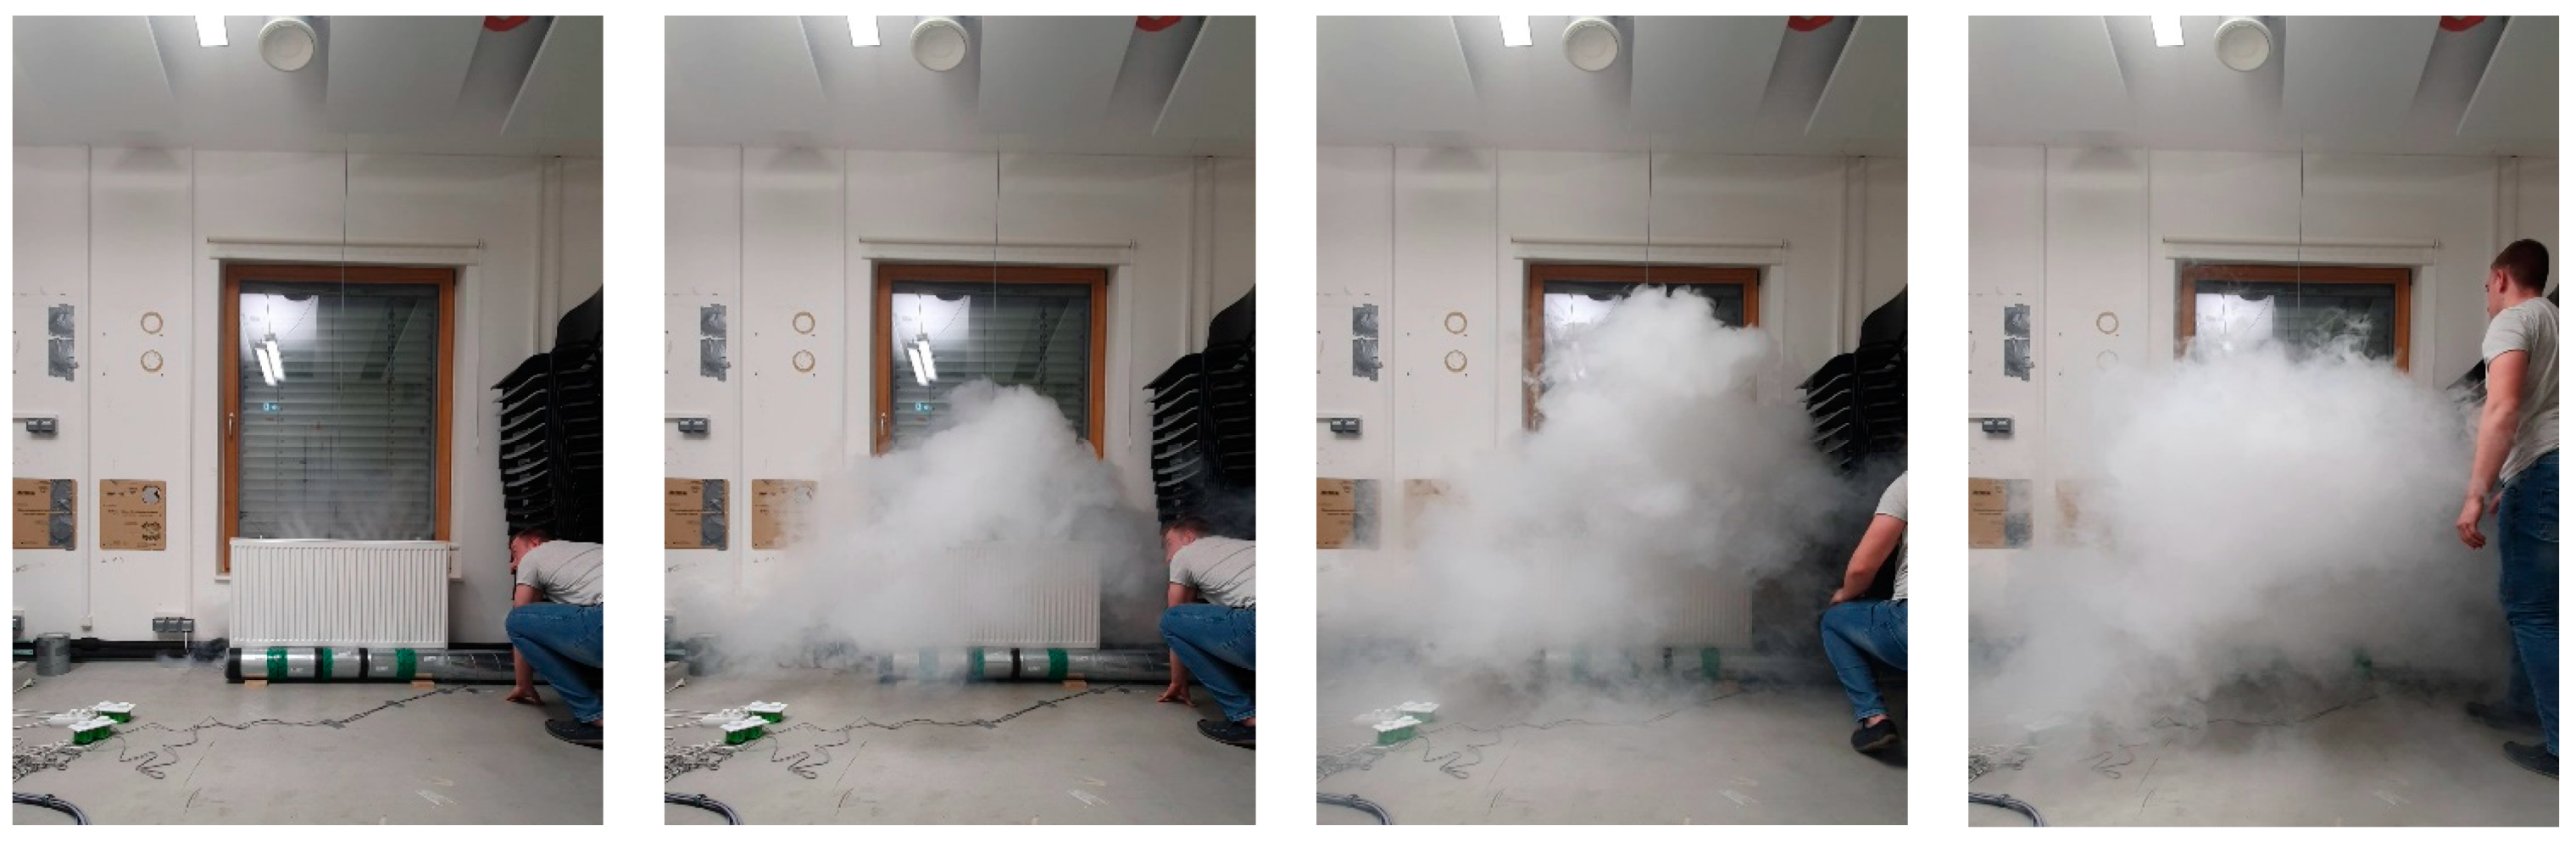
The smoke tests proved to be very useful for visualizing the air distribution patterns around the cooling systems.
Figure 16 and
Figure 17 portray very clearly the radical effect of the fan in the case of radiators. This is also quantified in
Figure 19, where the smoke is confirmed to reach only a height of 2 m before collapsing downward towards the floor.
As a comment on the efficiency results for thermal comfort, we point out that the case of LOW ceiling panels is interesting: although they guarantee a small thermal stratification (
Figure 10) and provide the lowest operative temperature by far (
Figure 11), they score a relatively high velocity at 1.7. m that is out of scale; see
Table 6. Furthermore,
Table 7 clearly proves that no correlation between surface temperature and operative temperature exists, as the HIGH ceiling panels have a lower temperature than the LOW panels. This confirms that when addressing thermal comfort, one needs to consider a whole combination of factors, including plumes generated by internal heat gains, and not only one parameter (e.g., the surface temperature).
Some limitations do exist for this study. First, the testing period was chosen between September and November to ensure less susceptibility to uncontrollable solar loads and external temperature swings. Moreover, as the internal heat gains used in the rooms were static loads, we did not address the systems’ inertia nor control strategies.
The condensation risk was not assessed into detail either. The latent load of the rooms was minimal and primarily due to the dry supply air of the ventilation, which is usually more humid than during the tests. In real applications, avoiding condensation on the surfaces of the radiators, ceiling panels and the floor must be a priority. Condensation risk is determined by supply water temperature that was equal for all the devices.
The power output was highest for the FCU, which reached 1686 W or 54 W/m
2 even at the lowest fan setting and was also the only system to achieve more than 50 W/m
2. The other systems all provided close to 40 W/m
2; therefore, they are suitable to use with a relatively low cooling capacity by design and are accordingly not suitable to spaces where the cooling loads are larger than 50 W/m
2. As the temperature gradients are strongly related to energy efficiency (see, e.g., [
30]), we also point out that in this respect our investigation is limited, as only one or two cooling output levels were measured. Adding measurements at different partial loads and considering additional boundary conditions such as ventilation supply temperature and flow rate as well as the internal and external surface temperatures in the room would provide a more comprehensive overview of the resulting temperature gradients.
5. Conclusions
In this paper, we addressed measurements of the cooling efficiency of radiant panels, fan-assisted radiators, fan coils, and underfloor cooling in terms of cooling power output and impact on thermal comfort. Six heating dummies were also placed within the room to mimic the internal gains of a typical office space. To assess thermal comfort, the change in temperature at different heights as well as the air velocities were observed together with the operative temperature.
Some significant stratification was observed for the underfloor cooling: for a seated occupant, the measured head-ankle temperature difference barely achieved category II for thermal comfort; for a standing occupant, this even worsened to category III. For the other systems, the stratification was milder, and gradients were generally of the order ~1.00 °C/m guaranteed category I. The operative temperature was evaluated as well: systems with larger radiant surfaces generally showed lower operative temperatures.
Air velocity magnitudes were the largest with the fan coil units, as expected. Even at the lowest fan speed setting, they only classified for thermal comfort category IV. All the other systems had lower velocities and achieved category I apart from the LOW ceiling panel, where the upward plume from the heating dummies or supply jets from ventilation valves probably prevailed.
Finally, a valuable result is that the cooling panels achieved a specific power of 36 W/m2 per floor surface but 78 W/m2 per radiant panel surface. Accordingly, they can be used even in rooms with a high cooling load if the panels are distributed as optimally as possible in the room ceiling. In summary, the most performing cooling devices for the studied 40 W/m2 cooling application were the ceiling panels and fan-assisted radiators, followed by underfloor cooling having a limitation of stratification. Because of the strong jet, fan coil units cannot achieve thermal comfort within the whole occupied zone.
Although the investigation was quite thorough and articulated, it is affected by several limitations. As the testing occurred in September through November, a typical cooling season could not be addressed; static internal loads were used instead of more realistic dynamic heat gains; thus, control strategies were not assessed. Other possible refinements include investigating the condensation risk, testing devices with a larger cooling power, and adding enough measurement points to cover the measurement space entirely, thus representing the average gradient in the entire room. The results of this study are planned to be used for quantitative cooling emission efficiency analyses in further research.


