Article

Artificial Neural Network Modelling and Experimental Evaluation of Dust and Thermal Energy Impact on Monocrystalline and Polycrystalline Photovoltaic Modules

1
Faculty of Computing and IT, Sohar University, P.O. Box 44, Sohar PCI 311, Oman
2
Faculty of Engineering, Sohar University, P.O. Box 44, Sohar PCI 311, Oman
*
Author to whom correspondence should be addressed.
Energies 2022, 15(11), 4138; https://doi.org/10.3390/en15114138
Submission received: 26 April 2022 / Revised: 26 May 2022 / Accepted: 2 June 2022 / Published: 4 June 2022
(This article belongs to the Special Issue Cutting-Edge Solar Panel and Cell Technologies)

Abstract

:
Many environmental parameters affect the performance of solar photovoltaics (PV), such as dust and temperature. In this paper, three PV technologies have been investigated and experimentally analyzed (mono, poly, and flexible monocrystalline) in terms of the impact of dust and thermal energy on PV behavior. Furthermore, a modular neural network is designed to test the effects of dust and temperature on the PV power production of six PV modules installed at Sohar city, Oman. These experiments employed three pairs of PV modules (one cleaned daily and one kept dusty for 30 days). The performance of the PV power production was evaluated and examined for the three PV modules (monocrystalline, polycrystalline, and flexible), which achieved 30.24%, 28.94%, and 36.21%, respectively. Moreover, the dust reduces the solar irradiance approaching the PV module and reduces the temperature, on the other hand. The neural network and practical models’ performance were compared using different indicators, including MSE, NMSE, MAE, Min Abs Error, and r. The Mean Absolute Error (MAE) is used for evaluating the accuracy of the ANN machine learning model. The results show that the accuracy of the predicting power of the six PV modules was considerable, at 97.5%, 97.4%, 97.6%, 96.7%, 96.5%, and 95.5%, respectively. The dust negatively reduces the PV modules’ power production performance by about 1% in PV modules four and six. Furthermore, the results were evident that the negative effect of the dust on the PV module production based on the values of RMSE, which measures the square root of the average of the square’s errors. The average errors in predicting the power production of the six PV modules are 0.36406, 0.38912, 0.34964, 0.49769, 0.46486, and 0.68238.

1. Introduction

Renewable energy sources and technologies have become attractive and compete with fossil fuels. With the exacerbation of economic issues and the crisis of high environmental pollution, the global trend towards renewable energy has become noticeable, especially solar energy. There has been a noticeable and renewed interest in the use of renewable energy recently [1]. This reduces the significant adverse environmental impact that results from the heavy use of fossil energy. With the increasing obstacles related to the use of fossil fuels from a political and ecological point of view, those interested in energy must exploit alternative natural sources for energy production. Solar energy is one of the most widespread renewable energies on the globe. Its energy is estimated at more than 150,000 terawatts of the total energy on the earth’s surface. Solar energy technologies spread fast in the last two decades. Photovoltaic, which converts solar energy into direct electricity, has been used in many applications [2]. PV technologies have been investigated by much research from different views over the past few decades. It was concluded that there are some disadvantages of investing in photovoltaics, such as a sharp reduction in PV costs and improved PV efficiency [3].
The desert and coastal areas are among the most suitable regions for photovoltaic uses due to the abundance of solar radiation throughout the year. However, these areas have many challenges that affect the surfaces and efficiency of PV modules. The dust accumulation is the most noticeable effect in these areas on the surfaces of the photovoltaic module blocks and reflects the solar radiation. This situation leads to an impact on performance and efficiency over time. Dust accumulation occurs for various reasons, including the type of installation, the photovoltaic module slope, amount of humidity, etc. [4].
Several research studies have investigated the impact dust has on solar photovoltaics. Appels et al. [5] investigated the effect of dust accumulation on PV modules experimentally. The study suggested using a coating to reduce dust accumulation and losses. The authors claimed that the rain removes the large dust particle (>60 µm) due to the coating compared with small dust particles. Rajput et al. [6] experimentally investigated the effect of environmental dust on the efficiency of solar cells over a year. Through the graphical results, the maximum efficiency obtained without dust was 0.64%, and the resulting energy was 92.11%. The lowest efficiency is 0.33% with dust, equivalent to 89% of the energy. As dust significantly affects energy production, performance must be ensured by providing a source of dust cleaning for the surface of solar cells. Guo et al. [7] investigated the cleanliness index to study the percentage of loss resulting from dust deposition on photovoltaic modules for one year. The study showed that the average drop for one day is 0.46% if the modules are cleaned within two months and 10–20% per month. Wind speed and humidity are among the most important factors for dust deposition on modules. Klugmann-Radziemska E [8] evaluated the negative impact of dust accumulation on the power generation of solar photovoltaic (PV) modules in dusty conditions. The experiments showed a reduction of 3% annually in energy output. Saidan et al. [9] investigated the effect of dust on photovoltaic solar modules in Baghdad city experimentally. The dust density and aerosol size distribution on the modules were measured. The results showed a decrease in the current short circuit (ISC) and output power in each solar module with dust deposits compared to the clean modules. The average effect on efficiency was 6.24%, 11.8%, and 18.74%, which worked for periods of exposure to dust on the modules for one day, one week, and one month, respectively. ALI et al. [10] investigated the dust deposition on the surface of two types of PV modules (monocrystalline and polycrystalline) during three months of the winter season. The study showed that the amount of dust deposited on the module’s surfaces amounted to 0.98667 mg/cm3, leading to a decrease in the average generated energy of 20% and 16% and a reduction in efficiency of 3.55% and 3.01%, respectively.
Gholami et al. [11] have conducted 70 days of experiments to investigate the dust effect on PV performance in Iran. This study was carried out on days when the region suffered from a lack of rain. They were started in May 2017 to identify how the photovoltaic modules are affected by dust accumulation. The results show a decrease of 21.47% in energy output and a total reduction of 289 kW for every 4.845 kW of output power capacity. The energy reduction was estimated to be equivalent to three hectares of forest area absorbing (32.7 tons) of carbon per MW of capacity. Chen et al. [12] studied factors that affected dust accumulation on photovoltaic cells and investigated the effects of temperature, protection, and corrosion. It is found that the accumulation and increase in dust on the surfaces of photovoltaic cells reduces the efficiency of photoelectric conversion (short-circuit current and voltage). This decrease in photovoltaic energy was estimated by about 34% if the density of the accumulated dust was 10 g/m2. Hachicha et al. [13] examined the performance of solar photovoltaic (PV) modules in dusty conditions in the United Arab Emirates. The results showed a decrease of 1.7% per g/m2 in power generation. Additionally, there was an increase of 5.44 g/m2 in dust density within five months. The accumulated dust reduced the power generation by 12.7%. Kazem et al. [14] implemented an experimental analysis to examine the impact of dust accumulation on the PV module’s energy losses. The results demonstrated that 64% of the dust particles’ diameters were 2–63 μm. The daily reduction of efficiency was 0.05% compared to neighboring countries, which is considered a small value. The results show the recommended period of cleaning the cells should not exceed three months.
Kazem et al. [15] proposed an analytical model for dust impact on PV performance in terms of dust ingredients. A 1.4 kW PV system was installed in Sohar, Oman, with ten monocrystalline PV modules with rated power equal to 140 W. The PV modules have been connected to produce a 1.4 kW PV system. The effect of dust on the system performance has been investigated. Furthermore, dust collected from six locations has been tested. The ingredient was analyzed, and their effect was discussed. The proposed model is used to investigate natural and artificial dust in Oman. The proposed model was validated using proper mathematical indicators. However, in the current study, the proposed model is ANN compared to the analytical model of Ref. [15]. On the other hand, the artificial neural network ANN is used for prediction applications in many fields. Ziółkowski et al. [16] used ANN to predict the fuel consumption of vehicles. Multi-Layer perceptron MLP is used for modeling and prediction. Some performance parameters are used to evaluate the prediction errors and accuracy, such as MAPE, r, and R2. De Silva et al. [17] used neural network autoregression NNAR and MLP to predict electricity consumption in the industrial sector in Brazil. MAPE is used to evaluate the prediction accuracy. The results show that the MLP model presents the best prediction. Elsheikh et al. [18] reviewed ANN techniques. The study is a comprehensive revision and contains a comparison between different techniques. It is worth mentioning that ANN is applicable to model and evaluate different solar energy applications, as has been discussed, such as photovoltaic design, solar thermal collector, PV/T, solar water heater, etc. Furthermore, different statistical criteria used to evaluate ANN models were discussed. Elsheikh et al. [19] proposed two ANN models to predict the water yield of a solar distiller integrated with the evacuated tube. ANN and moth-flame optimizers are used to find the optimal internal parameters of hybrid long short-term memory. Experimental data was used to test and train the proposed model. The lower values of error indicators (RMSE, MAE, MRE) and higher accuracy indicators (R2, OI, EC) approved the proposed model.
Table 1 illustrates some published studies in the literature. It is found that the PV power losses were investigated based on the dust accumulation period (daily, weekly, monthly, and yearly), PV technologies, etc. However, the review literature indicated many multiple parameters that affect the function and power generation of the PV system, such as location, dust characteristics, and pollution in the province.
The current study investigates the effect of dust and temperature on PV module technologies. This study installed monocrystalline, polycrystalline, and flexible monocrystalline PV modules horizontally in Sohar, Oman. A pair of PV modules were used for each technology—one to be cleaned daily and one to be kept dusty for 30 days in November 2021. Measurements were taken for the PV performance parameters and evaluated. Additionally, ANN techniques were used to investigate the pattern and predict different scenarios. Analysis, discussion, and comparison of experimental and ANN model results are presented.

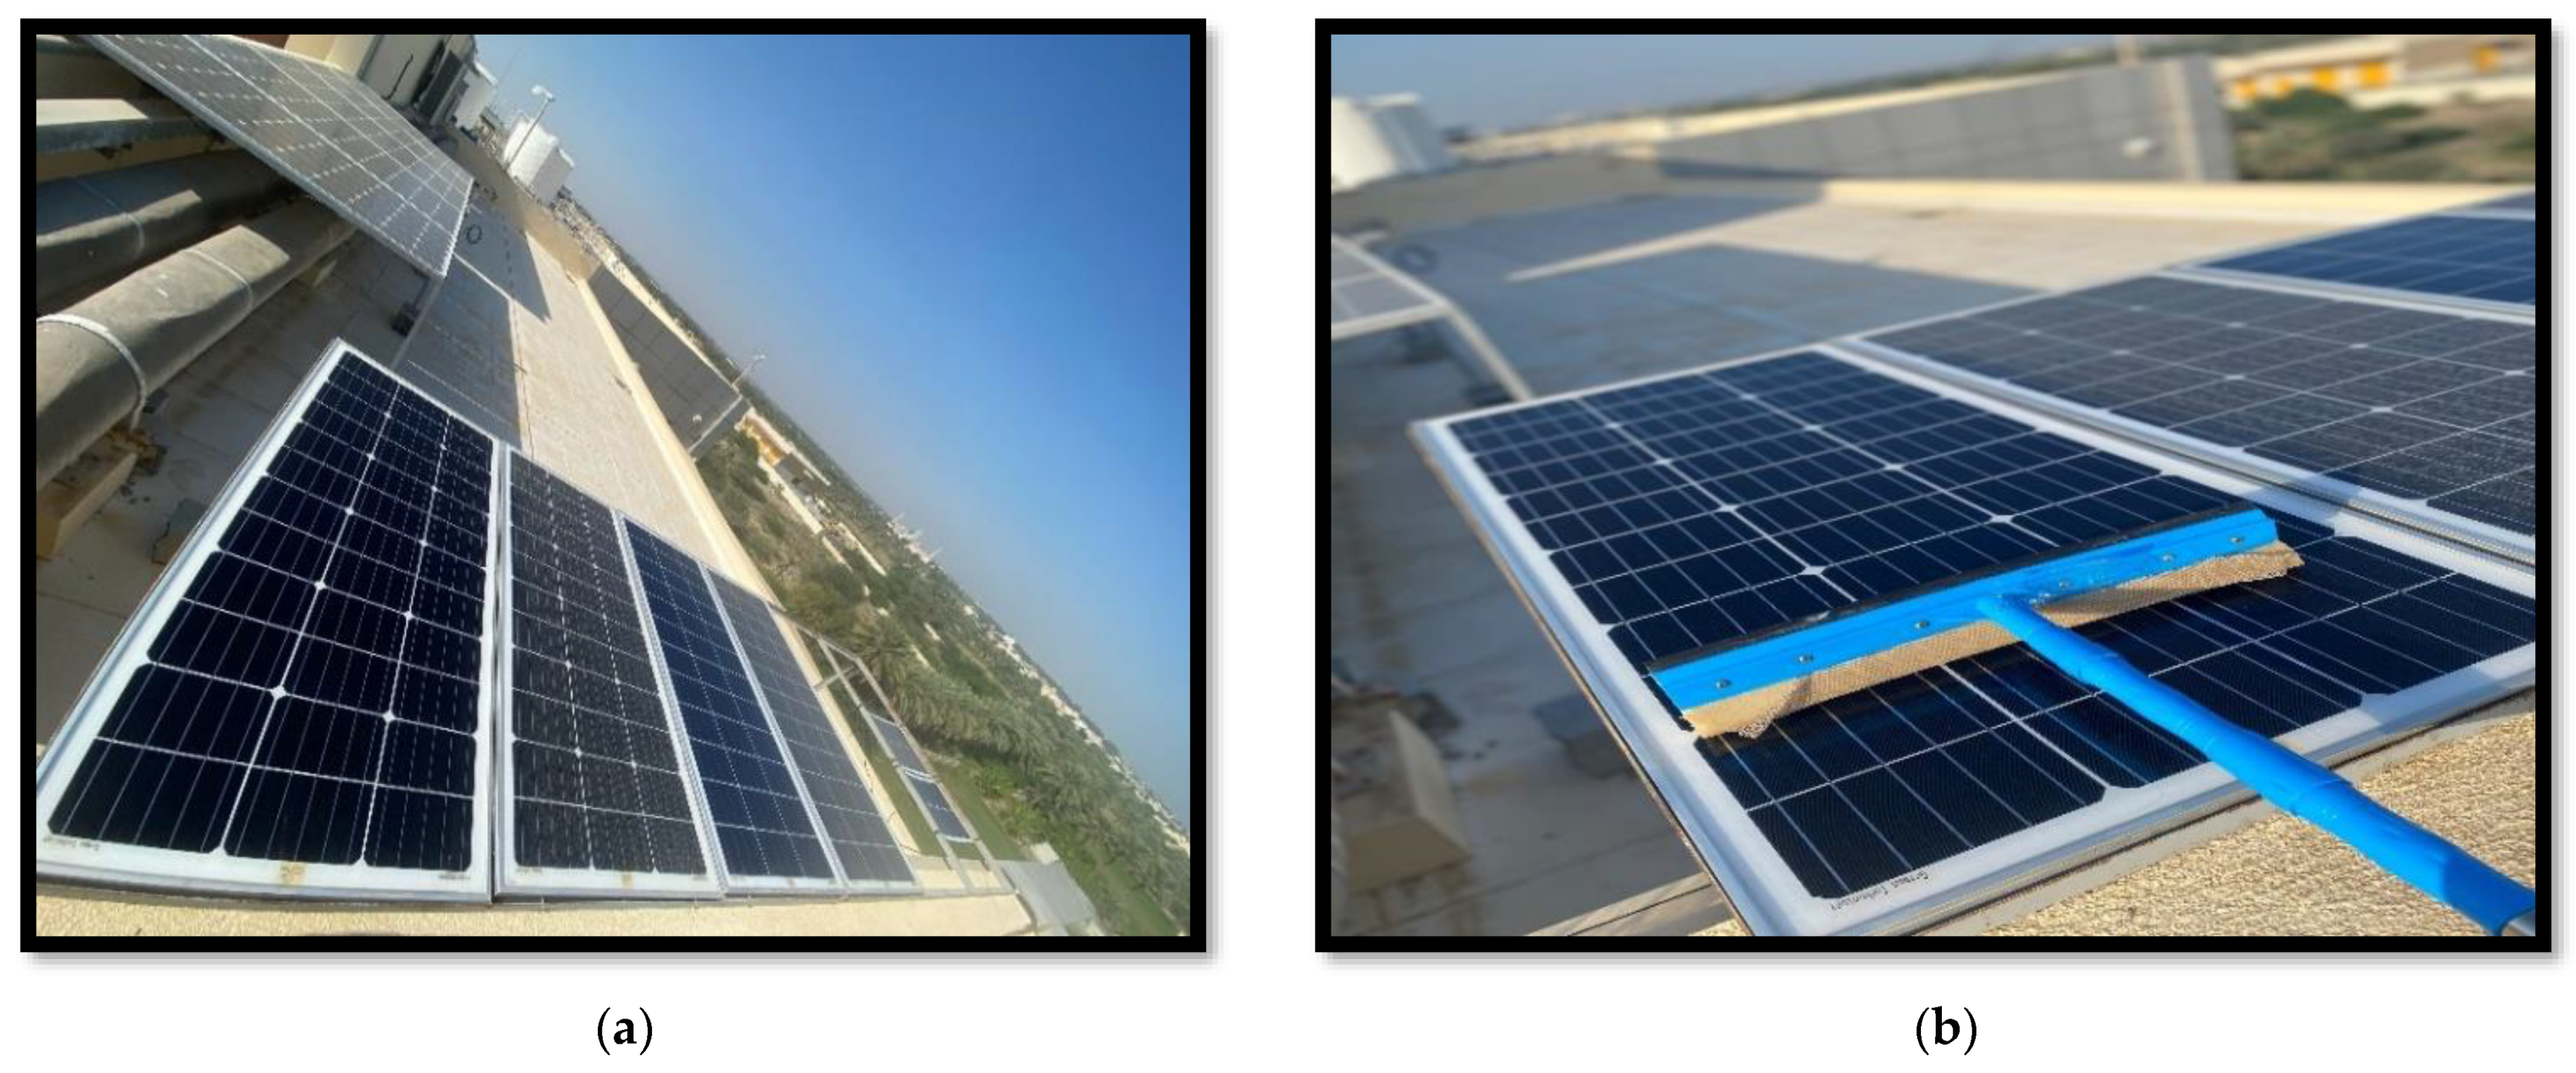
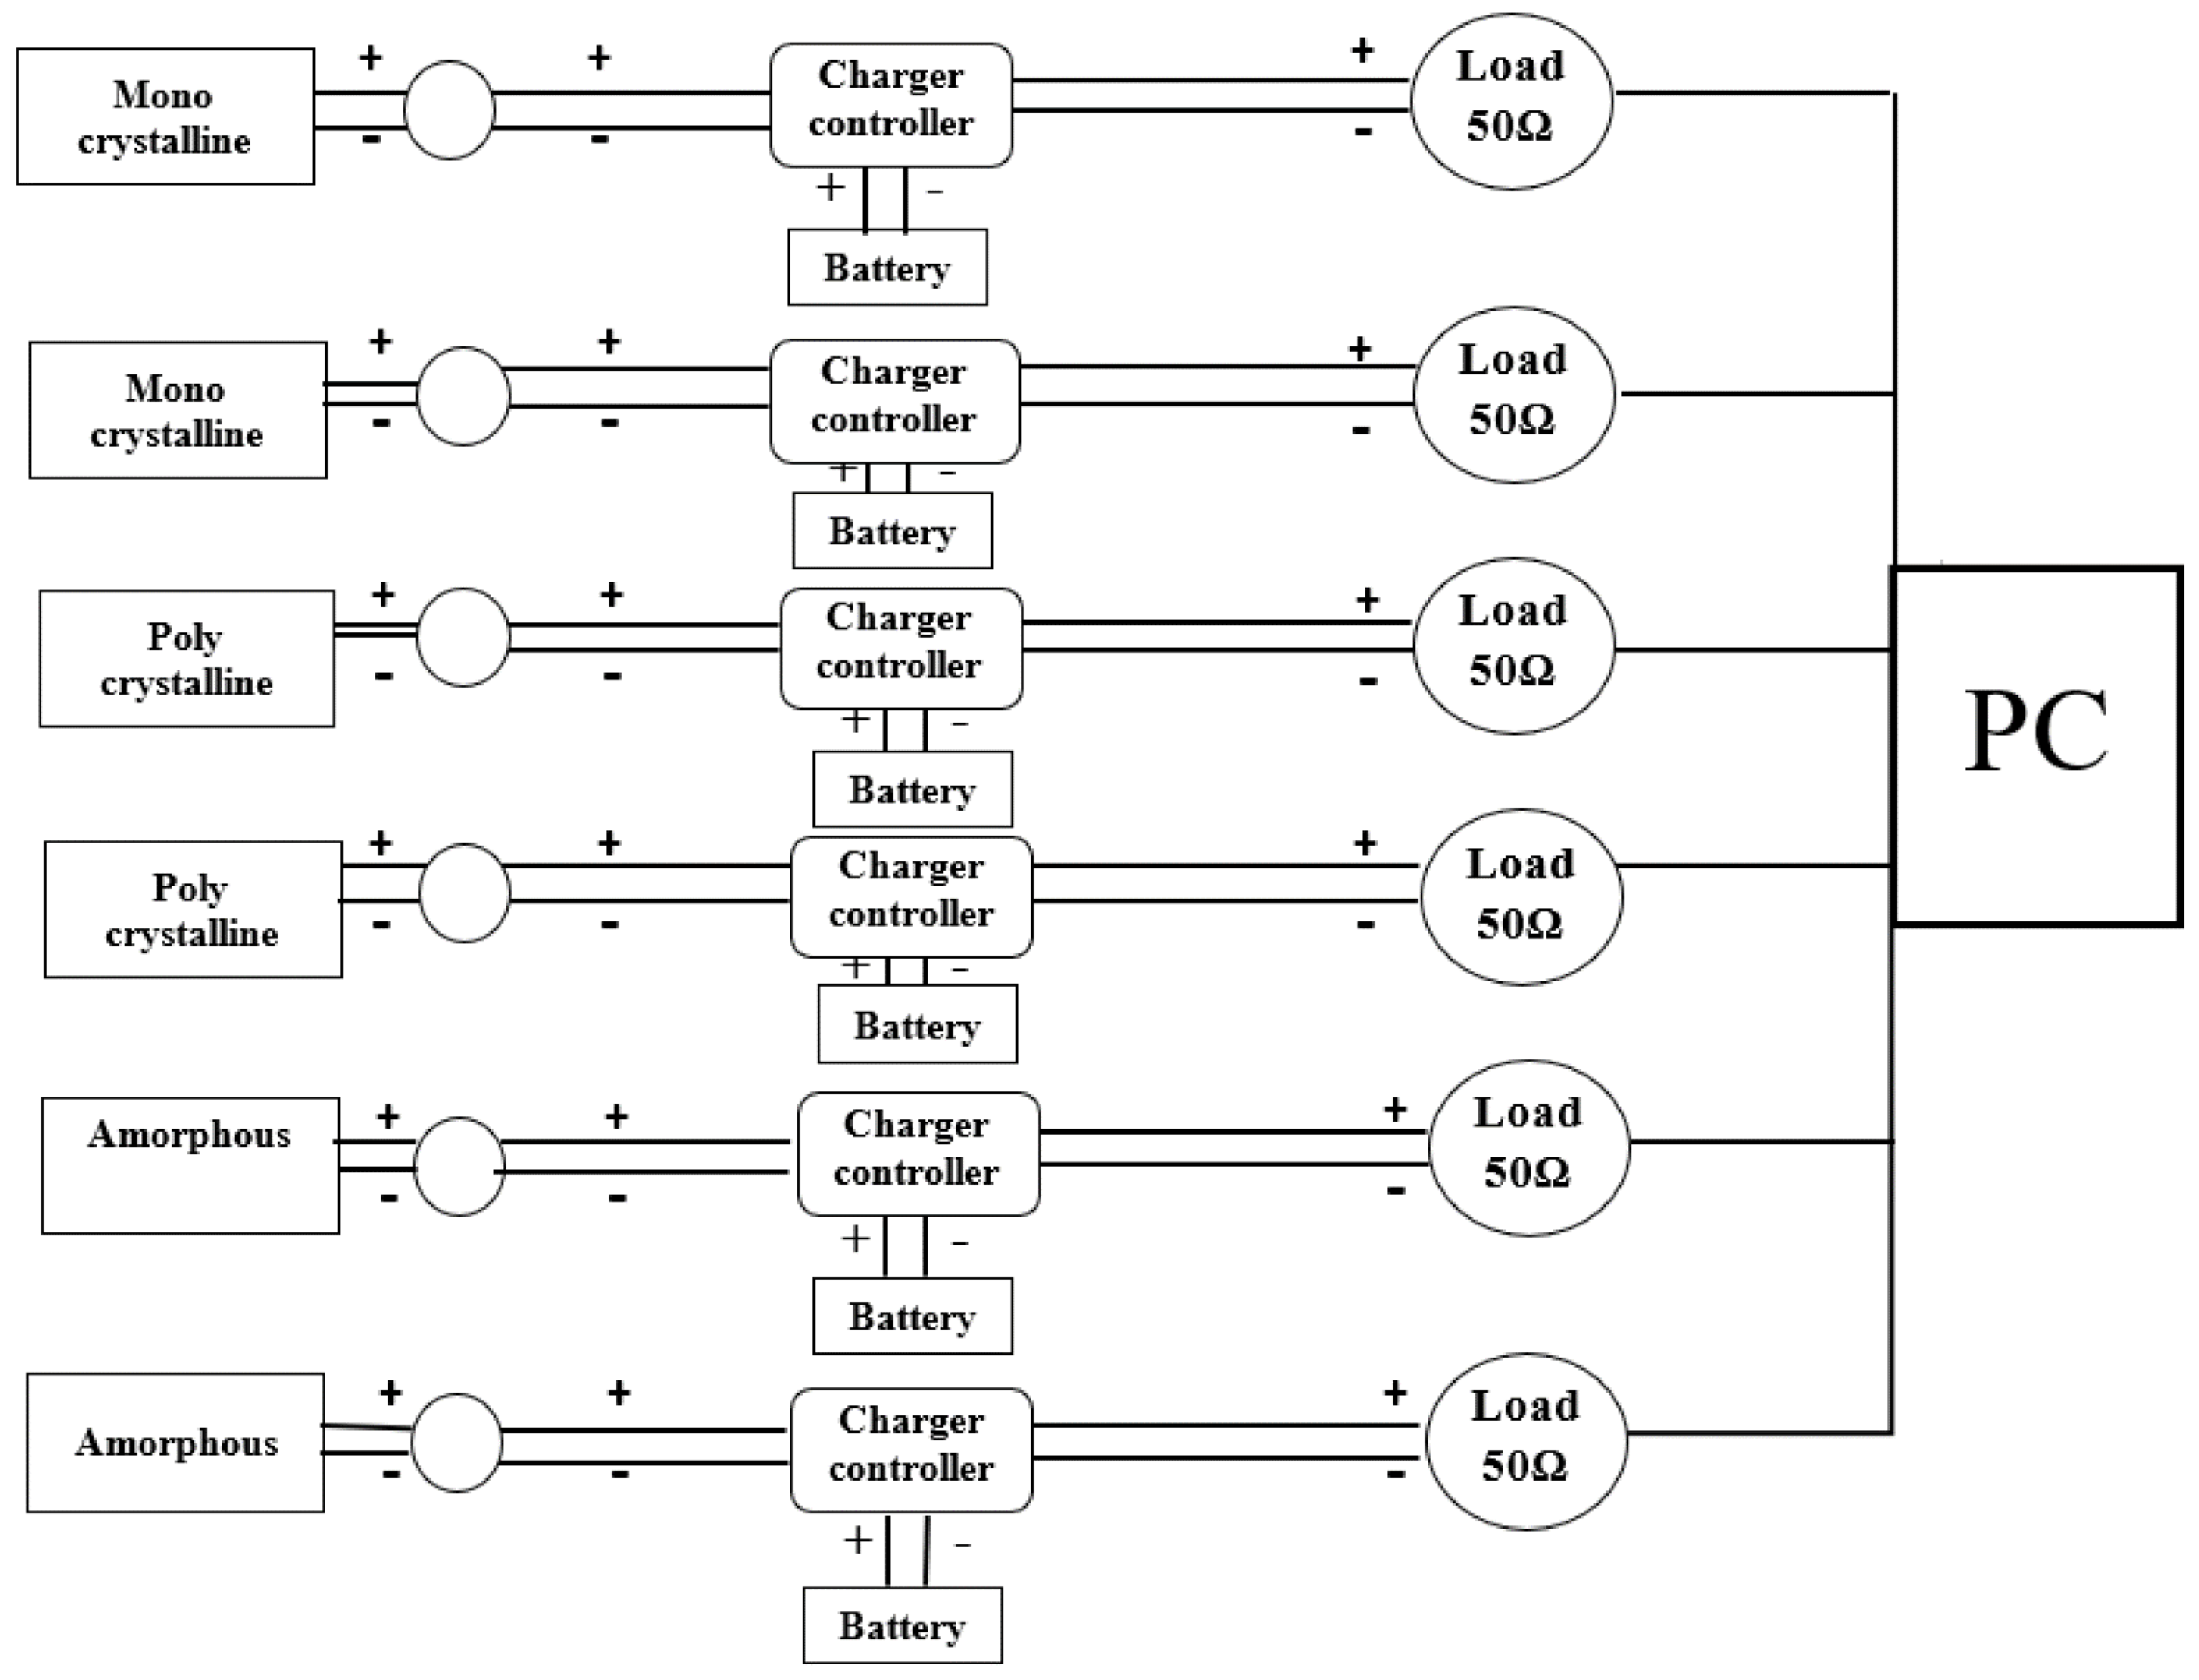
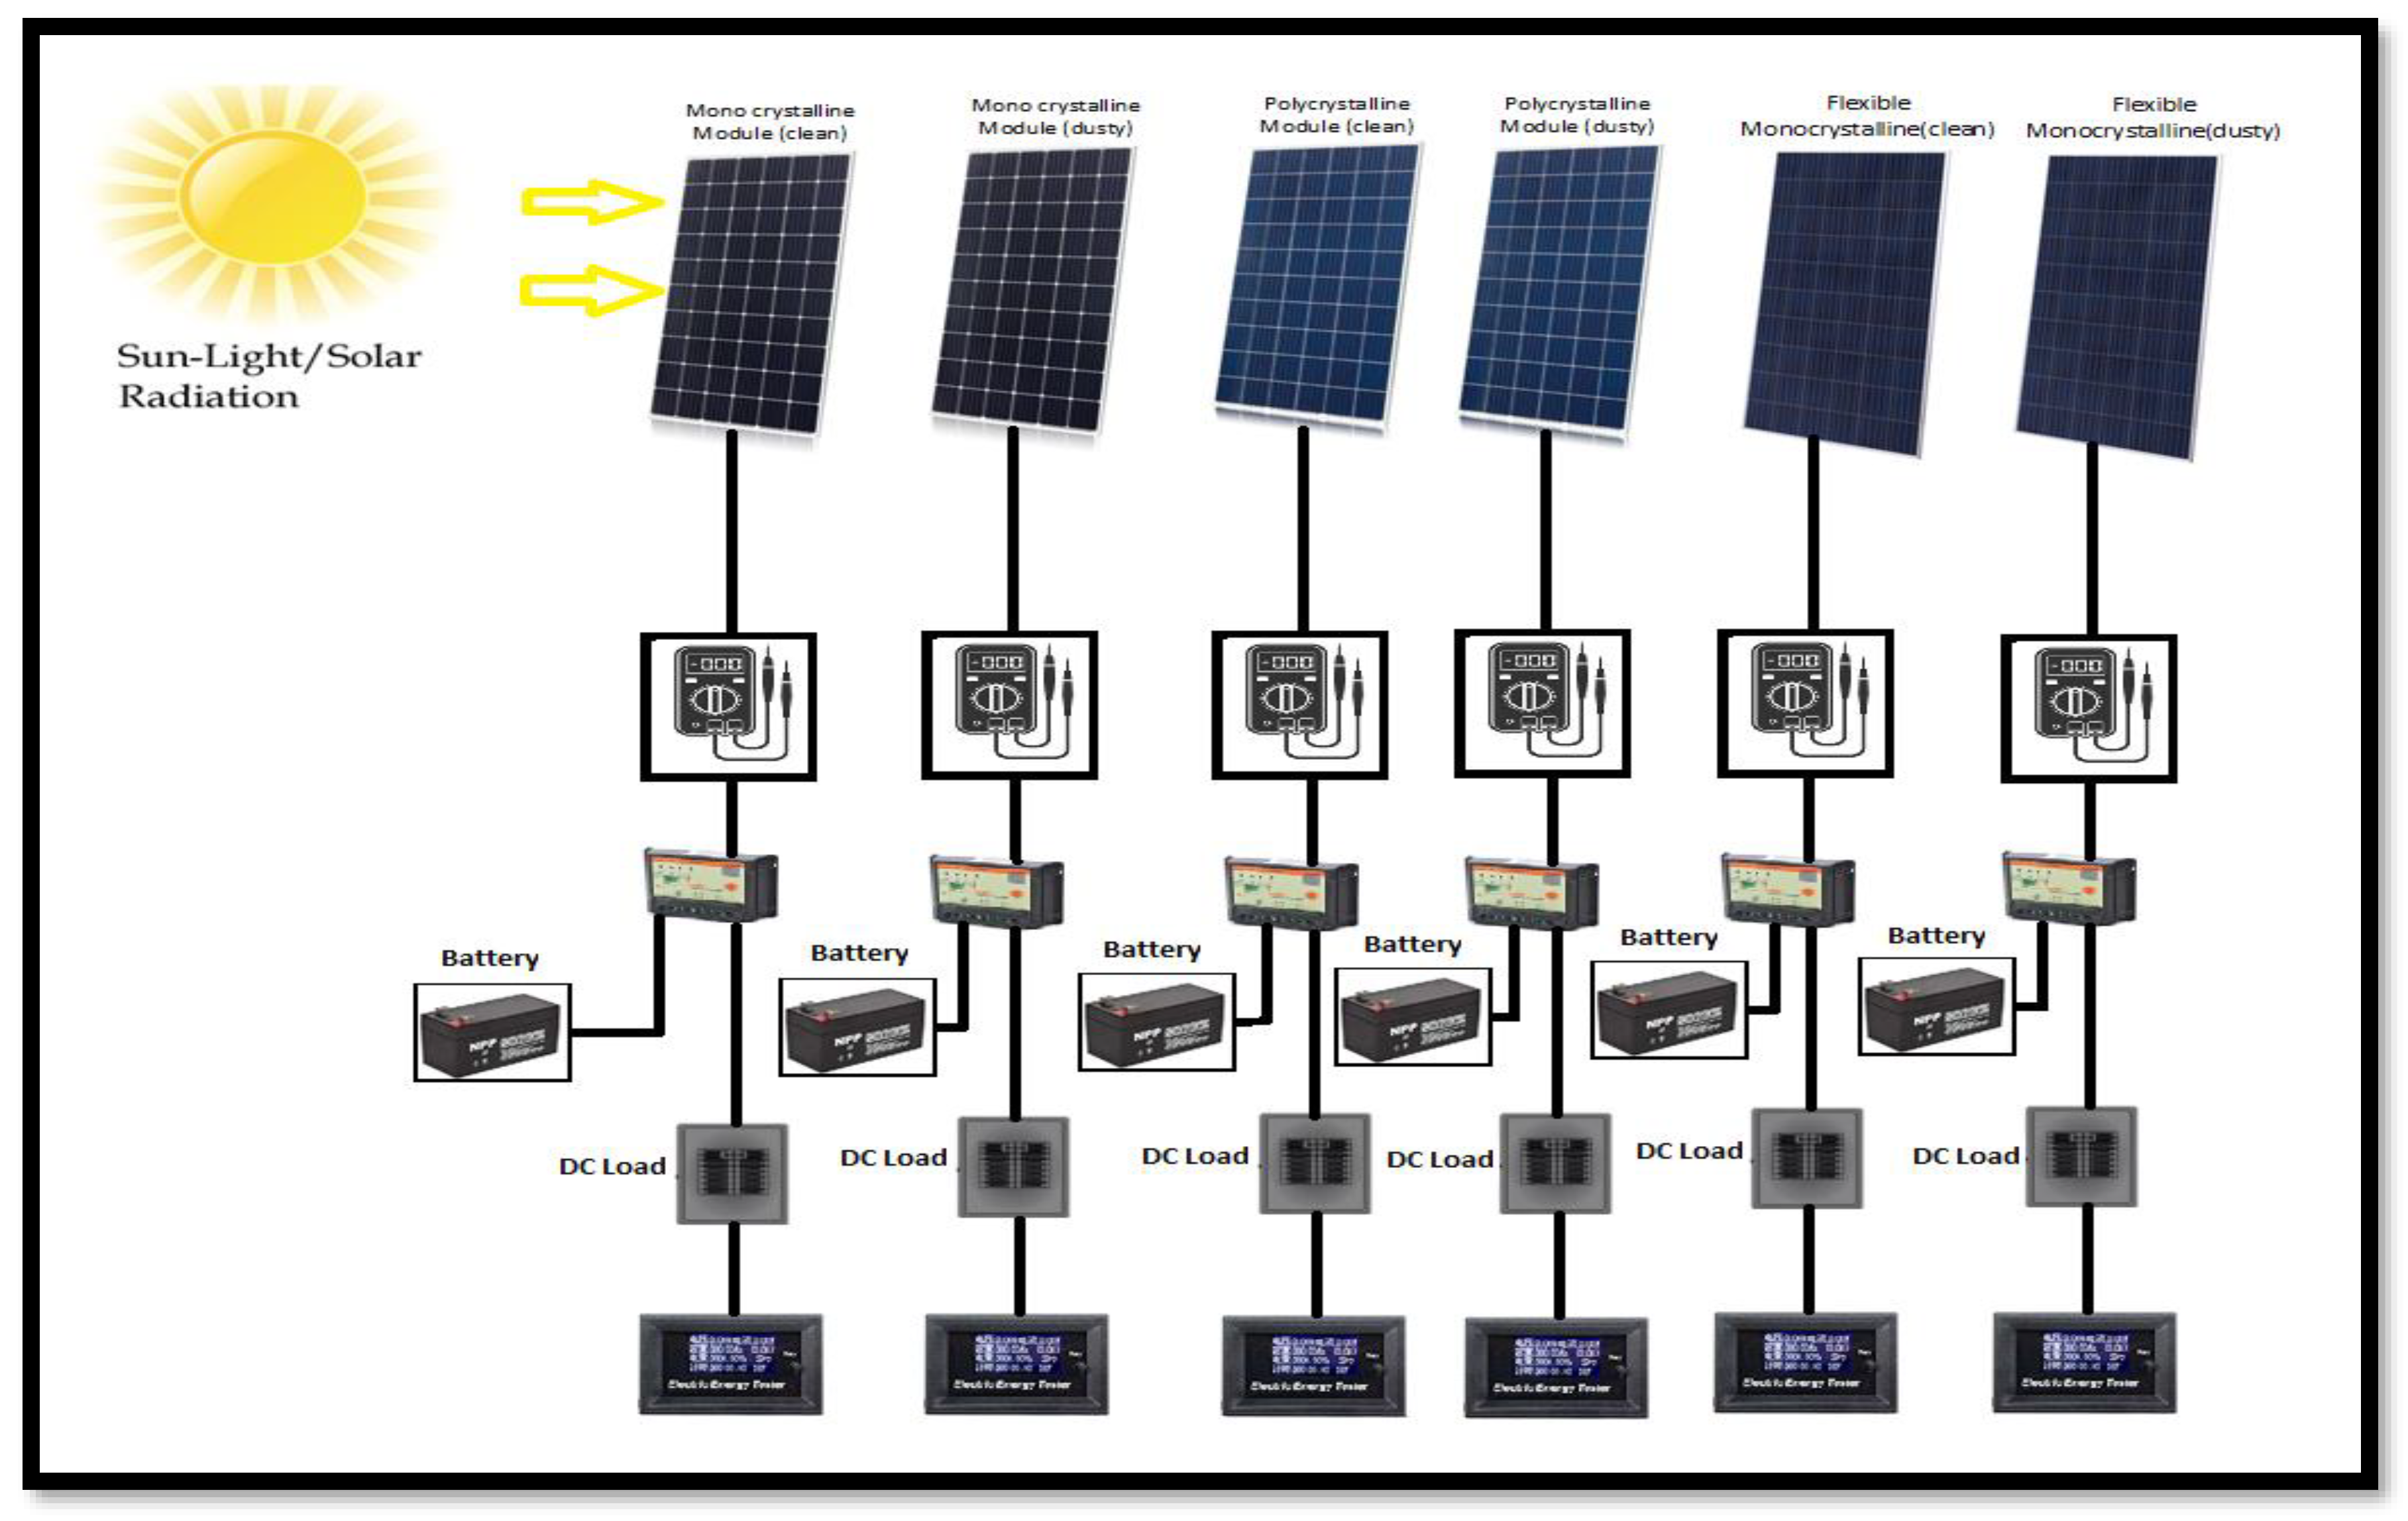
2. Experimental Setup

2.1. Photovoltaic System Description

Despite the power of solar radiation suitable for use in photovoltaic cells in the Arab Gulf region, specifically the Sultanate of Oman, there are many influences from weather conditions that affect solar cells’ performance. Oman is one of the most solar-density countries in the world. From this standpoint comes the role of Oman to provide sufficient electrical production from solar energy to contribute to meeting local electricity needs. Climatically, Oman is characterized by the diversity of the climate and its negative factors that affect the productivity of solar energy, such as dust, humidity, and high temperatures. Oman is divided into desert regions with a high solar density and coastal areas (the southern part of Oman) characterized by a low solar density [20]. Hence, it was necessary to present a study that analyzes the effect of (dust, humidity, radiation strength, and temperature) and the extent of sensitivity that affects solar cells’ efficiency over time. A stand-alone photovoltaic system containing six solar modules, each with a capacity of 100 W and a total power of 0.6 kW, as shown in Figure 1a, is installed at the Faculty of Engineering at Sohar University. One PV module is cleaned manually with water early morning every day, and one remains dusty, as shown in Figure 1b. In Figure 2, a block diagram indicates that the system used three solar modules (Mono-crystalline, Polycrystalline, and Fixable Mono-crystalline) connected to the controller charger with six separate batteries and load resistance (50 Ω) for each module. This system measures current, voltage, power, solar cell temperature, and resistance.
In order to study the effect of dust accumulation on PV modules, one type of pair module used in this system is cleaned daily. Figure 3 illustrates a schematic of the installed stand-alone photovoltaic systems.
Table 2 illustrates the photovoltaic modules specifications.

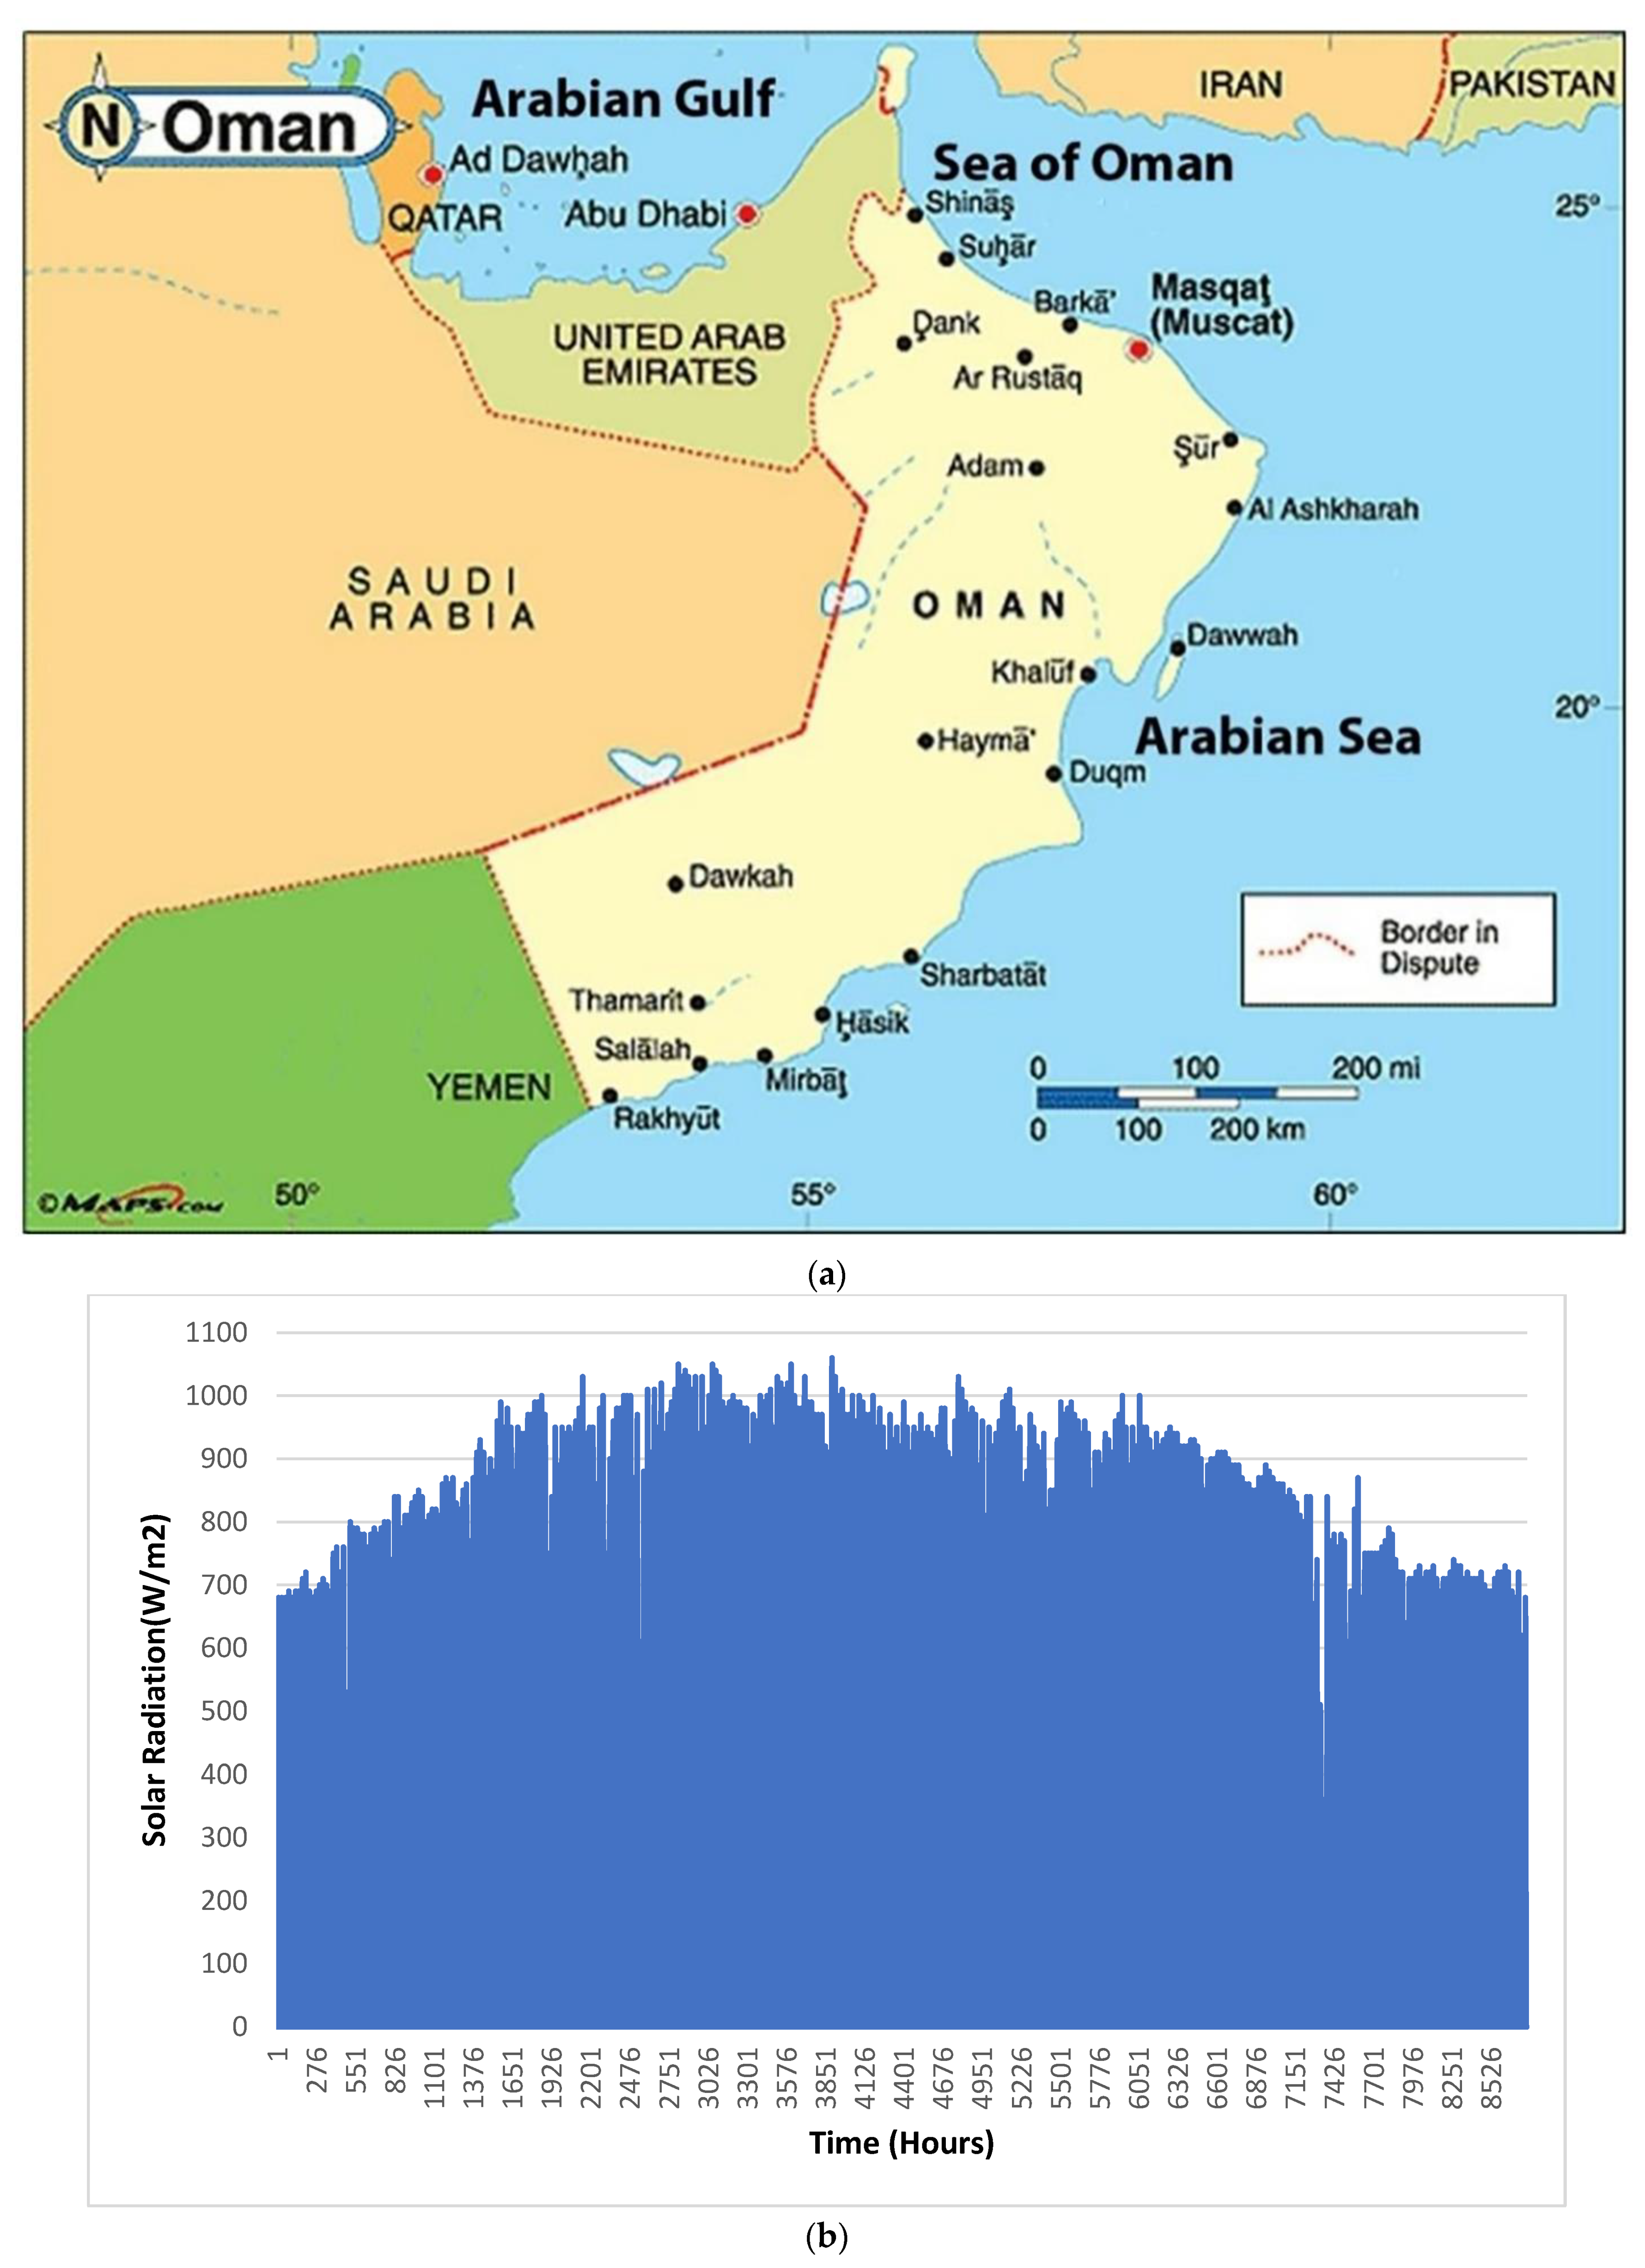
2.2. Sohar Metrological Data

Solar energy is one of the main renewable energy sources for ease of use nowadays. Many photovoltaic cells that implement solar energy methods are implemented as a result of the rapid development of the world and society. The primary source in Oman is natural gas and oil (fossil fuels) used to produce electricity, which are non-renewable energy sources and a source of air pollution.
Oman is in the solar belt between latitudes 16°40′ N and 26°20′ N and longitudes 51°50′ E and 59°40′ E, and climatic conditions are desert to the north of the Sultanate. The subtropical conditions in the south indicated that the average solar radiation in this country is 5.197 kW/m2/day [21]. The duration of the irradiance ranges between 8.0 and 10.5 h per day. Figure 4a shows the map of the Sultanate of Oman, and Figure 4b shows the hourly variation in solar radiation intensity for Sohar city.

2.3. Performance Evaluation Criteria

Several standard performance evaluation metrics were proposed to evaluate the accuracy of simulated results, such as Mean Squared Error (MSE), Mean Square Error (RMSE), and Mean Absolute Error (MAE). Coefficient of Determination (R2) and Root Mean Absolute Percentage Error (MAPE) [22]. The MSE determines the average squared difference between the estimated results and the actual data, and MAE computes the average deviation of predicted results from observed data. The RMSE measures the square root of the average of the square’s errors. Table 3 presents some standard performance evaluation metrics.

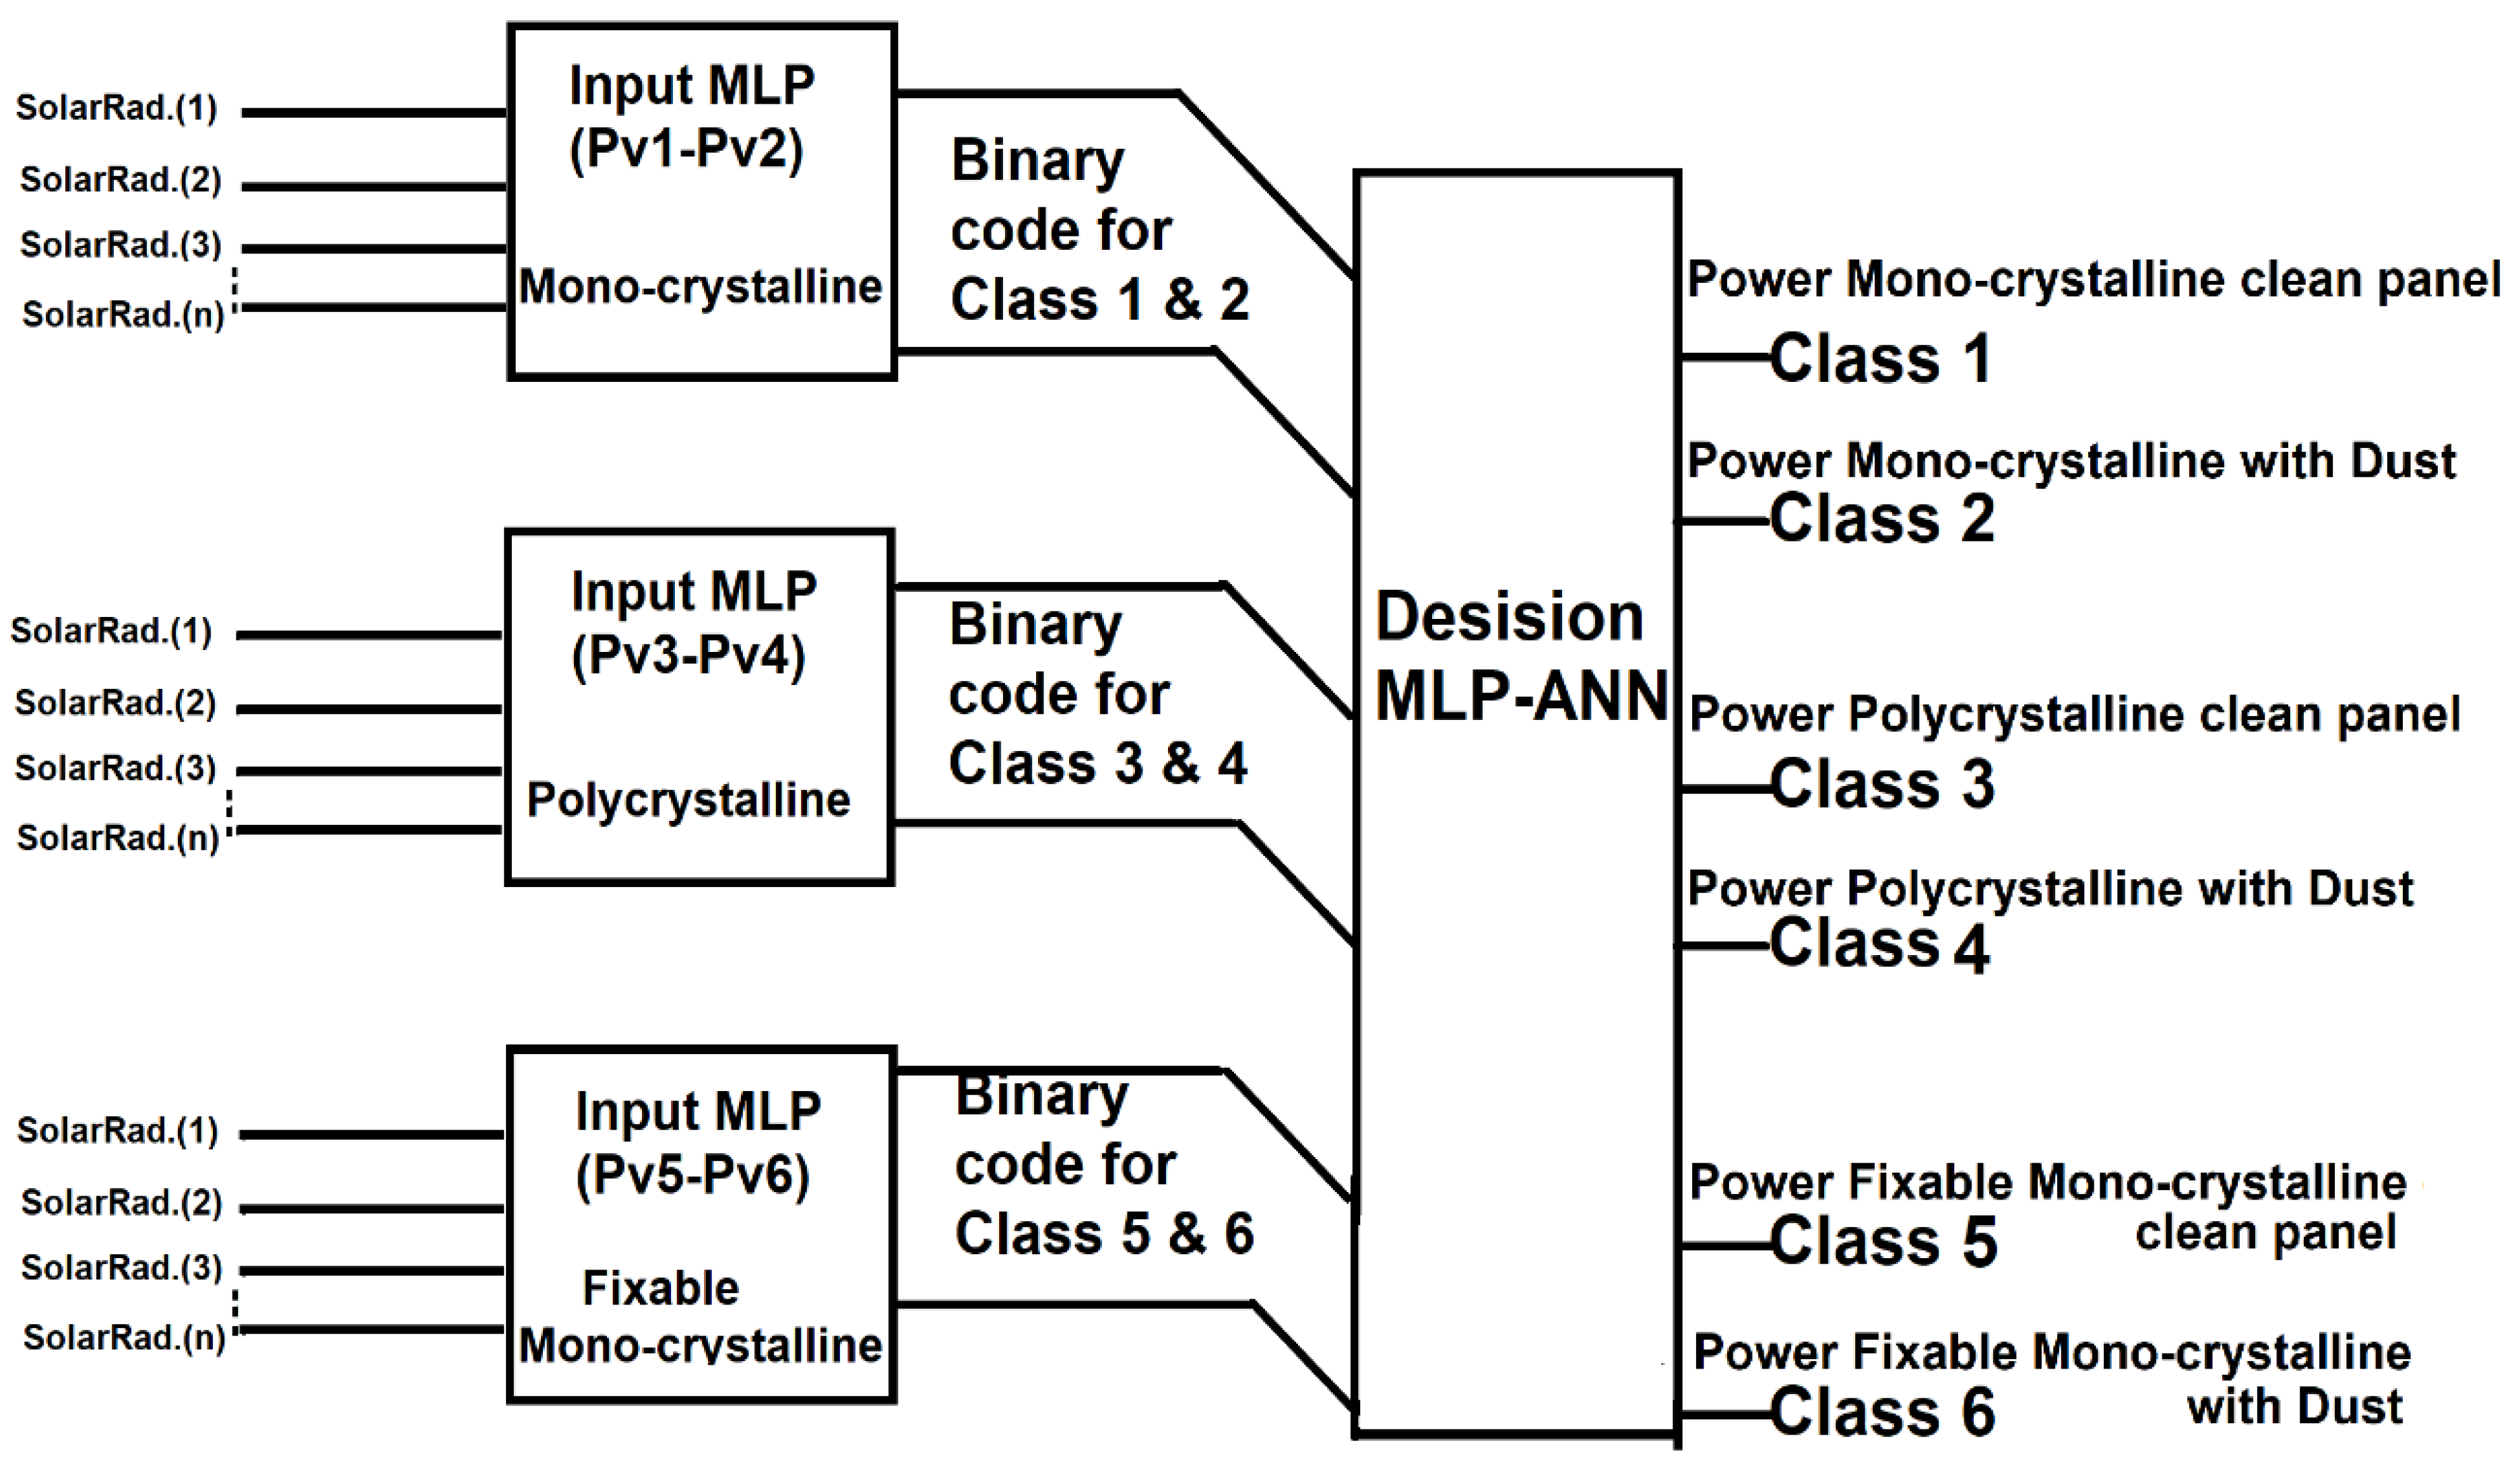
2.4. ANN Approach and Design

The artificial neural network (ANN) simulates linear or nonlinear associations and reduces the dimensionality of complex data relationships. ANN emulates and mimics the biological brain functions as a mathematical module [23]. The ANN has unique characteristics, such as learning from experience and generalization of the outcomes. It provides parallelism and recurrent computing, making it proper for data classification and recognition applications, approximating and predicting unseen data, etc. Numerous ANN architectures were designed and created to simulate and predicate the behavior of renewable power production systems [24].
To set up the dimensions of solar power applications, it is necessary to predict and examine solar irradiance and power accurately. As a result, finding robust mathematical solutions is critical for effectively controlling and managing the electrical grid. ANN can provide manageable and accurate prediction models [25]. It can train with a small number of datasets and control uncertainty in resource computation, which improves the performance of forecasting models. Furthermore, using hidden layers and a recurrent approach improves the results and better fits the actual data. In addition, the ANN performs a robust sensitivity analysis of input variables to determine the best selection of variables that improve model performance. A modular neural network comprises several neural network models connected by an intermediary. Modular neural networks enable more complex management and manipulation of simpler neural network systems [26]. In this case, the multiple neural networks function as modules, each solving a portion of the problem. An integrator is in charge of splitting the problem into sub-modules and combining the output from those modules to create the system’s outcome. The “divide and conquer” principle divides significant issues into smaller, more manageable chunks [27].
A modular neural network is defined as in Equation (1).
Net = (n, j, m, h, p, I, D)
where the number of inputs is n, and the number of modules is m. The number of classes is j, and the type of the intermediate connection is h. p is the permutation function, the input layer module is I, and D is the decision module. The proposed module is based on a modular neural network that consists of one input (Solar Rad.) and one output (Power), as shown in Figure 5.
The training dataset is TS, which can be defined as in Equation (2)
TS = ( x 1 j ,   x 2 j , , x n j ; d j ) , where   x i j IR
the class number dj, j in [1,..,t], t is epoch training number.
The mapping (Φ) function of input layer is defined as in Equation (3).
Φ : R n m   R n log 2 k
The response r of each vector j of input layer is defined as in Equation (4).
r j = Φ ( x 1 j ,   x 2 j , , x n j ) , w h e r e   x i j I R
The training set for the decision network is defined as in Equation (5).
T S d = { ( r j ; d B I T j ) |   j = 1 , , t } ,   where   d B I T j   is   the   output   class   of   dj
Therefore, the training for the decision network will be redefined as in Equation (6).
T S d = { ( Φ ( x 1 j ,   x 2 j , , x n j ) ; d B I T j ) |   j = 1 , . . , t }

3. Results and Discussion

Different computation formulas measure the energy generated from other solar cells, as shown in Table 4 [28,29]. This study deployed many computation formulas in practical experiments and predictive calculations to measure electrical energy production. It is presented in the following.
  • Energy production (E) and yields (SY), life cycle costs (LCC), and Cost of energy (CoE).
  • Performance ratio (R), Efficiencies (η), losses (Ploss), and recovery period (PBP).
  • Present worth (MC), the replacement cost percentage (RC), and capacity factor (CF).

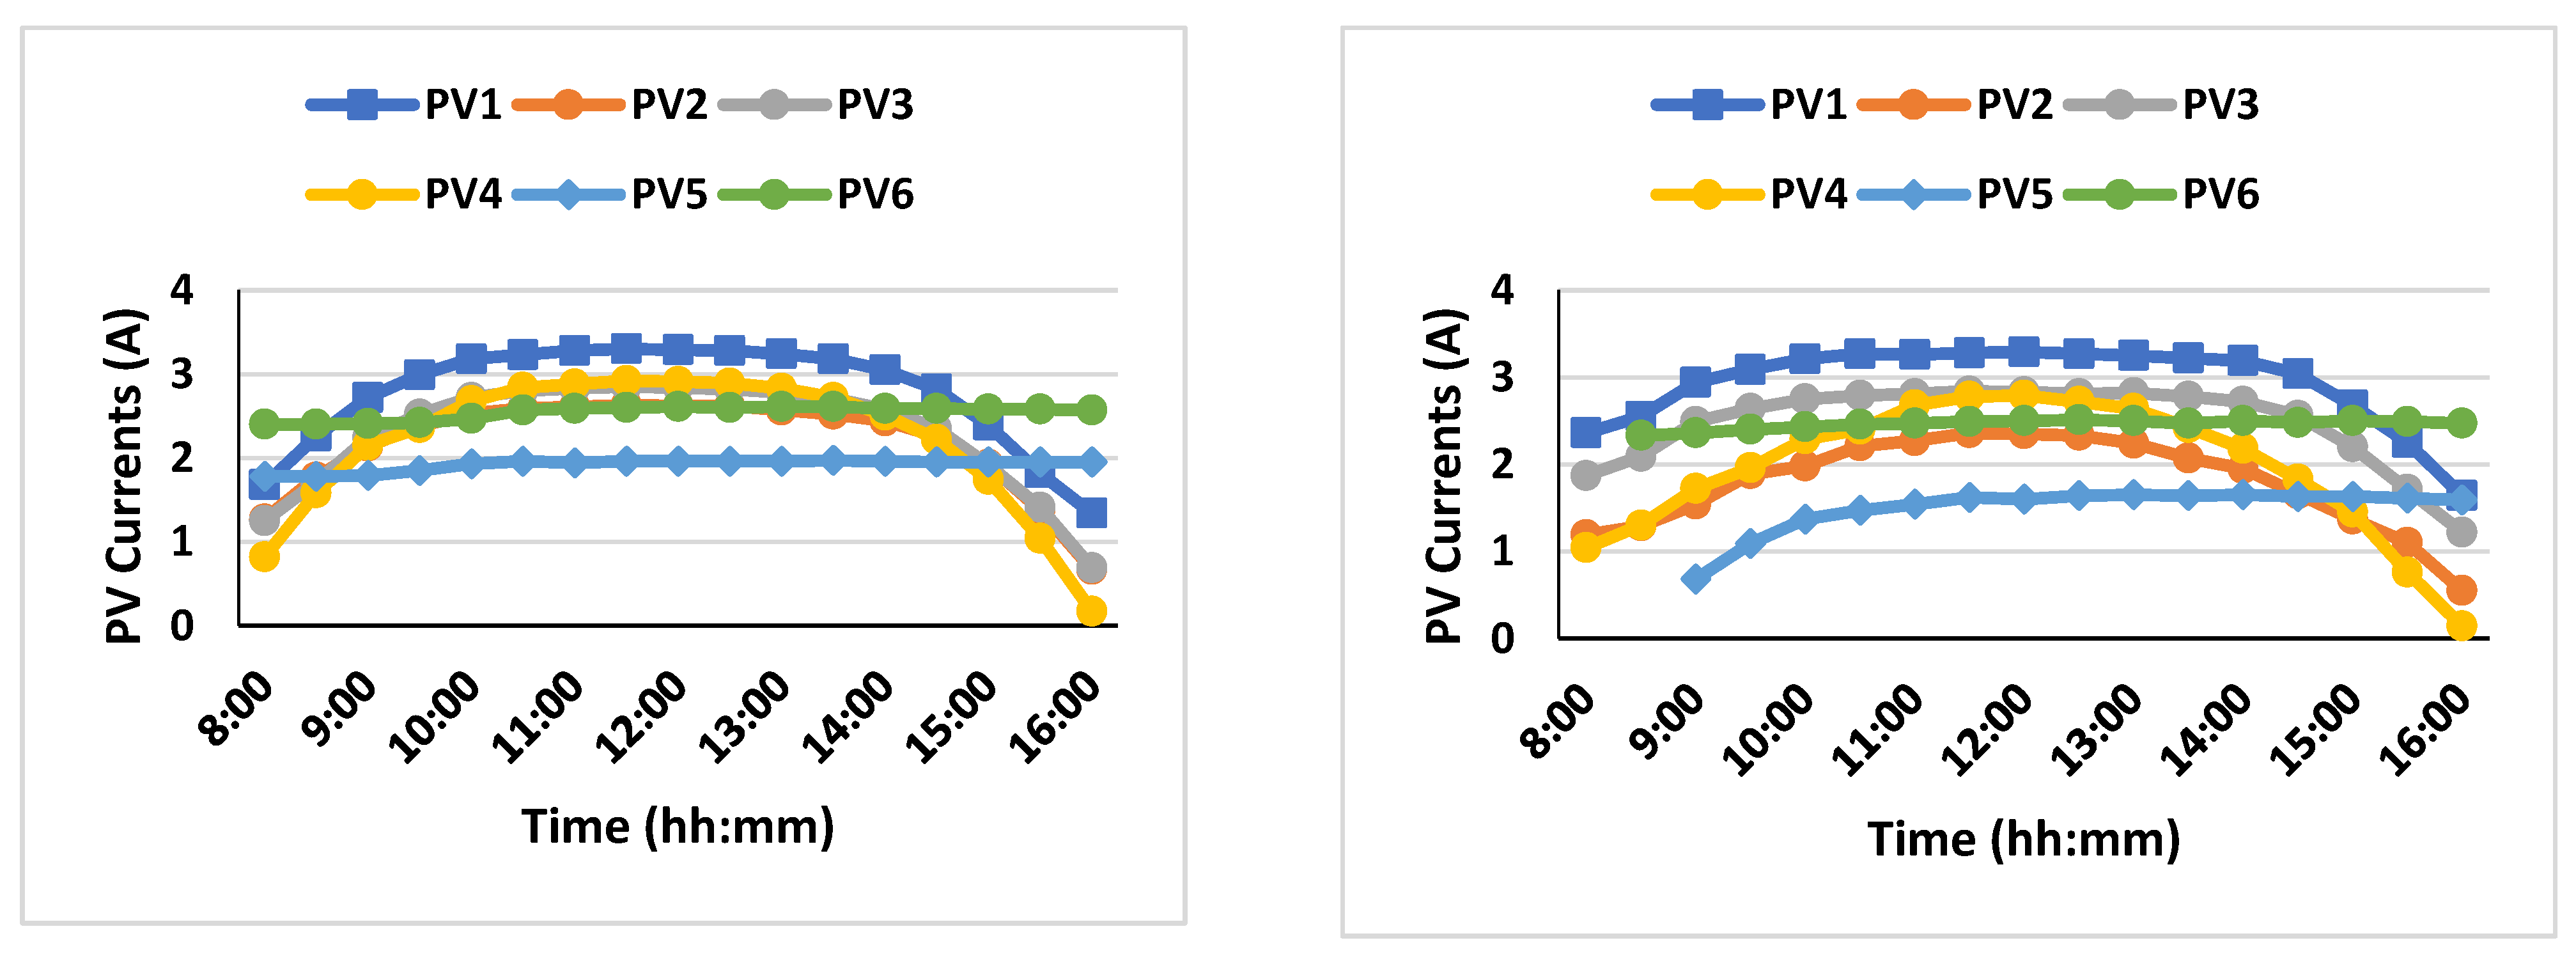
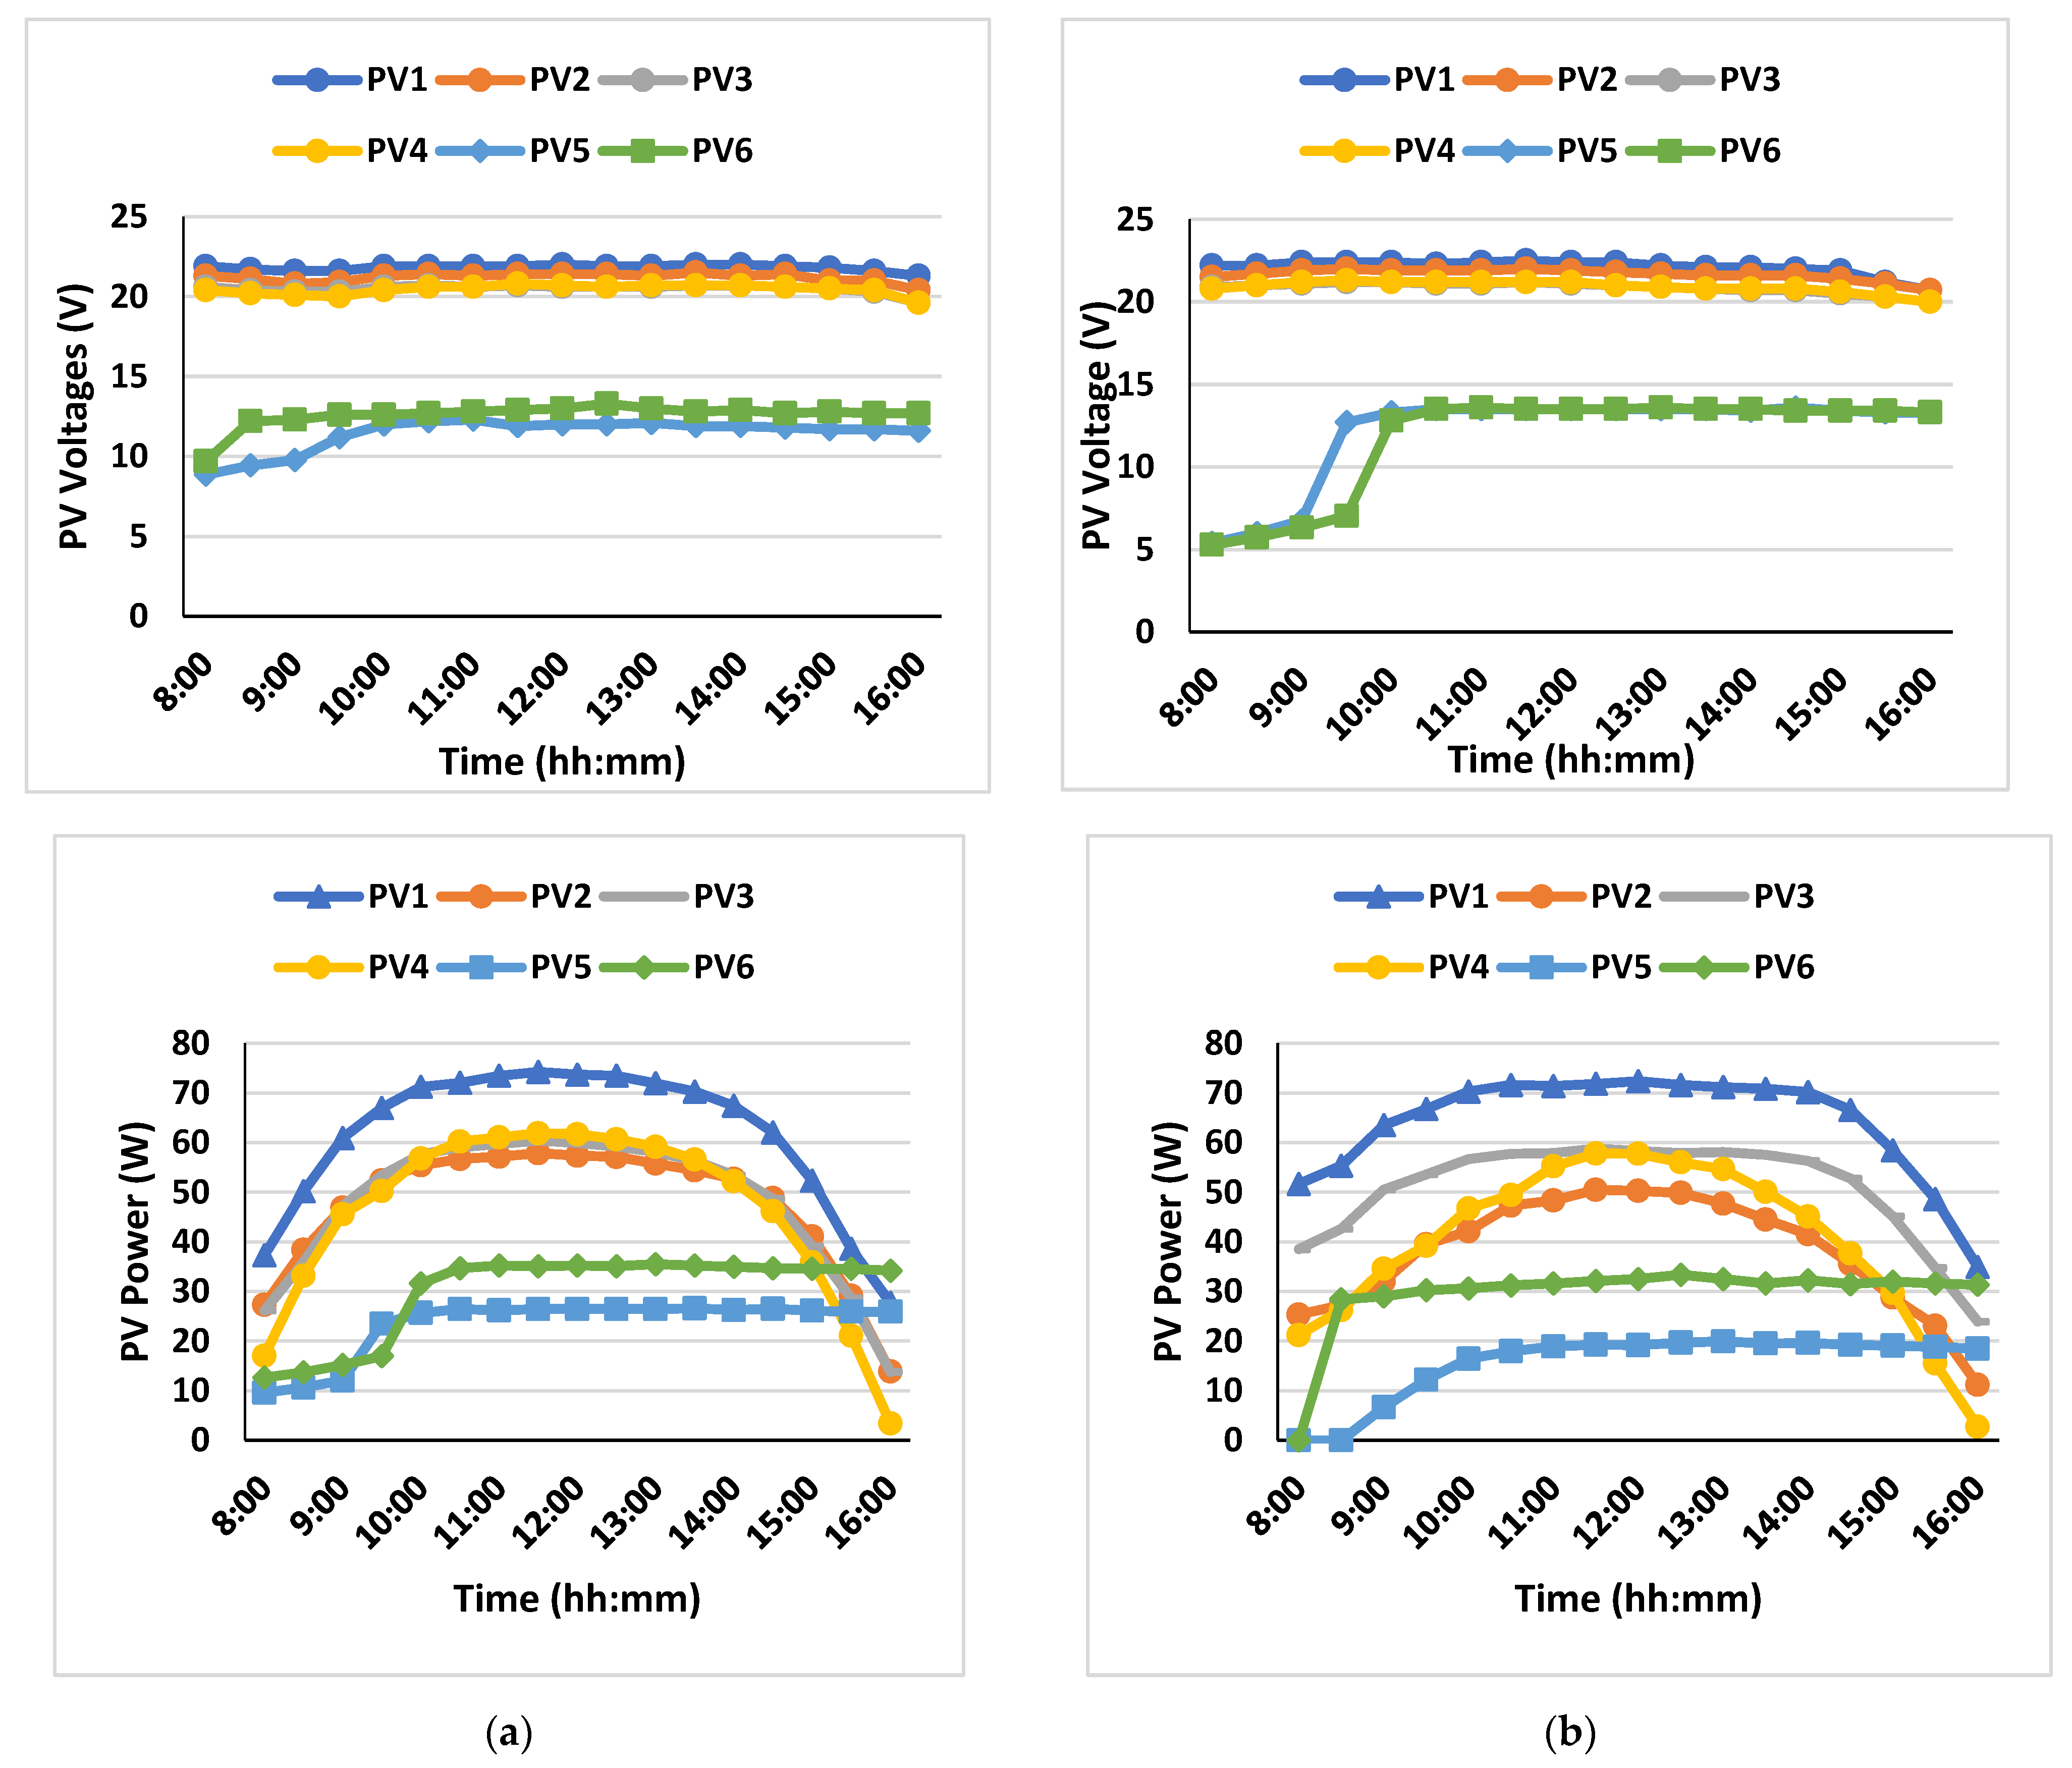
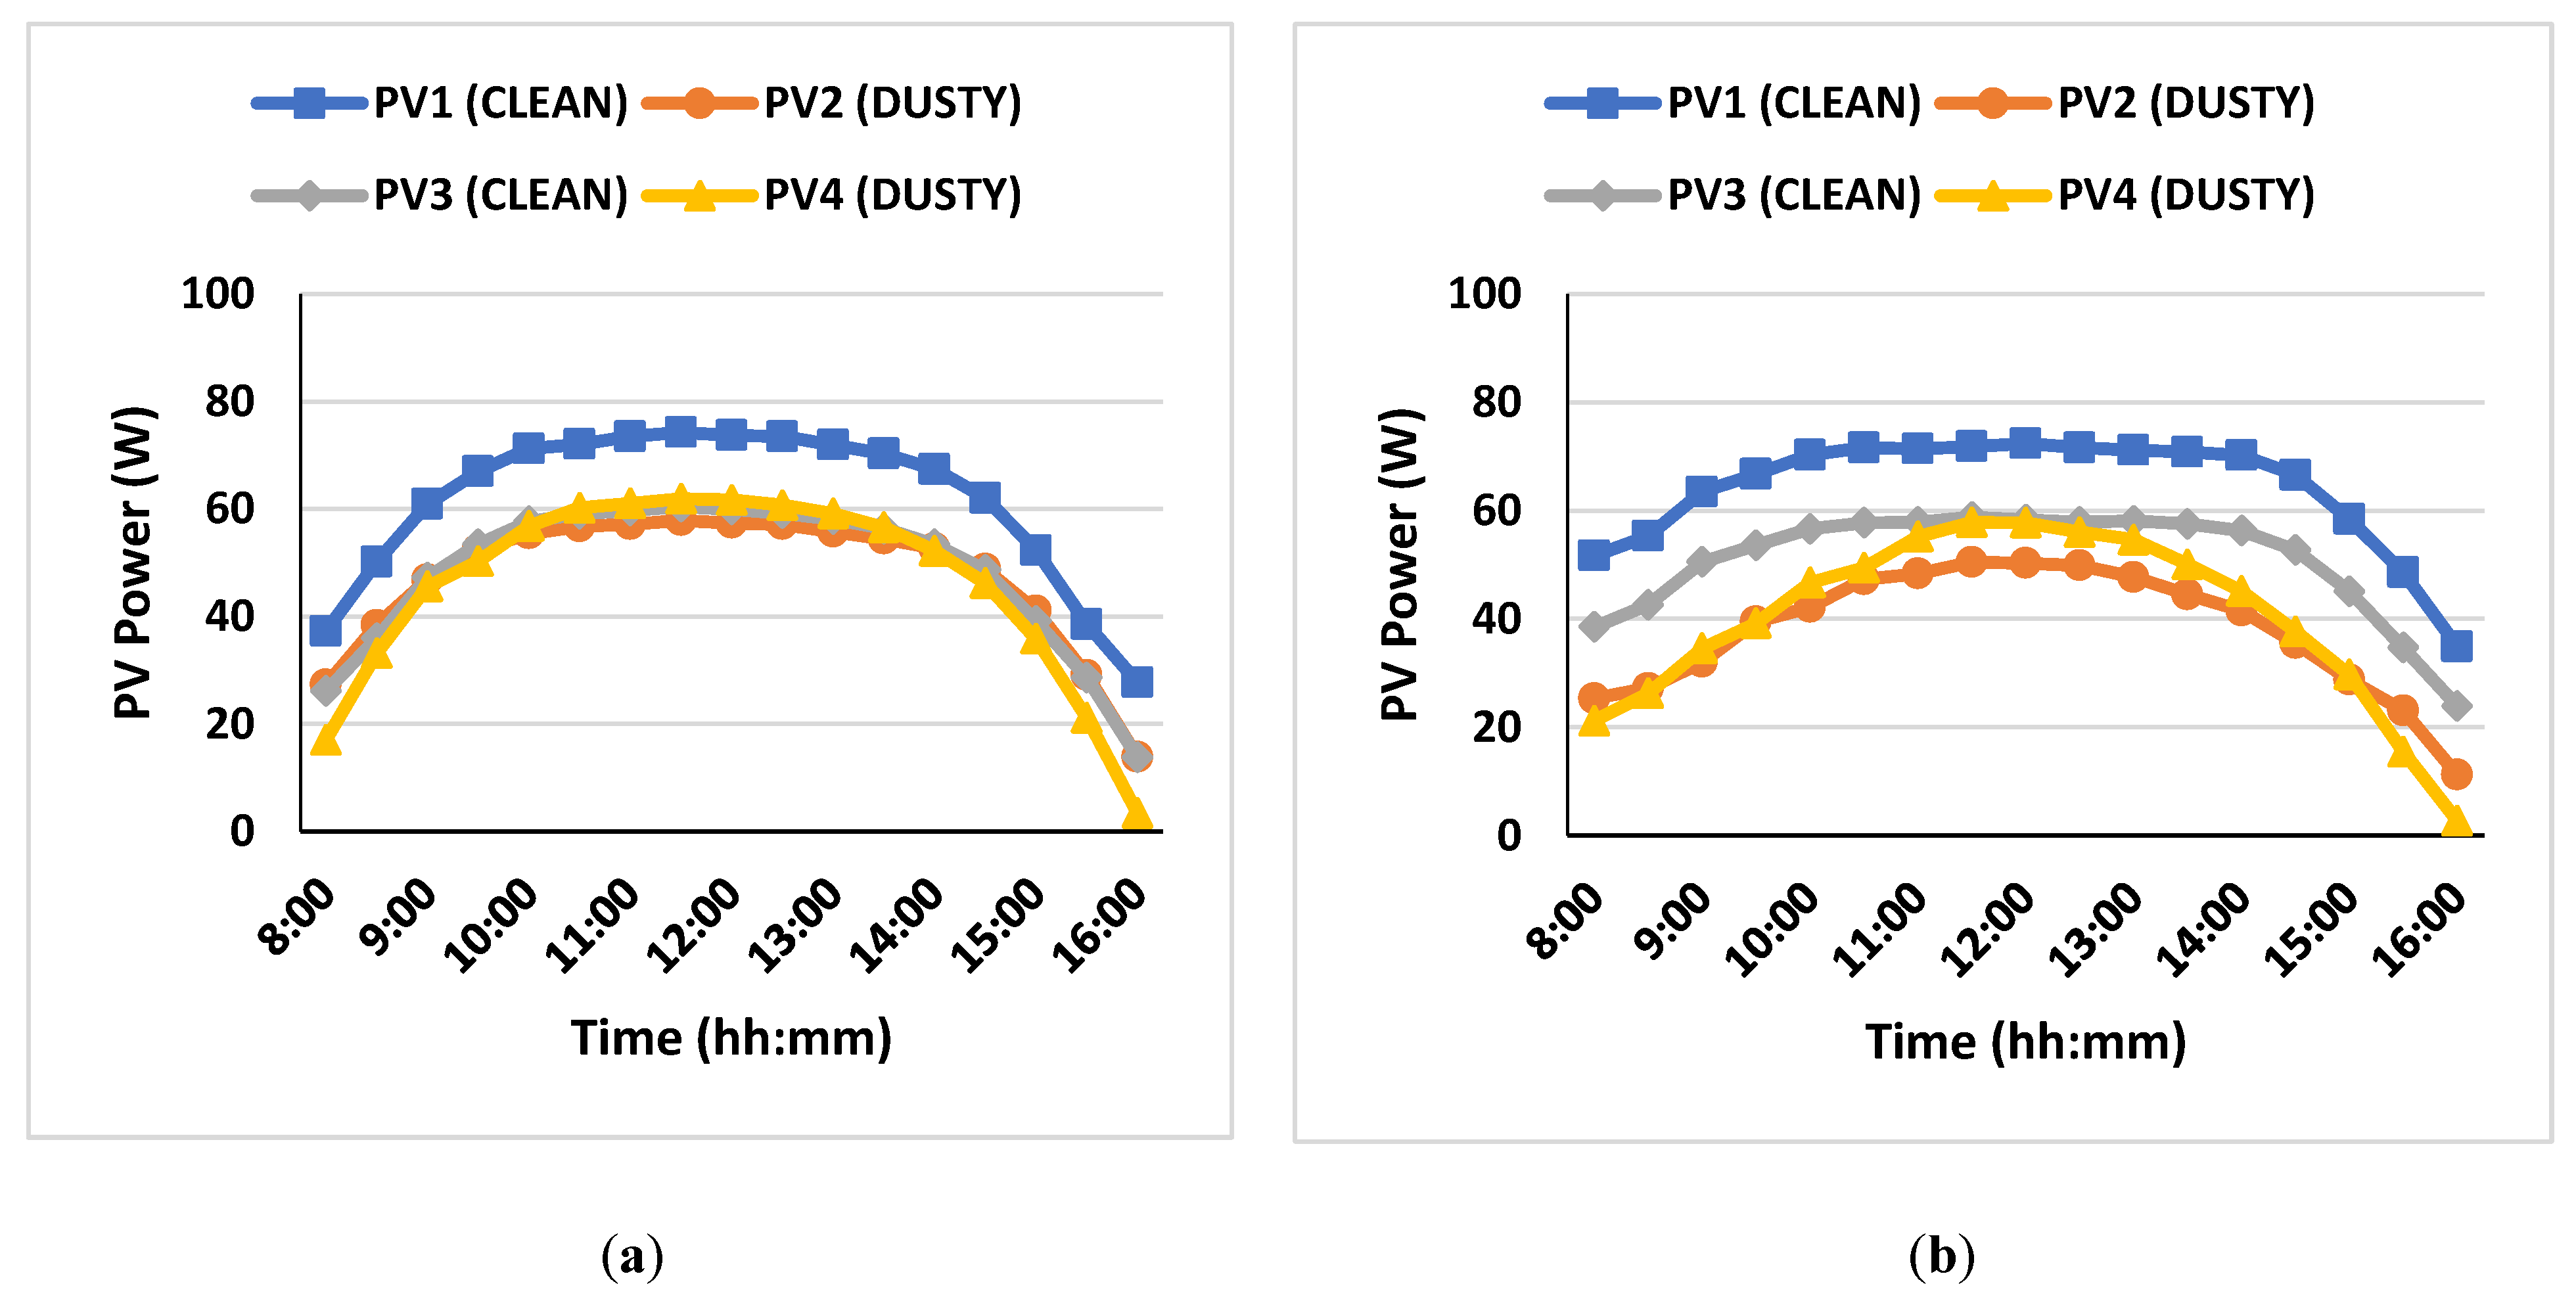
3.1. Experimental Results

The six PV modules were tested for 35 days in this study, including monocrystalline (PV1: clean, and PV2: dusty), polycrystalline (PV3: clean, and PV4: dusty), and flexible monocrystalline (PV5: dusty, and PV6: clean). The three technologies of PV modules have been compared, as shown in Figure 5 for dusty and clean in terms of current, voltage, and power, respectively. By comparing the results of Figure 6a,b, the following points have been observed:
  • Clean monocrystalline (PV1) always have the highest current, voltage, and power, while flexible module (PV5) has the lowest parameters. However, the polycrystalline current is higher than the flexible module and lower than the monocrystalline module;
  • In the middle of the day, the current drop due to the dust increased from 24.24% to 28.57%, for the first and 35th days, respectively. The voltage drops are insignificant on the first day of the experiment for the three technologies. However, the flexible PV module showed the highest drop on the last day of the experiment, which could be due to the small PV size compared to the other two technologies;
  • The power degradation for the three technologies is 30.24%, 28.94%, and 36.21%, for monocrystalline, polycrystalline, and flexible PV modules, respectively. In general, the monocrystalline is more affected by dust accumulation.
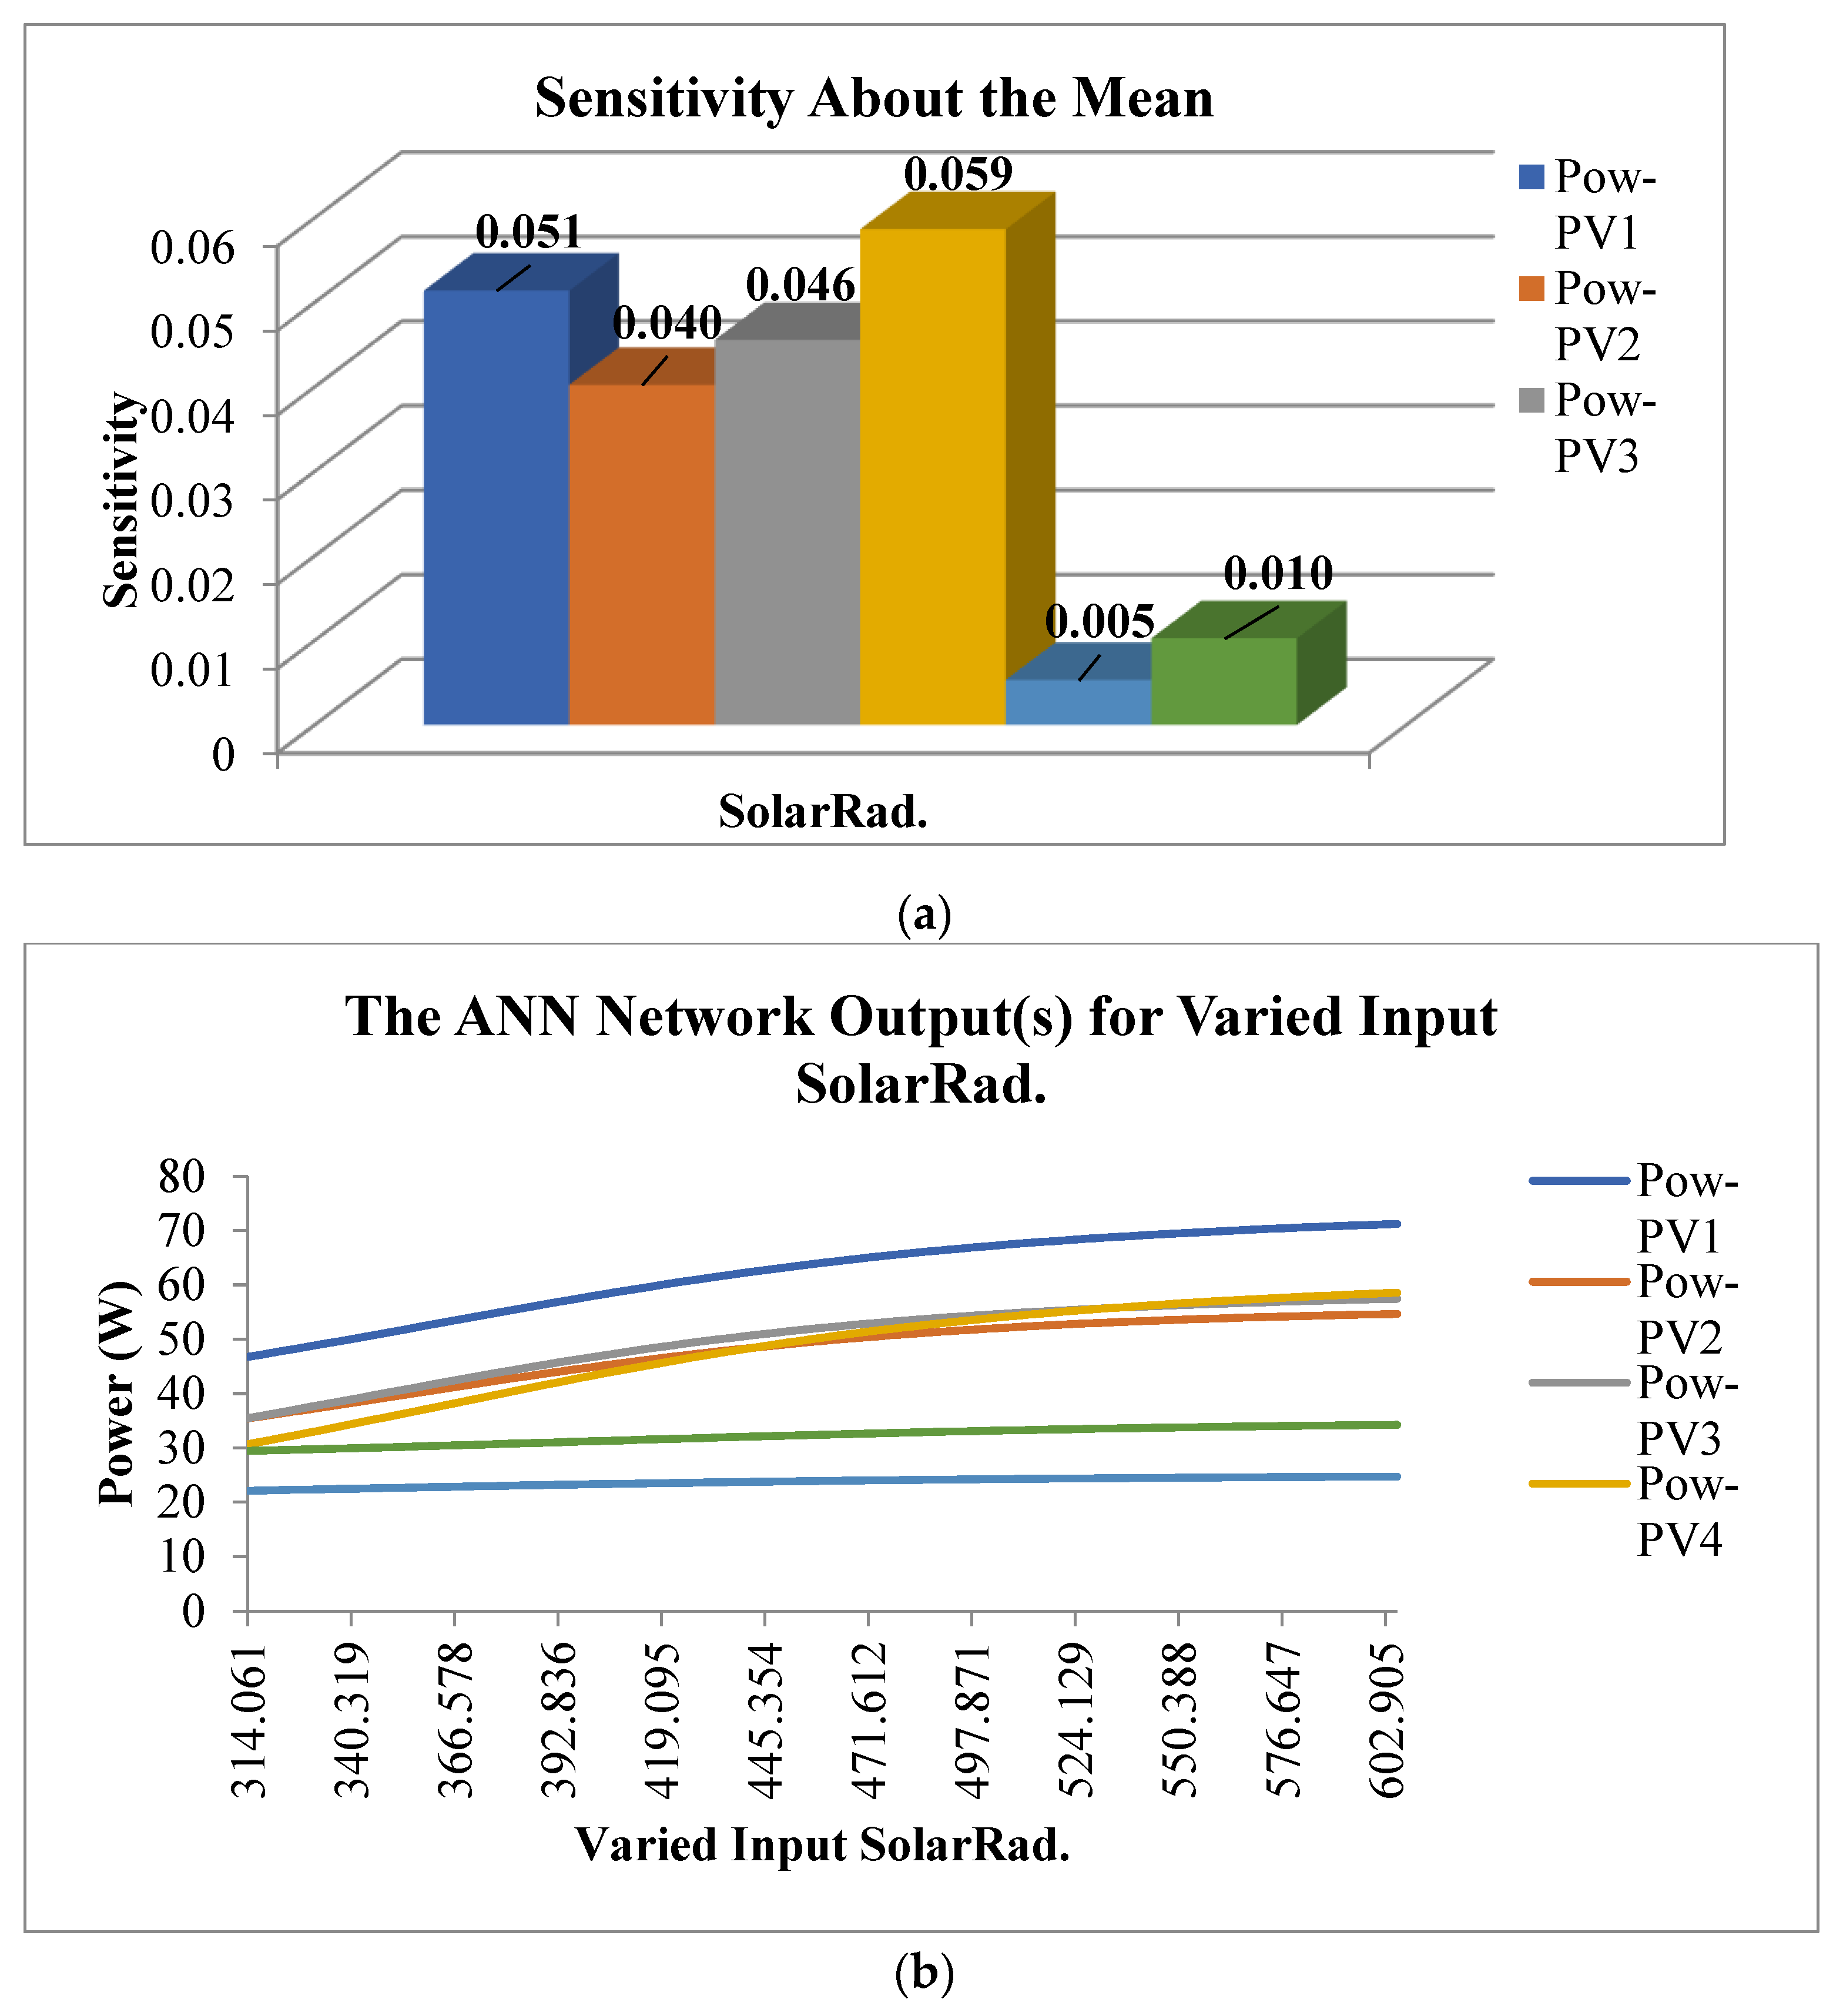
Figure 6. Comparison of electrical performance for (a) first day, and (b) after 35 days of the experiment.
Energies 15 04138 g006aEnergies 15 04138 g006b
There are many types of cleaning methods to clean PV modules from dust accumulation [30]. The study used water and a sponge (regular cleaning material) to clean the surfaces manually.
The dust degradation was compared on the first day and after three weeks for monocrystalline (mono) and polycrystalline (poly) PV modules, as shown in Figure 7. The mono PV power was reduced on the first day and 21st day from 74.25 W to 57.68 W and from 73.28 W to 50.29 W, respectively. The poly PV power was reduced on the first day and 21st day from 61.94 W to 60.75 W, and from 57.82 W to 56.32 W, respectively. However, the degradation is higher at the beginning and end of the day compared to the middle of the day.
Figure 8 illustrates the effect of solar cell temperature considering dust on PV modules. It is observed that the clean solar cell temperature is higher compared to the dusty one. However, cell temperatures are close for clean and dusty PV early on the day and end. In the middle of the day, the temperature difference increases obviously. The dust reduces the temperature and solar irradiance penetration of the PV module.

3.2. ANN Results

The proposed predicting mathematical module is based on a modular neural network that consists of one input (Solar Rad.) and one output (Power), using 600 datasets, as shown in Figure 5. The modular neural network classifies the tested six PV modules into three categories. The first-class is for the module using monocrystalline (PV1: clean, and PV2: dusty). The second class is PV based on polycrystalline (PV3: clean, and PV4: dusty), and the third is the PV module that uses flexible monocrystalline (PV5: dusty, and PV6: clean). The datasets were separated into three classes (60% for training the ANN module, 20% for the cross-validation process, and 20% for testing the results of the proposed module). Several epochs and hidden layers were deployed to choose the ideal number that achieved the highest performance. The experiments tested (100, 500, 1000) epochs, showing that the 1000-epochs are ideal. Furthermore, a different number of hidden layers were implemented and tested, and then the one hidden layer was fixed. The ANN implemented an activation function of TanhAxon and a momentum learning method with α = 0.7. Table 5 presents the descriptive statistics quantitative data of the experimental datasets. It indicates that the number of observations is 600 pairs (solar irradiance, power), and there are no missing values. The power of six photovoltaic panels was recorded, which indicates that the maximum power rate is 77.634 (PV1), and the minimum is 2.222 (PV4). The mean value indicated that the PV1 has the highest value 60.759 and PV5 has the minimum value (23.786).
The best network specifications indicate that the deployed number of epochs is 1000, the MSE value for the training of data is 0.0232, and the cross-validation is 0.0244. Table 6 depicts the comparison results using different performance indicators, including MSE, NMSE, MAE, Min Abs Error, and r. There are numerous methods for determining a model’s accuracy. The Mean Absolute Error (MAE) is used for evaluating the quality of the ANN machine learning model. It is the average of all absolute errors, indicating the differences between the actual and predicted values. The results show that the accuracy of power predicting of the six PV modules has a considerable accuracy of 97.5%, 97.4%, 97.6%, 96.7%, 96.5%, and 95.5%, respectively. The dust is negatively impacting the performance of the panel’s power production. The power production is reduced by about 1% in PV panels four and six. Furthermore, it was evident from the results that the negative effect of the dust on the PV panel production was based on the values of RMSE, which measures the square root of the average of the square’s errors. The average errors in predicting the power production of the six PV modules are 0.36406, 0.38912, 0.34964, 0.49769, 0.46486, and 0.68238. The adjusted r-square calculates the percentage of variation, and can be only explained by the independent variables that affect the dependent variable.
The comparison of the prediction of power production for the six PV panels with the actual power production is shown in Figure 9. The proposed modular neural network model accurately forecasts the actual power values with small error rates. However, some production points have more errors than others as a result of the random choice of tested datasets and the batch method’s use in updating the weights’ values through epochs.
Some of the variables were initialized with random values, such as weights and biases, in the ANN testing process. This usually shows some of the production points with high errors in the first 100 epochs of the testing process and is stabilized in the final epochs.
Sensitivity Analysis (SA) is a process to measure the impact of uncertainties in one or more input variables that can lead to uncertainties in the output variables [31]. This analysis improves the model’s prediction by studying how the model responds to changes in input variables and analyzing interactions between variables. Figure 10a depicts the SA of the proposed ANN model, demonstrating that the input variable (solar radiation) is less sensitive to changes in the power values of PV panels five and six (flexible monocrystalline). Additionally, Figure 10b shows the effects of varied input solar radiation on power production, which illustrates that the high-power production is PV panel one, and the lowest is PV 5 and 6.
To compare the results accurately, all experiments must be subjected to the same climatic conditions and other factors used in the experiment. However, this does not prevent us from finding a common factor for comparison, for example, the hot climate or the same type of solar panels, and other factors. Table 7 compares the proposed systems with some of the systems known in the literature survey. The power reduction is increased when the average dust accumulation is high. The dust concentration affected the cell panels more, which required weekly cleaning.

4. Conclusions

This paper experimented with three PV technologies and evaluated them using an artificial neural networks module. It employed six PV modules for the three technologies (mono, poly, and flexible monocrystalline), for clean and dusty PV panels at Sohar city. This case study proved that the monocrystalline is more affected by dust accumulation than other technologies. Furthermore, we found a 30.24%, 28.94%, and 36.21% degradation in power production for monocrystalline, polycrystalline, and flexible PV modules, respectively.
On the other hand, the ANN module is designed and implemented to evaluate the accuracy of power production in different technologies’ PV panels using clean and dusty cells. The results show that the accuracy of predicting power of the six PV modules has a considerable accuracy of 97.5%, 97.4%, 97.6%, 96.7%, 96.5%, and 95.5%, respectively. The dust negatively impacts the performance of panel power production. The power production is reduced by about 1% in PV panels four and six. Moreover, the results clearly show the negative effect of the dust on the PV panel production is based on the values of RMSE, which measure the average errors in predicting the power production of the six PV modules of 0.364, 0.389, 0.34964, 0.49769, 0.46486, and 0.68238, accordingly.
Future work should focus on evaluating the negative impact of the dust in the long-term period (3-months, 6-months, 9-months), as well as examining the effect of dust type, density, and size on PV panel performance.

Author Contributions

Conceptualization, J.H.Y., H.A.K. and R.A.-B.; Data curation, H.A.K., H.A.-B., K.A. and R.A.-B.; Formal analysis, J.H.Y., H.A.K., H.A.-B., K.A. and R.A.-B.; Investigation, H.A.-B. and K.A.; Methodology, J.H.Y.; Visualization, J.H.Y. and H.A.-B.; Writing—original draft, J.H.Y., H.A.K. and K.A.; Writing—review & editing, J.H.Y. All authors have read and agreed to the published version of the manuscript.

Funding

Ministry of Higher Education, Research and Innovation (MoHERI) of the Sultanate of Oman.

Institutional Review Board Statement

Not applicable.

Informed Consent Statement

Not applicable.

Data Availability Statement

The study did not report any data.

Acknowledgments

The research leading to these results has received Funding from Ministry of Higher Education, Research and Innovation (MoHERI) of the Sultanate of Oman under Block Funding Program. MoHERI block Funding Agreement NO TRC/BFP/SU/01/2018.

Conflicts of Interest

We the authors declare no affiliations with or involvement in any organization or entity with any financial interest (such as honoraria; educational grants; participation in speakers’ bureaus; membership, employment, consultancies, stock ownership, or other equity interest; and expert testimony or patent licensing arrangements), or non-financial interest (such as personal or professional relationships, affiliations, knowledge or beliefs) in the subject matter or materials discussed in this manuscript.

References

  1. Al-Waeli, A.H.; Kazem, H.A.; Yousif, J.H.; Chaichan, M.T.; Sopian, K. Mathematical and neural network modeling for predicting and analyzing of nanofluid-nano PCM photovoltaic thermal systems performance. Renew. Energy 2020, 145, 963–980. [Google Scholar] [CrossRef]
  2. Yousif, J.H.; Kazem, H.A. Prediction and evaluation of photovoltaic-thermal energy systems production using artificial neural network and experimental dataset. Case Stud. Therm. Eng. 2021, 27, 101297. [Google Scholar] [CrossRef]
  3. Yousif, J. Implementation of Big Data Analytics for Simulating, Predicting & Optimizing the Solar Energy Production. Appl. Comput. J. 2021, 1, 133–140. [Google Scholar]
  4. Zhao, W.; Lv, Y.; Zhou, Q.; Yan, W. Investigation on particle deposition criterion and dust accumulation impact on solar PV module performance. Energy 2021, 233, 121240. [Google Scholar] [CrossRef]
  5. Appels, R.; Lefevre, B.; Herteleer, B.; Goverde, H.; Beerten, A.; Paesen, R.; De Medts, K.; Driesen, J.; Poortmans, J. Effect of soiling on photovoltaic modules. Sol. Energy 2013, 96, 283–291. [Google Scholar] [CrossRef]
  6. Rajput, D.S.; Sudhakar, K. Effect of dust on the performance of solar PV panel. Int. J. ChemTech Res. 2013, 5, 1083–1086. [Google Scholar]
  7. Guo, B.; Javed, W.; Figgis, B.W.; Mirza, T. Effect of dust and weather conditions on photovoltaic performance in Doha, Qatar. In Proceedings of the 2015 First Workshop on Smart Grid and Renewable Energy (SGRE), Doha, Qatar, 22–23 March 2015; IEEE: Piscataway, NJ, USA, 2015; pp. 1–6. [Google Scholar]
  8. Klugmann-Radziemska, E. Degradation of electrical performance of a crystalline photovoltaic module due to dust deposition in northern Poland. Renew. Energy 2015, 78, 418–426. [Google Scholar] [CrossRef]
  9. Saidan, M.; Albaali, A.G.; Alasis, E.; Kaldellis, J.K. Experimental study on the effect of dust deposition on solar photovoltaic panels in desert environment. Renew. Energy 2016, 92, 499–505. [Google Scholar] [CrossRef]
  10. Ali, H.M.; Zafar, M.A.; Bashir, M.A.; Nasir, M.A.; Ali, M.; Siddiqui, A.M. Effect of dust deposition on the performance of photovoltaic modules in Taxila, Pakistan. Therm. Sci. 2017, 21, 915–923. [Google Scholar] [CrossRef]
  11. Gholami, A.; Khazaee, I.; Eslami, S.; Zandi, M.; Akrami, E. Experimental investigation of dust deposition effects on photo-voltaic output performance. Sol. Energy 2018, 159, 346–352. [Google Scholar] [CrossRef]
  12. Chen, Y.; Liu, Y.; Tian, Z.; Dong, Y.; Zhou, Y.; Wang, X.; Wang, D. Experimental study on the effect of dust deposition on photovoltaic panels. Energy Procedia 2019, 158, 483–489. [Google Scholar] [CrossRef]
  13. Hachicha, A.A.; Al-Sawafta, I.; Said, Z. Impact of dust on the performance of solar photovoltaic (PV) systems under United Arab Emirates weather conditions. Renew. Energy 2019, 141, 287–297. [Google Scholar] [CrossRef]
  14. Kazem, H.A.; Chaichan, M.T.; Alwaeli, A.H. The impact of dust’s physical properties on photovoltaic modules outcomes. In Renewable Energy and Sustainable Buildings; Springer: Cham, Switzerland, 2020; pp. 495–506. [Google Scholar]
  15. Kazem, H.A.; Chaichan, M.T.; Alwaeli, A.H.; Sopian, K. A novel model and experimental validation of dust impact on grid-connected photovoltaic system performance in Northern Oman. Sol. Energy 2020, 206, 564–578. [Google Scholar] [CrossRef]
  16. Ziółkowski, J.; Oszczypała, M.; Małachowski, J.; Szkutnik-Rogoż, J. Use of artificial neural networks to predict fuel consumption on the basis of technical parameters of vehicles. Energies 2021, 14, 2639. [Google Scholar] [CrossRef]
  17. Leite Coelho da Silva, F.; da Costa, K.; Canas Rodrigues, P.; Salas, R.; López-Gonzales, J.L. Statistical and Artificial Neural Networks Models for Electricity Consumption Forecasting in the Brazilian Industrial Sector. Energies 2022, 15, 588. [Google Scholar] [CrossRef]
  18. Elsheikh, A.H.; Sharshir, S.W.; Abd Elaziz, M.; Kabeel, A.E.; Guilan, W.; Haiou, Z. Modeling of solar energy systems using artificial neural network: A comprehensive review. Sol. Energy 2019, 180, 622–639. [Google Scholar] [CrossRef]
  19. Elsheikh, A.H.; Panchal, H.; Ahmadein, M.; Mosleh, A.O.; Sadasivuni, K.K.; Alsaleh, N.A. Productivity forecasting of solar distiller integrated with evacuated tubes and external condenser using artificial intelligence model and moth-flame optimizer. Case Stud. Therm. Eng. 2021, 28, 101671. [Google Scholar] [CrossRef]
  20. Amoatey, P.; Al-Hinai, A.; Al-Mamun, A.; Baawain, M.S. A review of recent renewable energy status and potentials in Oman. Sustain. Energy Technol. Assess. 2022, 51, 101919. [Google Scholar] [CrossRef]
  21. Kazem, H.A.; Yousif, J.; Chaichan, M.T.; Al-Waeli, A.H. Experimental and deep learning artificial neural network approach for evaluating grid-connected photovoltaic systems. Int. J. Energy Res. 2019, 43, 8572–8591. [Google Scholar] [CrossRef]
  22. Yousif, J.H.; Kazem, H.A.; Alattar, N.N.; Elhassan, I.I. A comparison study based on artificial neural network for assessing PV/T solar energy production. Case Stud. Therm. Eng. 2019, 13, 100407. [Google Scholar] [CrossRef]
  23. Fathi, M.; Parian, J.A. Intelligent MPPT for photovoltaic panels using a novel fuzzy logic and artificial neural networks based on evolutionary algorithms. Energy Rep. 2021, 7, 1338–1348. [Google Scholar] [CrossRef]
  24. Liu, H.; Gao, Q.; Ma, P. Photovoltaic generation power prediction research based on high quality context ontology and gated recurrent neural network. Sustain. Energy Technol. Assess. 2021, 45, 101191. [Google Scholar] [CrossRef]
  25. Moreira, M.O.; Balestrassi, P.P.; Paiva, A.P.; Ribeiro, P.F.; Bonatto, B.D. Design of experiments using artificial neural network ensemble for photovoltaic generation forecasting. Renew. Sustain. Energy Rev. 2021, 135, 110450. [Google Scholar] [CrossRef]
  26. Han, W.; Zheng, C.; Zhang, R.; Guo, J.; Yang, Q.; Shao, J. Modular neural network via exploring category hierarchy. Inf. Sci. 2021, 569, 496–507. [Google Scholar] [CrossRef]
  27. Li, W.; Li, M.; Zhang, J.; Qiao, J. Design of a self-organizing reciprocal modular neural network for nonlinear system modeling. Neurocomputing 2020, 411, 327–339. [Google Scholar] [CrossRef]
  28. Azuatalam, D.; Paridari, K.; Ma, Y.; Förstl, M.; Chapman, A.C.; Verbič, G. Energy management of small-scale PV-battery systems: A systematic review considering practical implementation, computational requirements, quality of input data and battery degradation. Renew. Sustain. Energy Rev. 2019, 112, 555–570. [Google Scholar] [CrossRef] [Green Version]
  29. Kazem, H.A.; Yousif, J.H.; Chaichan, M.T.; Al-Waeli, A.H.; Sopian, K. Long-term power forecasting using FRNN and PCA models for calculating output parameters in solar photovoltaic generation. Heliyon 2022, 8, e08803. [Google Scholar] [CrossRef]
  30. Kazem, H.A.; Chaichan, M.T.; Al-Waeli, A.H.; Sopian, K. A review of dust accumulation and cleaning methods for solar photovoltaic systems. J. Clean. Prod. 2020, 276, 123187. [Google Scholar] [CrossRef]
  31. Ji, L.; Liang, X.; Xie, Y.; Huang, G.; Wang, B. Optimal design and sensitivity analysis of the stand-alone hybrid energy system with PV and biomass-CHP for remote villages. Energy 2021, 225, 120323. [Google Scholar] [CrossRef]
Figure 1. (a) Stand-alone photovoltaic systems installed at the Faculty of Engineering at Sohar university; (b) PV module cleaning.
Energies 15 04138 g001
Figure 2. Block diagram of stand-alone photovoltaic systems.
Energies 15 04138 g002
Figure 3. Schematic of stand-alone photovoltaic systems.
Energies 15 04138 g003
Figure 4. (a) Map of Oman (Source: https://www.cbd.int/doc/world/om/om-nr-05-en.pdf, 25 April 2022); (b) Mean hourly solar radiation for Sohar city collected by the author.
Energies 15 04138 g004
Figure 5. Proposed Modular Neural Network Architecture.
Energies 15 04138 g005
Figure 7. Comparison of clean and dusty PV performance for: (a) first day; and (b) after three weeks of the experiment.
Energies 15 04138 g007
Figure 8. Effect of solar cell temperature considering dust on the PV module.
Energies 15 04138 g008
Figure 9. The comparison of prediction of power production for the six PV panels with the actual power production.
Energies 15 04138 g009
Figure 10. The sensitivity analysis of the input and output variables. (a) the SA of the proposed ANN model; (b) effects of varied input solar radiation on power production.
Energies 15 04138 g010
Table 1. Summary of some published studies in literature.
ReferenceYearCountry% ReductionDays of Experiment (Days)
Appels R et al. [5]2013BelgiumPloss = 3% and 4%365
Rajput et al. [6]2013IndiaPloss = 0.33% and efficiency reduction = 89%365
Guo et al. [7]2015QatarPloss = 0.46%/day/10–20%/month365
Klugmann-Radziemska [8]2015PolandPloss = 0.8%365
Saidan et al. [9]2016IraqPloss = 6.24%/day, 11.8%/week and 18.74%/month30
ALI et al. [10]2017PakistanPloss = 20% and 16% efficiency reduction = 3.55% and 3.01%,90
Gholami et al. [11]2018IranPloss = 21.47%70
Chen et al. [12]2018ChinaPloss = 34%80
Hachicha et al. [13]2019UAEPloos = 12.7%150
Kazem et al. [14]2020OmanPloss = 0.05%365
Table 2. PV module specifications.
Mono-Crystalline PhotovoltaicPolycrystalline
Photovoltaic
Fixable Mono-Crystalline
Photovoltaic
ParametersValueUnitValueUnitValueUnit
Maximum power100W100W100W
Maximum power voltage (Vmp)18V18V18V
Maximum power Current (Imp)5.56A5.56A5.56A
Open circuit Voltage (Voc)21.5V22.0V21.5V
Current short circuit (Isc)6.22A6.06A6.20A
Maximum System Voltage1000V1000V600V
Maximum series Fuse15A15A15A
Operating Temperature−20°–90°C−20°–85°C−40°–90°C
SizeLength1200mm1200mm320mm
Width540mm540mm240mm
Height35mm35mm3mm
Weight7.3kg7.3kg0.4kg
Table 3. The used standard performance evaluation metrics [21].
Evaluation MatricEquationVariablesMeaning
Mean square error (MSE) MSE = 1 N i = 1 N ( f i y i ) 2 yi: experimental data
fi: predicted data
N: number of the exemplars
Determine the average squared difference between the estimated results and the actual data.
Mean absolute error (MAE) MAP = 1 N i = 1 N | f i y i | yi: experimental data
fi: predicted data
N: number of the exemplars
Determine the average deviation of predicted results from observed data
Root mean square error (RMSE) RMSE = M S E = 1 N i = 1 N ( f i y i ) 2 yi: experimental data
fi: predicted data
N: number of the exemplars
Measure the square root of the average of the square’s errors.
Coefficient of determination (R2) R 2 = 1 i N (   y i f i ) 2 i N (   y i y ¯ i ) 2 yi: experimental data
y ¯ i : mean of the experimental data
fi: predicted data
N: number of the exemplars
Evaluate the validity of performance results of predicted are indicated by a (R2) value that is close to 1.
Normalized mean squared error (NMSE) N M S E = P N M S E j = 0 p N   i = 0 N ( d i j 2 ) ( i = 0 N d i j ) 2 N P: number of processing elements
N: number of the exemplars
dij: experimental output
Determine the percentage of normalized MSE between the observed data and predicted results.
The correlation coefficient (r) r = i = 1 N (   x i x i ¯ ) (   y i y ¯ i ) i N (   x i x i ¯ ) 2 i N (   y i y ¯ i ) 2 xi: x-variable values
x i ¯ : mean of the xi values
yi: y-variable values
y ¯ i : mean of the yi values
N: number of the exemplars
The degree to which the estimated data are aligned with a linear regression line.
Adjust (R2) a d j . R 2 = 1 ( 1 ) ( n 1 ) ( n k 1 ) n: number of the exemplars
k: number of the model variables
Calculate the percentage of variation explained by only the independent variables that affect the dependent variable
Table 4. The equations to compute the PV-power production.
EquationMeaning
Y F d = E P V ( k W h / y e a r ) P V W P ( k W p ) Specify the yield or factor (SY or YF), which is the AC energy output of the system divided by the peak power of the installed PV array at standard test conditions (STC) at a temperature of 25 °C.
C F = S Y 8760 = E P V a n n u a l ( P R × 8760 ) Estimate the capacity factor (CF) benefits obtained from the system.
P R = S Y Y R The full rated power (PR) for 24 h per day for a year, which used to evaluate the used PV system quality.
L C C = C c a p i t a l + 1 n C O & M · R P W + 1 n C r e p l a c e m e n t · R P W C s a l v a g e · R P W
Life cycle cost (LCC) is the sum of the capital cost (Ccapital) plus all present costs (R) minuse (Csalvage)
R P W = F / ( 1 + i ) N Rated power (W)
C c a p i t a l = C A i × U C i + I C I The capital cost of a project
M C r = M C 0 r × ( 1 + f i f ) × [ 1 ( 1 + f 1 + i ) N ] The maintenance cost (USD)
M C 0 r = k r × I C r The maintenance cost of the rth
M C = 1 r M C r The system total maintenance cost
R C k = I C k × j = 1 N r ( 1 + F R 1 + I R ) ( L P × j N r + 1 ) The replacement cost of the kth component (USD)
C o E = L C C 1 n E P V Cost of Energy
P P V ( t ) = P p e a k   (   G   ( t ) G s t c   ) α T [ T c ( t ) T s t c ] PV generated power
T c ( t ) T a m b = ( N O C T 20 800 ) G ( t ) The cell temperature (°C)
E A C , t 1 = t = 1 N E A C , t 2 PV electrical energy generated
η P V = E D C G ( t ) × A c × 100 % The PV array
η s y s = E A C G ( t ) × A c × 100 % The PV system
Table 5. The descriptive summary statistics of the experimental datasets.
VariableObservationsObs. with Missing DataObs. without Missing DataMinimumMaximumMeanStd. Deviation
SolarRad.600060060.700762.200467.454157.977
Pow-PV1600060019.13677.63460.75914.069
Pow-PV2600060010.10061.54846.53912.339
Pow-PV360006009.24660.42047.93712.877
Pow-PV460006002.22262.49146.37116.250
Pow-PV560006006.65027.12623.7863.958
Pow-PV6600060012.64839.11631.9925.288
Table 6. Comparison results using different performance indicators.
PerformancePow-PV1Pow-PV2Pow-PV3Pow-PV4Pow-PV5Pow-PV6
MSE0.132540.151420.122250.247700.21610.46565
RMSE0.364060.389120.349640.497690.464860.68238
NMSE0.065940.098030.065290.0823610.774940.78537
MAE2.595882.622702.462353.386323.539224.56511
Min Abs Error0.041020.042850.052260.090930.110830.18580
r0.972640.963430.974850.971160.564830.55038
R20.946020.928190.950330.943150.319030.30291
Adj. R20.945920.928060.950240.943050.317890.30174
Table 7. Comparison results with other studies.
ReferenceYearCountry% Reduction DailyDays of Experiment
Guo et al. [7]2015QatarPloss = 0.46%365
Saidan et al. [9]2016IraqPloss = 0.208%30
Gholami et al. [11]2018IranPloss = 0.306%70
Hachicha et al. [13]2019UAEPloos = 0.084%150
Kazem et al. [14]2020OmanPloss = 0.05%365
Proposed Pow-PV22022OmanPloos = 1.008% (monocrystalline cell)30
Proposed Pow-PV42022OmanPloss = 0.964% (polycrystalline)30
Proposed Pow-PV42022OmanPloss = 1.207% (flexible)30
Publisher’s Note: MDPI stays neutral with regard to jurisdictional claims in published maps and institutional affiliations.

