Article

Simulation of a Pilot Scale Power-to-Liquid Plant Producing Synthetic Fuel and Wax by Combining Fischer–Tropsch Synthesis and SOEC

Institute of Chemical, Environmental and Bioscience Engineering, TU Wien, Getreidemarkt 9/166, 1060 Vienna, Austria
*
Author to whom correspondence should be addressed.
Energies 2022, 15(11), 4134; https://doi.org/10.3390/en15114134
Submission received: 4 May 2022 / Revised: 27 May 2022 / Accepted: 28 May 2022 / Published: 4 June 2022

Abstract

:
Power-to-Liquid (PtL) plants can viably implement carbon capture and utilization technologies in Europe. In addition, local CO2 sources can be valorized to substitute oil and gas imports. This work’s aim was to determine the PtL efficiency obtained by combining a solid oxide electrolyzer (SOEC) and Fischer–Tropsch synthesis. In addition, a recommended plant configuration to produce synthetic fuel and wax at pilot scale is established. The presented process configurations with and without a tail gas reformer were modeled and analyzed using IPSEpro as simulation software. A maximum mass flow rate of naphtha, middle distillate and wax of 57.8 kg/h can be realized by using a SOEC unit operated in co-electrolysis mode, with a rated power of 1 MWel.. A maximum PtL efficiency of 50.8% was found for the process configuration without a tail gas reformer. Implementing a tail gas reformer resulted in a maximum PtL efficiency of 62.7%. Hence, the reforming of tail gas is highly beneficial for the PtL plant’s productivity and efficiency. Nevertheless, a process configuration based on the recirculation of tail gas without a reformer is recommended as a feasible solution to manage the transition from laboratory scale to industrial applications.

1. Introduction

Despite increased media interest in the consequences of the climate crisis, the global mean CO2 level in the atmosphere is still rising by about 2.5 ppm per year and reached a value of 414 ppm in October 2021, an increase of 2.4 ppm compared to October 2020 [1,2]. In 2020, about 83% of the global primary energy demand was still derived from fossil sources [3]. An increase in the EU27 transportation sector’s greenhouse gas (GHG) emissions of 33% compared to 1990 highlights the urgency of a sustainable reformation to reach the goal of being climate-neutral in 2050, whereas other sectors managed to reduce their GHG emissions by 32%. Transportation is responsible for about 29% of the EU27’s total GHG emissions: 15% of the total GHG emissions are produced by passenger cars and vans, 5% by trucks and buses and 4% respectively by aviation and marine navigation [4,5]. A comprehensive overview of several technologies and scenarios to tackle the mobility sector’s weak performance concerning GHG emissions can be found in [6].
Besides battery electric vehicles, plug-in hybrid technologies and biofuels, synthetic fuels pose an attractive transitional solution for individual mobility and have the potential to replace conventional fossil fuels in applications requiring high energy density—i.e., aviation, marine navigation and off-road vehicles, e.g., construction, agricultural or forestry vehicles—on a long-term basis [7]. In summary, the implementation of synthetic fuels includes the following advantages:
  • High energy density;
  • Applicability for existing technologies;
  • Suitability for heavy-duty applications;
  • Quick deployment, since no infrastructural adaptions are required.
An overview of current Power-to-X (PtX) projects throughout Europe was given by Wulf et al. in [8]. In June 2020, 220 PtX research and demonstration projects were realized, finished or planned in Europe. Some of the mentioned plants were not commissioned at release and have not been constructed as of April 2022. Germany, Spain and the UK have the highest shares of PtX plants in Europe. Power-to-Gas (PtG) plants obtained the highest share of 94%. Power-to-H2 applications had a share of 67%, whereas Power-to-Methane plants had a share of 27%. The production of methanol and other technologies, i.e., the production of DME or Fischer–Tropsch products, accounted for 3%. Low-temperature electrolysis technologies, i.e., alkaline electrolyzers and proton exchange membrane electrolyzers (PEMEC), were by far the preferred technology for H2 production, as shown by their share being larger than 90%, whereas high-temperature solid oxide electrolyzers (SOEC) were applied in less than 10% of the analyzed projects.
An overview concerning completed and ongoing Power-to-Liquid projects based on the synthesis of methanol or Fischer–Tropsch products is given in Table 1.
Finding a way to commercialize liquid fuels produced by lignocellulosic feedstocks or CO2 streams in combination with renewable H2 is one goal of [9] within the “Advancefuel” project, which is analyzing several conversion technologies to produce fuels such as methanol, DME, gasoline and diesel. An alternative route for the production of Fischer–Tropsch products based on syngas generated via biomass gasification, i.e., Biomass-to-Liquid, is presented in [10]. The upcycling of waste, e.g., municipal waste, sewage sludge or residues from the pulp and paper industry to renewable fuel and wax via dual-fluidized bed gasification and Fischer–Tropsch synthesis is planned to be realized within the ”Waste2Value” project conducted in Vienna, Austria [11]. A concept for a PtL plant based on the synthesis of methanol in combination with a biomass heating plant and a conventional alkaline electrolyzer was analyzed in [12]. Besides the produced methanol, heat was transferred to a district heating network provided by a fluidized bed combustor operating in air or oxyfuel mode.
Table 1. Overview of completed and ongoing Power-to-Liquid projects.
NameLocationCO2 SourcePower SourceElectrolyzerSynthesismProducts 1Source
Haru OniMagellanes, CHLDACWind powerPEMMethanol- 2[13]
George Olah PlantSvartsengi, ISGeothermalGeothermalAlkalineMethanol4000 t/a[14]
MefCO2Niederaussem, GERCoal plantSurplus el.PEMMethanol365 t/a[15]
Norsk e-fuelMosjøen, NORDACWind powerSOECFischer–Tropsch12.5 t/a[16]
- 2Werlte, GERBiogas + DACRenewable- 2Fischer–Tropsch350 t/a[17]
- 2Frankfurt, GERBiogas plant- 2- 2Fischer–Tropsch3500 t/a[18]
1 According to the stated source. 2 Information not available.
Fischer–Tropsch synthesis has been researched and optimized for several decades, and hence is well established at an industrial scale. De Klerk provided an extensive overview of the process itself and industrial plants in [19]. Martinelli et al. gave a comprehensive examination of the Fischer–Tropsch process in combination with SOEC or biomass gasification as syngas production technologies [20]. Detailed information about the impacts of process conditions—temperature, pressure, space velocity, H2:CO ratio, etc.—can be found in [21,22,23,24,25,26]. Refining Fischer–Tropsch syncrude to on-specification diesel fuel is far from trivial, since several technological aspects need to be synchronized with national diesel fuel standards to comply with required intervals for parameters, i.e., the cetane number, density and viscosity [27]. Lately, Fischer–Tropsch waxes have received increasing attention due to their low amounts of aromatic and sulfurous compounds, hence having high potential as feedstock for the cosmetic industry [28].
Choosing the appropriate reactor design for PtL plants at a pilot scale is crucial. Fluidized bed reactor systems, either stationary or circulating, are applied for high-temperature Fischer–Tropsch (HTFT) synthesis processes [29] but are not considered in this work, since the system aims at maximizing the middle distillate and wax fractions. In general, three reactor types can be considered for low-temperature Fischer–Tropsch (LTFT) applications, i.e., slurry bubble column reactors (SBCR), fixed bed multitubular reactors (FBMR) and microstructured reactors. The advantages and disadvantages of SBCR and FBMR reactors can be found in [29,30,31]. Detailed information regarding existing reactors at an industrial scale is stated in [19]. The current status of microstructured reactors and an analysis concerning the effect of process parameters can be found in [32,33].
Previous work concerning the simulation of Power-to-Liquid plants via Fischer–Tropsch synthesis is summarized in Table 2. The syngas was either provided by a solid-oxide electrolyzer operating in co-electrolysis mode, a low-temperature electrolyzer in combination with a reverse water-gas shift (rWGS) reactor, or biomass gasification. The simulation of the Fischer–Tropsch synthesis was based on a Co-based catalyst with different approaches concerning the chemistry inside the reactor, i.e., the standard Anderson–Schulz–Flory (ASF) distribution, kinetic modeling and basic reaction stoichiometry. In general, the chosen values concerning the chain growth probability were around 0.9 to maximize the yield of long-chain hydrocarbons. Most of the authors assumed rather optimistic CO conversions of higher than 70%. The recirculation of tail gas (TG) to the inlet of the SOEC unit or rWGS reactor was considered in the majority of the listed works. Another option is to realize a short recycle configuration to the Fischer–Tropsch reactor’s inlet.
The main aim of this work was to answer the question of which Power-to-Liquid efficiencies can be realized by pilot scale plants combining an SOEC unit with Fischer–Tropsch synthesis. In addition, an ideal plant configuration for the production of synthetic liquid fuels and wax at a pilot scale is provided as a result of the presented work. In comparison to the comparable research stated in Table 2, the underlying work shifts the focus toward the Fischer–Tropsch process itself by applying the extended ASF distribution model and analyzing the recirculation of tail gas prior to the Fischer–Tropsch reactor instead of the SOEC. Furthermore, a process route including a tail gas reformer to convert short-chain hydrocarbons and CO2 to syngas is analyzed.

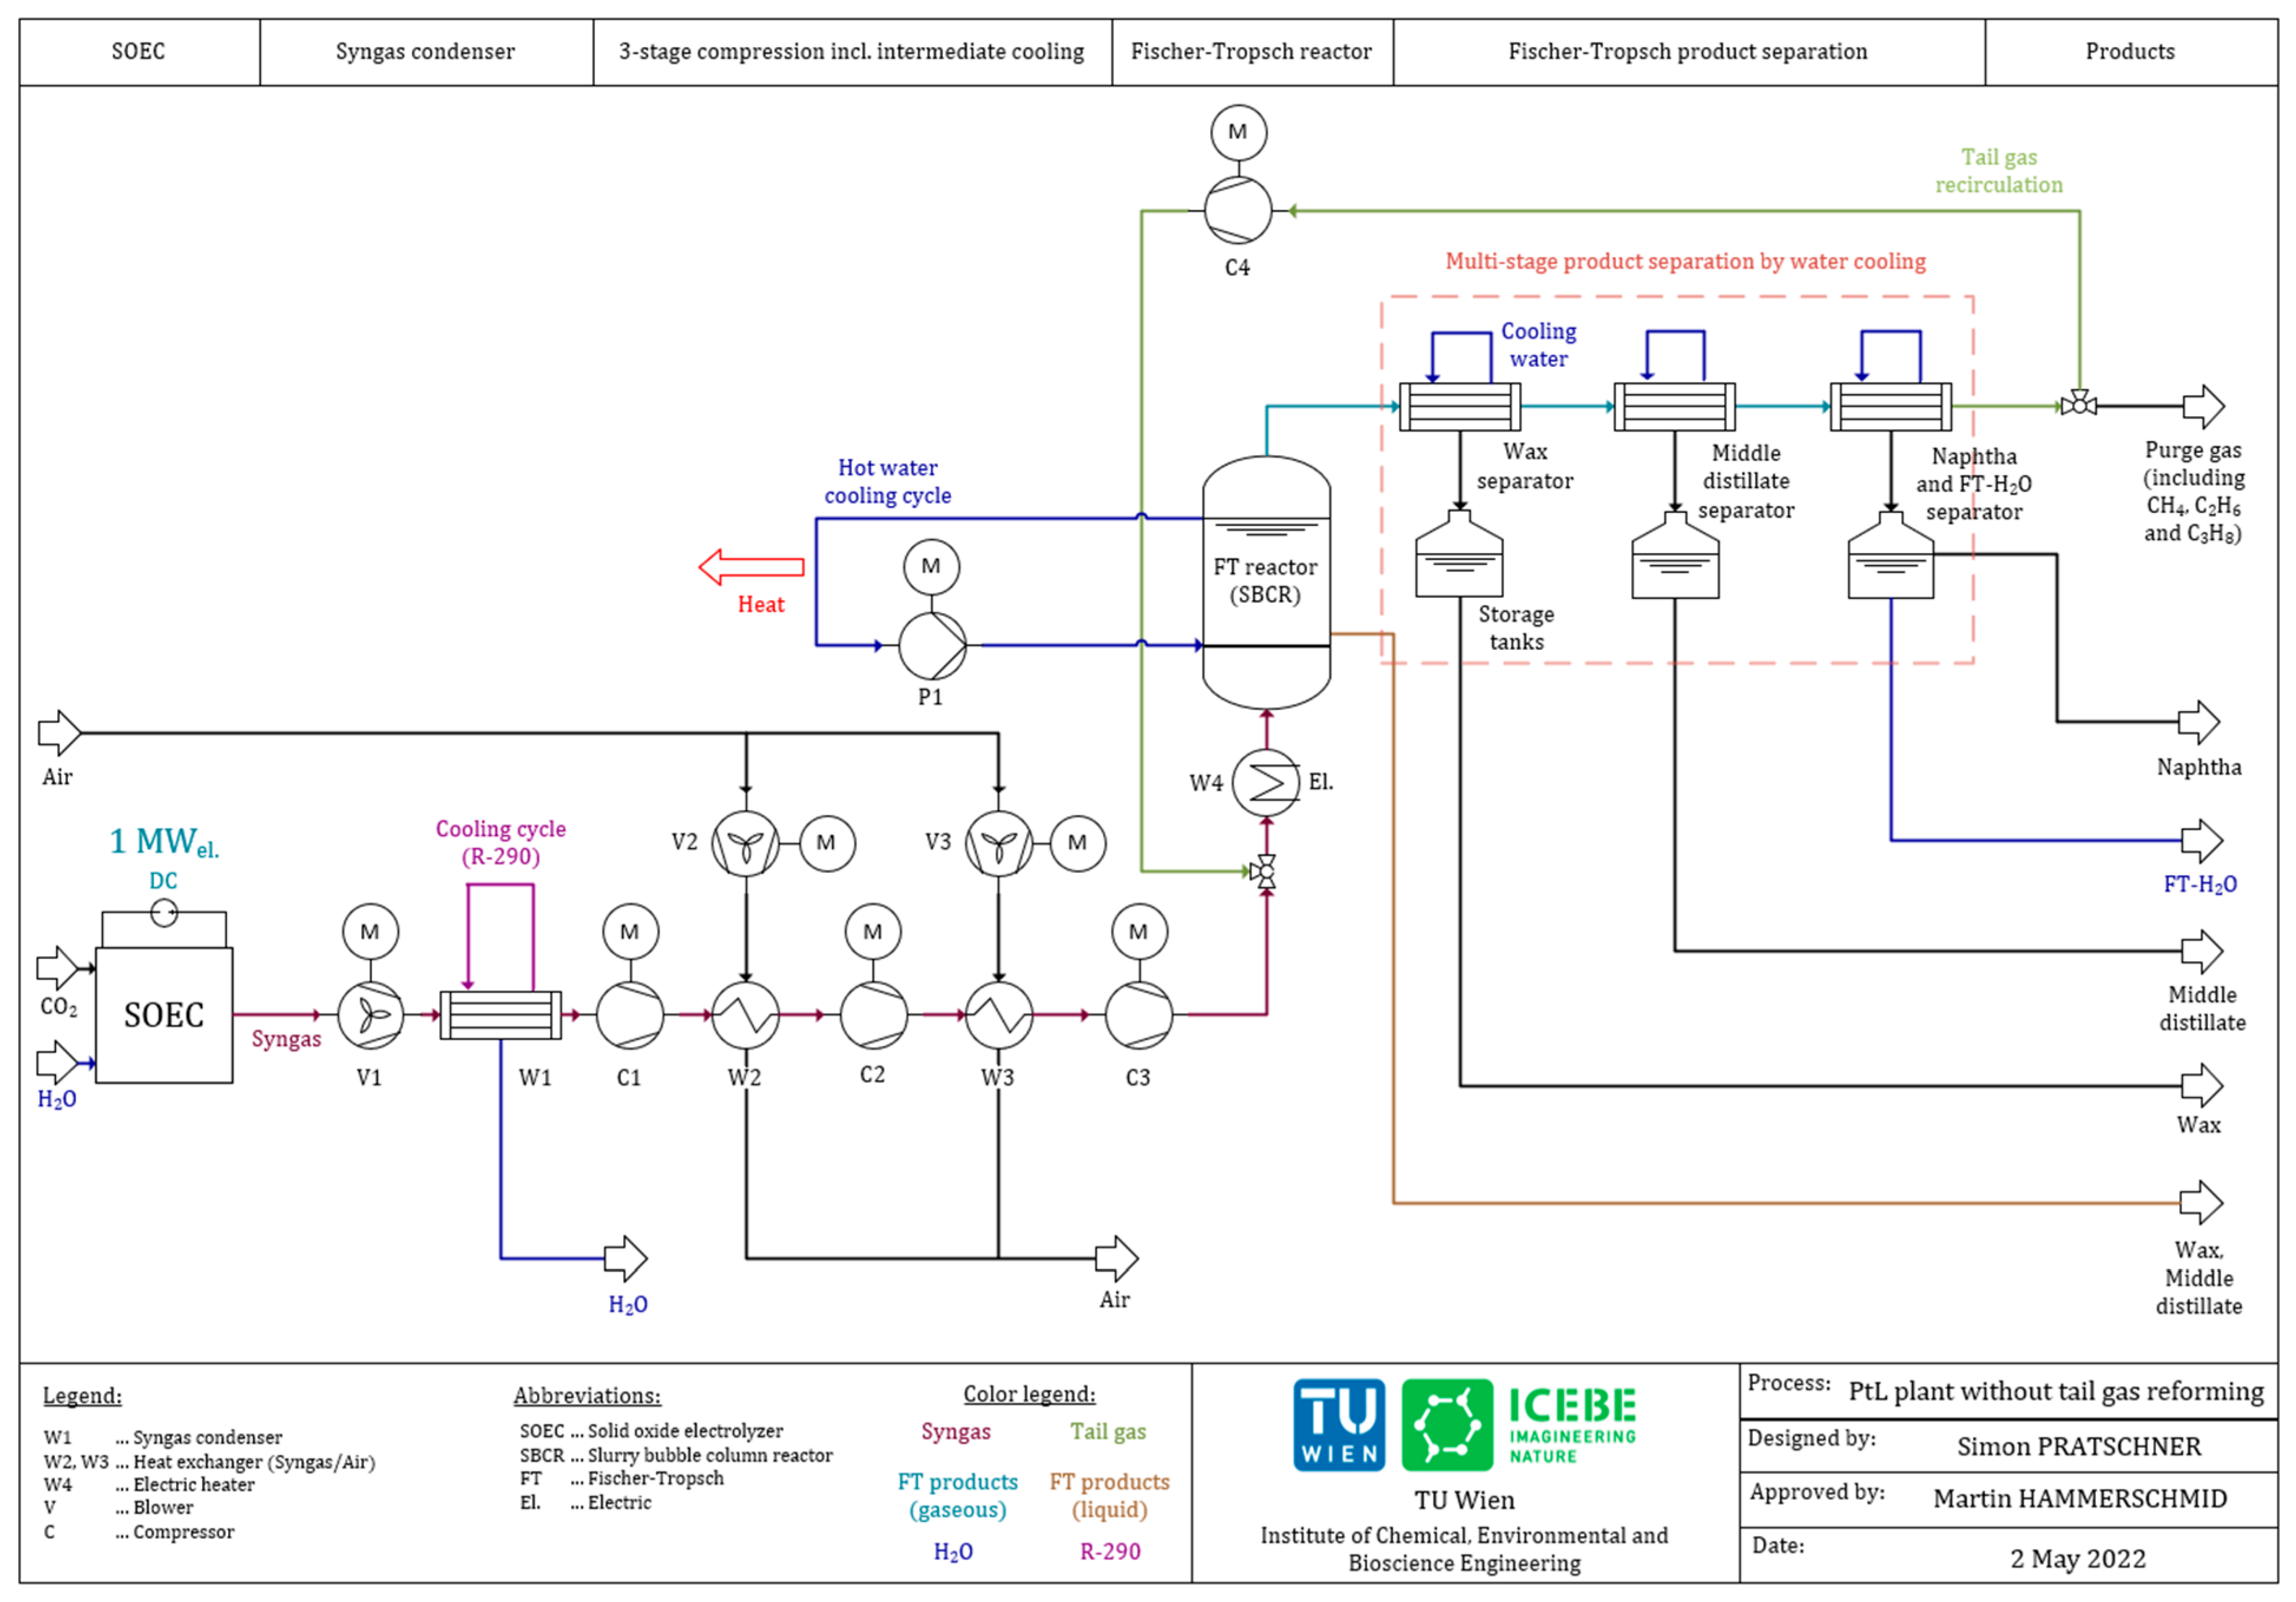
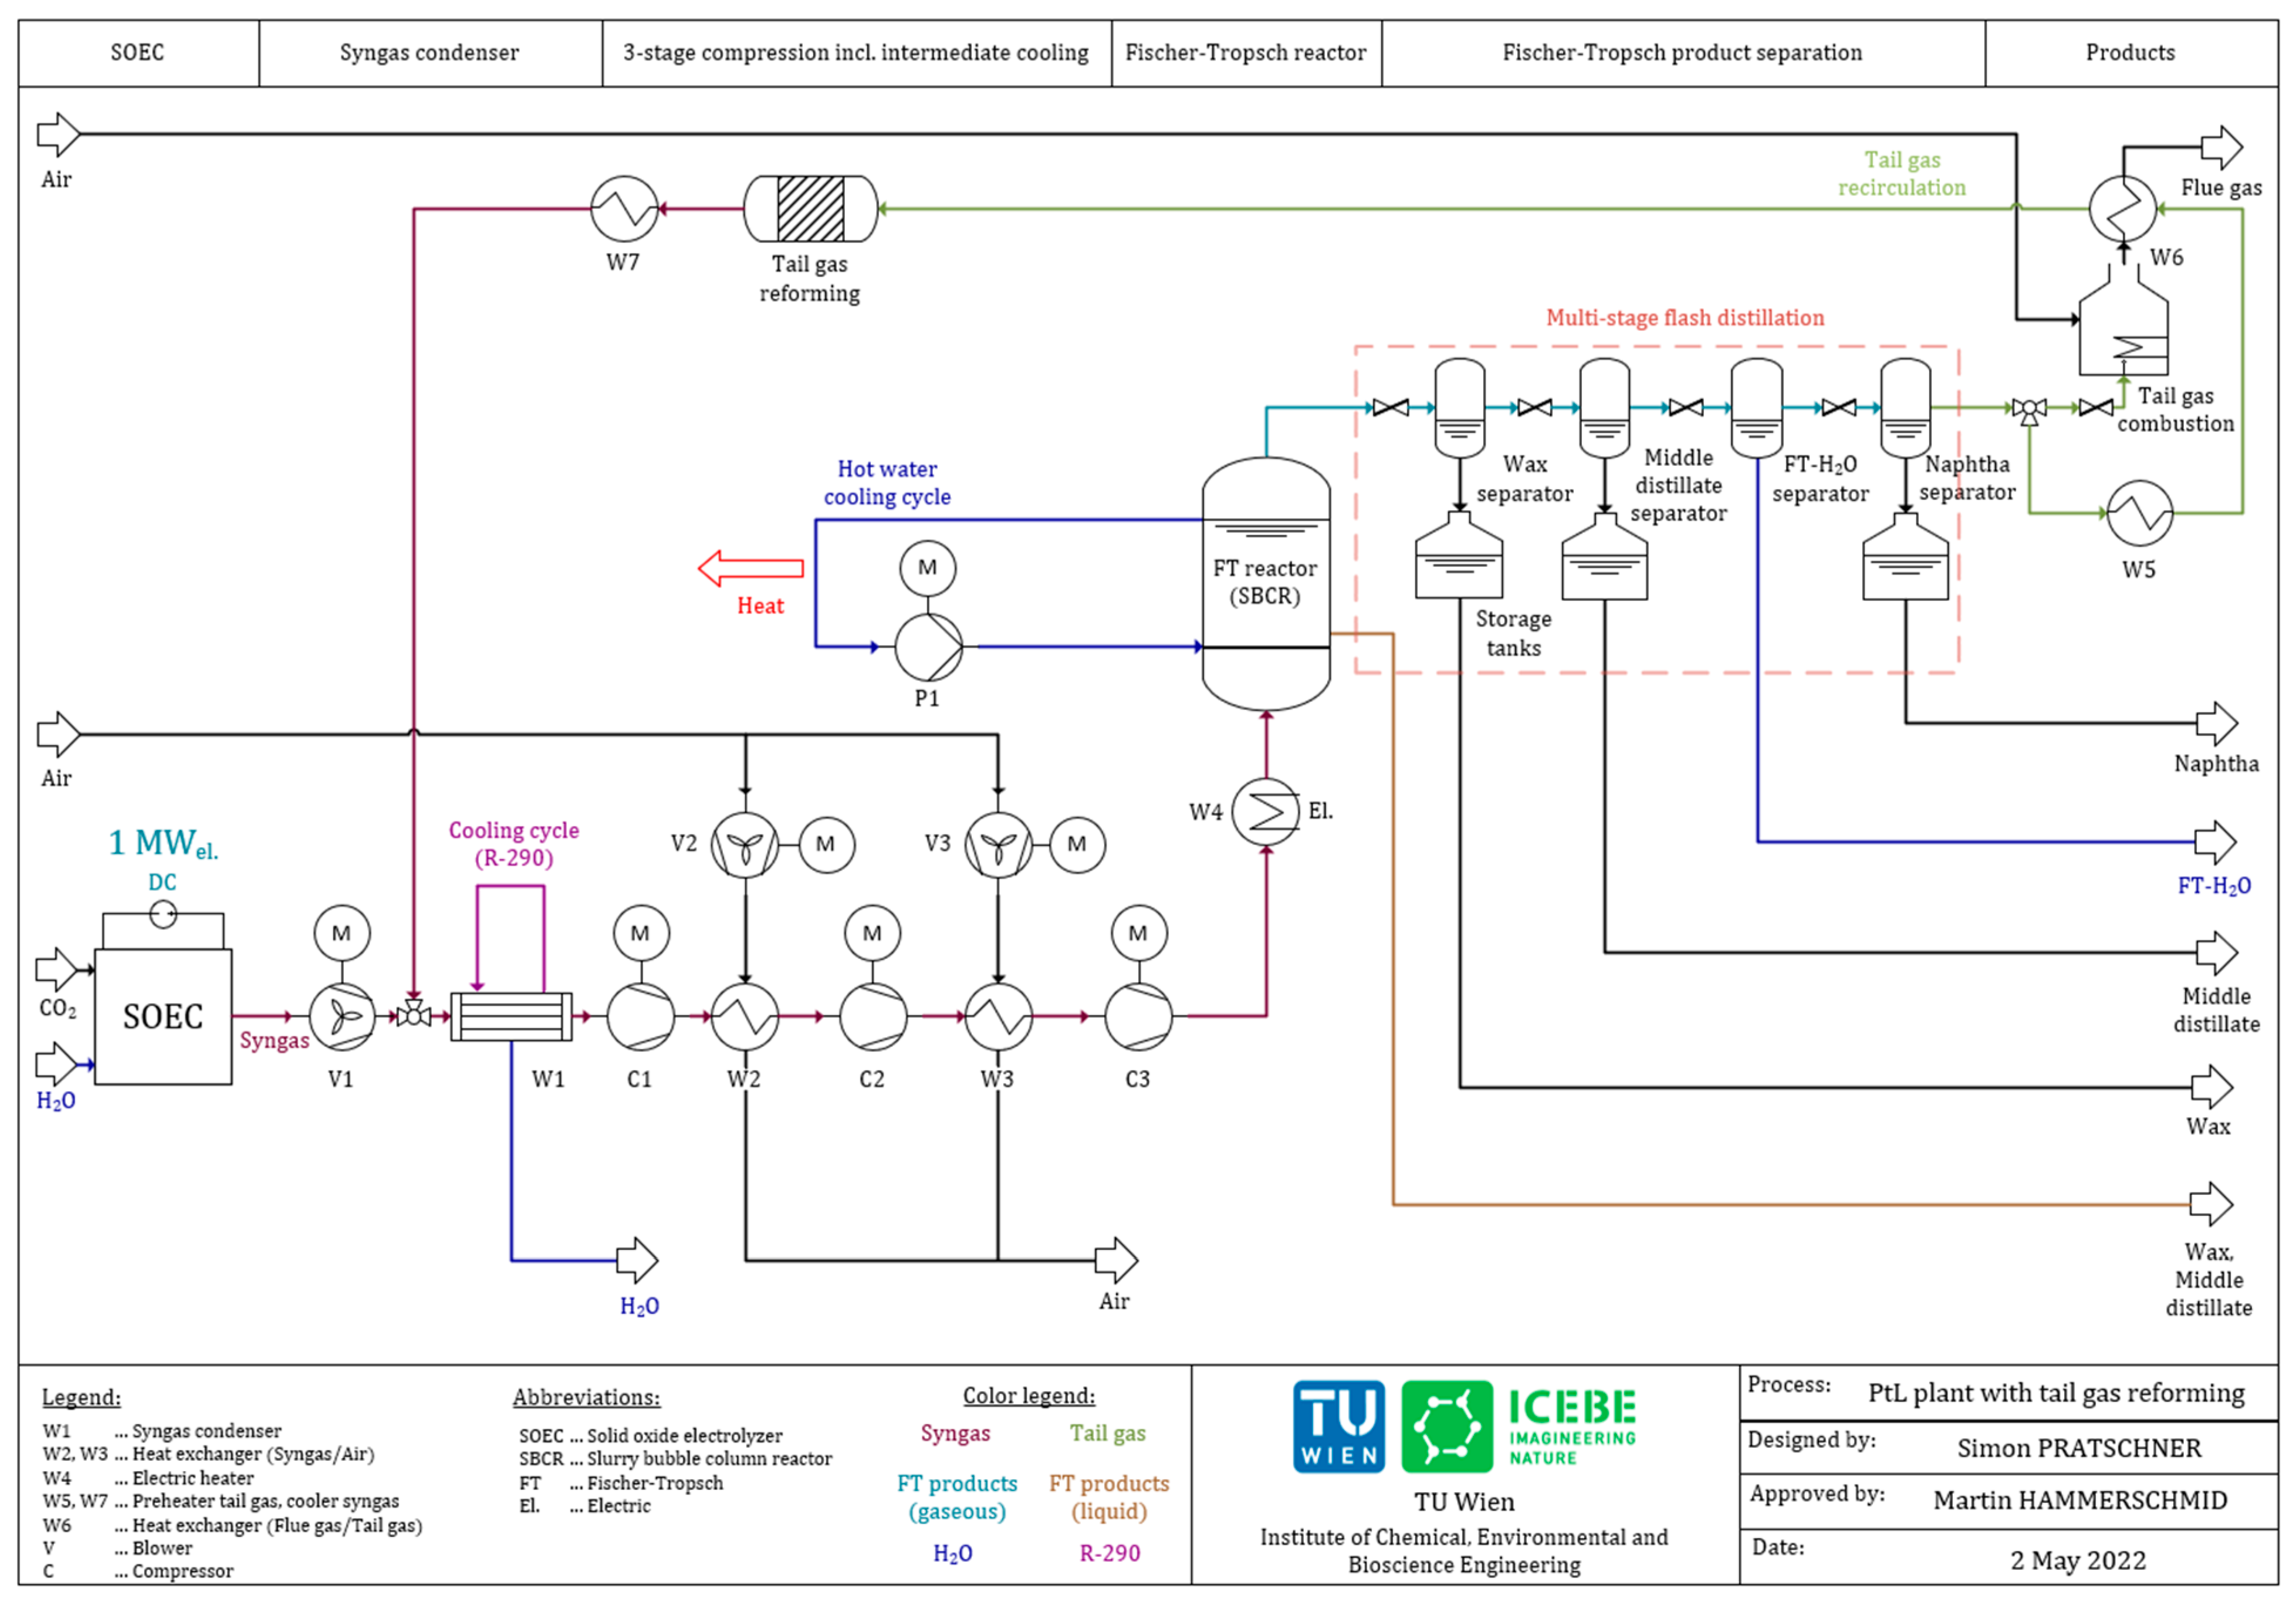
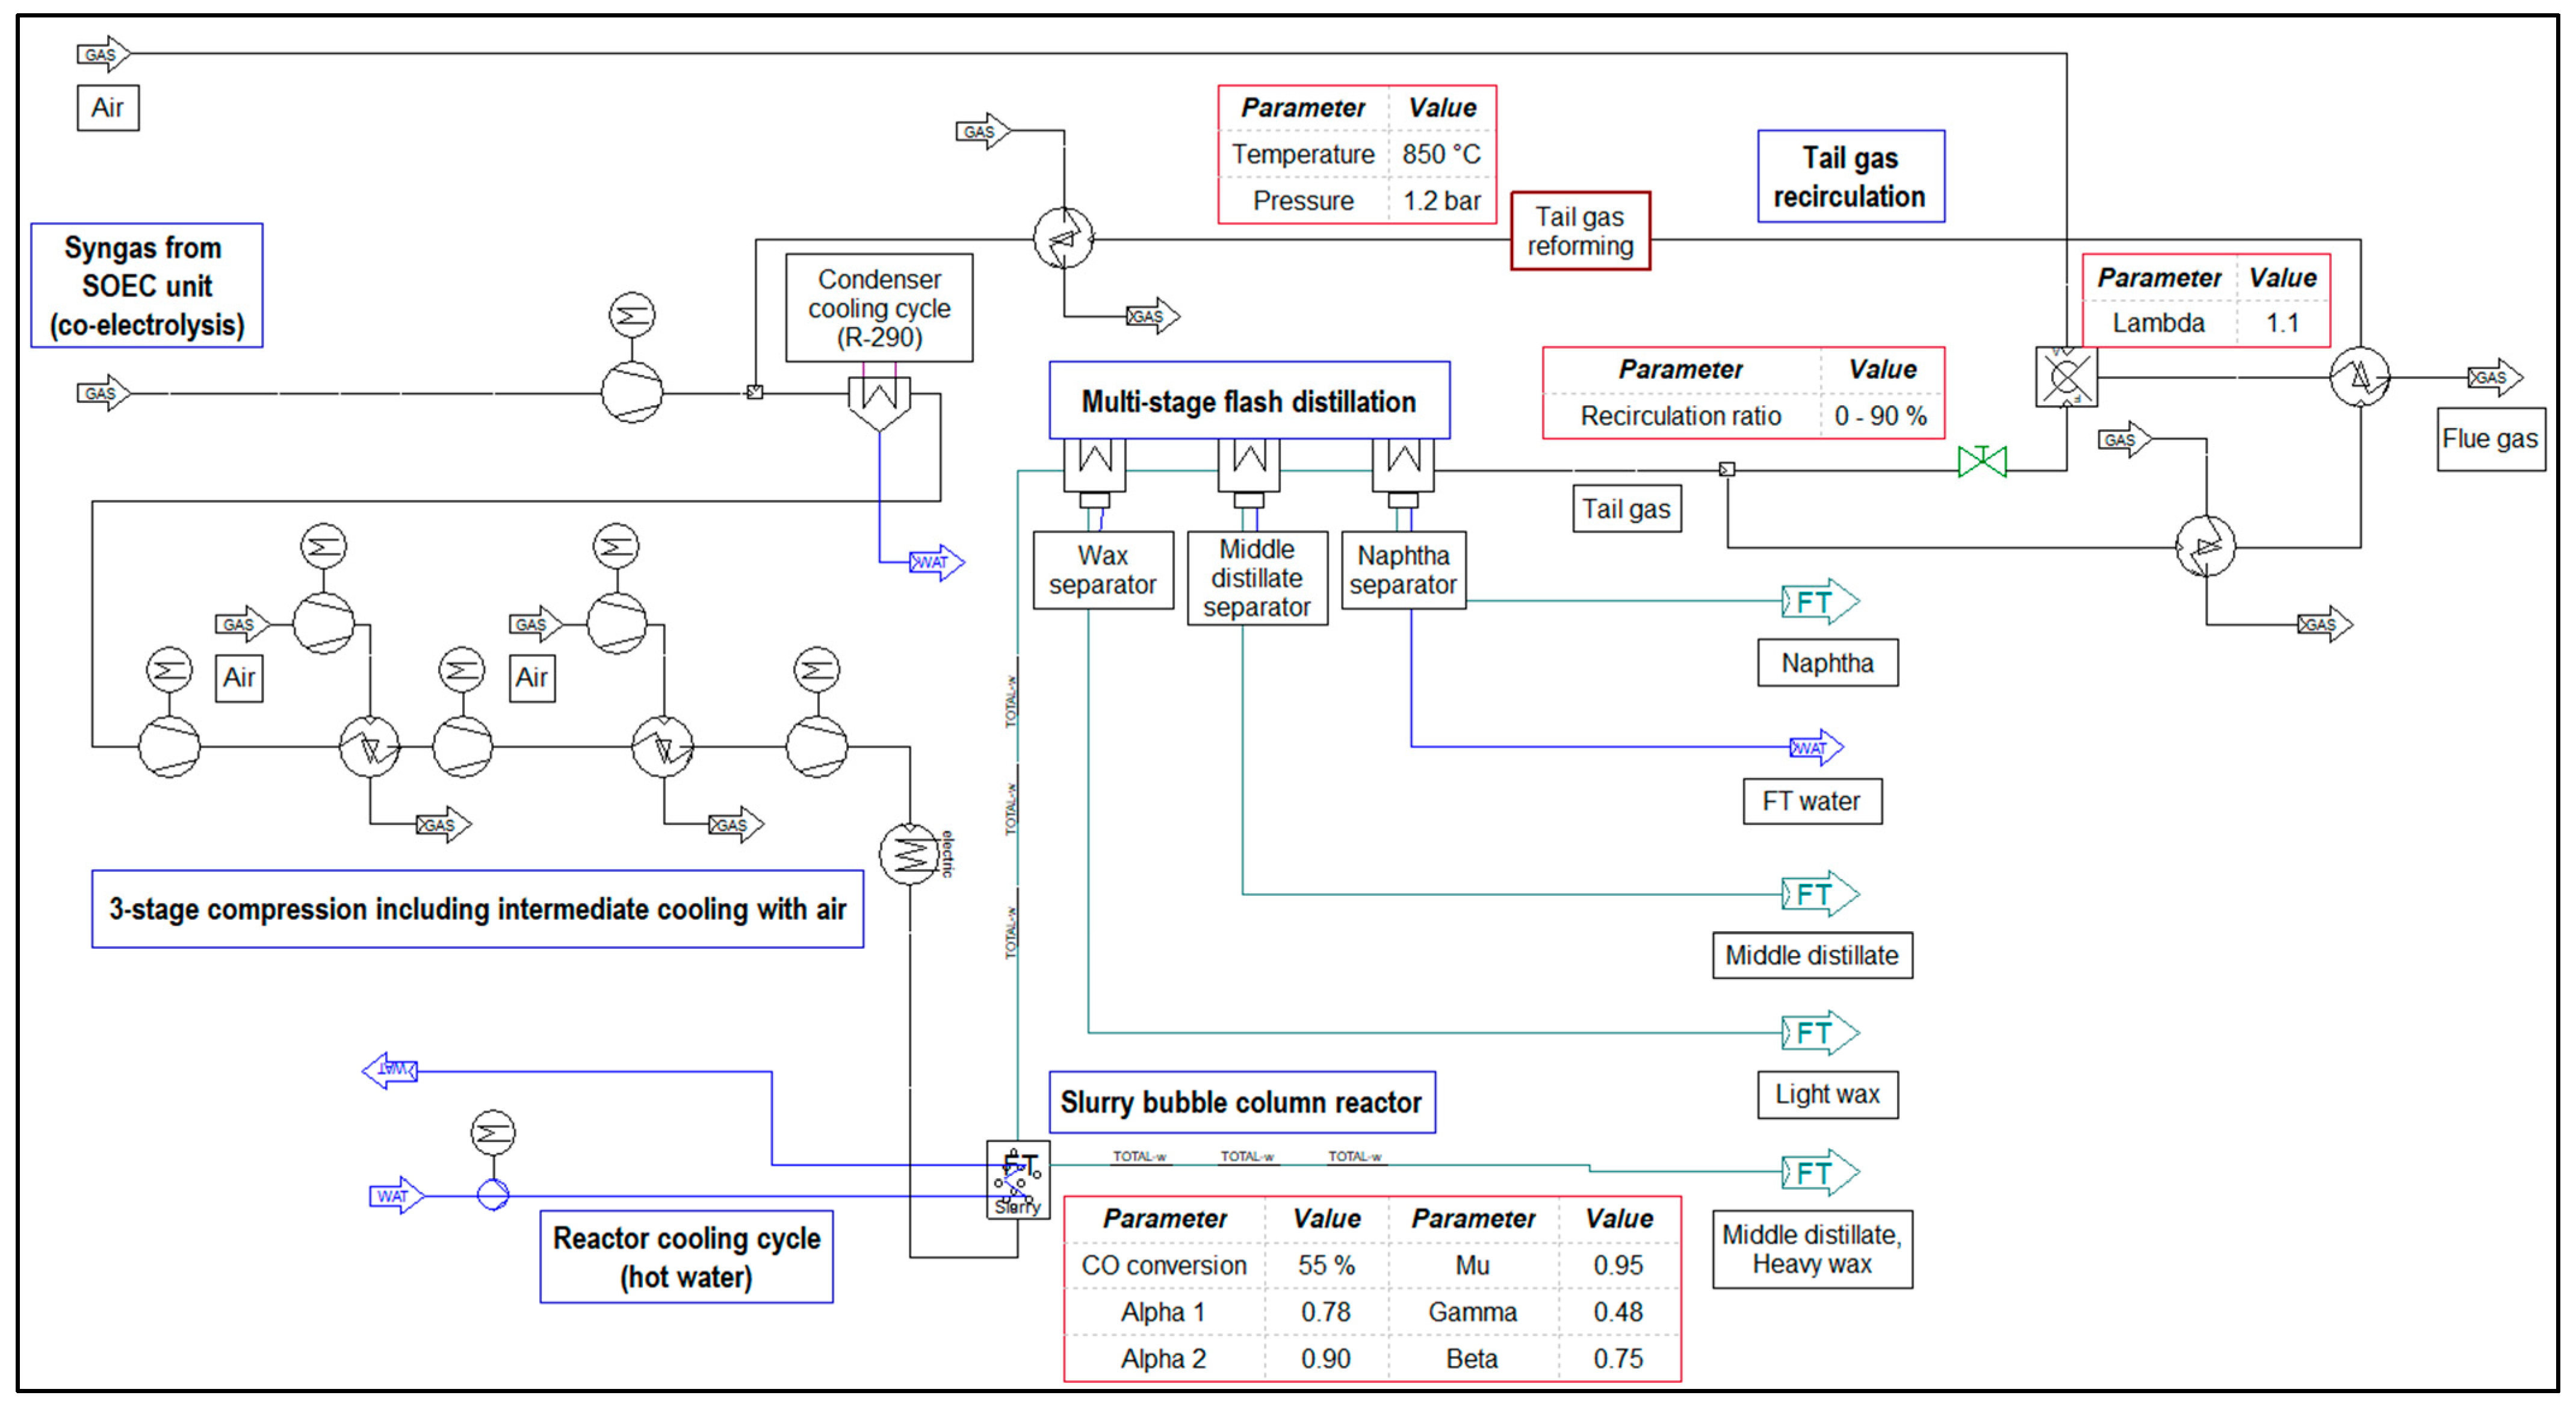
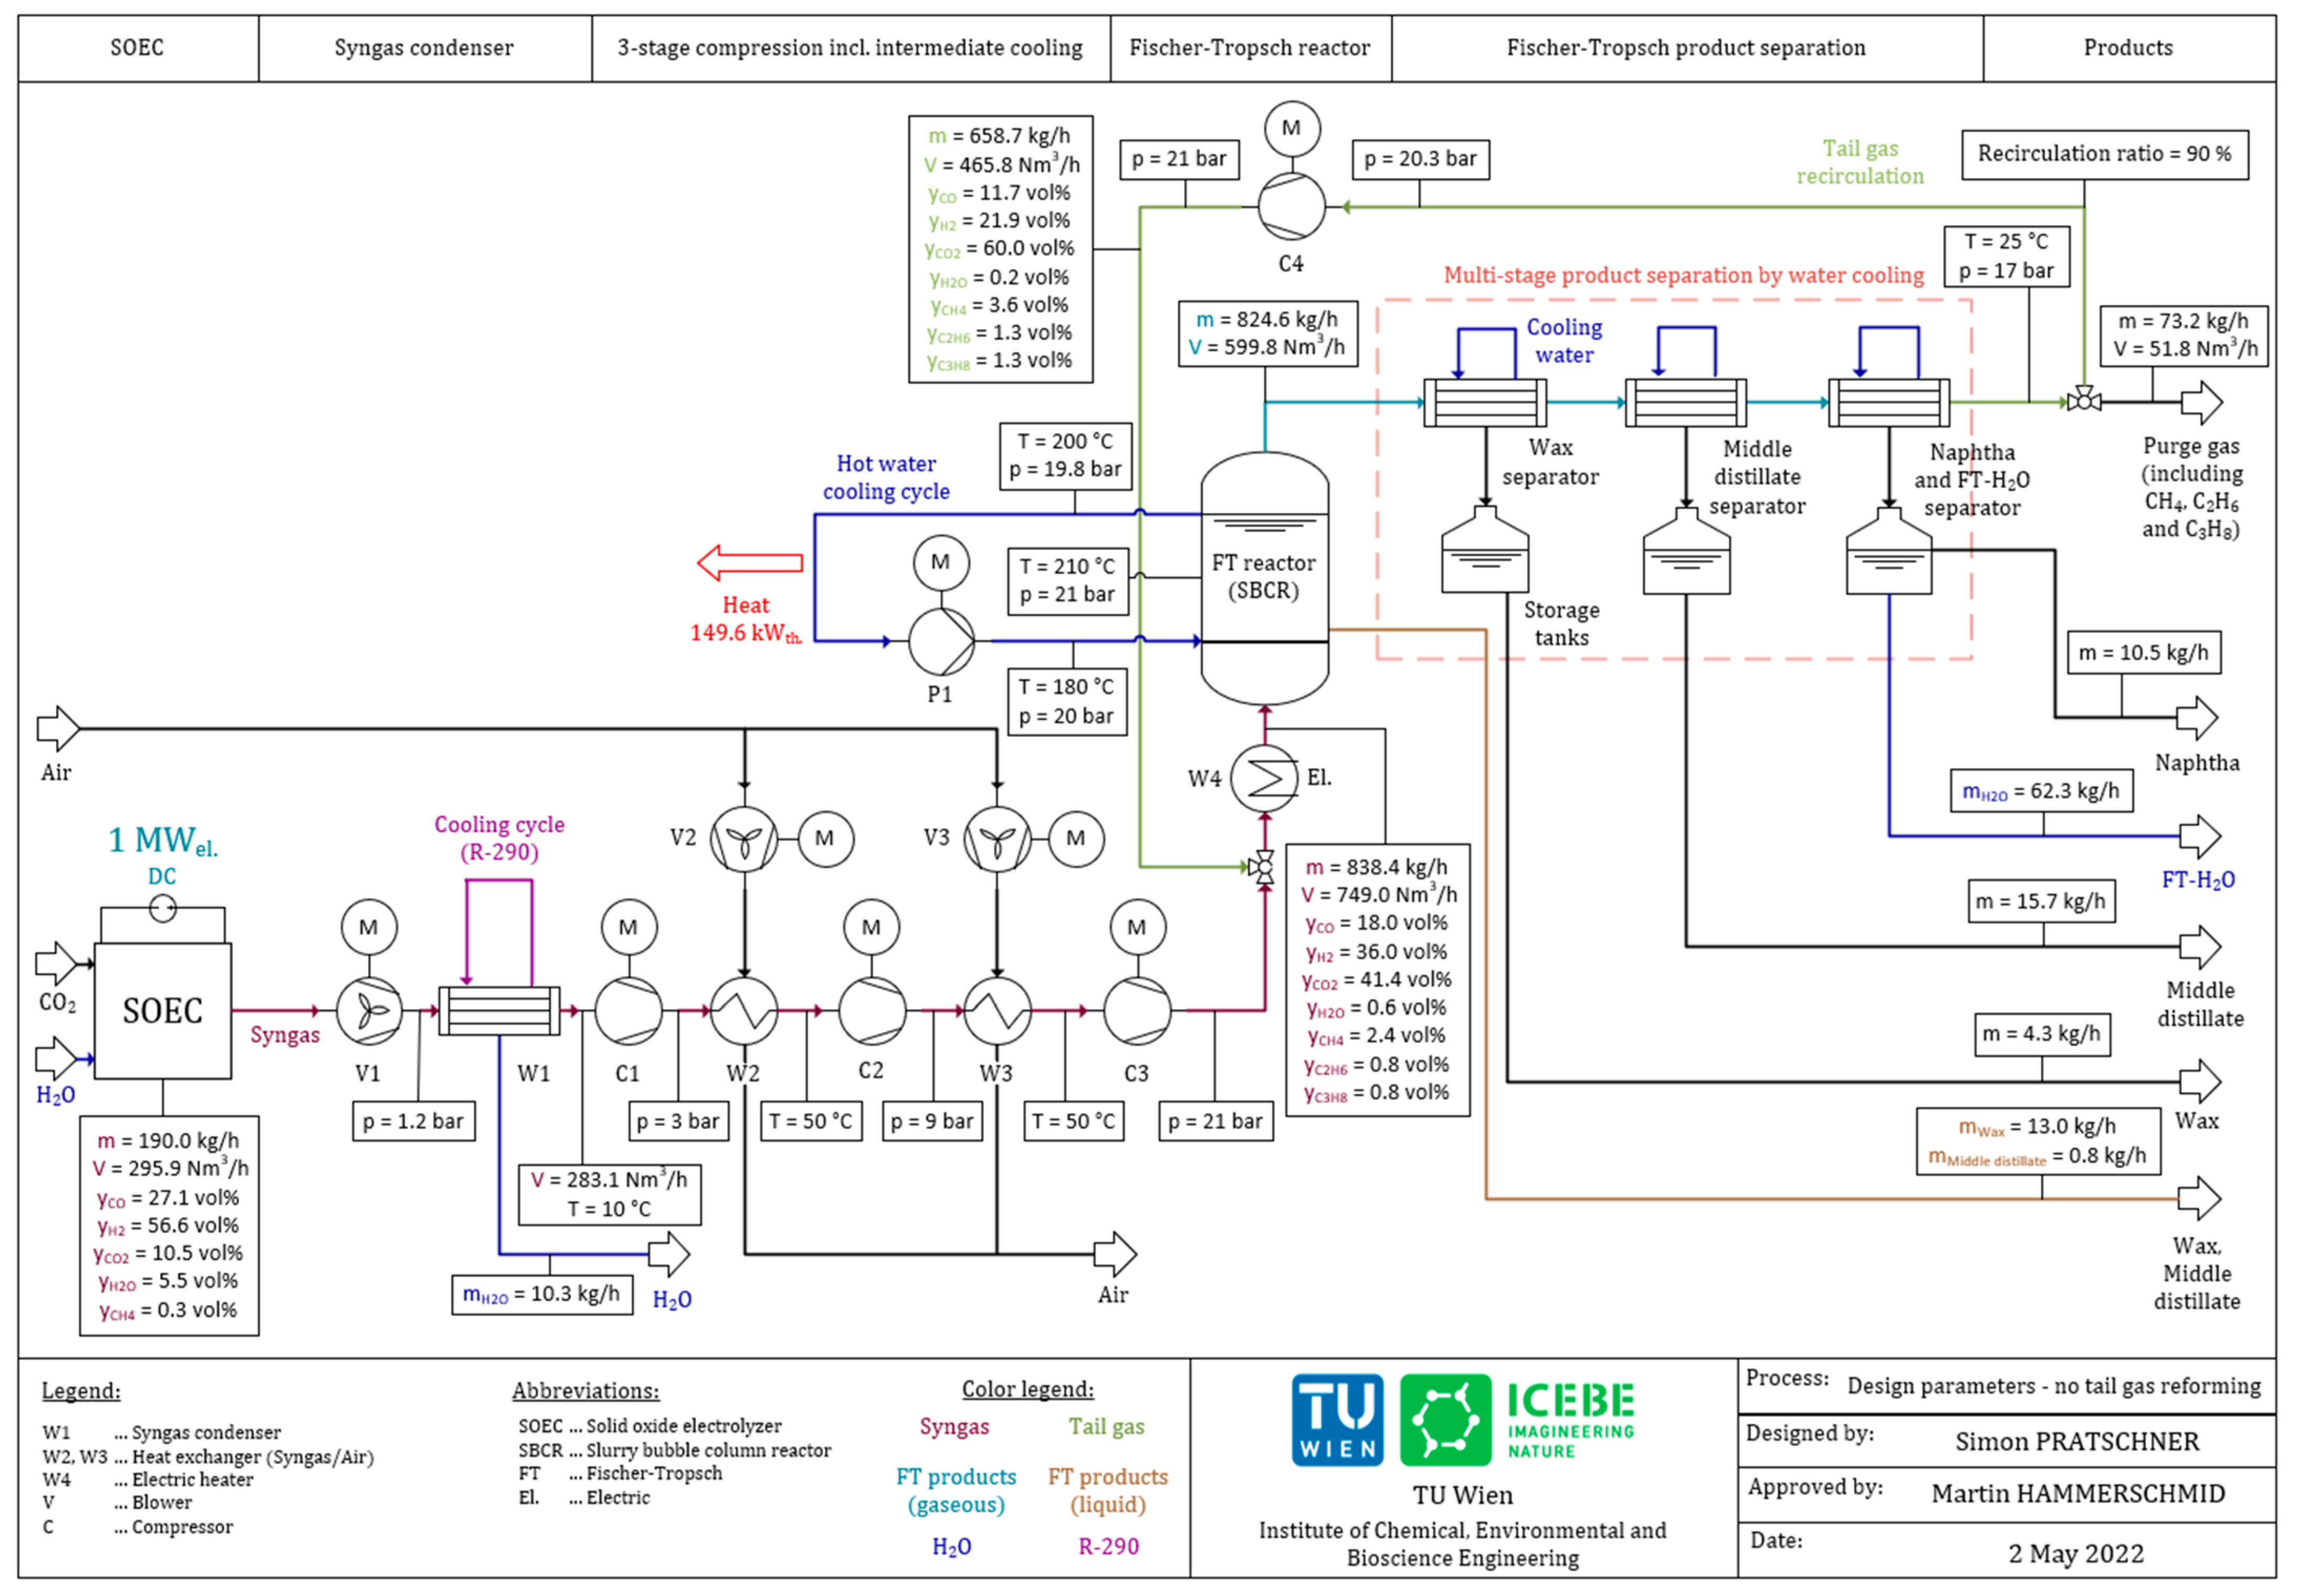
2. Materials and Methods

The presented work is based on the results obtained by the process simulation of two design configurations for a PtL plant producing Fischer–Tropsch products. IPSEpro (version 8), stationary equation-orientated simulation software based on the numerical solving of equation systems via the Newton–Raphson method, was applied to develop the underlying model consisting of the following subprocesses:
  • Co-electrolysis of CO2 and H2O with a subsequent syngas condenser;
  • Using a blower to overcome the pressure drop caused by the syngas condenser;
  • Three-staged syngas compression with intermediate cooling by ambient air;
  • Fischer–Tropsch reaction;
  • Product separation;
  • Tail gas recirculation and tail gas reforming;
  • Tail gas combustion.
An overview of a process configuration of a PtL plant at the pilot scale without a tail gas reformer is given in Figure 1. Syngas provided by the SOEC unit is transferred to the condenser by a blower to overcome its pressure drop. After water separation, the syngas is compressed to the Fischer–Tropsch reactor’s pressure level via a three-stage compression step with intermediate cooling by ambient air. The SOEC’s syngas and the recirculated tail gas are mixed before being transferred into the reactor. A hot water cooling cycle ensures the removal of the reaction heat. A share of the produced middle distillate and wax leave the reactor as a liquid. The rest of the Fischer–Tropsch products, water and unconverted gases are drained as gases and transferred to the subsequent product separation unit. Within this process configuration, the separation of wax, middle distillate, naphtha and water is realized by three heat exchangers based on water as a cooling agent. Subsequently, a share of the tail gas stream is recirculated in front of the Fischer–Tropsch reactor, whereas the remaining tail gas leaves the system as purge gas.
The proposed process route that includes a tail gas reformer is displayed in Figure 2, showing the following differences from Figure 1:
  • The recirculated tail gas is inserted in front of the syngas condenser;
  • The product separation is realized by a multi-stage flash distillation;
  • Purge gas is combusted to heat the recirculated tail gas;
  • A tail gas reformer ensures the conversion of CO2 and hydrocarbons inside the recirculated tail gas stream.
The implementations of the presented flowcharts in IPSEpro are shown in Figure 3 for the process configuration without a tail gas reformer and in Figure 4 for the one including a tail gas reformer.
Table 3 provides a list of the parameters chosen for the process simulation. Detailed explanations of the subprocesses are given within the following subsections.

2.1. SOEC (Co-Electrolysis) and Condenser

Thermodynamically, the required enthalpy for water splitting is provided by electrical and thermal energy, as can be seen in Equation (1). An increase in the thermal energy provided to the cell decreases the required input of electricity [45].
ΔrH = ΔrG + T∙ΔrS,
Due to this behavior, the application of high-temperature electrolysis technologies, i.e., SOEC, has the potential to significantly improve the efficiency of PtL plants when combined with strongly exothermal chemical synthesis processes [46]. Since conventional syngas consisting of CO and H2 is required for Fischer–Tropsch processes applying a Co-based catalyst, we chose to have the electrolysis unit operate under co-electrolysis conditions, converting CO2 and H2O to CO and H2, at atmospheric pressure and a temperature of 850 °C. Detailed information about state-of-the-art materials used for electrodes and the electrolyte in high-temperature electrolysis cells can be found in [47]. Equations (2)–(4) show the underlying chemical reactions of a high-temperature electrolyzer in co-electrolysis mode [34].
Cathode: H2O + 2 e → H2 + O2−,
Cathode: CO2 + 2 e → CO + O2−,
Anode: O2− → 0.5 O2 + 2 e,
According to literature, an assumed mass flow rate of 190 kg/h of syngas is provided by the SOEC unit, operating at TSOEC = 850 °C and pSOEC = 1 bar, consuming 1 MWel. of electric power. The amount of H2 inside the syngas stream and the required amount of H2 for the formation of CO via the rWGS reaction correspond to an energy demand of 3.37 kWh/Nm3 H2 according to [41], for the syngas’ base case composition listed in Table 3 [34], and an efficiency of 80%. The volume fractions of CO and H2 can be varied by adapting the share of H2O at the SOEC unit’s inlet to adjust the required H2:CO ratio for process routes that include the recirculation of tail gas [34]. The data listed in Table 3 imply a reactant utilization rate of around 80% [38].
A blower after the SOEC unit ensures overcoming the pressure difference of 0.2 bar caused by the condenser, applying C3H8, i.e., R-290, as a cooling medium.

2.2. Syngas Compression with Intermediate Cooling

Syngas leaves the SOEC unit at atmospheric pressure, and hence needs to be compressed to the synthesis pressure of pFT = 21 bar. In addition, the recirculated syngas needs to be re-pressurized after being separated via multi-stage flash distillation [48] for the process route that includes tail gas reforming. The compressors’ efficiencies were assumed as ηCompr.,s = ηCompr.,m. = 0.9, whereas the electric motors’ efficiencies were chosen as ηMotor,m. = 0.99 and ηMotor,el. = 0.96.

2.3. Fischer–Tropsch Synthesis

The applied Fischer–Tropsch model is based on an LTFT process in an SBCR using a Co-based catalyst, operating at a temperature of TFT = 210 °C and a pressure of pFT = 21 bar. At industrial scale, Fischer–Tropsch catalysts are either based on cobalt, obtaining higher activity, fewer by-products and longer lifetimes; or iron, which is cheaper and shows activity in the rWGS reaction. Important properties are the possible hydrogenating nature of the applied material, which will result in a higher share of non-saturated hydrocarbons, and the selectivity for by-products, which can be manipulated by the addition of alkali metals as promoters [20,30]. Additional information regarding the production of Fischer–Tropsch catalysts can be found in [49].
It is assumed that the formed Fischer–Tropsch products are solely paraffins, as shown in Equation (5).
n CO + (2n + 1) H2 → H(CH2)nH + n H2O, ΔrH = −166.4 kJ/mol

2.3.1. Extended ASF Distribution

The extended ASF (eASF) model, as proposed by Förtsch et al., was used to find the product spectrum of the synthesized hydrocarbons [50], since the standard ASF distribution does not consider three primary deviations from real applications:
  • Underestimation of the formation of CH4;
  • Overestimation of the formation of C2H6;
  • Deviation of the chain growth probability α for long-chain hydrocarbons, C13+.
The following parameters and equations were introduced by Förtsch et al. to minimize the deviation from real applications:
  • α1: Chain growth probability for hydrocarbons ranging from C1 to C7;
  • α2: Chain growth probability for hydrocarbons with C13+;
  • μ: Factor for merging α1 and α2;
  • γ: Termination factor to depict the higher selectivity for CH4;
  • β: Readsorption factor to depict the lower selectivity for C2H6.
The molar fractions of CH4, C2H6 and Cn>2 can be determined by Equations (6)–(8), respectively [50].
x CH 4 = ( 1 μ ) · [ 1 α 1 · ( 1 γ ) ] + μ · ( 1 α 2 ) ,
x C 2 H 6 = ( 1 μ ) · ( 1 α 1 ) · α 1 · 1 β 1 β · ( 1 α 1 ) · ( 1 γ ) + μ · ( 1 α 2 ) · α 2 ,
x C n H 2 n + 2 = ( 1 μ ) · ( 1 α 1 ) · α 1 ( n 1 ) · 1 γ 1 β · ( 1 α 1 ) · μ · ( 1 α 2 ) · α 2 ( n 1 ) ,
The Co-based catalyst’s assumed eASF parameters, as listed in Table 3, were based on the findings of Guilera et al. [43].

2.3.2. Reactor Cooling

Since Fischer–Tropsch synthesis is a highly exothermic process (see Equation (5)), the reaction heat needs to be transferred out of the reactor to avoid hot spots which might result in alternating the product selectivity and catalyst deactivation due to sintering processes. Industrial reactors are preferably cooled by the evaporation of boiling water at a certain pressure level, i.e., boiling water reactors. However, this reactor type requires a rather sophisticated design which might not be feasible for pilot scale applications; thus, a cooling design circulating pressurized hot water was chosen for the modeled Fischer–Tropsch reactor.

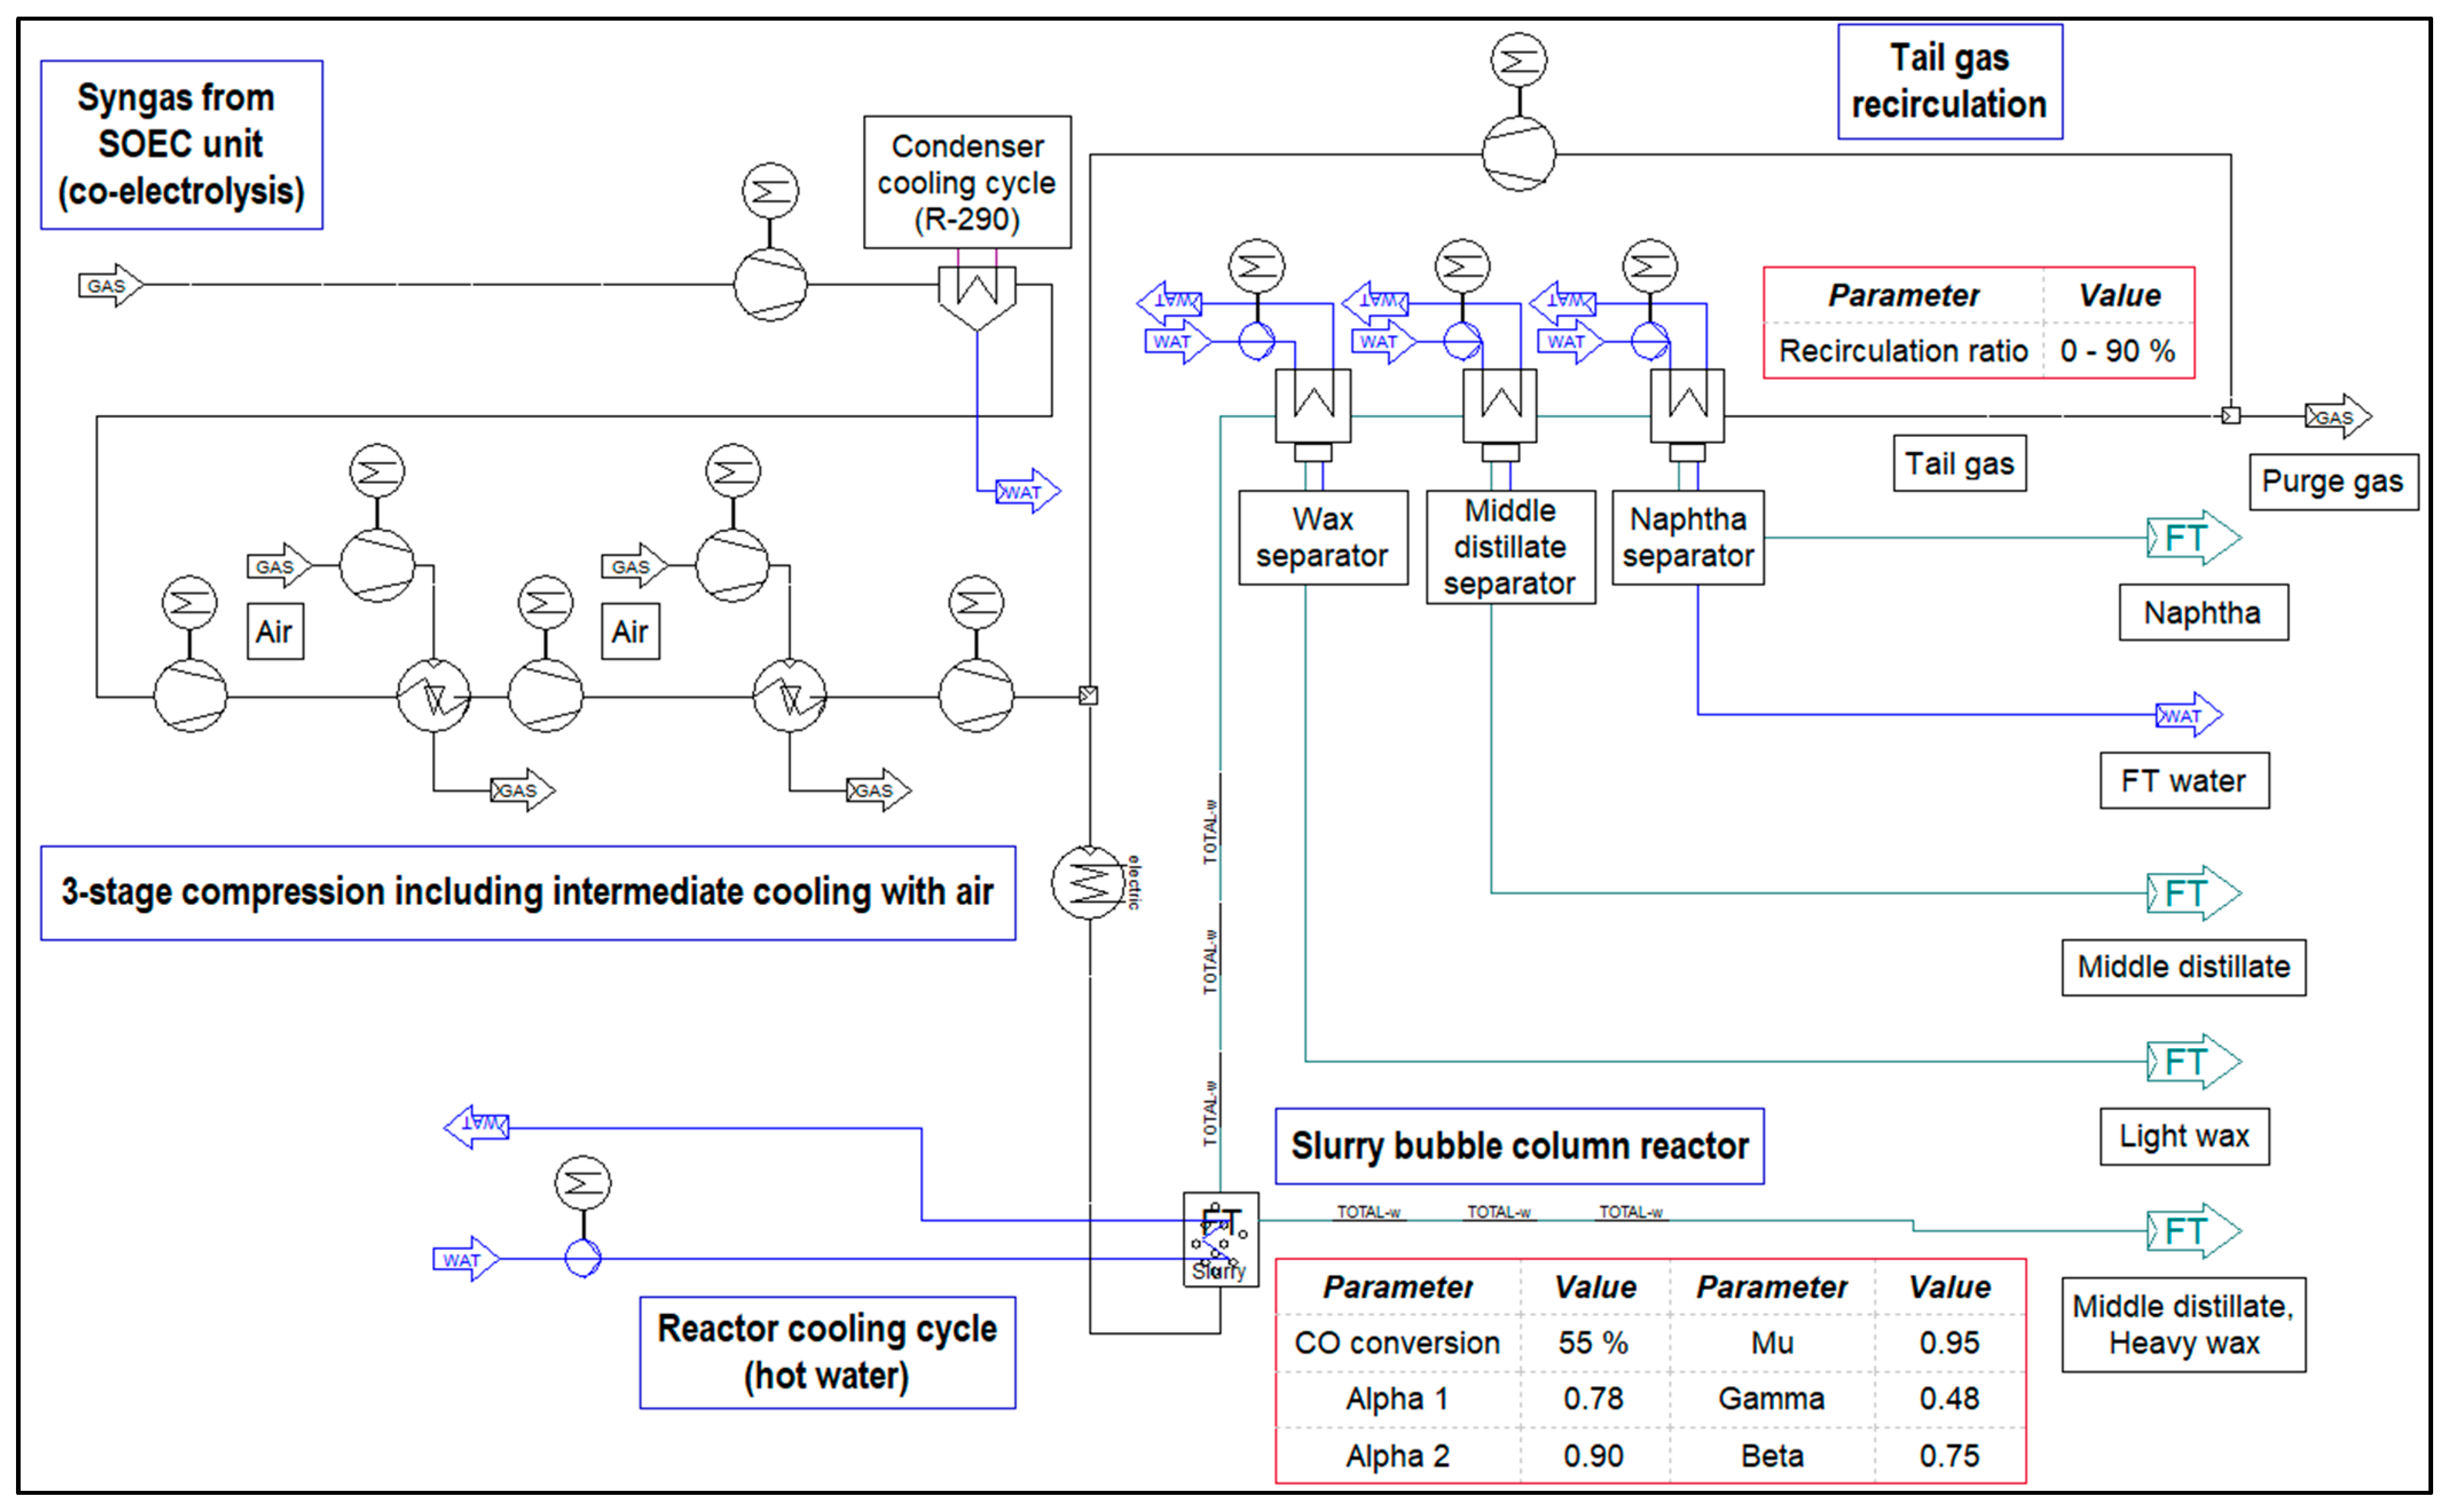
2.3.3. Chemical Conversion

A CO conversion of XCO,Reactor = 55% was assumed for the Fischer–Tropsch reactor according to [43,44]. As stated previously, Co-based Fischer–Tropsch catalysts are not active for the rWGS reaction, and hence XrWGS,Reactor was set to 0%.

2.4. Products and Product Separation

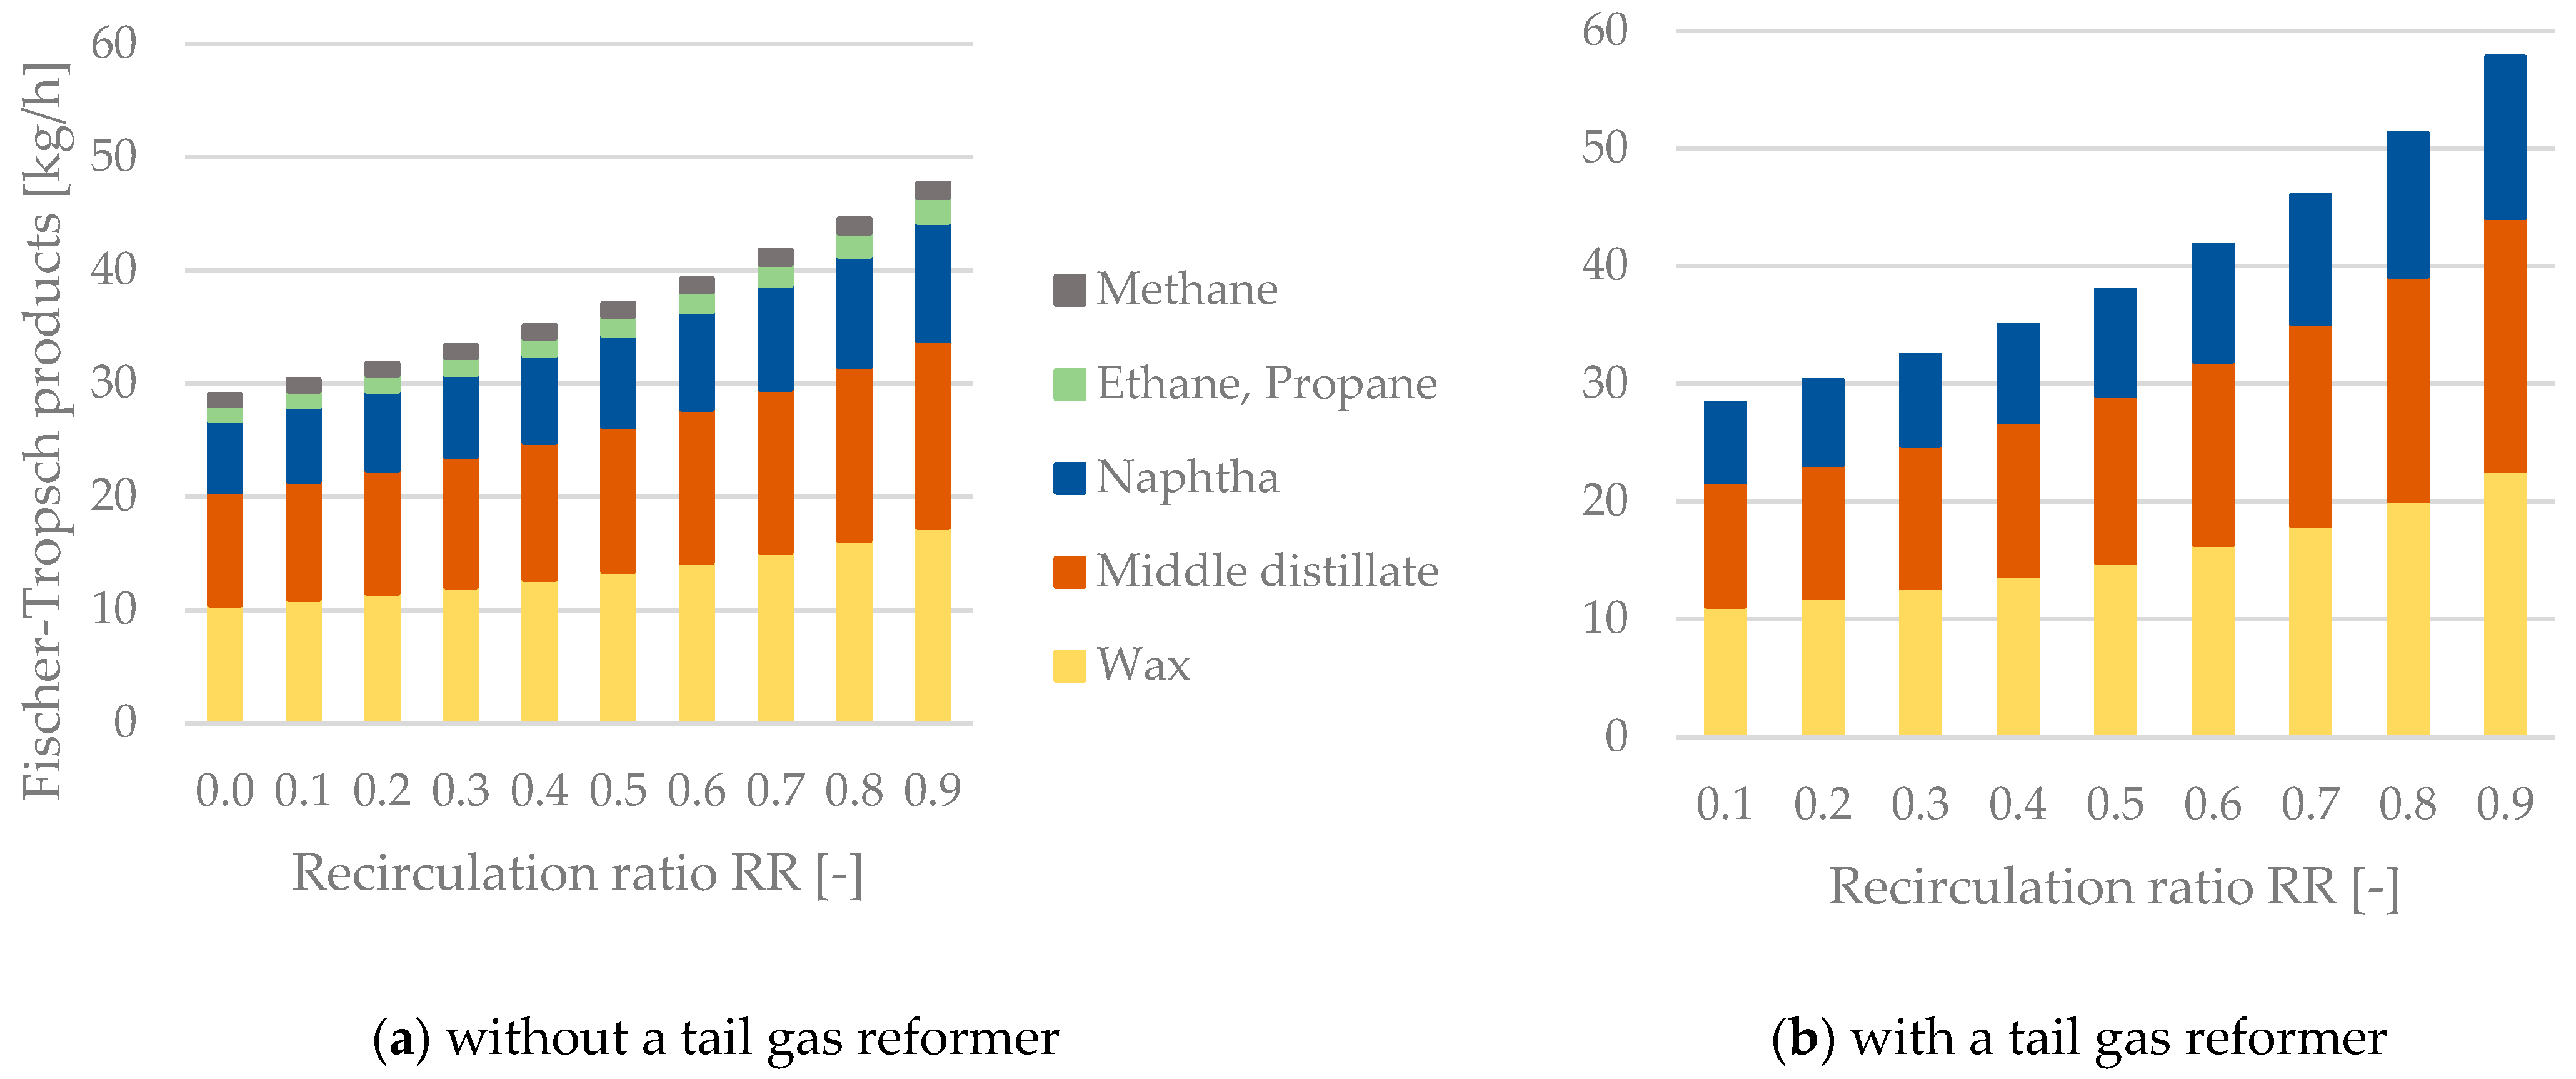
2.4.1. Fischer–Tropsch Products

As stated in Section 2.3, besides water only alkanes are considered as Fischer–Tropsch products. Table 3 shows the chosen division of product fractions based on the molecule’s number of carbon atoms.

2.4.2. Product Separation without Tail Gas Reforming

The separation of products without tail gas reforming is realized by a series of separators being cooled with pressurized water, as can be seen in Figure 1. To minimize the required power to repressurize the tail gas to pFT = 21 bar, the pressure level after the product separation step should be as high as possible while separating H2O and condensable hydrocarbons. Light waxes and the middle distillate fraction can be drained as liquids within a first separation step, whereas H2O, naphtha, methane, ethane and propane remain gaseous.

2.4.3. Product Separation with Tail Gas Reforming

Since the reforming of tail gas is favored at low-pressure levels, as explained in Section 2.6, the separation of products can be realized by serial flash distillation, as depicted in Figure 2. Light waxes, the middle distillate, the naphtha fraction and H2O, are gradually separated by depressurizing the gas mixture to a pressure level of pReformer = 1.2 bar, including an excess of 0.2 bar to overcome downstream heat exchanger units.

2.5. Tail Gas Recirculation

The recirculation of tail gas is a profound method with which to increase the overall conversion of CO for chemical plants based on syngas as a precursor, going hand in hand with an increase in the synthesized products and hence the plant’s PtL efficiency. The recirculation ratio RR is defined as the mass flow rate of recirculated tail gas divided by the total mass flow rate of tail gas (Equation (9)). To avoid the accumulation of CO2 and CH4 in the recirculated tail gas, a share of the stream needs to be drained from the system as purge gas. For the process configuration including tail gas reforming, the purge gas is combusted to heat the recirculated tail gas to the reformer’s operating temperature of 850 °C.
RR = m Tail   gas , Rec . m Tail   gas , Total ,

2.5.1. Process Configuration without Tail Gas Reforming

Since the separation of products is realized under synthesis pressure, only one additional compressor is required to compensate for the separator’s pressure drops, and the recirculated tail gas can be inserted before the Fischer–Tropsch reactor, as shown in Figure 1.

2.5.2. Process Configuration with Tail Gas Reforming

As illustrated in Figure 2, the purge gas is combusted to heat the recirculated tail gas to the reformer’s temperature of TReformer = 850 °C. Before the reformer, a water injector can be installed to add an extra degree of freedom to manipulate the chemical reactions inside the tail gas reformer. An additional heat exchanger after the reformer is required to cool the gas stream before it is inserted prior to the syngas condenser, removing non-converted water of the co-electrolysis process and excess water leaving the reformer. It is recommended to utilize the transferred heat for preheating and evaporating the SOEC’s water input. A maximum value of RRmax. = 0.9 was defined to ensure the heating of recirculated tail gas to the reformer’s temperature level. In addition, the limitation of RR to 0.9 secures the comparability of process configurations with and without a tail gas reformer.

2.6. Tail Gas Reforming

The tail gas reformer was modeled as a Gibbs reactor with the “Equilib” model of FactSage version 8.1, reforming the tail gas in accordance with the chemical equilibrium at a temperature of TReformer = 850 °C and a pressure of pReformer = 1.2 bar. A sufficient residence time inside the reactor was assumed to ensure the realization of chemical equilibrium. The following chemical reactions were assumed to have the highest impact on the reformer’s performance.
CO2 + H2 ↔ CO + H2O, ΔHr = +41.2 kJ/mol
The rWGS reaction (Equation (10)) has its chemical equilibrium at a temperature of around 800–850 °C, as sufficient conversion rates exist at temperatures surpassing 800 °C and are not affected by a change in pressure. The addition of H2 favors the conversion of CO2, whereas H2O inside the feed stream mitigates the CO2 conversion [51].
CH4 + H2O ↔ CO + 3 H2, ΔHr = +206.2 kJ/mol
CH4 + CO2 ↔ 2 CO + 2 H2, ΔHr = +247.0 kJ/mol
C2H6 + 2 H2O ↔ 2 CO + 5 H2, ΔHr = +356.8 kJ/mol
C3H8 + 3 H2O ↔ 3 CO + 7 H2, ΔHr = +512.2 kJ/mol
Equations (11)–(14) show the underlying chemical reactions of the steam reforming of methane, ethane and propane. To boost the conversion of short-chain hydrocarbons, the addition of H2O into the tail gas stream was considered but was not realized in the process simulation, since the H2O demand of Equations (11)–(14) can be fully covered by the formed H2O due to the rWGS reaction (Equation (10)). After the principle of Le Chatelier, the reforming of short-chain hydrocarbons by steam is enhanced with a high temperatures, low pressure and high share of water inside the stream [19].
CO + 3 H2 ↔ CH4 + H2O, ΔHr = −206.2 kJ/mol
CO2 + 4 H2 ↔ CH4 + 2 H2O, ΔHr = −165.0 kJ/mol
The methanation via CO (15) and CO2 (16) hydrogenation should be avoided, since CH4 is a product of the Fischer–Tropsch synthesis, and hence reduces the Fischer–Tropsch reactor’s productivity. After Le Chatelier, the formation of CH4 can be reduced by a low pressure level inside the reformer and the addition of steam at the reactor’s inlet [52].
In summary, to maximize the conversion of CO2 and short-chain hydrocarbons, the tail gas reformer should be operated at a high temperature and low pressure. The addition of H2 would favor the conversion of CO2 according to the rWGS reaction (Equation (10)). However, this would conclude in high shares of short-chain hydrocarbons after the reformer (Equations (15) and (16)), and was hence not included. A high share of steam inside the tail gas stream lowers the conversion of CO2 but is essential to reform hydrocarbons according to Equations (11), (13) and (14).

2.7. Power-to-Liquid Efficiency and Plant Efficiency

The Power-to-Liquid efficiency ηPtL is defined as the chemical energy stored in products divided by the system’s total electric power input. Two different efficiency rates were defined to be able to directly compare process routes with and without tail gas reforming: Firstly, the PtL efficiency excluding methane, ethane and propane (17); and secondly, the plant efficiency including methane, ethane and propane (18).
η PtL = j m j · LHV j P el . , Total ,   j =   [ naphtha ,   middle   distillate ,   wax ]
η Plant = k m k · LHV k P el . , Total ,   k =   [ CH 4 ,   C 2 H 6 ,   C 3 H 8 ,   naphtha ,   middle   distillate ,   wax ]

2.8. Utilization of Purge Gas

To avoid the accumulation of CO2 and short-chain hydrocarbons, i.e., methane, ethane and propane, a share of the tail gas needs to be drained from the system as purge gas. Either this gas stream can be used for downstream synthesis processes, or the stream’s chemical energy can be utilized to evaporate H2O or heat the recirculated tail gas when using a tail gas reformer.

3. Results

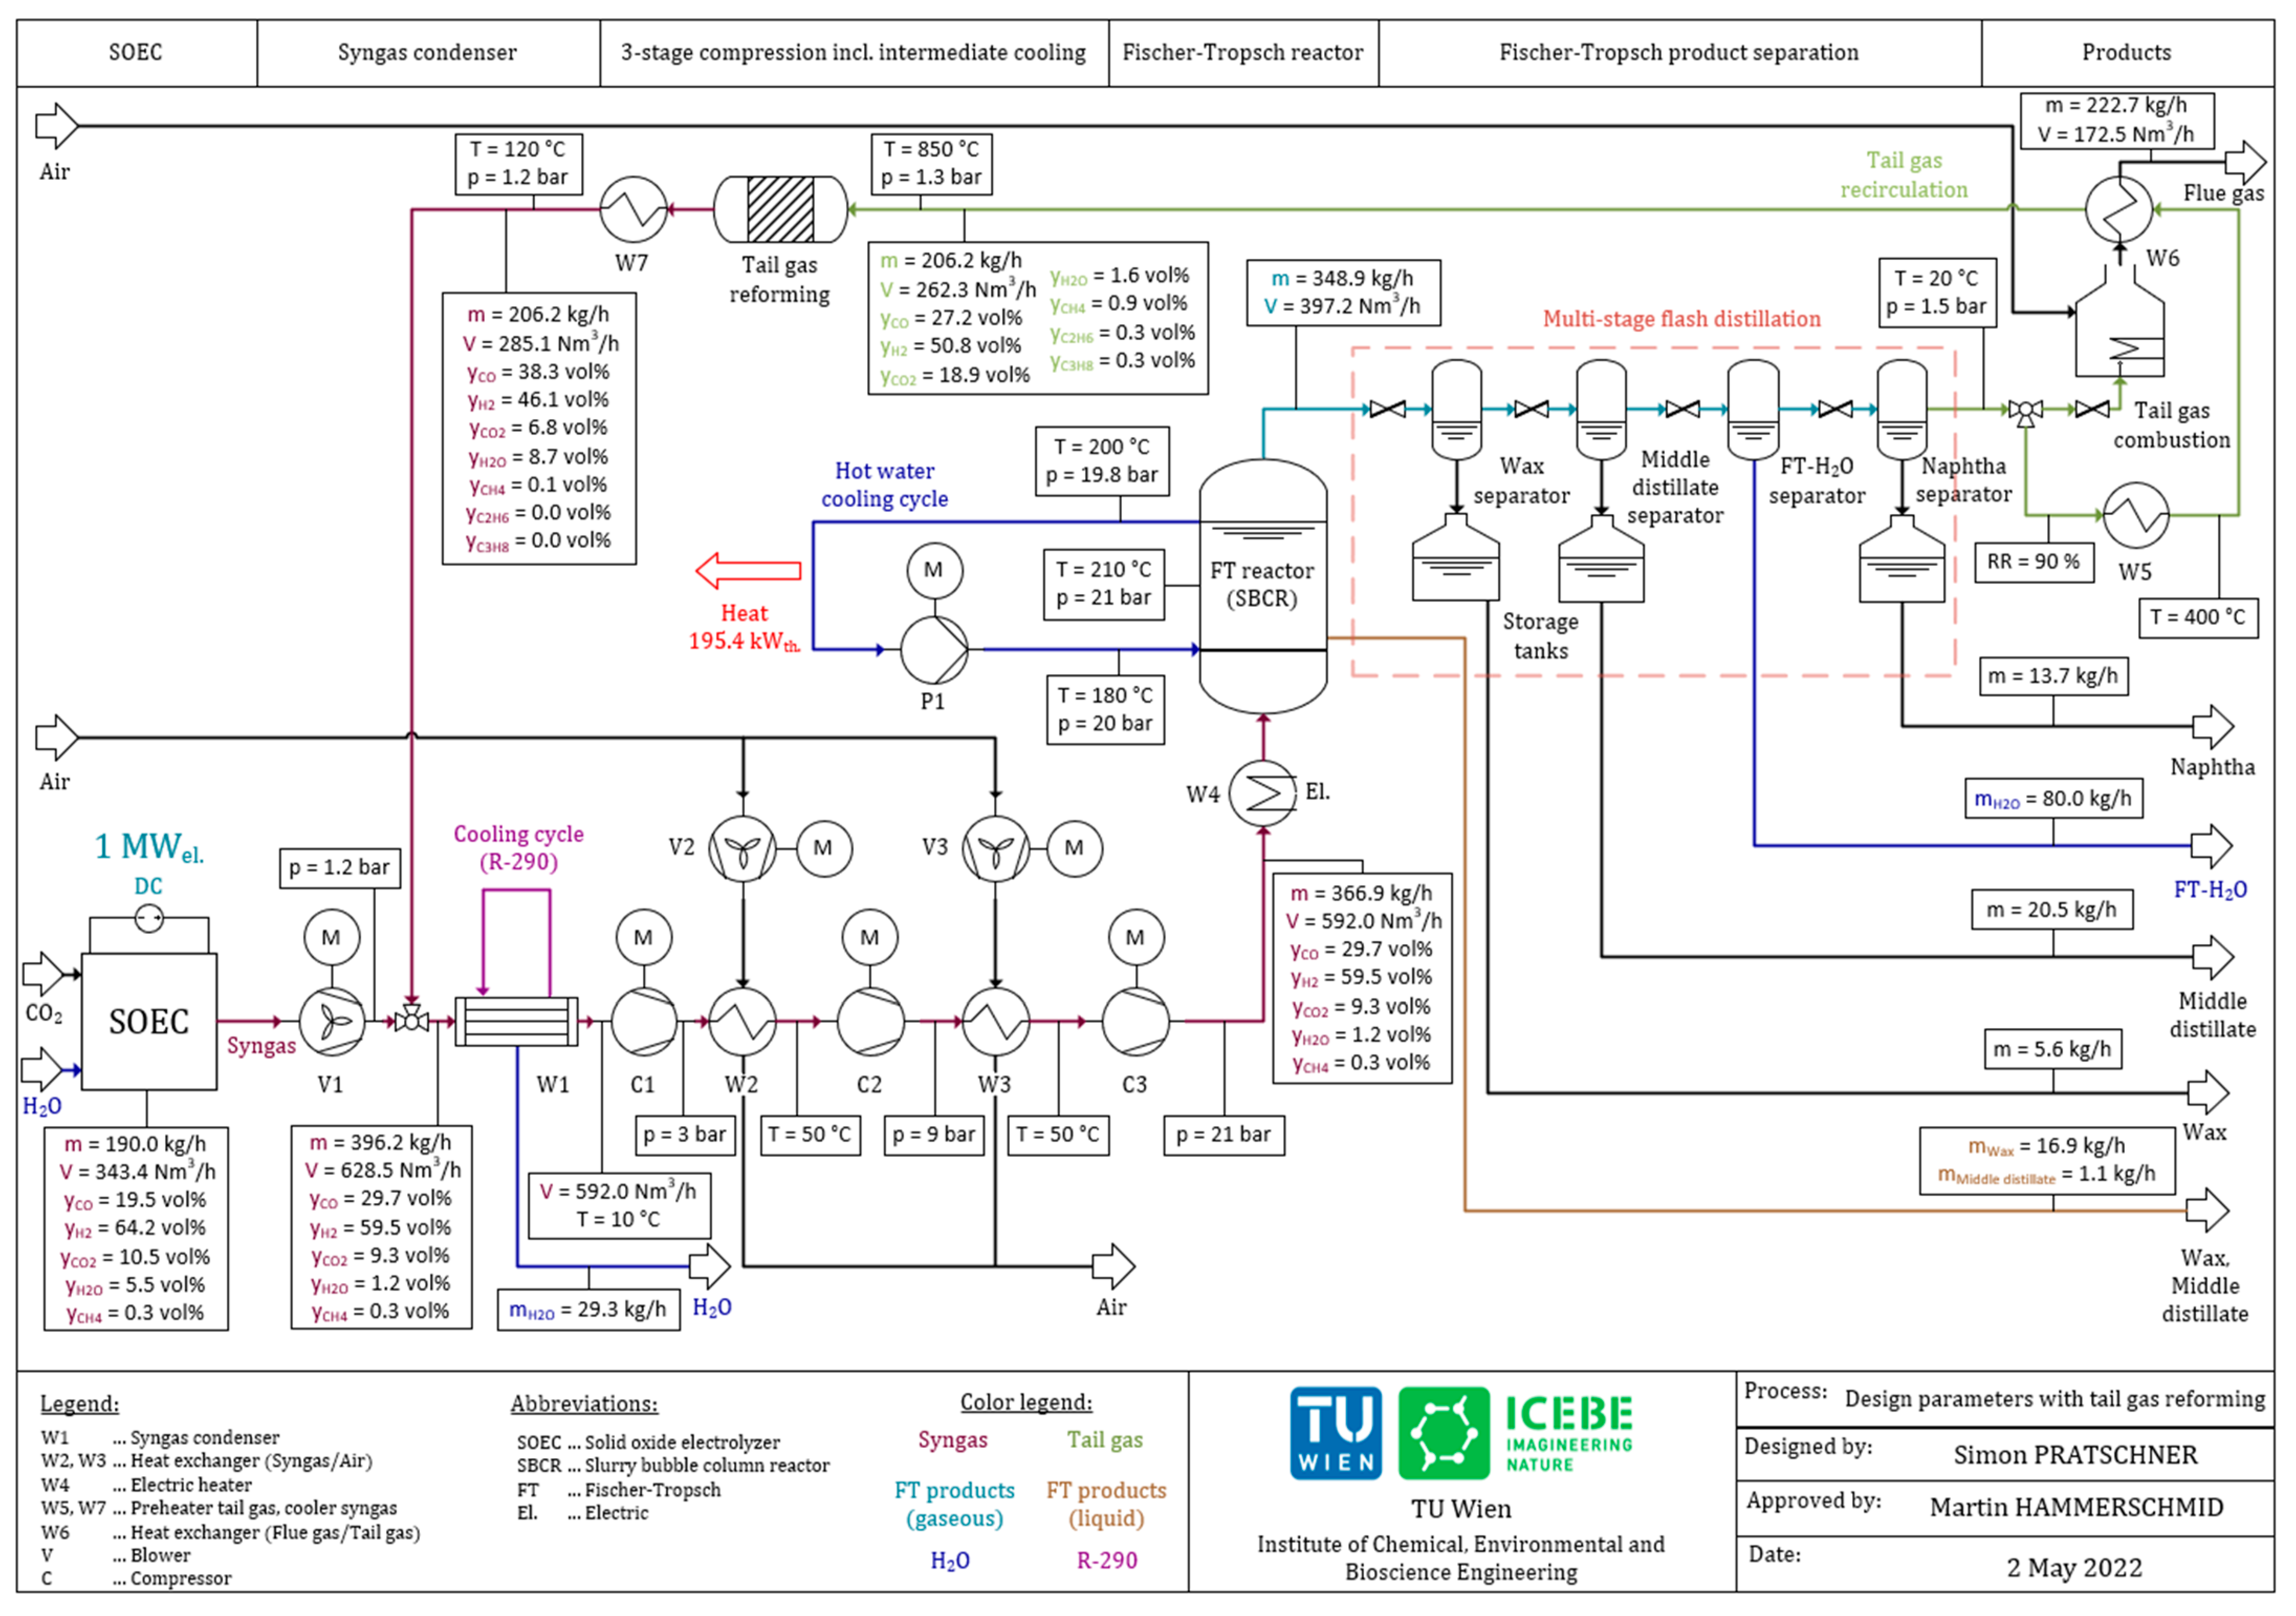
3.1. Recommended Design Parameters for a Pilot Scale Power-to-Liquid Plant

The recommended design parameters for the provided configurations of a Power-to-Liquid plant with and without a tail gas reformer, as illustrated in Figure 1 and Figure 2, are presented within this section. The shown mass flow rates, volume flow rates, temperature levels, pressure levels and stream compositions are based on the parameters listed in Table 3 and a recirculation ratio of tail gas of RR = 90%. Figure 5 shows the obtained design parameters for the process configuration without a tail gas reformer.
Figure 6 shows the recommended design parameters of a pilot scale Power-to-Liquid plant for the process configuration including a tail gas reformer based on the parameters listed in Table 3 and a recirculation ratio of RR = 90%.
The plant’s parameters, e.g., Power-to-Liquid efficiency, Fischer–Tropsch products and CO conversion, are analyzed within the following sections.

3.2. Fischer–Tropsch Synthesis—Products and Reaction Heat

The mass flow rates and distributions of the produced hydrocarbons, the produced Fischer–Tropsch water and the reaction heat are analyzed in this section. According to Table 3, the product fractions are divided into methane, ethane, propane, naphtha, middle distillate and wax. Table 4 summarizes the findings concerning the mass flow rates of Fischer–Tropsch products and the released reaction heat for process configurations with or without a tail gas reformer. The once-through configuration can be seen as a basic scenario with no recirculation of tail gas. As expected, high values of the recirculation ratio led to a significant rise in the obtained product streams. Without a tail gas reformer, a maximum mass flow rate of 47.8 kg/h could be realized. The integration of a tail gas reformer resulted in a maximum achievable product stream of 57.8 kg/h. However, this came at the price of combusting the purge gas, making it unavailable for potential downstream applications.
Figure 7 depicts the rise in hydrocarbons obtained with an increase in the recirculation ratio. In general, the mass flow rates of products rise exponentially with an increase in RR but show a significantly higher slope when including a tail gas reformer. As mentioned before, the purge gas needs to be combusted to heat the recirculated tail gas before the reformer. Hence, no methane, ethane or propane can be obtained when applying a tail gas reformer.

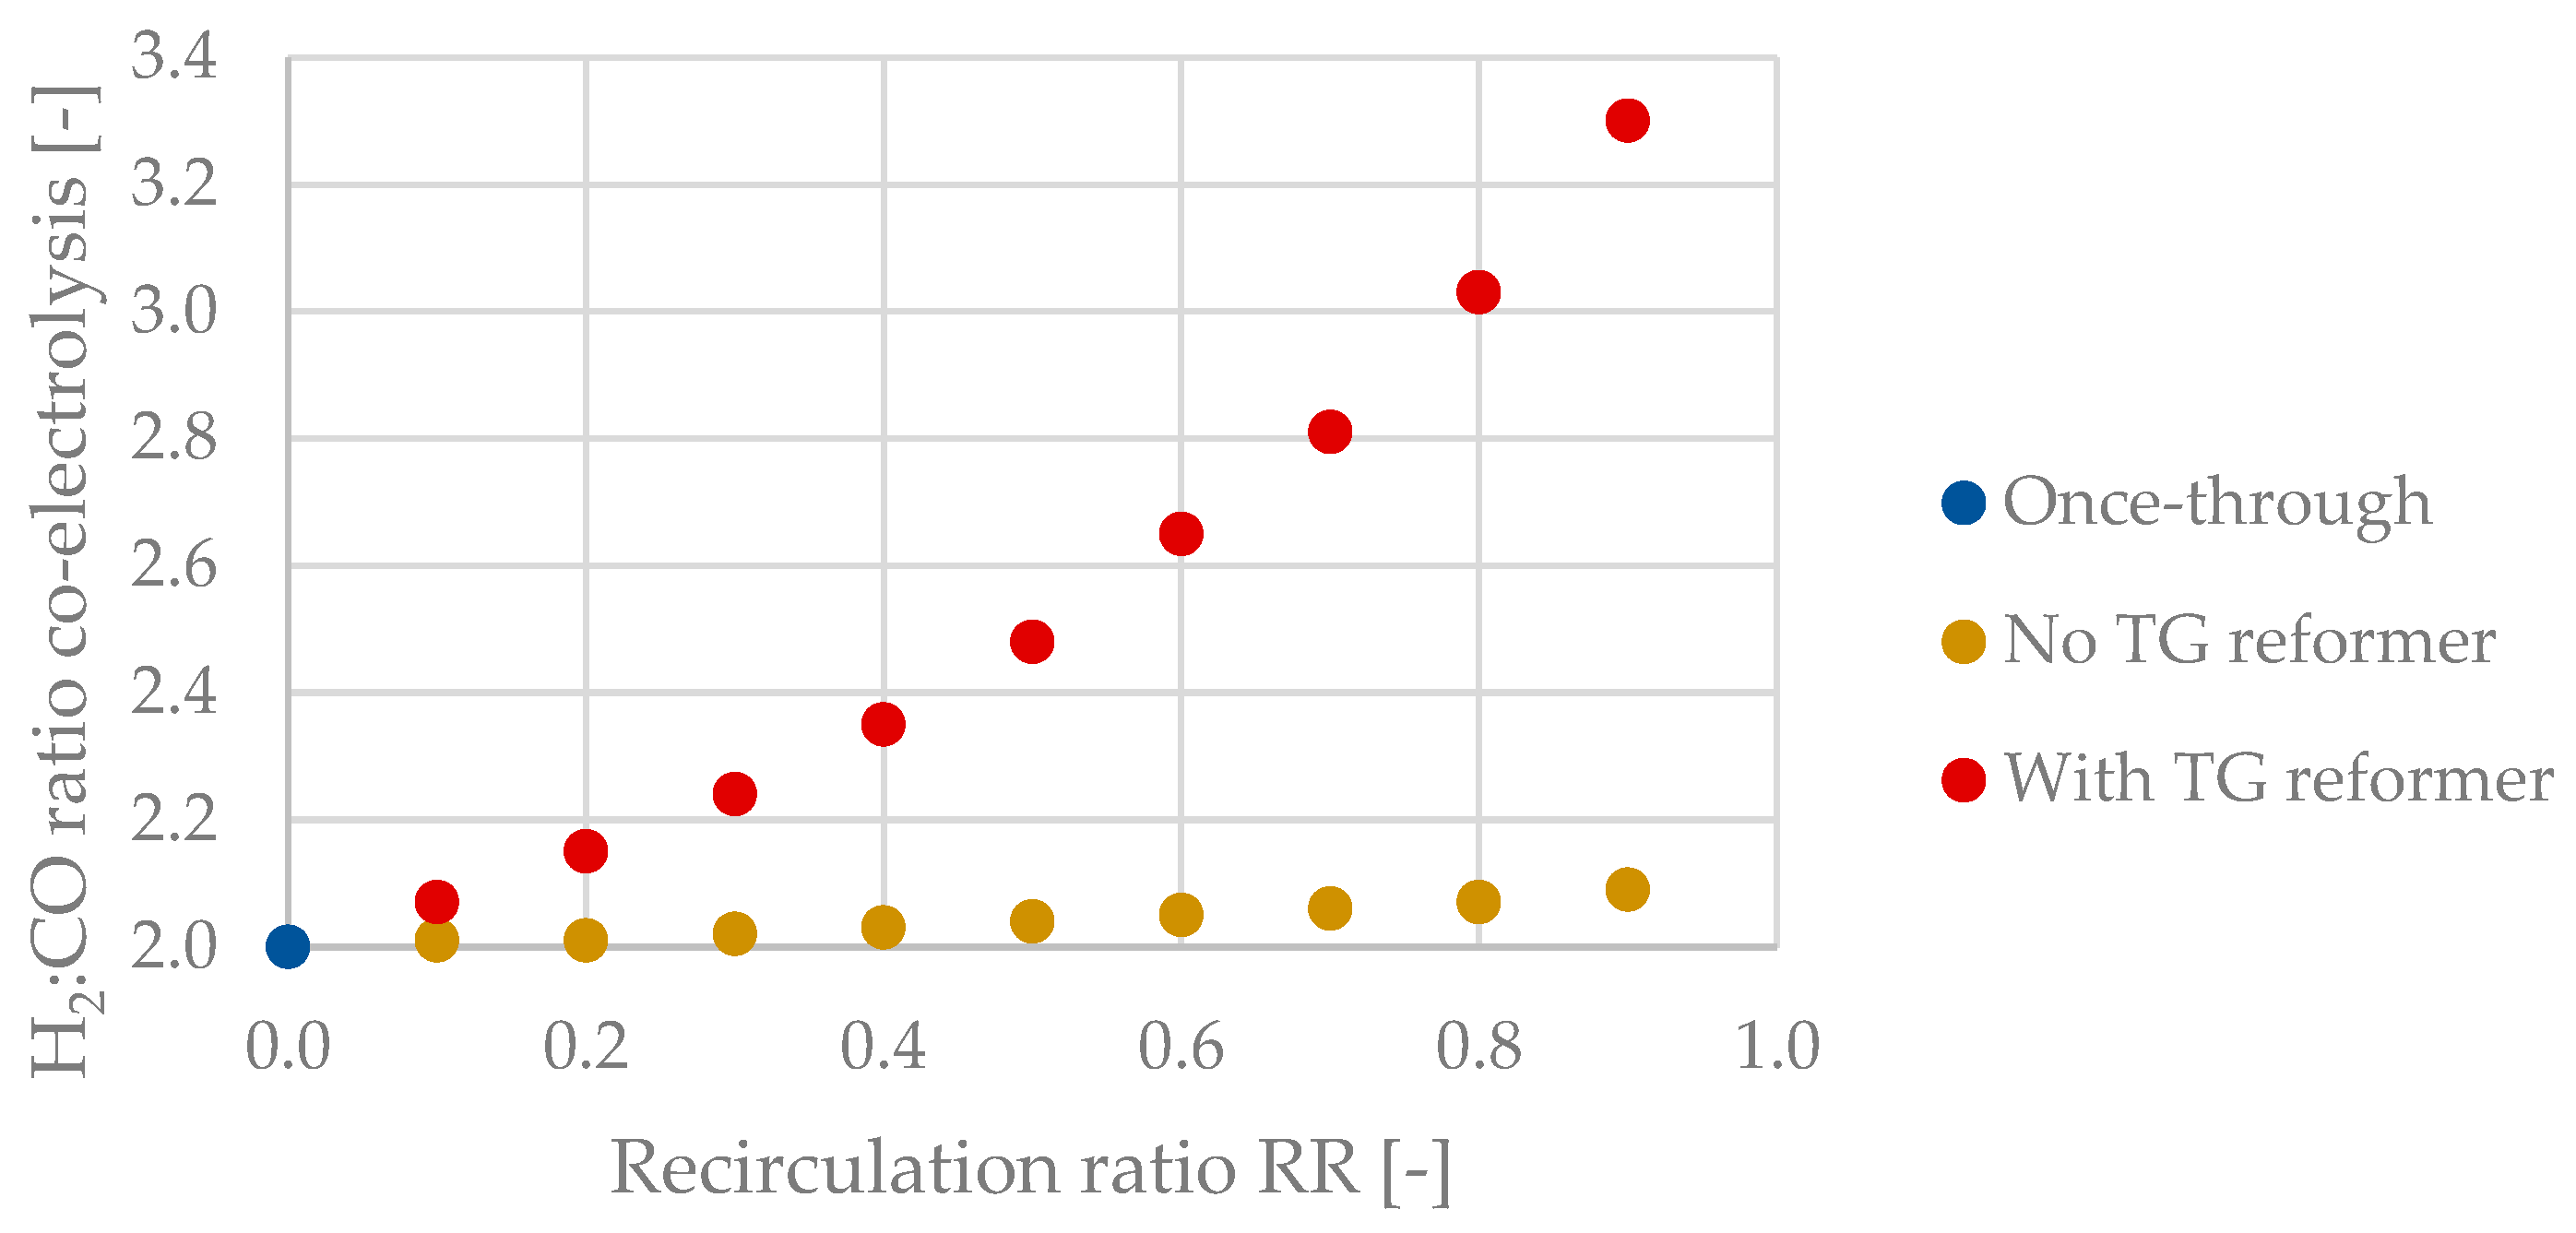
3.3. H2:CO Ratio of the SOEC (Co-Electrolysis) Unit
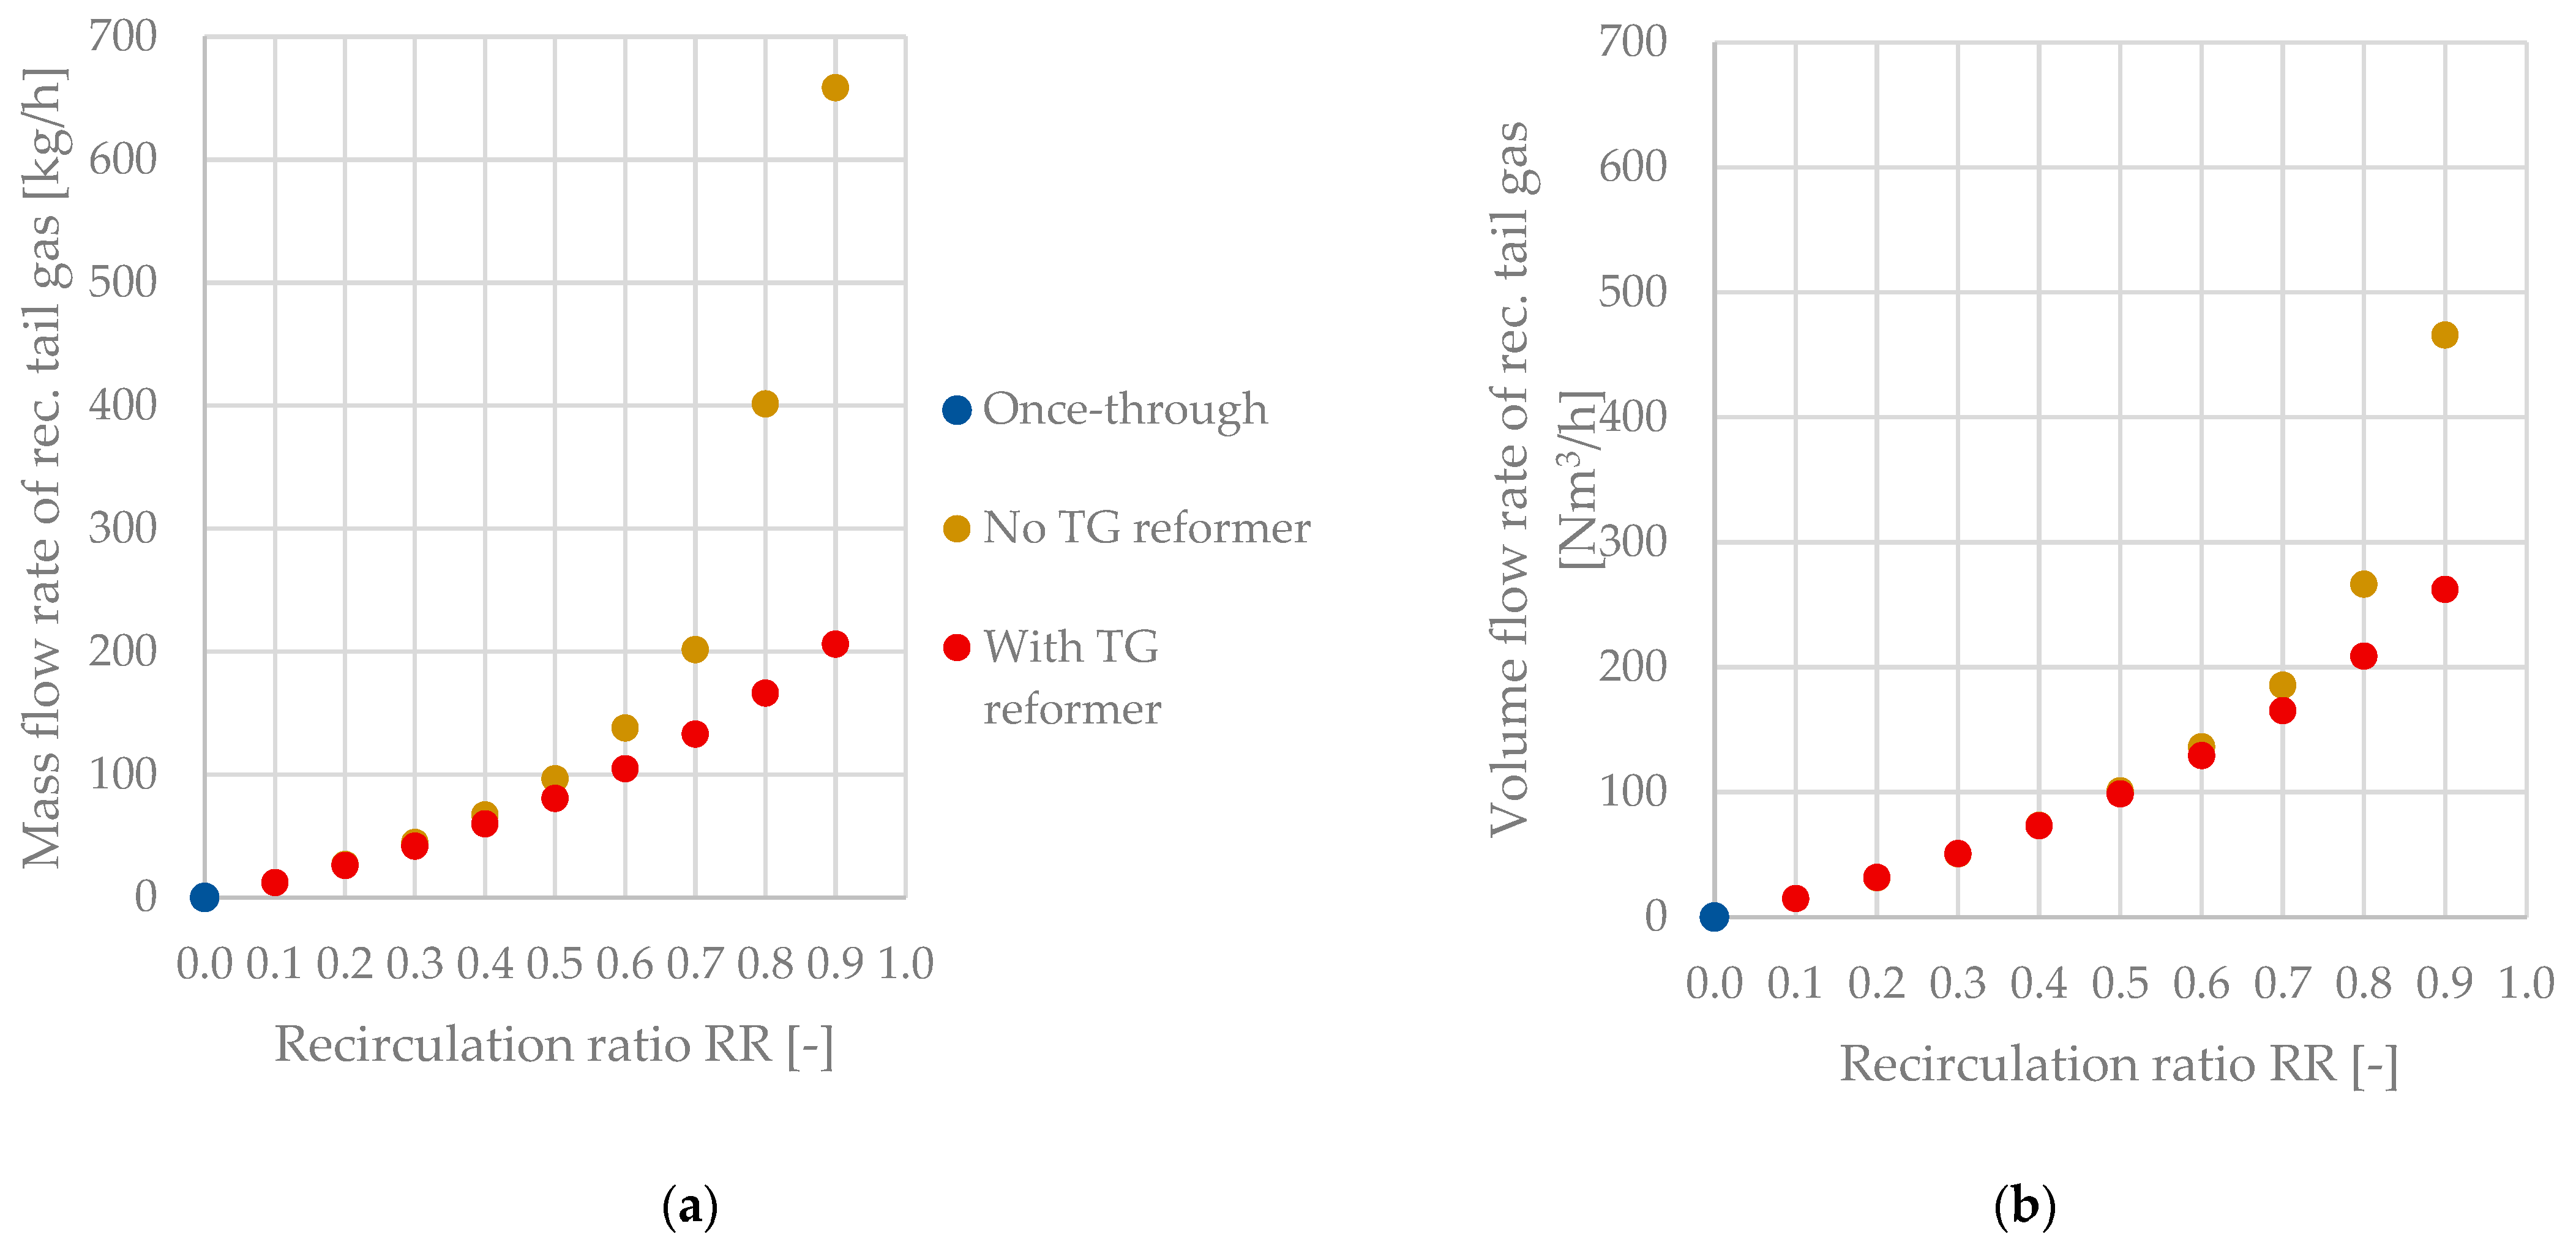
As explained in Section 2.1, the SOEC unit controls the reactor’s H2:CO ratio at H2:COFT = 2 by adjusting its H2:CO ratio. For process routes excluding tail gas reforming, H2:COSOEC does only change from 2.00 (RR = 0.0) to 2.09 (RR = 0.9), whereas H2:COSOEC increases to a value of 3.30 (RR = 0.9) when implementing the reforming of tail gas. A graphical display for H2:COSOEC as a function of RR is plotted in Figure 8.

3.4. Tail Gas

Analyzing the mass flow and volume flow rates, along with the composition of the recirculated tail gas stream, is critical to answering the posed questions and will be elaborated in detail in this section.

3.4.1. Mass Flow and Volume Flow Rates of recirculated Tail Gas

Figure 9 highlights the significant difference in the recirculated tail gas streams when comparing process configurations with and without tail gas reforming. The difference between the mass flow rates is negligible for RR < 0.5. However, the amounts of recirculated tail gas diverge rapidly as the recirculation ratio surpasses a value of 0.5. A maximum difference of 452.5 kg/h can be seen for a recirculation ratio of 0.9. This rapid growth for configuration B can be explained by the accumulation of CO2 inside the tail gas stream, as elaborated in Section 3.4.2. The differences appear to be less critical when analyzing the volume flow rates of recirculated tail gas with diverging values for recirculation ratios of 0.7 and higher.

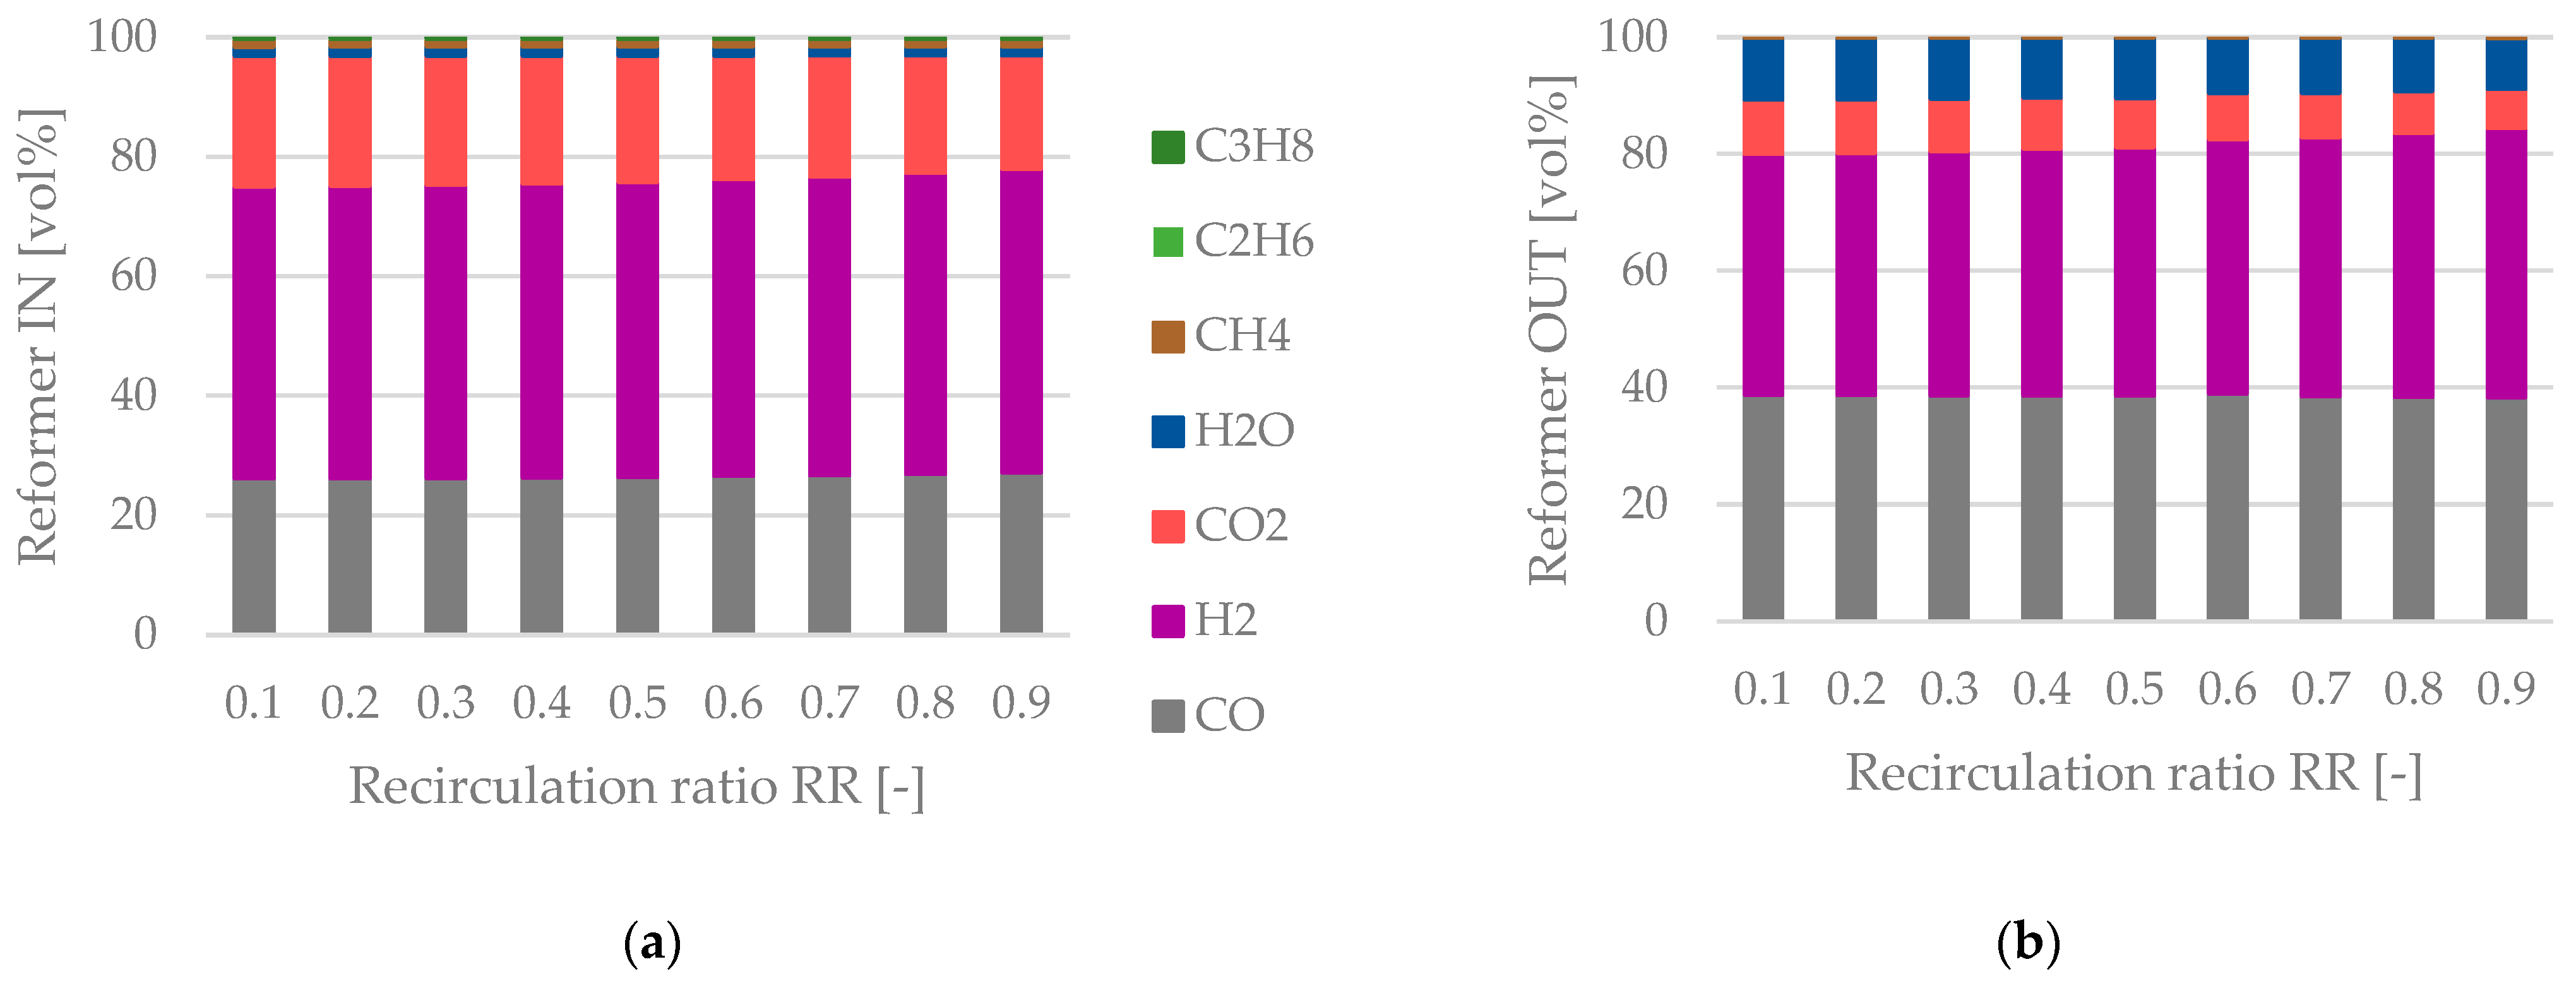
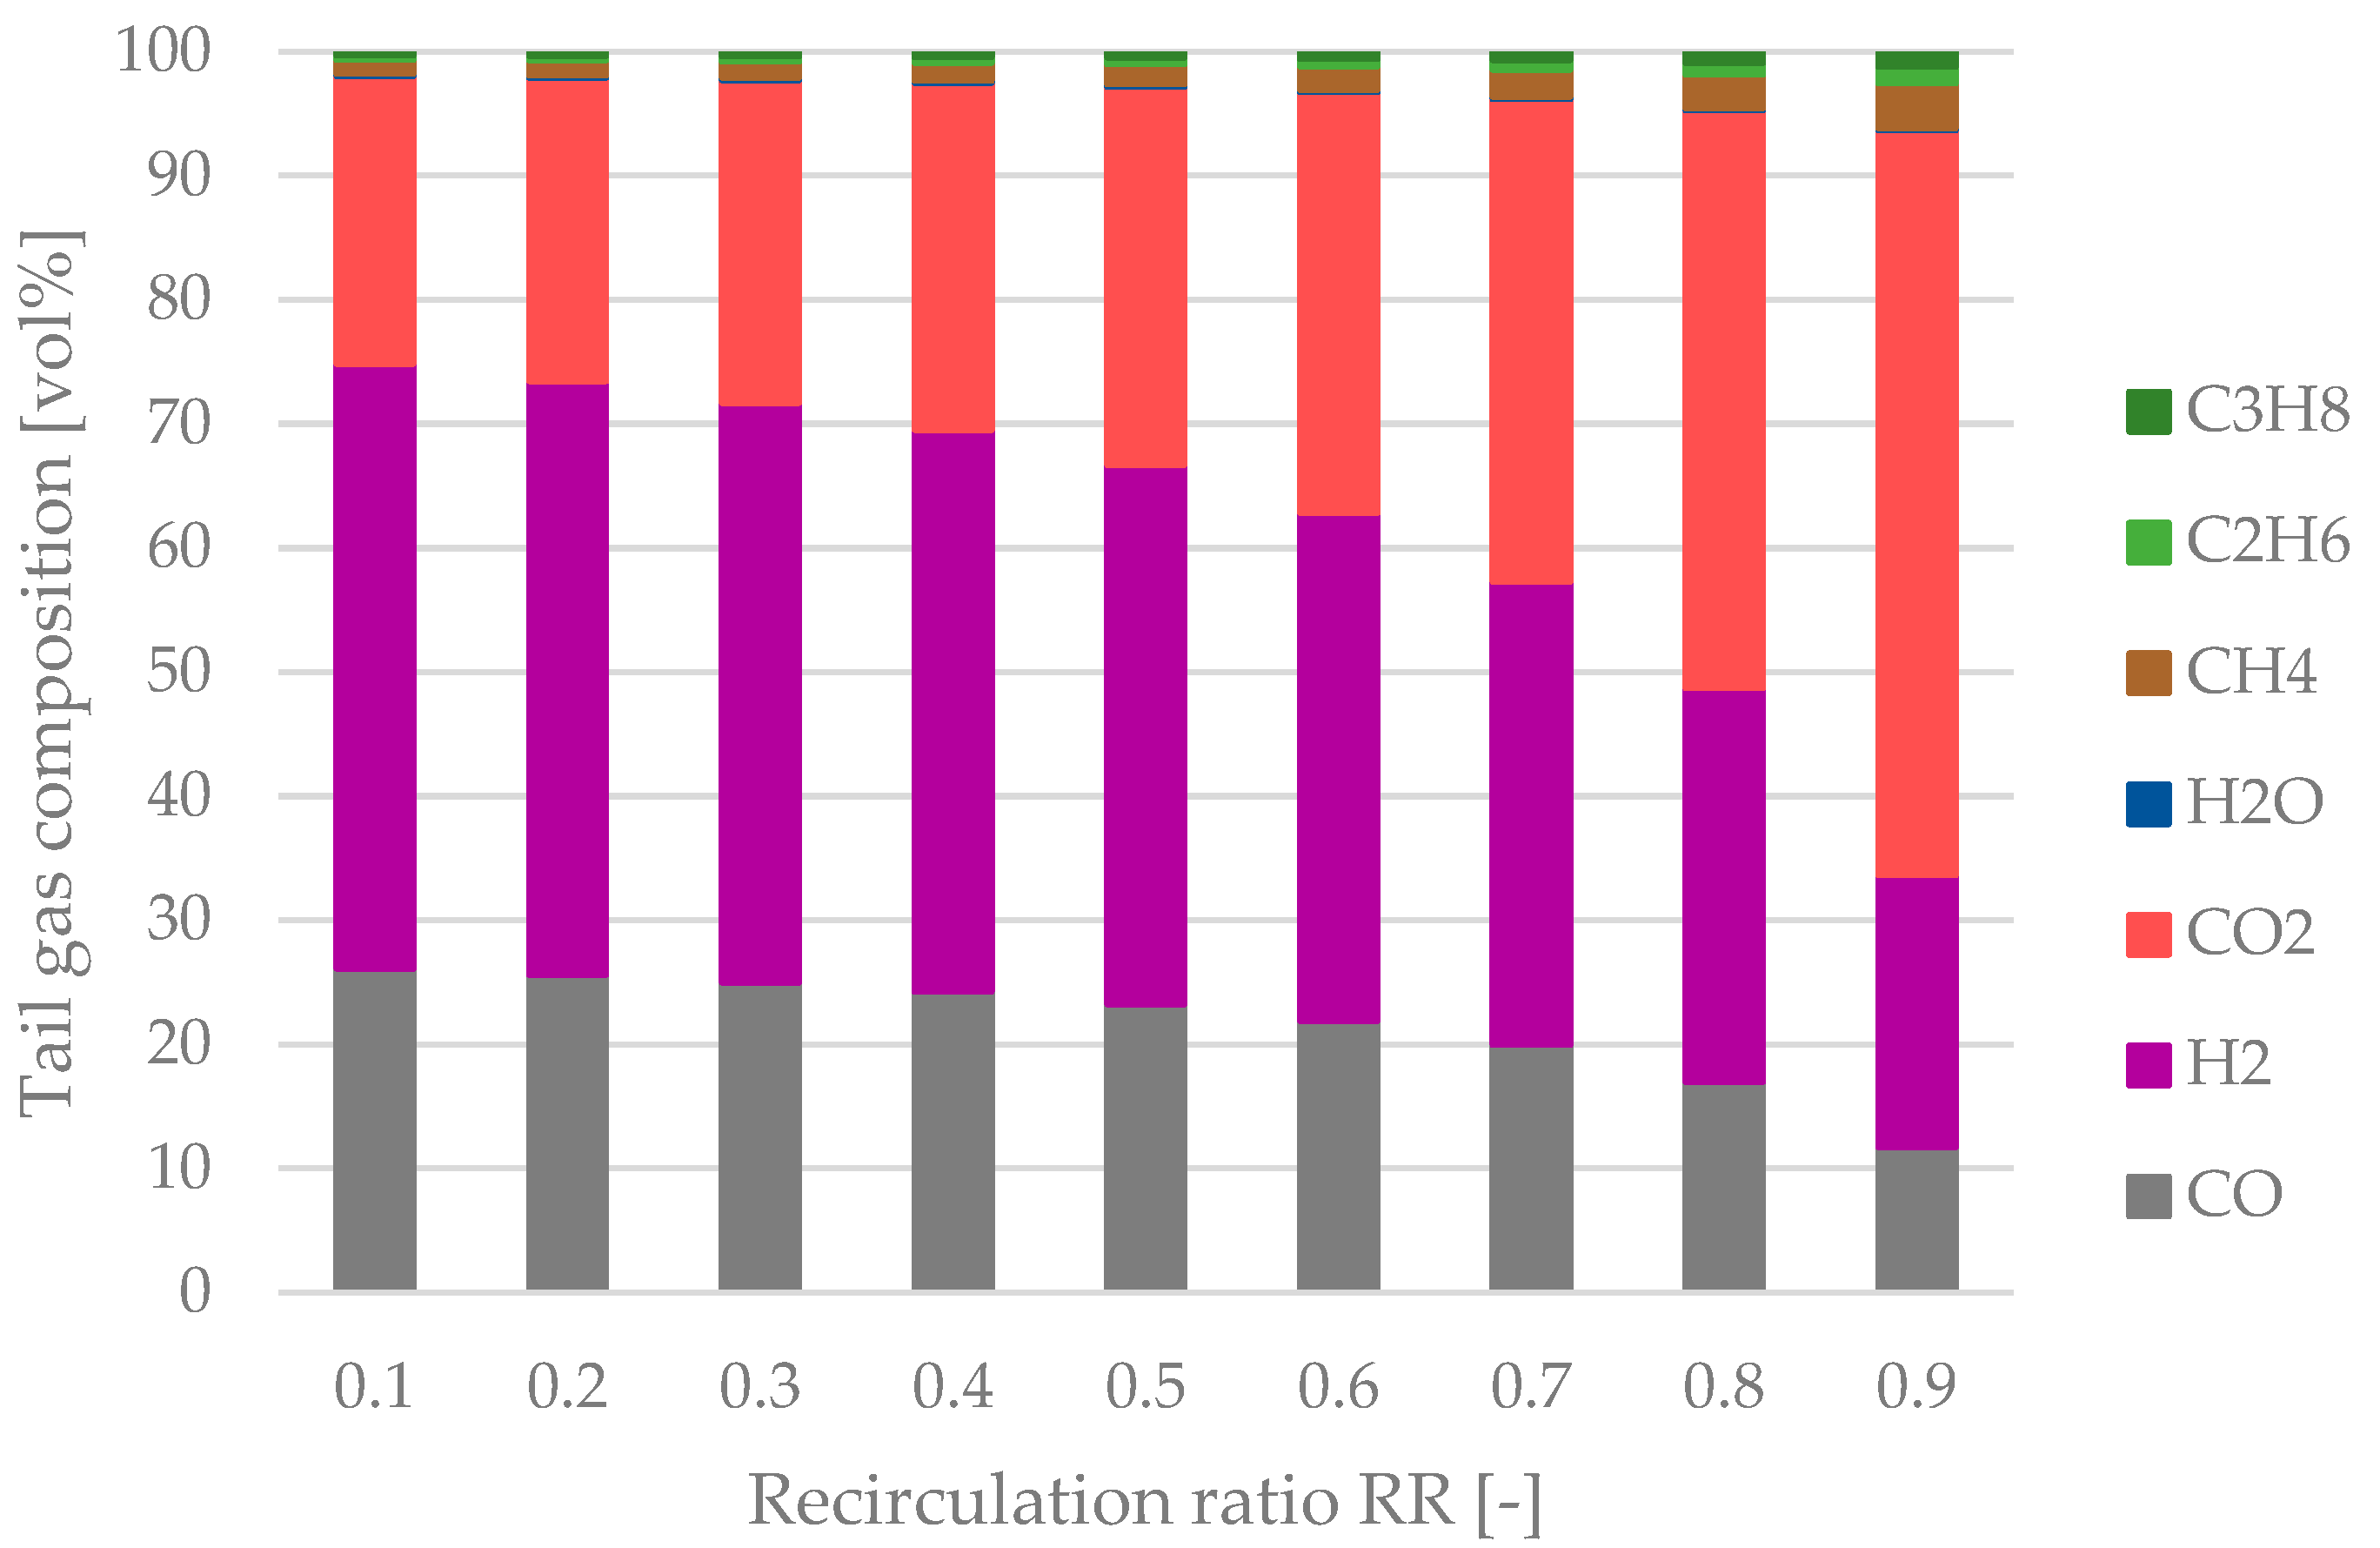
3.4.2. Composition of Tail Gas and Tail Gas Reforming

The tail gas leaving the product separation step consists of the following compounds:
  • Non-reacted reactants, i.e., CO and H2;
  • Inert gases, i.e., CO2;
  • Non-condensed products, i.e., CH4, ethane, propane and Fischer–Tropsch H2O.
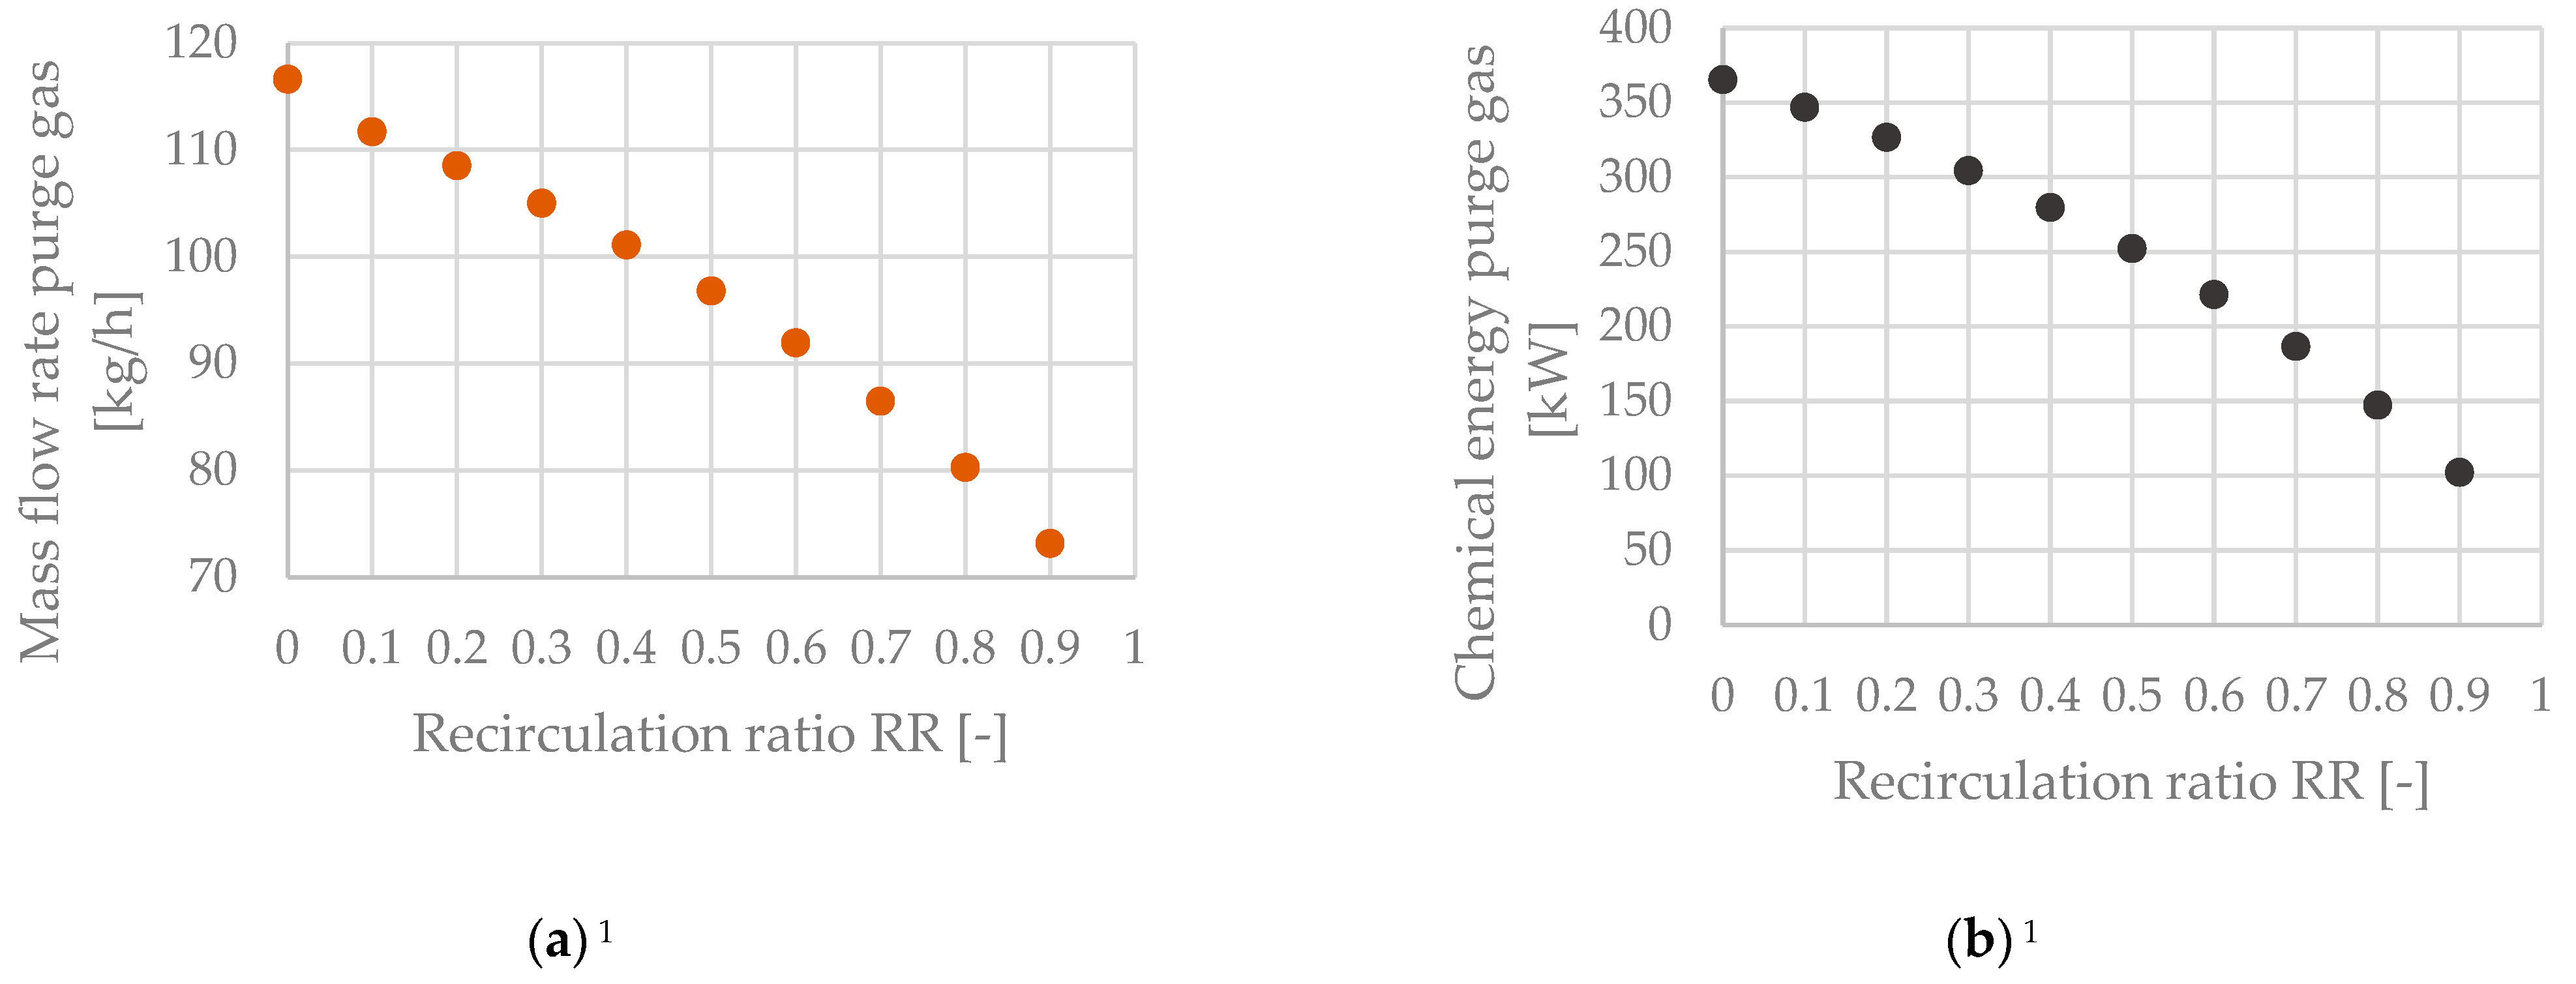
The tail gas compositions for the respective process configuration and recirculation ratio are stated in Table 5. Implementing a tail gas reformer reduces the shares of CO2, CH4, ethane and propane inside the tail gas stream significantly. A disadvantage is the increased percentage of water due to the reverse water–gas shift reaction.
The tail gas composition of the process route without a reformer as a function of the recirculation ratio is plotted in Figure 10. A significant rise in the share of CO2 can be seen after surpassing a recirculation ratio of 0.6. Non-condensable products, i.e., CH4, ethane and propane, also accumulate in the tail gas stream but are less crucial than CO2. The maximum share of yCO2 = 60.1 vol% inside the system can be seen at RR = 0.9.
The tail gas composition at the reformer’s inlet and outlet is plotted in Figure 11. A relative constant regime before and after the reactor can be noted. The share of CO at the reformer’s inlet remains almost constant, whereas the share of H2 increases slightly with a rise in the recirculation ratio. Small shares of gaseous hydrocarbons can be seen at the reactor’s inlet, which are almost entirely converted to H2 and CO inside the reformer. A significant increase concerning the share of H2O after the reformer occurs. Hence, the insertion of additional steam before the tail gas reformer is not beneficial. A sufficient amount of H2O is formed by the rWGS reaction inside the reformer (Equation (10)) to cover the H2O demand for the reforming of gaseous hydrocarbons.

3.5. Purge Gas

The combustion of purge gas is not necessary for process configurations without a tail gas reformer. Hence, the mass flow rate of purge gas and the stream’s chemical energy are important factors for designing potential downstream processes.
Figure 12 shows the mass flow rate of purge gas being drained from the system (Figure 12a) and the purge gas stream’s chemical energy (Figure 12b) as a function of the recirculation ratio RR. The mass flow rate of purge gas ranges from 116.6 to 73.2 kg/h. The stream’s chemical energy decreases disproportionately from 365.3 to 102.1 kW due to the stream’s increasing share of CO2 for an increase in the amount of recirculated tail gas.

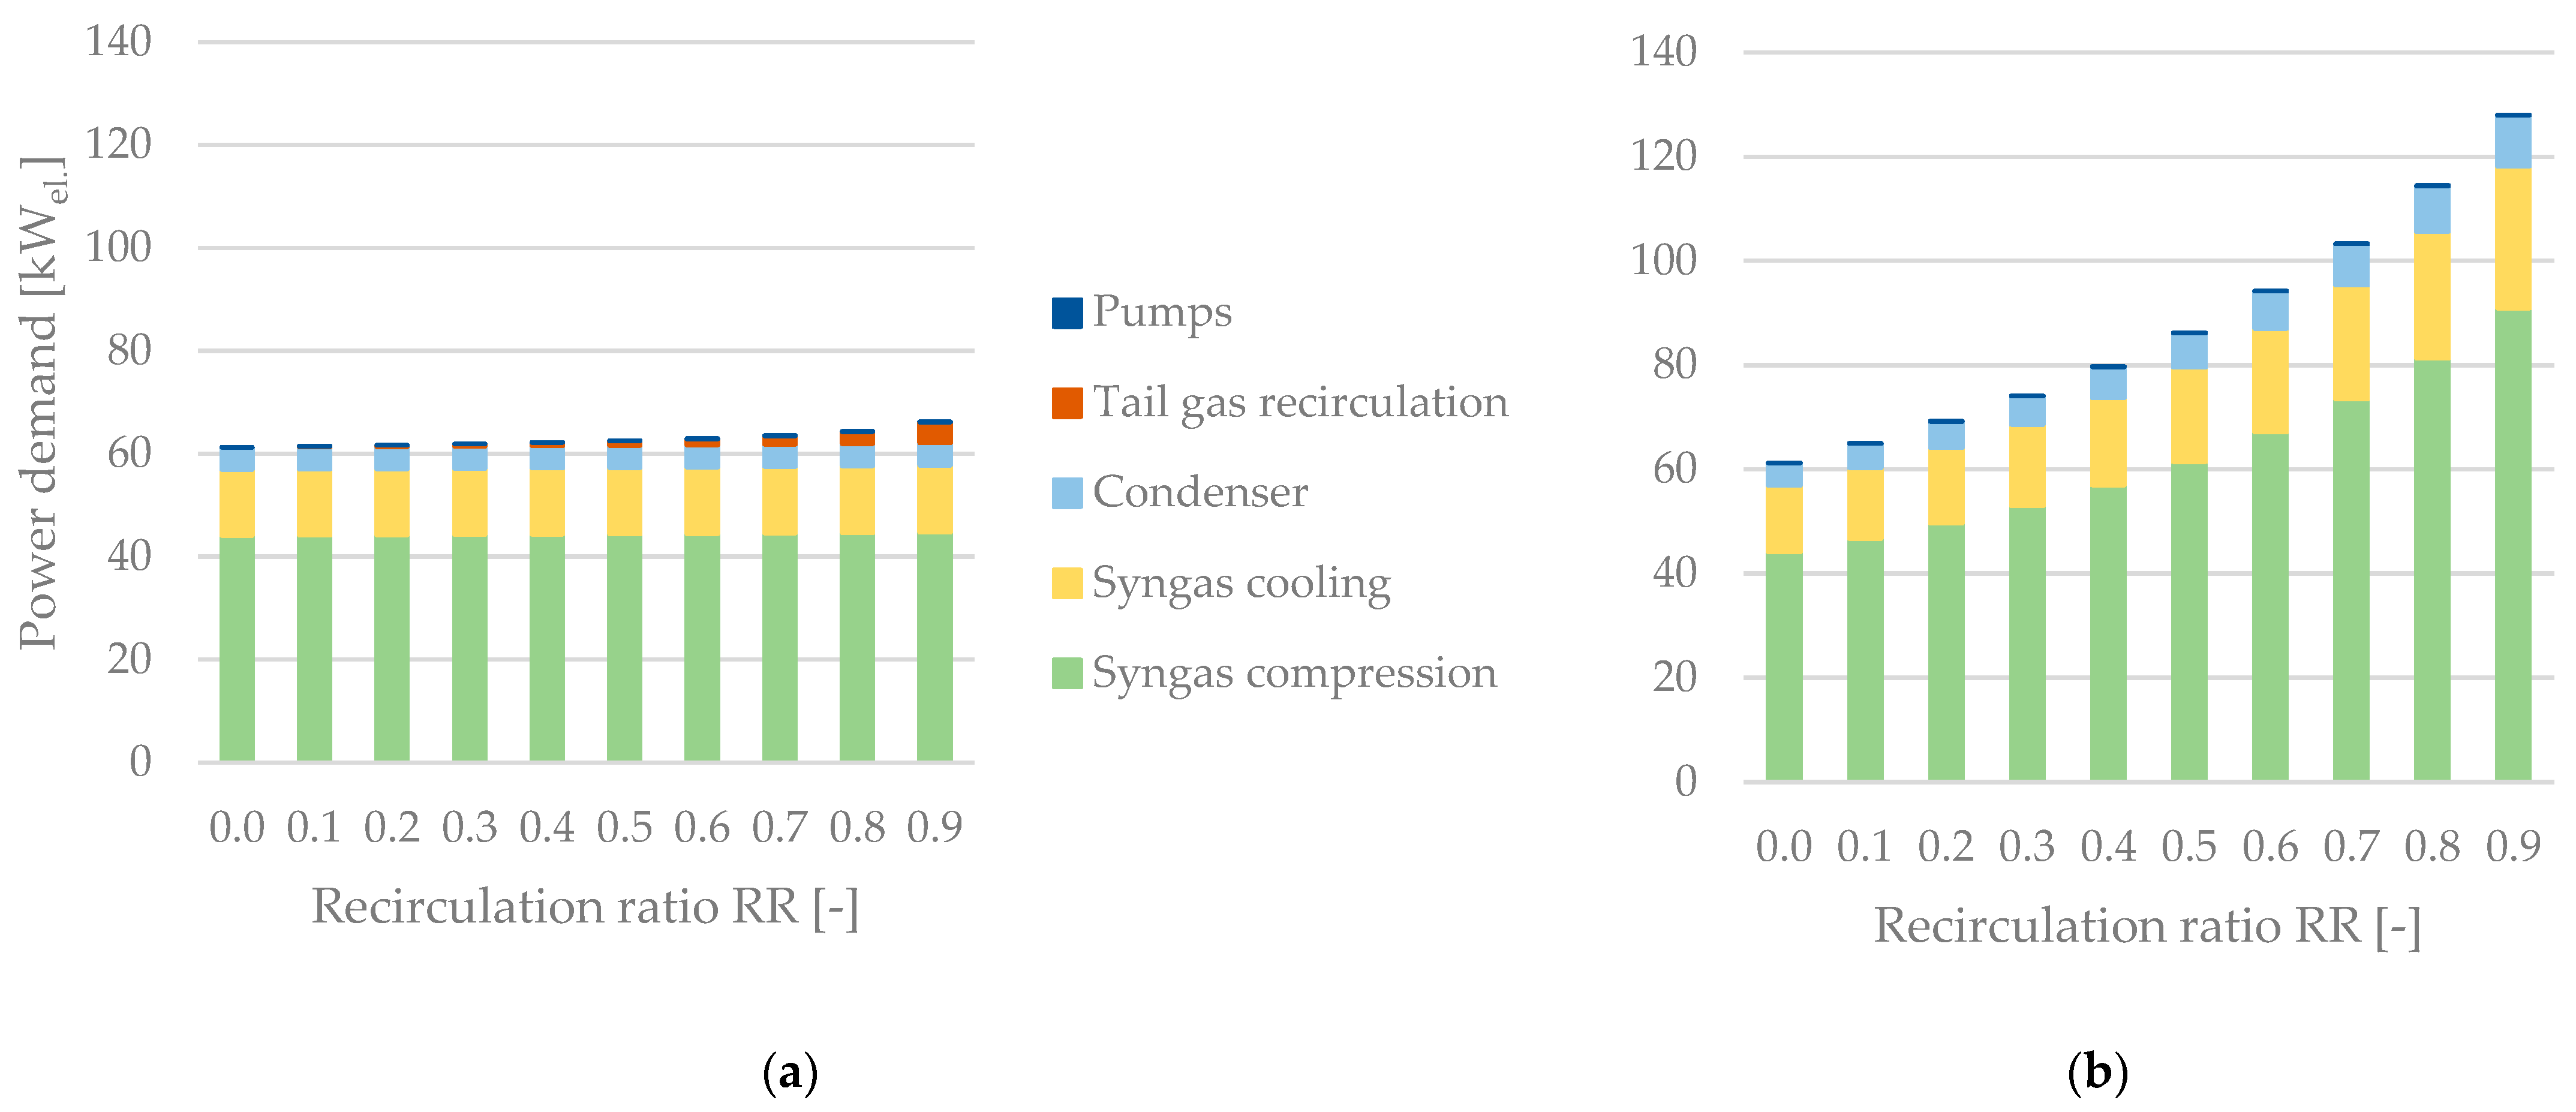
3.6. Power Demand of Auxiliary Equipment

The PtL plant’s auxiliary power demand includes all devices except the SOEC unit, i.e., compressors, blowers, the syngas condenser and pumps. Since the SOEC’s power input was set as constant, 1 MWel., the electricity demand of auxiliary devices defines the plant’s PtL efficiency, in combination with the product’s chemical energy. The following process steps require electricity:
  • Syngas compression;
  • Syngas condensing;
  • Syngas intermediate cooling;
  • Tail gas recirculation;
  • Pumping for the reactor cooling cycle and the separation of products.
Figure 13 shows a comparison of the auxiliary equipment’s power demand between plant configurations without (Figure 13a) and with (Figure 13b) a tail gas reformer. The syngas compression accounts for the highest share, whereas the power demand of pumps is negligible. If no tail gas reformer is integrated, the recirculation ratio has almost no effect on the power demand. An exponential increase can be seen when analyzing the process configuration including a tail gas reformer. Reasons for this behavior are the recirculation of tail gas to the condenser’s inlet and the depressurization via a multi-stage flash distillation to increase the conversion of CO2 and hydrocarbons inside the reformer.

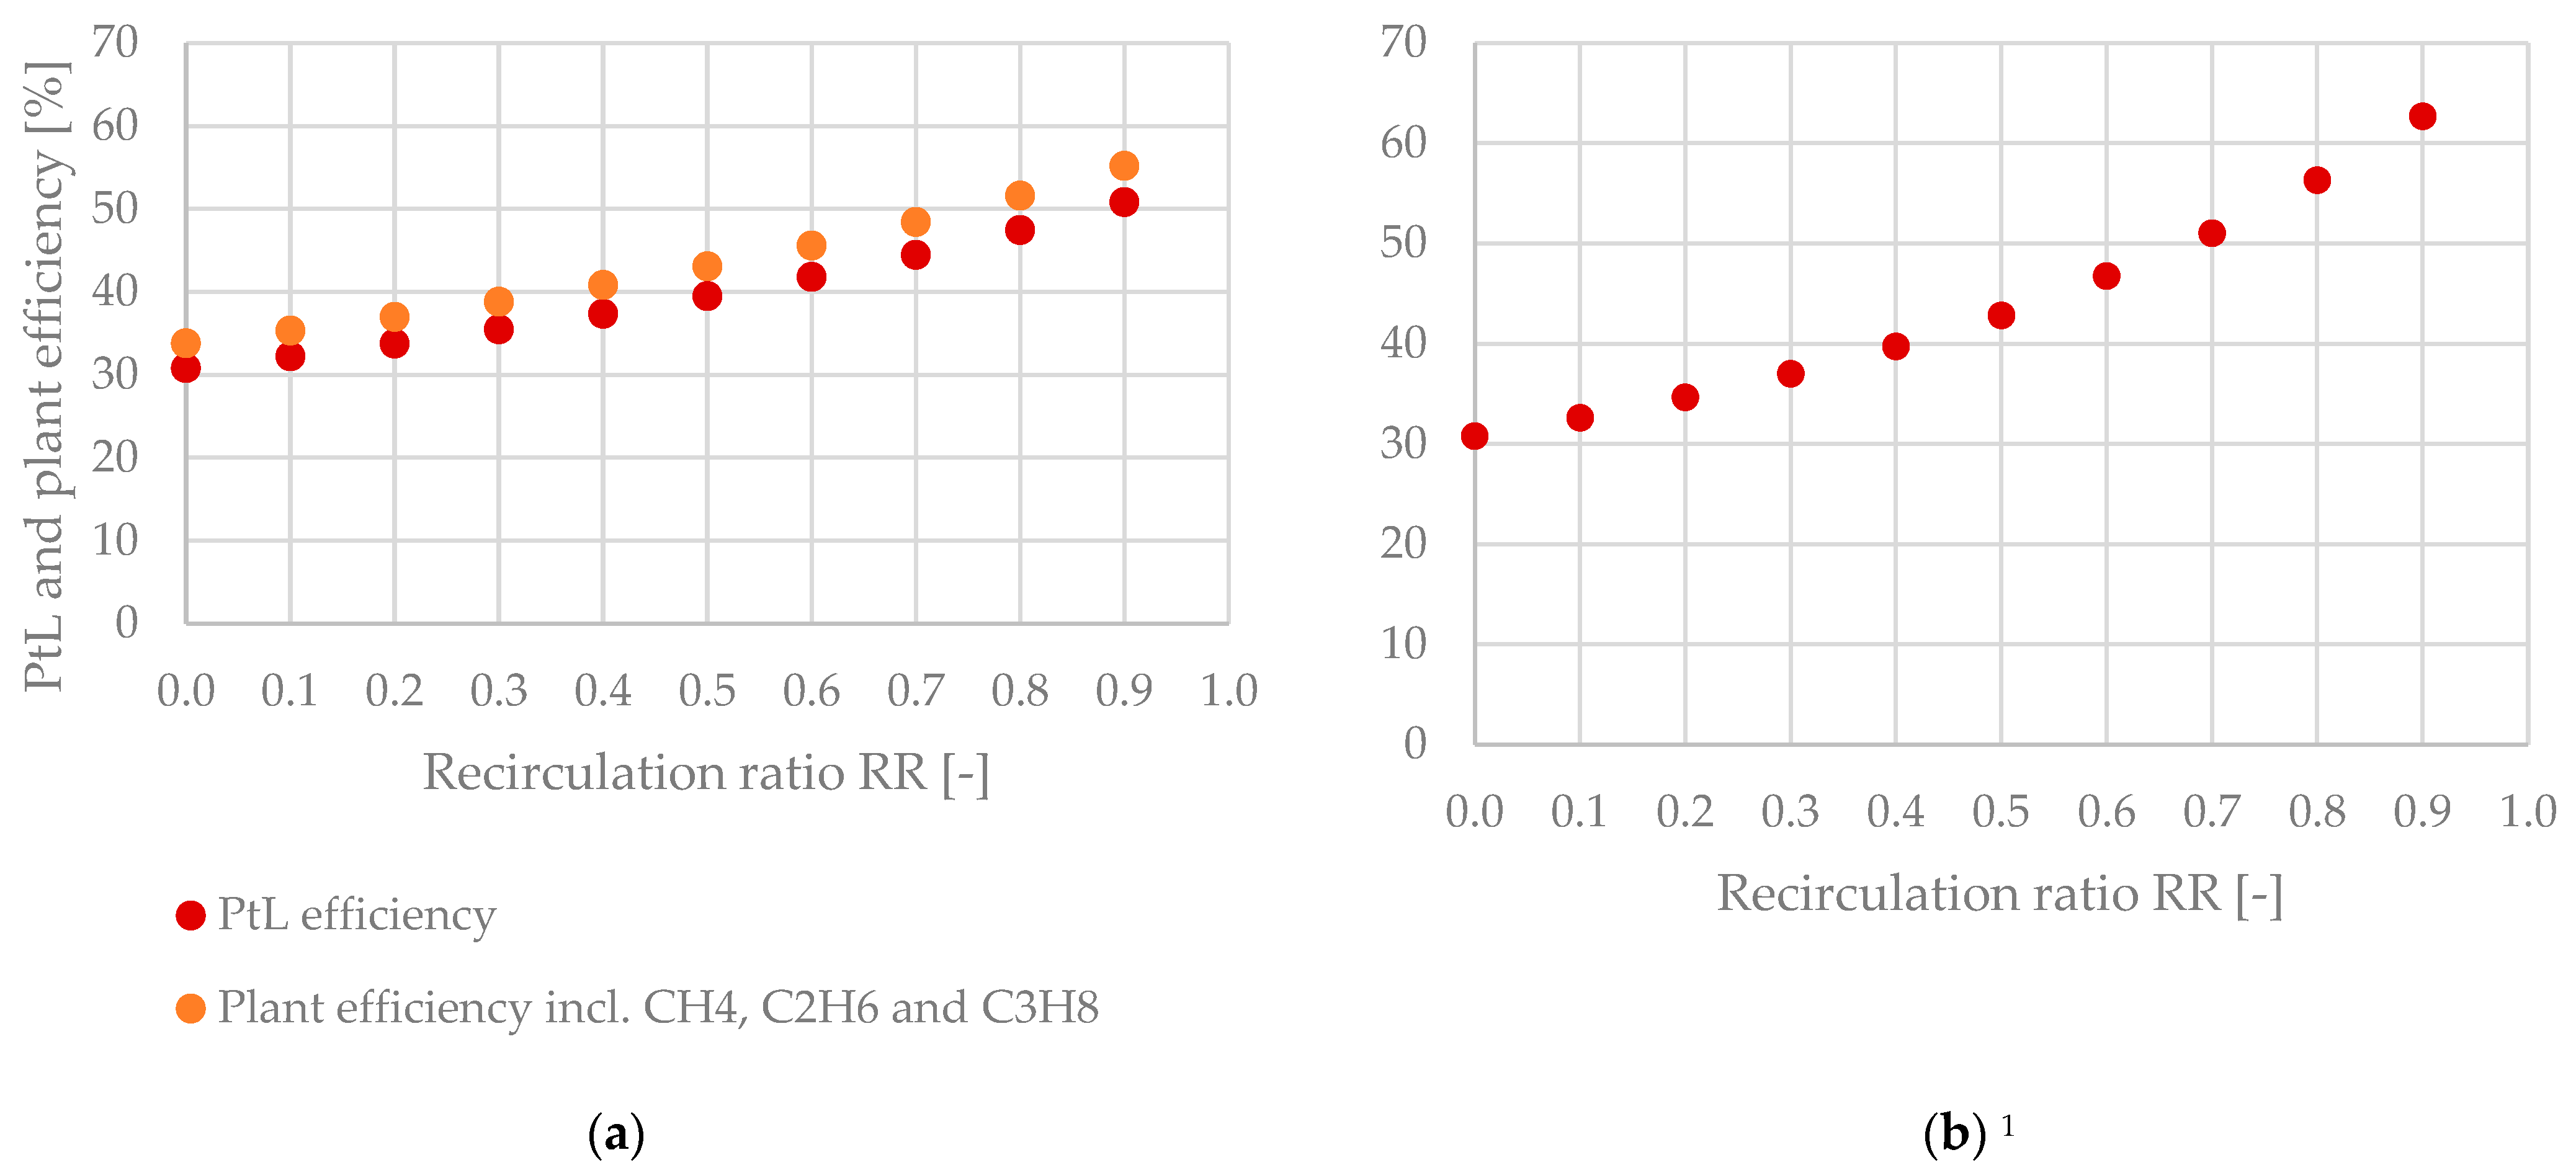
3.7. Power-to-Liquid Efficiency and Plant Efficiency

As described in Section 2.7, the PtL efficiency ηPtL is defined as the rate of the products’ chemical energy generation, excluding CH4 and LPG and the total electricity input into the system (Equation (17)). To enhance comparability between process configurations with and without a tail gas reformer, an additional indicator, the plant efficiency ηPlant, has been introduced (Equation (18)).
Table 6 sums up the Power-to-Liquid efficiency and plant efficiency of the analyzed process configurations. A significant increase in ηPtL can be realized by raising the recirculation ratio RR with a maximum value of 62.7% when implementing a tail gas reformer.
The exponential development of ηPtL and ηPlant as a function of the recirculation ratio is plotted in Figure 14.

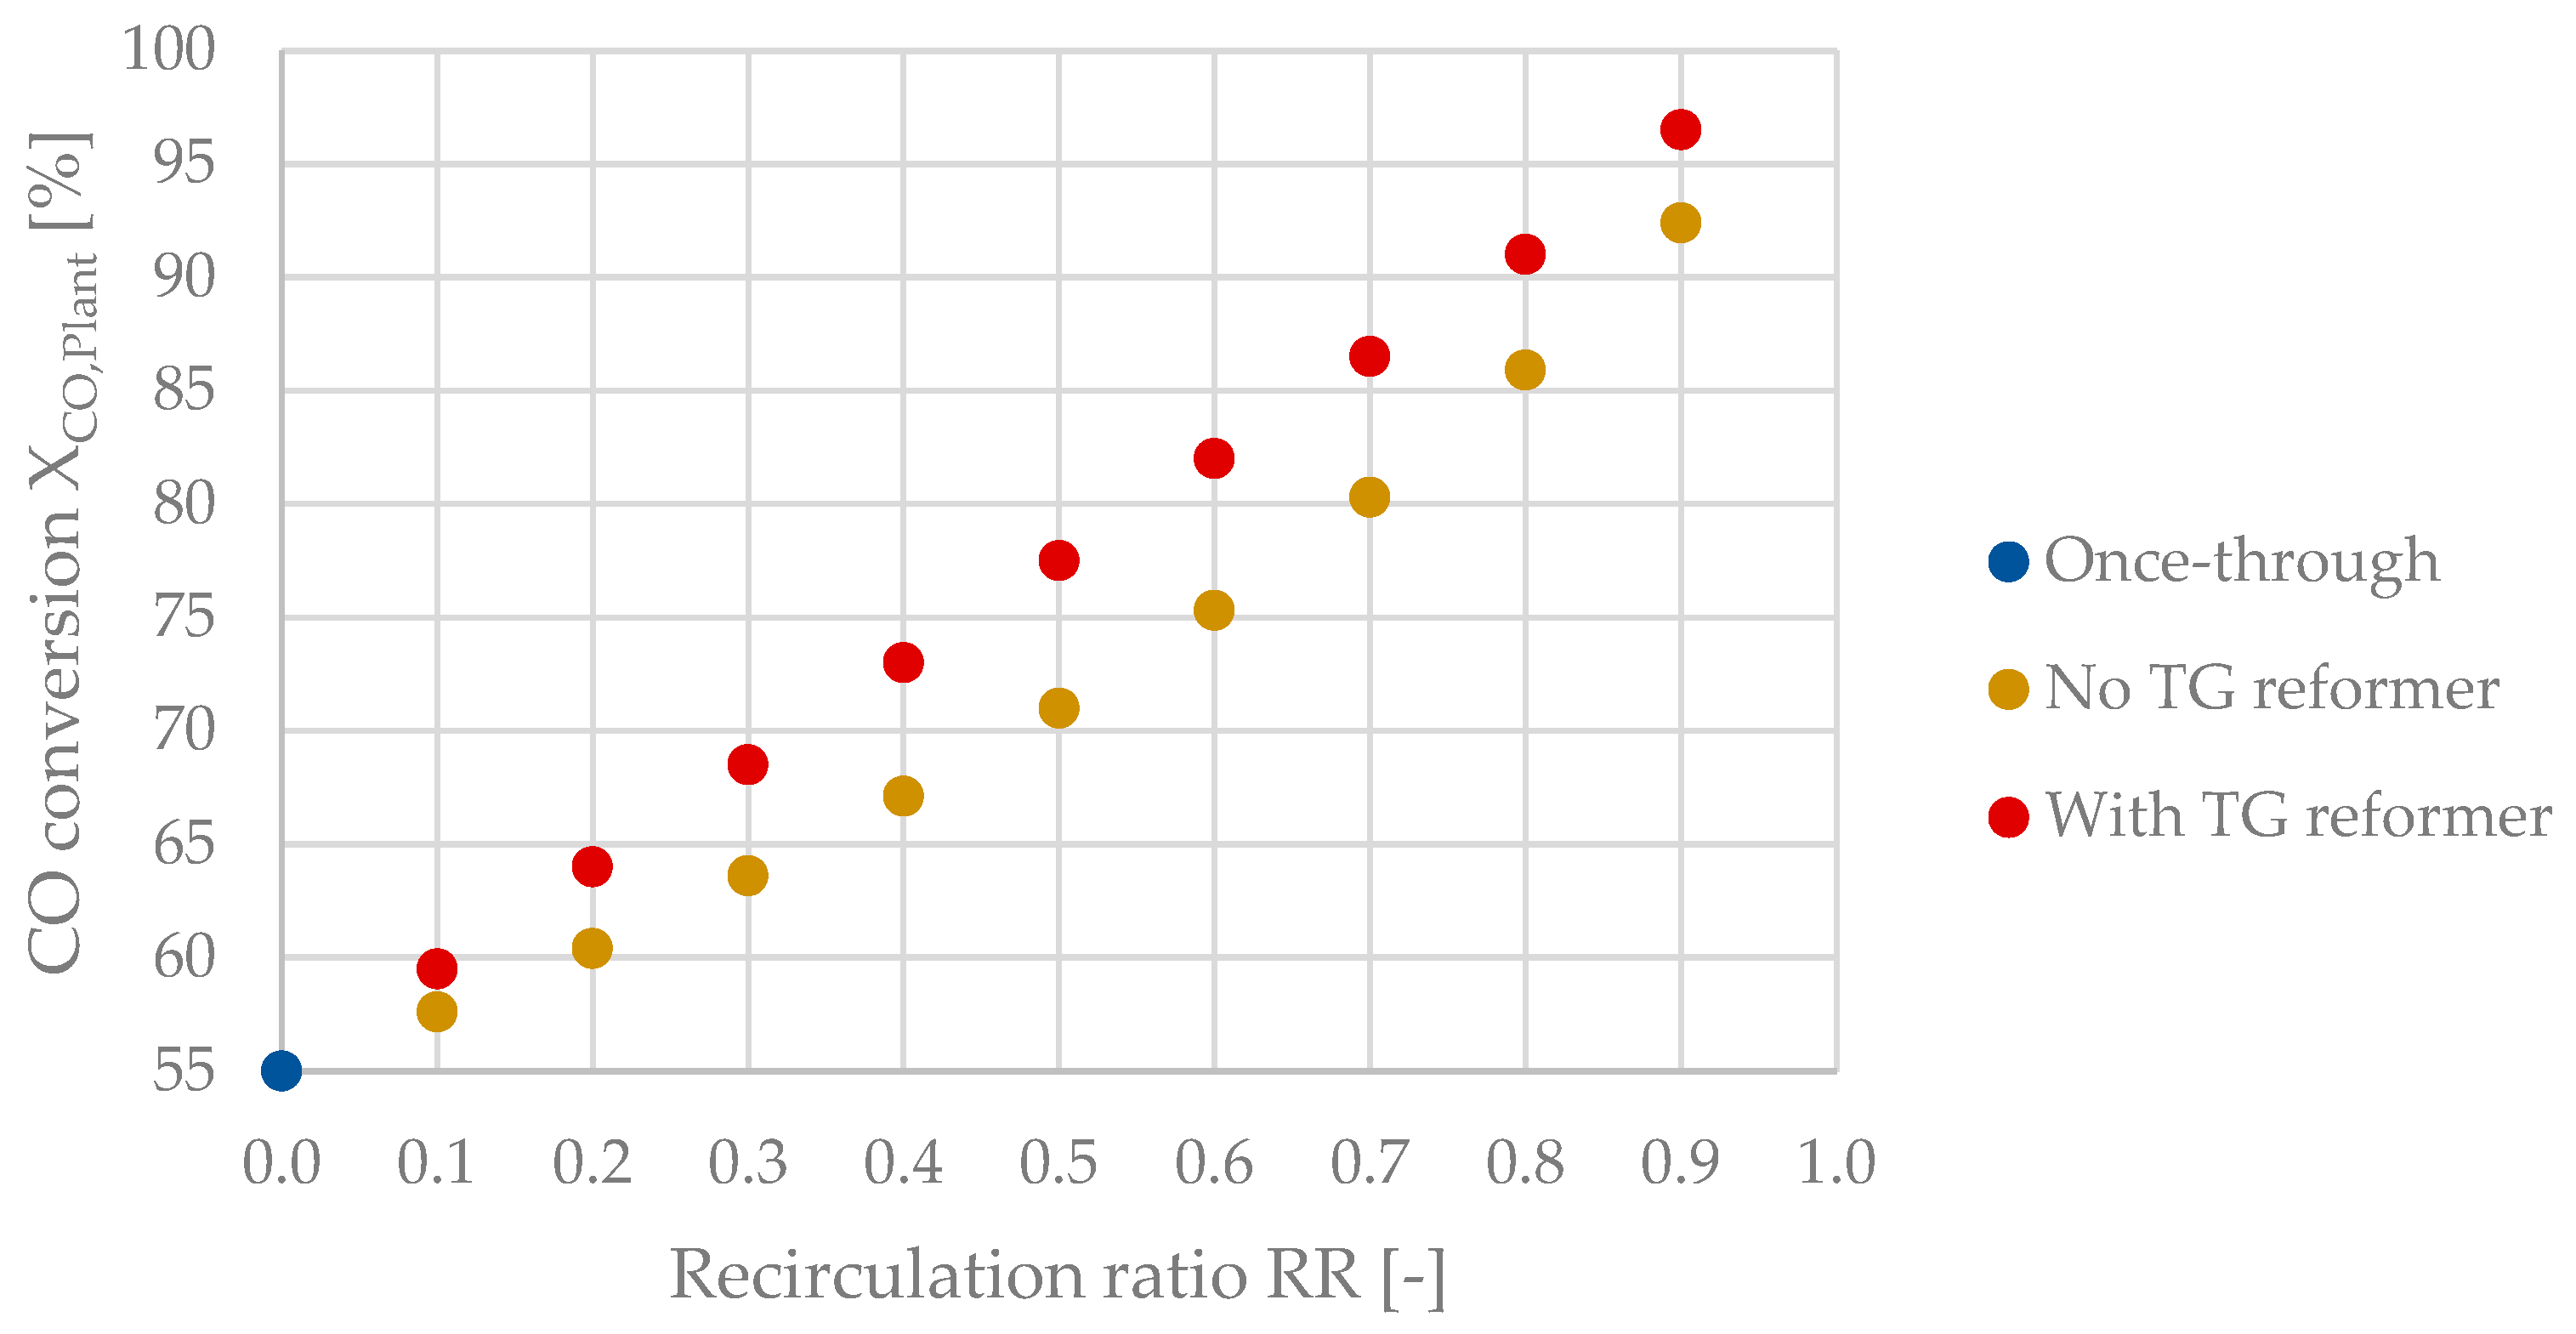
3.8. CO Conversion of the Power-to-Liquid Plant

The growth of XCO,Plant is exponential for the process configuration without a reformer and linear when implementing a tail gas reformer, as depicted in Figure 15. This behavior can be explained by the significant change of the tail gas composition without a reformer, whereas the composition of tail gas is almost constant at the reformer’s outlet, as stated in Section 3.4.2. The maximum values obtained were 92.4% with no tail gas reformer and 96.5% when implementing a reformer.

4. Discussion

The underlying work highlights the importance of tail gas recirculation to achieve feasible Power-to-Liquid efficiencies. A maximum value of 62.7% could be realized by adding a tail gas reformer to the recirculation line compared to only 30.8% via a once-through configuration. A significant accumulation of CO2 inside the system of up to 60.1vol% was observed without a tail gas reforming step, limiting the performance of process configurations without a tail gas reformer to a maximum Power-to-Liquid efficiency of 50.8%. A possible option to solve this problem is to increase the SOEC’s CO2 conversion. In addition, the application of a Fe-based Fischer–Tropsch catalyst might be a viable option due to its activity in the rWGS reaction.
Becker et al. determined a system efficiency of 51% for a plant including the subsequent processing of the Fischer–Tropsch syncrude to gasoline and diesel [37]. Cinti et al. included the recirculation of tail gas to the SOEC (operating in co-electrolysis mode) unit’s inlet in combination with a Fischer–Tropsch reactor, and obtained a PtL efficiency of 57% [35]. Maximum PtL efficiencies of 54.2% (air mode) and 51.9% (oxyfuel mode) were obtained for a PtL plant valorizing biogenic CO2 derived from the combustion of woodchips to methanol by [12]. PtL efficiencies of up to 63% are possible for systems including a high-temperature electrolyzer valorizing CO2 originating from a highly concentrated source, e.g., a biogas upgrading plant, according to [46]. Hence, this work’s maximum Power-to-Liquid efficiency of 62.7% seems reasonable, since the CO2 capture unit’s power demand was not considered.
Table 7 sums up the advantages and disadvantages of process configurations with and without a tail gas reformer. The plant’s key performance indicators, i.e., the Power-to-Liquid efficiency and the mass flow rates of produced hydrocarbons, benefit significantly from implementing a tail gas reformer. However, to keep the system’s complexity at a feasible level for the swift deployment of pilot scale PtL plants, a configuration without an additional tail gas reformer is a viable option.
PtL plants at pilot scale can potentially be combined with decentralized wind turbines or solar power plants to avoid rising electricity prices, making renewable fuels and wax economically competitive to products derived from increasingly expensive fossil resources.
This work aimed to shift the focus towards the Fischer–Tropsch synthesis by applying the extended ASF distribution and internal tail gas recirculation to the Fischer–Tropsch reactor’s inlet. Hence, we added value to previous studies, which mainly used the standard ASF distribution and rather idealized assumptions concerning the Fischer–Tropsch synthesis. In addition, two process configurations, i.e., with and without a tail gas reformer, were analyzed to provide a recommendation concerning the ideal plant configuration for the quick deployment of Power-to-Liquid plants at a pilot scale.

5. Conclusions

The presented work was conducted to answer the question of which Power-to-Liquid efficiencies can be realized by pilot scale plants combining a SOEC unit with Fischer–Tropsch synthesis. In addition, a recommended plant configuration for the production of synthetic fuels and wax at a pilot scale was provided.
Table 8 sums up this work’s central findings by comparing the key performance indicators obtained by the respective process configuration.
A more sophisticated model concerning the SOEC should be developed and applied for future research to evaluate the presented results. Furthermore, the synergy between the SOEC unit and the Fischer–Tropsch reactor needs to be analyzed from an engineering perspective for various modes of operation. Designing the tail gas reforming process in detail has significant potential to improve the concept’s feasibility at an industrial scale. Another possibility for improvement is the validation and extension of the presented Fischer–Tropsch model by conducting laboratory-scale experiments including several catalysts based on cobalt or iron. Process heat integration is a crucial way to secure the presented concept’s feasibility but was not within this work’s scope. Hence, future research should focus on implementing state-of-the-art heat integration methods, e.g., pinch analysis and multi-criteria analysis. In addition, a cost estimate of the respective process routes needs to be conducted to persuade possible investors to fund Power-to-Liquid plants producing synthetic fuel and wax. Conducting a techno-economic assessment is essential to transfer PtL plants to the next level, and thus should be prioritized in future research projects.

Author Contributions

Conceptualization, S.P., S.M. and F.W.; methodology, S.P. and M.H.; software, S.P. and M.H.; validation, S.P., M.H. and F.J.M.; investigation, S.P.; resources, M.H. and S.M.; data curation, S.P. and M.H.; writing—original draft preparation, S.P.; writing—review and editing, S.P., F.W.; visualization, S.P., M.H. and F.J.M.; supervision, S.M. and F.W.; project administration, S.M.; All authors have read and agreed to the published version of the manuscript.

Funding

The underlying work has received funding from the Mobility of the Future program—a research, technology and innovation funding program of the Federal Ministry of Climate Action, Environment, Energy, Mobility, Innovation and Technology, Republic of Austria. The Austrian Research Promotion Agency (FFG) has been authorized for the program management of the project “IFE—Innovation Flüssige Energie” (project #884340). In addition, the authors would like to thank TU Wien Bibliothek for covering the APC through its Open Access Funding Program.

Data Availability Statement

For further information regarding data presented in this article, please contact the corresponding author.

Acknowledgments

The authors would like to acknowledge the “IFE—Innovation Flüssige Energie” consortia, the doctoral college CO2Refinery at TU Wien and the open access funding by TU Wien.

Conflicts of Interest

The authors declare no conflict of interest.

Abbreviations

ASFAnderson–Schulz–Flory distribution
CCompressor
CCUCarbon capture and utilization
DACDirect air capture
DMEDimethyl ether
eASFExtended Anderson-Schulz-Flory distribution
FBMRFixed bed multitubular reactor
FTFischer–Tropsch
GHGGreenhouse gas
HTFTHigh-temperature Fischer–Tropsch synthesis
LTFTLow-temperature Fischer–Tropsch synthesis
PEMECProton exchange membrane electrolysis cell
rWGSReverse water-gas shift
SBCRSlurry bubble column reactor
SOECSolid oxide electrolysis cell
SyngasSynthesis gas provided by the SOEC unit
TGTail gas
PtXPower-to-X
PtGPower-to-Gas
PtLPower-to-Liquid
VBlower
WHeat exchanger
Nomenclature
LHVLower heating value [MJ/kg]
mMass flow rate [kg/h]
PPower [kWel.]
pPressure [bar]
RRRecirculation ratio [-,%]
TTemperature [K,°C]
UChemical energy [kW]
XCOCO conversion [%]
xMolar fraction [-]
yVolume fraction [vol%]
α1Dominant chain growth probability for C1 to C7 (eASF) [-]
α2Dominant chain growth probability for C13+ (eASF) [-]
βReadsorption factor—selectivity for C2H6 (eASF) [-]
γTermination factor—selectivity for CH4 (eASF) [-]
ηEfficiency [%]
λAir ratio [-]
μFactor to merge α1 and α2 (eASF) [-]
ΔrGGibbs free energy of a chemical reaction [kJ/mol]
ΔrHReaction enthalpy [kJ/mol]
ΔrSReaction entropy [kJ/(mol∙K)]
m.Mechanical
el.Electric
th.Thermal
max.Maximum
sIsentropic
Compr.Compressor/compression
Con.Condenser
Rec.Recirculation/recirculated

References

  1. Trends in Atmospheric Carbon Dioxide—Annual Mean Global Carbon Dioxide Growth Rates. Available online: https://gml.noaa.gov/ccgg/trends/gl_gr.html (accessed on 7 January 2022).
  2. Trends in Atmospheric Carbon Dioxide—Global Monthly Mean CO2. Available online: https://gml.noaa.gov/ccgg/trends/global.html (accessed on 7 January 2022).
  3. BP p.l.c. Statistical Review of World Energy—70th Edition. 2021. Available online: https://www.bp.com/content/dam/bp/business-sites/en/global/corporate/pdfs/energy-economics/statistical-review/bp-stats-review-2021-full-report.pdf (accessed on 7 January 2022).
  4. Buysse, C.; Miller, J. Transport Could Burn up the EU’s Entire Carbon Budget. Available online: https://theicct.org/blog/staff/eu-carbon-budget-apr2021 (accessed on 7 January 2022).
  5. Josh A European Green Deal. Striving to Be the First Climate-Neutral Continent. Available online: https://ec.europa.eu/info/strategy/priorities-2019-2024/european-green-deal_en (accessed on 7 January 2022).
  6. Austrian Automobile, Motorcycle and Touring Club. Expertenbericht Mobilität und Klimaschutz 2030. Available online: https://www.oeamtc.at/club/oeamtc-expertenbericht-mobilitaet-klimaschutz-2030-25873728#:~:text=%22Alles%20in%20allem%20werden%20die,betont%20%C3%96AMTC%2DDirektor%20Oliver%20Schmerold (accessed on 17 March 2022).
  7. E-FUEL—The Renewable Fuel. Available online: https://www.sunfire.de/en/e-fuel (accessed on 7 January 2022).
  8. Wulf, C.; Zapp, P.; Schreiber, A. Review of Power-to-X Demonstration Projects in Europe. Front. Energy Res. 2020, 8, 191. [Google Scholar] [CrossRef]
  9. Karka, P.; Johnsson, F.; Papadokonstantakis, S. Perspectives for Greening European Fossil-Fuel Infrastructures Through Use of Biomass: The Case of Liquid Biofuels Based on Lignocellulosic Resources. Front. Energy Res. 2021, 9, 636782. [Google Scholar] [CrossRef]
  10. Mailaram, S.; Kumar, P.; Kunamalla, A.; Saklecha, P.; Maity, S.K. Biomass, Biorefinery, and Biofuels. In Sustainable Fuel Technologies Handbook; Elsevier: Amsterdam, The Netherlands, 2021; pp. 51–87. ISBN 978-0-12-822989-7. [Google Scholar]
  11. Green Fuel from Residual Waste. Available online: https://smartcity.wien.gv.at/en/waste2value/ (accessed on 24 May 2022).
  12. Pratschner, S.; Skopec, P.; Hrdlicka, J.; Winter, F. Power-to-Green Methanol via CO2 Hydrogenation—A Concept Study Including Oxyfuel Fluidized Bed Combustion of Biomass. Energies 2021, 14, 4638. [Google Scholar] [CrossRef]
  13. Siemens Energy. Haru Oni: A New Age of Discovery. Available online: https://www.siemens-energy.com/global/en/news/magazine/2021/haru-oni.html (accessed on 7 January 2022).
  14. Marlin, D.S.; Sarron, E.; Sigurbjörnsson, Ó. Process Advantages of Direct CO2 to Methanol Synthesis. Front. Chem. 2018, 6. [Google Scholar] [CrossRef]
  15. Bowker, M. Methanol Synthesis from CO2 Hydrogenation. ChemCatChem 2019, 11, 4238–4246. [Google Scholar] [CrossRef] [PubMed] [Green Version]
  16. Norsk E-Fuel. Supplying Your Renewable Fuel. Unlimited. On the Road to Climate Neutral Transportation. Available online: https://www.norsk-e-fuel.com/en/ (accessed on 7 January 2022).
  17. Fisch, I. Sustainable E-Fuels for Aviation. Available online: https://ineratec.de/en/e-fuels-for-aviation/ (accessed on 7 January 2022).
  18. Industrial Power-to-Liquid Pioneer Plant in Germany 2022. INERATEC. Available online: https://ineratec.de/en/power-to-liquid-pioneer-plant-2022/ (accessed on 17 March 2022).
  19. de Klerk, A. Fischer-Tropsch Refining, 1st ed.; Wiley-VCH: Weinheim, Germany, 2011; ISBN 978-3-527-63560-3. [Google Scholar]
  20. Martinelli, M.; Gnanamani, M.K.; LeViness, S.; Jacobs, G.; Shafer, W.D. An Overview of Fischer-Tropsch Synthesis: XtL Processes, Catalysts and Reactors. Appl. Catal. A Gen. 2020, 608, 117740. [Google Scholar] [CrossRef]
  21. Badoga, S.; Gnanamani, M.K.; Martinelli, M.; Sparks, D.E.; Ma, W. Effect of Start-up Solvent on the Performance of Co Catalyst for Fischer-Tropsch Synthesis in Stirred-Tank Reactor. Fuel 2020, 272, 117707. [Google Scholar] [CrossRef]
  22. Visconti, C.G.; Lietti, L.; Tronconi, E.; Rossini, S. Kinetics of Low-Temperature Fischer-Tropsch Synthesis on Cobalt Catalysts: Are Both Slurry Autoclave and Tubular Packed-Bed Reactors Adequate to Collect Relevant Data at Lab-Scale? Can. J. Chem. Eng. 2016, 94, 685–695. [Google Scholar] [CrossRef]
  23. Todic, B.; Nowicki, L.; Nikacevic, N.; Bukur, D.B. Fischer–Tropsch Synthesis Product Selectivity over an Industrial Iron-Based Catalyst: Effect of Process Conditions. Catal. Today 2016, 261, 28–39. [Google Scholar] [CrossRef] [Green Version]
  24. Peña, D.; Griboval-Constant, A.; Lecocq, V.; Diehl, F.; Khodakov, A.Y. Influence of Operating Conditions in a Continuously Stirred Tank Reactor on the Formation of Carbon Species on Alumina Supported Cobalt Fischer–Tropsch Catalysts. Catal. Today 2013, 215, 43–51. [Google Scholar] [CrossRef]
  25. Chambrey, S.; Fongarland, P.; Karaca, H.; Piché, S.; Griboval-Constant, A.; Schweich, D.; Luck, F.; Savin, S.; Khodakov, A.Y. Fischer–Tropsch Synthesis in Milli-Fixed Bed Reactor: Comparison with Centimetric Fixed Bed and Slurry Stirred Tank Reactors. Catal. Today 2011, 171, 201–206. [Google Scholar] [CrossRef]
  26. de Klerk, A. Can Fischer−Tropsch Syncrude Be Refined to On-Specification Diesel Fuel? Energy Fuels 2009, 23, 4593–4604. [Google Scholar] [CrossRef]
  27. Gruber, H.; Groß, P.; Rauch, R.; Reichhold, A.; Zweiler, R.; Aichernig, C.; Müller, S.; Ataimisch, N.; Hofbauer, H. Fischer-Tropsch Products from Biomass-Derived Syngas and Renewable Hydrogen. Biomass Conv. Bioref. 2021, 11, 2281–2292. [Google Scholar] [CrossRef] [Green Version]
  28. Bekker, M.; Louw, N.R.; Jansen Van Rensburg, V.J.; Potgieter, J. The Benefits of Fischer-Tropsch Waxes in Synthetic Petroleum Jelly. Int. J. Cosmet. Sci. 2013, 35, 99–104. [Google Scholar] [CrossRef]
  29. Guettel, R.; Kunz, U.; Turek, T. Reactors for Fischer-Tropsch Synthesis. Chem. Eng. Technol. 2008, 31, 746–754. [Google Scholar] [CrossRef]
  30. Maitlis, P.M.; de Klerk, A. (Eds.) Greener Fischer-Tropsch Processes for Fuels and Feedstocks; Wiley-VCH: Weinheim, Germany, 2013; ISBN 978-3-527-32945-8. [Google Scholar]
  31. Makhura, E.; Rakereng, J.; Rapoo, O.; Danha, G. Effect of the Operation Parameters on the Fischer Tropsch Synthesis Process Using Different Reactors. Procedia Manuf. 2019, 35, 349–355. [Google Scholar] [CrossRef]
  32. Pfeifer, P.; Schmidt, S.; Betzner, F.; Kollmann, M.; Loewert, M.; Böltken, T.; Piermartini, P. Scale-up of Microstructured Fischer–Tropsch Reactors—Status and Perspectives. Curr. Opin. Chem. Eng. 2022, 36, 100776. [Google Scholar] [CrossRef]
  33. Yang, J.; Boullosa, E.; Myrstad, R.; Venik, H.; Pfeifer, P.; Holmen, A. Fischer-Tropsch Synthesis on Co-Based Catalysts in a Microchannel Reactor—Effect of Temperature and Pressure on Selectivity and Stability. In Fischer-Tropsch Synthesis, Catalysts and Catalysis; CRC Press: Boca Raton, FL, USA, 2016; Chapter 12; pp. 223–251. ISBN 978-1-4665-5529-7. [Google Scholar]
  34. Marchese, M.; Giglio, E.; Santarelli, M.; Lanzini, A. Energy Performance of Power-to-Liquid Applications Integrating Biogas Upgrading, Reverse Water Gas Shift, Solid Oxide Electrolysis and Fischer-Tropsch Technologies. Energy Convers. Manag. X 2020, 6, 100041. [Google Scholar] [CrossRef]
  35. Cinti, G.; Baldinelli, A.; Di Michele, A.; Desideri, U. Integration of Solid Oxide Electrolyzer and Fischer-Tropsch: A Sustainable Pathway for Synthetic Fuel. Appl. Energy 2016, 162, 308–320. [Google Scholar] [CrossRef]
  36. König, D.H.; Freiberg, M.; Dietrich, R.-U.; Wörner, A. Techno-Economic Study of the Storage of Fluctuating Renewable Energy in Liquid Hydrocarbons. Fuel 2015, 159, 289–297. [Google Scholar] [CrossRef] [Green Version]
  37. Becker, W.L.; Braun, R.J.; Penev, M.; Melaina, M. Production of Fischer–Tropsch Liquid Fuels from High Temperature Solid Oxide Co-Electrolysis Units. Energy 2012, 47, 99–115. [Google Scholar] [CrossRef]
  38. Herz, G.; Reichelt, E.; Jahn, M. Techno-Economic Analysis of a Co-Electrolysis-Based Synthesis Process for the Production of Hydrocarbons. Appl. Energy 2018, 215, 309–320. [Google Scholar] [CrossRef]
  39. Gao, R.; Zhang, C.; Jun, K.-W.; Kim, S.K.; Park, H.-G.; Zhao, T.; Wang, L.; Wan, H.; Guan, G. Green Liquid Fuel and Synthetic Natural Gas Production via CO2 Hydrogenation Combined with Reverse Water-Gas-Shift and Co-based Fischer-Tropsch Synthesis. J. CO2 Util. 2021, 51, 101619. [Google Scholar] [CrossRef]
  40. Müller, S.; Groß, P.; Rauch, R.; Zweiler, R.; Aichernig, C.; Fuchs, M.; Hofbauer, H. Production of Diesel from Biomass and Wind Power—Energy Storage by the Use of the Fischer-Tropsch Process. Biomass Conv. Bioref. 2018, 8, 275–282. [Google Scholar] [CrossRef]
  41. HELMETH—High Temperature Electrolysis Cell (SOEC). Available online: http://www.helmeth.eu/index.php/technologies/high-temperature-electrolysis-cell-soec (accessed on 22 February 2022).
  42. Avallone, E.A.; Baumeister, T.; Sadegh, A.M. Marks’ Standard Handbook for Mechanical Engineers; McGraw-Hill: New York, NY, USA, 2007; Chapter 14; ISBN 978-1-60119-653-8. [Google Scholar]
  43. Guilera, J.; Díaz-López, J.A.; Berenguer, A.; Biset-Peiró, M.; Andreu, T. Fischer-Tropsch Synthesis: Towards a Highly-Selective Catalyst by Lanthanide Promotion under Relevant CO2 Syngas Mixtures. Appl. Catal. A Gen. 2022, 629, 118423. [Google Scholar] [CrossRef]
  44. Sauciuc, A.; Abosteif, Z.; Weber, G.; Potetz, A.; Rauch, R.; Hofbauer, H.; Schaub, G.; Dumitrescu, L. Influence of Operating Conditions on the Performance of Biomass-Based Fischer–Tropsch Synthesis. Biomass Conv. Bioref. 2012, 2, 253–263. [Google Scholar] [CrossRef]
  45. Coutanceau, C.; Baranton, S.; Audichon, T. Hydrogen Production from Water Electrolysis. In Hydrogen Electrochemical Production; Elsevier: Amsterdam, The Netherlands, 2018; pp. 17–62. ISBN 978-0-12-811250-2. [Google Scholar]
  46. Schmidt, P.; Weindorf, W. Power-to-Liquids: Potential and Perspectives for the Future Supply of Renewable Aviation Fuel 2016; German Environment Agency: Dessau-Roßlau, Germany, 2016; ISSN 2363-829X. Available online: https://www.umweltbundesamt.de/sites/default/files/medien/377/publikationen/161005_uba_hintergrund_ptl_barrierrefrei.pdf (accessed on 17 March 2022).
  47. Hauch, A.; Brodersen, K.; Chen, M.; Mogensen, M.B. Ni/YSZ Electrodes Structures Optimized for Increased Electrolysis Performance and Durability. Solid State Ion. 2016, 293, 27–36. [Google Scholar] [CrossRef] [Green Version]
  48. Sattler, K. Thermische Trennverfahren: Grundlagen, Auslegung, Apparate; Wiley-VCH: Weinheim, Germany, 2007; Chapter 2; pp. 116–117. ISBN 978-3-527-30243-7. [Google Scholar]
  49. Zhai, P.; Sun, G.; Zhu, Q.; Ma, D. Fischer-Tropsch Synthesis Nanostructured Catalysts: Understanding Structural Characteristics and Catalytic Reaction. Nanotechnol. Rev. 2013, 2, 547–576. [Google Scholar] [CrossRef]
  50. Förtsch, D.; Pabst, K.; Groß-Hardt, E. The Product Distribution in Fischer–Tropsch Synthesis: An Extension of the ASF Model to Describe Common Deviations. Chem. Eng. Sci. 2015, 138, 333–346. [Google Scholar] [CrossRef]
  51. Sengupta, S.; Jha, A.; Shende, P.; Maskara, R.; Das, A.K. Catalytic Performance of Co and Ni Doped Fe-Based Catalysts for the Hydrogenation of CO2 to CO via Reverse Water-Gas Shift Reaction. J. Environ. Chem. Eng. 2019, 7, 102911. [Google Scholar] [CrossRef]
  52. de Miranda, P.E.V. (Ed.) Science and Engineering of Hydrogen-Based Energy Technologies: Hydrogen Production and Practical Applications in Energy Generation; Academic Press Is an Imprint of Elsevier: London, UK; San Diego, CA, USA, 2019; ISBN 978-0-12-814251-6. [Google Scholar]
Figure 1. Scheme of the Power-to-Liquid plant without tail gas reforming.
Energies 15 04134 g001
Figure 2. Scheme of the Power-to-Liquid plant with tail gas reforming.
Energies 15 04134 g002
Figure 3. Implementation in IPSEpro—process configuration without tail gas reforming.
Energies 15 04134 g003
Figure 4. Implementation in IPSEpro—process configuration including tail gas reforming.
Energies 15 04134 g004
Figure 5. Design parameters of the plant configuration without tail gas reforming.
Energies 15 04134 g005
Figure 6. Design parameters of the plant configuration including tail gas reforming.
Energies 15 04134 g006
Figure 7. Fischer-Tropsch products as a function of the recirculation ratio RR—(a) process configuration without a tail gas reformer, (b) process configuration with a tail gas reformer.
Energies 15 04134 g007
Figure 8. H2:CO ratio of the SOEC (co-electrolysis) unit with and without a tail gas reformer.
Energies 15 04134 g008
Figure 9. Recirculated tail gas as a function of the recirculation ratio RR and the process configuration—(a) mass flow rate, (b) volume flow rate.
Energies 15 04134 g009
Figure 10. Tail gas composition as a function of the recirculation ratio RR for the process configuration without a tail gas reformer.
Energies 15 04134 g010
Figure 11. Tail gas reforming—(a) tail gas composition at the reformer’s inlet, (b) tail gas composition at the reformer’s outlet as a function of the recirculation ratio.
Energies 15 04134 g011
Figure 12. Purge gas stream for the configuration without a tail gas reformer—(a) mass flow rate as a function of the recirculation ratio, (b) chemical energy as a function of the recirculation ratio. 1 No purge gas stream occurs for the process route that includes a tail gas reformer.
Energies 15 04134 g012
Figure 13. Power demand of auxiliary equipment excluding the SOEC unit as a function of the recirculation ratio—(a) without a tail gas reformer, (b) with a tail gas reformer.
Energies 15 04134 g013
Figure 14. Power-to-Liquid efficiency and plant efficiency as a function of the recirculation ratio—(a) without tail gas reforming, (b) with tail gas reforming. 1 ηPtL and ηPlant are equal due to the combustion of the purge gas stream.
Energies 15 04134 g014
Figure 15. CO conversion at a system level as a function of the recirculation ratio.
Energies 15 04134 g015
Table 2. Overview of previous works on the simulation of Power-to-Liquid plants based on Fischer–Tropsch synthesis.
Syngas
Production
Fischer–Tropsch
Model
CatalystChain Growth
Probability α
CO
Conversion
Tail Gas
Recirculation
Source
SOEC/rWGSStandard ASF +
kinetic model
Co-based- 170%
(per pass)
Inlet SOEC/
inlet rWGS
[34]
SOECStandard ASFCo-based0.9487%
(per pass)
Inlet SOEC[35]
rWGSStandard ASFCo-based- 1100%
(plant)
Inlet rWGS/
inlet FT reactor
[36]
SOECStandard ASF +
kinetic model
Co-based0.9080%
(per pass)
No recirculation[37]
SOEC- 1Co-based0.9080%
(per pass)
Inlet SOEC/
inlet FT reactor
[38]
rWGSReaction
stoichiometry
Co-based- 1- 1Inlet rWGS[39]
Biomass
gasification 2
Standard ASFCo-based0.89–0.9340%
(per pass)
No recirculation[40]
1 Not specified. 2 Combining process simulation and experimental validation.
Table 3. Important parameters of the process simulation.
ParameterSymbolValueUnitSource
SOEC and syngas
SOEC power inputPSOEC1MWel.Chosen design
Syngas mass flow ratemSyngas190kg/hCalculation [41]
Temperature syngasTSyngas120°CAssumption
Volume share of COyCO27.9 1vol%[34]
Volume share of H2yH255.8 1vol%[34]
Volume share of H2OyH2O5.5 2vol%[34]
Volume share of CO2yCO210.5 2vol%[34]
Volume share of CH4yCH40.3 2vol%[34]
Temperature condenser OUTTCon.10°CAssumption
Syngas compression and intermediate cooling
Pressure condenser OUTpCon.1barAssumption
Pressure C1pC13bar[42]
Pressure C2pC28bar[42]
Pressure C3pC321bar[42]
Temperature W2 and W3TW2,W350°CAssumption
Fischer–Tropsch synthesis
Temperature FT reactorTFT210°C[19]
Pressure FT reactorpFT21bar[19]
CO conversion FT reactorXCO,Reactor55%[43,44]
rWGS activity FT reactorXrWGS,Reactor0%[19]
Chain growth probabilityα10.78-Based on [43]
Chain growth probabilityα20.90-Based on [43]
Factor to merge α1 and α2μ0.95-Based on [43]
Readsorption factorγ0.48-Based on [43]
Termination factorβ0.75-Based on [43]
Tail gas recirculation and reforming
Recirculation ratioRR0–90%Chosen design
Temperature reformerTReformer850°CChosen design
Pressure reformerpReformer1.2barChosen design
Tail gas combustion
Air ratioλ1.1-Assumption
Temperature flue gasTFlue gas1100°CAssumption
Product fractions
MethaneC1Number of carbon atoms
Ethane and propaneC2–C3Number of carbon atoms
NaphthaC4–C9Number of carbon atoms
Middle distillateC10–C19Number of carbon atoms
WaxC20+Number of carbon atoms
1 Varied to maintain H2:COFT = 2. 2 constant.
Table 4. Fischer–Tropsch products and reaction heat for various process configurations.
Process Configuration
(Recirculation Ratio of Tail Gas)
Fischer–Tropsch Products [kg/h]Once-Through
(RR = 0%)
No Reformer
(RR = 90%)
With Reformer
(RR = 90%)
CH41.1 11.3 1- 2
Ethane and propane1.3 12.2 1- 2
Naphtha6.310.513.7
Middle distillate10.016.521.5
Wax10.417.322.6
Σ Fischer–Tropsch products29.147.857.8
Fischer–Tropsch H2O36.562.380.0
Reaction heat [kWth.]90.3149.6195.4
1 Entrained inside the purge gas stream. 2 Purge gas is combusted to heat the tail gas before the reformer.
Table 5. Tail gas composition for process configurations with and without a tail gas reformer.
Process Configuration
(Recirculation Ratio of Tail Gas)
ParameterSymbolUnitOnce-Through
(RR = 0%)
No Reformer
(RR = 90%)
Reformer IN
(RR = 90%)
Reformer OUT
(RR = 90%)
COyCOvol%26.011.727.238.4
H2yH2vol%48.721.950.845.2
CO2yCO2vol%21.760.118.97.2
H2OyH2Ovol%2.00.21.69.1
CH4yCH4vol%1.03.60.90.1
EthaneyC2H6vol%0.31.30.30.0
PropaneyC3H8vol%0.31.20.30.0
Table 6. Power-to-Liquid efficiency and plant efficiency for the chosen process configurations.
Process Configuration
(Recirculation Ratio of Tail Gas)
ParameterSymbolUnitOnce-Through
(RR = 0%)
No Reformer
(RR = 90%)
With Reformer
(RR = 90%)
Power-to-Liquid efficiency 1ηPtL%30.850.862.7
Plant efficiency 2ηPlant%33.855.262.7
Total power demandPTotalkWel.1061.31066.31128.1
1 Excluding CH4, ethane and propane inside the purge gas stream. 2 Including CH4, ethane and propane inside the purge gas stream.
Table 7. Performances and feasibility of pilot scale plants producing synthetic fuels and wax with and without implementing a tail gas reformer.
Process Configuration
ParameterWithout Tail Gas ReformerWith Tail Gas Reformer
PtL efficiency ηPtL+
Fischer–Tropsch products+
Technical expenditure+1
Costs+1
Deployment speed+
Utilization of purge gas+2
1 Additional reactor and catalyst are required for tail gas reforming. 2 Purge gas is combusted to heat the tail gas before the reformer.
Table 8. Obtained key performance indicators of the Power-to-Liquid plant for the respective process configurations with and without a tail gas reformer.
Process Configuration
(Recirculation Ratio of Tail Gas)
ParameterSymbolUnitOnce-Through
(RR = 0%)
No Reformer
(RR = 90%)
With Reformer
(RR = 90%)
Power-to-Liquid efficiencyηPtL%30.850.862.7
Fischer–Tropsch products 1mFTkg/h26.744.357.8
CO conversion of the plantXCO,Plant%55.092.496.5
Required H2:CO ratio (SOEC)H2:COSOEC-2.002.093.30
Total power demand 2Pel.kWel.1061.31066.31128.1
Purge gas chemical energyUPurge gaskW365.3102.1- 3
1 Excluding CH4, ethane and propane inside the purge gas stream. 2 Power demand of the SOEC is 1000 kWel.. 3 Purge gas is combusted to heat the tail gas before the reformer.
Publisher’s Note: MDPI stays neutral with regard to jurisdictional claims in published maps and institutional affiliations.

