
Development and Comparison of Thermodynamic Equilibrium and Kinetic Approaches for Biomass Pyrolysis Modeling


Abstract
:1. Introduction
1.1. Necessity of the Matter
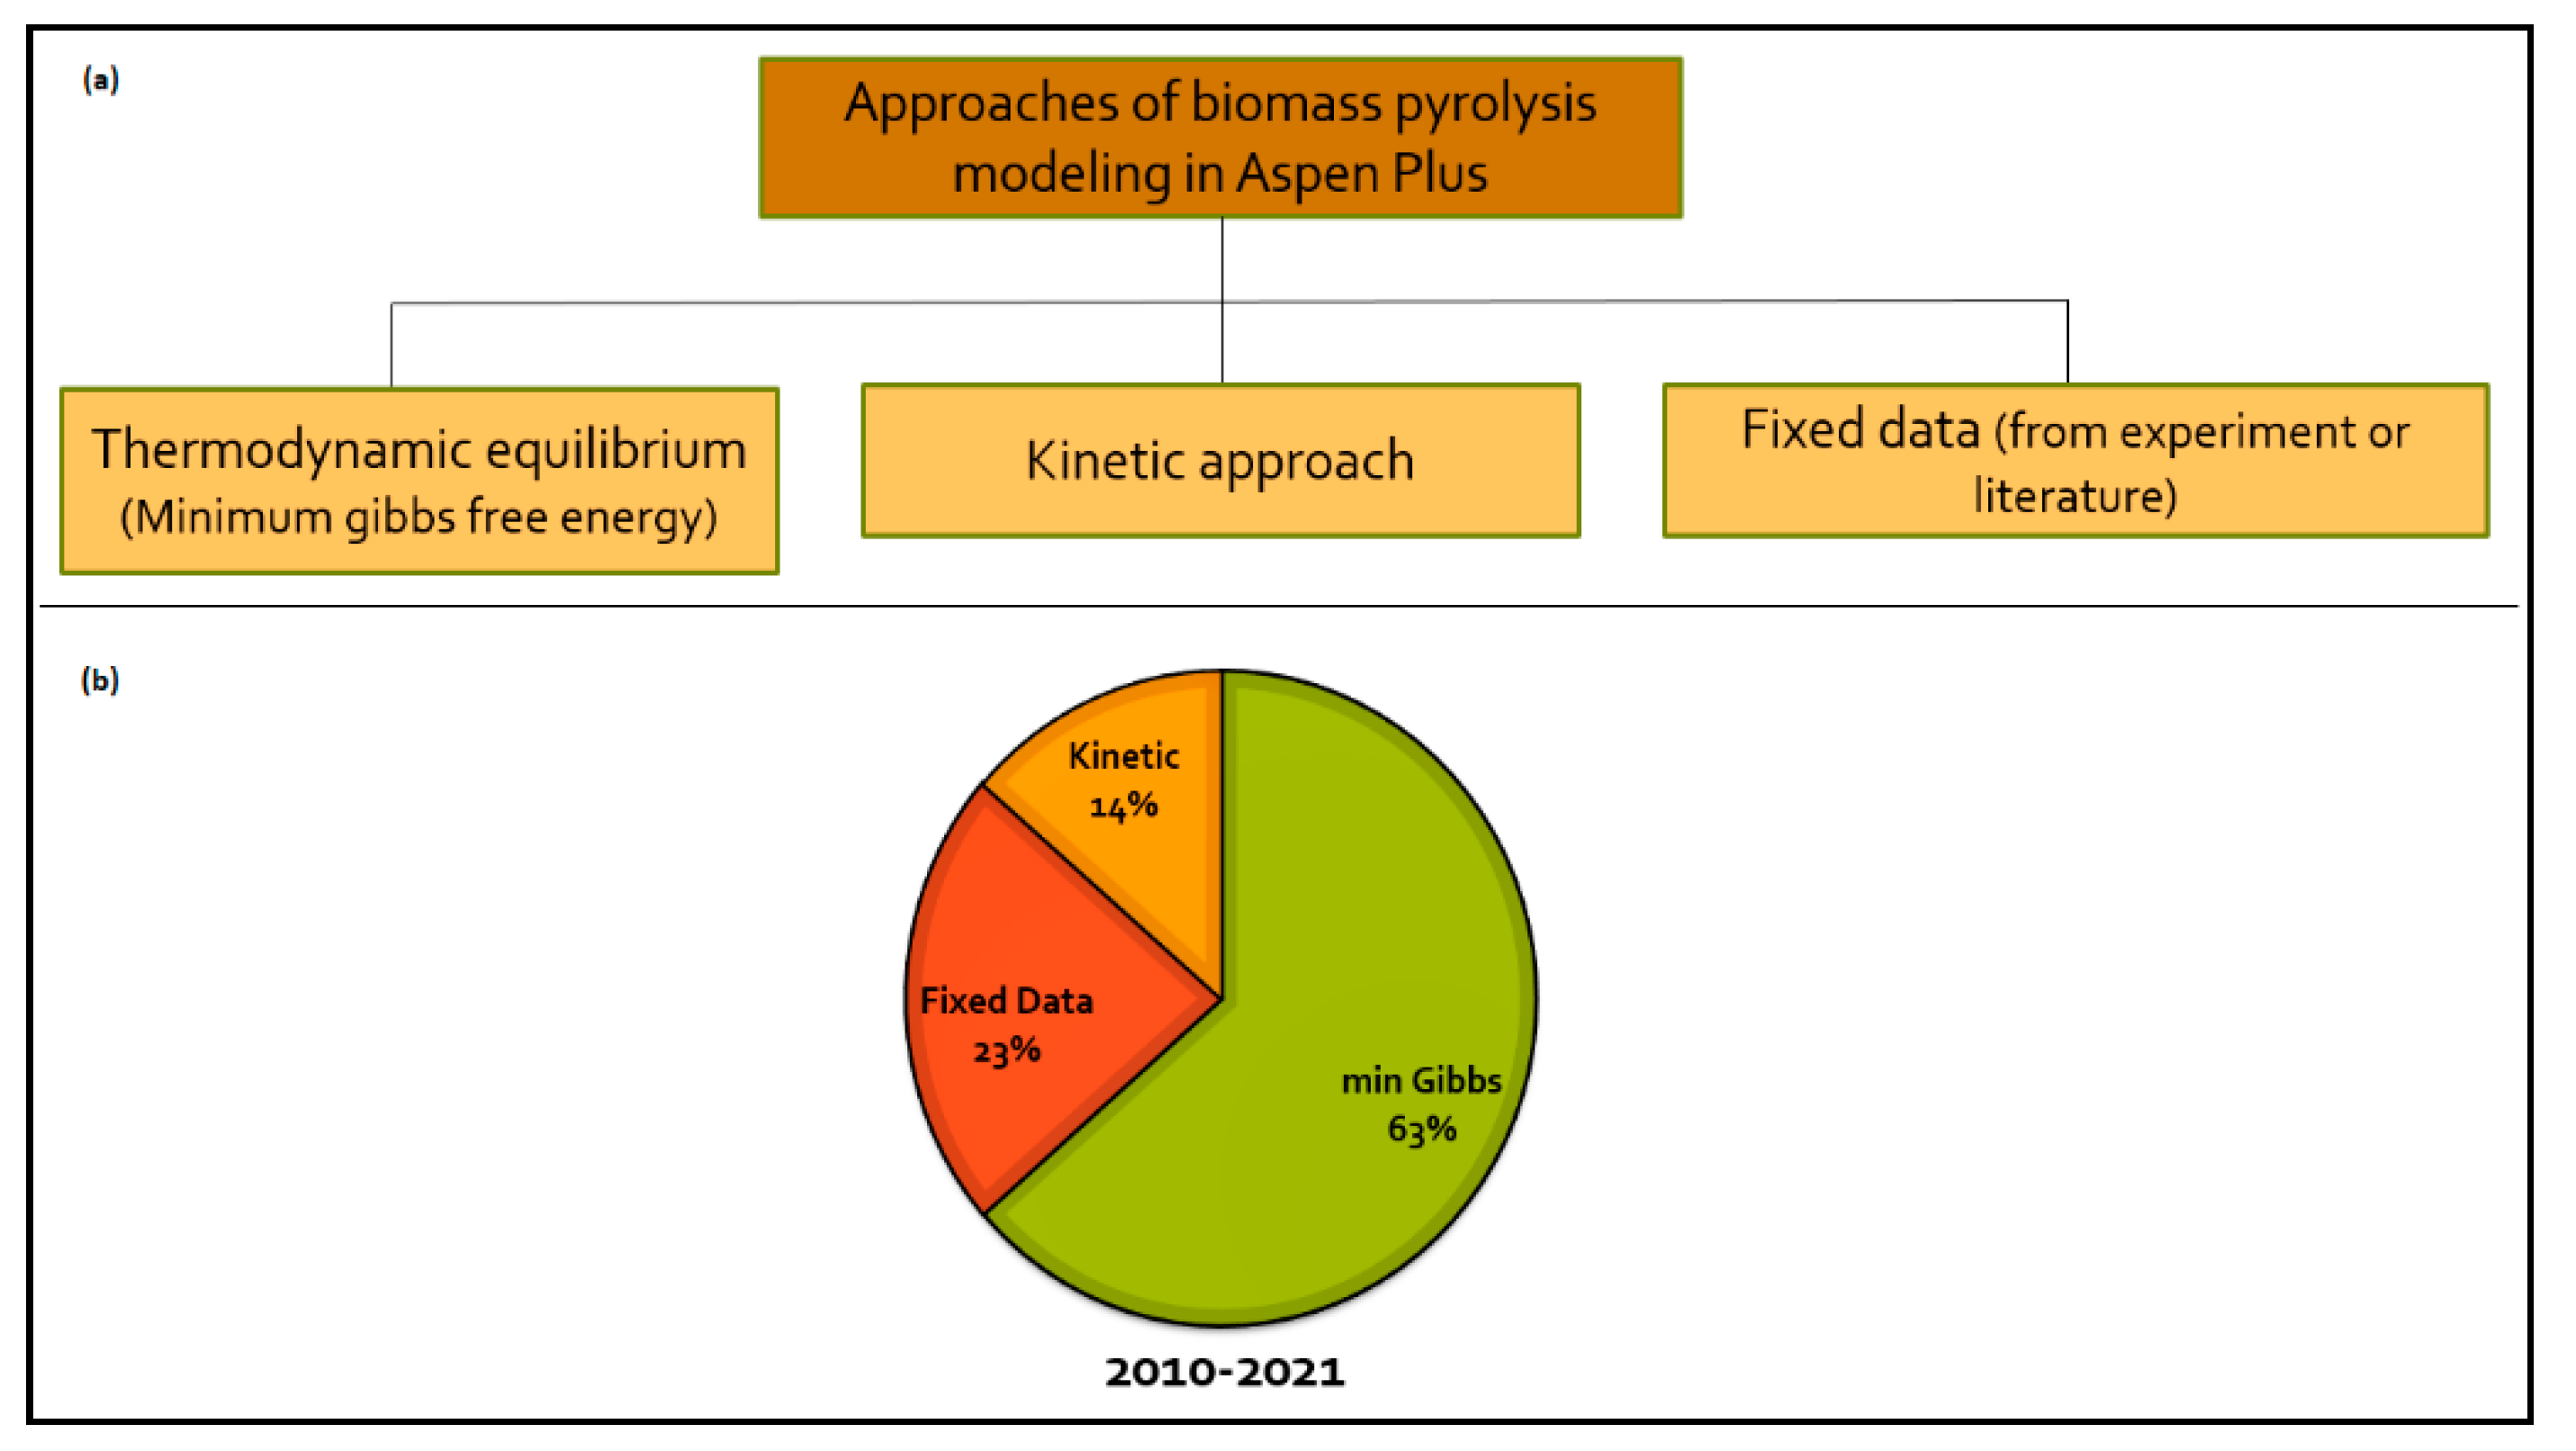
1.2. Approaches for Modeling of Pyrolysis and Simulation in Aspen Plus
- Substances are reacted in full mixed condition through unlimited time horizon;
- Temperature in the pyrolysis zone is constant;
- Chemical components are mixed perfectly.
1.3. Aim of the Work
2. Thermodynamic Equilibrium (TE) Model
2.1. Model Description
2.2. Results and Comparison
2.2.1. Comparison with Shahbaz et al. (2020) TE Model
2.2.2. Comparison with Visconti et al. (2015) TE Model
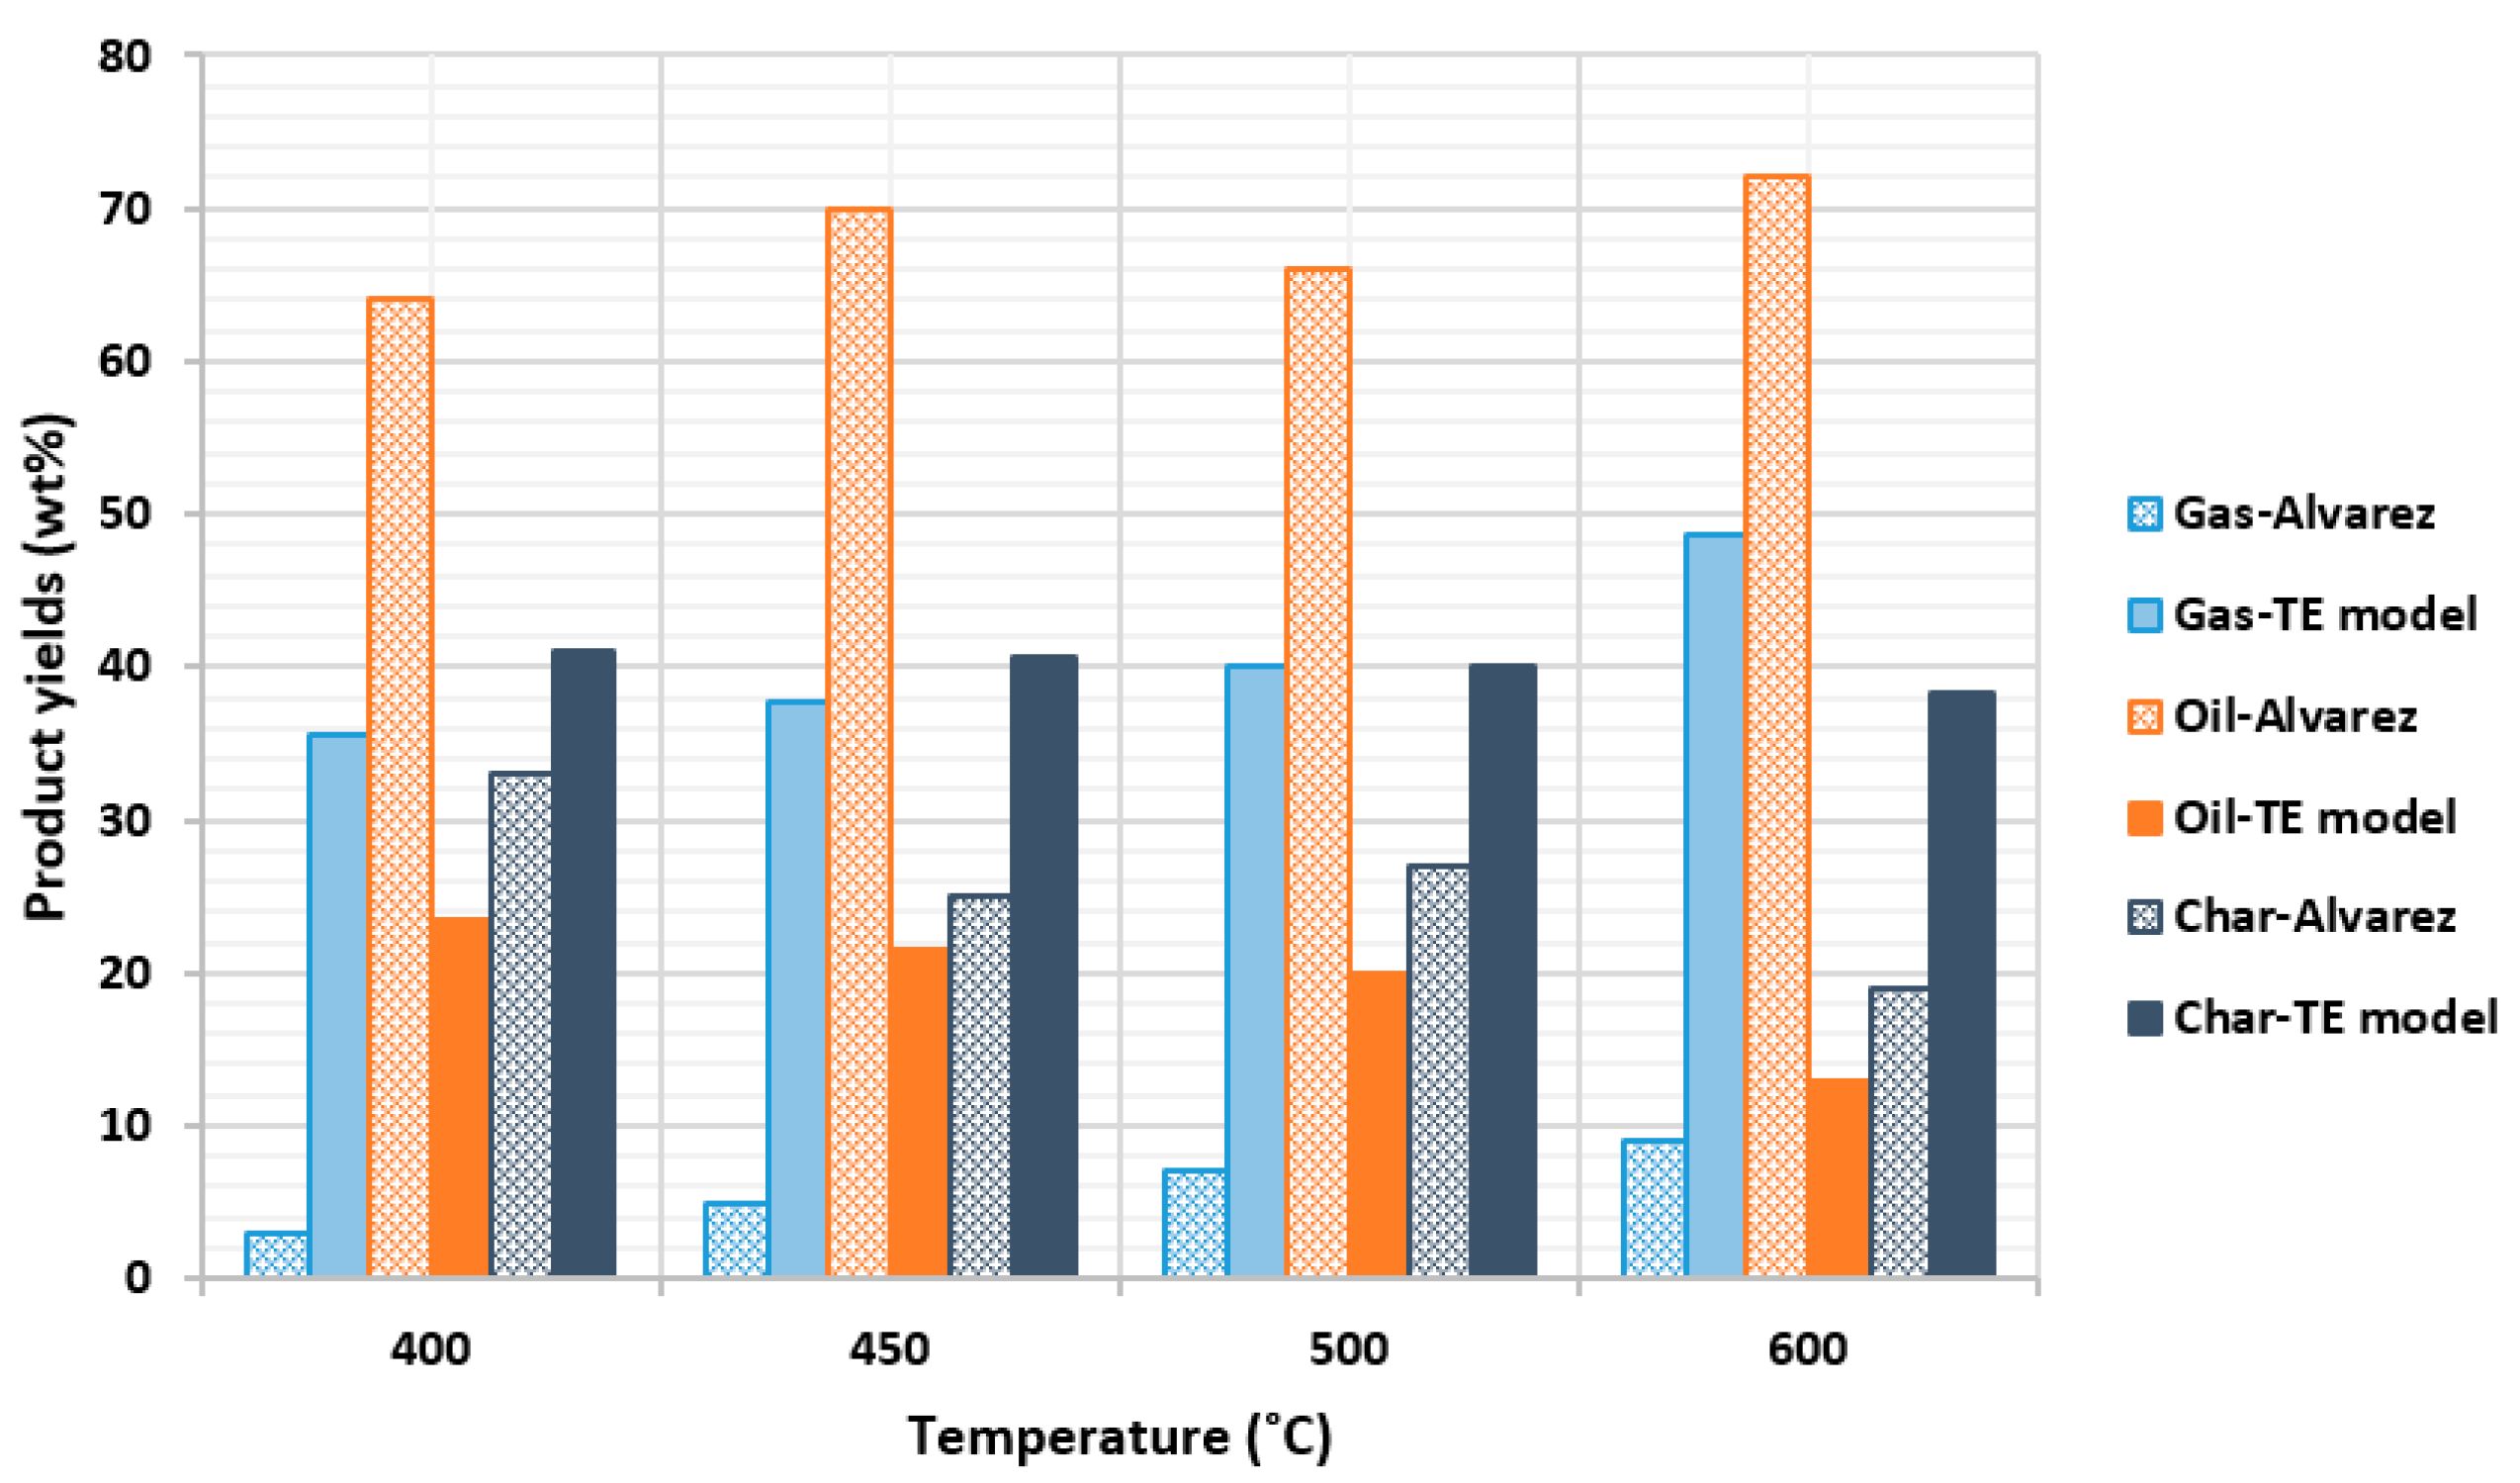
2.2.3. Comparison with Alvarez et al. (2014) Experiment
2.2.4. Comparison with Hernandez-Mena et al. (2014) Experiment
2.2.5. Comparison with Lee et al. (2013) Experiment
3. Kinetic Model
3.1. Model Description
3.2. Results and Comparison
3.2.1. Comparison with Peters et al. (2017) Kinetic Model and Experiment
3.2.2. Comparison with Calonaci et al. (2010) Kinetic Model and Experiment
3.2.3. Comparison with Lee et al. (2013) Experiment
4. Conclusions and Future Work
Author Contributions
Funding
Institutional Review Board Statement
Informed Consent Statement
Data Availability Statement
Conflicts of Interest
References
- Karmee, S.K.; Kumari, G.; Soni, B. Pilot scale oxidative fast pyrolysis of sawdust in a fluidized bed reactor: A biorefinery approach. Bioresour. Technol. 2020, 318, 124071. [Google Scholar] [CrossRef] [PubMed]
- Safarian, S.; Saryazdi, S.M.E.; Unnthorsson, R.; Richter, C. Artificial neural network modeling of bioethanol production via syngas fermentation. Biophys. Econ. Sustain. 2021, 6, 1–13. [Google Scholar] [CrossRef]
- Brownsort, P.A. Biomass Pyrolysis Processes: Performance Parameters and Their Influence on Biochar System Benefits. Master’s Thesis, University of Edinburgh, Edinburgh, UK, 2009. [Google Scholar]
- Rapier, R. Fossil Fuels Still Supply 84 Percent of World Energy—And Other Eye Openers from BP’s Annual Review. Available online: https://www.forbes.com/sites/rrapier/2020/06/20/bp-review-new-highs-in-global-energy-consumption-and-carbon-emissions-in-2019/?sh=7e22392866a1 (accessed on 16 February 2022).
- Manzano-Agugliaro, F.; Sanchez-Muros, M.; Barroso, F.; Martínez-Sánchez, A.; Rojo, S.; Pérez-Bañón, C. Insects for biodiesel production. Renew. Sustain. Energy Rev. 2012, 16, 3744–3753. [Google Scholar] [CrossRef]
- Manzano-Agugliaro, F.; Alcayde, A.; Montoya, F.G.; Zapata-Sierra, A.; Gil, C. Scientific production of renewable energies worldwide: An overview. Renew. Sustain. Energy Rev. 2013, 18, 134–143. [Google Scholar] [CrossRef]
- Safarian, S.; Unnthorsson, R.; Richter, C. Techno-economic and environmental assessment of power supply chain by using waste biomass gasification in iceland. BioPhysical Econ. Sustain. 2020, 5, 7. [Google Scholar] [CrossRef]
- Safarian, S.; Ebrahimi Saryazdi, S.M.; Unnthorsson, R.; Richter, C. Gasification of woody biomasses and forestry residues: Simulation, performance analysis, and environmental impact. Fermentation 2021, 7, 61. [Google Scholar] [CrossRef]
- Safarianbana, S. Simulation of a Small Scale Biowaste Gasification System for Energy Production. Ph.D. Thesis, University of Iceland, Reykjavík, Iceland, 2021. [Google Scholar]
- Safarian, S.; Unnthorsson, R.; Richter, C. Performance investigation of biomass gasification for syngas and hydrogen production using Aspen Plus. Open J. Model. Simul. 2022, 10, 71–87. [Google Scholar] [CrossRef]
- Safarian, S.; Unnthorsson, R.; Richter, C. Simulation and performance analysis of integrated gasification–syngas fermentation plant for lignocellulosic ethanol production. Fermentation 2020, 6, 68. [Google Scholar] [CrossRef]
- Safarian, S.; Unnthorsson, R.; Richter, C. Techno-economic analysis of power production by using waste biomass gasification. J. Power Energy Eng. 2020, 8, 1. [Google Scholar] [CrossRef]
- Safarian, S.; Unnthorsson, R.; Richter, C. Simulation of small-scale waste biomass gasification integrated power production: A comparative performance analysis for timber and wood waste. Int. J. Appl. Power Eng. 2020, 9, 147–152. [Google Scholar] [CrossRef]
- Safarian, S.; Unnthorsson, R.; Richter, C. Hydrogen production via biomass gasification: Simulation and performance analysis under different gasifying agents. Biofuels 2021, 1–10. [Google Scholar] [CrossRef]
- Duku, M.H.; Gu, S.; Hagan, E.B. Biochar production potential in ghana—A review. Renew. Sustain. Energy Rev. 2011, 15, 3539–3551. [Google Scholar] [CrossRef]
- Tripathi, M.; Sahu, J.N.; Ganesan, P. Effect of process parameters on production of biochar from biomass waste through pyrolysis: A review. Renew. Sustain. Energy Rev. 2016, 55, 467–481. [Google Scholar] [CrossRef]
- Nartey, O.D.; Zhao, B. Biochar preparation, characterization, and adsorptive capacity and its effect on bioavailability of contaminants: An overview. Adv. Mater. Sci. Eng. 2014, 2014, 715398. [Google Scholar] [CrossRef] [Green Version]
- Xiang, W.; Zhang, X.; Chen, J.; Zou, W.; He, F.; Hu, X.; Tsang, D.C.; Ok, Y.S.; Gao, B. Biochar technology in wastewater treatment: A critical review. Chemosphere 2020, 252, 126539. [Google Scholar] [CrossRef]
- Khodaei, H.; Gonzalez, L.; Chapela, S.; Porteiro, J.; Nikrityuk, P.; Olson, C. Cfd-based coupled multiphase modeling of biochar production using a large-scale pyrolysis plant. Energy 2021, 217, 119325. [Google Scholar] [CrossRef]
- Chi, N.T.L.; Anto, S.; Ahamed, T.S.; Kumar, S.S.; Shanmugam, S.; Samuel, M.S.; Mathimani, T.; Brindhadevi, K.; Pugazhendhi, A. A review on biochar production techniques and biochar based catalyst for biofuel production from algae. Fuel 2021, 287, 119411. [Google Scholar] [CrossRef]
- Nsamba, H.K.; Hale, S.E.; Cornelissen, G.; Bachmann, R.T. Sustainable technologies for small-scale biochar production—A review. J. Sustain. Bioenergy Syst. 2015, 5, 10. [Google Scholar] [CrossRef] [Green Version]
- Angın, D. Effect of pyrolysis temperature and heating rate on biochar obtained from pyrolysis of safflower seed press cake. Bioresour. Technol. 2013, 128, 593–597. [Google Scholar] [CrossRef]
- Raclavská, H.; Corsaro, A.; Juchelková, D.; Sassmanová, V.; Frantík, J. Effect of temperature on the enrichment and volatility of 18 elements during pyrolysis of biomass, coal, and tires. Fuel Process. Technol. 2015, 131, 330–337. [Google Scholar] [CrossRef]
- Zhao, B.; O’Connor, D.; Zhang, J.; Peng, T.; Shen, Z.; Tsang, D.C.; Hou, D. Effect of pyrolysis temperature, heating rate, and residence time on rapeseed stem derived biochar. J. Clean. Prod. 2018, 174, 977–987. [Google Scholar] [CrossRef]
- Patra, T.K.; Sheth, P.N. Biomass gasification models for downdraft gasifier: A state-of-the-art review. Renew. Sustain. Energy Rev. 2015, 50, 583–593. [Google Scholar] [CrossRef]
- Basu, P. Combustion and Gasification in Fluidized Beds; CRC Press: Boca Raton, FL, USA, 2006. [Google Scholar]
- Lestinsky, P.; Palit, A. Wood pyrolysis using Aspen Plus simulation and industrially applicable model. GeoScience Eng. 2016, 62, 11. [Google Scholar] [CrossRef] [Green Version]
- Safarian, S.; Unnthorsson, R.; Richter, C. Performance analysis of power generation by wood and woody biomass gasification in a downdraft gasifier. J. Appl. Power Eng. 2021, 10, 80–88. [Google Scholar] [CrossRef]
- Safarian, S.; Unnthorsson, R.; Richter, C. Bioethanol production via herbaceous and agricultural biomass gasification integrated with syngas fermentation. Fermentation 2021, 7, 139. [Google Scholar] [CrossRef]
- Ansah, E. Experimental Investigation and Aspen Plus Simulation of the MSW Pyrolysis Process. Master’s Thesis, North Carolina Agricultural and Technical State University, Greensboro, NC, USA, 2013. [Google Scholar]
- Ward, J.; Rasul, M.; Bhuiya, M. Energy recovery from biomass by fast pyrolysis. Procedia Eng. 2014, 90, 669–674. [Google Scholar] [CrossRef] [Green Version]
- Kabir, M.J.; Chowdhury, A.A.; Rasul, M.G. Pyrolysis of municipal green waste: A modelling, simulation and experimental analysis. Energies 2015, 8, 7522–7541. [Google Scholar] [CrossRef] [Green Version]
- Visconti, A.; Miccio, M.; Juchelková, D. An Aspen Plus tool for simulation of lignocellulosic biomass pyrolysis via equilibrium and ranking of the main process variables. Int. J. Math. Models Methods Appl. Sci. 2015, 9, 71–86. [Google Scholar]
- Dahawi, Y.A.; Abdulrazik, A.; Seman, M.N.A.; Aziz, M.A.A.; Yunus, M.Y.M. Aspen Plus simulation of bio-char production from a biomass-based slow pyrolysis process. Key Eng. Mater. 2019, 797, 336–341. [Google Scholar] [CrossRef]
- Miranda, N.T. Investigação das Condições Operacionais para Produção de Bio-Óleo e Biochar a Partir de Bagaço de Cana-de-Açúcar por Meio de Simulação e Aplicação em Planta Piloto: Investigation about Operational Conditions for Bio-Oil and Biochar Production from Sugarcane Bagasse through Simulation and Application in Pilot Plant. Master’s Thesis, Universidade Estadual de Campinas (UNICAMP), Campinas, Brazil, 2019. [Google Scholar]
- Adeniyi, A.; Odetoye, T.; Titiloye, J.; Ighalo, J. A thermodynamic study of rice husk (Oryza sativa) pyrolysis. Eur. J. Sustain. Dev. Res. 2019, 3, 1–10. [Google Scholar] [CrossRef]
- Adeniyi, A.G.; Otoikhian, K.S.; Ighalo, J.O.; Mohammed, I. Pyrolysis of different fruit peel waste via a thermodynamic model. ABUAD J. Eng. Res. Dev. 2019, 2, 16–24. [Google Scholar]
- Elkhalifa, S.; AlNouss, A.; Al-Ansari, T.; Mackey, H.R.; Parthasarathy, P.; Mckay, G. Simulation of food waste pyrolysis for the production of biochar: A Qatar case study. In Computer Aided Chemical Engineering; Elsevier: Amsterdam, The Netherlands, 2019; Volume 46, pp. 901–906. [Google Scholar]
- Ighalo, J.O.; Adeniyi, A.G. Thermodynamic modelling and temperature sensitivity analysis of banana (Musa spp.) waste pyrolysis. SN Appl. Sci. 2019, 1, 1086. [Google Scholar] [CrossRef] [Green Version]
- Miranda, N.T.; Maciel Filho, R.; Maciel, M.R.W. Sugarcane bagasse fast pyrolysis simulation: A thermodynamic equilibrium approach. Chem. Eng. Trans. 2019, 74, 175–180. [Google Scholar]
- Shahbaz, M.; AlNouss, A.; Parthasarathy, P.; Abdelaal, A.H.; Mackey, H.; McKay, G.; Al-Ansari, T. Investigation of biomass components on the slow pyrolysis products yield using Aspen Plus for techno-economic analysis. Biomass Convers. Biorefin. 2022, 12, 669–681. [Google Scholar] [CrossRef]
- AlNouss, A.; Parthasarathy, P.; Mackey, H.R.; Al-Ansari, T.; McKay, G. Pyrolysis study of different fruit wastes using an Aspen Plus model. Front. Sustain. Food Syst. 2021, 5, 4. [Google Scholar] [CrossRef]
- Liu, Y.; Zhu, Z.; Zhang, J.; Yang, X. Simulate the process of preparing biochar by pyrolysis of biomass via Aspen Plus and evaluate its economic. Res. Sq. 2021; preprint. [Google Scholar] [CrossRef]
- Peters, J.F.; Banks, S.W.; Bridgwater, A.V.; Dufour, J. A kinetic reaction model for biomass pyrolysis processes in Aspen Plus. Appl. Energy 2017, 188, 595–603. [Google Scholar] [CrossRef] [Green Version]
- Salman, C.A.; Schwede, S.; Thorin, E.; Yan, J. Predictive modelling and simulation of integrated pyrolysis and anaerobic digestion process. Energy Procedia 2017, 105, 850–857. [Google Scholar] [CrossRef]
- Jaroenkhasemmeesuk, C.; Tippayawong, N.; Ingham, D.B.; Pourkashanian, M. Process modelling and simulation of fast pyrolysis plant of lignocellulosic biomass using improved chemical kinetics in Aspen Plus®. Chem. Eng. Trans. 2020, 78, 73–78. [Google Scholar]
- Kälber, S.; Leible, L.; Domnik, T. Biochar from biogenic residues and waste: A techno-economic assessment of carbonization technologies. In Proceedings of the 27th European Biomass Conference (EUBCE), Lisbon, Portugal, 27–30 May 2019; p. 1202. [Google Scholar]
- Tangsathitkulchai, C.; Punsuwan, N.; Weerachanchai, P. Simulation of batch slow pyrolysis of biomass materials using the process-flow-diagram coco simulator. Processes 2019, 7, 775. [Google Scholar] [CrossRef] [Green Version]
- Zaini, I.N.; Sophonrat, N.; Sjöblom, K.; Yang, W. Creating values from biomass pyrolysis in sweden: Co-production of H2, biocarbon and bio-oil. Processes 2021, 9, 415. [Google Scholar] [CrossRef]
- Qu, T.; Guo, W.; Shen, L.; Xiao, J.; Zhao, K. Experimental study of biomass pyrolysis based on three major components: Hemicellulose, cellulose, and lignin. Ind. Eng. Chem. Res. 2011, 50, 10424–10433. [Google Scholar] [CrossRef]
- Xianjun, X.; Zongkang, S.; Peiyong, M. Establishment of three components of biomass pyrolysis yield model. Energy Procedia 2015, 66, 293–296. [Google Scholar] [CrossRef] [Green Version]
- Safarian, S.; Unnthorsson, R.; Richter, C. The equivalence of stoichiometric and non-stoichiometric methods for modeling gasification and other reaction equilibria. Renew. Sustain. Energy Rev. 2020, 131, 109982. [Google Scholar] [CrossRef]
- Safarian, S.; Unnþórsson, R.; Richter, C. A review of biomass gasification modelling. Renew. Sustain. Energy Rev. 2019, 110, 378–391. [Google Scholar] [CrossRef]
- Basu, P.; Kaushal, P. Modeling of pyrolysis and gasification of biomass in fluidized beds: A review. Chem. Prod. Process Modeling 2009, 1–45. [Google Scholar] [CrossRef]
- Peters, J.; Banks, S.; Susmozas, A.; Dufour, J. Experimental verification of a predictive pyrolysis model in Aspen Plus. In Proceedings of the 22nd European Biomass Conference and Exhibition, Hamburg, Germany, 23–26 June 2014. [Google Scholar]
- Vikram, S.; Rosha, P.; Kumar, S. Recent modeling approaches to biomass pyrolysis: A review. Energy Fuels 2021, 35, 7406–7433. [Google Scholar] [CrossRef]
- Safarian, S.; Richter, C.; Unnthorsson, R. Waste biomass gasification simulation using Aspen Plus: Performance evaluation of wood chips, sawdust and mixed paper wastes. J. Power Energy Eng. 2019, 7, 12–30. [Google Scholar] [CrossRef] [Green Version]
- Safarianbana, S.; Unnthorsson, R.; Richter, C. Development of a new stoichiometric equilibrium-based model for wood chips and mixed paper wastes gasification by Aspen Plus. In Proceedings of the ASME International Mechanical Engineering Congress and Exposition, Salt Lake City, UT, USA, 11–14 November 2019; American Society of Mechanical Engineers: New York, NY, USA, 2020; p. V006T006A002. [Google Scholar]
- Kaushal, P.; Tyagi, R. Advanced simulation of biomass gasification in a fluidized bed reactor using Aspen Plus. Renew. Energy 2017, 101, 629–636. [Google Scholar] [CrossRef]
- Keche, A.J.; Gaddale, A.P.R.; Tated, R.G. Simulation of biomass gasification in downdraft gasifier for different biomass fuels using Aspen Plus. Clean Technol. Environ. Policy 2015, 17, 465–473. [Google Scholar] [CrossRef]
- Alvarez, J.; Lopez, G.; Amutio, M.; Bilbao, J.; Olazar, M. Bio-oil production from rice husk fast pyrolysis in a conical spouted bed reactor. Fuel 2014, 128, 162–169. [Google Scholar] [CrossRef]
- Hernandez-Mena, L.E.; Pécoraa, A.; Beraldob, A.L. Slow pyrolysis of bamboo biomass: Analysis of biochar properties. Chem. Eng. 2014, 37, 115–120. [Google Scholar]
- Lee, Y.; Park, J.; Ryu, C.; Gang, K.S.; Yang, W.; Park, Y.-K.; Jung, J.; Hyun, S. Comparison of biochar properties from biomass residues produced by slow pyrolysis at 500 °C. Bioresour. Technol. 2013, 148, 196–201. [Google Scholar] [CrossRef] [PubMed]
- Humbird, D.; Trendewicz, A.; Braun, R.; Dutta, A. One-dimensional biomass fast pyrolysis model with reaction kinetics integrated in an Aspen Plus biorefinery process model. ACS Sustain. Chem. Eng. 2017, 5, 2463–2470. [Google Scholar] [CrossRef]
- Ranzi, E.; Corbetta, M.; Manenti, F.; Pierucci, S. Kinetic modeling of the thermal degradation and combustion of biomass. Chem. Eng. Sci. 2014, 110, 2–12. [Google Scholar] [CrossRef]
- Calonaci, M.; Grana, R.; Barker Hemings, E.; Bozzano, G.; Dente, M.; Ranzi, E. Comprehensive kinetic modeling study of bio-oil formation from fast pyrolysis of biomass. Energy Fuels 2010, 24, 5727–5734. [Google Scholar] [CrossRef]


| Strengths | Weakness | |
|---|---|---|
| Thermodynamic equilibrium method |
|
|
| Kinetics method |
|
|
| Fixed data technique |
|
|
| Block | Name | Definition |
|---|---|---|
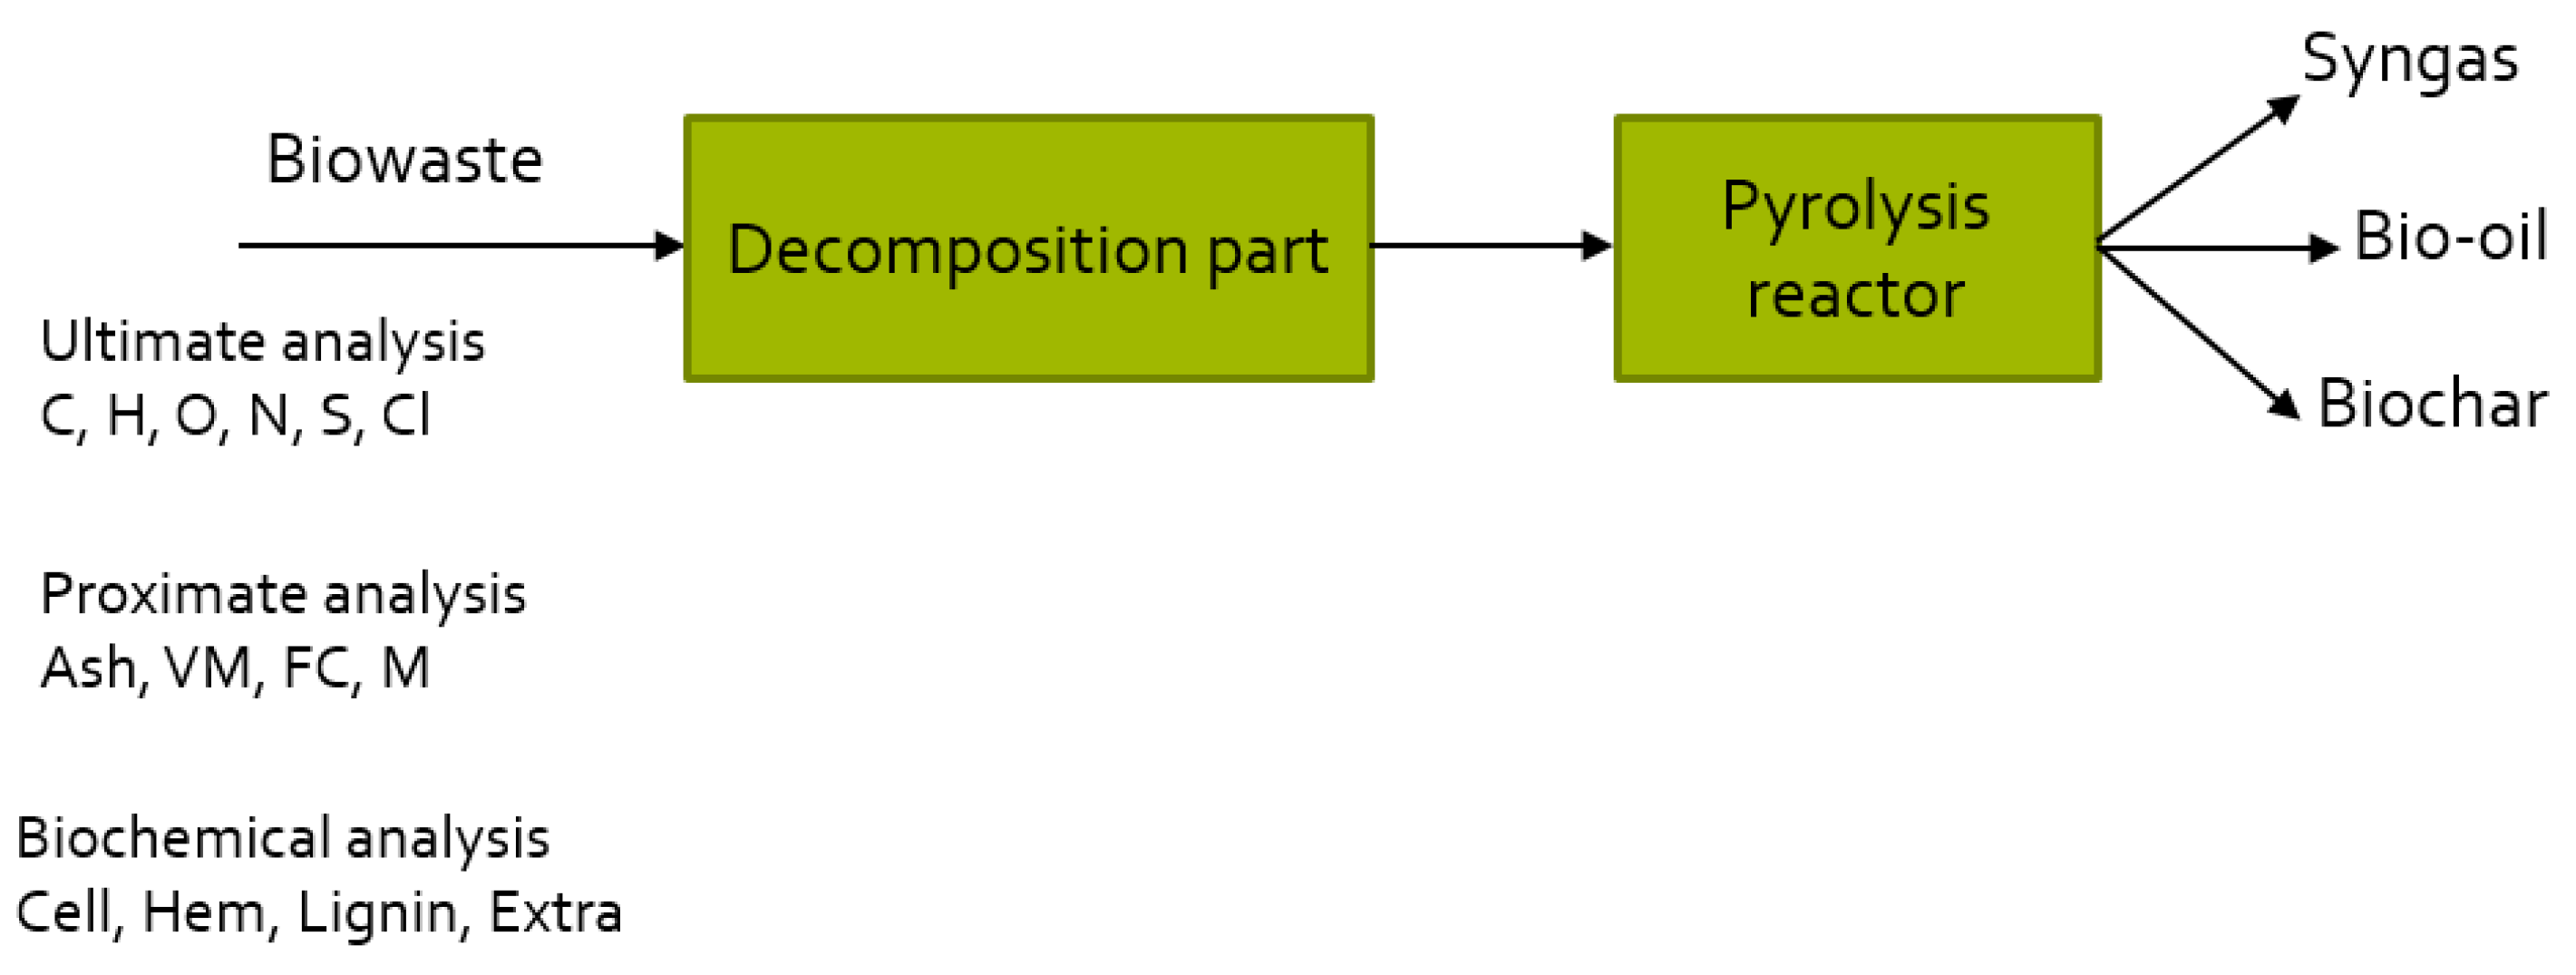
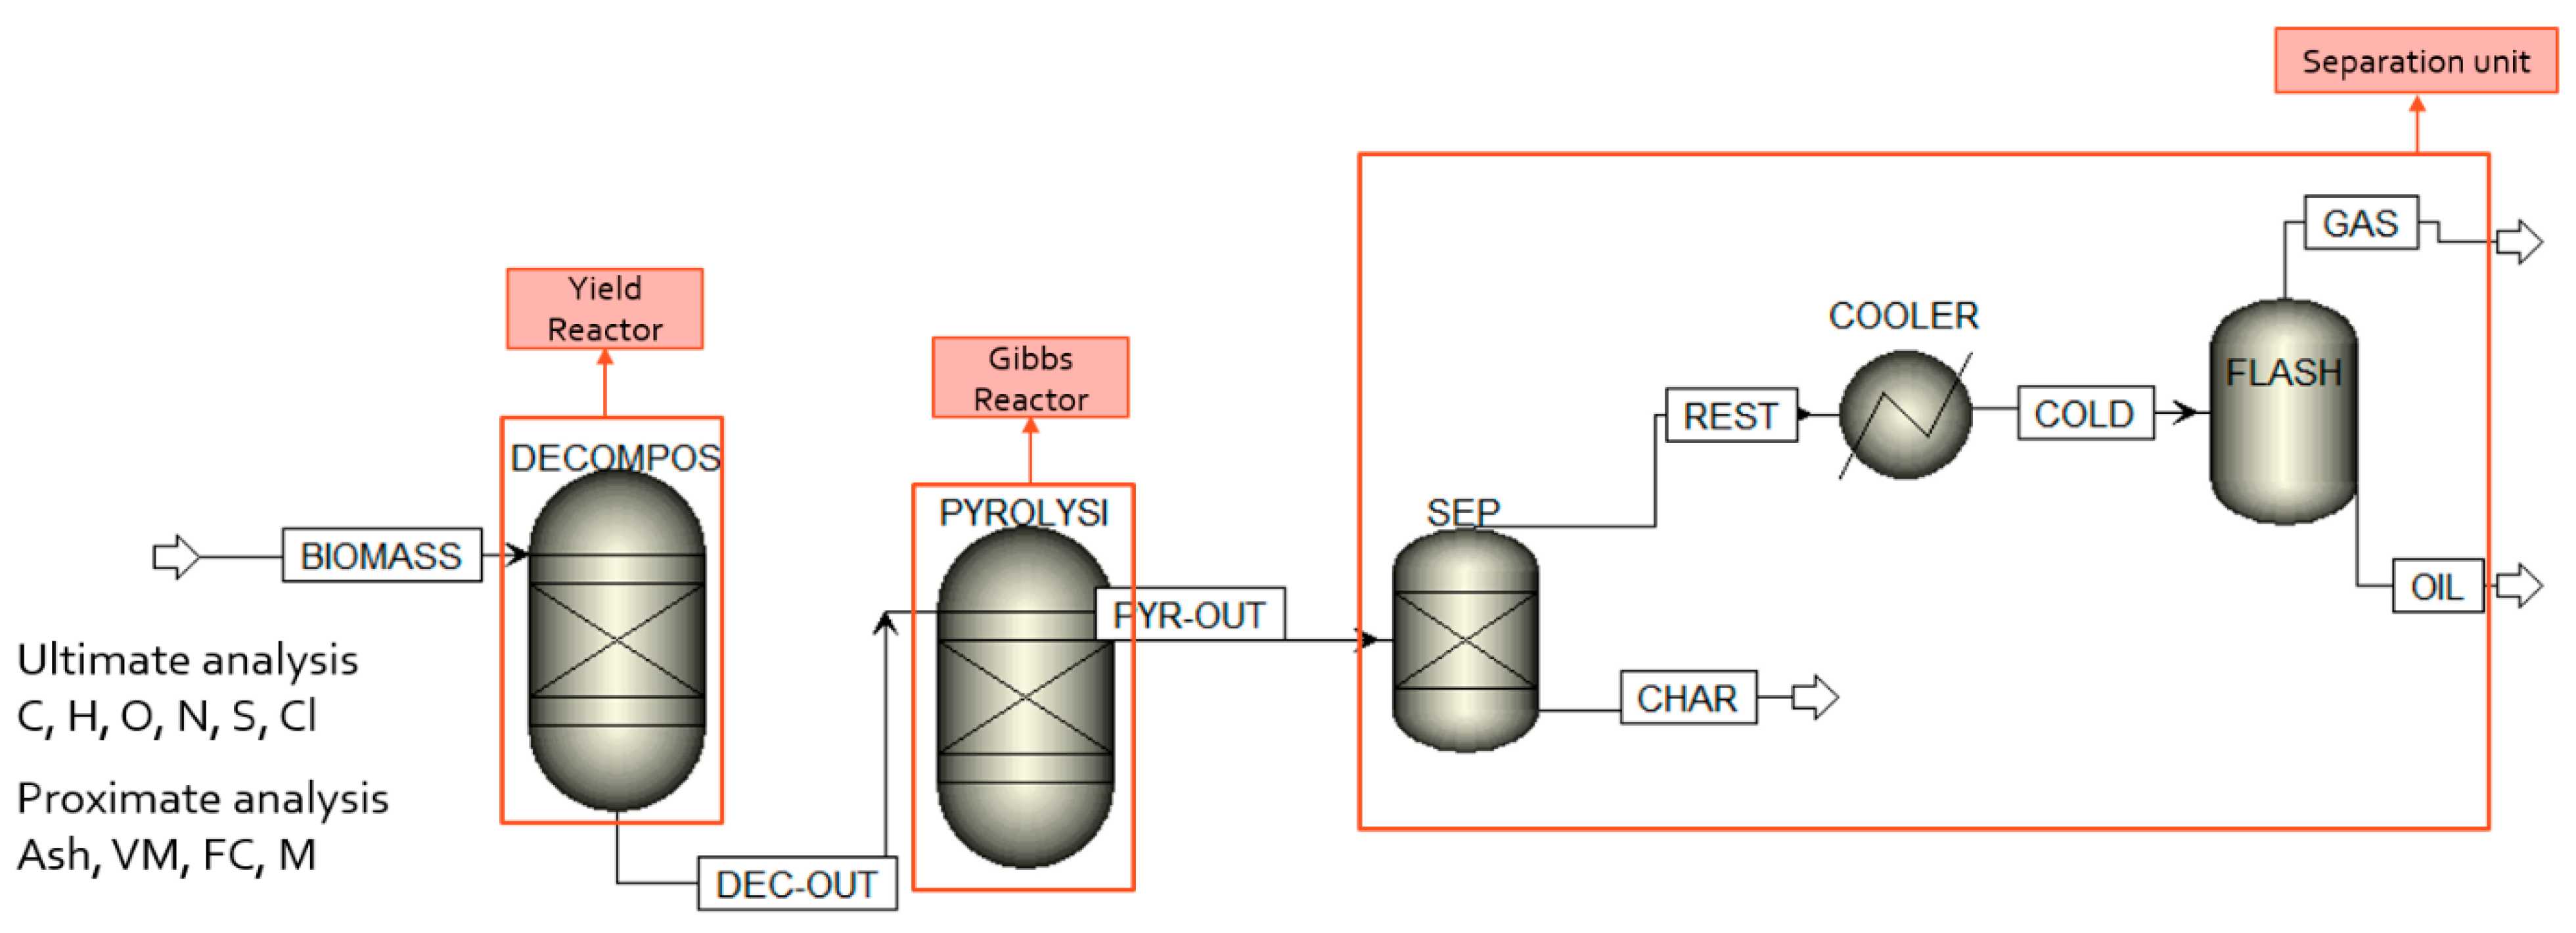
| RYield | DECOMPOS | Analysis of non-conventional biomass to conventional substances |
| RGibbs | PYROLYSIS | Rigorous equilibrium reactor based on minimum Gibbs free energy approach |
| Separator | SEP | Char and ash separation from the rest of steam via determination of split fractions |
| Exchanger | COOLER | To cool/reduce stream temperature |
| Flash/Separator | FLASH | One-stage separation process for splitting into two streams of non-condensates and condensates |
| Cellulose | Hemicellulose | Lignin | Biomass | Rice Husk | Bamboo | Bagasse | |
|---|---|---|---|---|---|---|---|
| Proximate analysis (wt%) | |||||||
| Moisture content | 3 | 3 | 3 | 7.86 | 1.1 | 9.37 ± 0.80 | 13.2 |
| Volatile matter (VM) | 94.25 | 83.15 | 64.66 | 84.71 | 70.5 | 70.31 ± 0.44 | 71 |
| Fixed carbon (FC) | 5.75 | 16.85 | 32.47 | 13.94 | 16.6 | 17.75 ± 0.40 | 13.7 |
| Ash content | 0 | 0 | 2.87 | 1.35 | 12.9 | 2.57 ± 0.41 | 2.1 |
| Ultimate analysis (wt% dry basis) | |||||||
| Carbon | 41.46 | 40.69 | 56.99 | 47.67 | 42 | 39 ± 3 | 51.71 |
| Hydrogen | 5.97 | 5.75 | 5.27 | 6.86 | 5.4 | 6.1 ± 0.2 | 5.32 |
| Nitrogen | 0.07 | 0.04 | 1.1 | 0.13 | 0.4 | 0.6 ± 0.3 | 0.33 |
| Oxygen | 52.48 | 53.49 | 33.52 | 43.98 | 39.3 | 54 ± 3 | 42.64 |
| Sulfur | 0.02 | 0.03 | 0.25 | 0.01 | 0 | 0.018 ± 0.006 | 0 |
| Cellulose | Hemicellulose | Lignin | ||||
|---|---|---|---|---|---|---|
| Current Study | Shahbaz et al. [41] Model | Current Study | Shahbaz et al. [41] Model | Current Study | Shahbaz et al. [41] Model | |
| Biochar | 23 | 23 | 22 | 22 | 58 | 58 |
| Bio-oil | 26 | 26 | 26 | 26 | 3 | 3 |
| Syngas | 51 | 51 | 52 | 52 | 39 | 39 |
| Current Study | Visconti et al. [33] Model | |
|---|---|---|
| 500 °C | 95.55 | 95.6 |
| 650 °C | 94.5 | 93 |
| 700 °C | 93.5 | 93 |
| 750 °C | 91.9 | 91.1 |
| Current Study | Visconti et al. [33] Model | |
|---|---|---|
| CO | 4.06 | 4 |
| CO2 | 28.1 | 28 |
| H2 | 39.4 | 40.5 |
| H2O | 6.5 | 10 |
| CH4 | 21.8 | 18 |
| Current Study | Lee et al. [63] Experiment | Deviation (%) | |
|---|---|---|---|
| Biochar | 30 | 24.5 | 18.33 |
| Bio-oil | 22 | 55.1 | 150.45 |
| Syngas | 49 | 20.4 | 58.37 |
| Reactions | |
|---|---|
| Cellulose | CELL --> ACT-CELL ACT-CELL --> 0.95 GLYCOL-ALDEHYDE + 0.25 GLYOXAL+ 0.2 ACETALDEHYDE + 0.25 HYDROXYMETHYLFURFURAL + 0.16 CO2+ 0.23 CO+ 0.9 H2O+ 0.1 METHANE + 0.61 C + 0.2 ACETONE CELL --> 5 H2O + 6 C |
| Hemicellulose | HEMICELL --> 0.4 HEM-1 + 0.6 HEM-2 HEM-1 --> 1.25 H2 + 0.5 CO2 + CO + 0.5 FORMALDEHYDE + 0.25 METHANOL + 0.125 ETHANOL + 2.125 H2O + 2.3 C + 0.075 ETHYLENE + 0.05 METHANE HEM-2 --> XYLOS |
| Lignin | LIG-C --> 0.3 LIG-CC + 0.1 COUMARYL + 0.08 PHENOL + 0.41 ETHYLENE + H2O + 0.495 METHANE + 0.82 CO + 6.985 C + 1.35 H2 LIG-CC --> 0.3 COUMARYL + 0.2 PHENOL + 0.35 PROPENE-DIAL + 0.7 H2O + 0.65 METHANE + 0.6 ETHYLENE + 7.4 C + 0.8 CO + H2 LIG-H + LIG-O --> 2 LIG-OH + ACETONE + CO2 LIG-OH --> PHENOL + 0.5 H2O + METHANOL + 0.5 METHANE + ETHYLENE + 0.5 CO + 2.5 H2 + 9 C LIG-OH --> 3 PHENOL + METHANE |
| Water | Cellulose | Hemicellulose | Lignin | Ash |
|---|---|---|---|---|
| 12.95 | 40.26 | 21.68 | 19.91 | 1.62 |
| 470 °C | 570 °C | |||||
|---|---|---|---|---|---|---|
| Current Study | Experiment | Kinetic Simulation by Peters et al. [44] | Current Study | Experiment | Kinetic Simulation by Peters et al. [44] | |
| Gas | 23.3 | 19.07 | 14.88 | 25.18 | 24.2 | 21.90 |
| Oil | 63 | 66.56 | 66.28 | 62.4 | 60.5 | 65.90 |
| Char | 13.8 | 14.27 | 18.82 | 12.4 | 10.3 | 12.03 |
| Water | Cellulose | Hemicellulose | Lignin |
|---|---|---|---|
| 8 | 48.75 | 21.39 | 21.86 |
| Current Study | Experiment | Kinetic Model by Calonaci et al. [66] | |
|---|---|---|---|
| Syngas | 19 | 17 | 17.20 |
| Bio-oil | 70 | 70 | 68.60 |
| Biochar | 11 | 12 | 14.10 |
| Bagasse | Paddy Straw | Wood Bark | ||||
|---|---|---|---|---|---|---|
| Current Study | Lee et al. [63] Experiment | Current Study | Lee et al. [63] Experiment | Current Study | Lee et al. [63] Experiment | |
| Syngas | 26 | 24.5 | 41 | 41 | 29.6 | 31.9 |
| Bio-oil | 53 | 55.1 | 40 | 37.2 | 52 | 50.5 |
| Biochar | 20.7 | 20.4 | 19 | 21.8 | 18.2 | 17.6 |
Publisher’s Note: MDPI stays neutral with regard to jurisdictional claims in published maps and institutional affiliations. |
© 2022 by the authors. Licensee MDPI, Basel, Switzerland. This article is an open access article distributed under the terms and conditions of the Creative Commons Attribution (CC BY) license (https://creativecommons.org/licenses/by/4.0/).
Share and Cite
Safarian, S.; Rydén, M.; Janssen, M. Development and Comparison of Thermodynamic Equilibrium and Kinetic Approaches for Biomass Pyrolysis Modeling. Energies 2022, 15, 3999. https://doi.org/10.3390/en15113999
Safarian S, Rydén M, Janssen M. Development and Comparison of Thermodynamic Equilibrium and Kinetic Approaches for Biomass Pyrolysis Modeling. Energies. 2022; 15(11):3999. https://doi.org/10.3390/en15113999
Chicago/Turabian StyleSafarian, Sahar, Magnus Rydén, and Matty Janssen. 2022. "Development and Comparison of Thermodynamic Equilibrium and Kinetic Approaches for Biomass Pyrolysis Modeling" Energies 15, no. 11: 3999. https://doi.org/10.3390/en15113999
APA StyleSafarian, S., Rydén, M., & Janssen, M. (2022). Development and Comparison of Thermodynamic Equilibrium and Kinetic Approaches for Biomass Pyrolysis Modeling. Energies, 15(11), 3999. https://doi.org/10.3390/en15113999