Article

The Thermochemical Conversion of Forestry Residues from Silver Fir (Abies alba Mill.) by Torrefaction and Pyrolysis

“Petru Poni” Institute of Macromolecular Chemistry, 41A Grigore Ghica Vodă Alley, 700487 Iași, Romania
*
Author to whom correspondence should be addressed.
Energies 2022, 15(10), 3483; https://doi.org/10.3390/en15103483
Submission received: 19 April 2022 / Revised: 30 April 2022 / Accepted: 6 May 2022 / Published: 10 May 2022
(This article belongs to the Special Issue Pyrolysis and Gasification of Biomass and Waste)

Abstract

:
Forestry residue is a renewable energy biomass whose valorization has increased due to the interest in replacing exhaustible and environmentally unfriendly fossil resources. Needles, cones and bark from silver fir were thermally processed by separated and combined torrefaction (250 °C) and pyrolysis (550 °C). The torrefaction removed the humidity and extractives and degraded the hemicelluloses, significantly decreasing the oxygen content to ~11 wt% and increasing the carbon content to ~80 wt%, while enhancing the calorific value of the solids (~32 MJ/kg). The pyrolysis produced solid materials with high amounts of fixed carbon (~60–70 wt%) and high heating values, of ~29 MJ/kg. The combined torrefaction + pyrolysis increased the energy yield of the process and decreased the O/C and H/C atomic ratios to about 0.1 and 0.5, respectively, which is close to those of coals. It also led to condensable products with more homogeneously distributed compounds, regardless of the initial biomass type. More than 110 chemical compounds were confirmed in the condensable products, in amounts that depended on the type of starting material and on the thermal treatment. These included the following: terpenes, from extractives; furans, acids and linear ketones, from hemicelluloses; cyclic ketones and saccharides, from cellulose; and aromatic hydrocarbons and phenol derivatives, from lignin. Clear distinctions between the thermal procedures and the sample origins were evidenced by an exploratory data analysis (PCA), which suggested the presence of different types of lignin in the three starting materials.

1. Introduction

Biomass is a necessary and reliable energy resource, since it is the only renewable energy material with unlimited supplies, from trees to crops and animal wastes. Bioenergy is the chemical energy harvested and stored by plants through photosynthesis from solar energy (sunlight). The production of bioenergy from bioproducts could provide a clean alternative to traditional fossil fuels, such as coal, crude oil, or natural gas and, consequently, contribute to environmental and economic sustainability. Specific types of biomass as potential candidate feedstocks for energy production include energy grasses, forestry residues, agricultural crops, urban wood waste, animal manure or algae crops [1]. In particular, forestry residues, which are often burned on-site or are prone to fire hazard, have received increasing attention as valuable materials in addition to the need to prevent waste accumulation [2]. The forestry residues available for energy production include branches, bark, cones and leaves/needles resulting from forest management operations such as logging (cutting, processing and transportation) or from natural attrition (the effects of insects or diseases on trees) [3]. Firs are among the most important trees in the coniferous forests in the mountainous regions of Europe, spreading from Poland to the northern border of Greece and from the Romanian Carpathians to Western Alps [4].
The greatest natural resources in Romania are its forests and agricultural land. The forests cover 6.4 million ha, with mountainous areas being the most predominant, followed by hilly areas and plains. The forests feature 29.9% coniferous (fir, spruce, pines, etc.) and 49.5% deciduous (beech, oak) tree species. Forest accessibility (terrain type, slope) can be a challenge for biomass valorization. Up to 80% of the forestry residues are potentially available for energy production in plain and hilly zones, but they are difficult to access in mountainous areas, which limits their usage to relatively small quantities [5].
Biomass is largely considered for the valorization of its structural constituents, mainly cellulose and lignin [6,7]. Many emerging technologies and effective conversion processes, including pyrolysis, combustion and gasification, are used to transform biomass into valuable bioproducts, such as chemicals and/or liquid fuels. Pyrolysis is a complex process of thermal treatment at high temperatures in inert environments (featuring the absence or limited amounts of air/oxygen) [8], in which biomass is converted into noncondensable gases, condensable liquids and solid products (biochar) [9]. The long-distance transportation of biomass as feedstock material for pyrolysis involves some inherent limitations due to the physical features of biomass, such as low density, high moisture and volatile content and low stability. Therefore, upgrading pretreatments such as deoxygenation and densification are needed. Torrefaction is an effective method to improve the quality of the biomass material required for pyrolysis [10]. Torrefaction is a mild thermal treatment that typically occurs from 200 to 300 °C, with a heating rate slower than 50 °C min−1 and a long residence time, in oxygen-free atmosphere [11]. Torrefaction is applied to remove physically and chemically bound water and volatiles, avoiding advanced degradation and carbonization reactions [12]. Hemicelluloses are the most thermally labile during torrefaction, while lignin is partly decomposed to some extent. This makes the biomass nonfibrous and, therefore, easily grindable and suitable for pelletization, as well as easier to handle, store and transport. Arias et al. [13] reported that the torrefaction of eucalyptus biomass at 240 °C with a 30-min residence time had a substantial effect on the chemical and grindability properties. Furthermore, Dyjakon and Noszczyk [14] evaluated the effect of the torrefaction temperature on the mechanical durability of pellets made from various biomass wastes and on the required energy for grinding.
The main purpose of torrefaction is to enhance biomass properties, leading to the formation of a hydrophobic solid material with low moisture content and high calorific value compared with the original biomass. Maximizing the energy and solid yields of biomass by torrefaction is possible by minimizing the oxygen-to-carbon (O/C) ratio. Chew and Doshi [15] reported that torrefaction above 250 °C shifts the H/C and O/C atomic ratios of woody biomass towards that of lignite (brown coal).
Forestry biomass is a lignocellulosic material that is mainly composed of intertwined hemicelluloses, cellulose and lignin, along with small amounts of extractives and inorganics. Generally, lignocellulosic materials have 65–75 wt% carbohydrates (hemicelluloses and cellulose) and 18–35 wt% lignin. Coniferous wood species, known as softwoods, have high cellulose (40–45 wt%) and lignin (26–34 wt%) content but low amounts of pentosans (7–14 wt%), while deciduous species (hardwoods) have less cellulose and lignin content (38–49 wt% and 23–30 wt%, respectively) and higher amounts of 19–26 wt% pentosans [16]. Hemicelluloses are less thermally stable and start to decompose at about 200 °C. The pyrolysis of hemicelluloses produces aldehydes, acids, ketones, furans and alcohols [17]; the main compounds are furfural and acetic acid, but hydroxyacetone, formic acid, propionic acid, 5-hydroxymethylfurfural, cyclopentenone, CO2 and CO are also formed in high amounts [18]. Cellulose decomposition mainly occurs between 300 and 400 °C, the main pyrolysis products consisting in levoglucosan, furans and light oxygenates, such as glycolaldehyde and formic acid [19]. Lignin consists of a complex phenolic macromolecular network that provides rigidity and hydrophobicity to lignocellulosic materials. Lignin is composed of three structural units, namely p-hydroxyphenyl (H), guaicyl (G) and syringyl (S), softwoods containing mainly guaiacyl-type lignin [20]. The pyrolysis of lignin takes place in a broader temperature range, from 160 °C to 500 °C, but continues slowly up to as much as 900 °C [21]. Borella et al. [22] studied the chemical composition of lignin Kraft bio-oil by GC–MS analysis and found alkyl and alkoxy-phenols, alkyl-di-hydroxybenzenes, several other oxygenated compounds and a small number of hydrocarbons.
Many researchers have studied the thermal decomposition of forestry biomass residues and wastes [23] from the point of view of thermal properties [24,25] or for energy purposes [26]. To fully understand the potential of the pyrolysis process, the detailed characterization of its products, especially bio-oil and biochar, is a necessity. Negahdar et al. [27] identified more than 200 compounds in the bio-oils obtained through the fast pyrolysis of pinewood, wheat straw and rapeseed cake. Among these, phenolic compounds such as phenols, benzenediols, methoxyphenol and dimethoxyphenol derivatives were found in high amounts. Generally, the total amount of phenolic compounds in the pyrolysis oil varies from 20% to 30%. Phenolic compounds are highly valuable as transportation fuel additives and precursors for chemical products, but they also have some drawbacks in bio-oils due to their oxygen content, which lowers the heating value, and due to their high corrosiveness [28].
Here, we present a comparative study on using torrefaction and pyrolysis as thermal conversion processes for forestry residues. Needles, cones and bark from silver fir (Abies alba Mill.) were considered as biomass feedstock. The thermal processes are discussed in terms of energy efficiency based on the properties of the obtained solid materials and from the point of view of the composition of the liquid products. Particularities were observed, related both to the biomass source (needles, cones or bark) and to the thermal treatment method (individual or combined torrefaction and pyrolysis).

2. Materials and Methods

2.1. Materials

Needles (FN), cones (FC) and bark (FB) from 100-year-old silver fir (Abies alba Mill.), which were considered representative forestry residues, were chosen for this study. The samples studied in this work were collected at the end of summer of 2020 from the northeastern mountain region of Romania, after proper authentication by a specialist. Sample preparation consisted in drying, particle size reduction and sieving. In brief, samples were collected from their natural habitat and conditioned in a shadowed and ventilated placed for one month. The air-dried samples were ground and then sieved to small particle sizes of less than 500 µm, before performing the torrefaction and pyrolysis tests. This particle size was found to be suitable for thermal treatment because usually lignocellulosic materials need to be ground into fine particles to achieve higher thermal efficiency [29,30].
The composition (expressed in wt%) of fir samples was as follows. Needles: 29.3 extractives, 18.8 hemicelluloses, 23.3 cellulose, 27.9 Klason lignin. Cones: 19.8 extractives, 19.9 hemicelluloses, 22.7 cellulose, 33.7 Klason lignin. Bark: 16.57 extractives, 24.3 hemicelluloses, 26.6 cellulose, 31.2 Klason lignin [31].

2.2. Torrefaction and Pyrolysis Experiments

The torrefaction and pyrolysis experiments were performed under a self-generated atmosphere in a semi-batch process schematically represented in Figure 1, using a glass reactor with an internal diameter of 25 mm and a total length of 320 mm. Samples of 10 ± 0.1 g were used in each experiment. The fir biomass samples were subjected to torrefaction at 250 °C (noted as “To” in this text) or to pyrolysis at 550 °C (noted as “Py”), heating the furnace at a rate of 10 °C min−1 up to the final temperature, which was maintained for 60 min. Two-step thermal processing was also performed, using torrefaction as a preliminary pretreatment, followed by pyrolysis of the torrefied solid material; this is noted as “PyTo”.
The products of thermal treatment by torrefaction and/or pyrolysis consisted of volatile non-condensable compounds in the form of gases, volatile condensable products (liquid fraction) separately collected as an aqueous phase and an organic fraction (oil) and the solid residue that remained at the bottom of the reactor (biochar). The liquid products were collected in a graduated cylinder after cooling with ethylene glycol by a refrigerated bath at −15 °C, as shown in Figure 1. The liquid and char yields were gravimetrically determined, while the gas yield was calculated by difference.

2.3. Proximate/Ultimate and Thermal Analysis

The solid materials, both the initial fir samples and the torrefied and/or pyrolyzed residues, were subjected to proximate/ultimate analysis and to thermogravimetric analysis.
Proximate analysis included moisture, ash, volatile matter and fixed carbon content. These were determined based on thermogravimetric analysis performed using a Discovery TGA 5500 IR thermobalance from TA Instruments, New Castle, DE, USA. Samples of ~6.5 mg were heated by 10 °C min−1 up to 900 °C under an inert N2 flow of 25 mL min−1. When temperature reached 900 °C, the nitrogen flow was replaced by an oxidative flow of 20 mL min−1 air and the temperature was maintained constant for another 5 min. Moisture (M) was considered as the mass loss below 110 °C. Volatile matter (VM) was calculated as the mass loss from 110 to 900 °C under N2 atmosphere. Fixed carbon (FC) was determined as the mass loss when the carbonaceous residue was burnt in the presence of air at 900 °C. Ash was determined as the final solid residue at 900 °C in air, when no more mass loss was detected.
Ultimate analysis was performed for determination of carbon and hydrogen content using Pregl method, of nitrogen content by Kjeldahl method and of sulfur content using Schonneger method. The oxygen content was calculated by difference. Each determination was performed in triplicate and the average values were reported. The results were expressed on moisture-free basis. The hydrogen, carbon and oxygen mass percentage content were used to calculate the H/C and O/C atomic ratios [32].
The high heating values (HHV), expressed in MJ/kg, were calculated using Equation (1) [33], where C, H, S, O and N represent carbon, hydrogen, sulphur, oxygen, and nitrogen content, respectively as weight percentages, as determined by ultimate analysis.
HHV = 0.3491 C + 1.1783 H + 0.1005 S − 0.1034 O − 0.0151 N − 0.0211 Ash
The energy efficiency of torrefaction and/or pyrolysis processes was determined based on the energy yield and the energy density, calculated according to Chen et al. [34], using Equations (2) and (3):
Energy density (ED) = HHVt/HHVr
Energy yield (EY) = SY × ED
where HHVr and HHVt are the high heating values of the raw and of the thermally treated samples, respectively, while SY is the solid yield of the thermal processes.

2.4. GC–MSD Analysis

Gas chromatography coupled with mass selective detector (GC-–MDS) was performed on a 6890 N Agilent gas chromatograph coupled to a 5975 inert XL Agilent mass selective detector (Agilent, Santa Clara, CA, USA) working at 70 eV, to determine the composition of liquid products. The chromatographic separation was obtained on an HP5—MS column (30 m in length, 0.25 mm in diameter and with a film thickness of 0.25 μm) coated with (5%—phenyl)—methylpolysiloxane. The following temperature program was used: 2 min at 40 °C, ramp of 10 °C/min−1 up to 320 °C. The injector and detector temperatures were both 230 °C, while the transfer line between the GC column and the MSD detector was of 280 °C. Helium was used as carrier gas, with a flow rate of 1 mL min−1. Identification of compounds was performed according to NIST14 database, with a quality of recognition above 85%. Confirmation of identified structures was obtained comparing the calculated Kovats index with the NIST values and by cross-validation between the 18 samples analyzed in this study. The organic fractions were injected by syringe, in volumes of 0.2 μL, with a split ratio of 50:1. The organic compounds from aqueous phase were concentrated on a 57328-U Supelco Divinylbenzene/Carboxen/Polydimethylsiloxane (DVB/CAR/PDMS) solid-phase microextraction (SPME) fiber. Subsequently, they were thermally desorbed for 30 s directly into the GC-–MSD inlet.
The global composition of the aqueous and oil fractions was described with the NP-gram curves, which were calculated based on the percentage area from the GC–MSD chromatograms. These curves represent the sum of the peak areas of all compounds appearing in a chromatogram in the retention time range corresponding to two successive normal paraffins (Cn−1 and Cn), versus the corresponding carbon number, n, of the normal paraffin from the upper limit of the range [35,36]. For example, all compounds appearing in the chromatogram after the retention time of octane (C8), but before the retention time of nonane (C9), are considered to have the carbon number of 9 (C9).

3. Results and Discussion

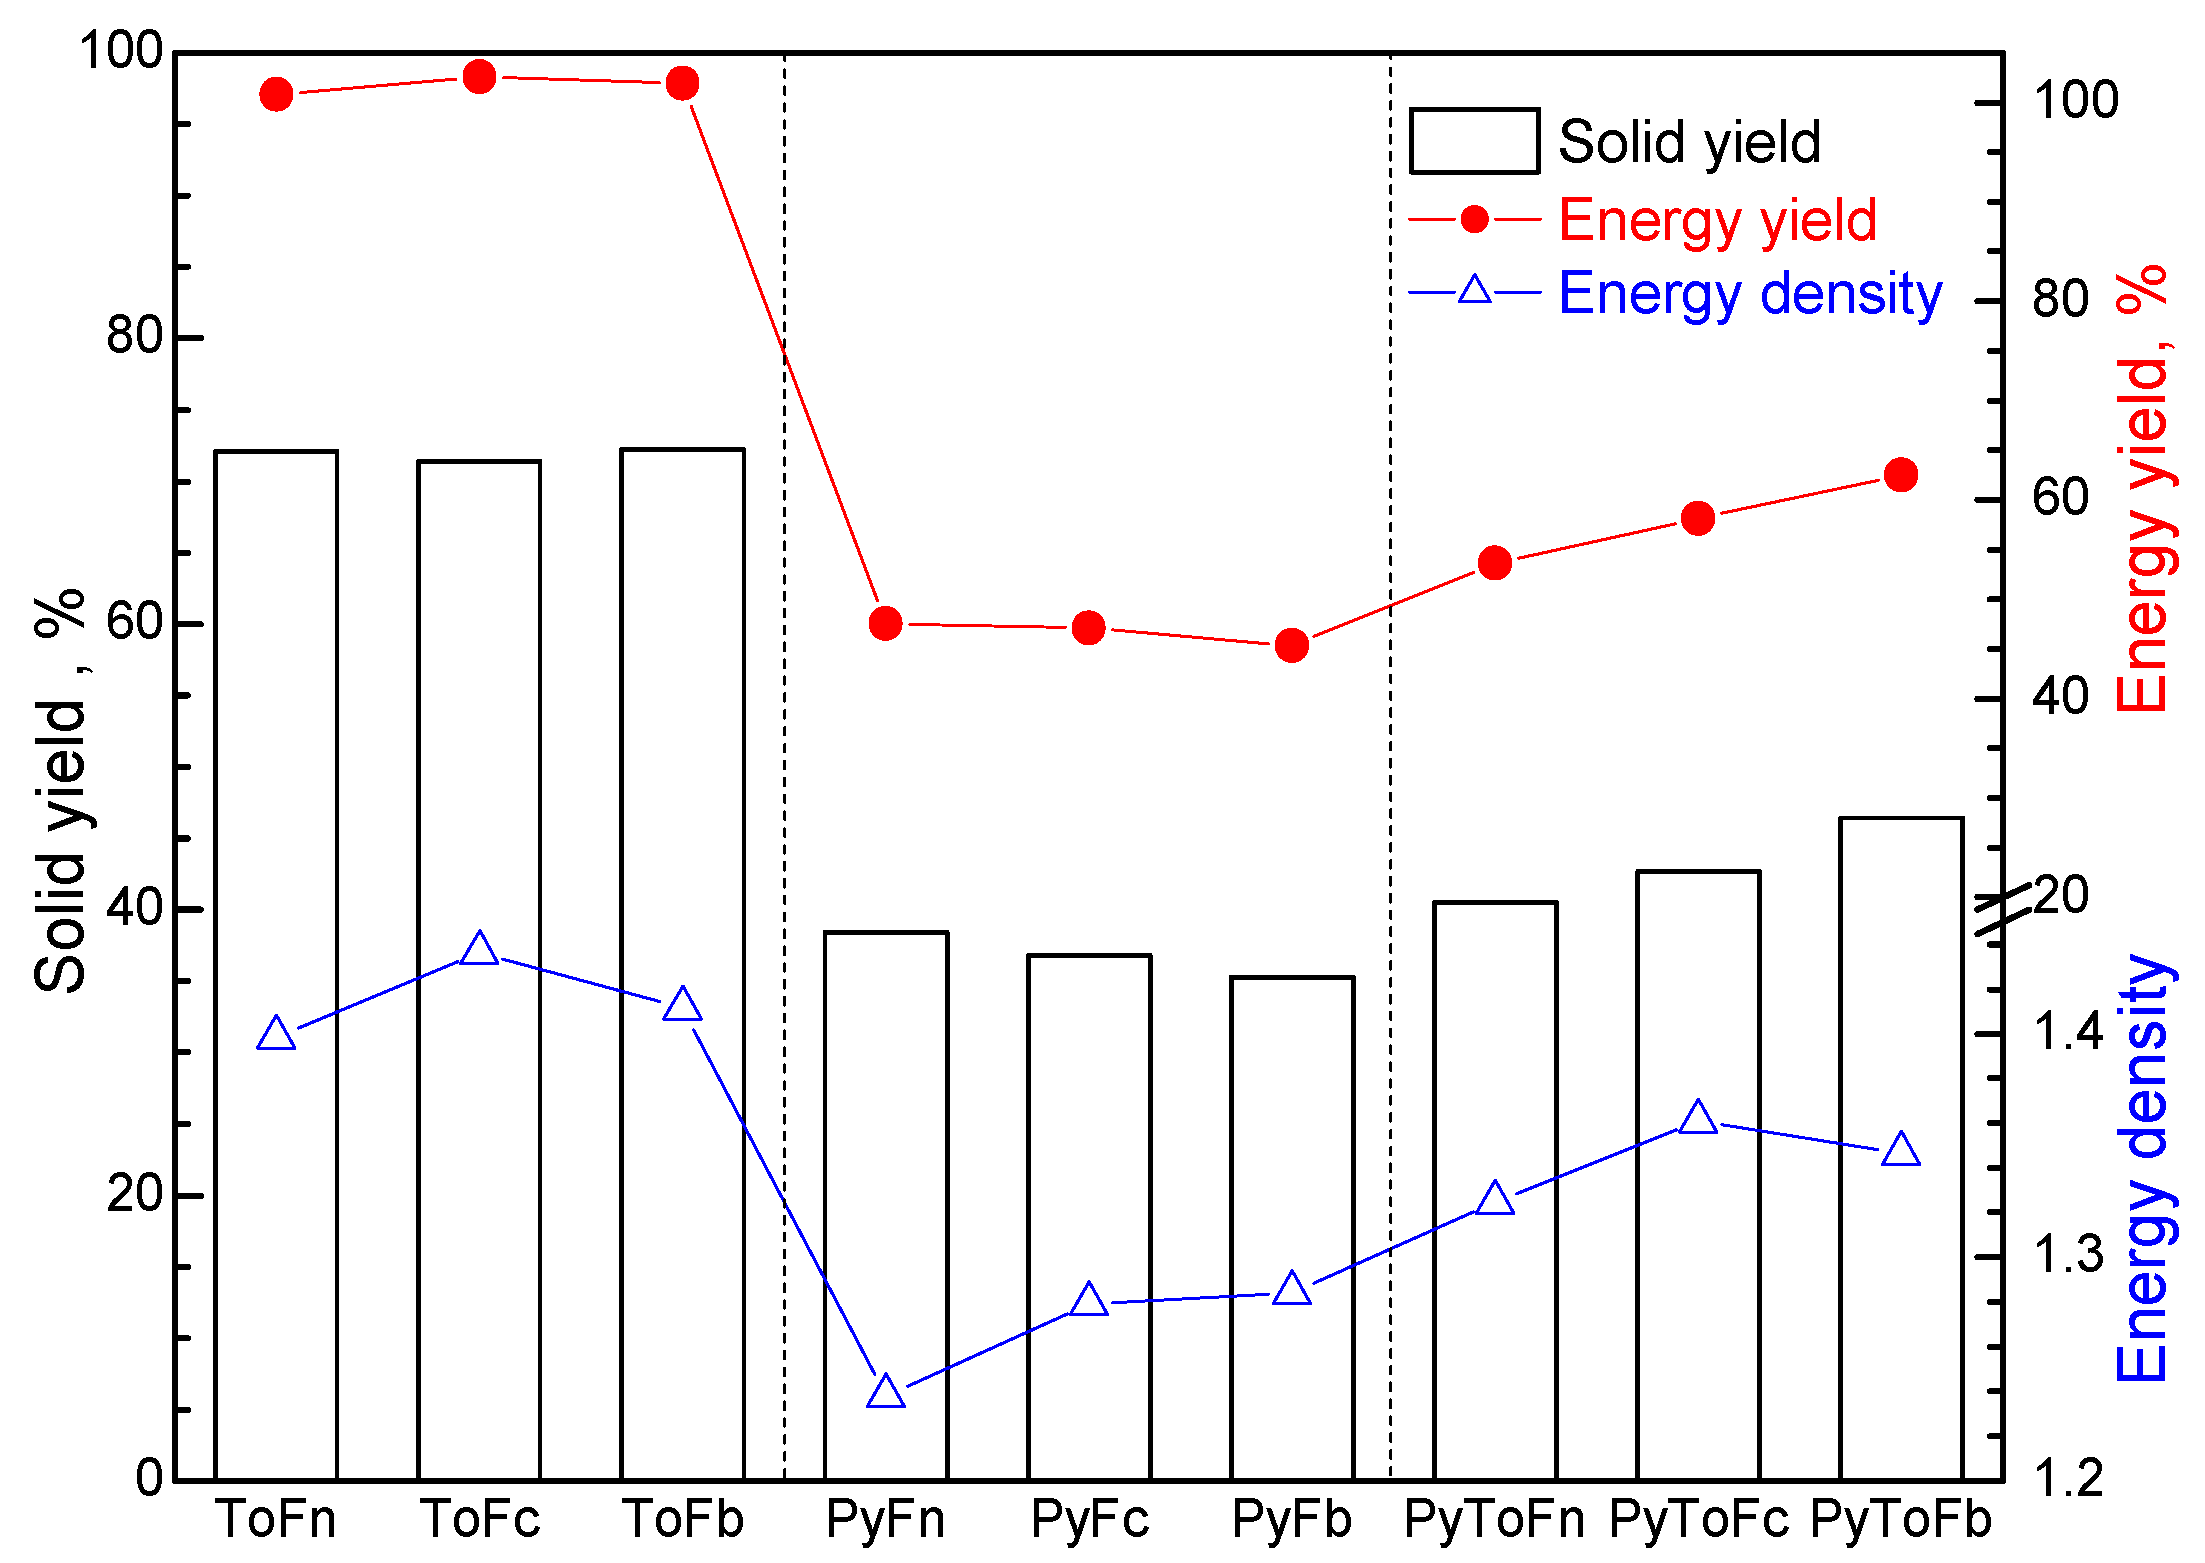
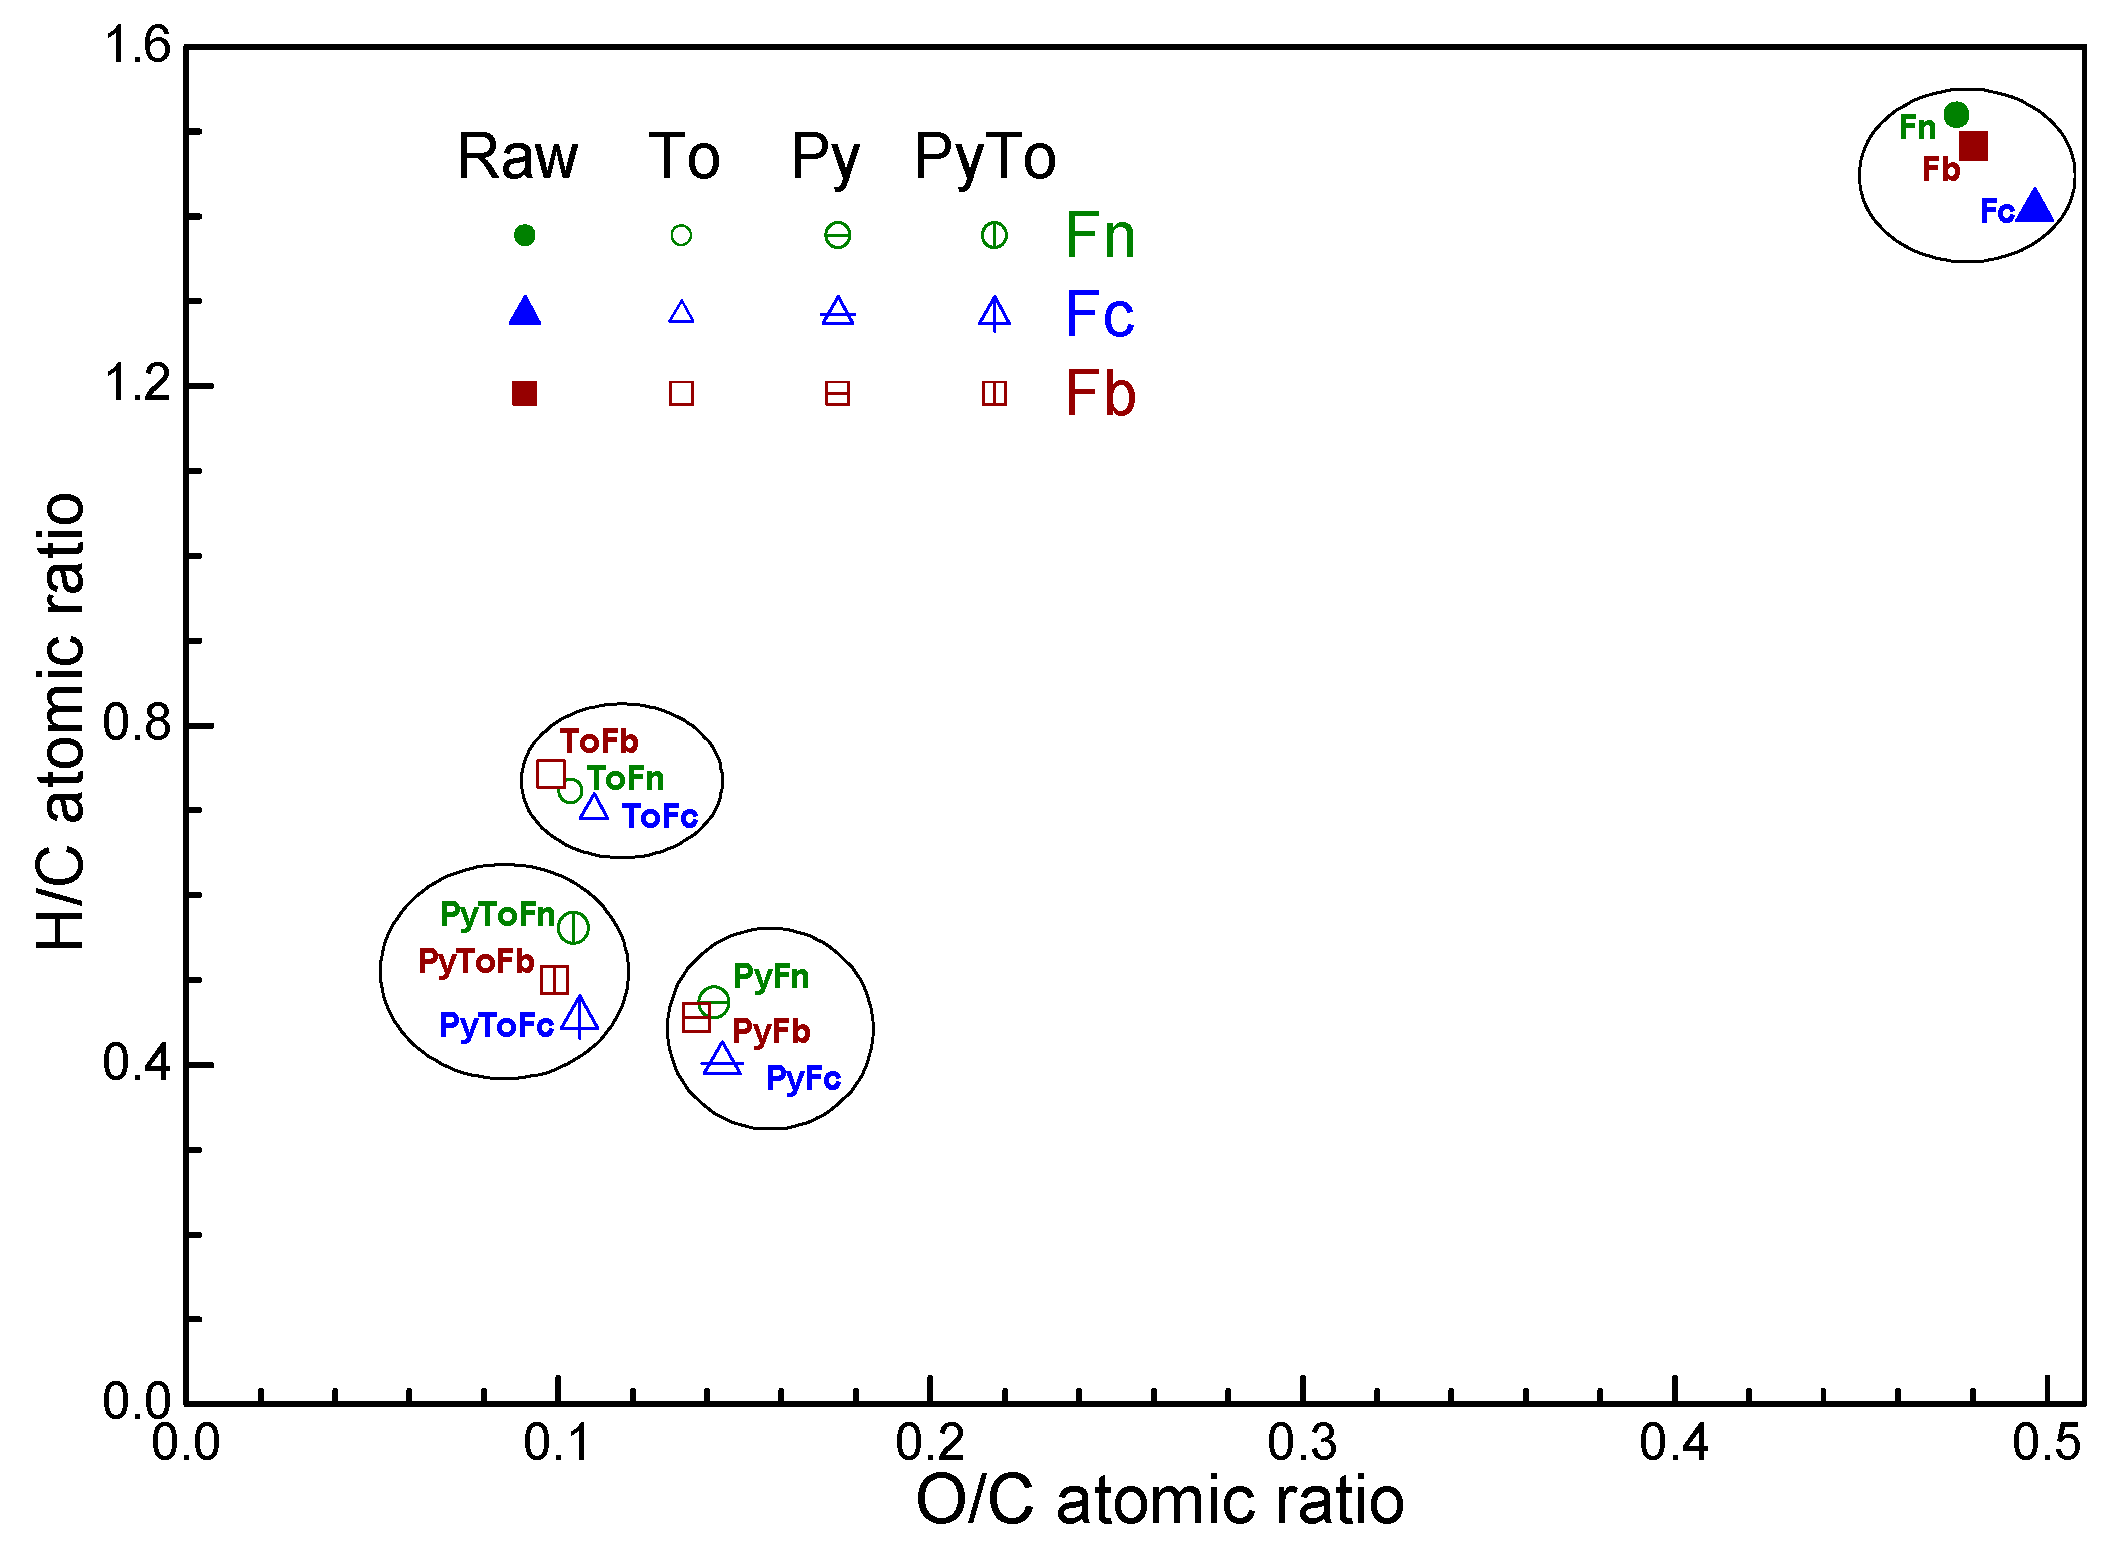
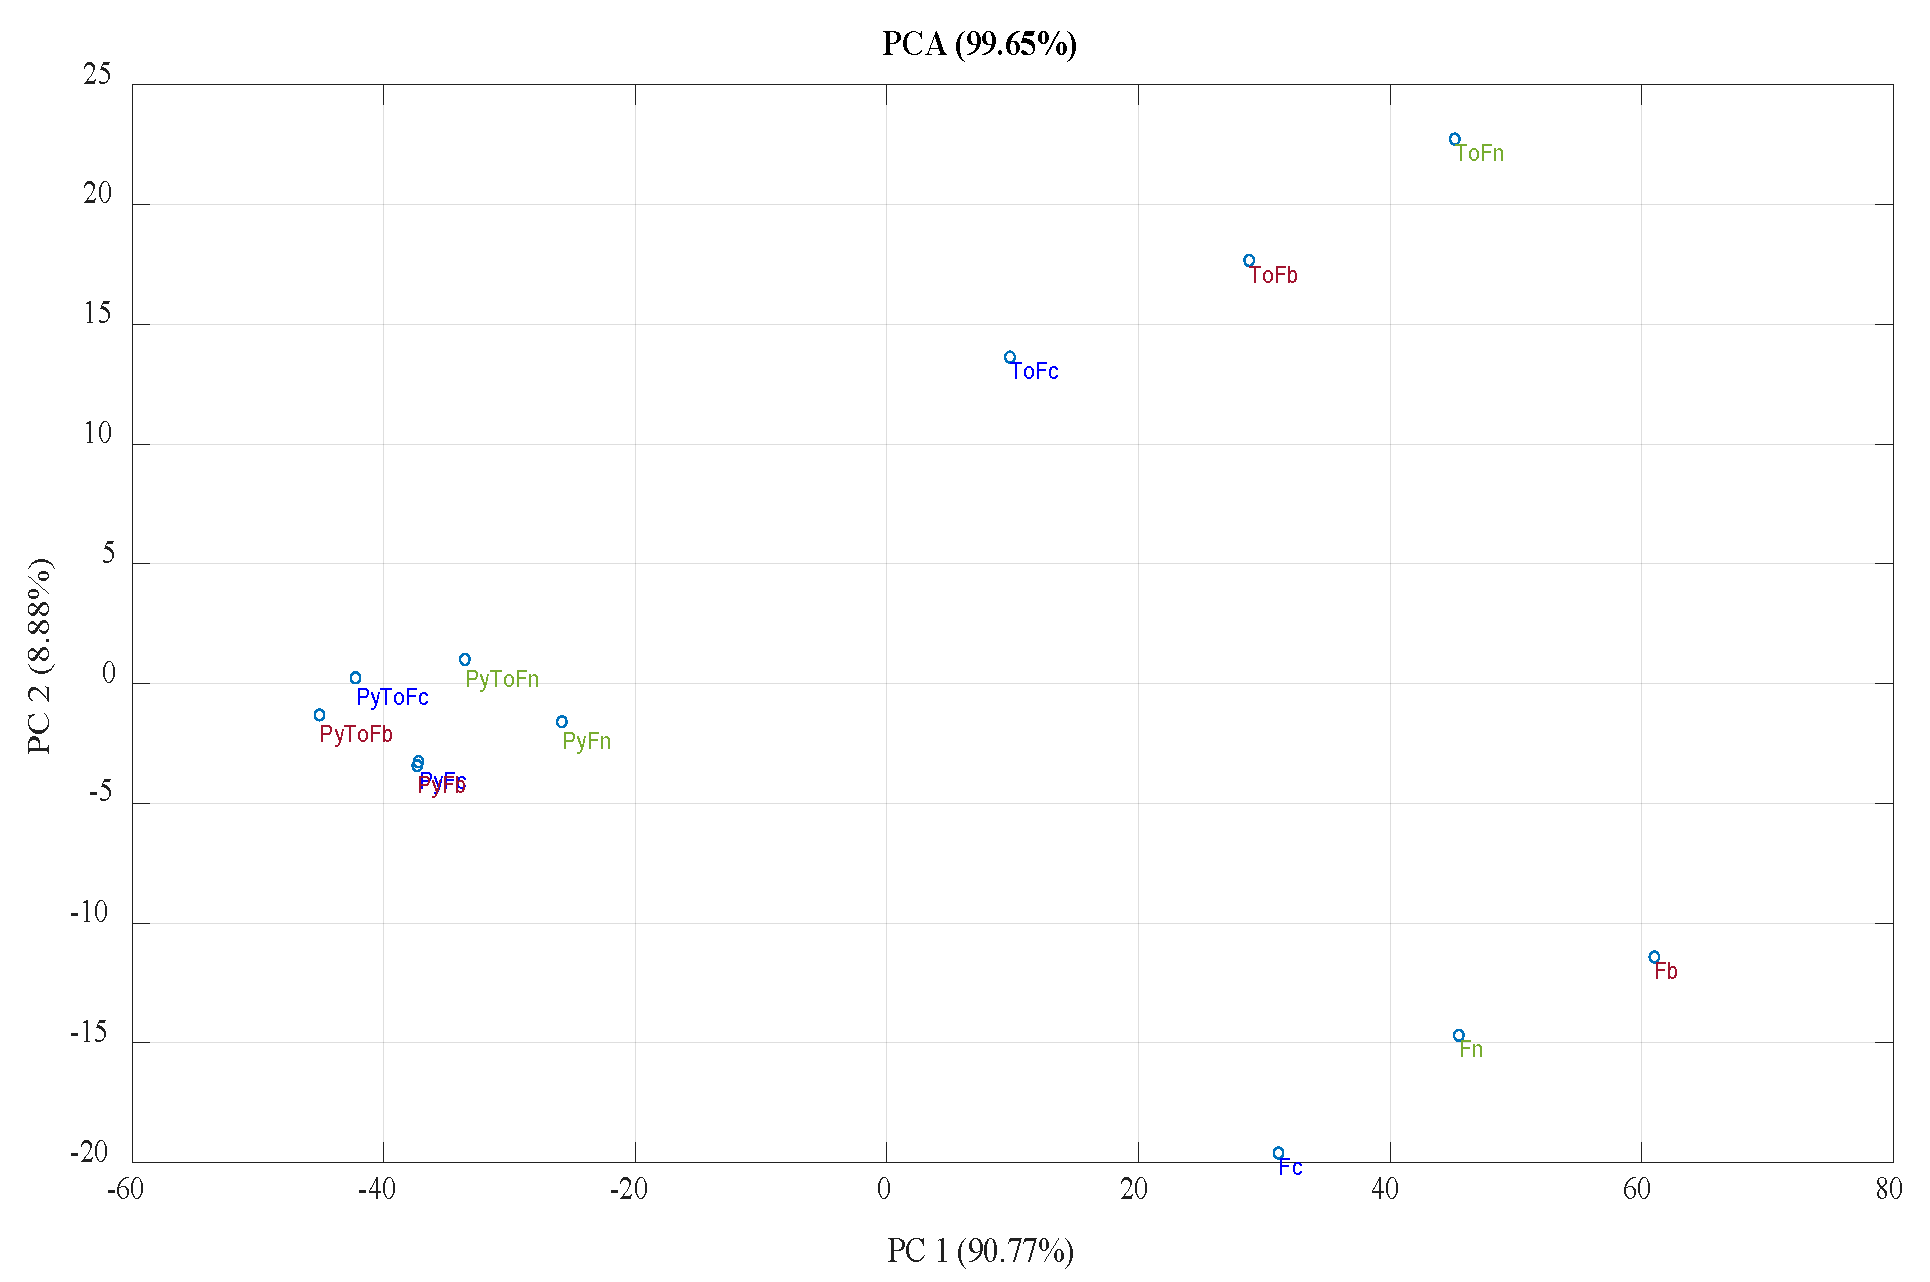
3.1. Product Yield and Characterization of Solid Materials

The torrefaction removed the humidity and the volatile compounds and broke down the most labile chemical bonds from the biomass constituents. This resulted in 15.6–17.2 wt% aqueous fractions and ~11 wt% noncondensable gaseous products, as shown in Figure 2. The oil fractions from the torrefaction of cones and bark were obtained in very low amounts, of only 0.3 and 0.4 wt%, respectively. A slightly higher amount, of ~1.4 wt%, was observed for the fir needles, which was most probably due to the higher content of extractives in this sample. About 72 wt% of the initial samples remained as solid materials, indicating that the torrefaction at 250 °C had only a limited effect on the biomass.
The pyrolysis at 550 °C led to advanced thermal degradation of the biomass, decreasing the amount of solid residue (~35–38 wt%) to less than half compared with torrefaction. The degradation compounds leaving the reactor consisted of about 21–22.7 wt% noncondensable gaseous products, ~29–34 wt% aqueous fraction and ~6–11 wt% organic oil. Similarly to the torrefaction, the amount of oil fraction was much higher for the needles (11.3 wt%) compared with the cones and bark (6.3 and 8.2 wt% respectively); the amounts of aqueous fraction and gaseous product were slightly smaller.
The two-step thermal processing, consisting of torrefaction followed by pyrolysis (PyTo), increased the amount of solid residue to 40.5–46.5 wt% and the oil yield to 12–17.5 wt% while decreasing the amount of aqueous fraction to ~20–23.5 wt%, with only a marginal effect on the gas yield (19.5–23.5 wt%). This offers a great advantage for producing highly valuable solid materials and organic fractions, which could be used as fuels or sources of chemicals, with lower amounts of aqueous product, from which organic compounds are difficult to separate.
In addition to the product yield, energy aspects should be also considered when deciding on the efficiency of thermal processes. The high heating values of the solid materials were calculated based on the ultimate analysis and are presented in Table 1.
The torrefaction (To) strongly increased the calorific value of the solid materials from ~23 to ~32 MJ/kg. This was mainly due to a drastic decrease, of ~20 wt%, in the oxygen content, from ~34–36 wt% in the starting materials down to ~10–12 wt% in the torrefied materials, and the consequent increase in the carbon content from ~53–54 wt% up to ~79–81 wt%. The hydrogen content also decreased, from ~6.5 wt% to ~4.8 wt%; this was mainly in the form of water. The pyrolysis (Py) decreased the calorific value of the solid residues down to ~29 MJ/kg, which was, however, significantly higher than the heating value of the initial biomass sample. This decrease was due to the advanced degradation of the main constituents of biomass, which generated organic compounds with low molecular weight and enough volatility to leave the reactor. The carbon loss was much higher than the oxygen loss. Therefore, the carbon content of the solid residue decreased to 76.5–79 wt%, while the oxygen content increased to 14.2–15.2 wt%. The hydrogen content also decreased, to ~3 wt%. Using torrefaction as a preliminary thermal pretreatment before the pyrolysis of the biomass (PyTo) stabilized the carbon and hydrogen; their contents in the final residue were ~79–81.5 and ~3.1–3.7 wt%, respectively, which was slightly higher compared with the solid residues that remained when the thermal processing was performed by pyrolysis alone. Consequently, the oxygen content decreased to 10.5–11.5 wt%. These changes in composition led to higher calorific values, of 30.5–31 MJ/kg. The nitrogen and sulfur contents of the solids were not significantly affected by the thermal processing. The energy density and the energy yield of the thermal processes, calculated based on the calorific values of the resulting solid materials, are presented in Figure 3. The needles had the lowest calorific value, energy density and yield, regardless of the thermal process. This was most probably due to the fact that the initial sample had the lowest lignin content. On the other hand, the cones, which had the highest lignin content among the fir samples, also had the highest heating value and energy density. However, their solid yield was slightly lower compared with that of the bark, while the energy yield was higher only for torrefaction (To) and pyrolysis (Py). The combined torrefaction + pyrolysis process (PyTo) improved both the energy density and the energy yield compared with pyrolysis alone. The torrefaction had the highest energy density and energy yield considering the solid residue, but pyrolysis and combined torrefaction + pyrolysis have the advantage of producing organic liquid fractions, which could be used as sources of chemicals or as oil fuels.
The energy yield of the torrefaction was of 101–102.5%, which was slightly above unit. It should be mentioned that the calorific values, energy density and energy yield were calculated on a moisture-free basis, which allows easy comparisons among samples with different hygroscopies. However, usual practice refers to materials in ambient conditions, containing various amounts of humidity. This would have led, in our case, to lower calorific and energy values. The energy yield of the torrefaction would have fallen slightly below unit, showing that torrefaction is a highly efficient thermal process.
The carbon, hydrogen and oxygen content of the biomass samples determined their position in the Van Krevelen diagram, as shown in Figure 4. The initial forestry residue had an O/C atomic ratio of ~0.5 and an H/C atomic ratio of ~1.41–1.52, placing the needles, cones and bark from the fir on the upper right corner of the diagram. The torrefaction (To) strongly decreased both the O/C and the H/C ratios down to ~0.1 and ~0.70–0.74, respectively. This was mainly due to the high amount of oxygen removed together with the hydrogen in the form of water. The pyrolysis (Py) decreased the oxygen content, but advanced the thermal degradation of the structural components in the biomass, leading to a high loss of carbon and hydrogen in the form of oxygen-containing organic compounds. This resulted in a stronger decrease in the H/C atomic ratio compared with the torrefaction, while the O/C ratio was slightly higher. Therefore, the pyrolyzed solids were placed lower and to the right of the torrefied solids. The combined torrefaction and pyrolysis thermal process (PyTo) appeared more advantageous than pyrolysis alone, leading to lower O/C and higher H/C atomic ratios, placing the solid samples closer to the origin of the Van Krevelen diagram.
It was observed that the samples could be clearly grouped in the Van Krevelen diagram, according to the thermal procedure, indicating that the individual and combined torrefaction and/or pyrolysis gave relevant and distinct results. Similar grouping results from the exploratory data analysis performed in MATLAB R2017b, based on the characterization data of the solid materials, are presented in Table 1.
The principal component analysis (PCA) plot in Figure 5 indicates that two principal components are relevant for the accurate description (99.65%) of the system consisting of the solid materials before and after the thermal processing by torrefaction and/or pyrolysis. A clear distinction was observed between the initial biomass samples and the thermally treated samples, as well as between the thermal treatment at low temperatures (torrefaction) and at high temperatures (pyrolysis). Although they were placed in relatively close proximity, there was also a separation between the stand-alone pyrolysis (Py) and the combined torrefaction + pyrolysis (PyTo), confirming that the two approaches led to different results. It was observed that the points corresponding to the biomass type (needles, cones and bark) were placed distantly from each other for the initial and for the torrefied materials, but once the thermal treatment involved high temperatures of 550 °C (in the pyrolysis domain), they moved closer. This was an indication that the torrefaction at 250 °C did not significantly affect the differences among the samples, but that these were leveled by the pyrolysis. However, the solid residues of the fir needles that remained after the pyrolysis and combined torrefaction + pyrolysis were still significantly separated from those of the cones and bark. This is an indication that the lignin in fir needles could be different than that in cones and bark.
A thermal analysis of the fir samples and of their solid residues from the torrefaction and/or pyrolysis was performed to obtain information on the degradation steps that are related with the composition of solid materials. The results are presented in Figure 6.
The DTG peaks in Figure 6a show seven stages during the heating of the fir biomass samples. The sample humidity was removed below 100 °C (Stage I in Figure 6a) and was immediately followed by a small stage of ~1.5 wt% mass loss for the needles and bark (Stage II), which was not observed for the cones and might correspond to the light volatile compounds from the composition of the extractives.
The main degradation of the biomass sampless occured in the 150–400 °C temperature range (Stage III), the DTG shoulders indicating several overlapped processes. The fir needles showed a large DTG shoulder, with two inflections around 240 and 275 °C. These were related to the evaporation of the terpenes, which are present in high amounts in needles, and with the thermal decomposition of the hemicelluloses. The DTG peak at 352 °C indicates the degradation of the cellulose. The lignin thermally degraded over a large temperature range; this started soon after moisture removal, overlapping with the degradation of the hemicelluloses and of cellulose, and continued with lower rates at high temperatures, as shown by the long tail above 375 °C. The hemicelluloses in the fir cones do not appear as a distinct DTG shoulder but manifest as a gradual increase in the DTG peak that covers the othervise sharp DTG peak of the cellulose decomposition. The maximum degradation rate occured over a large temperature range, between about 327 and 348 °C. The fir bark, with the highest content of hemicelluloses, had a clear DTG shoulder at ~285 °C. It appears that the lignin from the bark was more thermally stable than the lignin from the cones, with a clear DTG shoulder appearing around 375 °C, after the degradation of the cellulose.
The needles and bark had a degradation stage (IV) around 490 °C, with mass losses of 4.5 and 6.5 wt%, respectively. This stage involved the advanced charring reactions of the thermally degraded lignin, with the release of hydrogen, methane and carbon monoxide/carbon dioxide [37]. Stage V occurred for the needles and bark with maximum rates around 650 and 670 °C and mass losses of 4.1 and 6.2 wt%, respectively. Carbon dioxide was the main gas evolved in this stage, suggesting that this might correspond to the thermal decomposition of the inorganic compounds, such as carbonates, which are usually present in large quantities in the biomass samples [38]. Stage VI represented the burning of the fixed carbon when the flow gas was shifted at 900 °C from inert nitrogen to oxidative air, while Stage VII represented the remaining inorganic ash.
The DTG curves in Figure 6b are much simpler, indicating a change in the composition of the solid materials from the fir after thermal treatment by torrefaction at 250 °C. The mass loss in stage II decreased below 1 wt% and the shoulders appearing for the fir samples in the 220–290 °C temperature range were no longer present, indicating that the volatiles, extractives and hemicelluloses were removed to a great extent by the torrefation. Stage III of the thermal degradation started at higher temperatures (~170 °C for the needles and 220–235 °C for the cones and bark) and the DTG peak temperatures increased to 358–368 °C, indicating a thermal stabilization of the structures that were partially degraded by the torrefaction.
Figure 6c shows that the pyrolysis at 550 °C successfully removed most of the functional groups from the volatiles and extractives and also from the hemicelluloses, cellulose and lignin structural units in the fir biomass samples. A small mass loss occurred after ~320 °C, while the degradation of the inorganics at 650–670 °C was not affected. Figure 6d shows a stronger thermal stabilization of the solid materials by combined torrefaction + pyrolysis. The mass loss was smaller and started at higher temperatures, of ~340 °C, for the needles and cones and at 480 °C for the bark. The mass loss in the 400–600 °C temperature range decreased in the following order: needles > cones > bark. This suggested an inverse stability order for the lignin structures in the fir samples. It appears that the lignin in bark is the least thermally stable, since it is totally degraded during pyrolysis, especially in the two-step approach (PyTo), leaving the most stable carbonaceous solid residue.

3.2. Characterization of Liquid Products

The GC–MSD chromatograms of the liquid products are presented in Figure 7, with the numbers indicating the compounds listed in Table 2.
The condensable pyrolysis products resulting from the thermal processing of biomass materials were separately collected as aqueous and oil fractions. Their compositions were analyzed by gas chromatography coupled with mass spectrometry, by the direct injection of oil fractions and after concentration on a solid-phase microextraction fiber (SPME) in the case of the organic compounds partitioned into the aqueous phase.
The composition of the liquid products resulting from the torrefaction strongly depended on the initial material (needles, cones or bark) and on the fraction in which the organic compounds are partitioned, as shown in Figure 8a. Several peaks could be observed in the C7–C20 range, such as at C7 (acetic acid) for the cones and the aqueous fraction from the bark, C9 (furfural) for the aqueous fractions from the cones and the bark, C12 (phenol derivatives) for the oil fraction from the bark, C13 (bornyl acetate) for the oil fraction from the needles and C15 (terpenes) for the aqueous fraction from the needles and the oil fraction from the cones. Fewer differences were observed between the liquid fractions resulting from the pyrolysis, as shown in Figure 8b. The aqueous fractions from all the fir samples contained high amounts of acetic acid at C7. The oil fractions had peaks at C10, C12 and C14 for the needles and cones but at C11 and C13 for the bark. Figure 8c shows higher amounts of acetic acid, at C7, in the aqueous fractions of the needles and cones and two peaks, at C11 and C13, for the oil fractions, but a single peak, at C12, for the aqueous fractions. Apart from these differences, the NP gram curves overlap to a very high degree, showing that torrefaction used as a preliminary pretreatment before pyrolysis has a strong uniformizing effect on the composition of liquid products (aqueous fractions and organic oils) obtained from various biomass sources. This is a supplementary advantage of two-step thermal processing, considering the usual large variation in the properties of final products, depending on the starting materials and the pyrolysis parameters.
Table 2 shows the detailed composition of the aqueous and oil fractions produced by the torrefaction and/or pyrolysis of needles, cones and bark from fir. More than 110 compounds, representing between 70 and 90% of the area in the C6–C19 range of the chromatograms, were identified by MSD and confirmed by the Kovats retention index and by cross-validation among the 18 samples. These belonged to nine chemical classes, namely acids, acetals, saccharides, linear ketones, cyclic ketones, furans, aromatics, phenols and terpenes, as formed from the chemical components and structural constituents of the biomass. Some of them were found in all the samples, since they were related to the common features of studied biomasses, while several were particular to the initial material (needles, cones or bark) or to the type of liquid product (aqueous or oil fraction).
The heatmap in Figure 9 shows that the torrefaction (To) had different effects on the forestry residue, depending on the starting material. Terpenes (45.5–59%) were the main compounds resulting from the fir needles, which are rich in volatile compounds and extractives. Furans and phenols were the main components of the fir cones and bark, with the furans being the highest in the aqueous fraction from the cones (43%) and the phenols being dominant in the oil fraction from the bark (42%). Acids were also produced by the torrefaction, especially from the cones (9–12.4%), although they were also found in the aqueous fraction from the bark (12.2%). These offer an indication on the effect of the torrefaction over the main chemical compounds or structural components in the biomass. It appears that the volatiles and extractives were the main compounds released by the torrefaction in the case of the fir needles, while the hemicelluloses were degraded and the lignin was marginally affected in the case of the cones and bark and less affected in the needles. The torrefaction had a small effect on the cellulose, as shown by the very small amount of identified saccharides and cyclic ketones.
The pyrolysis (Py) strongly degraded the lignin, with phenols being the most abundant compounds (33–65%) in all the fir materials, both in the aqueous and in the oil fraction. The highest amounts (53–65.4%) were produced from the cones, which were the richest in lignin, while the needles, which had the lowest lignin content, produced only 32.6–35% phenols. Oxygen-free aromatic compounds, also originating from lignin, were observed in amounts of ~3.4–3.8% in all the oil fractions. The bark, which had the highest hemicellulose content, produced 19.6% acids and 6.4% acetals in the aqueous fraction. Instead, furans were highest (16.4%) in the aqueous fraction from the cones. Pyrolysis also degraded the cellulose, with ~5% cyclic ketones being observed in the bark and in the aqueous fraction from the cones, while ~2–3.8% saccharides were found in the aqueous fractions from all the samples. Terpenes were produced in high amounts (10–20%) from the needles, as expected, but in amounts below 1.6% for the cones and below 0.3% for the bark.
The two-steps thermal processing, consisting in a preliminary pretreatment by torrefaction followed by pyrolysis (PyTo), increased the amount of phenols (40–62%), oxygen-free aromatics (11.5% in the oil fraction from the needles) and cyclic ketones (5.7–7.3 in the aqueous fractions from all samples). Acids were observed in high amounts only in the aqueous fractions from the needles and cones, while terpenes were present in small amounts (below 2.8%) because they were removed during the torrefaction pretreatment step.
The detailed observations on the amounts of particular compounds in the aqueous and oil fractions listed in Table 2 offer new insights into the similarities and differences among various sources of biomass and/or thermal treatment methods.
Terpenes are low-molecule volatile compounds biosynthesized by plants [39], which evaporate at heating during torrefaction or during the initial stages of pyrolysis and are collected in liquid products after cooling. Although they were partitioned between the aqueous and the oil phases, due to their dominant hydrophobic character, terpenes were found in higher amounts in the oil fractions. Terpenes are highly abundant in fir needles, as shown by the 25 compounds from this class found in the composition of the aqueous and oil phases from the torrefaction. Bornyl acetate, which gives needles their specific odor and is involved in the protection mechanisms of trees, especially against the spruce budworm [40], was the main terpene (~12–13%) resulting from the torrefaction of the fir needles. This was followed by β-caryophyllene and himachala-2,4-diene (9.8 and 7.2% in the aqueous phase and 4.5 and 3.1% in the oil phase, respectively). The fir cones and bark had simpler terpene compositions compared with the needles. Junipene was the main terpene (7.7%) from the torrefaction of the cones, followed by γ-gurjunene (3%), α-longipinene (2.6%) and β-himalchalene (1.4%), while β-cimene (1%) was the main terpene from the torrefaction of the bark. As expected, the pyrolysis decreased the amount of terpenes in the liquid products. Even for the needles, most of the terpenes identified after torrefaction, including bornyl acetate, were not found in the pyrolysis condensates. However, the pyrolysis oils from the needles still contained significant amounts of β-caryophyllene (5%), himachala-2,4-diene (2.7%), α-caryophyllene (2.6%) and δ-cadinene (1.7%).
Acetic acid was the main compound from the chemical class of acids found from the torrefaction and/or pyrolysis of the fir residues. This acid is mainly produced from the degradation of hemicelluloses but also from lignin [41]. Its quantification was difficult, its chromatographic peak sometimes partly overlapping with other light compounds, such as 2-methylfuran. Therefore, the reported amounts of acetic acid varied in a large range; the highest values were for the aqueous phases from the combined torrefaction + pyrolysis of the fir needles (22.9%) and from the pyrolysis of the bark (19.6%). Propanoic acid was also observed in several samples, but this overlapped with 2,5-dimethylfuran. Hexanoic acid in amounts of ~3% was found in the liquid products from the torrefaction of the needles.
Furans, formed mainly from the thermal degradation of the hemicelluloses, were identified in high amounts in the aqueous fractions from the torrefaction of the cones and bark and, to a lesser extent, in the torrefaction products of the needles. Pyrolysis at high temperatures led to significantly lower amounts of furans in all the fir samples. Furfural was the main furan compound, followed by 5-methylfurfural. These were found especially in the aqueous fractions from the torrefaction of the cones (27.1 and 9.5%) and the bark (14.9 and 10.0%). Pyrolysis strongly decreased the amounts of these two compounds (to 8.0 and 3.7% for the cones and to 2.6 and 1.3% for the bark) and of all the furans in general. This was mainly due to the increased amounts of compounds from the thermal degradation of the cellulose and of the lignin, which were formed at high-temperature pyrolysis.
The acetals consisted of acetol and acetol acetate, their amount being higher in the aqueous phases compared with the oil phases. The highest amount of acetol (5.9%) was obtained from the pyrolysis of the bark, while it was below 1.8% for all the other samples. Acetol acetate was produced in much smaller amounts, generally below 0.5%; and only from the torrefaction of bark did it reach 1%. The linear ketones (light butane and pentane) were below 1% (0.8% from the pyrolysis of the bark and 0.6% from the torrefaction of the cones). Cyclic ketones were mainly produced from the pyrolysis and combined torrefaction + pyrolysis of the cones and bark; they were found in slightly higher amounts in the aqueous fractions. Saccharides, produced from the thermal degradation of the cellulose, were higher in the cones compared with the other fir samples and mainly partitioned to the aqueous phases.
Aromatic and phenol derivatives were produced from the thermal degradation of the lignin structural units in the biomass. Their amounts was smaller in the needles, as expected due to the lignin having the lowest content; they increased with the temperature of the thermal treatment and were generally found in higher amounts in the oil fractions compared with the aqueous fractions and in the combined torrefaction + pyrolysis process compared with the individual torrefaction and pyrolysis. The aromatics peaked at 11.5, 7.3 and 5% for the oil fractions from the needles, cones and bark, respectively, remaining below 3.4% for the other samples. They consisted mainly of benzene and its methyl, dimethyl, ethyl and trimethyl derivatives, but benzaldehyde and naphthalene were also found, especially after the combined torrefaction + pyrolysis. Toluene, followed by xylene isomers, were the aromatic compounds found in the highest amounts, especially in the oil fractions from the needles and cones.
Phenolics were the main compounds in the liquid products from the thermal treatments involving high temperatures of 550 °C. They were above ~33% for the pyrolysis and above 40% for the combined torrefaction + pyrolysis, as shown in Figure 7. They peaked at 42.2% in the oil fraction from the torrefaction of the bark, but this was mainly due to the lack of terpenes in this sample compared with the needles and cones. The cones, which had higher lignin content than the bark, presented significantly more phenolic compounds as a result of the pyrolysis, reaching 65.4 and 53% in the oil and aqueous phase, respectively, compared with 59.3 and 37.2% in the corresponding fractions from the bark. The differences were diminished, especially in the aqueous fractions, with the combined torrefaction + pyrolysis treatment. About 35 different phenolic compounds were found in the liquid products. Mild thermal treatment by torrefaction can break only the most labile chemical bonds in lignin. For the cones and bark, this led to the formation of high amounts of guaiacol (7.4–10.6 and 5.0–6.6% in the aqueous and oil fractions, respectively), which were liberated from the guaiacyl units in the lignin, followed by isoeugenol (peaking 11.8% in the oil fraction from the bark) and by p-vinylguaiacol (2.6–5%). The higher temperatures involved in the pyrolysis led to the advanced degradation of the lignin’s structural units, with the guaiacol in the aqueous fractions decreasing to 5.3–8.7%. The pyrocatechol (1,2-benzenediol) and homocatechol (4-methylpyrocatechol) significantly increased, to ~8.5 and 5.1–7%, respectively, in the cones, but remained at ~4 and 2–3%, respectively, for the bark. The combined thermal treatment by torrefaction + pyrolysis (PyTo) changed the composition of the liquid products. The guaiacol decreased to 3.9–6.1%; most of it was removed during the torrefaction pretreatment step. The pyrocatechol and homocatechol increased to 7.8–10.8 and 6.7–7.9%, respectively, for the cones. This increase was much higher for the bark, reaching 4.9–7.5 and ~6.2%, respectively. The needles behaved differently to the cones and bark, with guaiacol and pyrocatechol being observed in much smaller amounts, while homocatechol was not found in the pyrolysis products from the torrefaction and pyrolysis. Instead, phenol was the main oxygenated aromatic compound from the needles, representing ~1.5% of the liquid torrefaction products. Unlike the guaiacol, the main phenolic compound from the torrefaction of the cones and bark, whose amount was decreased by the pyrolysis and combined torrefaction + pyrolysis, the phenol from the needles had the opposite trend: its amount increased to 5.7–6.5% after the pyrolysis and to 6.4–8% after the two-step thermal treatment. The phenolic compounds in the liquid products from the torrefaction and/or pyrolysis indicated strong differences in the composition of the lignin, especially between the needles on one hand and the cones and bark on the other. This offers additional support for the distinct placement of the needles compared with the cones and bark in the Py and PyTo samples observed by PCA (see the green circle in Figure 5).
Table 2. The composition (GC–MSD peak area %, ±5% associated error) of aqueous and oil fractions from torrefaction and/or pyrolysis of fir needles, cones and bark.
NoRtRiNameTypeCASRiNISTToFn-AqToFn-OilToFc-AqToFc-OilToFb-AqToFb-OilPyFn-AqPyFn-OilPyFc-AqPyFc-OilPyFb-AqPyFb-OilPyToFn-AqPyToFn-OilPyToFc-AqPyToFc-OilPyToFb-AqPyToFb-Oil
12.215982,3-ButanedioneLk431-03-85580.230.200.370.440.27 0.24 0.19 0.560.35
22.306042-MethylfuranF534-22-56100.070.411.17 1.460.75 0.81 0.60 1.720.56
32.40615Acetic acidAc64-19-75942.263.388.2911.819.33 6.920.656.100.3419.622.6422.871.0511.160.872.371.11
42.746493-MethylbutanalAl590-86-36430.120.371.670.290.18 0.190.020.20
52.81657BenzeneAr71-43-2680 0.10 0.160.170.130.120.10.32 0.520.060.520.520.54
62.876632-MethylbutanalAl96-17-36430.060.271.05
72.91667AcetolAl116-09-66810.360.261.731.131.96 1.640.11.440.225.890.631.830.21.610.051.330.52
82.956713-Penten-2-oneLk625-33-2697 0.10 0.180.140.10.130.220.440.15
93.226992,3-PentanedioneLk600-14-66660.070.100.260.220.24 0.16
103.357082,5-Dimethylfuran/Propanoic acidF/Ac625-86-5/79-09-4667/676 0.111.060.090.550.202.830.271.720.191.440.16
114.22765TolueneAr108-88-37550.020.09 1.22 0.532.130.270.620.120.86 3.980.031.601.001.23
124.70796CyclopentanoneCk120-92-3771 0.35 0.400.440.170.060.290.870.23
135.46839FurfuralF98-01-18311.211.3327.098.5614.891.661.710.117.981.132.591.510.22 1.671.101.840.50
145.49840CyclopentenoneCk930-30-3793 0.550.121.480.470.770.781.040.241.350.51.060.52
155.91863Furfuryl alcoholF98-00-08850.500.571.111.031.930.671.700.331.160.492.101.111.090.431.190.501.990.63
165.87862EthylbenzeneAr100-41-4893 0.50 0.20 0.24 0.840.290.460.20.31
176.01869p-XyleneAr106-42-3855 0.190.780.30.450.100.69 1.53 1.410.380.66
186.178785-Methyl-2(3H)-furanoneF591-12-8897 0.220.19
196.18879Acetol acetateAl592-20-18220.160.210.360.311.040.280.530.10.430.080.530.250.32 0.42 0.420.11
206.30885SanteneT529-16-88801.592.50 0.270.90 0.50 0.78
216.44893o-XyleneAr95-47-6881 0.320.33 0.60 0.450.260.16
226.799132-Methyl-2-cyclopentenoneCk1120-73-6881 0.260.180.310.390.681.070.410.330.460.530.730.56
236.90919ButyrolactoneF96-48-0870 0.670.120.820.391.330.611.390.140.930.331.150.47
246.94921AcetylfuranF1192-62-7879 0.92 0.28 0.480.27 0.360.150.370.320.560.34
256.98923TricycleneT508-32-79220.400.39
267.149322-Hydroxy-2-cyclopentenoneCk10493-98-8919 0.530.060.780.171.650.860.200.10.680.180.940.22
277.19935α-PineneT7785-70-89481.551.90 0.31
287.319431,2-CyclopentanedioneCk3008-40-09420.060.070.410.570.680.16
297.56956PropylbenzeneAr103-65-1992 0.16 0.20 0.11 0.16
307.47951CampheneT79-92-59433.274.40 0.370.68
317.70964m-EthyltolueneAr620-14-41006 0.22 0.46 0.92 0.61 0.52
327.829715-MethylfurfuralF620-02-09200.741.019.552.6710.005.101.08 3.671.351.291.09 1.281.061.320.46
337.849723-Methyl-2-cyclopentenoneCk2758-18-1923 0.340.54 0.62 0.550.460.640.53
347.949771-Acetoxy-2-butanoneLk1575-57-1933 0.260.28
357.94978Methyl 2-furoateF611-13-2956 0.19 0.15
368.12988PhenolPh108-95-29551.551.470.700.411.904.016.465.732.134.341.842.166.377.964.575.213.112.84
378.29997Hexanoic acidAc142-62-1974 0.670.592.843.07 0.37 0.59 0.51
388.4210052-Furanone, 2,5-dihydro-3,5-dimethylF196881958 0.160.71 0.350.220.210.170.220.18
398.4310061,2-CyclohexanedioneCk765-87-710620.280.42
408.7310231,2,3-TrimethylbenzeneAr526-73-81020 0.56 0.20 0.91 0.41
418.781026β-CymeneT527-84-410420.130.19 0.92 1.09
428.851031Limonene/β-PhellandreneT138-86-3/555-10-21018/10301.391.61 0.53 0.370.351.75 1.91
438.9710383-Methyl-1,2-cyclopentanedioneCk765-70-81043 1.020.621.440.971.831.371.560.801.570.851.721.16
449.0710432,3-Dimethyl-2-cyclopentenoneCk1121-05-7999 0.56 0.29 0.240.89
459.171050BenzeneacetaldehydeAr122-78-110810.110.201.330.560.400.33
469.2710562-MethylphenolPh95-48-71014 0.450.390.421.090.882.611.041.430.662.001.943.581.782.54
479.611077AcetophenoneF1679-47-6941 0.30 0.120.110.230.250.180.220.320.370.10.31
489.6210773-MethylphenolPh108-39-41053 0.451.261.802.792.025.581.172.132.524.904.526.503.084.23
499.841090TerpinoleneT586-62-910520.320.41
509.901094GuaiacolPh90-05-110900.470.9710.594.977.416.583.492.578.724.665.267.202.993.085.313.876.054.49
5110.0811057-MethylbenzofuranF17059-52-81131 0.19 0.33 1.50 0.26 0.50 0.39
5210.0711056-CamphenolT3570-04-510820.370.58
5310.1211082,5-DimethylphenolPh95-87-41127 0.36 0.53 0.48 0.46
5410.1611102-MethylbenzofuranF4265-25-21131 0.34 0.42 0.55 0.35
5510.3711243-Ethyl-2-hydroxy-2-cyclopentenoneCk21835-01-81072 0.31 0.38 0.52
5610.501132MaltolCk118-71-81092 0.540.79 0.520.170.691.060.521.380.590.481.031.120.580.91
5710.751149L-PinocarveolT547-61-51143 0.430.490.830.69
5810.751149Ethyl/DimethylphenolsPh 0.782.140.633.150.561.401.092.152.314.162.093.45
5911.031167Ethyl/DimethylphenolsPh 0.250.570.320.2 1.192.391.252.160.621.241.612.981.622.41.521.85
6011.171176BorneolT10385-78-110880.721.24 1.46
6111.361189NaphthaleneAr91-20-31170 0.50 0.561.610.460.620.510.68
6211.4711954,4,6-Trimethyl-2-cyclohexen-1-oneCk13395-73-810690.661.04
6311.501197p-MethylguaiacolPh93-51-61162 1.921.812.543.531.531.774.013.413.946.481.302.312.482.673.864.20
6411.631206PyrocatecholPh120-80-911990.801.851.582.721.79 5.373.368.718.483.984.027.593.7110.807.777.534.87
6511.7612151,4:3,6-Dianhydro-α-D-glucopyranoseS981481198 0.16 0.72 0.42 0.59 0.18 0.36 0.34
6611.8112184,7-DimethylbenzofuranF28715-26-61244 0.18 0.31 0.370.320.830.341.18 0.92
6711.871223DihydrobenzofuranF496-16-211880.661.432.322.96 1.440.95 1.46 0.86 0.74
6812.0512365-HydroxymethylfurfuralF67-47-01176 0.921.200.84 0.830.160.730.420.340.420.440.460.370.39
6912.1112402-Ethyl-5-methylphenolPh1687-64-51236 0.33 0.71 0.210.160.620.420.930.430.97
7012.3912593-Ethyl-5-methylphenolPh698-71-51260 0.40 0.35 0.40 0.65 0.60 0.52
7112.4412633-MethylpyrocatecholPh488-17-51235 0.361.111.292.140.941.530.911.901.672.392.112.28
7212.4912663-MethoxycatecholPh934-00-91269 0.400.50.270.23 0.59 0.43 0.30
7312.581273HydroquinonePh123-31-91334 1.550.840.530.34 2.95 1.30 1.07
7412.761285p-EthylguaiacolPh2785-89-912500.170.370.941.022.033.62 2.392.192.805.521.611.261.621.582.492.95
7512.901295HomocatecholPh452-86-81235 0.721.250.40 5.147.001.913.092.513.326.677.946.246.15
7612.911295Bornyl acetateT76-49-3127711.8612.93
7713.251320p-VinylguaiacolPh7786-61-012930.300.613.473.142.614.991.271.072.463.342.123.710.431.261.242.731.201.77
7813.551342Methyl-p-hydroquinonePh95-71-61235 0.30 0.53 0.31 0.89 0.86 0.39
7913.7113542,4-DimethoxyphenolPh13330-65-91318 0.36 0.440.84 0.48 0.76 0.59 0.67
8013.801361α-LongipineneT5989-08-213582.091.15 2.560.38 1.03 0.390.96 0.270.740.751.050.981.37
8113.831363EugenolPh97-53-01392 0.690.861.142.75
8213.8613663-Allyl-2-methoxyphenolPh1941-12-41392 1.081.181.152.41 0.481.11
8313.921370p-PropylguaiacolPh2785-87-71392 0.320.540.580.390.590.561.540.270.620.510.500.610.74
8414.1213854-EthylcatecholPh1124-39-61334 0.891.321.422.791.392.211.152.182.393.093.264.07
8514.451410VanillinPh121-33-51403 0.871.491.131.11 1.120.531.03
8614.4614103-Allyl-2-methoxyphenolPh153141392 0.781.23 0.680.630.371.010.201.30
8714.581420JunipeneT475-20-713981.541.08 7.70
8814.741432β-CaryophylleneT87-44-514249.854.52 1.624.97
8914.811438Himachala-2,4-dieneT60909-27-514997.193.08 1.212.74
9014.8514412,4-DimethoxyphenolPh13330-65-91318 0.460.90
9114.951449D-Mannose/D-AlloseS3458-28-4/2595-97-316981.140.840.871.981.400.721.570.661.900.160.20 0.990.501.61 1.26
9215.051457IsoeugenolPh97-54-11410 1.972.914.414.6711.761.961.672.983.442.825.480.490.921.301.811.702.59
9315.1114622,3,4,5-TetramethylbenzaldehydeAr29344-95-41435 0.500.60 0.650.341.100.930.580.310.86
9415.131463α-HimachaleneT3853-83-614471.580.87 0.78 1.33
9515.141464α-CaryophylleneT6753-98-614563.251.58 1.272.57
9615.3014774-Propyl-1,3-benzenediolPh18979-60-71434 0.810.260.97 1.19
9715.481490LevoglucosanS498-07-71426 1.421.020.530.28 1.521.901.741.14 0.601.021.070.820.95
9815.691508γ-GurjuneneT22567-17-514692.060.910.553.050.300.85 0.410.620.130.28 0.190.220.37 0.31
9915.761513β-HimachaleneT1461-03-614972.820.90 1.38 0.270.560.90
10015.771514β-CadineneT523-47-71440 0.352.63
10115.891524γ-CadineneT39029-41-915051.460.73 0.78 0.590.73
10215.981532δ-CadineneT483-76-115143.091.520.300.87 1.111.67
10316.111543GuaiacylacetonePh2503-46-015380.360.460.711.581.361.120.940.591.311.020.861.420.610.480.690.851.351.18
10416.171547α-CalacoreneT21391-99-115470.490.30
10516.3415624-HydroxybenzylacetonePh5471-51-214980.491.38 1.790.840.310.440.160.501.050.820.400.350.380.68
10616.4615714-(3-Hydroxybutyl)phenolPh501-96-214750.241.04 1.030.440.460.430.500.730.430.990.390.450.620.51
10717.011618LongiborneolT465-24-715880.591.11
10817.221637Juniper camphorT473-04-116471.471.69
10917.481659Homovanillic acidPh306-08-116590.391.040.831.531.300.772.040.841.560.891.341.910.730.940.750.541.410.84
11018.1617203-PhenoxyphenolPh713-68-81664 0.520.280.210.190.140.240.330.590.280.320.430.38
11118.441746Coniferyl aldehydePh458-36-61676 1.101.51
Total 72.7769.7990.4083.1277.2157.7669.5061.8688.8182.4182.6382.3381.6670.7589.0386.0484.3381.01
Ac: acids; Al: aldehydes; S: saccharides; Lk: linear ketones; Ck: cyclic ketones; F: furans; Ar: aromatics; Ph: phenols; T: terpenes; Rt: retention time, min; Ri: calculated Kovats retention index; CAS: CAS registry number; RiNIST: NIST reported Kovats retention index.

4. Conclusions

Needles, cones and bark from silver fir (Abies alba Mill.), as representative coniferous forestry residue in Romania, were thermally treated by torrefaction at 250 °C, stand-alone pyrolysis at 550 °C and combined torrefaction and pyrolysis. Differences were observed between the thermal conversion procedures and between the three types of fir biomass. The main effects of the torrefaction were dehydration, the removal of extractives and the degradation of hemicelluloses, which produced gases and an aqueous fraction, with only trace amounts of organic oils. The remaining cellulose and lignin in the torrefied fir samples were thermally stabilized, as suggested by the thermogravimetry data. The strong deoxygenation down to ~11 wt% and the increase in the carbon content up to ~80 wt% led to solid materials, with enhanced calorific values of ~32 MJ/kg, that preserved almost the entire energy content of the studied forestry residues. The pyrolysis involved the advanced thermal degradation of all the structural units in the studied forestry residues, increasing the amount of gaseous and liquid products and producing solid materials with high amounts of fixed carbon, of above 60–70 wt%, along with high heating values of ~29 MJ/kg. The two-step thermal approach, consisting of combined torrefaction + pyrolysis, increased the solid yield and the amount of organic fractions, to the detriment of the aqueous phase. The obtained solid materials had higher carbon and hydrogen contents and lower amounts of oxygen compared with those obtained from the stand-alone pyrolysis, increasing the calorific content to ~30.5 MJ/kg. The O/C and H/C atomic ratios of 0.1 and 0.5, respectively, placed the samples in the favorable area close to the origin of the Van Krevelen diagram. The torrefied solid materials from the needles, cones and bark were statistically distinct according to PCA analysis, which was most probably due to the differences between the properties of the lignin in the three fir samples. The pyrolysis increased the similarities between the solid materials, with only a small distinction between the samples from the needles still being observable. The liquid products of the thermal treatment had complex compositions, including more than 110 chemical compounds, such as acids, acetals, saccharides, linear ketones, cyclic ketones, furans, aromatics, phenols and terpenes. The combined torrefaction and pyrolysis approach led to more uniformly composed liquid products, regardless of the initial biomass source.

Author Contributions

Conceptualization, M.B.; investigation, M.B. and E.B.; supervision, M.B.; writing—original draft, M.B. and E.B.; writing—review and editing, M.B. All authors have read and agreed to the published version of the manuscript.

Funding

This research was funded by the grant from the Ministry of Research, Innovation and Digitization, CNCS/CCCDI-UEFISCDI, Romania, project code PN–III–P1-1.1-PD-2019-1120, contract number PD 49/2020, within PNCDI III.

Institutional Review Board Statement

Not applicable.

Informed Consent Statement

Not applicable.

Data Availability Statement

Not applicable.

Acknowledgments

The support from Daniela Ionita for access to the thermogravimetric equipment and from Nicoleta Balmoj (Forest Engineer at Ocolul Silvic Tg. Neamț) for the authentication of the forest biomass residues is gratefully acknowledged.

Conflicts of Interest

The authors declare no conflict of interest.

References

  1. Scarlat, N.; Dallemand, J.-F.; Monforti-Ferrario, F.; Banja, M.; Motola, V. Renewable energy policy framework and bioenergy contribution in the European Union—An overview from National Renewable Energy Action Plans and Progress Reports. Renew. Sustain. Energy Rev. 2015, 51, 969–985. [Google Scholar] [CrossRef]
  2. Titus, B.D.; Brown, K.; Helmisaari, H.-S.; Vanguelova, E.; Stupak, I.; Evans, A.; Clarke, N.; Guidi, C.; Bruckman, V.J.; Varnagiryte-Kabasinskiene, I.; et al. Sustainable forest biomass: A review of current residue harvesting guidelines. Energy Sustain. Soc. 2021, 11, 10. [Google Scholar] [CrossRef]
  3. Balaman, Ş.Y. Introduction to biomass-resources, production, harvesting, collection, and storage. In Decision-Making for Biomass-Based Production Chains. The Basic Concepts and Methodologies; Balaman, Ş.Y., Ed.; Academic Press: London, UK, 2019; Chapter 1; pp. 1–23. [Google Scholar] [CrossRef]
  4. Barbati, A.; Marchetti, M.; Chirici, G.; Corona, P. European Forest Types and Forest Europe SFM indicators: Tools for monitoring progress on forest biodiversity conservation. For. Ecol. Manag. 2014, 321, 145–157. [Google Scholar] [CrossRef] [Green Version]
  5. Scarlat, N.; Blujdea, V.; Dallemand, J.-F. Assessment of the availability of agricultural and forest residues for bioenergy production in Romania. Biomass Bioenergy 2011, 35, 1995–2005. [Google Scholar] [CrossRef]
  6. Kaur, R.; Kaur, P. Chemical valorization of cellulose from lignocellulosic biomass: A step towards sustainable development. Cellul. Chem. Technol. 2021, 55, 207–222. [Google Scholar] [CrossRef]
  7. Galić, M.; Stajić, M.; Ćilerdžić, J. Lignocellulose waste valorization by an enzymatic cocktail of P. eryngii and P. pulmonarius. Cellul. Chem. Technol. 2021, 55, 1043–1050. [Google Scholar] [CrossRef]
  8. Zadeh, Z.E.; Abdulkhani, A.; Aboelazayem, O.; Saha, B. Recent insights into lignocellulosic biomass pyrolysis: A critical review on pretreatment, characterization, and products upgrading. Processes 2020, 8, 799. [Google Scholar] [CrossRef]
  9. Jahirul, M.I.; Rasul, M.G.; Chowdhury, A.A.; Ashwath, N. Biofuels production through biomass pyrolysis—A technological review. Energies 2012, 5, 4952–5001. [Google Scholar] [CrossRef]
  10. Chen, Z.; Wang, M.; Jiang, E.; Wang, D.; Zhang, K.; Ren, Y.; Jiang, Y. Pyrolysis of torrefied biomass. Trends Biotechnol. 2018, 36, 1287–1298. [Google Scholar] [CrossRef] [Green Version]
  11. Basu, P. Torrefaction. In Biomass Gasification, Pyrolysis and Torrefaction—Practical Design and Theory, 3rd ed.; Basu, P., Ed.; Academic Press: San Diego, CA, USA, 2018; pp. 93–154. [Google Scholar] [CrossRef]
  12. Gent, S.; Twedt, M.; Gerometta, C.; Almberg, E. Introduction to Thermochemical Conversion Processes. In Theoretical and Applied Aspects of Biomass Torrefaction. For Biofuels and Value-Added Products; Gent, S., Twedt, M., Gerometta, C., Almberg, E., Eds.; Butterworth-Heinemann: Oxford, UK, 2017; pp. 1–16. [Google Scholar] [CrossRef]
  13. Arias, B.; Pevida, C.; Fermoso, J.; Plaza, M.G.; Rubiera, F.; Pis, J.J. Influence of torrefaction on the grindability and reactivity of woody biomass. Fuel Process. Technol. 2008, 89, 169–175. [Google Scholar] [CrossRef] [Green Version]
  14. Dyjakon, A.; Noszczyk, T.; Mostek, A. Mechanical durability and grindability of pellets after torrefaction. Process. Energies 2021, 14, 6772. [Google Scholar] [CrossRef]
  15. Chew, J.J.; Doshi, V. Recent advances in biomass pretreatment—Torrefaction fundamentals and technology. Renew. Sustain. Energy Rev. 2011, 15, 4212–4222. [Google Scholar] [CrossRef]
  16. Rowell, R.M.; Pettersen, R.; Tshabalala, M.A. Cell Wall Chemistry. In Handbook of Wood Chemistry and Wood Composites, 2nd ed.; Rowell, R.M., Ed.; CRC Press: London, UK, 2012; pp. 33–72. Available online: https://www.routledgehandbooks.com/doi/10.1201/b12487-5 (accessed on 11 April 2020).
  17. Zhang, L.; Liu, J.; Zhang, Z.; Yang, Z.; Wang, X.; Li, D.; Lin, R. Research of the two-step pyrolysis of lignocellulosic biomass based on the cross-coupling of components by Py-GC/MS. Biomass Conv. Biorefin. 2021. [Google Scholar] [CrossRef]
  18. Wang, S.; Luo, Z. Pyrolysis of hemicellulose. In Pyrolysis of Biomass; De Gruyter: Berlin, Germany; Boston, MA, USA, 2016; Chapter 3; pp. 81–102. [Google Scholar] [CrossRef]
  19. Mettler, M.S.; Mushrif, S.H.; Paulsen, A.D.; Javadekar, A.D.; Vlachos, D.G.; Dauenhauer, P.J. Revealing pyrolysis chemistry for biofuels production: Conversion of cellulose to furans and small oxygenates. Energy Environ. Sci. 2012, 5, 5414–5424. [Google Scholar] [CrossRef] [Green Version]
  20. Wang, S.; Luo, Z. Pyrolysis of lignin. In Pyrolysis of Biomass; De Gruyter: Berlin, Germany; Boston, MA, USA, 2016; Chapter 4; pp. 103–140. [Google Scholar] [CrossRef]
  21. Brebu, M.; Vasile, C. Thermal degradation of lignin—A review. Cellul. Chem. Technol. 2010, 44, 353–363. [Google Scholar]
  22. Borella, M.; Casazza, A.A.; Garbarino, G.; Riani, P.; Busca, G. A study of the pyrolysis products of Kraft lignin. Energies 2022, 15, 991. [Google Scholar] [CrossRef]
  23. Părpăriță, E.; Brebu, M.; Uddin, M.A.; Yanik, J.; Vasile, C. Pyrolysis behaviors of various biomasses. Polym. Degrad. Stab. 2014, 100, 1–9. [Google Scholar] [CrossRef]
  24. Harun, N.Y.; Afzal, M.T. Thermal Decomposition Kinetics of Forest Residue. J. Appl. Sci. 2010, 10, 1122–1127. [Google Scholar] [CrossRef] [Green Version]
  25. Enes, T.; Aranha, J.; Fonseca, T.; Lopes, D.; Alves, A.; Lousada, J. Thermal properties of residual agroforestry biomass of Northern Portugal. Energies 2019, 12, 1418. [Google Scholar] [CrossRef] [Green Version]
  26. Dyjakon, A.; Noszczyk, T. Alternative fuels from forestry biomass residue: Torrefaction process of horse chestnuts, oak acorns, and spruce cones. Energies 2020, 13, 2468. [Google Scholar] [CrossRef]
  27. Negahdar, L.; Gonzalez-Quiroga, A.; Otyuskaya, D.; Toraman, H.E.; Liu, L.; Jastrzebski, J.T.; Van Geem, K.M.; Marin, G.B.; Thybaut, J.W.; Weckhuysen, B.M. Characterization and comparison of fast pyrolysis bio-oils from pinewood, rapeseed cake, and wheat straw using 13C NMR and comprehensive GC × GC. ACS Sustain. Chem. Eng. 2016, 4, 4974–4985. [Google Scholar] [CrossRef] [PubMed] [Green Version]
  28. Shah, Z.; Renato, C.V.; Marco, A.C.; Rosangela, D.S. Separation of phenol from bio-oil produced from pyrolysis of agricultural wastes. Mod. Chem. Appl. 2017, 5, 1000199. [Google Scholar] [CrossRef]
  29. Motte, J.-C.; Sambusiti, C.; Dumas, C.; Barakat, A. Combination of dry dark fermentation and mechanical pretreatment for lignocellulosic deconstruction: An innovative strategy for biofuels and volatile fatty acids recovery. Appl. Energy 2015, 147, 67–73. [Google Scholar] [CrossRef]
  30. Granados, D.A.; Basu, P.; Chejne, F.; Nhuchhen, D.R. Detailed investigation into torrefaction of wood in a two-stageinclined rotary torrefier. Energy Fuels 2017, 31, 647–658. [Google Scholar] [CrossRef]
  31. Butnaru, E.; Pamfil, D.; Stoleru, E.; Brebu, M. Characterization of bark, needles and cones from silver fir (Abies alba Mill.) towards valorization of biomass forestry residues. Biomass Bioenergy 2022, 159, 106413. [Google Scholar] [CrossRef]
  32. Pereira, B.L.C.; Carneiro, A.; de Cássia Oliveira Carneiro, A.; Carvalho, A.M.M.L.; Colodette, J.L.; Oliveira, A.C.; Fontes, M.P.F. Influence of chemical composition of Eucalyptus wood on gravimetric yield and charcoal properties. BioResources 2013, 8, 4574–4592. [Google Scholar] [CrossRef]
  33. Channiwala, S.A.; Parikh, P.P. A unified correlation for estimating HHV of solid, liquid and gaseous fuels. Fuel 2002, 81, 1051–1063. [Google Scholar] [CrossRef]
  34. Chen, W.-H.; Peng, J.; Bi, X.T. A state-of-the-art review of biomass torrefaction, densification and applications. Renew. Sustain. Energy Rev. 2015, 44, 847–866. [Google Scholar] [CrossRef]
  35. Murata, K.; Hirano, Y.; Sakata, Y.; Uddin, M.A. Basic study on a continuous flow reactor for thermal degradation of polymers. J. Anal. Appl. Pyrolysis 2002, 65, 71–90. [Google Scholar] [CrossRef]
  36. Brebu, M.; Tamminen, T.; Hannevold, L.; Stöcker, M.; Spiridon, I. Catalytic upgrading of co-pyrolysis oils from bisphenol a polycarbonate and lignins. Polym. Degrad. Stab. 2014, 102, 88–94. [Google Scholar] [CrossRef]
  37. Brebu, M.; Cazacu, G.; Chirilă, O. Pyrolysis of lignin—A potential method for obtaining chemicals and/or fuels. Cellul. Chem. Technol. 2011, 45, 43–50. [Google Scholar]
  38. Febrero, L.; Granada, E.; Pérez, C.; Patiño, D.; Arce, E. Characterisation and comparison of biomass ashes with different thermal histories using TG-DSC. J. Therm. Anal. Calorim. 2014, 118, 669–680. [Google Scholar] [CrossRef]
  39. Wise, M.L.; Croteau, R. Monoterpene Biosynthesis. In Comprehensive Natural Products Chemistry; Barton, D., Nakanishi, K., Meth-Cohn, O., Eds.; Pergamon: Pullman, WA, USA, 1999; Volume 2, pp. 97–153. [Google Scholar] [CrossRef]
  40. Cates, R.G.; Henderson, C.B.; Redak, R.A. Responses of the western spruce budworm to varying levels of nitrogen and terpenes. Oecologia 1987, 73, 312. Available online: https://www.jstor.org/stable/4218368 (accessed on 11 April 2020). [CrossRef] [PubMed]
  41. Brebu, M.; Tamminen, T.; Spiridon, I. Thermal degradation of various lignins by TG-MS/FTIR and Py-GC-MS. J. Anal. Appl. Pyrolysis 2013, 104, 531–539. [Google Scholar] [CrossRef]
Figure 1. Experimental set-up for torrefaction and/or pyrolysis of silver fir biomass.
Energies 15 03483 g001
Figure 2. Product yield (±5% associated error) and high heating value (HHV) of solid residues from thermal processing of fir needles, cones and bark by torrefaction and/or pyrolysis.
Energies 15 03483 g002
Figure 3. Solid yield, energy density and energy yield from thermal processing of fir forestry waste.
Energies 15 03483 g003
Figure 4. Position in the Van Krevelen diagram of the fir needles, cones and bark before and after thermal processing by torrefaction and/or pyrolysis.
Energies 15 03483 g004
Figure 5. The PCA plot of needles, cones and bark from fir according to the chemical/compositional analysis and calorific values.
Energies 15 03483 g005
Figure 6. The TG and DTG curves of needles, cones and bark from fir (a) and of their solid residue after torrefaction (b), pyrolysis (c) and combined torrefaction + pyrolysis (d).
Energies 15 03483 g006
Figure 7. The GC–MSD chromatograms of the aqueous and oil fractions from torrefaction (a), pyrolysis (b) and combined torrefaction + pyrolysis (c) of needles, cones and bark from fir.
Energies 15 03483 g007
Figure 8. The NP-gram curves of aqueous and oil fractions from thermal processing of needles, cones and bark from fir by torrefaction (a), pyrolysis (b) and combined torrefaction+pyrolysis (c).
Energies 15 03483 g008
Figure 9. The heatmap representing the composition (±3% associated error) of aqueous and oil fractions from torrefaction and/or pyrolysis of fir needles, cones and bark, expressed in terms of main classes of compounds.
Energies 15 03483 g009
Table 1. Proximate (±3% associated error) and ultimate (±5% associated error) analysis (wt%, moisture free basis) of needles, cones and barks from silver fir and of their solids from torrefaction and/or pyrolysis, as well as the related calculated parameters.
SampleMoistureVolatile MatterFixed CarbonAshCHNSO *Atomic H/CAtomic O/CHHV MJ/kg
Fn4.4978.9916.224.7953.586.780.140.7333.980.481.5223.15
Fc7.2869.3827.982.6454.266.360.370.4835.890.501.4122.72
Fb6.7089.714.505.7952.906.540.140.7533.880.481.4822.62
ToFn1.8486.1310.333.5479.894.810.410.3411.010.100.7232.37
ToFc3.0161.2737.151.5880.944.720.320.6011.840.110.7032.62
ToFb2.5072.7221.136.1578.464.850.100.1510.290.100.7431.93
PyFn1.6032.2362.155.6276.523.020.230.1214.490.140.4728.66
PyFc2.4425.5371.622.8578.862.640.110.3915.150.140.4029.05
PyFb1.6024.4970.804.7177.732.950.210.1814.220.140.4529.05
PyToFn1.6927.1666.786.0678.943.690.120.2210.970.100.5630.67
PyToFc2.3922.6474.402.9681.443.090.180.8311.500.110.4630.91
PyToFb1.5018.6874.926.4079.523.310.100.1710.500.100.5030.46
* Oxygen calculated by difference (100–ash–C–H–N–S).
Publisher’s Note: MDPI stays neutral with regard to jurisdictional claims in published maps and institutional affiliations.

