Article

A Production and Delivery Model of Hydrogen from Solar Thermal Energy in the United Arab Emirates

Graduate School of Science and Technology, University of Tsukuba, Tsukuba 3058573, Japan
*
Author to whom correspondence should be addressed.
Energies 2022, 15(11), 4000; https://doi.org/10.3390/en15114000
Submission received: 30 April 2022 / Revised: 24 May 2022 / Accepted: 26 May 2022 / Published: 29 May 2022
(This article belongs to the Topic Sustainable Energy Technology)

Abstract

:
Hydrogen production from surplus solar electricity as energy storage for export purposes can push towards large-scale application of solar energy in the United Arab Emirates and the Middle East region; this region’s properties of high solar irradiance and vast empty lands provide a good fit for solar technologies such as concentrated solar power and photovoltaics. However, a thorough comparison between the two solar technologies, as well as investigating the infrastructure of the United Arab Emirates for a well-to-ship hydrogen pathway, is yet to be fully carried out. Therefore, in this study we aim to provide a full model for solar hydrogen production and delivery by evaluating the potential of concentrated solar power and photovoltaics in the UAE, then comparing two different pathways for hydrogen delivery based on the location of hydrogen production sites. A Solid Oxide Cell Electrolyzer (SOEC) is used for technical comparison, while the shortest routes for hydrogen transport were analyzed using Geographical Information System (GIS). The results show that CSP technology coupled with SOEC is the most favorable pathway for large-scale hydrogen from solar energy production in the UAE for export purposes. Although PV has a slightly higher electricity potential compared to CSP, around 42 GWh/km2 to 41.1 GWh/km2, respectively, CSP show the highest productions rates of over 6 megatons of hydrogen when the electrolyzer is placed at the same site as the CSP plant, while PV generates 5.15 megatons when hydrogen is produced at the same site with PV plants; meanwhile, hydrogen from PV and CSP shows similar levels of 4.8 and 4.6 megatons of hydrogen, respectively, when electrolyzers are placed at port sites. Even considering the constraints in the UAE’s infrastructure and suggesting new shorter electrical transmission lines that could save up to 0.1 megatons of hydrogen in the second pathway, production at the same site with CSP is still the most advantageous scenario.

1. Introduction

The Middle East region, including the United Arab Emirates, is facing a growing energy demand and a surge in CO2 emissions [1,2], leading the region into looking for new sources of energy with low carbon footprint.
The region’s climatic advantages provide a suitable fit for solar energy [1,2,3,4,5,6,7], from sunlight abundance to the vast open areas of deserts [8]. A few projects and plans to exploit the UAE’s solar potential, such as concentrated solar power (CSP) and photovoltaics (PV), are already afoot, but addressing its full capabilities is still a distant milestone. Only 2% of the UAE’s electricity came from renewable resources by the year 2018 [6], and that comes as a result of the large economic investment renewables require compared to the current traditionally applied technologies [1].
Hydrogen’s ability to store surplus energy from renewable sources, such as solar energy, makes it a key player in the future of renewables and global decarbonization efforts by guaranteeing long term sustainability [9,10,11,12]. The global demand for hydrogen is on the rise, especially in the mobility sector [13]. Japan already has plans to integrate hydrogen into their future energy mix [14], but as domestic supply of hydrogen fails to meet its targets in CO2 emissions reduction, importing zero-carbon produced H2 from overseas seems like a viable option [15,16,17]. For instance, to realize its goal of a hydrogen-based society, Japan aims to establish an international hydrogen supply chain [18]. A deal to co-operate on the development of such a supply chain has already been established between Japan and the United Arab Emirates, as the UAE and other countries in the Middle East region aspire to becoming major international suppliers of low-carbon hydrogen in the future [19]. The profits from exporting green hydrogen from excess energy in the UAE can provide an incentive to decision makers to seek a higher renewable energy target.
Concentrated solar power plants are deemed as one of the favorable pathways for large-scale hydrogen production from solar power [20]. Its compatibility with thermal energy storages (TES) that can store energy in the form of heat can overcome the challenge of fluctuating energy supply from solar technologies. It can also prevent the intermittent functioning of water electrolyzers and provide more stable hydrogen production [20]. Another advantage of CSP and TES is that the electricity supply can be adapted to the demand, providing more flexible hydrogen production for export, and abating the need for H2 storage at production site.
Although the UAE’s potential for renewable energy and hydrogen production was addressed in a few previous studies, none addresses the possible use of hydrogen as a means for maximum solar energy potential fulfilment. While some studies consider a hydrogen future for the UAE, the focus is only on official targets and cost analysis, or the use of energy from photovoltaics and nuclear plants only for hydrogen production [21,22,23]. In addition, hydrogen production and utilization are confronted with a spatial gap which infrastructure can solve [9], but the United Arab Emirates’ infrastructure is yet to be analyzed with a full plan for hydrogen delivery and transport. Thus, a clear gap between renewable energy application and hydrogen supply chain is present in the case of the United Arab Emirates.
Therefore, this study aims to bridge this gap by using the excess energy from two different scenarios of large-scale solar energy application in the UAE for hydrogen production for the purpose of export, by comparing electricity and hydrogen production from PV and CSP and analyzing two different delivery pathways while examining the UAE’s current infrastructure and highlighting the constraints. This will provide an adequate and detailed model for hydrogen production from solar technologies in the UAE with a well-to-ship supply chain for the delivery of hydrogen from plants to ports. The resultant predicted income from hydrogen sales would make large-scale solar energy application feasible, while keeping the UAE as a major energy exporter in the market. This paper also proposes some solutions to the limitations in the UAE’s infrastructure capabilities to deliver the produced hydrogen, and analyzes how this will affect the hydrogen supply chains.

2. Materials and Methods

This study investigates the technical potential of hydrogen production from excess electricity of CSP and PV application in the UAE based on our previous study [24], where the potential of solar energy in the United Arab Emirates was estimated by analyzing the suitable areas for solar energy application, satisfying a solar irradiance of 5 kWh/m2/day and higher and a slope lower than 3% based on the National Renewable Energy Laboratory’s (NREL) model for the estimation of rural utility-scale PV and CSP [25]. Depending on the distance from roads, electrical grid, and water supply, these areas were then divided into three different scenarios after the exclusion of populated and protected areas with 10, 25, and 40 km distances, as 40 km is the furthest distance for a buffer zone from main roads and electrical grid before it crosses the UAE borders, and then this distance was divided into three different scenarios for more simple representation. The results show that the two scenarios with distances of 25 km and 40 km from the mentioned parameters can leave extra electricity for hydrogen production, after satisfying the future electricity demand of the UAE and the 27% green energy obligations for the year 2023 [6,26]. Figure 1 shows the GIS results of the areas of the UAE that are suitable for solar energy application in the 25 km and 40 km scenarios.
In Figure 2 we explain the flow of the study by using the areas suitable for solar energy production in the UAE to calculate PV and CSP potentials to having the final amounts of liquid hydrogen ready for export.
The equation used to evaluate the UAE’s technical potential of solar energy in MWh is derived from the NREL’s technical report as follows [25]:
Available land [km2] × Power density [MW/km] × Region capacity factor [%] × 8760 [hours per year]
The CSP system assumed in our study is a tower system with dry cooling, with salt as a heat fluid, coupled with a 10-h thermal storage and a solar multiple of 2.4. The power density of this system is 14.9 MW/km2 according to NREL’s module [27]. Following the assessments of NREL, a region capacity factor of 31.5% is used for areas with 5 kWh/m2/day irradiance or higher [25]. As for the PV system, a one-axis tracking collector with the axis of rotation aligned north-south with zero-degree tilt from horizon as per the NREL model for utility-scale photovoltaics was assumed [25], power density of 30 MW/km2 is assumed [28], and the UAE’s capacity factor of 16% is used as per Al Ali et al.’s analysis for PV application in Abu Dhabi [29]. Table 1 presents the area and expected energy production results after applying all assumptions of both systems in Equation (1).
The hydrogen supply chain model is similar to those of Strachan et al. [30], Balta-Ozkan et al. [31], Reuß et al. [9,32], and Tlili et al. [33], where different delivery pathways are compared and travel distances to demand areas are assessed.
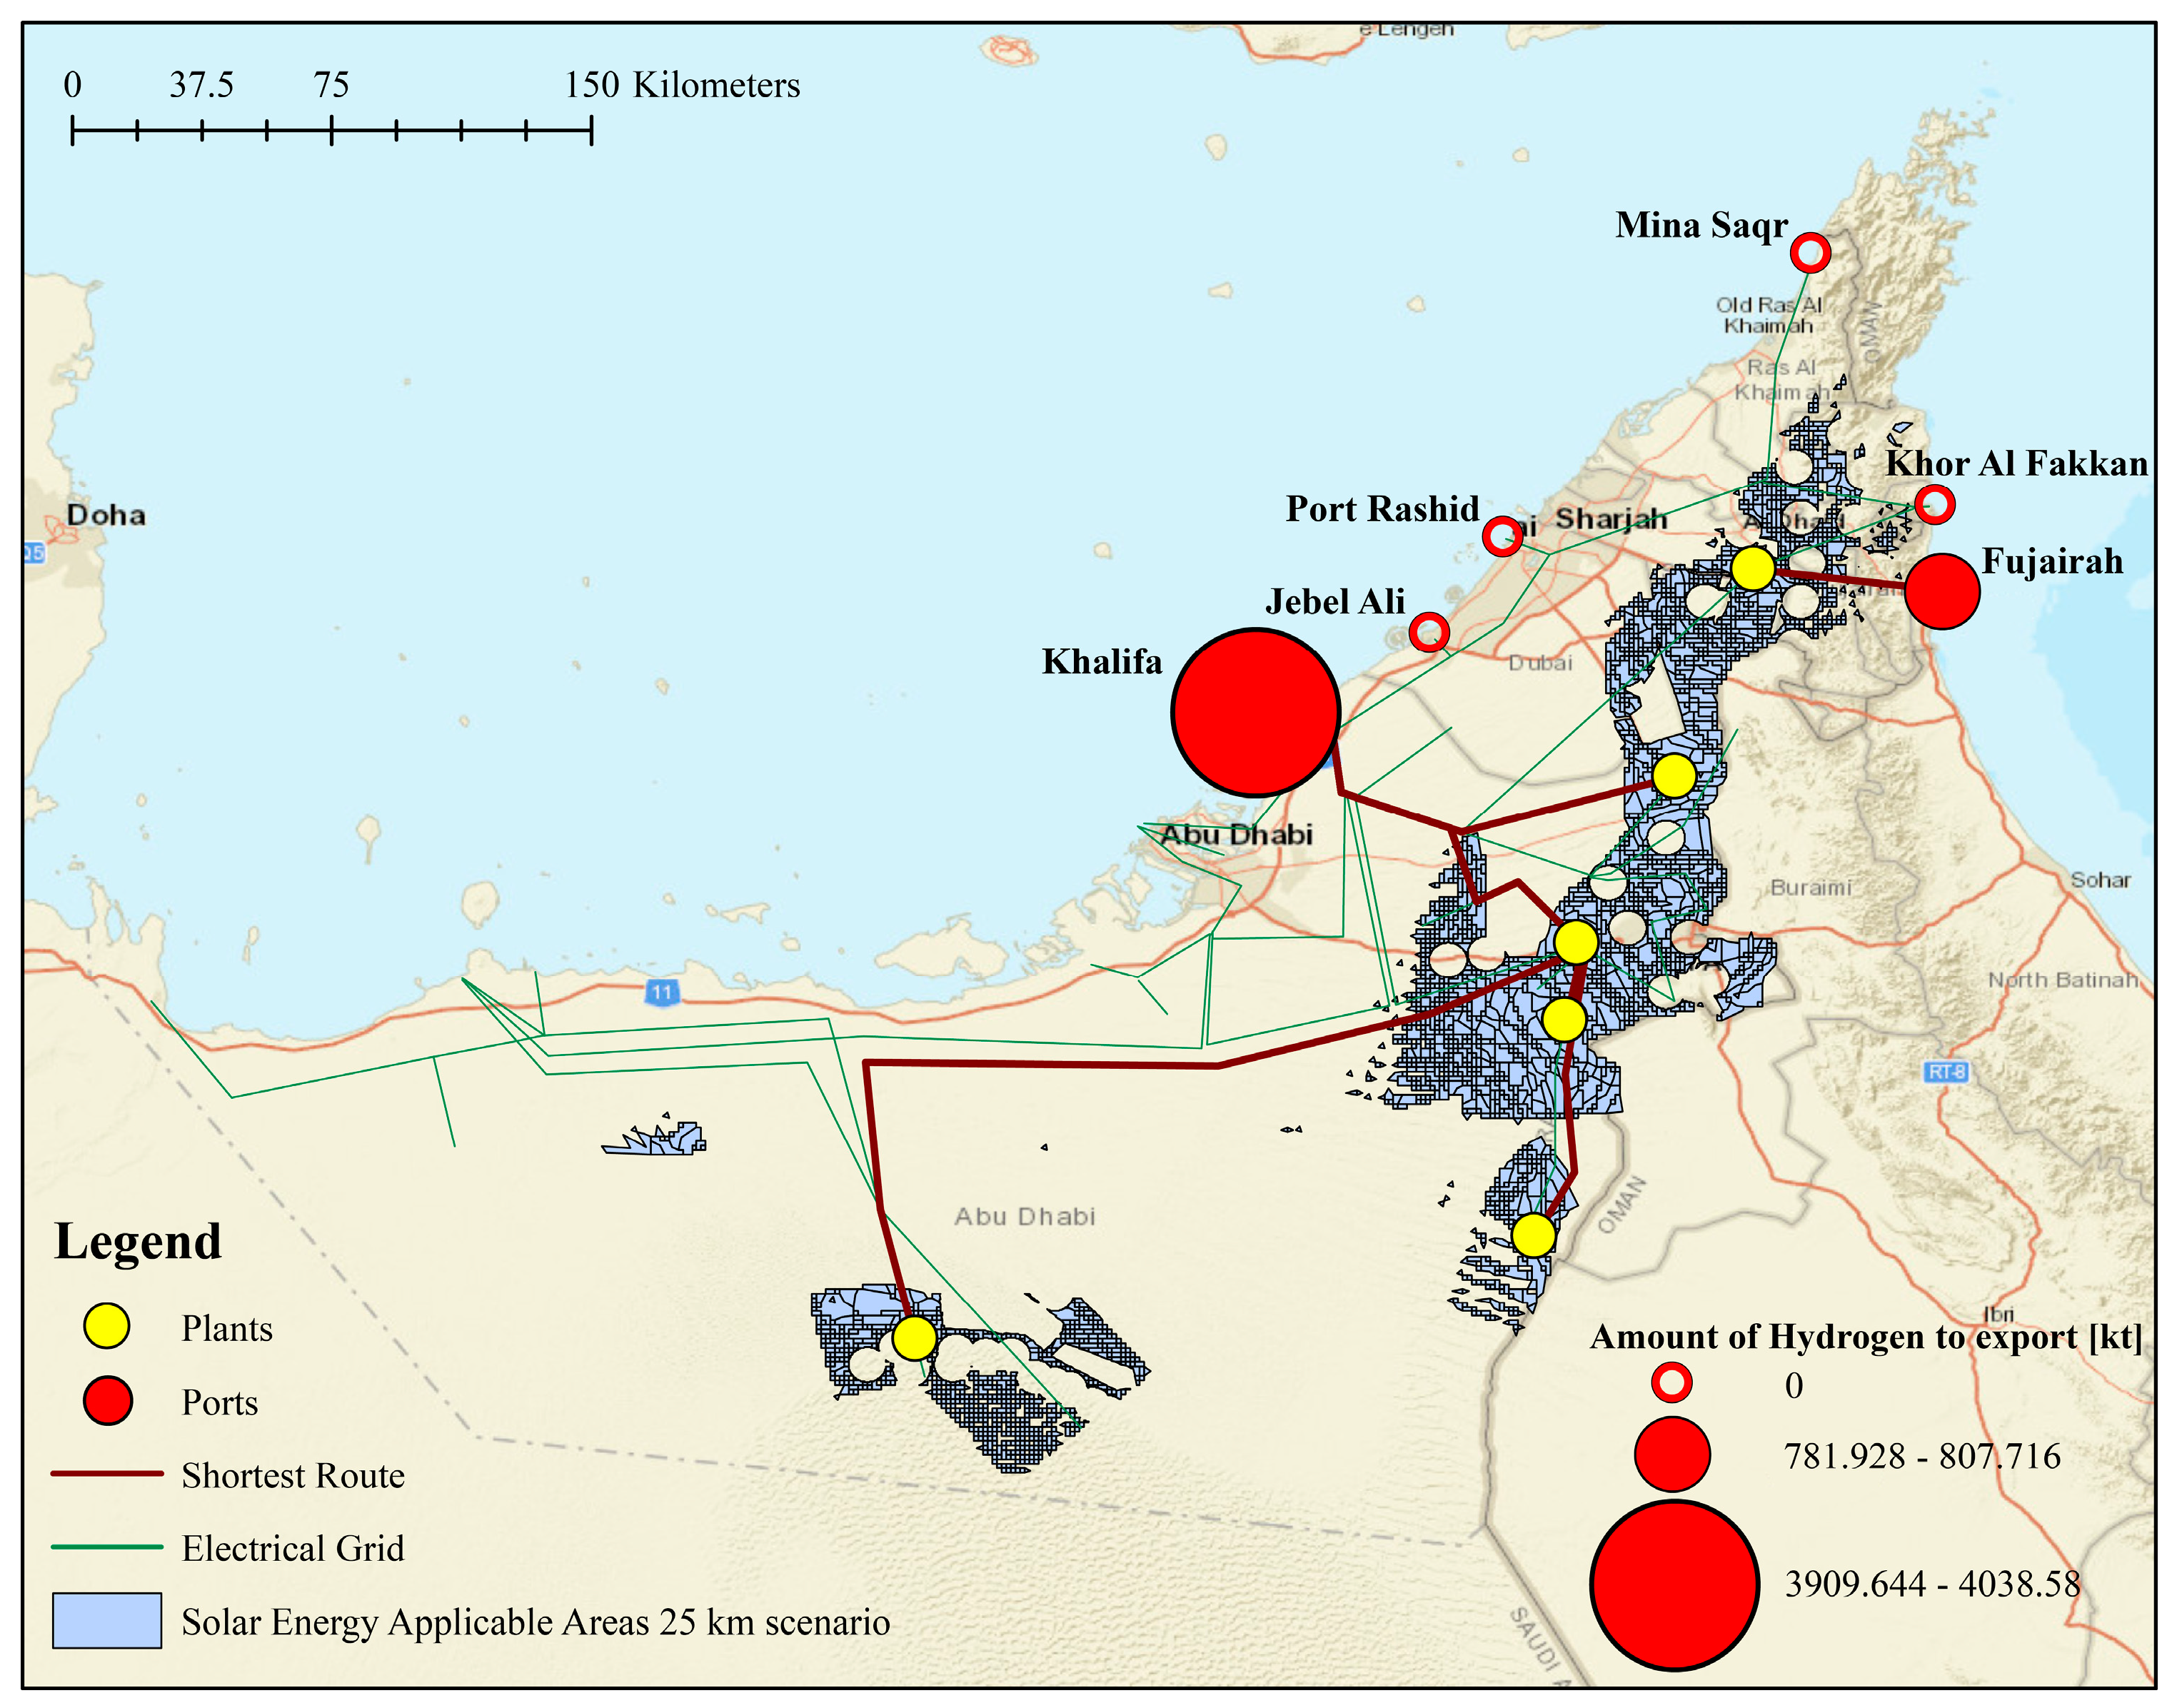
This study proposes two delivery pathways based on the location of H2 electrolyzers. The first pathway allocates hydrogen plants at the same site as solar energy plants; six main locations are chosen for the plants, covering all areas of the UAE suitable for solar energy application, with direct access to the main road grid and electricity transmission lines in the UAE. In this pathway, trucks are assumed to carry the produced hydrogen to the six main seaports for export in the UAE [34]. Using Geographical Information System (GIS), the shortest distances from plants to ports are analyzed to investigate the applicability of this scenario (road network data from OpenStreetMap [35] is used).
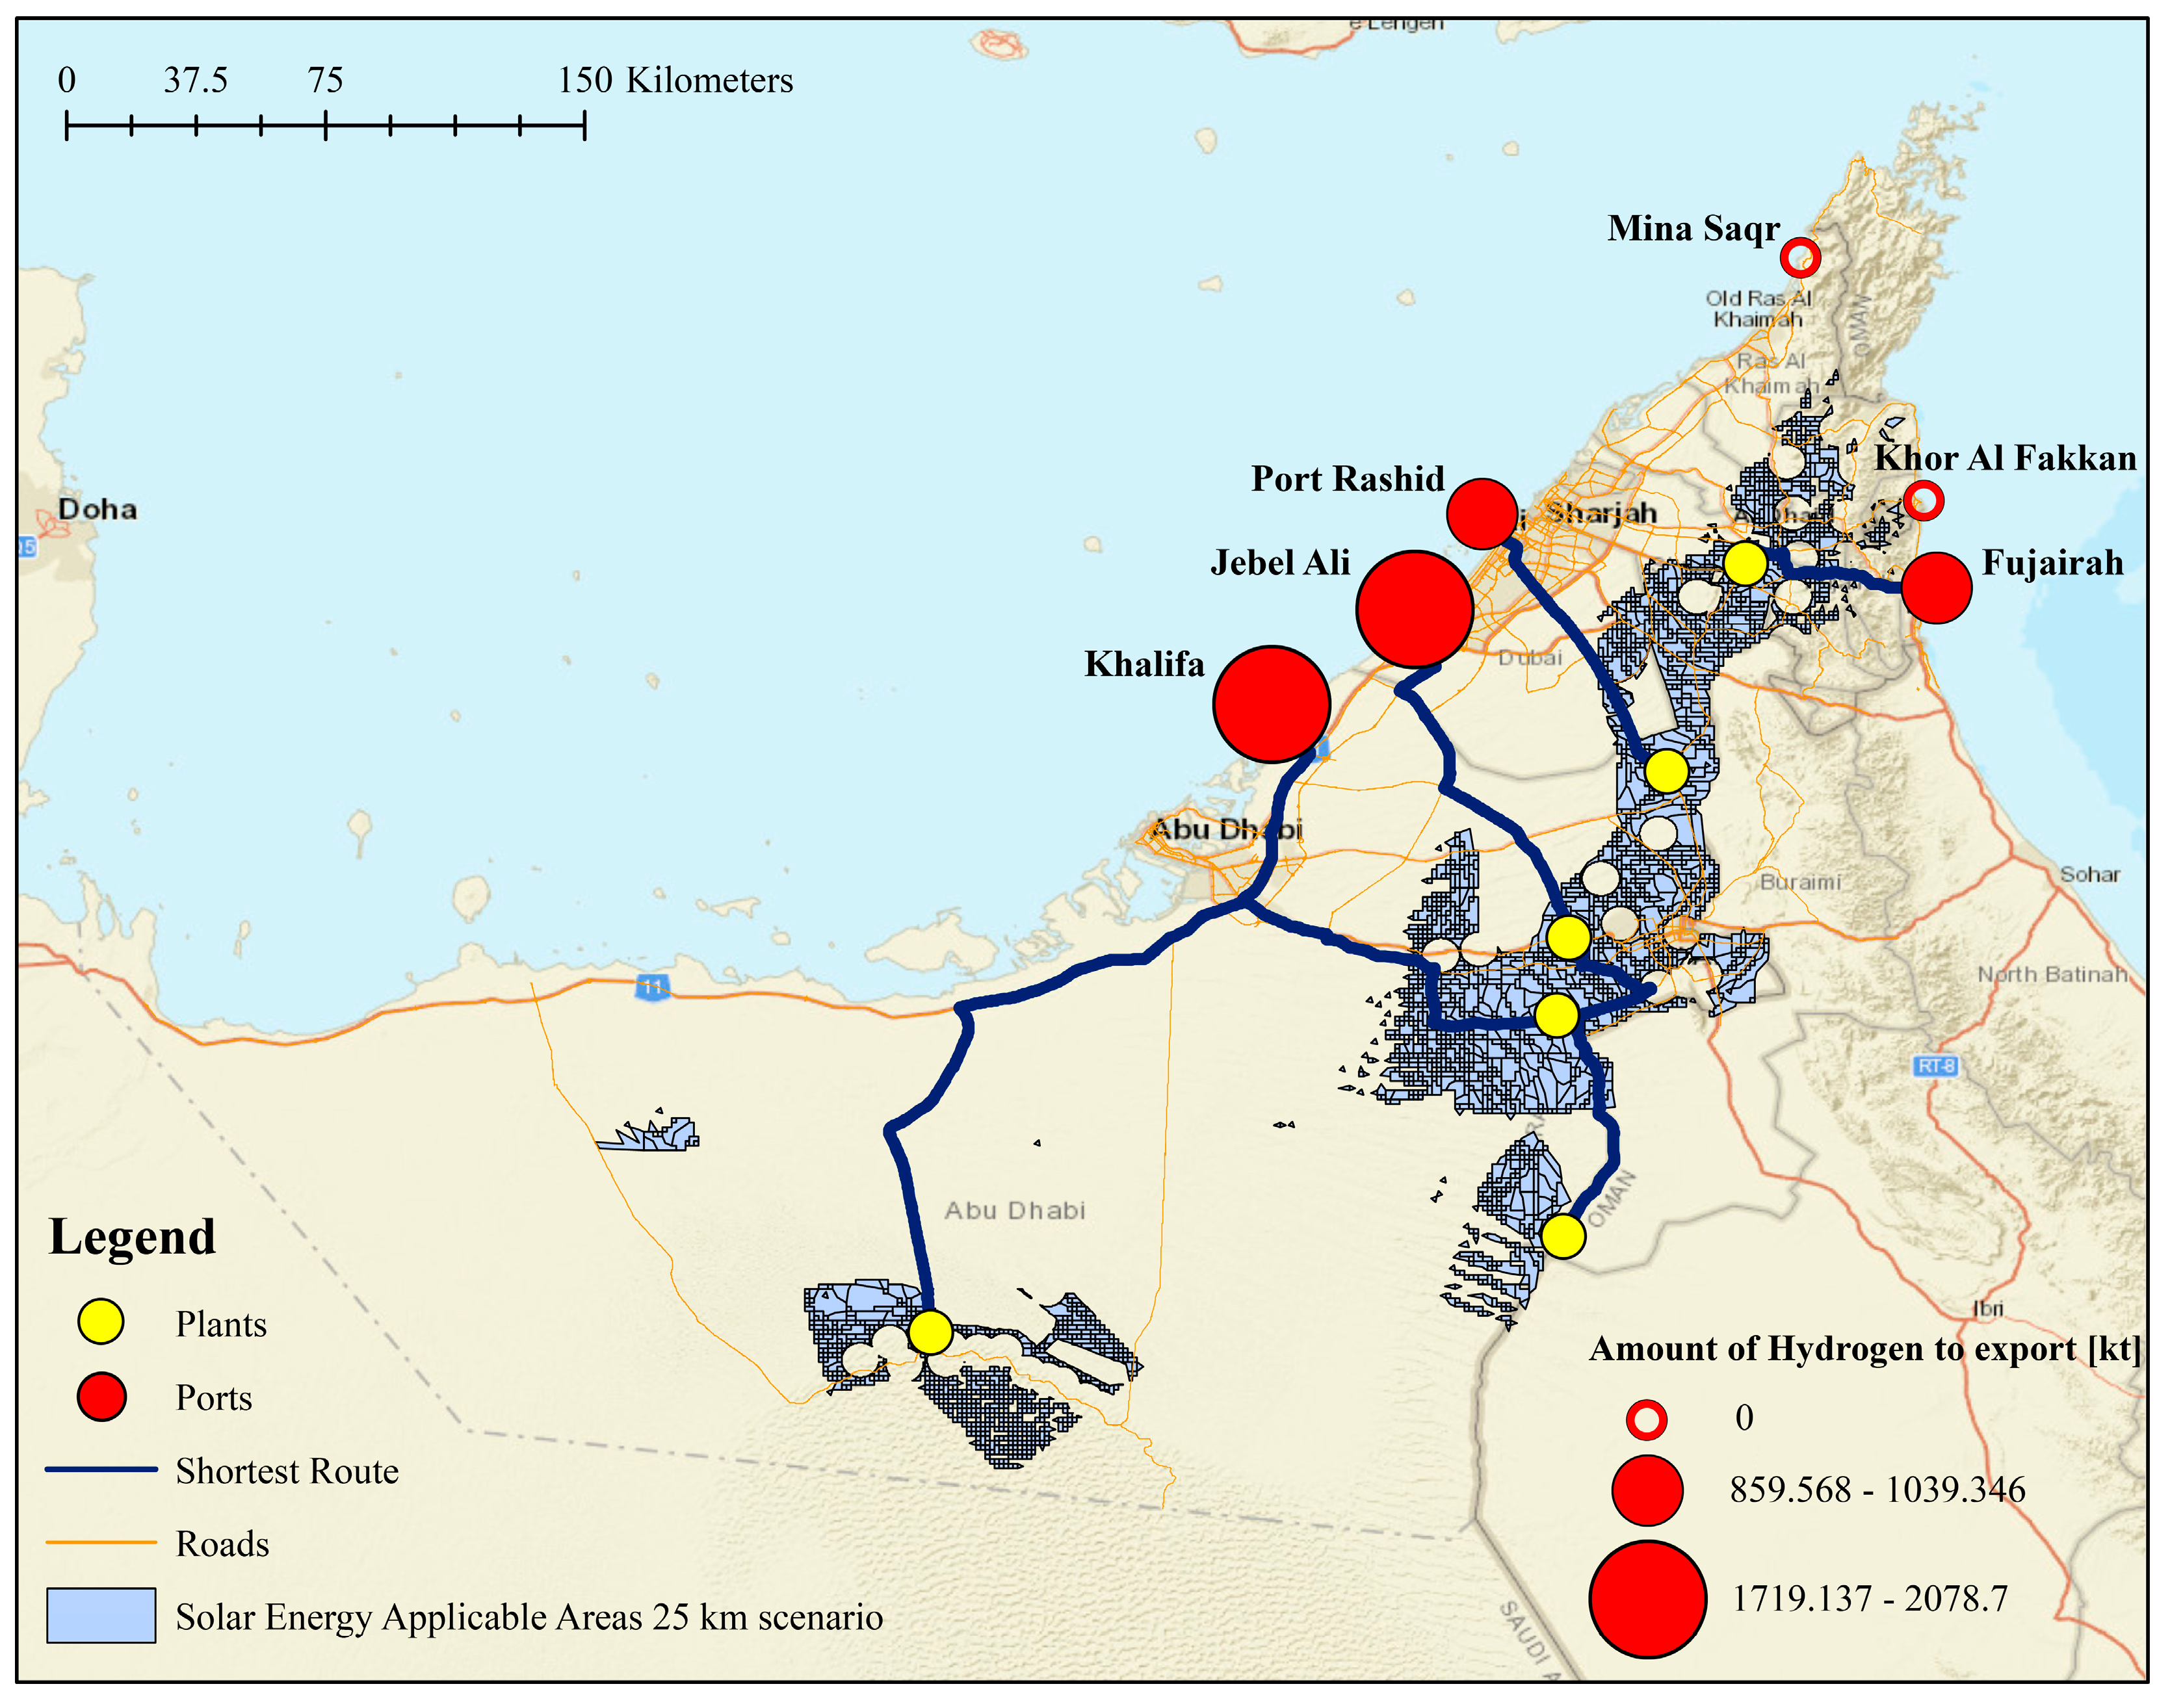
In the second pathway we place hydrogen plants at the port sites, assuming that the excess electricity from solar plants is transmitted through the electrical transmission lines of the UAE towards export ports, and assuming that 3% of the electricity is lost in the grid for every 1000 km traveled in the selected electricity grid lines of 220 kV and above of the UAE [36]. To ensure the least loss of electricity possible in the network, GIS is used to optimize the shortest routes that electricity can travel in this scenario. The second pathway also uses the same CSP plants and ports assumed in the first pathway. The layout of the pathway study methodology is shown in Figure 3.
The network analyst function of GIS is used to carry out the spatial analysis after uploading the road network of the UAE and specifying the use of only main roads and highways where hydrogen trailers are allowed to drive. Similarly, the data of the UAE’s electric grid are inserted, and lines with 220 voltage and above are chosen for the analysis. Then, the six plants and chosen ports are fixed on the map. Finding the closest facility tool is then used to estimate the shortest routes between each plant and each port for both pathways.
As for H2 production, solid oxide electrolyzers (SOECs) are used where the electrolyte is a solid ceramic membrane. Although it is a less-mature technology than other electrolyzers, such as alkaline and proton exchange membrane (PEM), and has higher investment cost, SOEC promises greater efficiencies [37]. This electrolyzer is assumed as a higher heating value (HHV), as high-temperature electrolyzers use heat as part of their energy demand [38], making it a perfect fit for thermal solar technologies such as CSP. SOEC electrolyzers use high-temperature steam electrolysis (HTE) at temperatures in the range of 700 °C to 800 °C [39]. This is why, when coupled to high-temperature heat sources such as solar thermal plants, this type of steam electrolyzer offers great advantages in both power requirements and heat provided, and the thermal energy storage integrated into the CSP plants ensures that fast load variations over the electrolyzer could be avoided [40]. The biggest disadvantage of the SOEC electrolyzer is that it is still in the development phase [41]. Chosen efficiencies for the electrolyzer are explained in Table 2. When coupled with PV, a heater is required to increase the temperature of water entering the electrolyzer to the needed levels, and an 11.5 kWh [41] extra energy consumption will be conducted from the PV electricity production for each kg of hydrogen.
For the second pathway, where the hydrogen plants are located at the ports, the SOEC would require extra energy to heat the water at the ports in the amount of 11.5 kWh/kg-H2 [41]. Desalinated seawater using reverse osmosis (RO) desalination is assumed as the water source for electrolysis in this scenario, and electrical expenses for water desalination are added to the energy demand of electrolyzers. The energy needed can be determined by multiplying the energy need per cubic meter with the amount of water that is necessary, which is [42]:
m H ˙ 2 O = m ˙ M × η × M H 2 O
where m ˙ (kg/s) is the production rate of hydrogen, M is the molar mass of hydrogen, η is the efficiency of water use, and M H 2 O is the molar mass of water.
We assume that hydrogen will be transported and exported in liquid form; liquification will be conducted at solar energy sites in the first pathway, and then transported to ports to be shipped overseas, while in the second pathway hydrogen is to be liquified at port sites to then board the H2 carrier ships. Liquification is assumed to consume 6.78 kWh for each kg of H2 [32] that is added to the electricity expenses of the electrolyzer. The Boil Off Gas (BOG) during liquification is neglected in this study.
Table 2. Electrolyzer efficiencies [43].
ElectrolyzerEfficiencyEfficiency
SOEC39.4 kWh/kg-H282%

3. Results and Discussions

3.1. CSP Technical Potential

In this study we estimate the potential of CSP application in the UAE. Table 3 represents the expected energy production results after applying all assumptions in Equation (1) and the surplus energy that can be used for hydrogen production after deducting the year 2023 energy demand additions and 27% green energy target of the UAE. To simplify this section, only the results of the 25 km energy scenario is shown. The numbers show that the UAE has a high potential for CSP with a large amount of excess energy even after realizing future energy targets.

3.2. PV Technical Potential

Photovoltaics technical potential is calculated by applying the assumptions into Equation (1) and, similarly to CSP surplus energy, is calculated as shown in Table 4.
Figure 4 presents a comparison between the amounts of electricity produced by PV and CSP in the 25 km energy scenario in the UAE from all plants. The energy share produced by PV in the areas suitable for solar energy production in the UAE is larger than that of CSP due to the higher power density of PV technology.

3.3. Hydrogen Plants at the Same Site as Solar Plant Sites Pathway

In this pathway, we first calculate the liquid hydrogen production for all different technologies after applying all assumptions. CSP has the largest amount of hydrogen produced, as shown in Table 5, as the SOEC electrolyzer shows higher efficiencies when directly coupled to a direct source of thermal energy such as the CSP plants. The produced hydrogen quantities from each technology are compared in Figure 5.
Next, we carry a geospatial network analysis to define the shortest routes for the hydrogen delivery from production sites to closest ports. Figure 6 illustrates the four closest ports along with the shortest roads trucks can take to deliver the liquid hydrogen, where two plants can deliver its production to Khalifa port, two to Jebel Ali port, one to port Rashid, and one to the Fujairah port. The distances calculated are to be used for feasibility studies in the future. Table 6 shows the estimated amounts of liquid hydrogen reaching each port in this pathway.

3.4. Hydrogen Plants at Port Sites Pathway

GIS’s network analysis is used in this pathway to define the shortest distances of the UAE’s electrical grid to deliver the surplus electricity from solar plants to port sites. In Figure 7 we can see the GIS results, where only port Khalifa and Fujairah are chosen as the closest ports for electricity transmission, with five solar plants transmitting electricity to the Khalifa port while only one solar plant is close enough to use the electrical grid to deliver its electricity to Fujairah port.
The sum of distances traveled in the electrical grid is 1031.24 km, which translates to a 3.1% loss of total transmitted energy. The remaining energy is used to desalinate water, provide the necessary energy for heating the water to needed levels before entering the HTE solid oxide electrolyzer and then produce hydrogen at the two chosen ports; the electricity consumption for desalinating the water needed for one kg of H2 from Equation (2) is 1.8 kWh, which is added to the electrolyzer’s consumption along with external steam supply and liquification electricity needs. Table 7 displays the numbers for the amounts of hydrogen produced in this pathway for the 25 km energy supply scenario.
In Figure 8, we compare these results to shows the differences between the amounts of produced H2 from PV and CSP technologies. The hydrogen levels produced by CSP fall slightly behind those of PV due to the extra energy expenses for providing high-temperature steam to ports in this pathway. The estimated amounts of hydrogen to be produced at each port in this pathway is explained in Table 8.

3.5. Pathways Comparison

Here, we compare hydrogen produced for the 25 km energy scenario to have a better understanding of the results, as shown in Figure 9. The second pathway shows lower levels of H2 at port sites, as the losses in the electrical grid added to desalination and external heater energy expenses leave less available electricity for hydrogen production than the solar plant sites pathway.

3.6. Proposed Shortest Routes

The current infrastructure of both road and electrical grids of the UAE is not ideal for some of the suggested solar plant sites. A few new routes are proposed in both location pathways to cut down the distance of hydrogen delivery for the first pathway, and electricity transmission losses in the second one. In Figure 10, three new routes are built with GIS to bring the distances of plants 4, 5, and 6 closer to ports. Figure 11 shows four suggested electrical transmission lines: the first connects the second plant to the geographically closest port, which is Dubai’s Jebel Ali, and three other lines for plants 4, 5 and 6 to port Khalifa.
The new proposed routes for the first pathway will shorten the accumulated distances between all solar plants and ports from 926 km to 781 km. This will reduce time consumed for delivery and the number of trucks used to transport the hydrogen. Table 9 displays the quantities of H2 to reach UAE’s ports after using the proposed new roads in the first pathway.
As for the proposed transmission lines, the shorter traveled distance from 1031.240 km to 773.76 km will reduce the electricity loss in the grid to 2.3% based on a presumed 3% loss for every 1000 km, thus leaving more surplus electricity for hydrogen production at port sites.
Figure 12 shows the increases in hydrogen production if the proposed new electrical grid line is applied compared to the current electrical grid of the UAE, while Table 10 lists the new amounts of liquid hydrogen to be produced at each port in this pathway.
The proposed new roads and transmission lines aim to provide a clearer image on which hydrogen production scenario is better for the case of the UAE. However, from a technical point of view, the amount of produced hydrogen is the main parameter. Figure 13 compares the amounts of liquid H2 produced in each location pathway with the new proposed routes for the 25 km energy scenario. While the new roads do not provide any change in the amounts of hydrogen produced, the shorter transmission lines lead to an increase of hydrogen production at the ports, as explained in the previous section.
The suggested transmission lines close the gap between the amounts of hydrogen produced in each location scenario, separately around 0.1 megatons of hydrogen, while the SOEC electrolyzer still manages to provide higher levels of liquid H2 when coupled to the CSP plants in the first pathway.

4. Conclusions

In this study we develop a model to evaluate solar power’s potential for hydrogen production in the United Arab Emirates. We compare hydrogen output from PV and CSP technologies using solid oxide electric cell water electrolyzer technology, and then investigate the UAE’s infrastructure for a H2 supply chain from well to ship in two different pathways depending on the location of the electrolyzers by estimating the shortest routes using Geographical Information System (GIS), while highlighting the constraints in the UAE’s infrastructure and then proposing solutions for these limitations. Produced hydrogen is to be exported as a means of profit to make the investment in large-scale solar energy application in the UAE feasible and set the UAE to become a main green hydrogen exporter in the future.
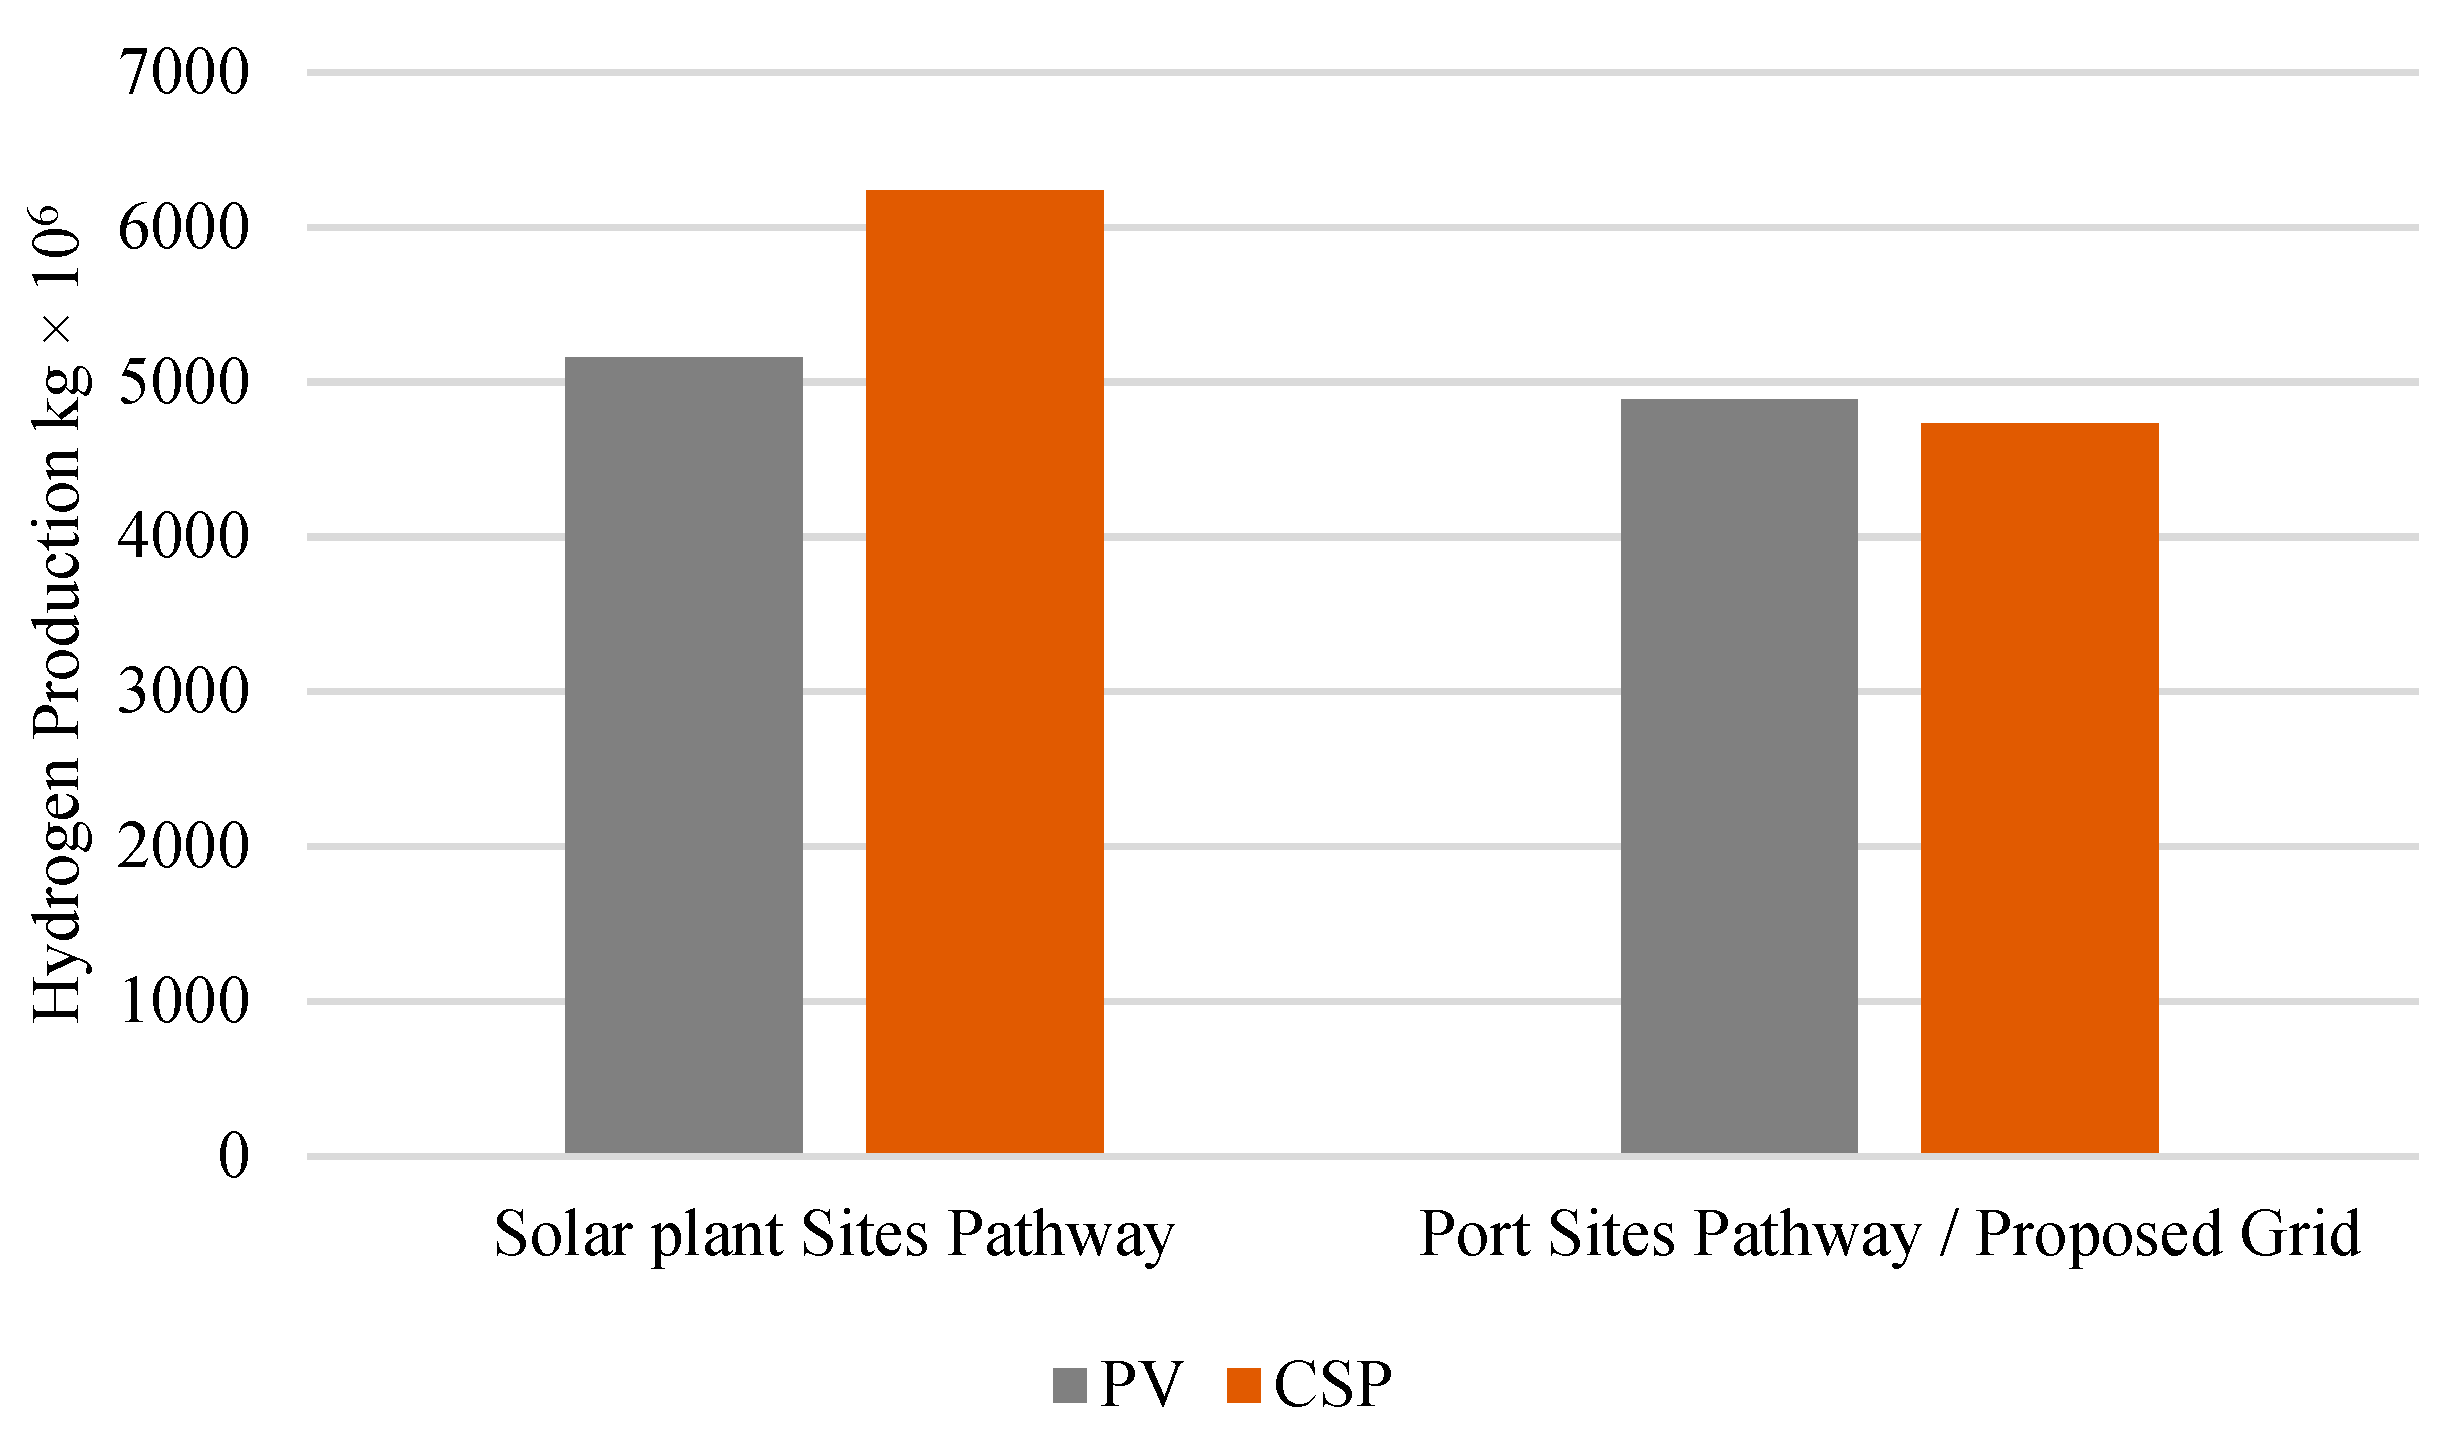
We have found that the integration of concentrated solar power plants coupled with SOEC electrolyzers for hydrogen production at solar plant sites is the most favorable way to utilize areas suitable for solar energy application in the UAE for large-scale solar hydrogen production. Although PV technology shows an advantage in energy potential, with 42 GWh/km2 compared to 41.1 GWh/km2 for CSP, the production of hydrogen from SOEC coupled to CSP plants at the same sites brings about over 1.1 extra megatons of liquid hydrogen to those produced from PV in the same pathway. The second pathway, with electrolyzers positioned at port sites, shows lower levels of hydrogen from both PV and CSP technologies due to the electricity lost in the UAE’s electrical grid and the extra energy demands for water heating.
The results from the two delivery paths also show that four ports can be used for export after delivering the liquid hydrogen by trucks from various solar plants in the first one, providing more flexibility to delivery options. In the second pathway, only the Khalifa and Fujairah ports are chosen as the efficient options for electricity transmission and hydrogen production sites.
The proposed shorter routes made the gap of hydrogen produced in both pathways smaller, to around 0.1 megatons of hydrogen. In addition, a third port is added as a suitable option for hydrogen production in the electrolyzers-at-ports scenario. Even with addressing the UAE’s infrastructure constraints, the first pathway is still more favorable when it comes to hydrogen generation, while the second pathway addresses the water shortage issue of the UAE and results in hydrogen production levels comparable to those in the first pathway.
A future cost analysis to estimate the levelized cost of energy and hydrogen in each scenario and pathway, along with a life cycle assessment of the environmental impacts, is needed to provide a wider perspective on which pathway and technology is a better fit for the UAE and assures higher hydrogen export profits and the lowest harmful emissions.

Author Contributions

Conceptualization, A.J. and K.O.; methodology, A.J.; software, A.J.; validation, A.J., Y.A. and K.O.; formal analysis, A.J.; investigation, A.J.; resources, A.J.; data curation, A.J.; writing—original draft preparation, A.J.; writing—review and editing, A.J.; visualization, A.J.; supervision, Y.A. and K.O.; project administration, A.J. and K.O.; funding acquisition, K.O. All authors have read and agreed to the published version of the manuscript.

Funding

This research was supported by JSPS Grant-in-Aid for Scientific Research 20H02677.

Informed Consent Statement

Not applicable.

Data Availability Statement

Not applicable.

Acknowledgments

The first author acknowledges funding support from the Japanese government, Ministry of Education, Culture, Sports, Science and Technology, under their international program (MEXT) scholarship.

Conflicts of Interest

The authors declare no conflict of interest.

References

  1. El-Katiri, L. A Roadmap for Renewable Energy in the Middle East and North Africa; Oxford Institute for Energy Studies: Oxford, UK, 2014; ISBN 9781907555909. Available online: https://a9w7k6q9.stackpathcdn.com/wpcms/wp-content/uploads/2014/01/MEP-6.pdf (accessed on 15 June 2019).
  2. Alnaser, W.E.; Alnaser, N.W. The Status of Renewable Energy in the GCC Countries. Renew. Sustain. Energy Rev. 2011, 15, 3074–3098. [Google Scholar] [CrossRef]
  3. Griffiths, S. A Review and Assessment of Energy Policy in the Middle East and North Africa Region. Energy Policy 2017, 102, 249–269. [Google Scholar] [CrossRef]
  4. Bhutto, A.W.; Bazmi, A.A.; Zahedi, G.; Klemeš, J.J. A Review of Progress in Renewable Energy Implementation in the Gulf Cooperation Council Countries. J. Clean. Prod. 2014, 71, 168–180. [Google Scholar] [CrossRef]
  5. IRENA. Renwable Energy Market Analysis: The GCC Region; International Renewable Energy Agency: Abu Dhabi, United Arab Emirates, 2016. [Google Scholar]
  6. IRENA. Renewable Energy Market Analysis: GCC 2019; International Renewable Energy Agency: Abu Dhabi, United Arab Emirates, 2019. [Google Scholar]
  7. Nematollahi, O.; Hoghooghi, H.; Rasti, M.; Sedaghat, A. Energy Demands and Renewable Energy Resources in the Middle East. Renew. Sustain. Energy Rev. 2016, 54, 1172–1181. [Google Scholar] [CrossRef]
  8. Bouhal, T.; Agrouaz, Y.; Kousksou, T.; Allouhi, A.; el Rhafiki, T.; Jamil, A.; Bakkas, M. Technical Feasibility of a Sustainable Concentrated Solar Power in Morocco through an Energy Analysis. Renew. Sustain. Energy Rev. 2018, 81, 1087–1095. [Google Scholar] [CrossRef]
  9. Reuß, M.; Grube, T.; Robinius, M.; Stolten, D. A Hydrogen Supply Chain with Spatial Resolution: Comparative Analysis of Infrastructure Technologies in Germany. Appl. Energy 2019, 247, 438–453. [Google Scholar] [CrossRef]
  10. Marchenko, O.V.; Solomin, S.V. The Future Energy: Hydrogen versus Electricity. Int. J. Hydrog. Energy 2015, 40, 3801–3805. [Google Scholar] [CrossRef]
  11. Loisel, R.; Baranger, L.; Chemouri, N.; Spinu, S.; Pardo, S. Economic Evaluation of Hybrid Off-Shore Wind Power and Hydrogen Storage System. Int. J. Hydrog. Energy 2015, 40, 6727–6739. [Google Scholar] [CrossRef]
  12. Franco, B.A.; Baptista, P.; Neto, R.C.; Ganilha, S. Assessment of Offloading Pathways for Wind-Powered Offshore Hydrogen Production: Energy and Economic Analysis. Appl. Energy 2021, 286, 116553. [Google Scholar] [CrossRef]
  13. IEA. World Energy Outlook 2020; International Energy Agency: Paris, France, 2020; Available online: https://www.iea.org/reports/world-energy-outlook-2020 (accessed on 16 May 2020).
  14. Behling, N.; Williams, M.C.; Managi, S. Fuel Cells and the Hydrogen Revolution: Analysis of a Strategic Plan in Japan. Econ. Anal. Policy 2015, 48, 204–221. [Google Scholar] [CrossRef]
  15. Kamiya, S.; Nishimura, M.; Harada, E. Study on Introduction of CO2 Free Energy to Japan with Liquid Hydrogen. Phys. Procedia 2015, 67, 11–19. [Google Scholar] [CrossRef] [Green Version]
  16. Nagashima, M. Japan’s Hydrogen Strategy and Its Economic and Geopolitical Implications; IFRI: Paris, France, 2018; ISBN 9782365679183. [Google Scholar]
  17. Kim, A.; Kim, H.; Lee, H.; Lee, B.; Lim, H. Comparative Economic Optimization for an Overseas Hydrogen Supply Chain Using Mixed-Integer Linear Programming. ACS Sustain. Chem. Eng. 2021, 9, 42. [Google Scholar] [CrossRef]
  18. Basic Hydrogen Strategy Determined (METI). Available online: https://www.meti.go.jp/english/press/2017/1226_003.html (accessed on 28 April 2022).
  19. IEA. Global Hydrogen Review 2021; International Energy Agency: Paris, France, 2021; Available online: https://www.iea.org/reports/global-hydrogen-review-2021 (accessed on 15 November 2021).
  20. Rosenstiel, A.; Monnerie, N.; Dersch, J.; Roeb, M.; Pitz-Paal, R.; Sattler, C. Electrochemical Hydrogen Production Powered by PV/CSP Hybrid Power Plants: A Modelling Approach for Cost Optimal System Design. Energies 2021, 14, 3437. [Google Scholar] [CrossRef]
  21. Kazim, A.; Veziroglu, T.N. Utilization of Solar–Hydrogen Energy in the UAE to Maintain Its Share in the World Energy Market for the 21st Century. Renew. Energy 2001, 24, 259–274. [Google Scholar] [CrossRef]
  22. Orhan, M.F.; Kahraman, H.; Babu, B.S. Approaches for Integrated Hydrogen Production Based on Nuclear and Renewable Energy Sources: Energy and Exergy Assessments of Nuclear and Solar Energy Sources in the United Arab Emirates. Int. J. Hydrog. Energy 2017, 42, 2601–2616. [Google Scholar] [CrossRef]
  23. Kazim, A. Strategy for a Sustainable Development in the UAE through Hydrogen Energy. Renew. Energy 2010, 35, 2257–2269. [Google Scholar] [CrossRef]
  24. Joubi, A.; Okajima, K. Development of an Energy Potential Estimation Model for Concentrated Solar Plants Penetration in the GCC Region. Int. J. Smart Grid Clean Energy 2020, 9, 1000–1010. [Google Scholar] [CrossRef]
  25. Lopez, A.; Roberts, B.; Heimiller, D.; Blair, N.; Porro, G. U.S. Renewable Energy Technical Potentials. A GIS-Based Analysis; U.S. Department of Energy: Golden, CO, USA, 2012. [CrossRef] [Green Version]
  26. APICORP. APICORP’s MENA Annual Energy Investment Outlook 2019–2023; Arab Petroluem Investments Corporation: Dammam, Saudi Arabia, 2019; Available online: https://www.apicorp.org/media-centre/publications/?page_num=2&category_type=&date_year= (accessed on 1 March 2020).
  27. Murphy, C.; Sun, Y.; Cole, W.; Maclaurin, G.; Turchi, C.; Mehos, M. The Potential Role of Concentrating Solar Power within the Context of DOE’s 2030 Solar Cost Targets; U.S. Department of Energy: Golden, CO, USA, 2019.
  28. Tran, J.; Grue, N.; Cox, S. Renewable Energy Data Explorer User Guide; U.S. Department of Energy: Golden, CO, USA, 2018.
  29. Al Ali, M.; Emziane, M. Performance Analysis of Rooftop PV Systems in Abu Dhabi. Energy Procedia 2013, 42, 689–697. [Google Scholar] [CrossRef] [Green Version]
  30. Strachan, N.; Balta-Ozkan, N.; Joffe, D.; McGeevor, K.; Hughes, N. Soft-Linking Energy Systems and GIS Models to Investigate Spatial Hydrogen Infrastructure Development in a Low-Carbon UK Energy System. Int. J. Hydrog. Energy 2009, 34, 642–657. [Google Scholar] [CrossRef]
  31. Balta-Ozkan, N.; Baldwin, E. Spatial Development of Hydrogen Economy in a Low-Carbon UK Energy System. Int. J. Hydrog. Energy 2013, 38, 1209–1224. [Google Scholar] [CrossRef]
  32. Reuß, M.; Grube, T.; Robinius, M.; Preuster, P.; Wasserscheid, P.; Stolten, D. Seasonal Storage and Alternative Carriers: A Flexible Hydrogen Supply Chain Model. Appl. Energy 2017, 200, 290–302. [Google Scholar] [CrossRef]
  33. Tlili, O.; Mansilla, C.; Linβen, J.; Reuß, M.; Grube, T.; Robinius, M.; André, J.; Perez, Y.; le Duigou, A.; Stolten, D. Geospatial Modelling of the Hydrogen Infrastructure in France in Order to Identify the Most Suited Supply Chains. Int. J. Hydrog. Energy 2020, 45, 3053–3072. [Google Scholar] [CrossRef]
  34. Seaports—The Official Portal of the UAE Government. Available online: https://u.ae/en/information-and-services/infrastructure/civic-facilities/seaports (accessed on 28 April 2022).
  35. GEOFABRIK. OpenStreetMap. Available online: https://www.geofabrik.de/geofabrik/openstreetmap.html (accessed on 28 April 2022).
  36. IEA ETSAP. Electricity Transmission and Distribution; International Energy Agency Energy Technology Systems Analysis Programme. 2014. Available online: https://iea-etsap.org/E-TechDS/PDF/E12_el-t&d_KV_Apr2014_GSOK.pdf (accessed on 7 October 2021).
  37. Taibi, E.; Miranda, R.; Vanhoudt, W.; Winkel, T.; Lanoix, J.-C.; Barth, F. Hydrogen from Renewable Power: Technology Outlook for the Energy Transition; IRENA: Abu Dhabi, United Arab Emirates, 2018; ISBN 978-92-9260-077-8. [Google Scholar]
  38. Houaijia, A.; Roeb, M.; Monnerie, N.; Sattler, C. Solar Power Tower as Heat and Electricity Source for a Solid Oxide Electrolyzer: A Case Study. Int. J. Energy Res. 2015, 39, 1120–1130. [Google Scholar] [CrossRef]
  39. IEA. Technology Roadmap Hydrogen and Fuel Cells Technical Annex; International Energy Agency: Paris, France, 2018; Available online: https://www.iea.org/reports/technology-roadmap-hydrogen-and-fuel-cells (accessed on 30 April 2020).
  40. Sanz-Bermejo, J.; Muñoz-Antón, J.; Gonzalez-Aguilar, J.; Romero, M. Optimal Integration of a Solid-Oxide Electrolyser Cell into a Direct Steam Generation Solar Tower Plant for Zero-Emission Hydrogen Production. Appl. Energy 2014, 131, 238–247. [Google Scholar] [CrossRef]
  41. Hinkley, J.; Hayward, J.; Mcnaughton, R.; Gillespie, R.; Watt, M.; Lovegrove, K.; Matsumoto, A. Cost Assessment of Hydrogen Production from PV and Electrolysis; CSIRO: Newcastle, Australia, 2016. [Google Scholar]
  42. Meier, K. Hydrogen Production with Sea Water Electrolysis Using Norwegian Offshore Wind Energy Potentials: Techno-Economic Assessment for an Offshore-Based Hydrogen Production Approach with State-of-the-Art Technology. Int. J. Energy Environ. Eng. 2014, 5, 104. [Google Scholar] [CrossRef] [Green Version]
  43. Monnerie, N.; von Storch, H.; Houaijia, A.; Roeb, M.; Sattler, C. Hydrogen Production by Coupling Pressurized High Temperature Electrolyser with Solar Tower Technology. Int. J. Hydrog. Energy 2017, 42, 13498–13509. [Google Scholar] [CrossRef] [Green Version]
Figure 1. Areas with high solar potential in the UAE (a) 25 km and (b) 40 km from roads, electrical grid, and water areas.
Energies 15 04000 g001
Figure 2. Study flow chart.
Energies 15 04000 g002
Figure 3. Pathways’ layout.
Energies 15 04000 g003
Figure 4. Comparison of the energy potential of PV and CSP in the UAE in the 25 km scenario.
Energies 15 04000 g004
Figure 5. Hydrogen levels produced from PV and CSP comparison, in plants at the same location as solar energy sites pathway.
Energies 15 04000 g005
Figure 6. First pathway GIS analysis results for closest ports and shortest routes.
Energies 15 04000 g006
Figure 7. Second pathway GIS analysis results for closest ports and shortest electrical grid routes for electricity transmission from solar plants to port sites.
Energies 15 04000 g007
Figure 8. Comparison of hydrogen production in all technologies for 25 km energy scenario, in plants at port sites pathway.
Energies 15 04000 g008
Figure 9. Hydrogen produced for all location scenarios in the 25 km scenario.
Energies 15 04000 g009
Figure 10. Proposed shortest routes from hydrogen plants to export ports analysis with GIS.
Energies 15 04000 g010
Figure 11. Proposed shortest electrical grid routes from hydrogen plants to export ports.
Energies 15 04000 g011
Figure 12. Comparison between the produced H2 from the current and proposed electrical grid from PV and CSP.
Energies 15 04000 g012
Figure 13. Comparison between the amounts of produced H2 in the two location pathways with new proposed routes.
Energies 15 04000 g013
Table 1. UAE’s results for solar energy applicable areas for 25 km and 40 km scenarios.
Scenario25 km40 km
Area km210,18016,207
Table 3. UAE’s results for CSP energy potential and excess energy in GWh/km2.
ScenarioEnergy PotentialExcess Energy
25 km41.11528.3
Table 4. UAE’s results for PV energy potential and excess energy in GWh.
ScenarioEnergy Potential Excess Energy
25 km42.04829.223
Table 5. Produced H2 in the first pathway from PV and CSP in (kg × 106).
Energy ScenarioPV CSP
25 km5157.4126236.081
Table 6. Amount of H2 reaching each port in the first pathway from PV and CSP in (kg × 106).
Port NamePV CSP
Khalifa1719.1372078.7
Jebel Ali1719.1372078.7
Port Rashid859.5681039.346
Fujairah859.5681039.346
Table 7. Produced H2 in the second pathway from PV and CSP in (kg × 106).
Energy ScenarioPV CSP
25 km4846.2964691.573
Table 8. Amount of H2 produced at each port in the second pathway from PV and CSP in (kg × 106).
Port NamePV CSP
Khalifa4038.583909.644
Fujairah807.716781.928
Table 9. Amount of H2 reaching each port using the proposed shortest routes in the first pathway from PV and CSP in (kg × 106).
Port NamePV CSP
Khalifa2578.7063118.04
Jebel Ali859.5681039.347
Port Rashid859.5681039.346
Fujairah859.5681039.346
Table 10. Amount of H2 produced at each port using the proposed shortest electric grid in the second pathway from PV and CSP in (kg × 106).
Port NamePV CSP
Khalifa4071.0463941.075
Jebel Ali814.21788.215
Fujairah814.21788.215
Publisher’s Note: MDPI stays neutral with regard to jurisdictional claims in published maps and institutional affiliations.

