Article

Three-Dimensional Direct Numerical Simulation of Near-Field Ozone-Enhanced Lean Premixed Syngas Turbulent Jet Flame

1
College of Energy Engineering, Zhejiang University, Hangzhou 310027, China
2
Zhejiang Energy R&D Institute Co., Ltd., Hangzhou 311121, China
3
Aircraft and Propulsion Laboratory, Ningbo Institute of Technology, Beihang University, Ningbo 100190, China
*
Authors to whom correspondence should be addressed.
Energies 2022, 15(11), 3945; https://doi.org/10.3390/en15113945
Submission received: 19 April 2022 / Revised: 5 May 2022 / Accepted: 14 May 2022 / Published: 26 May 2022
(This article belongs to the Special Issue Experiments and Simulations of Combustion Process)

Abstract

:
Due to its enhancement in the flame speed, ozone added in lean premixed syngas turbulent jet flame was investigated by the three-dimensional direct numerical simulation method in the near field of the flame. In the present study, numerical simulations were conducted in the lean premixed syngas turbulent jet flame configuration to explore the effects of ozone addition on freely-propagating turbulent flames. It was seen that turbulence began to significantly affect the flame surface to produce wrinkles in lean premixed gas flame with ozone added after 4D; ozone started to affect the composition field and temperature field after 8D; it accelerated the generation of intermediate products, OH and O radicals; and it will promote the production of CO2 in the near field range. Ozone will increase the flame surface area of the lean premixed syngas flame during the ignition period and can promote the ignition process and make the combustion occur earlier. The flame surface of the case with ozone added is more easily stretched by turbulence, and ozone can improve the stability of combustion. Ozone does not affect the effective radius of the flame curvature but will broaden the distribution of the curvature term because of the enhancement effect on the displacement speed of the flame surface.

1. Introduction

Coal is an important primary energy source in China, but the use of coal will cause significant environmental pollution. China has put forward the goal of striving for a carbon peak by 2030 and a goal of achieving carbon neutrality by 2060; the use of coal will usher in a transitional period. The gasification of coal to obtain secondary products before use is a form of coal utilization, and its main effective components are CO and H2. From the direct utilization of coal to the use of syngas, it can greatly reduce pollutants, emissions, and greenhouse gas emissions such as CO2. The study of the combustion characteristics of syngas will be a branch of achieving the dual carbon goal.
The strengthening of combustion is also one of the research directions. Ozone, as the long-lived component of active molecules, is used and studied by researchers as a means of strengthening combustion [1,2,3,4]. Ombrello [5] discussed the strengthening effect of ozone on the flame propagation in propane combustion in 2010. The study found that ozone had an effect on the fluid dynamics of the flame front to enhance the flame propagation speed, and they obtained that the zone mainly affects the methane combustion by producing O radicals. Wang et al. [6] used a heat flow furnace to measure the laminar flame velocity and combined the CHEMKIN calculation method to study the ozone strengthening mechanism in a methane/air premixed combustion. They proposed a 16-step elementary reaction ozone kinetic mechanism, and the calculated results of CHEMKIN were in good agreement with the experimental values. It is pointed out that the strengthening of ozone is reflected in the O radical generated by the decomposition of ozone in the preheating zone, which accelerates the chain reaction and increases the laminar flame speed. On this basis, Liu et al. [7] further reduced the mechanism reaction and proposed an 18-step, 22-species reduced global mechanism for ozone-enhanced CH 4 /air combustion processes. The calculation results were in good agreement with the results using the detailed mechanism. Ji et al. [8] used a constant volume burner to find that ozone can shorten the ignition delay time of methane lean premixed flame and accelerate its combustion speed. Wu et al. [9] studied the effect of ozone on the liftoff height of the ethane non-premixed jet flame. They found that increasing the triple-flame propagation speed will reduce the liftoff height. Increasing the axial jet velocity along the stoichiometric contour will increase the liftoff height. The interaction ultimately affects the value of the liftoff height.
Nowadays, the research on the ozone strengthening mechanism is still in the experimental and one-dimensional calculation; the simulation method of three-dimensional direct numerical simulation (DNS) can obtain detailed turbulence and chemical reaction interaction information [10,11], which can conduct more in-depth research on the strengthening mechanism [12,13,14,15]. DNS has also been applied to the combustion of syngas; Chi Cheng et al. [16] used the means of a DNS box to study the syngas combustion flame and found the physical quantity that can be used to characterize the heat release rate; the physical quantity, which is expressed as c H C O 1.5 × c O H 0.75 by the concentration of HCO and OH, can be measured by experimental methods. Roys et al. [17] used the 2D DNS box method to study the ignition characteristic parameters of syngas. The study found that for the larger RMS temperature fluctuation, the deflagration during ignition is the main source of the heat release rate, while the spontaneity during ignition is the main source of the heat release rate for the smaller RMS temperature fluctuation. Bhide et al. [18] used the DNS box method to study the influence of the Lewis number and turbulence in the lean premixed syngas flame on the heat release rate. The study found that the peak of the heat release rate moved to the zone of low temperature under high turbulence conditions, and highly diffusible hydrogen atoms play a decisive role in the heat release rate. The use of DNS in syngas flame is rarely reported in current research, and performing DNS on a three-dimensional full-scale flame can obtain a more realistic flame structure, which is more helpful for understanding the interaction between combustion and turbulence in a real flame. In this paper, the DNS method was used to study the strengthening effect of ozone in the three-dimensional lean premixed syngas turbulent jet flame, which can more accurately capture the effect of ozone on the internal structure, composition, and statistics of the flame at the real scale. The strengthening mechanism at the three-dimensional scale is discussed to some extent.

2. Method and Definition

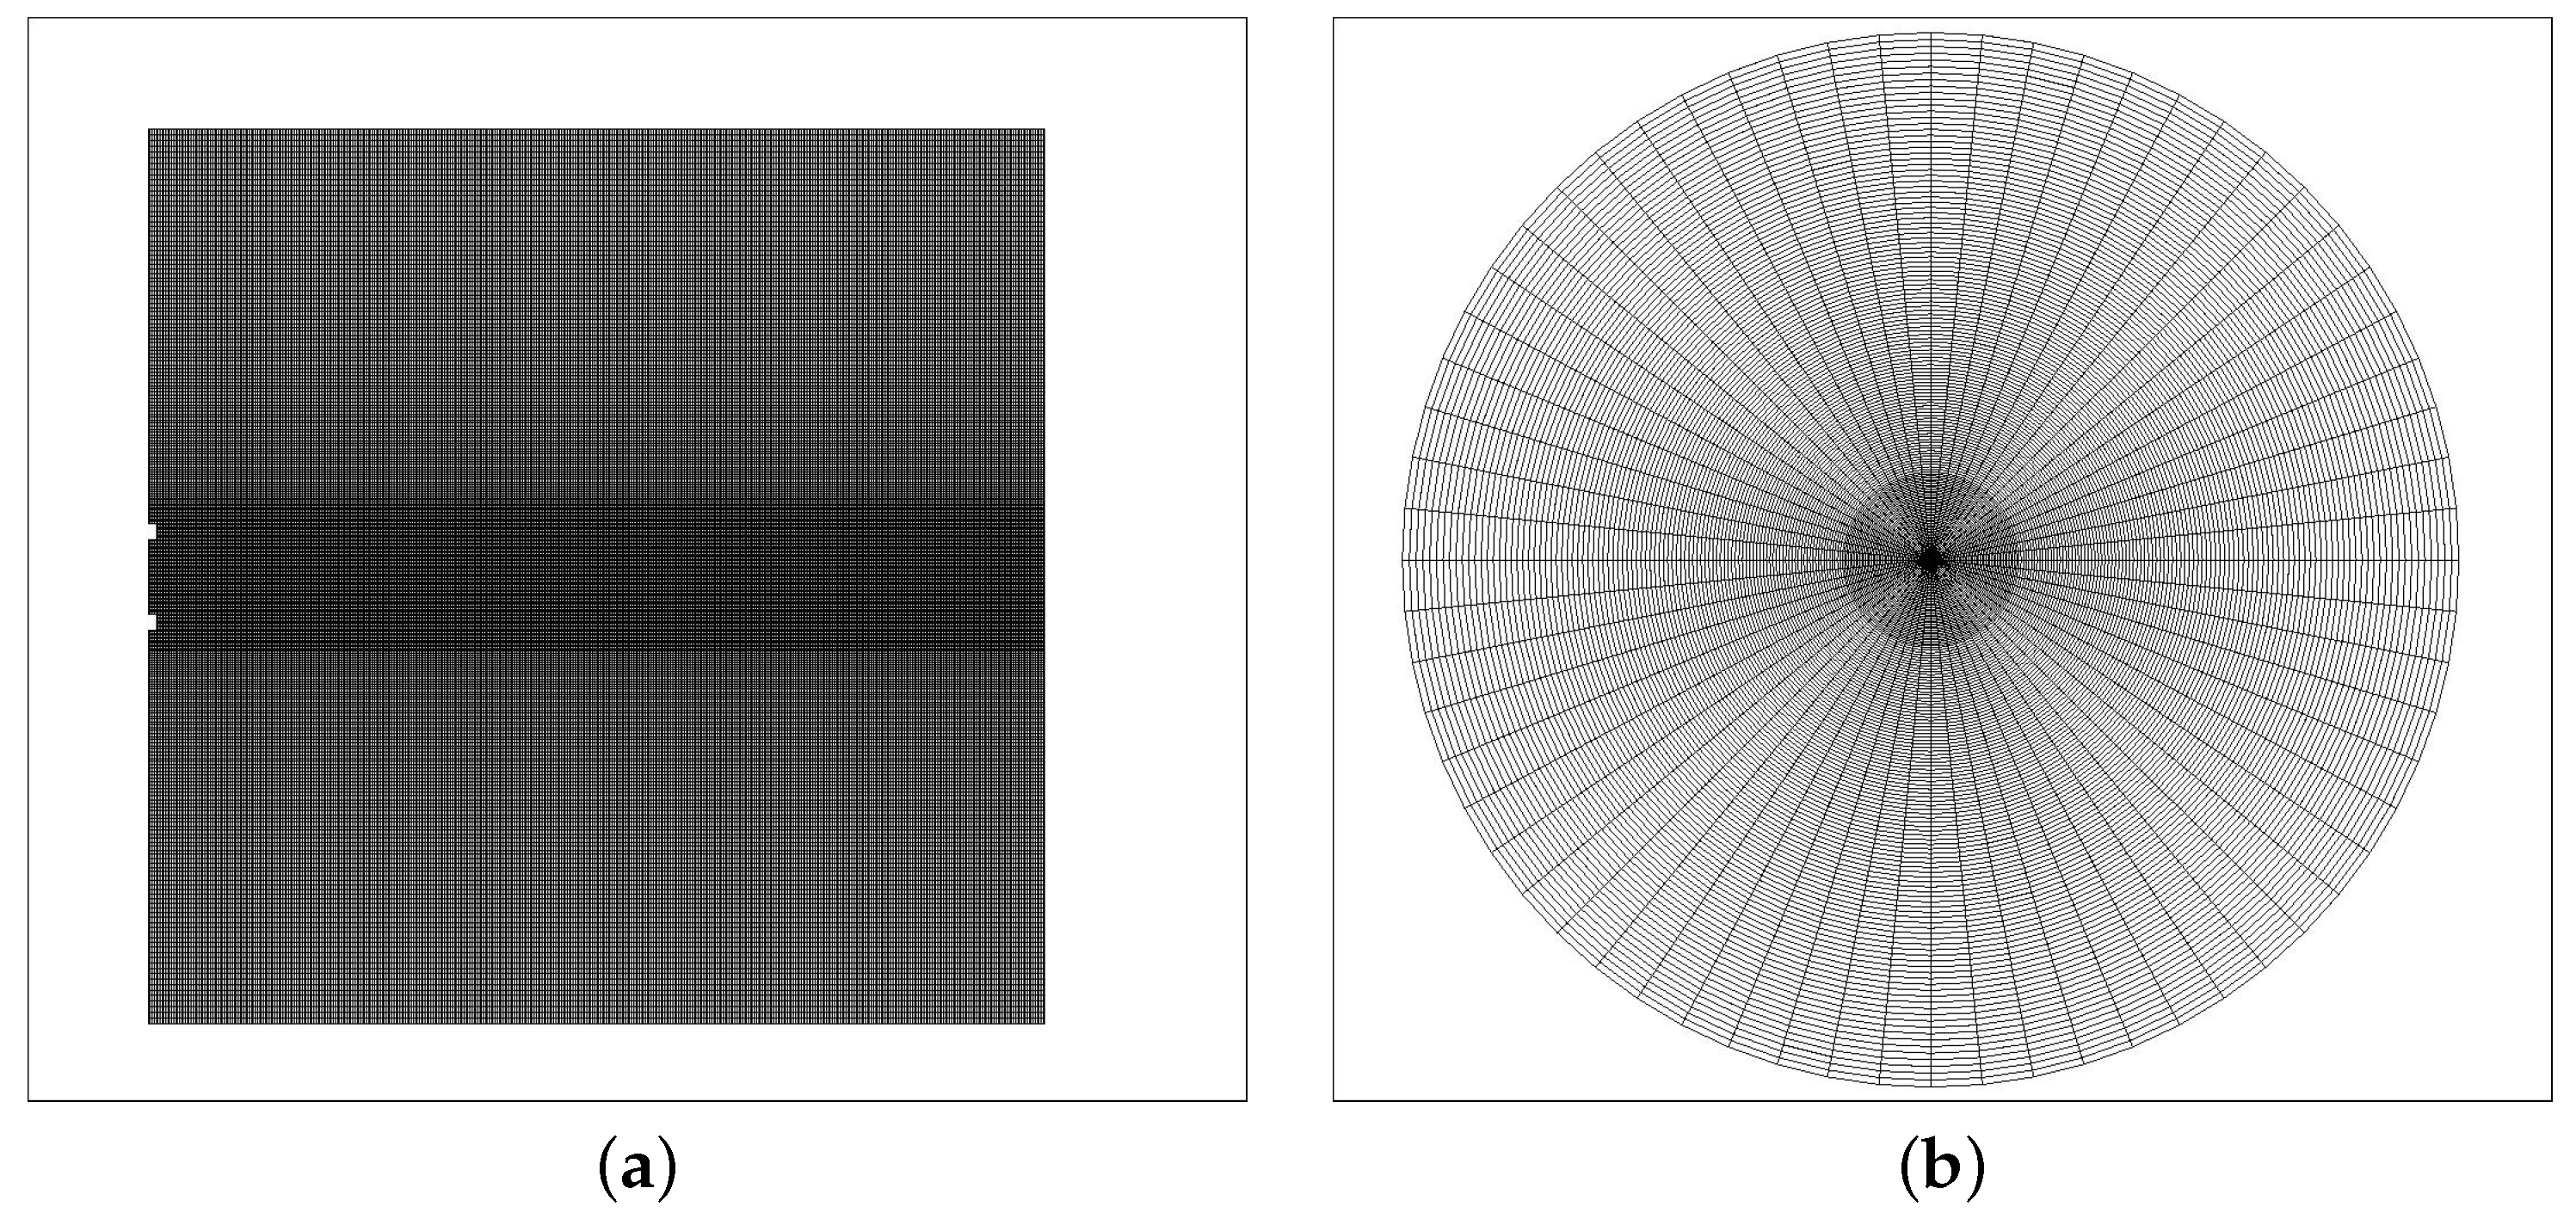
2.1. Numerical Method

The governing equations of mass, momentum, species, and energy and the equation of the state are simplified as below (in Cartesian coordinates); parameters involving acoustic interactions, compressibility, viscous dissipation heating, bulk viscosity, body forces (except gravity), and diffusion by pressure gradients were not implemented.
ρ t + ρ u = 0
ρ u t + ρ u u x = p + τ + ρ n = 1 N s Y n f n
ρ Y n t + ρ u Y n = ρ V n Y n + ρ ω n , n = 1 , 2 , 3 , , N s
ρ T t + ρ u T = 1 c p κ T 1 c p n = 1 N s ρ c p , n Y n V n T 1 c p n = 1 N s ρ h n ω n + q ˙
p 0 = ρ n = 1 N s Y n M n R T
The gas mixture density is represented by ρ (unit is kg·m 3 ); the fluid velocity vector is represented by u (unit is m·s−1); the fluid viscous vector is represented by τ (unit is kg·m 1 ·s 2 ); the unit gravity for component n is represented by f n (unit is m·s 2 ); the hydrodynamic pressure is represented by p (unit is Pa) (shown in Equations (2) and (3)); the net formation rate of species n is represented by ω n (unit is s 1 ); the mass fraction of component n is represented by Y n ; the number of species is represented by N s ; the species diffusion velocity is represented by V n (unit is m·s 1 ); and a simple formula proposed by Bird [19] was used to calculate the approximate mixture diffusivities. The thermal conductivity of the mixture is represented by κ in Equation (4) (unit is W·m 1 ·K 1 ); the temperature is represented by T (unit is K); the average specific heat capacity is represented by c p (unit is J·kg 1 ·K 1 ); the specific heat capacity of n is represented by c p , n (unit is J·kg 1 ·K 1 ); the specific enthalpy of n is represented by h n (J·kg 1 ); the radiation source term, which is calculated using the model proposed by Barlow [20], is represented by q ˙ (unit is kg·K·m 3 ·s 1 ). The thermodynamic pressure is represented by p 0 (unit is Pa), and the molar weight of n is represented by M n in Equation (5).
A staggered space–time method was used for improving the numerical stability. The equations were integrated by a semi-implicit method [21], and the discretization was conservative. The six-order central difference method shown in Equation (6) was used for spatial discretization. The six-order center interpolation method shown in Equation (7) was used for velocity interpolation. δ n ϕ δ n x is the finite difference operator; ϕ ¯ n x is the interpolation operator; n is the distance between the two points used for the difference divided by grid spacing. The WENO5 method [22] was used for scalar interpolation in order to ensure the stability of a staggered grid simulation. Each species’ Lewis number was defined in code. The DVODE solver [23] was used to implement the calculation of detailed chemical kinetics. The 38-step syngas chemical mechanism used was derived by Davis et al. [24], and the 16-step ozone chemical mechanism used was derived by Wang et al. [6].These two mechanisms can help the simulation to obtain accurate intermediate species without too much computational cost.
ϕ x 150 128 δ 1 ϕ δ 1 x 25 128 δ 3 ϕ δ 3 x + 3 128 δ 5 ϕ δ 5 x
ϕ 150 128 ϕ ¯ 1 x 25 128 ϕ ¯ 3 x + 3 128 ϕ ¯ 5 x

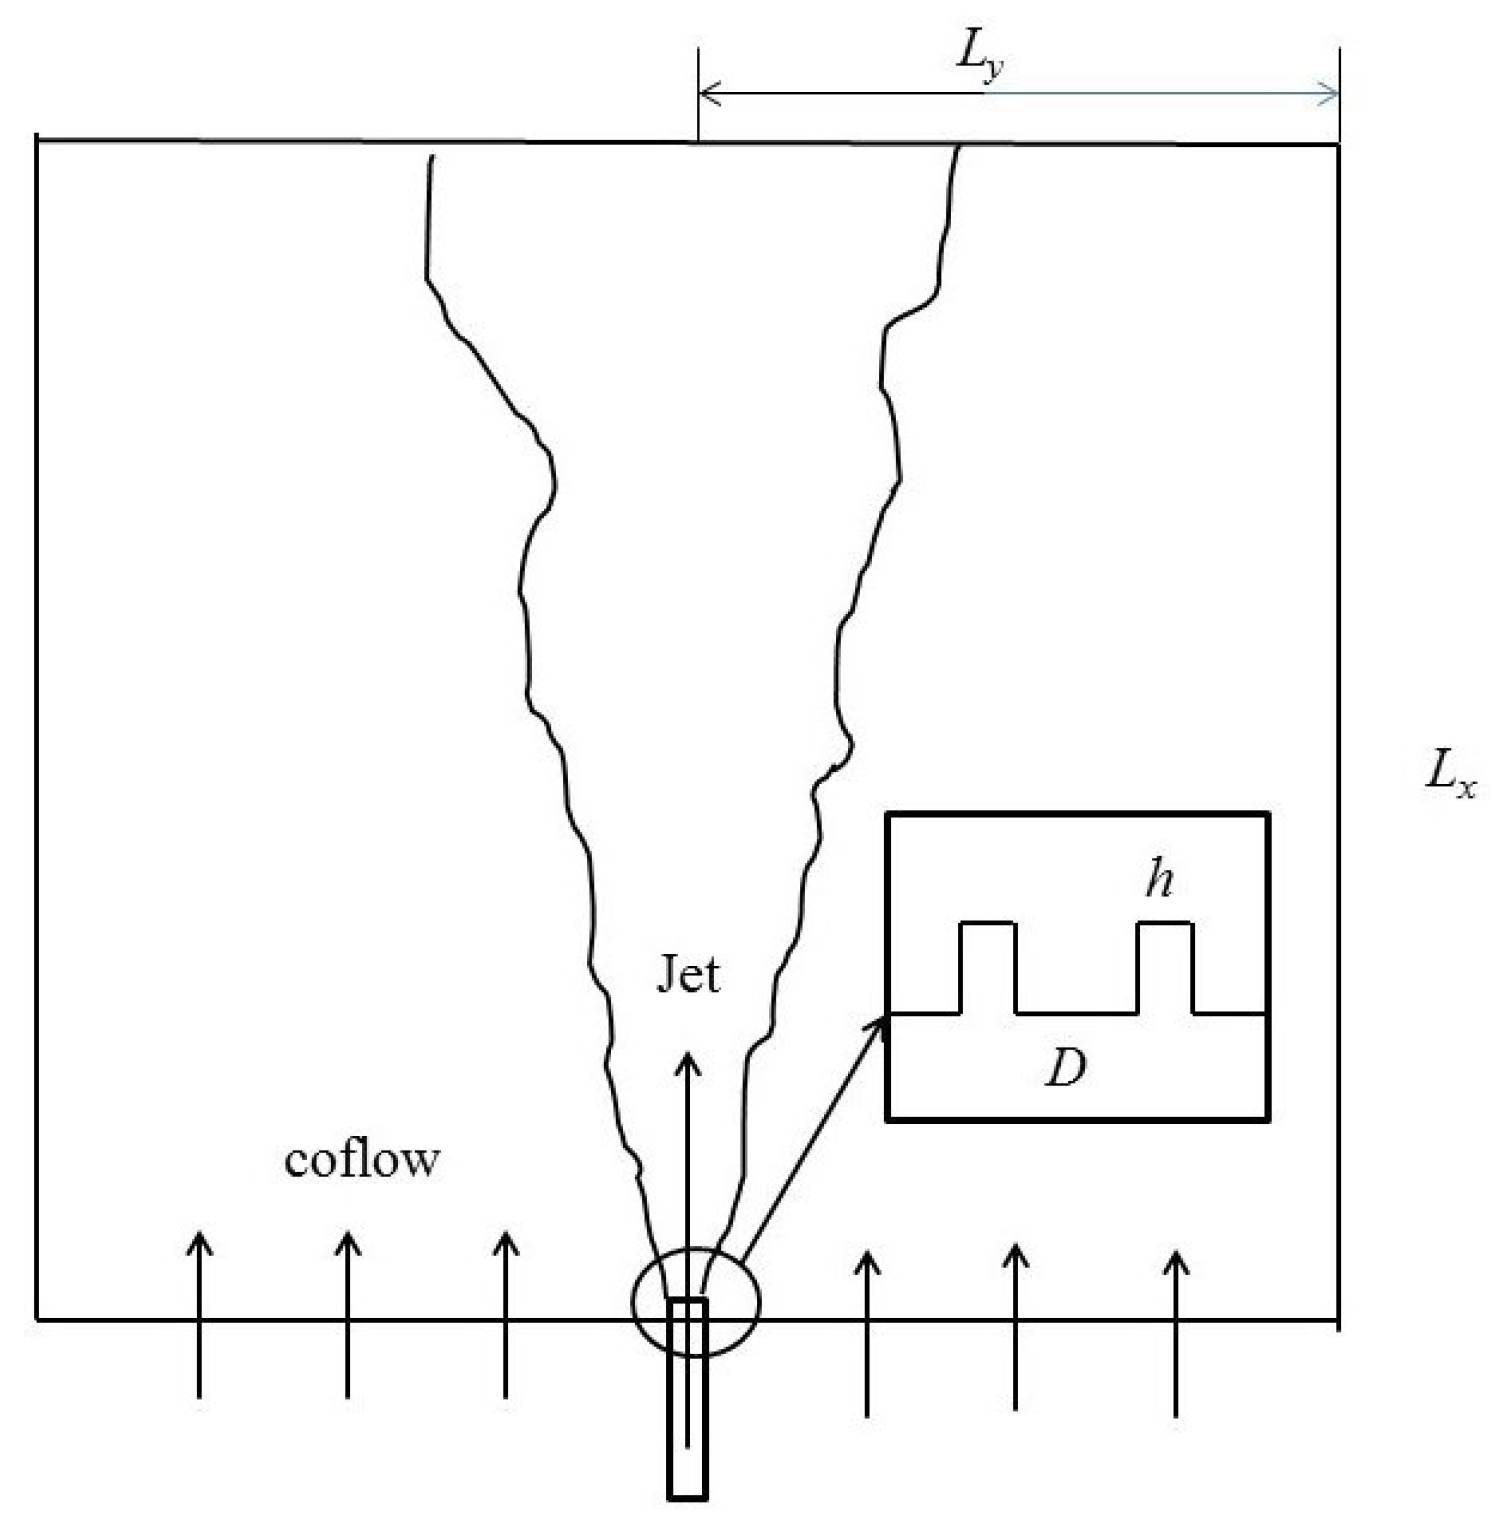
2.2. Case Definition

The premixed jet device used for the size setting of the center nozzle in the design conditions of this study comes from the water-cooled Mcknena burner, which was used for a turbulent premixed methane flame by Weng [25]. The Mcknena burner uses a mixture of methane/air to prevent its flame from being flown out by high turbulence and is ignited by an ignizer, but the ignition of the simulated premixed flame is generally realized by the coflow of high-temperature products, and the equivalent ratio of the premixed gas can be ensured by this treatment. Two cases were discussed in this article: one is the basic syngas premixed condition with an equivalent ratio of 0.7, and the jet velocity at the center nozzle was 40 m/s; the Reynolds number of the central jet was 4980; and the velocity of the coflow was set to 1% of the central jet velocity based on the principle that the coflow velocity cannot affect the central jet field, 0.4 m/s. The temperature of the central jet was set to 300 K, and the temperature of coflow was 1500 K because of its function of igniting the central jet. The second case was added with ozone; the ozone in the experiment was generated by the ozone generator using O 2 , which was in the oxidizer; the added 8500 ppm ozone in the second case was transformed from the O2 too; and the mixed gas was taken as the inlet component of the central jet. The specific parameters are listed in Table 1 in detail.
The setting of the calculation area is shown in Figure 1; the center jet nozzle parameters refer to the real nozzle; the nozzle diameter D was 2.3 mm; and the nozzle wall thickness h was 0.5 mm. The distance of the nozzle into the calculation area was controlled to four grids; the radial half-width L y was 6D, and the axis L x was 12D. The overall grid was generated using cylindrical coordinates, and the near field of the flame was simulated because of the high computing cost of the direct numerical simulation. The grid size of 0D∼1D remained 50 μm when dividing the grid in the radial direction, but the diffusion was not strong after 1D in the near field of the flame for the premixed flame, so the grid can be stretched appropriately. A stretch rate of 1.01 was used to stretch the grid in the interval from 1D to 6D. The grid size in the axial direction was maintained at 60 μm because the flame structure changes are more complicated in the near field. The number of grids along the angular direction was 128 so that the grid size near the pipe wall was about 50 μm. The grid size was less than twice the Kolmogorov scale of the cases [26], which meets the requirement of DNS. It can be known that the flame surface thickness of a syngas premixed flame with an equivalent ratio of 0.7 is 530 μm according to previous research [27]. The flame surface was analyzed by 10 grids using the settings of the grids above; so, it is believed that the changes in the flame surface can be captured accurately under this grid scale. The specific number of grids in the axial direction was 456; the number in the radial direction was 146; and the total number was about 8.52 million. The specific grid distribution is shown in Figure 2. The calculation time step was 2.5 × 10 7 s. The direction of gravity was the negative direction of X, and the magnitude was 9.87 m/s 2 . The initialization of the field was done using the parameters of coflow, and the calculation time was 17 ms; time-averaged statistics were performed after 10 ms. The total CPU hours spent was about 150,000.
The turbulence part of the calculation program was used by the author to study the influence of the equivalent ratio and the Reynolds number in the interaction between turbulence and the flame surface by using the DNS method [27]. Wan et al. used the LES method to study the pulverized-coal-pyrolysis and the release law of alkali metal in the turbulent flame [28,29]. Liu et al. verified the accuracy of the LES code under the low Mach number [30]. The calculation accuracy of the code’s chemical mechanism module was also verified in the author’s article on the interaction of turbulence and the flame surface [27]. The laminar speed simulated by the DNS code was in good agreement with the corresponding experiment data shown in Figure 2a of Ref. [27].

3. Results and Discussion

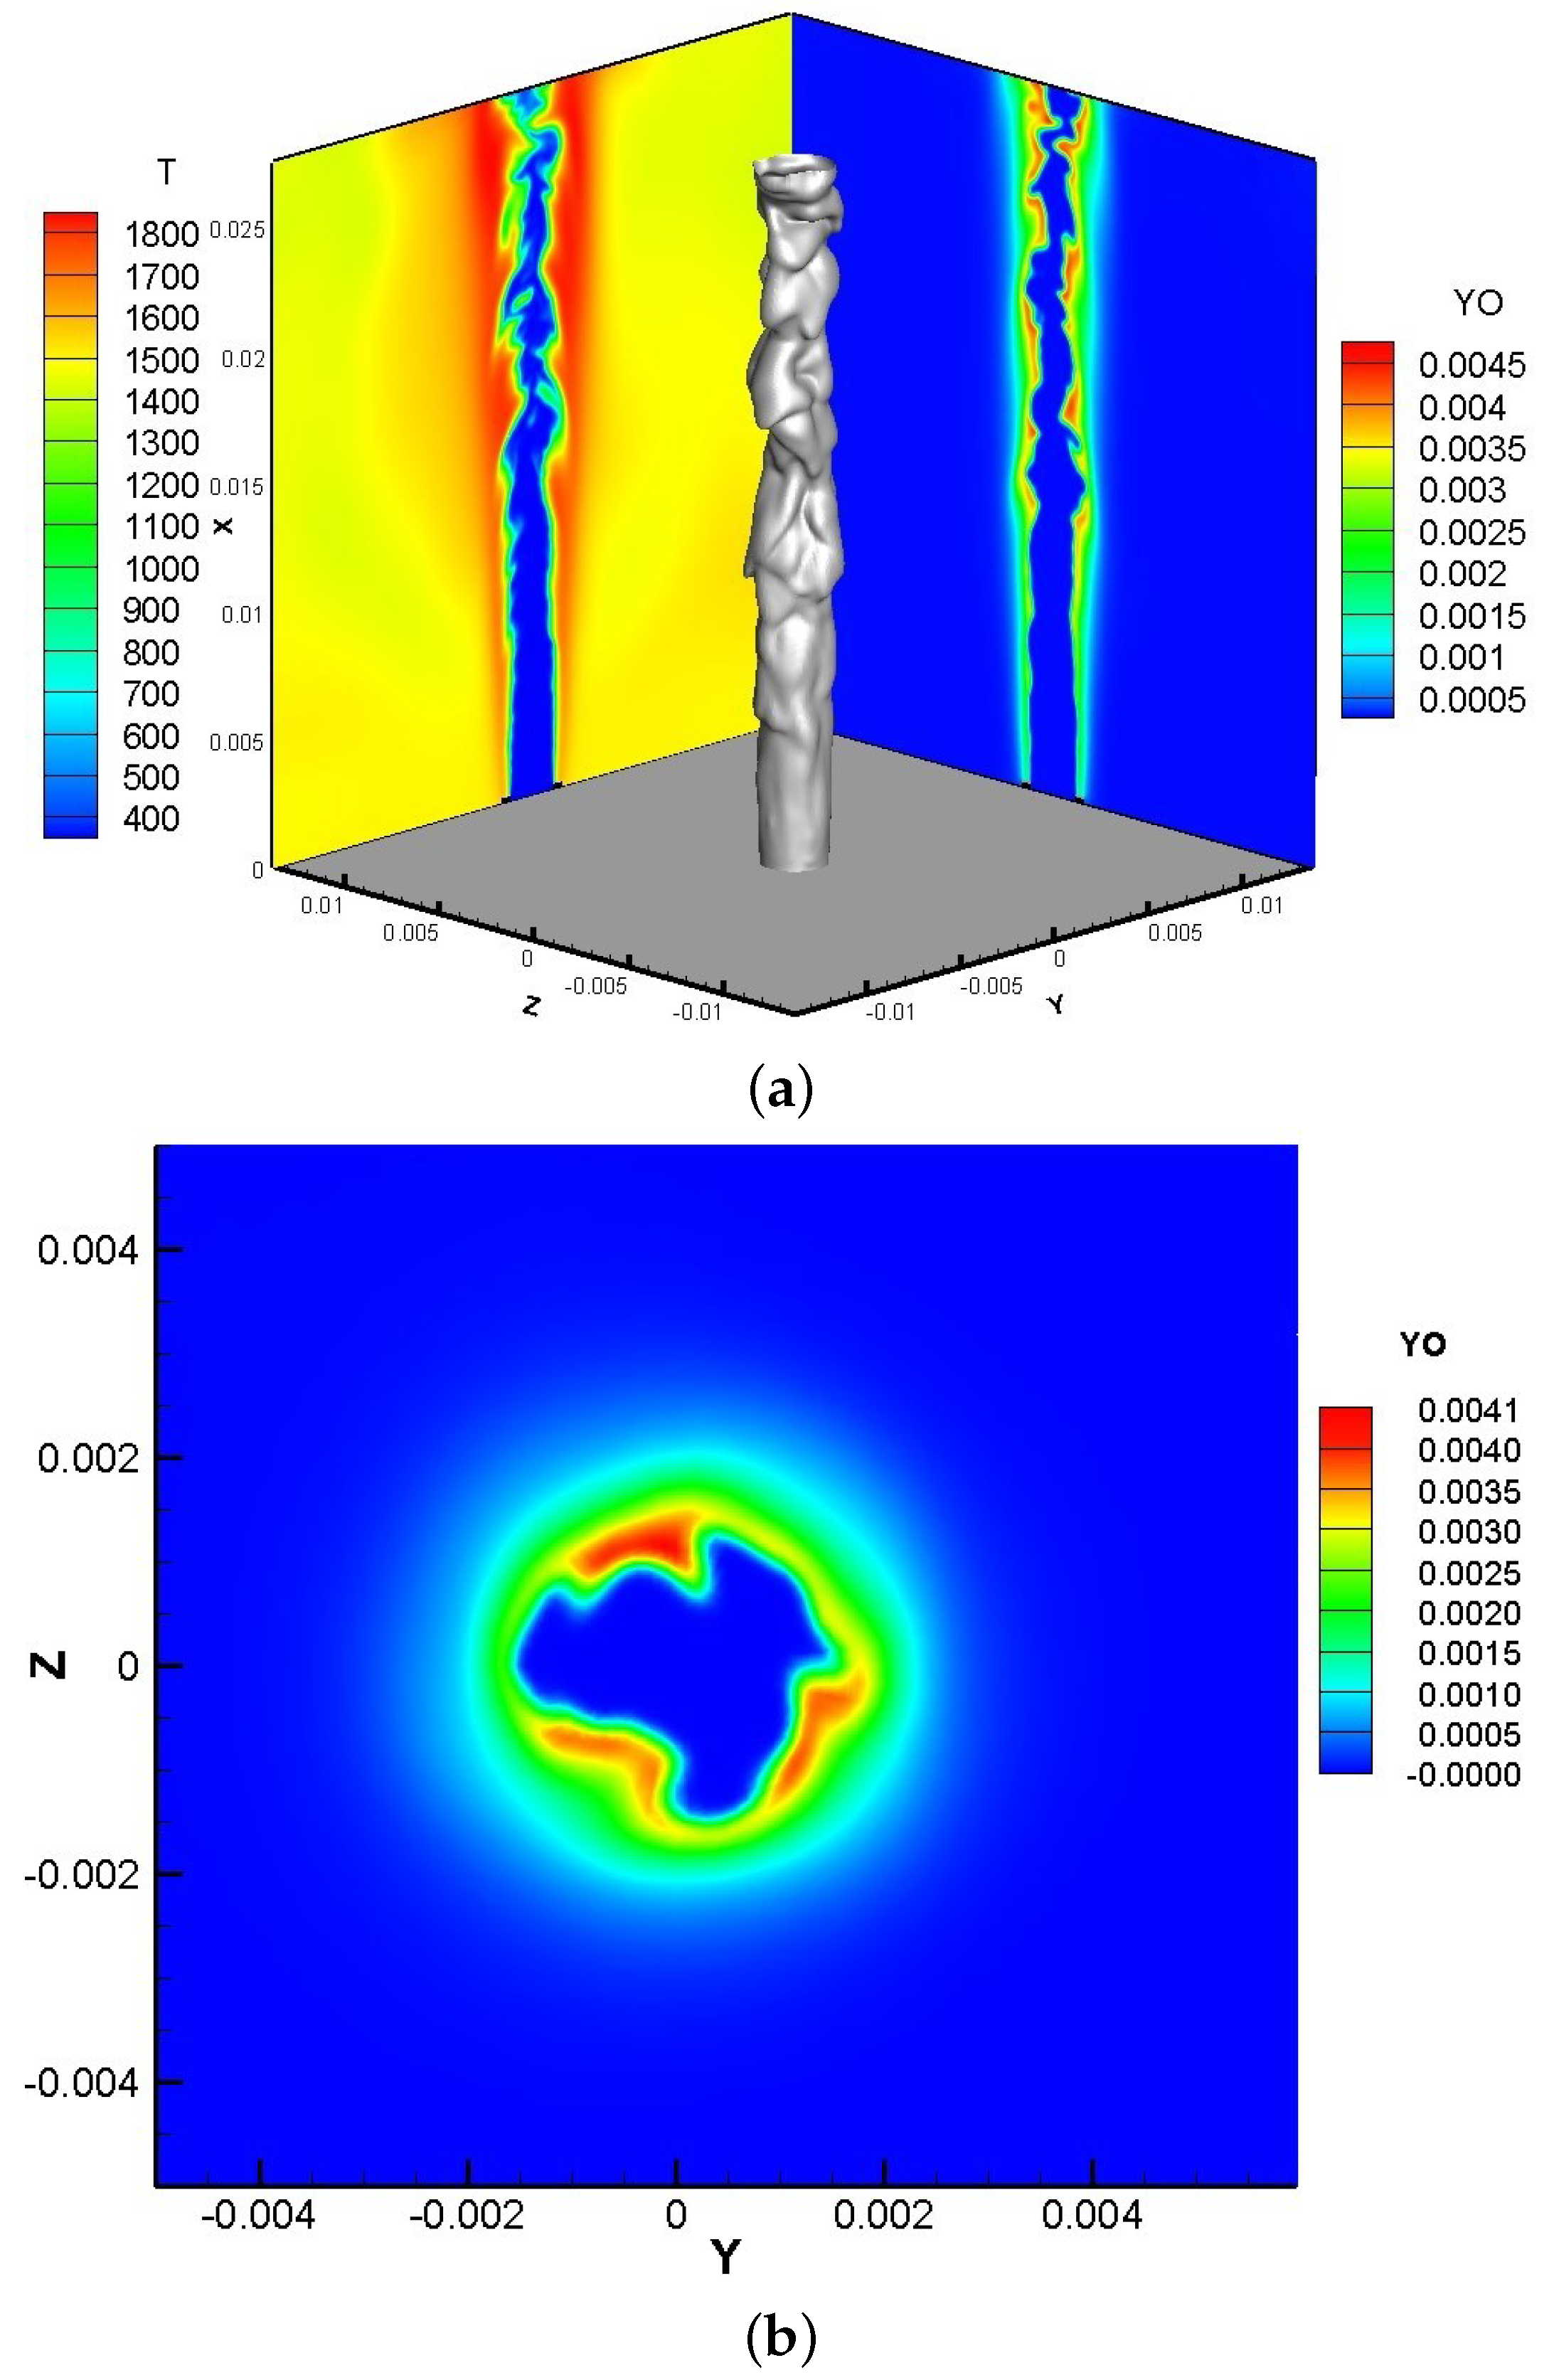
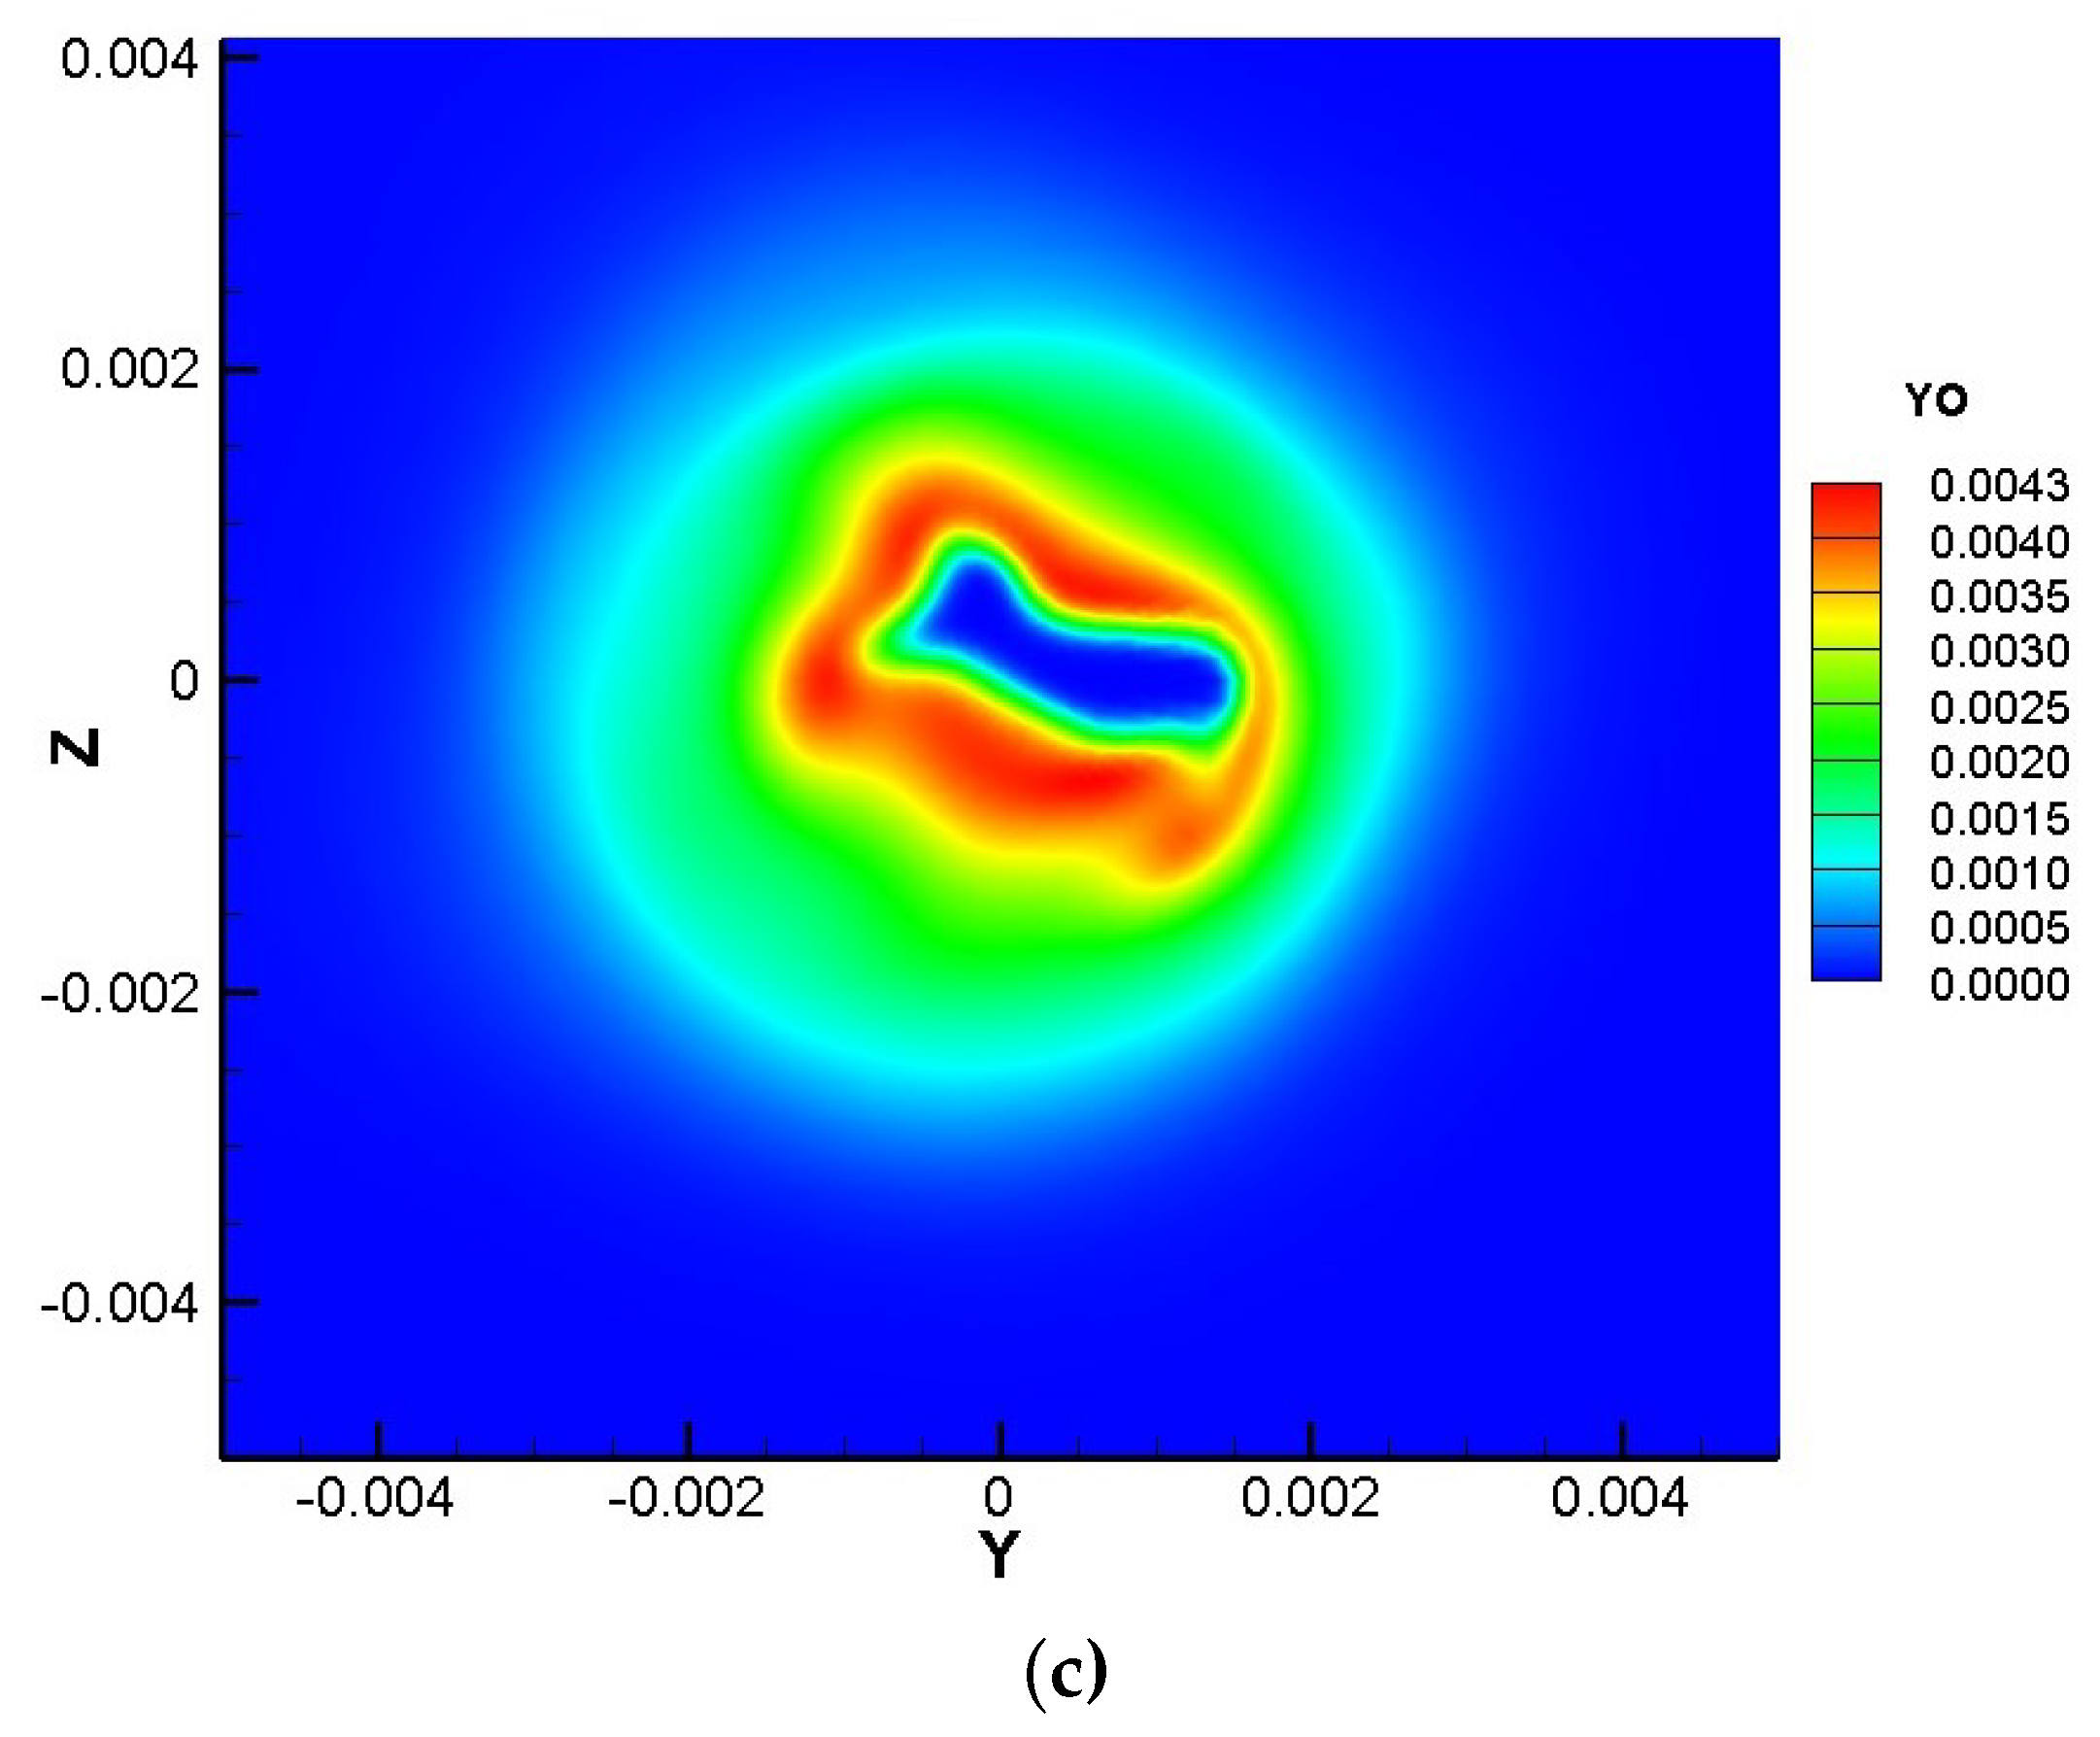
3.1. Transient Field Analysis

The central jet had formed a stable premixed flame after 15 convection cycles. The method of defining the reaction process by reactants was used when studying the flame surface, and the reaction process c was defined as c = 1 − Y C O / m a x ( Y C O ). Figure 3 shows the flame surface, the temperature field of the section through the central axis, and the mass fraction fields of OH and O radicals of the section through the central axis at c = 0.7—and the mass fraction of O radicals at cross-section x / D = 6 and x / D = 11 in the premixed flame with ozone added. It can be seen from the figure that the flame surface did not change much before 4D, indicating that the turbulence had little effect on the flame surface. The flame surface began to wrinkle slightly after 4D. The turbulence caused obvious wrinkles on the flame surface after passing through the flame surface, which can be inferred from the temperature field and the O radicals field. The effect of the turbulence on the flame surface became more obvious as the turbulence passed through the flame surface. The wrinkles on the flame surface became more obvious. The downstream chemical reaction was becoming stronger, which can be inferred from the temperature field. The O radicals were enriched on the side that protrudes toward the reactant, which can be seen from the O radical field; the place where the flame surface protrudes toward the reactant indicates that the local turbulent flame velocity was temporarily greater than the gas velocity; so, it is shown that the concentration of O radicals was positively correlated with the turbulent flame velocity. The O radicals at x / D = 11 were significantly higher comparing with that at x / D = 6. This indicates that the O radical at this position began to play an important role in the reaction process. Ozone, as a substance that can generate O radicals, should also start to significantly affect the reaction process at this location.

3.2. Time-Averaged Statistical Analysis

The field shown in Figure 3 is transient, and the time-averaged statistics of velocity, temperature, and the main components are discussed next. Figure 4 shows the time-averaged velocity, temperature, fuel, product, and intermediate product OH and O radical mass fraction distribution on the central axis. It can be seen from the figure that the addition of ozone will not affect the velocity decay on the central axis. The temperature curve shows that the overall temperature curve starts to rise, indicating that the wrinkles caused by the turbulence on the flame surface from 6D began to affect the instantaneous flame surface to approach or even appear at the central axis position, which caused the time-averaged temperature on the central axis after 6D to start to increase obviously. The time-averaged temperature of the case with ozone added was higher than that of the case without ozone after 8D; the mass fraction of fuel decreased faster than that of the case without ozone; and the production of O radicals and OH was greater than that of the case without ozone, but only the mass fraction of CO 2 in the product increased, and the mass fraction of H2O basically had no change, indicating that ozone will promote the formation of CO 2 and has little effect on the formation of H 2 O in the near field.
The axial distribution of the near field reflects the combustion characteristics along the jet direction, while the radial distribution reflects the combustion characteristics on the flame front to a greater extent. Figure 5 shows the time-averaged velocity, temperature, fuel, product, and intermediate product OH and O radical mass fraction distribution on r / D = 3, 6, 11. The change in axial velocity and radial velocity also reflects the change in flame velocity because of passing through the flame surface; the velocity curves at three positions of the case with ozone added showed the enhancement of the flame speed. The flame temperature curve also showed that the overall temperature of the case with the ozone added was greater than that of the case without ozone, indicating the addition of ozone will increase the heat release rate of the overall chemical reaction. The time-averaged results of r / D = 3 and r / D = 6 show that the addition of ozone began to affect the generation of intermediate products OH and O radicals on the flame surface upstream before 6D, but it did not affect the production of the products, while the time-averaged results showed that the strengthening effect of ozone on the premixed combustion of syngas in the near field downstream was reflected in the product. The mass fraction of CO 2 in the case with ozone added near the flame surface in the entire radial direction was significantly greater than that in the case without ozone, which is consistent with the trend on the central axis. It is shown that ozone can significantly strengthen the combustion reaction and promote the generation of CO 2 in the near field of the entire premixed flame. The mean mass fraction of CO 2 of different radial positions at x / D = 11 are listed in Table 2. The role of ozone in promoting CO 2 production is particularly obvious at the center of x / D = 11, which can increase the production rate of CO 2 by 10.8%.

3.3. The Effect on Ignition

The ignition of the two cases was in the form of coflow ignition, which is realized by the complete combustion product of 1500 K in the coflow. The influence of ozone on the ignition was analyzed in this study through the influence of the flame surface area. The flame surface area was used as a parameter to characterize the component exchange and energy exchange intensity in the flame. It can be concluded that the effect of ozone on the intensity of mass–energy exchange during flame combustion is strong or weak by comparing the area of the flame surface. Similarly, the influence of ozone on the ignition process can be judged by comparing the size of the flame surface during the ignition process. The full-field initialization component can not be zero based on the calculation stability—it will cause the definition of reaction process, and it can not be used when the flame surface area is calculated during the ignition phase. Therefore, the surface of Y H 2 = 0.007 was simply used as the flame surface for flame surface area statistics, and the specific curve is shown in Figure 6. It can be seen from the figure that the flame surface area increases sharply due to the intense mass–energy exchange during the ignition process, and the flame surface area gradually stabilizes as the flame stabilizes. It can be found that ozone makes the curve of the flame surface change forward comparing the case without ozone, and the maximum flame surface area was s also larger than the case without ozone. In connection with the previous conclusion, it shows that the content of intermediate products OH and O radicals in the ignition process were re greater than those of the case without ozone due to the addition of ozone; this phenomenon makes the combustion reaction proceed earlier, and the combustion was more intense; thereby, the ignited speed of the premixed syngas by the high-temperature combustion products was increased. Therefore, it can be concluded that ozone can significantly promote the ignition of the free jet discussed.

3.4. Flame Surface Statistics Analysis

Many analyses of the two-dimensional flame surface were carried out by discussing the statistics of its flame surface, such as the tangential strain rate, the curvature, etc. The flame surface of the three-dimensional free jet can also be analyzed using this method so that the effect of adding ozone on the overall shape of the flame surface can be obtained.
The PDFs of the tangential strain rate and curvature on the isoline of c = 0.4 at t = 17.5 ms are shown in Figure 7. The overall distribution is biased towards positive values, which can be seen from the distribution of the tangential strain rate, indicating that the stretching effect on the flame surface is greater than the extrusion effect on the flame surface because of fluid dynamics. This tendency is different from the trend of the two-dimensional flame surface at an equivalent ratio of 0.7 but is consistent with the trend of the two-dimensional flame surface at an equivalent ratio of 2.0 and 3.0. The reason is that the combustion of the near-field flame still showed stability, and the flame surface shape was relatively complete, so its tangential strain rate distribution trend was biased to a positive value. This phenomenon further shows that the effect of turbulence on the flame surface in a stable flame is mainly to stretch the flame surface. The density of the positive tangential strain rate is becoming larger when the ozone is added, indicating that the flame surface after ozone addition is more easily stretched by turbulence. It can be found that adding ozone can improve the stability of combustion. As for the curvature term caused by the propagation of the reaction front, the distributions of the two cases are both nearly symmetric with the zero curvature line, which is consistent with the conclusions of previous studies. From an overall point of view, the curvature of the flame surface with ozone added had a wider distribution. According to Figure 7, the effective radius of the flame curvature did not change after the addition of ozone, indicating that the addition of ozone will not affect the degree of the wrinkle of the flame surface. The difference in the curvature between the two is because the addition of ozone increases the displacement speed of the flame surface, which is shown in Figure 7d.

4. Conclusions

Three-dimensional simulation of the near-field (0∼12D) of the lean premixed syngas flame without ozone and with ozone was carried out through direct numerical simulation. The following conclusions were drawn after comparing the transient field, time-averaged results, ignition process, and flame surface statistics:
(1)
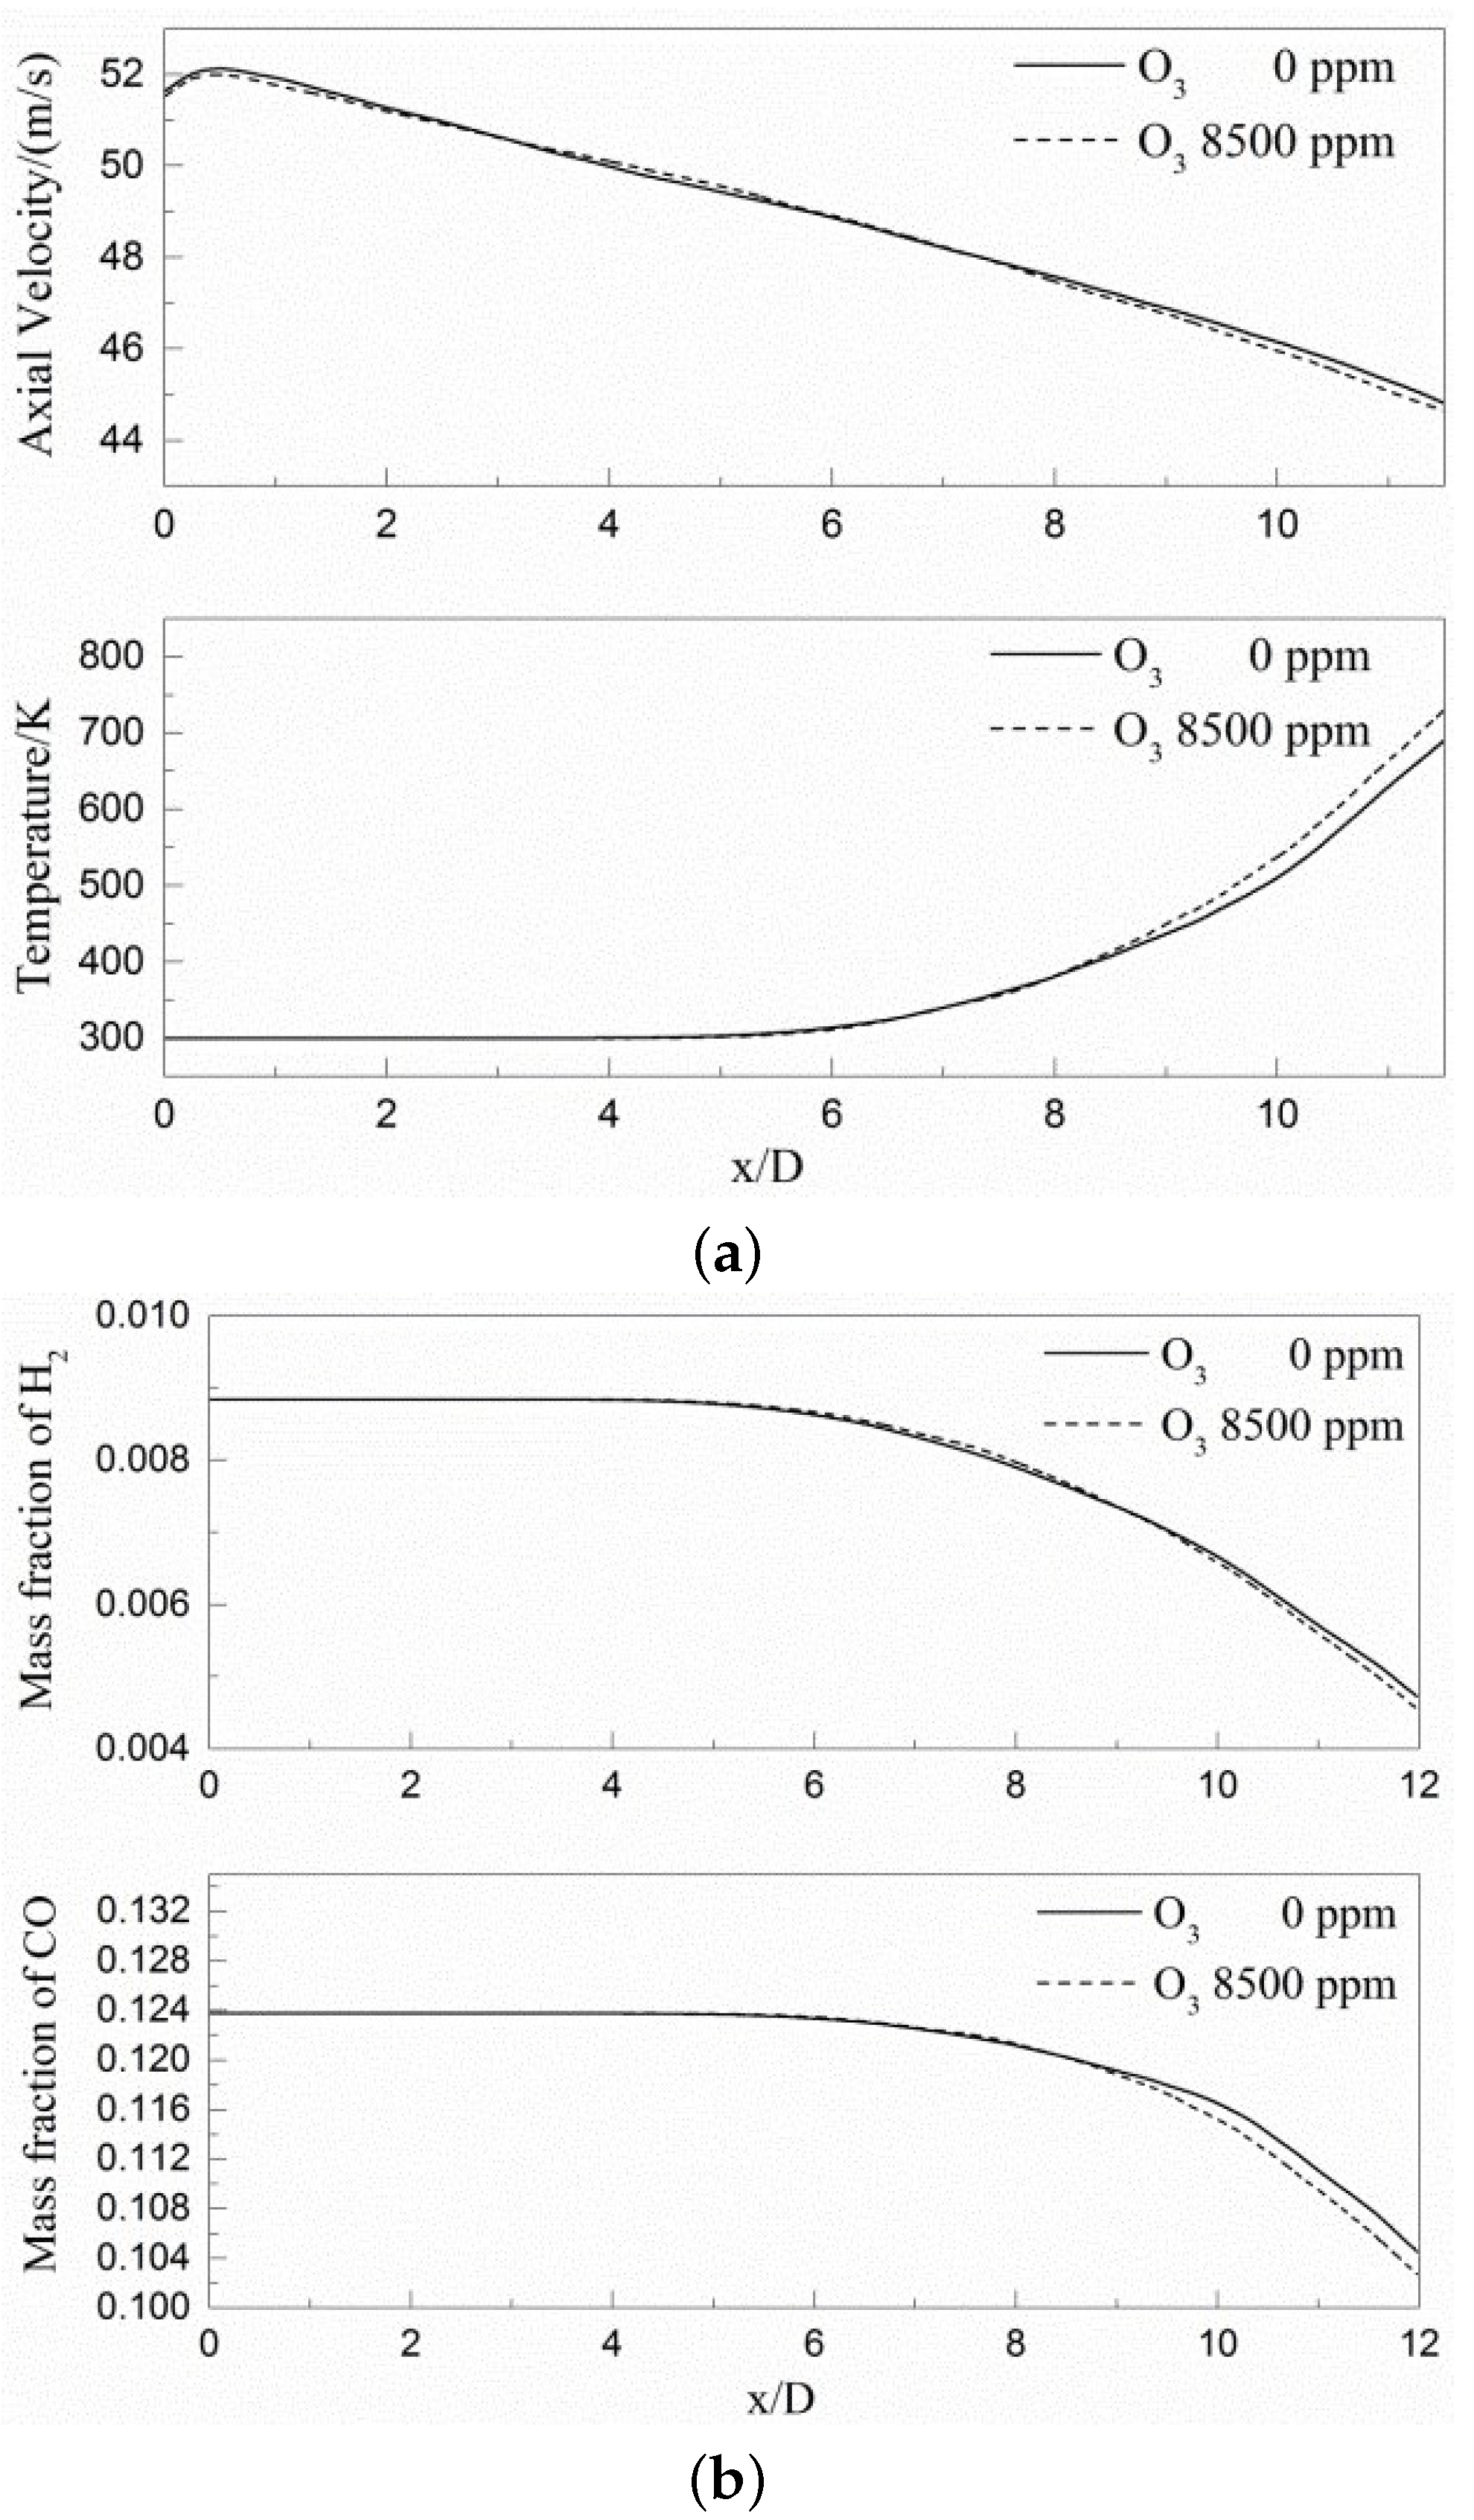
It can be seen from the transient field and the time-averaged results that turbulence begins to significantly affect the flame surface to produce wrinkles in lean premixed gas flame after 4D, while ozone starts to affect the composition field and temperature field after 8D and accelerates the generation of intermediate products OH and O radicals and will promote the production of CO 2 in the near field range.
(2)
It can be seen from the ignition process that ozone will increase the flame surface area of the lean premixed syngas flame by comparing the area of the flame surface during the ignition period, and the conclusion can be obtained that ozone can promote the ignition process and make the combustion occur earlier.
(3)
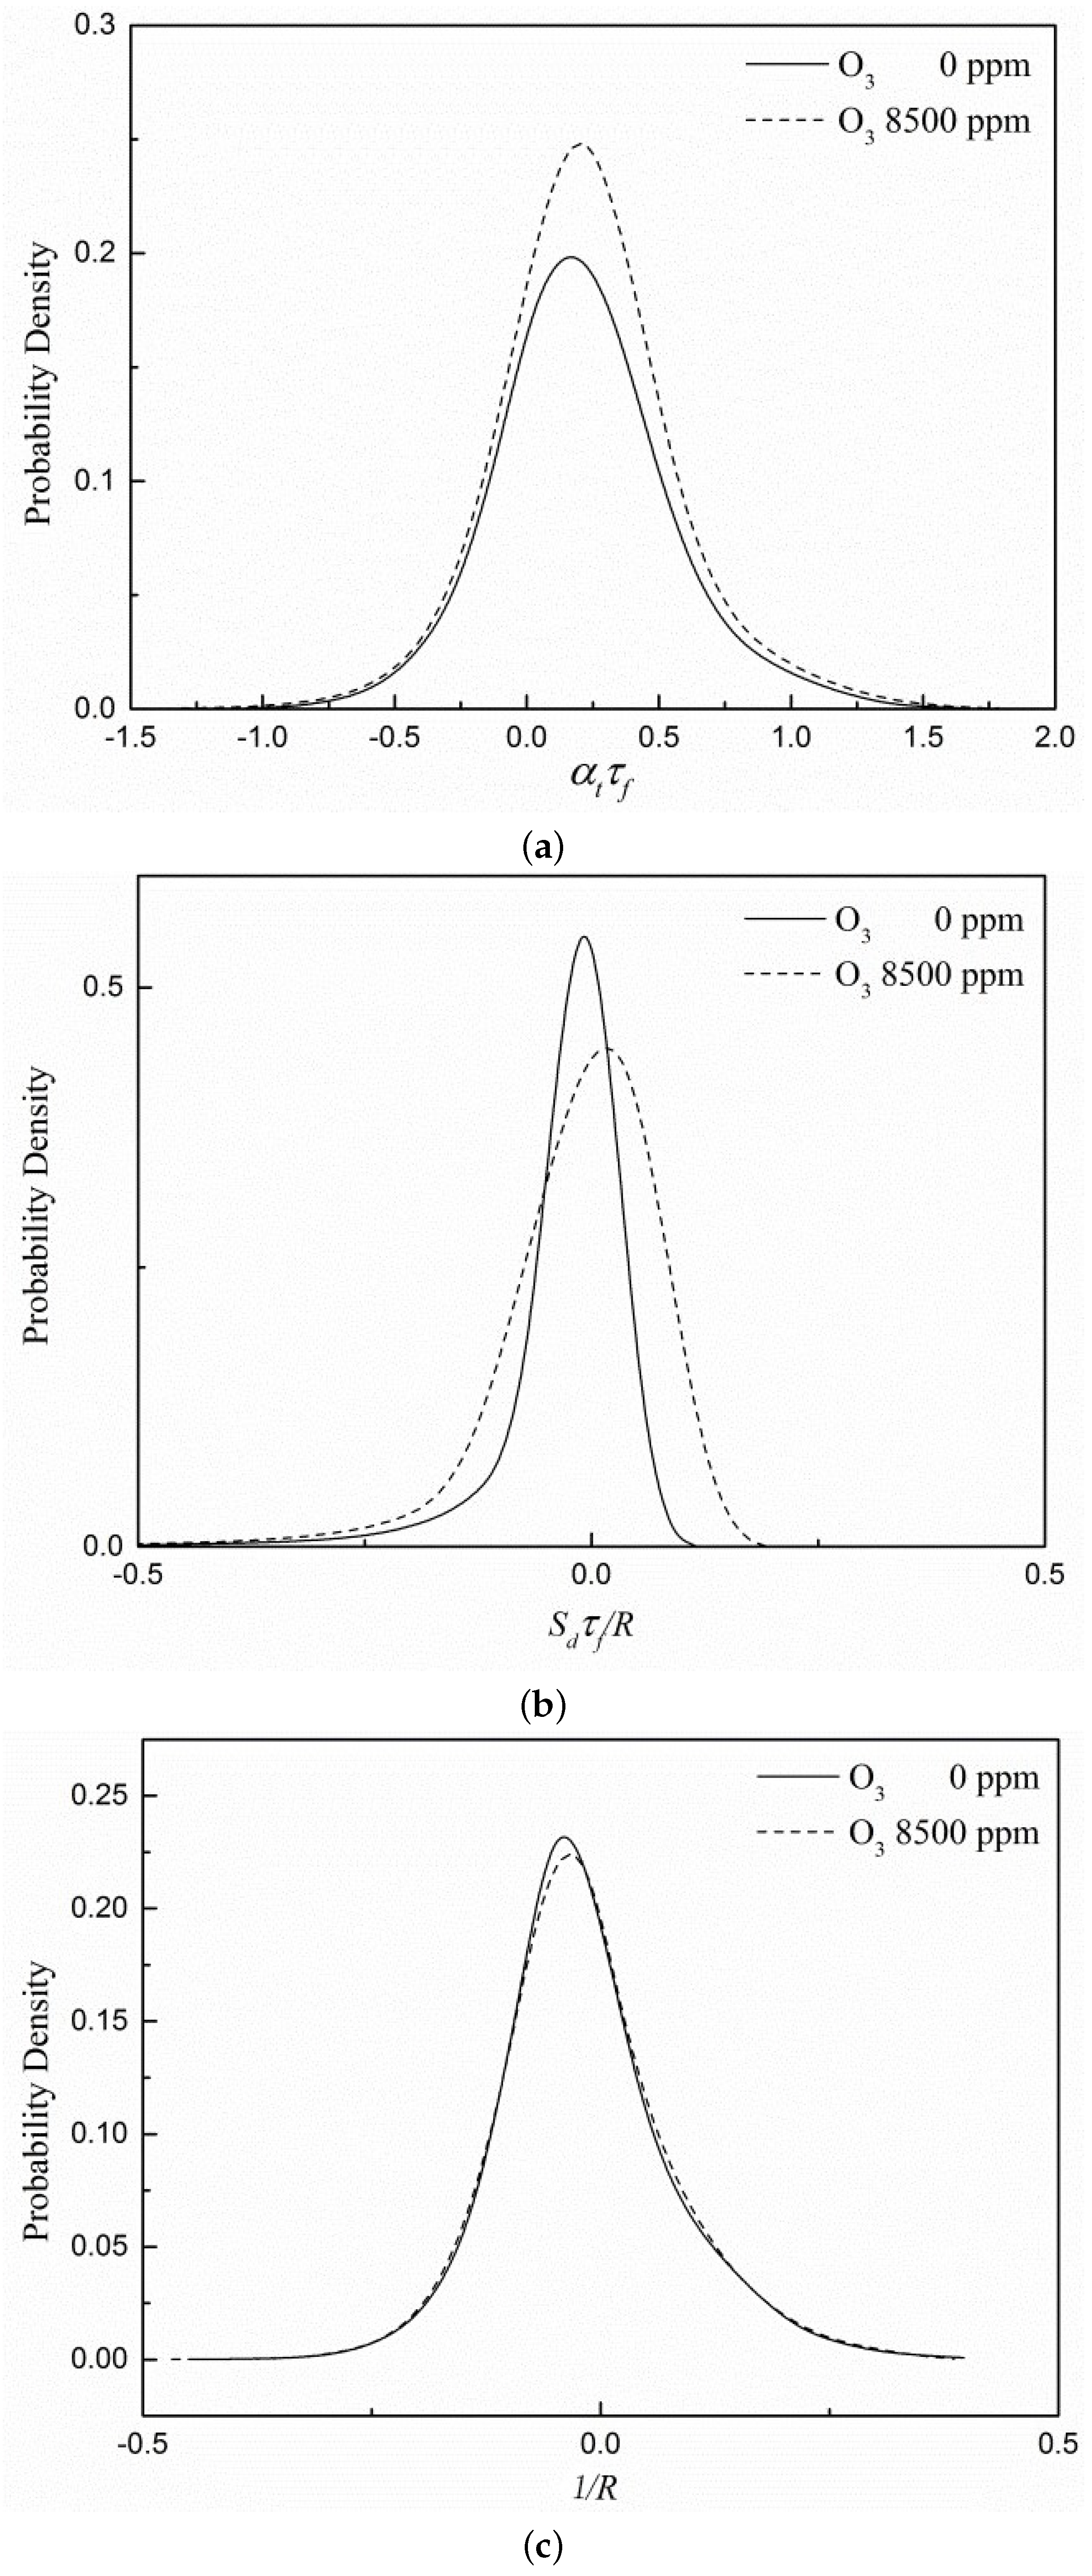
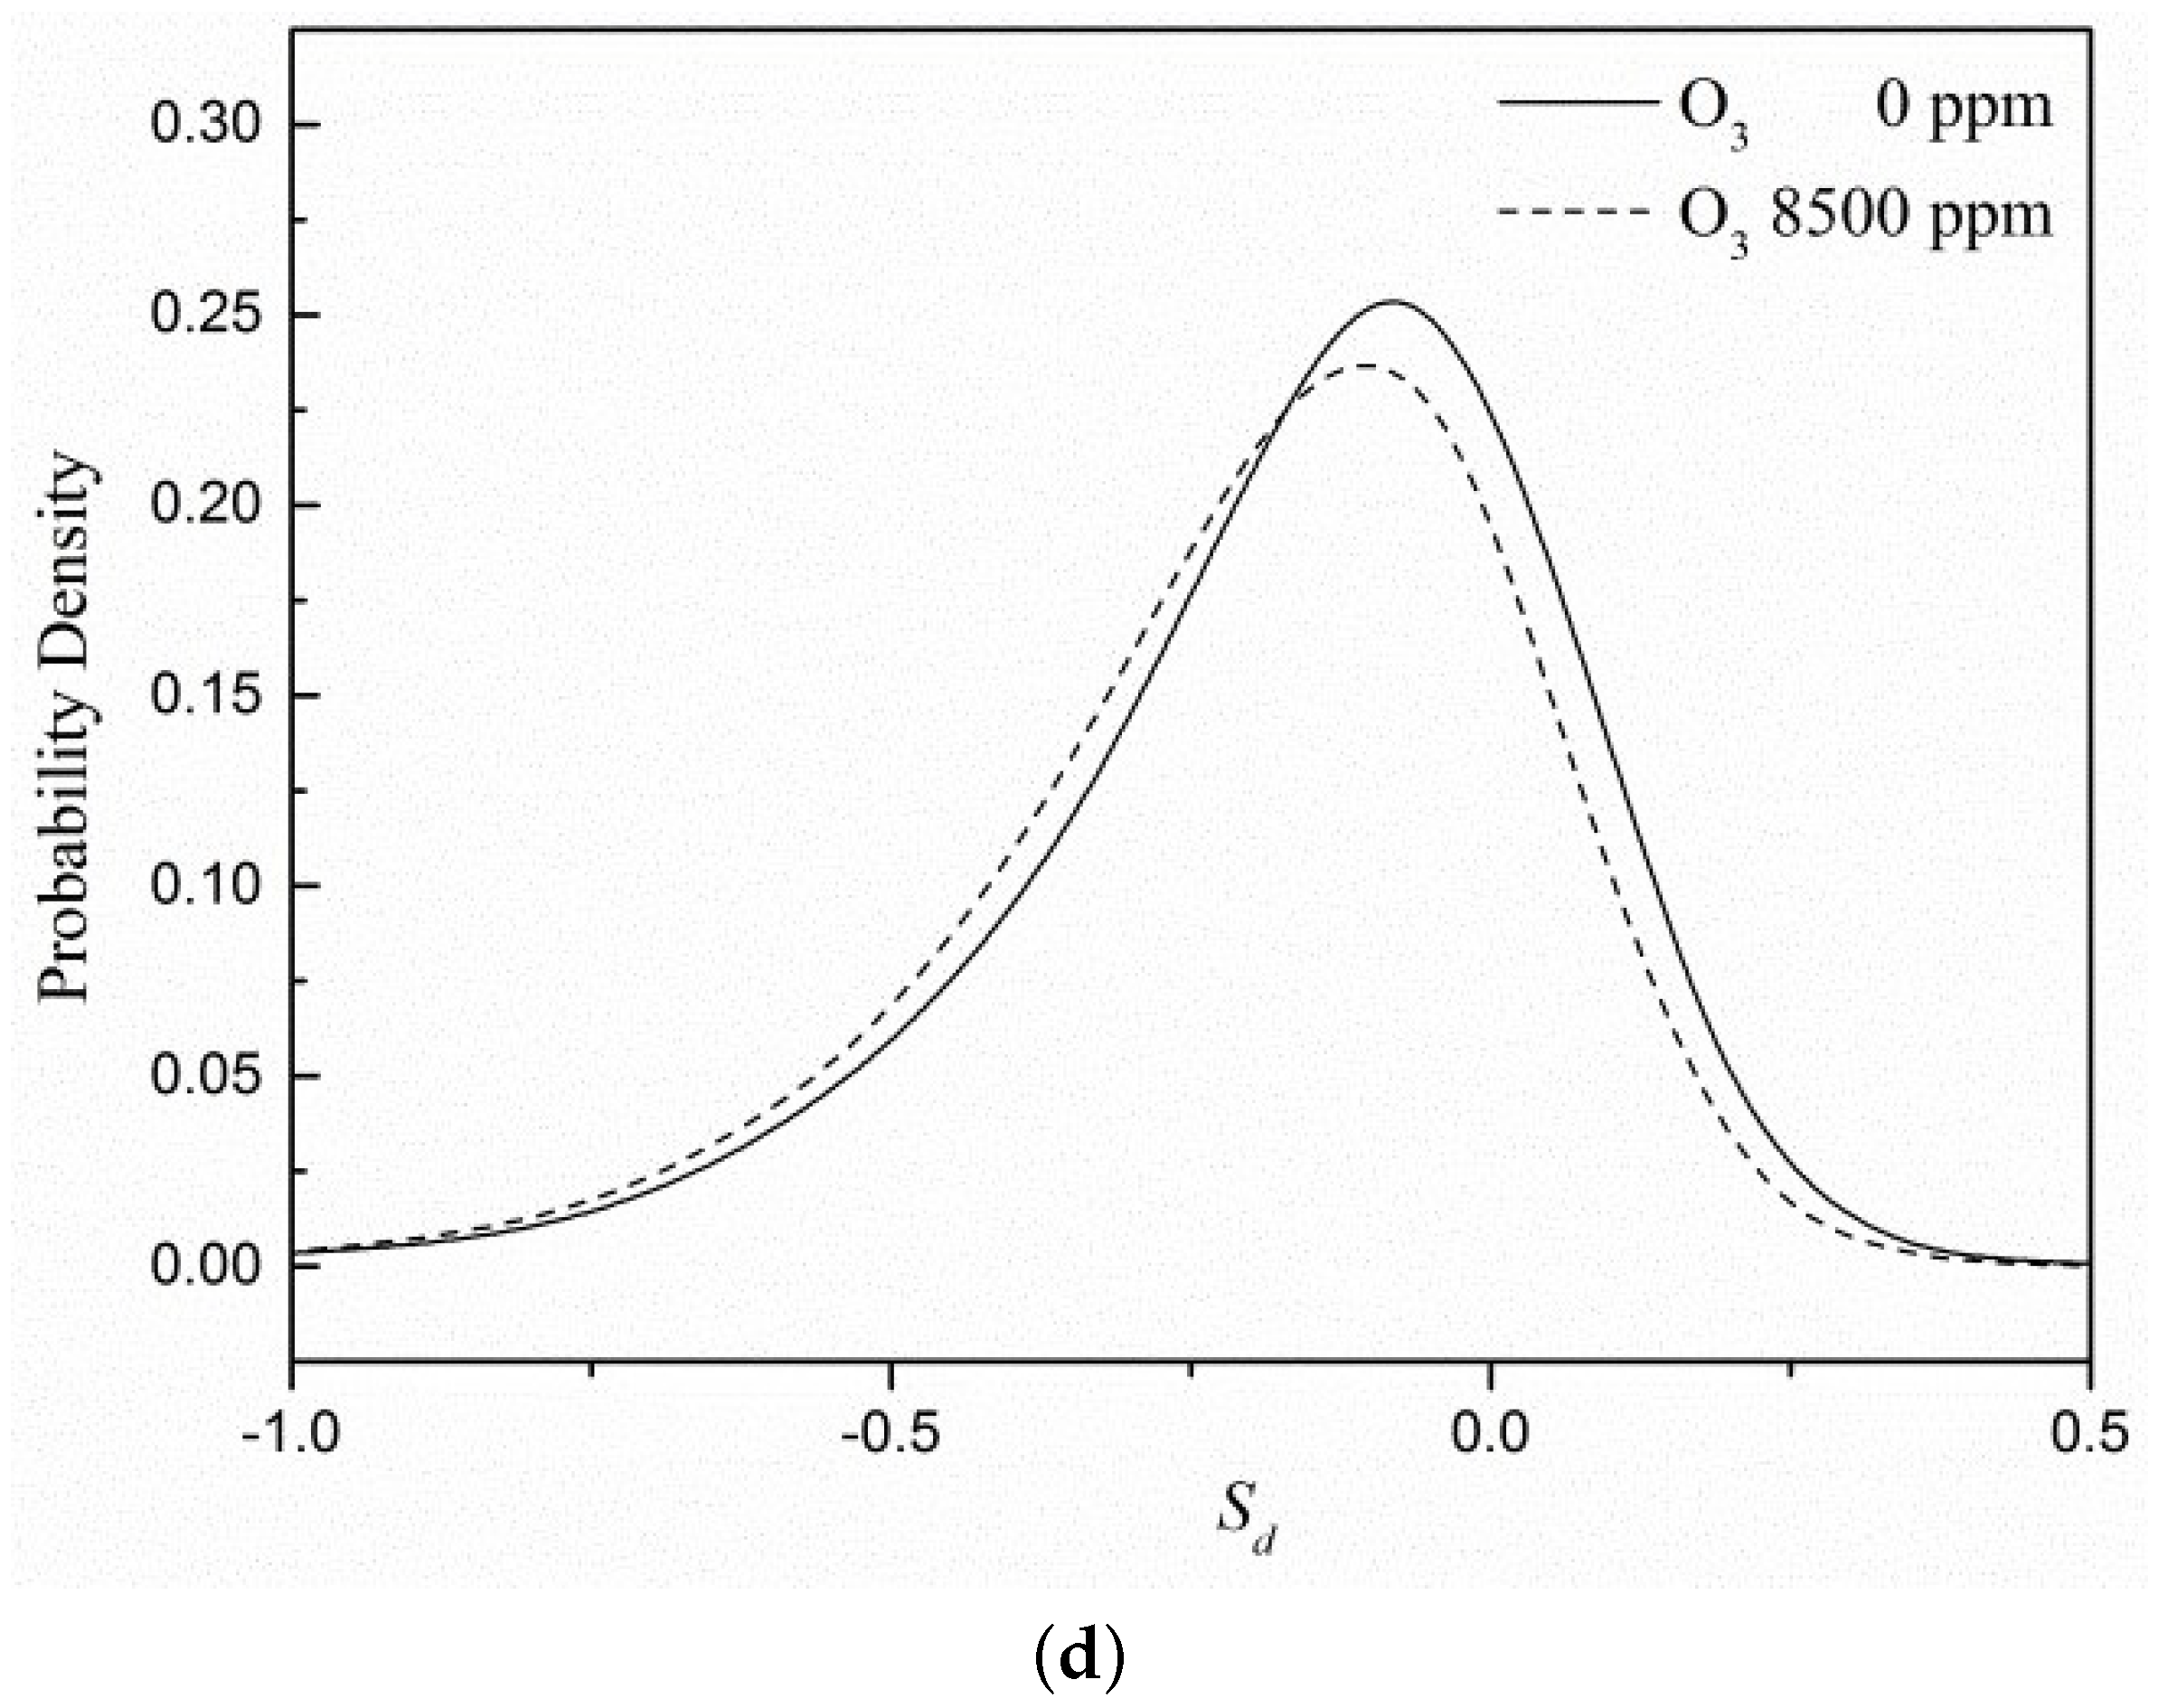
It can be seen from the flame surface statistics that the flame surface of the case with ozone added is more easily stretched by turbulence, and adding ozone can improve the stability of combustion. Ozone does not affect the effective radius of the flame curvature but will broaden the distribution of the curvature term because of the enhancement effect on the displacement speed of the flame surface.
The present numerical simulations investigated the enhancement of lean premixed syngas turbulent jet flame by ozone addition and also compared the flame with ozone and the flame without ozone. Future studies can advance the understanding of the change in ozone content in the flame through a more detailed design of numerical conditions. As our understanding of the combustion-enhancing effect of ozone on syngas deepens, a suitable means is provided to improve combustion conditions and adjust combustion characteristics without altering fuel and intake air in combustion technologies that are using syngas, such as IGCC.

Author Contributions

C.X., J.L. and K.W. designed and performed the simulations together; Z.Z., S.S. and Z.W. helped analyze the data and improve the simulations. All authors have read and agreed to the published version of the manuscript.

Funding

This work was supported by the National Natural Science Foundation of China (52076008), the R&D Project of MW Natural Gas-Hydrogen Gas Turbine (72901020008), the Ningbo Natural Science Foundation (2021J010), and the State Key Laboratory of Clean Energy Utilization (Open Fund Project No. ZJUCEU2020008).

Conflicts of Interest

The authors declare no conflict of interest.

References

  1. Halter, F.; Higelin, P.; Dagaut, P. Experimental and Detailed Kinetic Modeling Study of the Effect of Ozone on the Combustion of Methane. Energy Fuels 2011, 25, 2909–2916. [Google Scholar] [CrossRef]
  2. Masurier, J.B.; Foucher, F.; Dayma, G.; Daguat, P. Investigation of iso-octane combustion in a homogeneous charge compression ignition engine seeded by ozone, nitric oxide and nitrogen dioxide. Proc. Combust. Inst. 2015, 35, 3125–3132. [Google Scholar] [CrossRef]
  3. Zhang, Y.; Zhu, M.M.; Zhang, Z.Z.; Shang, R.X.; Zhang, D.K. Ozone effect on the flammability limit and near-limit combustion of syngas/air flames with N2, CO2, and H2O dilutions. Fuel 2016, 186, 414–421. [Google Scholar] [CrossRef]
  4. Mehdi, G.; Bonuso, S.; De Giorgi, M.G. Effects of Nanosecond Repetitively Pulsed Discharges Timing for Aeroengines Ignition at Low Temperature Conditions by Needle-Ring Plasma Actuator. Energies 2021, 14, 5814. [Google Scholar] [CrossRef]
  5. Ombrello, T.; Won, S.H.; Ju, Y.G.; Williams, S. Flame propagation enhancement by plasma excitation of oxygen. Part I: Effects of O3. Combust. Flame 2010, 157, 1906–1915. [Google Scholar] [CrossRef]
  6. Wang, Z.H.; Yang, L.; Li, B.; Li, Z.S.; Sun, Z.W.; Alden, M.; Cen, K.F.; Konnov, A.A. Investigation of combustion enhancement by ozone additive in CH4/air flames using direct laminar burning velocity measurements and kinetic simulations. Combust. Flame 2012, 159, 120–129. [Google Scholar] [CrossRef]
  7. Liu, Y.; Wang, Z.; Li, L.; Wan, K.; Cen, K. Reaction Mechanism Reduction for Ozone-Enhanced CH4/Air Combustion by a Combination of Directed Relation Graph with Error Propagation, Sensitivity Analysis and Quasi-Steady State Assumption. Energies 2018, 11, 1470. [Google Scholar] [CrossRef] [Green Version]
  8. Ji, S.B.; Lan, X.; Lian, J.; Xu, H.M.; Wang, Y.Q.; Cheng, Y.; Liu, Y.Q. Influence of Ozone on Ignition and Combustion Performance of a Lean Methane/Air Mixture. Energy Fuels 2017, 31, 14191–14200. [Google Scholar] [CrossRef]
  9. Wu, B.; Hastings, M.; Sun, W.T.; Ombrello, T.; Carter, C. Dynamics of laminar ethylene lifted flame with ozone addition. Proc. Combust. Inst. 2020, 38, 6773–6780. [Google Scholar] [CrossRef]
  10. Keil, F.B.; Amzehnhoff, M.; Ahmed, U.; Chakraborty, N.; Klein, M. Comparison of Flame Propagation Statistics Extracted from Direct Numerical Simulation Based on Simple and Detailed Chemistry—Part 1: Fundamental Flame Turbulence Interaction. Energies 2021, 14, 5548. [Google Scholar] [CrossRef]
  11. Keil, F.B.; Amzehnhoff, M.; Ahmed, U.; Chakraborty, N.; Klein, M. Comparison of Flame Propagation Statistics Based on Direct Numerical Simulation of Simple and Detailed Chemistry. Part 2: Influence of Choice of Reaction Progress Variable. Energies 2021, 14, 5695. [Google Scholar]
  12. Wang, Z.H.; Fan, J.R.; Zhou, J.H.; Cen, K.F. Direct numerical simulation of hydrogen turbulent lifted jet flame in a vitiated coflow. Chin. Sci. Bull. 2007, 52, 2147–2156. [Google Scholar] [CrossRef]
  13. Hawkes, E.R.; Sankaran, R.; Sutherland, J.C.; Chen, J.H. Scalar mixing in direct numerical simulations of temporally evolving plane jet flames with skeletal CO/H2 kinetics. Proc. Combust. Insititute 2007, 31, 1633–1640. [Google Scholar] [CrossRef]
  14. Wang, Z.H.; Lv, Y.; He, P.; Zhou, J.H.; Cen, K.F. Fully explicit implementation of direct numerical simulation for a transient near-field methane/air diffusion jet flame. Comput. Fluids 2010, 39, 1381–1389. [Google Scholar] [CrossRef]
  15. Wang, Z.H.; He, P.; Lv, Y.; Zhou, J.H.; Fan, J.R.; Cen, K.F. Direct Numerical Simulation of Subsonic Round Turbulent Jet. Flow Turbul. Combust 2010, 84, 669–686. [Google Scholar] [CrossRef]
  16. Chi, C.; Janlga, G.; Abdelsamle, A.; Zahringer, K.; Turanyi, T.; Thevenin, D. DNS Study of the Optimal Chemical Markers for Heat Release in Syngas Flames. Flow Trubulence Combust. 2017, 98, 1117–1132. [Google Scholar] [CrossRef]
  17. Roy, R.N.; Muto, M.; Kurose, R. Direct numerical simulation of ignition of syngas (H2/CO) mixtures with temperature and composition stratifications relevant to HCCI conditions. Int. J. Hydrog. Energy 2017, 42, 26152–26161. [Google Scholar] [CrossRef]
  18. Bhide, K.G.; Sreedhara, S. A DNS study on turbulence-chemistry interaction in lean premixed syngas flames. Int. J. Hydrog. Energy 2020, 45, 23615–23623. [Google Scholar] [CrossRef]
  19. Bird, R.B. Transport phenomena. Appl. Mech. Rev. 2002, 55, R1–R4. [Google Scholar] [CrossRef]
  20. Barlow, R.S.; Karpetis, A.N.; Frank, J.H.; Chen, J.Y. Scalar profiles an NO formation in laminar opposed-flow partially premixed methane/air flames. Combust. Flame 2001, 127, 2102–2118. [Google Scholar] [CrossRef]
  21. Najm, H.N.; Wyckoff, P.S.; Knio, O.M. A semi-implicit numerical scheme for reacting flow: I. Stiff chemistry. J. Comput. Phys. 1998, 143, 381–402. [Google Scholar] [CrossRef]
  22. Jiang, G.S.; Shu, C.W. Efficient Implementation of Weighted ENO Schemes. J. Comput. Phys. 1996, 126, 202–228. [Google Scholar] [CrossRef] [Green Version]
  23. Brown, P.N.; Byrne, G.D.; Hindmarsh, A.C. VODE: A variable-coefficient ODE solver. SIAM J. Sci. Comput. 1989, 10, 1038–1051. [Google Scholar] [CrossRef] [Green Version]
  24. Davis, S.G.; Joshi, A.V.; Wang, H.; Egolfopoulos, F. An optimized kinetic model of H2/CO combustion. Proc. Combust. Insititute 2005, 30, 1283–1292. [Google Scholar] [CrossRef]
  25. Weng, W.; Nilsson, E.; Ehn, A.; Zhu, J.; Zhou, Y.; Wang, Z.; Li, Z.; Aldén, M.; Cen, K. Investigation of formaldehyde enhancement by ozone addition in CH4/air premixed flames. Combust. Flame 2015, 162, 1284–1293. [Google Scholar] [CrossRef]
  26. Pope, S.B. Turbulent Flows; Cambridge University Press: Cambridge, UK, 2000. [Google Scholar]
  27. Xu, C.; Wang, Z.H.; Weng, W.B.; Wan, K.D.; Whiddon, R.; Wu, A.J. Effects of the Equivalence Ratio and Reynolds Number on Turbulence and Flame Front Interactions by Direct Numerical Simulation. Energy Fuels 2016, 30, 6727–6737. [Google Scholar] [CrossRef]
  28. Wan, K.D.; Xia, J.; Wang, Z.H.; Wrobel, L.C.; Cen, K.F. Online-CPD-Coupled Large-Eddy Simulation of Pulverized-Coal Pyrolysis in a Hot Turbulent Nitrogen Jet. Combust. Sci. Technol. 2017, 189, 103–131. [Google Scholar] [CrossRef]
  29. Wan, K.D.; Xia, J.; Vervisch, L.; Liu, Y.Z.; Wang, Z.H.; Cen, K.F. Modelling alkali metal emissions in large-eddy simulation of a preheated pulverised-coal turbulent jet flame using tabulated chemistry. Combust. Theory Model. 2018, 22, 203–236. [Google Scholar] [CrossRef]
  30. Liu, Y.Z.; Wan, K.D.; Li, L.; Wang, Z.H.; Cen, K.F. Verification and Validation of a Low-Mach-Number Large-Eddy Simulation Code against Manufactured Solutions and Experimental Results. Energies 2018, 11, 921. [Google Scholar] [CrossRef] [Green Version]
Figure 1. Schematic diagram of calculation area.
Energies 15 03945 g001
Figure 2. Schematic diagram of meshing. (a) plane across central axis (b) x = 0 plane.
Energies 15 03945 g002
Figure 3. The transient field of case added ozone at 17.5 ms (a) The flame surface, temperature field, and O radicals field at c = 0.7; (b) the mass fraction of O radicals at cross-section x / D = 6; (c) the mass fraction of O radicals at cross-section x / D = 11.
Energies 15 03945 g003aEnergies 15 03945 g003b
Figure 4. The time-averaged velocity, temperature, fuel, product, and intermediate product OH and O radical mass fraction distribution on the central axis. (a) The time-averaged velocity and temperature, (b) mass fraction of H 2 and CO, (c) mass fraction of H 2 O and CO 2 , and (d) mass fraction of O and OH.
Energies 15 03945 g004aEnergies 15 03945 g004b
Figure 5. The time-averaged velocity, temperature, fuel, product, and intermediate product OH and O radical mass fraction distribution on r / D = 3, 6, 11. (a) the time-averaged velocity and temperature, (b) mass fraction of H 2 and CO, (c) mass fraction of H 2 O and CO 2 , and (d) mass fraction of O and OH.
Energies 15 03945 g005aEnergies 15 03945 g005b
Figure 6. Variation curve of flame surface area with time at flame surface Y H 2 = 0.007.
Energies 15 03945 g006
Figure 7. Probability density distribution of statistics on the flame surface. (a) Tangential strain rate, (b) curvature, (c) the effective radius of flame curvature, and (d) the displacement speed of the flame surface.
Energies 15 03945 g007aEnergies 15 03945 g007b
Table 1. The parameters of the two cases.
Case 1Case 2
Inner diameter of central jet nozzle2.3 mm (D)2.3 mm (D)
Thickness of central jet nozzle0.5 mm0.5 mm
Velocity of central jet40.0 m/s40.0 m/s
Component in central jet (volume fraction)11.36% H 2 , 11.36% CO,
77.28% Air
11.40% H 2 , 11.40% CO,
15.30% O 2 , 61.25% N 2 ,
6.56% O 3
Temperature of central jet300 K300 K
Velocity of coflow0.4 m/s0.4 m/s
Temperature of coflow1500 K1500 K
Component in coflow (complete combust products)12.82% H 2 O, 12.82% CO 2 ,
5.49% O 2 , 68.88% N 2
12.82% H 2 O, 12.82% CO 2 ,
5.49% O 2 , 68.88% N 2
Table 2. The mean mass fraction of CO 2 of different radial positions at x / D = 11.
r / D 0.250.50.751.01.251.5
case 10.0370.0970.1590.1710.1560.14
case 20.0410.1040.1620.1720.1580.14
enhanced rate/%10.87.21.90.60.10
Publisher’s Note: MDPI stays neutral with regard to jurisdictional claims in published maps and institutional affiliations.

