Article

New Hybrid Machine Learning Method for Detecting Faults in Three-Phase Power Transformers

1
Wolfson Centre for Magnetics, School of Engineering, Cardiff University, Cardiff CF24 3AA, UK
2
High-Value Manufacturing Group, School of Engineering, Cardiff University, Cardiff CF24 3AA, UK
*
Author to whom correspondence should be addressed.
Energies 2022, 15(11), 3905; https://doi.org/10.3390/en15113905
Submission received: 18 April 2022 / Revised: 20 May 2022 / Accepted: 23 May 2022 / Published: 25 May 2022
(This article belongs to the Section F: Electrical Engineering)

Abstract

:
A novel hybrid machine learning technique is proposed for the protection of three-phase power transformers in this study. Here, the developed model was tested across several types of current signal fault cases from different fault conditions and examined based on a laboratory-constructed transformer system, in which internal and external faults were created. The data gathered on signals were used to develop a novel hybrid model. A process for optimal feature identification was put forward, with machine learning classifiers being trained to classify faults. The methods used included orthogonal matching pursuit and discrete wavelet transform for extraction of statistical characteristics from unprocessed data. Following this, the bees algorithm (BA) was used to create an optimized subset, minimizing the amount of data needed and making the model more accurate. In order to distinguish normal operational conditions (inrush current) from faults, an optimized feature set was used as an input for three classification algorithms: the k-nearest neighbour, support vector machine, and artificial neural network. Training was conducted via k-fold cross-validation. Comparisons were made between the proposed approach and a comparable approach, which used the genetic algorithm (GA). This model was analysed based on specificity, accuracy, precision, recall, and F1 score. The findings from the experiment suggest that the model proposed here is suitable for fault identification in a range of conditions and faults.

1. Introduction

To achieve stability and safety in power grid operations, an accurate protection scheme is required. A power transformer must be protected by avoiding or reducing damage due to the high cost of maintenance [1]. The main type of fault that affects the winding of the transformer is the turn-to-turn fault, which can rapidly burn the transformer [2]. This type of fault is responsible for 70–80% of transformer damage [3] and presents a major challenge in terms of detection at lower magnitudes of fault current [4]. Differential protection is one of the main methods used to protect the power transformer. This method depends on the current, which is measured by a current transformer (CT) fixed to both sides of the primary and secondary windings of the transformer. This approach is used to identify internal faults inside the transformer windings. In this scenario, the differential current will be extremely high instead of its value when the transformer is operating normally or when an external fault occurs outside the transformer’s protection zone. Therefore, reducing malfunctions in the differential protection system when classifying faults as internal or external is an important challenge [5]. In previous studies focusing on discrimination between these types of faults, many approaches were developed for use in the protective relay, applying different solutions and techniques [6]. The current waveform is determined based on the shape of the signal, considering the pattern on the spectra of the signal, as well as the discrete wavelet transform (DWT). Wavelet transforms are highly effective in detecting transient signals generated by faults, but otherwise, they may not be sufficient for detecting faults more fully [7], and separation of the maximum coefficient of different current phases (A, B, C) was performed to create comparison indicators to discriminate between external and internal faults.
Recent years have seen the popularity of artificial neural networks (ANNs) as a technique for fault classification based on artificial intelligence [8], due to their ability to produce accurate results. Irrespective of its general adoption, however, this technology presents numerous drawbacks: first, ANNs cannot be set using accurate rules, and second, the pattern learning process is extensive and time consuming. Further, the topology of this technology may be exposed to changes, especially when used in large, real power systems [9]. The ANN method does not serve to protect diverse power systems; rather, it is designed to protect a single or specific power system. This approach is also used in protecting against turn–turn faults; however, the process demands that data from numerous fault cases be used to train the neurons. The process may also demand increased computation and memory space. As an alternative, wavelet transform (WT) may be used to define the differences between internal faults and other disturbances [10]. The use of the wavelength function in advancing transformer protection has attracted considerable scholarly attention and has been presented in articles, such as [11,12]. A range of scholars have also sought to establish techniques that use both ANN and WT, as in concepts presented in [13]. The WT technique is an arithmetical mean that indicates signal levels based on changes in frequency with time. In some cases, WT may be defined as an extension of Fourier analysis and is adopted during signal extraction through the decomposition of low and high-frequency bands [14]. The coefficients of wavelengths based on frequency bands are affected by changes in both specific harmonics and fundamentals derived from the required signal. Moreover, noise affects these coefficients when they are at a high level of detail [15]. It is crucial to acknowledge that the WT signal features in such cases are unreliable, especially when noise exists. In addition, the sensitivity of WT to noise and disturbance results in these features demanding long data windows. In methods advocated in [16], wavelet transform may require a minimum of ¼ of the available current waveform cycle. This transform is also subject to the presence of instances of both internal and external faults. The algorithmic nature of the wavelength function may also be advanced using available data originating from trial-and-error processes.
Based on the above, current transformer saturation challenges, which are in most cases a result of faults, may result in the maloperation of detection systems. The primary objective of this article is to establish a framework that enhances the detection of internal faults over short periods. Emphasis is, however, placed on the turn–turn fault, which is considered among the most challenging faults to detect in transformers. IEEE Standard C37.92-2000 proposes a method in which over 10 percent of transformer turns must undergo short circuiting to ensure that changes in terminal current are detected [17]. As a result, an undetectable amount of current will be present when fewer turns are short circuited. This paper presents a method that can detect internal faults within a very short period of time, particularly minor internal faults such as turn–turn faults, which are difficult to detect when triggered with very few turns. Moreover, the proposed method presented in this paper is simple and easy to understand, providing several benefits over other proposals. In addition, it provides reliable results. Essentially, with hybrid techniques, excellent features can be selected for classification tasks that will enhance performance and accuracy. Three different classification algorithms were studied: k-nearest neighbours (KNN), support vector machines (SVM), and artificial neural network (ANN); these were trained using the k-fold cross-validation method. To reduce the number of extracted features, the bees algorithm (BA) and genetic algorithm (GA) were used to compare study-based methods for selecting features.
This paper is presented in six sections. The Section 1 gives an overview of the proposal paper represented in the introduction; the Section 2 presents the steps that were used to collect current signal data in the laboratory as experimental data and use this to inform machine learning to detect faults. The research methodology and model are presented in Section 3. With comparisons, Section 4 presents the results that validate the proposed model. A discussion of the results is presented in Section 5. Finally, Section 6 presents the conclusions of this work. As part of the Section 3, discrete wavelet transforms and orthogonal matching pursuits (OMPs) are used to extract feature information in the time–frequency domain, while in the Section 3, the bees algorithm (BA) and genetic algorithm (GA) are applied to select features. Finally, several methods are examined in the last section, including k-nearest neighbour (KNN), support vector machine (SVM), and artificial neural network (ANN).

2. Materials and Methods

2.1. Description of the Model System

In order to carry out the experiment, the entire system had to be built at Cardiff University’s laboratory and consisted of the following components:
  • Three phase transformer
  • Power supply
  • Three-phase load
  • Six-current transformer with turn ratio of 40/5, rated burden is 1VA and Class 3 FS5
  • Switch relay, OMRON G8P series SPST-NO, 5VDC, 30A
  • Data acquisition (6211) card
  • Power analyser LEM NORMA D 6000
  • LabVIEW software
MATLAB software was used to obtain reliable results to identify normal operation and different types of faults (internal and external). The internal fault is represented by creating turn to turn, turn to the ground, and phase to ground faults, which are applied to a three-phase power transformer. Data for the three-phase current are stored in a file in discrete sampled form. The sample rate at 10 kHz is taken by the LabVIEW program at 10 s, meaning that 10,000 samples and 300 samples per cycle are collected using a DAQ card. All current signals are collected with harmonics, and in order to create an internal fault (turn to turn fault, turn-to-ground fault and phase to ground faults) inside the transformer, taps are positioned in relation to specific turns in the three-phase winding, as shown in Figure 1. Each phase has 60 turns on the primary and 60 turns on the secondary side. Further, 60 v is set as the phase voltage from the supplier at 50 HZ. The cooling parts (oil tank) are ignored because of difficulty in building these in the laboratory, and as they are not considered to affect the method for detecting internal faults. Figure 2 shows a schematic diagram of a lab work system in the form of a schematic diagram.
Laboratory tests gave the same results over three phases, and therefore, this paper shows the results obtained in phase A. Five types of faults in phase A have been chosen with which to apply the proposed method through a simple algorithm, and these are described below.

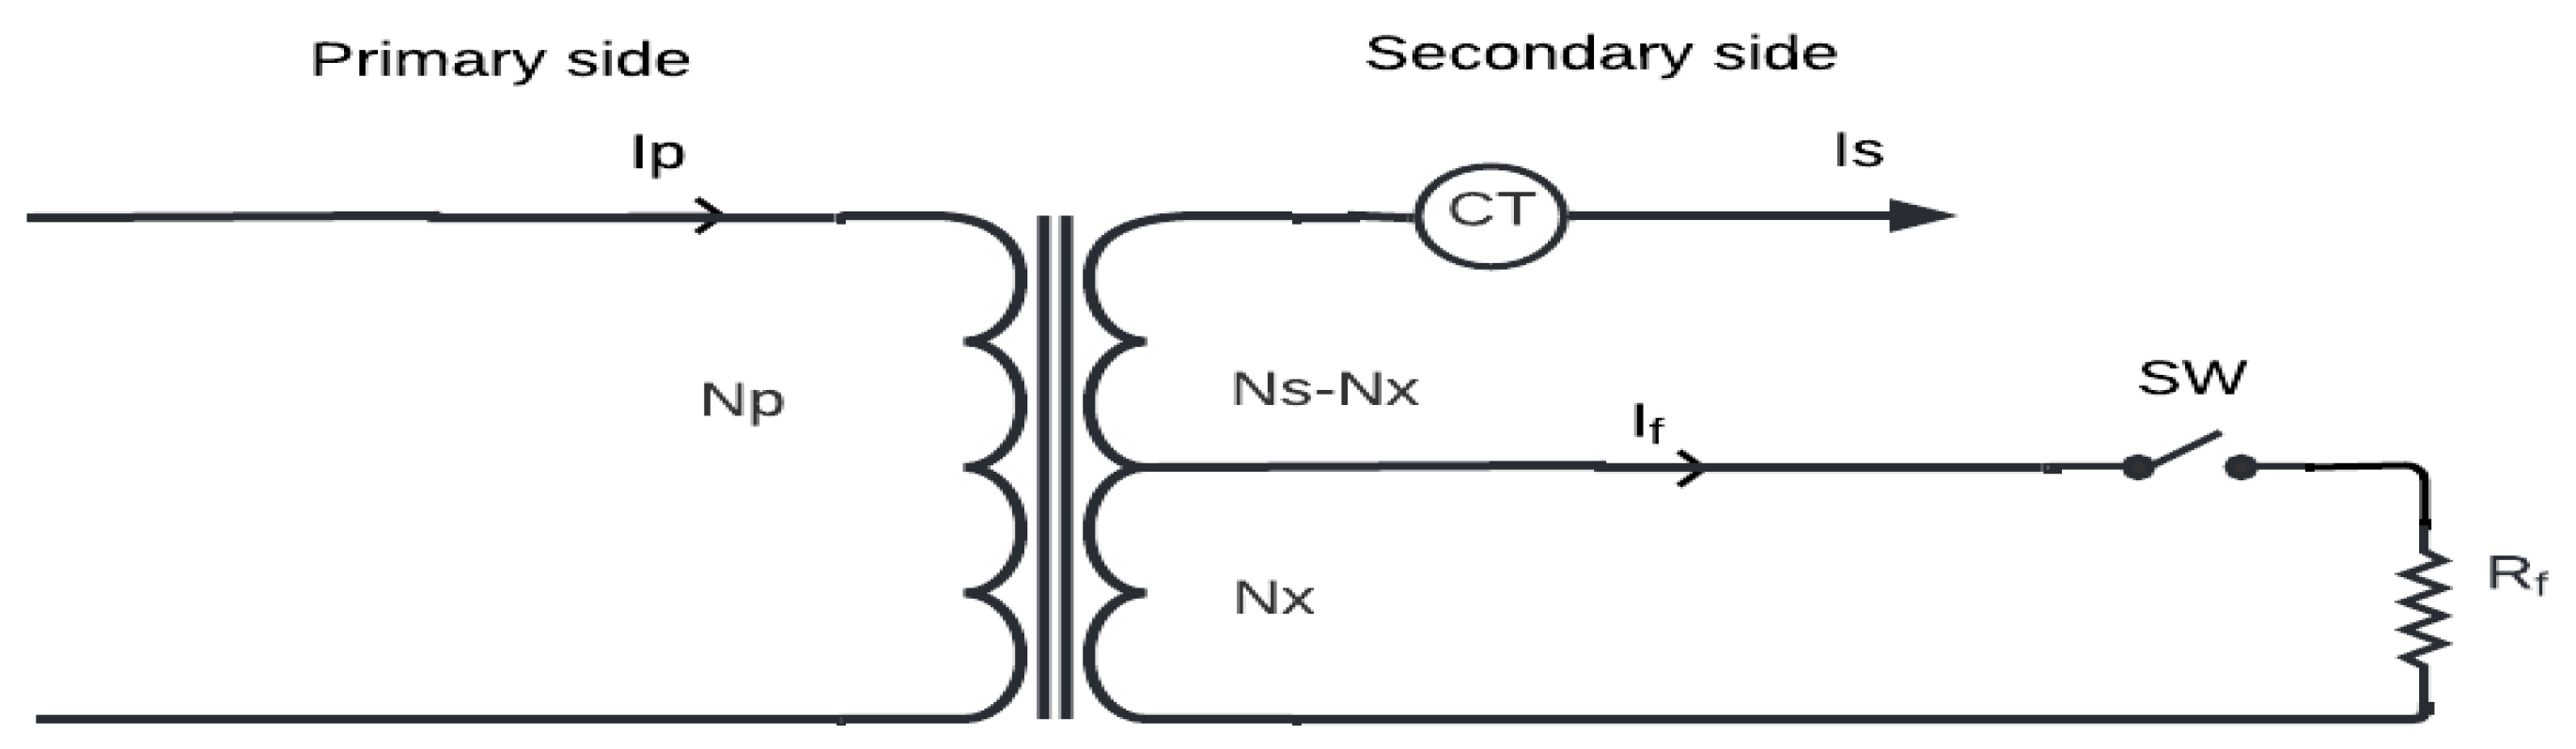
2.2. Turn-to-Turn Fault

Generating the interturn fault is practically possible but unsafe, because the turns to be shorted Nx will be damaged due to very high circulating current in the loop as the scenario in Figure 3 illustrates. Due to the low wire resistance, a high current is created. Therefore, high resistor Rf of 0.2 was put in the loop to reduce the current value flowing through the wires and protect the winding turns from damage caused by the high current. Each turn should have 1 V across it if the turns are identical. Therefore, there will be three V for three rotations. Because the turns were almost equal (manually wrapped around the core limb), 5 turns with a voltage of 5 V and a resistance of 0.2 ohm were added to a wire resistance of around 0.018 computed by
R   = ρ   ×   l A
where R is the wire’s resistance in ohms (Ω), ρ is the material’s resistivity in Ohmmeters (Ωm), l is the wire’s length in meters (m), and A is the wire’s cross-sectional area in square meters (m2). The overall resistance was, therefore, 0.2 + 0.018 = 0.218 Ω. In this situation, the circulating current was 5/0.218 = 22.9 Amp, which was within the manufacture current limit of the employed winding wire of 30 Amp. Closing or opening the switch (SW) may be controlled by LabVIEW software, which creates a pulse signal through data acquisition card to an electro-mechanical relay linked in series with the short circuit’s protection resistor Rf. As seen in Figure 1, this relay was utilized as a switch (SW) to create a short circuit between spins.

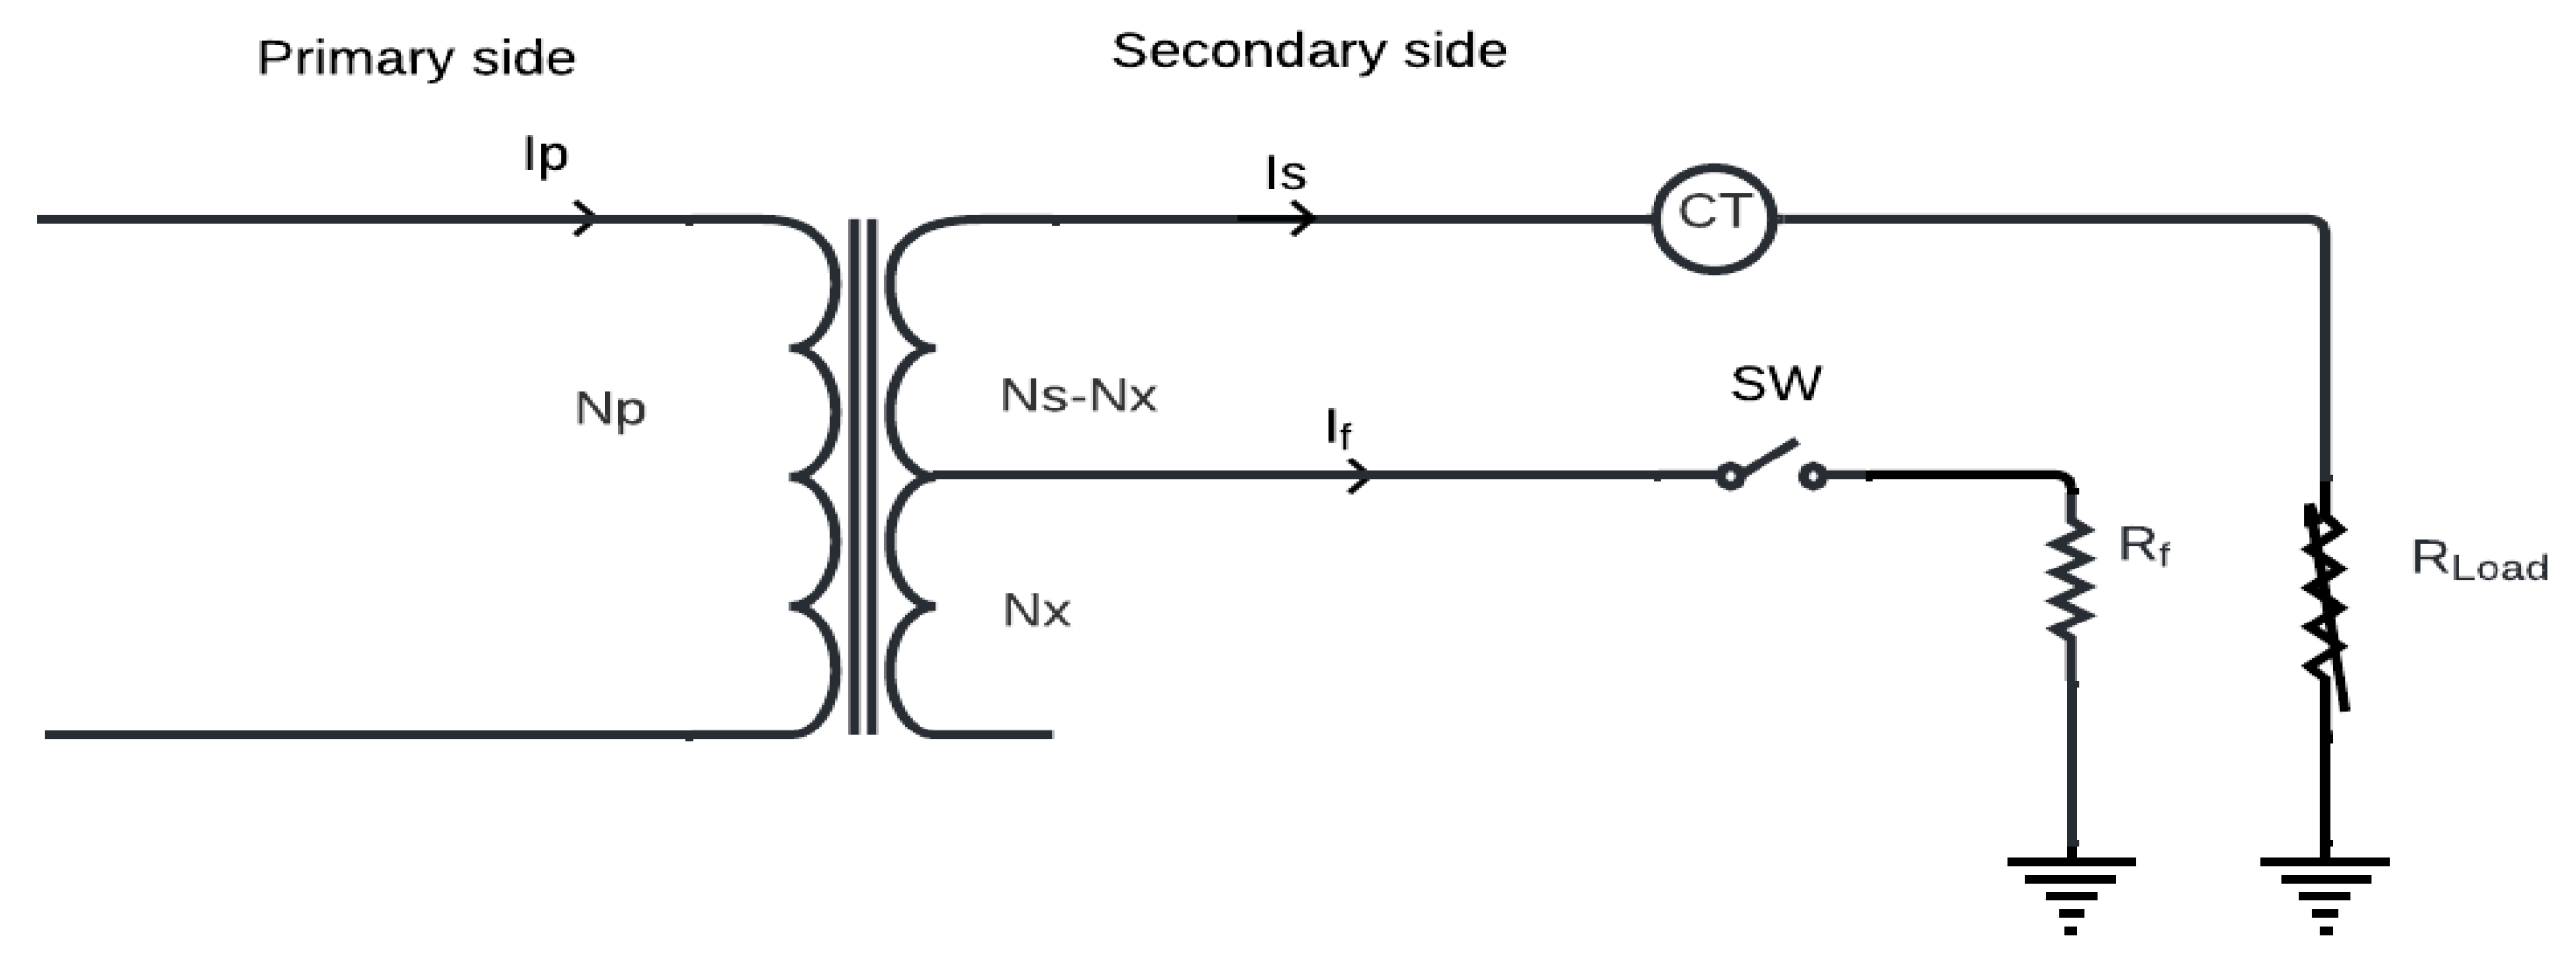
2.3. Turn-to-Ground Fault

On both the primary and secondary sides of the transformer, different turns have been selected to create a turn-to-ground fault in three phases. In this paper, turn 30 on the secondary side of phase A is shown. To reduce the high current that would pass from turn 30 to the ground, a resistor (5 Ω) was connected in series via tap number 30 to the ground. The turns should have the same voltage. As a result, 30 turns will result in a voltage of 30 volts, and the wire resistance will be 0.018 Ω, so the current will be 30/0.018 = 1667 amp. Due to the current, the winding will burn, so a resistor reduced the current to 30/5.018 = 5.96 Amp, which will prevent the winding from being damaged as the current passes virtually to the ground when there is a fault on the primary side. However, Figure 4 demonstrates how this scenario might be represented and how this error was performed in the lab.

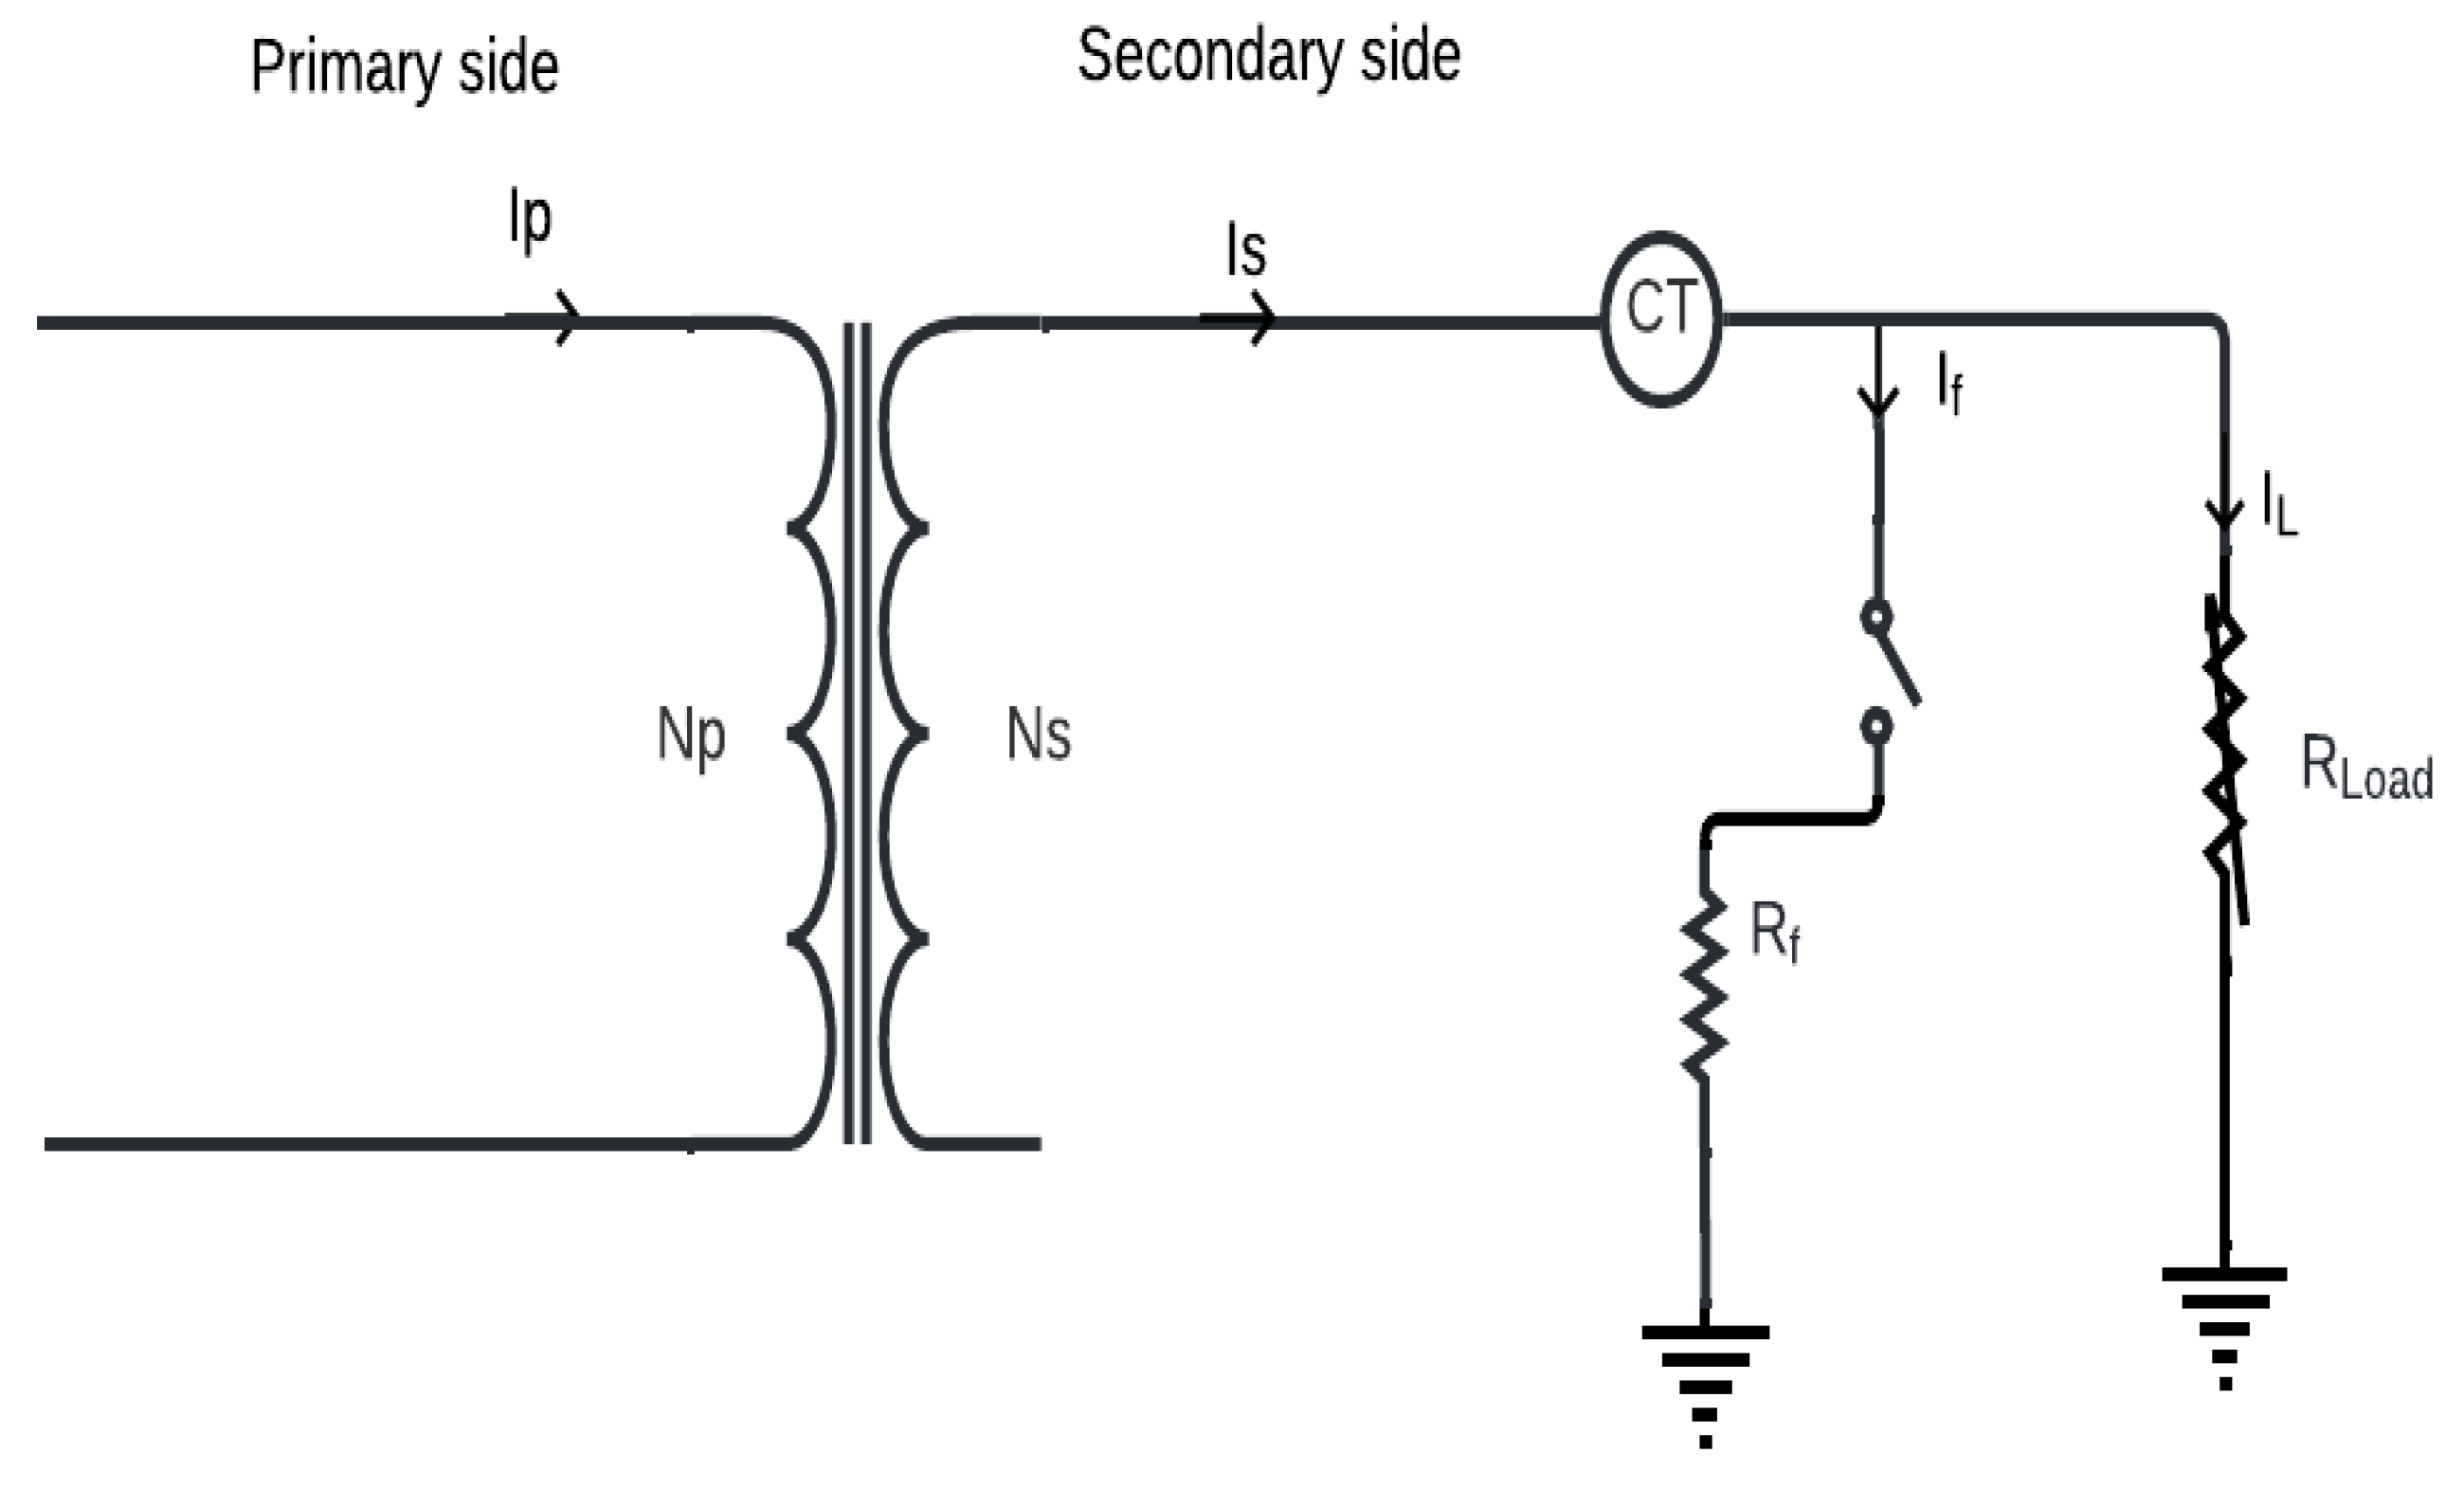
2.4. Phase-to-Ground Fault

This fault was caused through the connection of the first turn to the ground via Rf of 5 Ω (representing a ground and fault resistance). As it affects the whole phase, it is similar to turn–ground fault current; however, it is the highest fault current. Due to the lower resistance in the fault branch, the phase voltage is supposed to be extremely reduced when it is generated on the primary side, rather than the high resistance of the winding where it is generated. Only a small current continued to flow through the fault branch. Phase voltage was reduced to approximately 44 V because of Rf. CTs on primary sides measure primary current Ip, which is the sum of fault current If and winding current I. Due to the extremely low resistance of the fault branch, this current is normally high, so the protection resistor was used to reduce it to 12 amps. As shown in Figure 5, the current that flowed through the load IL was very small when the fault was generated on the secondary side. Rather, most of the current flowed through the fault branch. On the secondary side, the CT measured only the inductive load.

2.5. Phase–Phase Fault

Using a fault resistor of 5 Ω, phases A and B were connected to produce this type of fault. As a result of this fault, the primary current of phase A increased in the same direction as the secondary current, while the primary current of phase B increased in the opposite direction.

2.6. External Fault

Outside of the transformer’s protected zone, there is an external fault. It is located between the transformer’s load and secondary side. The CT on the secondary side measures the secondary current Is, as illustrated in Figure 6. Once the switch was closed, the phase voltage dropped from 60 V to approximately 20 V, causing the secondary current Is to jump to around 5 Amp (Vf = VL). Is divided into high and low fault currents. If 3.98 Amp flowed through a fault resistor Rf of 5 with a low resistance and a low load current IL of 1 Amp ran through a greater resistance load RLoad, Is = IL + IF = 3.98 + 1 = 4.98 Amp.

3. Research Methodology

3.1. Feature Extraction

Defect detection and monitoring of mechanical equipment is one of the most challenging tasks. In this study, discrete wavelet transform and orthogonal matching pursuit were used to extract features using MATLAB simulation software version R2021a, and 1-D for OMP and 1-D wavelet for DWT. In this paper, DWT and OMP are combined to extract phase differences. DWT is employed to decompose the initial phase difference. In the next step, we use the OMP pursuit method to reconstruct the phase difference using the usable components. Based on experimental results, high-frequency noise components are known to cause errors in the reconstruction results. This strategy has been shown to reduce this type of error [18].

3.1.1. Discrete Wavelet Transform

There are several types of wavelet transforms, including the discrete wavelet transform. It is a signal-processing method that analyses the raw signal in the time–frequency domain [19]. DWT is based on sub-band coding; therefore, DWT provides a faster analysis than the continuous wavelet transforms. Furthermore, DWT provides a time-scale representation of a digital signal through the use of digital filtering techniques. In other words, the signal analysis method entails passing a signal through filters with various cut-off frequencies at various scales. DWT has recently proven its ability to extract initial characteristics in numerous applications of three-phase power transformer current failure detection among the various types of wavelet transforms [20]. According to Figure 7, in order to decompose wavelets at n levels of decomposition, the approximation signal is analysed at each level, and this is repeated until level n is achieved. Wavelet decomposition consists of decomposing the signal into two parts: approximation A1 and detail D1. Decomposition of A1 at the second level further breaks it down into A2 and D2, as part of the decomposition process. The decomposition process continues until the desired level N is reached A n , D n .
DWT is an efficient method, as mentioned earlier, due to its excellent decorrelation property. However, it has some drawbacks. The majority of the drawbacks for DWT are the mother wavelet selection [21]. In this study, five mother wavelets [22] (db7, sym3, coif4, bior6.8, and rbior6.8) were used for achieving the optimal performance process of DWT. MATLAB simulation codes have been implemented to analyse the current signals. A six-level decomposition was carried out. In the time–frequency domain, thirty features were retrieved, using all of the suggested five-mother wavelets independently. The proposed datasets are built using these data.

3.1.2. Orthogonal Matching Pursuit

An orthogonal matching pursuit (OMP) technique is used to reconstruct a high-dimensional sparse signal based on a few noisy linear measurements. The OMP algorithm selects the column with the highest correlation with the current residuals at each stage using iterative greedy optimization. Essentially, OMP consists of combining multiple basis functions and feature waveforms to produce an overly complete vocabulary of atoms. During a process of gradual iteration, the optimal atom is found to match the vibration signal. To achieve a global optimal solution in each iteration, the atoms chosen must be orthogonal. By projecting the signal in the space created by the processed atoms, the component and residue on the atoms are determined. To obtain the global optimal solution, it is necessary to ensure that the leftover signals are orthogonal to all of the selected atoms. OMP can be described as follows [23].
MATLAB simulation represented five different scenarios (Sym4-Lev5, Wpsym4-Lev5, Dct, Sin, and Cos) for processing all current data signals from phase A. These are, respectively, symmetric wavelets with five levels and four vanished moments, wavelet packet-based symmetric with four vanished moments and five levels, discrete cosine transforms, sine sub dictionary, and cosine sub dictionary. For the simulation, several OMP parameters were carefully chosen, including a maximum iteration level of 100 and a maximum relative error of 0.01 percent. As shown in the codes below, this proposed approach includes eight features: mean, median, standard deviation, median absolute deviation, mean absolute deviation, L1 norm, L2 norm, and maximal norm.
Mean   μ = 1 N 1 N X i
Mean   med = 1 2 ( X [ ( N + 1 ) 2 ] ) + X ( [ N 2 ] 1 ) )
Standard   deviation   α = i = 1 N ( X i   μ ) 2 N 1
In the following formula, AD = median (|xi-median(X)|)
Mean   absolute   deviation   σ 2 = i = 1 N ( X i μ ) 2 N 1
L 1   norm   L 1 = i = 1 N X i
L 2   norm   L 2 = i = 1 N | X i | 2
Max   norm L = Max | X i | 2
In this formula, X i is the sampled obtained signal and I = 1, 2, 3, 4, …, n. The absolute value of the L1 standard is equal to its total elements, the square root of its elements’ absolute values is equal to its total components, and the infinite standard is equal to its maximum elements’ absolute value.

3.2. Feature Selection Algorithms

Feature selection is the process used to identify and eliminate irrelevant, low value, and redundant qualities, as well as determine the most appropriate inputs into a classification model.

3.2.1. Bees Algorithm

In 2006, Pham created a new algorithm called ’bees’. The bees algorithm is a form of bee-inspired algorithm that is related to swarm intelligence, as well as computational intelligence and metaheuristics in general. The strategy is frequently used to identify an optimal answer while avoiding problems with local optima. Because it combines neighbourhood search and random search in a unique way, this technique is excellent for combinatorial and functional optimizations and the BA is simple to implement and it is efficient in finding the best solutions [24]. Appendix A shows the entire procedure for selecting features for BA-based analysis.

3.2.2. Genetic Algorithm

Developed by Holland in 1995, the genetic-algorithm-based features selection approach achieves a balance between computational cost and optimal selection using a heuristic search. This method can be easily parallelized in a computer cluster and can handle tons of data without the need for any previous knowledge of the project [25]. Appendix B summarizes the entire procedure for selecting features for GA-based analysis.

3.3. Classification Techniques

Various classification methods are illustrated in this section, being thoroughly explored in the subsections that follow.

3.3.1. K-Nearest Neighbour

KNN is the most basic machine learning algorithm. Using a similarity function to categorize unknown situations, it employs a correlation technique [26]. A predefined integer (k), which could be real or imaginary, is used to divide the dataset into clusters for training this classifier. As part of the iterative classifier process, the central data point is the centroid of the cluster. As a result of the emerging classifier, a random cluster of clusters is generated and the centroid value is continuously changed until it becomes stable. This model is then used to classify new data [27].

3.3.2. Support Vector Machine

The SVM is another type of classifier commonly used for classification and regression. This algorithm separates datasets into two categories: negative and positive. The proposed dataset is also trained based on statistical learning, which is expressed as a support vector [28]. Based on categorization information, the algorithm constructs the hyperplane. By creating a hyperplane, positives and negatives are spaced optimally. Kernel functions may be used for nonlinear transformations and for SVM when there are separable and non-separable features in a dataset. Multi-feature mappings make a nonlinearly separable object linearly separable [29]. This has been accomplished using linear kernels, polynomial kernels, and Gaussian radial basis functions (RBF).

3.3.3. Artificial Neural Networks

Artificial neural networks have been widely used in the power system protection field since 1994, since this problem falls within the current waveform pattern identification class. An ANN is typically used for pattern recognition, image processing, power quality analysis, and data compression, among other things. The ANN technique’s non-algorithmic parallel-distributed architecture for information processing and the ability to make intelligent decisions are the major advantages over the conventional method. Several recent works have examined the feasibility of applying ANN to protect power transformers [30]. It is critical to note, however, that the ANNs used in this previous study were taught for a specific transformer system and would need to be retrained. In addition, the algorithms used for feature extraction are based on either the time or frequency domain signals, rather than both, which is critical for accurately distinguishing between an internal fault and an inrush current [31].

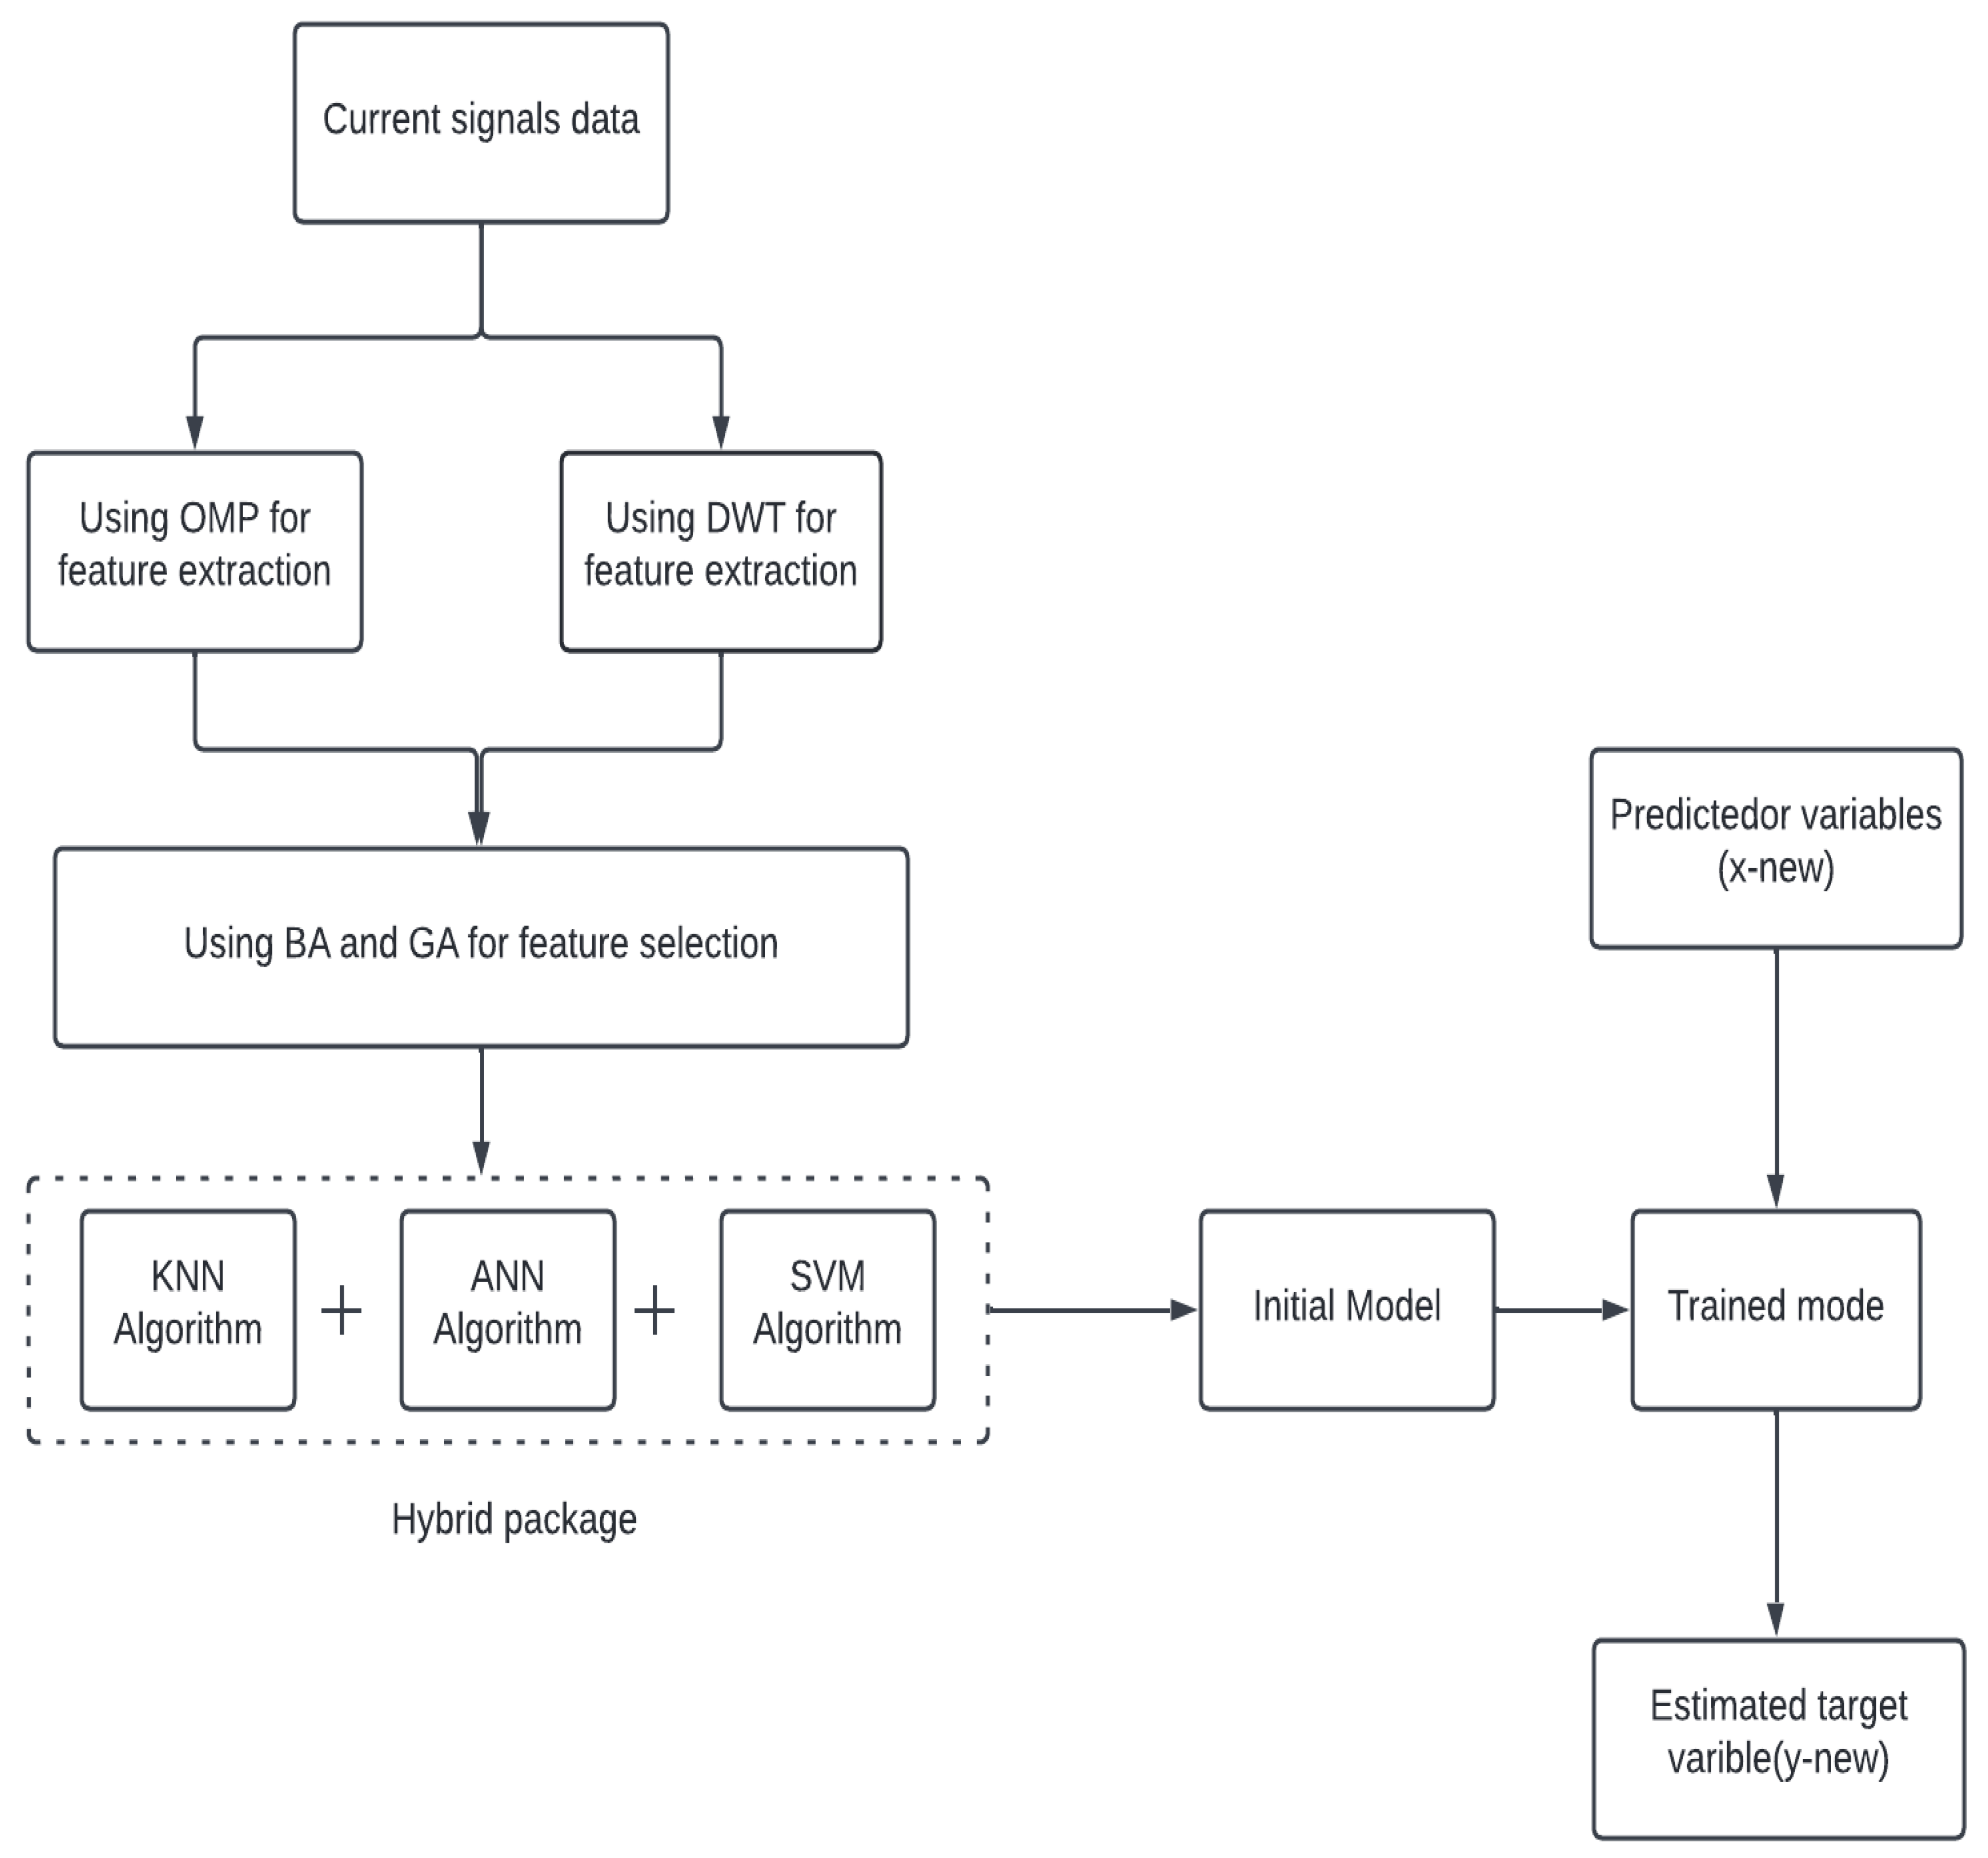
3.4. Proposed Method

Figure 8 shows a flow chart illustrating the major steps of the proposed application as they will be applied to carry out this project. To create a large dataset, the current signal and vibration signal are captured using specialized sensors under various operating situations. For each signal collected, OMP and DWT are used to retrieve features. It is crucial to determine the right number of discriminative features, as too many features can result in too much noise, whereas too few can lead to lost information. The computational complexity of classification algorithms is excessive when they use many features unless certain methods for reducing data dimensionality are employed before classification. Thus, this research proposes BA-based feature selection to reduce data dimensionality by utilizing the acquired feature matrix for discriminant feature selection. Furthermore, GA is also used to compare results to those of BA. The fitness function of these methods is based on the classification error of the KNN algorithm (K = 3).
In order to classify faults, the feature matrix obtained through the feature selection process is input into three classifiers using machine learning. The classifiers are then trained using cross validation. The training was repeated five and ten times with cross-validation techniques to fine tune the model and ensure consistency in the results.

3.5. Assessment of the Model

The model’s robustness was assessed using a variety of performance criteria, being evaluated using the F1-score, specificity, overall accuracy, prediction, and sensitivity. In addition to the F1-score, specificity and accuracy indicate the performance of the model in terms of class assignment. As a positive class, precision and sensitivity measure how appropriate the model’s error type is.

4. Results

The proposed application is evaluated in this section based on current signal experimental data. By feeding the obtained signals to the classification algorithms with the extracted features used in conjunction with the proposed strategy for selecting discriminative features, the fault detection procedure is improved. Instead of fourteen features, the bees algorithm (BA) selected twelve features with the best cost, 0.083, for building the final feature matrix when the current signal was applied, as shown in Figure 9.
To compare the performance and superiority of the bees algorithm technique, a similar test was run using the genetic algorithm. The original features were replaced with twenty-one features on the basis of the implementation of GA using transformer current data. According to Table 1, BA selected 12 features based on the loss curve shown in Figure 9. GA selected 21 features based on the signal. A display of the classification results using feature selection based on BA and GA is shown in Table 2a,b and Table 3a,b.
In the following two steps, three machine learning algorithms, KNN, SVM, and ANN, were used for classifying the optimum feature sets selected by the BA and GA into their respective classes. The best parameters for KNN, SVM, and ANN are neighbour = 1, C = 20, and kernel = RBF. During the study, specificity, accuracy, sensitivity, prediction, and F1-scores were measured for each classifier.
When training the model using 10-fold cross validation, the support vector machine (SVM) achieved the highest classification accuracy, which was 96% using the genetic algorithm. When the model was trained with 5-fold cross validation, it was 93%. Additionally, the accuracy of the classification using the ANN classifier was 0.62% and improved to be 0.76% by using 5-fold cross validation. Furthermore, Table 2 and Table 3 show that 10-fold cross validation gave improved results for both BA and GA when compared to 5-fold cross validation.
When combined with SVM and KNN classifiers, BA produced improved results for all metric measurements. BA-ANN and BA-KNN, on the other hand, can produce identical sensitivity results and greater classification accuracy for the same data. Consequently, GA–SVM outperformed BA–SVM in terms of accuracy, sensitivity, and F1-score measures.

5. Discussion

The findings of this study indicate that the proposed fault classification model, which can be generated using current signals, has a superior performance when compared to other approaches. In a classification model, bees algorithms and genetic algorithms are essential for feature selection, as they reduce data dimensionality while simultaneously decreasing computational complexity. In comparison to GA, BA selected fewer features than GA, leading to greater classification accuracy. Furthermore, the ANN classifier outperformed the KNN and SVM classifiers in most cases in determining the correct class. Additionally, applying a 10-fold cross-validation strategy to train the proposed models could enhance classification accuracy.

6. Conclusions

This paper presented a novel hybrid model, which diagnoses faults in a three-phase power transformer and demonstrated its application. Algorithms were applied to optimise selection of discriminating features and, thus, enhance fault detection performance, and a comparison of the number of features assessed was made. The proposed application’s performance was enhanced by some optimization-algorithm-based selection of the discriminative features. A comparison was made with the number of executed features based on the model. A cross-validation strategy was used to train three machine learning classifiers to detect the faults that may happen in a three-phase transformer. To investigate the robustness of the proposed model, the simulations of different cases of the transformer with healthy and faulty conditions were applied. Concerning the time–frequency domain, discrete wavelet transform and orthogonal matching pursuit were applied to recover 40 distinct features per signal, and the volume of necessary data was reduced by using the bees algorithm; 12 features of the current signal were chosen, while the genetic algorithm selected 21. For fault-type detection, the study applied three machine learning classifier approaches, ANN, SVM and KNN, training these in fault diagnosis based on the features selected, and 10-fold cross validation was applied. The classifiers were found to be satisfactorily accurate, a result that points to the potential of the proposed model for use in fault detection and classification. The model was validated for effectiveness by comparing optimization-algorithm-based feature selection performed on the same dataset. The findings of this comparison show that the proposed strategies with fewer statistical features give comparatively more accurate results, and that the bees algorithm gave greater total accuracy while selecting fewer features. When BA was combined with an SVM classifier, maximal accuracy (0.96%) in fault classification was seen at high accuracy on evaluation.

Author Contributions

O.A., F.A. and M.P. contributed equally to the conception of the idea; collecting data, O.A. analysing experimental results, O.A. investigating, O.A.; writing—original draft preparation, O.A.; writing—review and editing A.I., F.A. and M.P. All authors have read and agreed to the published version of the manuscript.

Funding

This paper is part of the Ph.D. research of the corresponding author, Othman Abdusalam, who is sponsored by the Ministry of Higher Education in Libya.

Institutional Review Board Statement

Not applicable.

Informed Consent Statement

Not applicable.

Data Availability Statement

Not applicable.

Acknowledgments

The authors would like to thank Cardiff University/School of Engineering for accepting to pay the APC towards publishing this paper.

Conflicts of Interest

The authors declare no conflict of interest.

Appendix A

  • Initialise population with random solutions.
  • Evaluate fitness of the population.
  • While (stopping criterion not met)//forming new population.
  • Select elite bees.
  • Select sites for neighbourhood search.
  • Recruit bees for selected sites (more bees for best e sites) and evaluate fitness.
  • Select the fittest bee from each patch.
  • Assign remaining bees to search randomly and evaluate their fitness.
  • End while.
  • Best features subset
Figure A1. A flow chart of bees algorithm optimization.
Energies 15 03905 g0a1

Appendix B

Feature selection using a genetic algorithm (GA) is divided into the following steps:
  • With the feature vector, produce the initial population.
  • For a successful application, choose a suitable evaluation functions.
  • Indicates whether reproduction is possible. Only the fittest individuals will inherit the best qualities.
  • The crossover stage of simulated mating results in a generation that combines the best features from both parents.
  • During reproduction, each child undergoes a mutation operation based on its genes. As a result, the children inherit the best characteristics of their parents.
  • Once all the requirements are satisfied, the process is repeated with a newer population sector. As soon as the population reaches a maximum number of generations or the population reaches the optimal solution, the algorithm will stop.
Figure A2. A flow chart of genetic algorithm optimization.
Energies 15 03905 g0a2

References

  1. Horowitz, S.; Phadke, A. Power System Relaying; Research Studies Press: Somerset, UK, 1992. [Google Scholar]
  2. Faiz, J.; Heydarabadi, R. Diagnosing power transformers faults. Russ. Electr. Eng. 2014, 85, 785–793. [Google Scholar] [CrossRef]
  3. Sidhu, T.; Sachdev, M. Online identification of magnetizing inrush and internal faults in three-phase transformers. IEEE Trans. Power Deliv. 1992, 7, 1885–1891. [Google Scholar] [CrossRef]
  4. Phadke, A.; Thorp, J. A new computer-based flux-restrained current differential relay for power transformer protection. IEEE Trans. Power App. Syst. 1983, 11, 3624–3629. [Google Scholar] [CrossRef]
  5. Bastard, P.; Bertrand, P.; Meunier, M. A transformer model for winding fault studies. IEEE Trans. Power Deliv. 1994, 9, 690–699. [Google Scholar] [CrossRef]
  6. Gafoor, S.A.; Rao, P.R. Wavelet based fault detection, classify cation and location in transmission lines. In Proceedings of the 2006 IEEE International Power and Energy Conference, Putra Jaya, Malaysia, 28–29 November 2006; pp. 114–118. [Google Scholar]
  7. Rao, M.; Singh, B. Detection and localization of interturn fault in the HV winding of a power transformer using wavelets. IEEE Trans. Dielectr. Electr. Insul. 2001, 8, 652–657. [Google Scholar] [CrossRef]
  8. Bastard, P.; Meunier, M.; Regal, H. Neural network-based algorithm for power transformer differential relays. IEE Proc. Gener. Transm. Distrib. 1995, 142, 386–392. [Google Scholar] [CrossRef]
  9. Pihler, J.; Grcar, B.; Dolinar, D. Improved operation of power transformer protection using artificial neural network. IEEE Trans. Power Deliv. 1997, 12, 1128–1136. [Google Scholar] [CrossRef]
  10. Eissa, M.M. A Novel Digital Directional Transformer Protection Technique Based on Wavelet Packet. IEEE Trans. Power Deliv. 2005, 20, 1830–1836. [Google Scholar] [CrossRef]
  11. Jettanasen, C.; Pothisarn, J.; Klomjit, J.; Ngaopitakkul, A. Discriminating among inrush current, external fault and internal fault in power transformer using low frequency components comparison of DWT. In Proceedings of the 2012 15th International Conference on Electrical Machines and Systems (ICEMS), Sapporo, Japan, 21–24 October 2012; pp. 1–6. [Google Scholar]
  12. Ngaopitakkul, A.; Kunakorn, A.; Ngamroo, I. Discrimination between external short circuits and internal faults in transformer windings using discrete wavelet transforms. In Proceedings of the Fourtieth IAS Annual Meeting. Conference Record of the 2005 Industry Applications Conference, Hong Kong, China, 2–6 October 2005; Volume 1, pp. 448–452. [Google Scholar] [CrossRef]
  13. Ngaopitakkul, A.; Kunakorn, A. Internal fault classification in transformer windings using combination of discrete wavelet transforms and back-propagation neural networks. Int. J. Control Autom. Syst. 2006, 4, 365–371. [Google Scholar]
  14. Jettanasen, C.; Klomjit, J.; Positharn, C.; Bunjongjit, S.; Ngaopitakkul, A. Differential protection schemes for classification of fault detection between external fault and internal winding fault in transformer using probabilistic neural network. In Proceedings of the 2012 International conference on Fuzzy Theory and Its Applications (iFUZZY2012), Taichung, Taiwan, 16–18 November 2012; pp. 150–153. [Google Scholar] [CrossRef]
  15. Snedecor, G.W.; Cochran, W.G. The Sample Correlation Coefficient r and Properties of r. In 10.1–10.2 in Statistical Methods, 7th ed.; Iowa State Press: Ames, IA, USA, 1980; pp. 175–178. [Google Scholar]
  16. Spiegel, M.R. Correlation theory. In Theory and Problems of Probability and Statistics, 2nd ed.; Mcgraw-Hill: New York, NY, USA, 1992; pp. 294–323. [Google Scholar]
  17. Lü, S.-S.; Jiang, M.-S.; Su, C.-H.; Zhang, L.; Zhang, F.-Y.; Sui, Q.-M.; Jia, L. Novel phase difference extraction method of FPP system based on DWT and OMP algorithm. Optoelectron. Lett. 2020, 16, 131–136. [Google Scholar] [CrossRef]
  18. Singh, M.; Shaik, A.G. Broken Rotor Bar Fault Diagnosis of a Three-phase Induction Motor using Discrete Wavelet Transform. In Proceedings of the 2019 IEEE PES GTD Grand International Conference and Exposition Asia (GTD Asia), Bangkok, Thailand, 19–23 March 2019; pp. 13–17. [Google Scholar] [CrossRef]
  19. IEEE Standard C37.91-2000; IEEE Guide for Protective Relay Applications to Power Transformers. IEEE: Piscataway, NJ, USA, 2000.
  20. Chen, J.; Li, Z.; Pan, J.; Chen, G.; Zi, Y.; Yuan, J.; Chen, B.; He, Z. Wavelet transform based on inner product in fault diagnosis of rotating machinery: A review. Mech. Syst. Signal Process. 2015, 70–71, 1–35. [Google Scholar] [CrossRef]
  21. Subasi, A. Classification of EMG signals using PSO optimized SVM for diagnosis of neuromuscular disorders. Comput. Biol. Med. 2013, 43, 576–586. [Google Scholar] [CrossRef] [PubMed]
  22. Bontempo, R.N.; Bottom, W.P.; Weberp, E.U. Asynchronous motor cage fault detection through electromagnetic torque measurement. Eur. Trans. Electr. Power 1997, 17, 529–555. [Google Scholar]
  23. Elasha, F.; Greaves, M.; Mba, D.; Addali, A. Application of Acoustic Emission in Diagnostic of Bearing Faults within a Helicopter Gearbox. Procedia CIRP 2015, 38, 30–36. [Google Scholar] [CrossRef] [Green Version]
  24. Pham, D.T.; Castellani, M. A comparative study of the Bees Algorithm as a tool for function optimisation. Cogent Eng. 2015, 2, 1091540. [Google Scholar] [CrossRef]
  25. Boqiang, X.; Heming, L.; Liling, S. Feature signal extraction of inter-turn short circuit fault in stator windings of induction motors. In Proceedings of the 2002 IEEE International Conference on Industrial Technology, Bangkok, Thailand, 11–14 December 2002; Volume 1, pp. 97–100. [Google Scholar]
  26. Islam, R.; Khan, S.A.; Kim, J.M. Discriminant Feature Distribution Analysis-Based Hybrid Feature Selection for Online Bearing Fault Diagnosis in Induction Motors. J. Sens. 2016, 2016, 7145715. [Google Scholar] [CrossRef]
  27. Meyer, H.; Kühnlein, M.; Appelhans, T.; Nauss, T. Comparison of four machine learning algorithms for their applicability in satellite-based optical rainfall retrievals. Atmos. Res. 2016, 169, 424–433. [Google Scholar] [CrossRef]
  28. Fawzy, H.; Rady, E.H.A.; Fattah, A.M.A. Comparison between support vector machines and k-nearest neighbor for time series forecasting. J. Math. Comput. Sci. 2020, 10, 2342–2359. [Google Scholar]
  29. Seshadrinath, J.; Singh, B.; Panigrahi, B.K. Investigation of vibration signatures for multiple fault diagnosis in variable frequency drives using complex wavelets. IEEE Trans. Power Electron. 2014, 29, 936–945. [Google Scholar] [CrossRef]
  30. Moravej, Z. Evolving Neural Nets for Protection and Condition Monitoring of Power Transformer. Electr. Power Compon. Syst. 2005, 33, 1229–1236. [Google Scholar] [CrossRef]
  31. Yu, J.; Zhang, Z. Fault Diagnosis of Transformer Based on RBF Neural Network. Appl. Mech. Mater. 2014, 571–572, 201–204. [Google Scholar] [CrossRef]
Figure 1. Schematic of the system in the lab.
Energies 15 03905 g001
Figure 2. Schematic diagram of lab work system.
Energies 15 03905 g002
Figure 3. Turn-to-Turn fault representation.
Energies 15 03905 g003
Figure 4. Turn–ground fault representation.
Energies 15 03905 g004
Figure 5. Single phase-to-ground fault representation.
Energies 15 03905 g005
Figure 6. External fault representation.
Energies 15 03905 g006
Figure 7. Discrete wavelet decomposition process.
Energies 15 03905 g007
Figure 8. Flow chart for proposal method.
Energies 15 03905 g008
Figure 9. Loss curves of bees and genetic algorithm.
Energies 15 03905 g009
Table 1. Number of selected features.
AlgorithmsCurrent Signal Data
BA12
GA21
Table 2. (a) Results of 5-fold cross validation with BA. (b) Results of 10-fold cross validation with BA.
5-Fold Cross-ValidationSVMANNKNN (a) 10-FoldCross-ValidationSVMANNKNN (b)
Accuracy0.93%0.62%0.86%Accuracy0.96%0.76%0.93%
Specificity0.97%0.83%0.91%Specificity0.98%0.88%0.91%
Precision0.85%0.58%0.83%Precision0.88%0.74%0.88%
Sensitivity0.85%0.62%0.81%Sensitivity0.87%0.72%0.87%
F1-Score0.77%0.57%0.76%F1-Score0.78%0.64%0.85%
Table 3. (a) Results of 5-fold cross validation with GA. (b) Results of 10-fold cross validation with GA.
5-Fold Cross-ValidationSVMANNKNN (a) 10-FoldCross-ValidationSVMANNKNN (b)
Accuracy0.89%0.59%0.82%Accuracy0.91%0.73%0.85%
Specificity0.86%0.85%0.97%Specificity0.89%0.70%0.84%
Precision0.75%0.64%0.82%Precision0.86%0.69%0.78%
Sensitivity0.87%0.57%0.75%Sensitivity0.77%0.68%0.77%
F1-Score0.87%0.58%0.76%F1-Score0.75%0.71%0.81%
Publisher’s Note: MDPI stays neutral with regard to jurisdictional claims in published maps and institutional affiliations.

