Article

Correlation between the Production of Electricity by Offshore Wind Farms and the Demand for Electricity in Polish Conditions

1
Institute of Electrical Engineering and Electronics, Faculty of Automatic, Robotics and Electrical Engineering, Poznan University of Technology, 3A Piotrowo Street, 60-965 Poznan, Poland
2
Institute of Electrical Power Engineering, Faculty of Environmental Engineering and Energy, Poznan University of Technology, 5 Piotrowo Street, 61-138 Poznan, Poland
*
Author to whom correspondence should be addressed.
Energies 2022, 15(10), 3669; https://doi.org/10.3390/en15103669
Submission received: 23 April 2022 / Revised: 12 May 2022 / Accepted: 15 May 2022 / Published: 17 May 2022
(This article belongs to the Special Issue Renewable Offshore Energies)

Abstract

:
Energy transition forcing a change in the structure of the electricity generation system is a particularly difficult task in countries such as Poland, where the dominant source of energy is fossil fuels. Due to the nature of renewable sources (stochastic and seasonally variable), it is necessary to study their impact on the power system. Much research was conducted on this subject. They consider modelling power systems in terms of dealing with an increasing amount of renewable energy sources, stabilization of electricity generation or environmental aspects. This article examines one of the key sources of future power systems—offshore wind turbines (OWT). The influence of offshore wind sources on the power system in the fields of stability of generation, methods of regulatory strategies, and economics were examined. One of the aspects that are less considered is the correlation of energy production in OWT with energy demand and with generation in other renewable energy sources, especially in the region of the southern Baltic Sea and the distribution of energy demand in countries such as Poland. The key aspect of the research is to fill this gap. The obtained results indicate that the average monthly power generation in OWT is strongly positively correlated with the demand, and the hourly average is positively correlated moderately. Correlation between generation in OWT and photovoltaic sources is very high negative, and between onshore and offshore wind turbines is highly positive. The study indicates that the OWT has a significant potential for the development and replacement of conventional sources, due to the very high capacity and a positive correlation with demand. Moreover, future offshore wind farms can cooperate with photovoltaic sources as these sources complement each other. On the other hand, a significant saturation of the system with offshore and onshore wind sources may pose a threat to the power system due to their positive correlation.

1. Introduction

The demand for electricity in Poland is constantly growing. Forecasts contained in government documents indicate that this growth will continue and between 2019 and 2040 the demand will increase by over 20% [1,2]. The peak power demand will also increase. In recent years, the distribution of energy demand in individual months of the year has also been changing. More and more energy is consumed in the summer, which narrows the difference between summer and winter [3]. This shift is driven in large part by the increasing use of air conditioning and the development of data management centres that require efficient HVAC systems [4].
Polish electricity generation is one of the most coal-dependent in Europe. According to the data of the transmission network operator in Poland, in 2020 over 71% of the energy generated in Poland came from professional hard coal and lignite power plants [3]. Due to the need to decarbonise the energy sector, there is a need to replace carbon sources with zero-emission sources. One of the sources with the greatest potential is offshore wind farms (OWF). The maximum potential in terms of Polish OWF is estimated at 28 GW [5]. However, this would require the use of areas of the Baltic Sea that are so deep that only floating farms can be built there. For this reason, Flaszyński et al. estimate the theoretical potential at the level of 18 GW [6], and government documents provide for the development of 11 GW by 2040 [1], which corresponds to over 22% of the installed capacity in the Polish system in 2020. Despite the fact that there is a great potential in OWF in Poland, there is no OWF constructed at the moment. Most developed projects have now been in the phase of choosing the turbines. The projects that have been developing in Poland will be located on two banks: Słupsk Bank and Middle Bank [7].
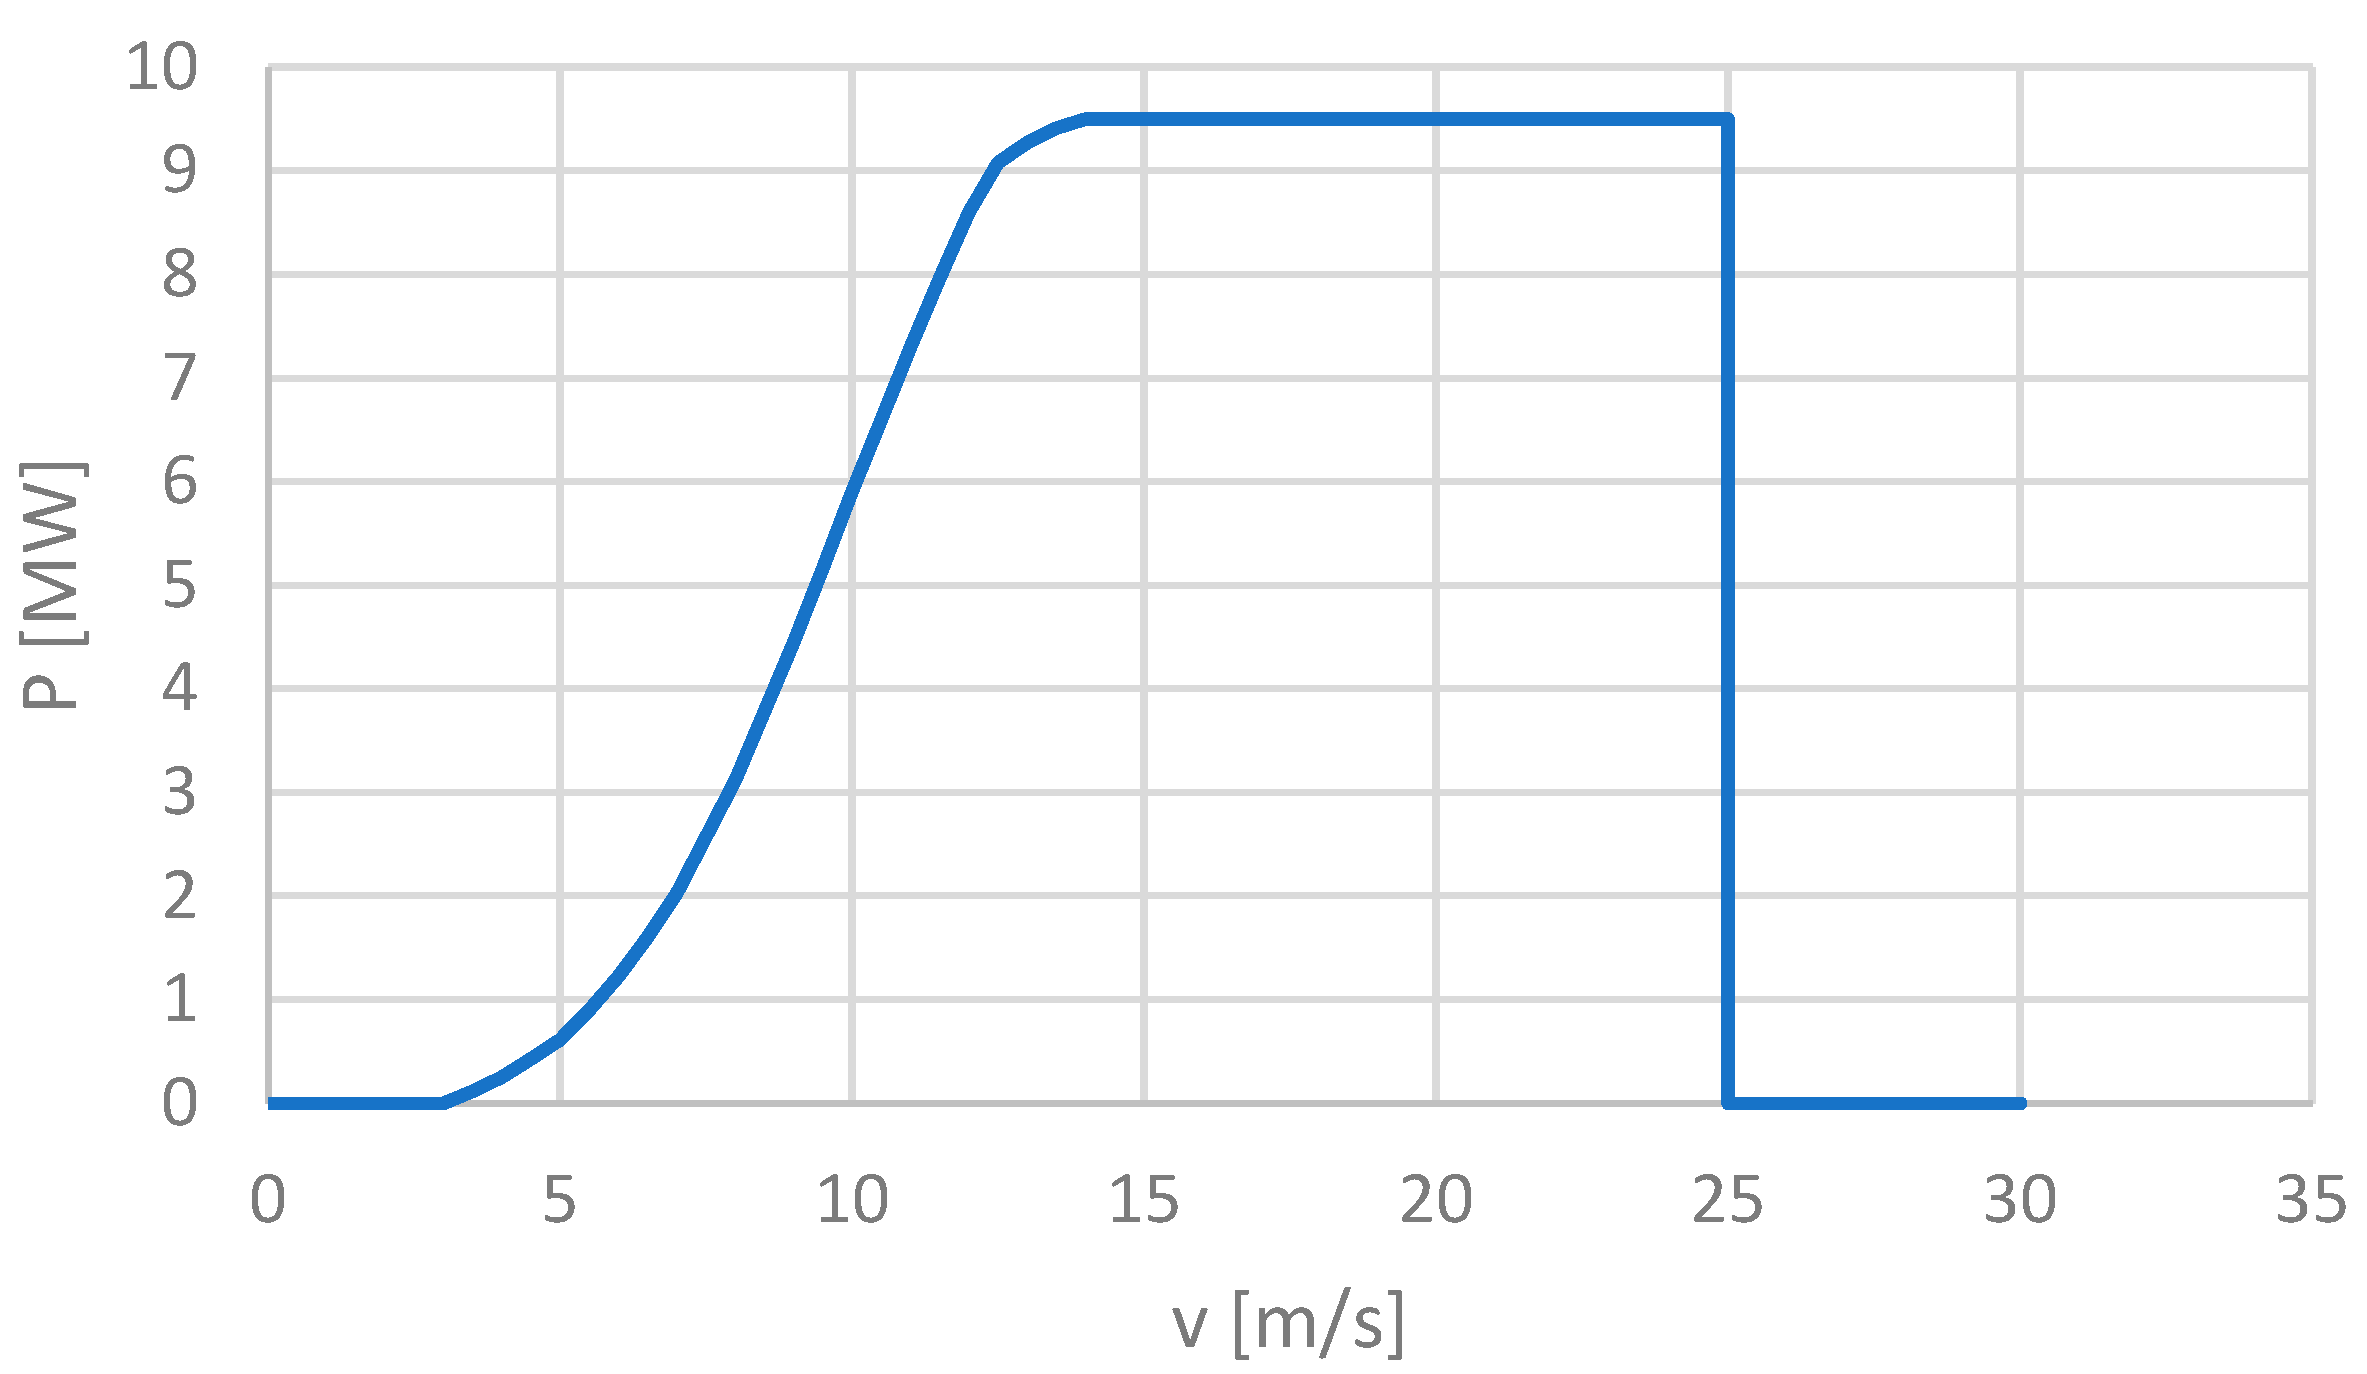
OWF is characterized by higher energy generation and stability than onshore farms. They also use other types of turbines (OWT). OWT has higher rated powers, larger diameters of the circle delineated by the rotor blades and are most often higher than shore-based turbines [8,9]. Due to higher wind speeds at the sea, OWT is sometimes designed to operate at wind speeds greater than 25 m/s, which is the limit value for onshore turbines [10]. However, they are much more expensive and more complicated in design and implementation than onshore turbines.
Despite their advantages, OWFs are stochastic and seasonally variable sources. Therefore, it is necessary to determine their impact on the country’s power system, as they will constitute a significant part of the system. An important aspect of the OWF’s work, which receives less attention, is the correlation of generation with energy demand. This is important due to the fact that different areas are characterized by different daily, monthly and inter-annual variability [11]. OWF can both contribute to covering the demand and reducing the dependence of generation on sources emitting CO2 (in the case of a high positive correlation with the demand), and cause in-demand valleys, where it will be necessary to switch off conventional units, and in peaks, it will be necessary to restart them (with a negative correlation).
The above considerations were the basis for the analysis of literature reports indicating several trends in research related to the use of renewable energy sources, in particular OWF.
The first of these trends is the modelling of RES systems. In this area, dos Santos et al. [12] point to the necessity to analyze power flows in power grids and to build models of these grids for the purpose of forecasting their further expansion. In turn, Zhang et al. [13] show the effectiveness of using multi-objective optimization as a method to improve the efficiency of using electricity generated by OWF. The work of Zhao et al. [14] concerns model studies of the use of nuclear and wind power plants in the power system so that by deploying new wind farms (WF) it is possible to gradually phase out nuclear power plants as those with a higher risk of a serious accident and replace them with cheaper WF. Mueller [15] points to the role of demand-side management (DSM) as a method facilitating the integration of RES with the power system and a means to manage overproduction by RES. Research by Koivisto et al. [16,17] relate to the analysis of the use of onshore and offshore WF and photovoltaic (PV) systems in Northern Europe. The conducted research has shown that modern wind turbines significantly reduce the variability of electricity generation in complex systems. The work of Mikulik et al. [18] concerns the modelling of the net load variability due to the diversifying share of distributed sources (wind and solar). On the other hand, Pluta et al. [19] focus on planning the transition from coal-based to RES-based energy in such a way as to minimize the potentially significant increase in electricity prices. One such way is DSM. Analyzes conducted by Kaczmarzewski et al. [20] relate to the possibility of adjusting load profiles to electricity production by PV farms based on statistical data. Sun et al. [21] indicate that active management of the power network brings benefits with the use of offshore RES, also in terms of the use of transmission lines. Acosta et al. [22] propose a solution that is effective in managing the grid from RES, consisting of the construction of a coordinated system consisting of a controller that manages a wind farm at the same time, and energy storage in the form of battery banks and a DC line connecting them.
The next line of research is the stabilization of electricity supplies to the grid by RES, in particular WF, and environmental aspects. Wagner [23] presents the necessity to use energy storage due to the instability of RES as a method of reducing CO2 emissions in Germany. Sayigh [24] deals with a similar topic for Malta. He points out that the combination of wind farms and pumped hydroelectric storage systems is an effective system stabilizing energy supply to the grid. On the other hand, Santos et al. [25] analyze the economic and technical potential of the use of battery energy storage systems (BESS). They indicate that a well-managed BESS can increase the efficiency of a transmission system. Lu et al. [26] show how in a practical way East China Grid Corporation can use pumped hydropower plants in its area of operation to stabilize the power system while reducing the share of nuclear power plants in electricity production.
Another trend that can be found in many publications deals directly with issues related to OWF and their role in meeting the demand for power and electricity. Silva [27] points to the necessity to expand the network infrastructure, RES installations as close as possible to the places of demand and the necessity to supplement (stabilize production) RES by conventional power plants. This also affects the economy of energy production and the need for a flexible approach to controlling the operation of sources. Hu et al. [28] indicate the need for optimal allocation and selection of OWF power. Curto et al. [29] present the problems of using renewable energy sources, including OWF in Vietnam. Li et al. [30] indicate the need to apply source-grid-load regulatory strategies, which, especially when applied to OWF, may lower the operating costs of the system and better use the potential of OWF. Klinger et al. [31] prove that in the case of Germany, WF is the main element of the energy mix. Wang et al. [32] show the analysis of simulation results, which prove that in the case of microgrids built from renewable sources (PV, WT) and battery storage, the use of a two-stage energy management system can significantly improve the efficiency of using these sources.
Eltamaly et al. [33] proved that the hybrid energy system consisting of WT, PV, battery and diesel generator is a good combination for a smart grid. These types of networks together with the equivalent of the DRS optimization algorithm have a positive effect on reducing the cost of energy.
Alotabli et al. [34] indicate that the use of renewable, hybrid sources of electricity is currently the best solution, especially when such a system is supplemented with energy storage. The authors conducted optimization, using an algorithm called the gradually reduced particles of particle swarm optimization, of the wind-solar system with pumped hydro energy storage for the area of Dumah Aljandal in the north of Saudi Arabia. These studies proved the superiority of using a pumped-storage system with a dynamic tariff demand to the other energy storage systems with flat-rate tariffs.
A number of works concern the analysis of OWF in a specific location. Pires et al. [35] presents an analysis for the southern coast of Santa Catomina state in Brazil, Ortega et al. [36] for northern California, Douville et al. [37] for Oregon. The work of Bardenhage et al. [38] concerns Japan, Al Hinai et al. [39] analyze the case of Oman, and Roldan-Fernandez examines the impact of OWF on the energy market in Spain [40].
The analysis of literature reports prompted the authors to analyze the OWF work in the southern Baltic Sea in the context of the cooperation of such sources with the Polish power system. We consider the lack of literature reports for the area in question regarding the correlation of the demand for power and energy and the considered plans for the construction of OWF in the analyzed area as a gap that can be filled by this article.

2. Materials and Methods

2.1. Estimation of Wind Conditions

Due to the lack of measurement masts in the Polish part of the Baltic Sea and, as a result, the lack of publicly available measurement data of wind speed at sea, data from the MERRA-2 system was used in the study. It is a system that uses mesoscale-satellite models [8]. Hyun-Goo et al. Say that the data from MERRA-2 is the best fit among the methods of data re-analysis [41]. Kostrzewa also indicates that for the Baltic Sea region, the correlation between the data from this model and those from measurement masts in the German part of the Baltic Sea is very high, and the fit is good. Moreover, the calculated mean values of the wind speed are similar to those obtained from the measurements. As a result, MERRA-2 can be considered a reliable source of long-term data [8].
To calculate the wind conditions in the areas of the future Polish OWF and limit the potential influence of a single year on the results, the data set for the years 2006–2020 from the MERRA-2 system was used [42]. These data are averaged 10 min data and relate to the wind speed at a height of 10 m above sea level. The 10-min data were used to obtain the most reliable power results and because this is the shortest time interval used in data collected from meteorological towers both in offshore and onshore [8,41] to assume wind conditions in areas of these towers. Wind conditions were analyzed for single points located in the areas of each of the banks. On Słupsk Bank a point belonging to the planned farm Baltica 2 has been identified (54°59′23″ N, 17°04′56″ E), and on Middle Bank belonging to planned farm Baltica 1 (55°28′38.3″ N, 17°25′20.1″ E).
Wind speeds vn at a height of 10 m were recalculated into wind speeds at the height of the turbine rotor vEW, according to Equation (1) [10].
v E W = v n ( H E W H ) α
The α coefficient value in the range 0.1–0.13 allows obtaining average wind speeds close to the real values [8]. Therefore, the value 0.11 was used in the calculations. The mean wind speeds vav were then calculated at 110 m above sea level on both shoals.
Thanks to the above calculations, it was possible to make histograms of velocity on both shoals. And then, determination of the probability function of the occurrence of a given wind speed—the Weibull distribution. This function is defined by Equation (2) [10].
f ( v ) = k λ ( v λ ) k 1 e ( v λ ) k
The scale parameter λ was calculated by Equation (3), where the wind speed vav was divided by the gamma distribution Γ(x) of shape parameter k [10].
λ = v a v Γ ( 1 + 1 k )
The calculations and graphs were made in the Scilab 6.1.0 program.

2.2. Estimating the Generation of Electricity by Wind Power Turbine

Due to the fact that the type of turbine in future Polish OWFs has not been chosen yet, one of the most commonly used turbines today, the V164-9.5MW turbine, manufactured by MHI Vestas, was analysed to determine the generation of energy in offshore wind turbines. Table 1 presents its parameters.
As the source data are given in discrete form every 0.5 m/s [43], in order to develop a continuous function describing the dependence of the power generated by the turbine on the wind speed, a linear approximation was used according to the Equation (4).
P ( v ) = P 1 + P 2 P 1 v 2 v 1 ( v v 1 )
The determined power characteristic is shown in Figure 1.
Equation (5) was used to calculate the annual energy E produced by the turbine [9]. The number of hours in year T in the analyzed period was on average 8766.4 h (4 leap years in the analyzed 15 years).
E = T 0 P ( v ) · f ( v ) d v
The method of rectangles with the wind speed step v every 0.01 m/s was used for integration. Then, based on the obtained results, the average value of the capacity factor (cf) was determined (Equation (6)) [9].
c f = E E m a x = E T · P n
Based on the wind conditions, the average monthly power and energy generations by the turbine were also calculated. For this purpose, the data of wind speed at the height of the rotor suspension was divided into individual months from all analyzed years. Then, for each value of the wind speed, the power at which the turbine operates was determined in accordance with the P(v) characteristic of the turbine. The next step was to determine the average power generated by the turbine for each month according to Equation (7).
P a v = · i = 1 n P i n
By multiplying the obtained average power results by the number of hours in a month (according to Equation (8)), the amounts of electricity produced on average in a given month were calculated.
E m o n t h = P a v · T m o n t h
Hourly averages were determined analogously to the monthly averages. The wind speed data was divided into individual hours, and then for each wind speed value, the power at which the turbine works was determined, in accordance with the characteristics of the turbine power. Hourly mean values were calculated according to Equation (7). Hourly mean values were calculated for UTC + 1 time.

2.3. Correlation between Generation in OWF and Demand for Electric Power

To determine the influence of OWF of the Polish power system, monthly and hourly correlations between generation in OWF and demand for electric power were calculated. The average generated energy in every month was calculated using the equations from Section 2.2. Due to the fact that the wind speed and power data were obtained over a 15-year period, it was assumed that the calculated monthly generation in OWF will be reliable as described in Section 2.1 and could represent a potential generation of the future wind farms.
The data on the average monthly demand for electricity in Poland was taken from the annual report of the transmission network operator in Poland [3]. Data from 2015–2019 were used. They were selected because this period is the most representative of the future, considering the changing demand distribution and the fact that in 2020 as a result of the lockdown, various industries were closed, which had an impact on the distribution of the system load. The average monthly demands were calculated for the whole 5-year period and in separate years.
In order to acquire long term correlations, the monthly average of 5 years was compared to the computed generation data from an average of 15-years monthly values. Due to the fact that the distribution of the demand in Poland has changed in past years, the correlations between single year average monthly demand and average 15-years monthly generations were computed.
The average hourly demand for electricity was determined from the daily reports of the demand for power in the system provided by the operator of the transmission network [44]. Based on these data, the average power demand for each hour of the day was calculated as the average energy demand Eav in every hour of the day according to Equation (9).
E a v = · i = 1 n E i n
Average hourly demands were compared to calculated, according to the Equation (7), generations in OWF to find its correlations.
The Guilford scale and the adjustment scale were used to assess the level of correlation between demand and generation in offshore wind farms. For the Guilford scale, the value of the R correlation coefficient was assessed, and for the adjustment scale—the value of the R2 determination coefficient. The values of both scales are presented in Table 2.
The R and R2 coefficients are defined by the Equations (10) (correlation coefficient) and (11) (coefficient of determination).
R = C ( x y ) S ( x ) S ( y )
R 2 = ( y i ^ y a v ) 2 ( y i y a v ) 2
Excel spreadsheet functions were used to calculate the correlation between the average demand and generation values.

2.4. Correlation between Generation in OWF and Generation in Other Renewable Sources

To determine the correlation between generation in OWF and other renewable sources, on which the Polish energy transformation will be based, i.e., photovoltaic and wind sources on land, the Guilford scale and the matching scale were used, which are presented in Table 2. The same equations were also used as in point 2.3.
In order to compare OWF results with other renewable sources, the capacity factor of OWF was calculated for every month according to Equation (6). The same equation was used to calculate the capacity factor for other energy sources.
Data on average monthly values of generated power in photovoltaic sources come from articles describing generation in photovoltaic installations in various areas of Poland: south-eastern Poland [45], north-eastern Poland [46] and northern Poland [47]. Data describing the monthly average values generated by onshore wind farms come from articles [48,49,50]. Due to the use of the data, an analysis of the correlation between the generation in future OWF and other renewable sources were made. In addition, the influence of the location of the source in Poland was considered. Data on the capacity factor are presented in Table 3.

3. Results

3.1. Wind Conditions

The calculated average wind speeds at the measurement height, 10 m, and at the height of the turbine rotor, 110 m, are presented in Table 4.
The calculated average annual wind speeds are included in the speed ranges obtained by Kostrzewa [8] and Hahmann et al. [51]. Also, the data from measurement masts in the German part of the Baltic Sea have similar values [52].
Figure 2 shows the velocity histogram and the Weibull distribution plot. The parameter k was defined as 2.35.
The Weibull distribution with the given shape and scale parameters is very similar to the velocity histogram. This means that it can be used for further calculations of energy generation by offshore wind farms.
Better wind conditions (higher average wind speed and higher probability of higher wind speeds) are on the Central Bank than on the Słupsk Bank. The late autumn and winter months are characterized by much higher average wind speeds than the spring and summer months. The best wind conditions are in December and January, and the worst in May and June.

3.2. Power Generation in the V164-9.5MW Turbine

The forecasted energy generation in the turbines located on the Słupsk Bank and the Middle Bank is presented in Table 5.
The results calculated and presented in Table 5 do not consider the possible downtime of the turbines. They also assume immediate activation and generation of electricity after exceeding the extreme values of wind speed. It does not include the inertia of electricity generation following sudden changes in wind speed. As a result, the values obtained are very high and exceed the corresponding values of the turbines operating under real conditions.
Table 6 shows the average forecasted energy generation and the average power in individual months.
The highest average monthly power for a non-leap year is found in the late autumn and winter months (December, January, slightly less November and February), and the lowest in late spring (May and June). It is also visible that the average power of the turbines on the Central Bank is higher each month than on the Słupsk Bank. The decrease in average power between December and January and May and June amounted to over 50% on the Słupsk Bank and not much less on the Central Bank.
Table 7 shows the average power in each hour.
The obtained results indicate that for the turbines in both locations there is a difference in the average turbine power. More power is generated in the morning period, with a peak between 8–11 a.m., and in the evening, with a peak between 7 p.m. and 11 p.m. Power production valleys occur at night (24–4 p.m.) and in the afternoon (around 4 p.m.).

3.3. Correlation between Generation in OWF and Power Demand

The results of the correlation calculations between the generation in OWF and the demand for electric power in the monthly average values are presented in Table 8.
The correlation coefficient R, for the period 2015–2019, is greater than 0.9 on both the Słupsk Bank and the Middle Bank. This proves that, according to the Guilford scale, there is a very strong positive correlation between the demand for power in individual months and the potential generation in OWT. On the other hand, the fit (characterized by the R2 coefficient) is good. Offshore wind farms produce more energy in the months of higher demand and less in the months of lower demand, so they can contribute to covering the peaks in demand.
There is a visible decrease in the value of the correlation coefficient and the determination coefficient in 2018–2019. It may be related to the changing distribution of power demand throughout the year and the increase in power demand in the summer months. However, the dependence according to Guilford is high. However, the fit for 2018–2019 is only satisfactory.
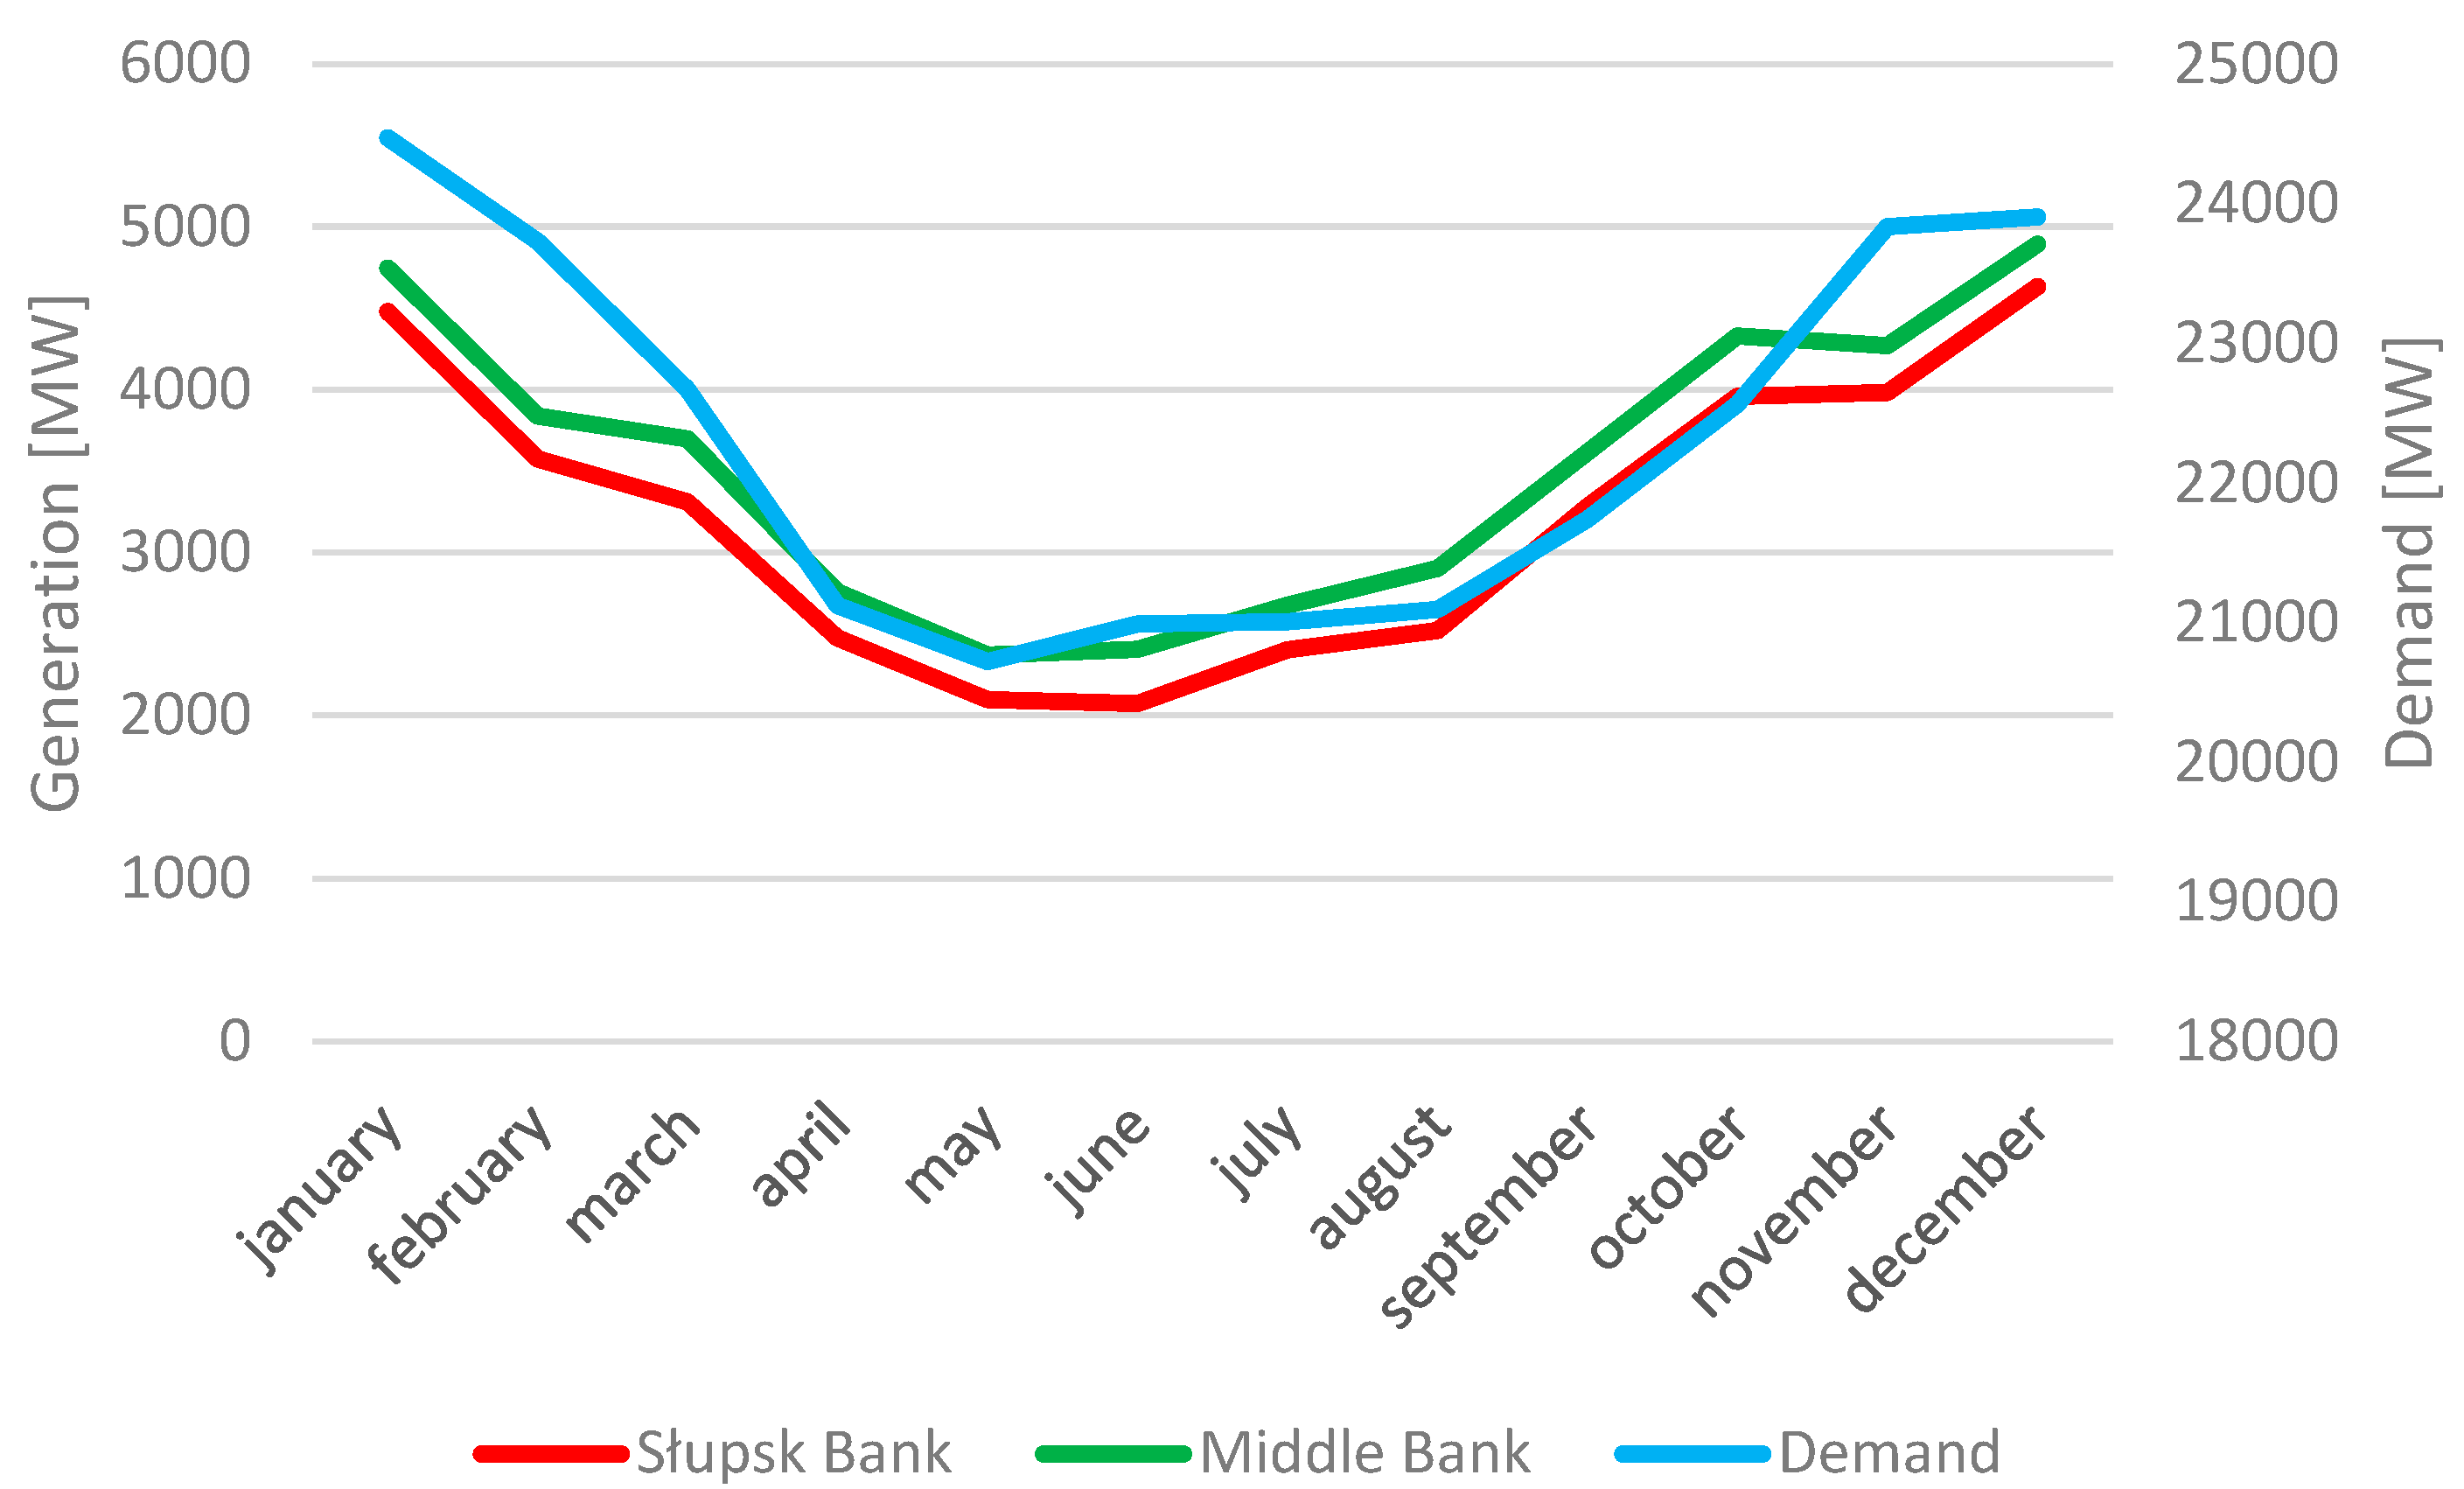
A chart comparing the average monthly demand with generation in OWF is shown in Figure 3.
The graph showing both demand and production in individual turbines shows that they decrease in summer and reach their peak in winter. However, this is a comparison of multi-year values and may vary from year to year.
Table 9 presents the results of the correlation calculations between the power demand and the average hourly power generated in OWT.
Contrary to monthly averages of generation values, in the case of hourly averages, they cannot be considered strongly correlated with the demand. There is also a significant difference between the locations where the turbines will be located. The correlation between generation and demand according to the Guilford scale is positive and moderate. It is stronger in Middle Bank than in Słupsk Bank. The alignment is unsatisfactory in both cases. Therefore, it is not possible to present the dependence of generation on-demand in a linear manner. However, the fact that the correlation is positive indicates a good ability of the OWF to cover the demand.
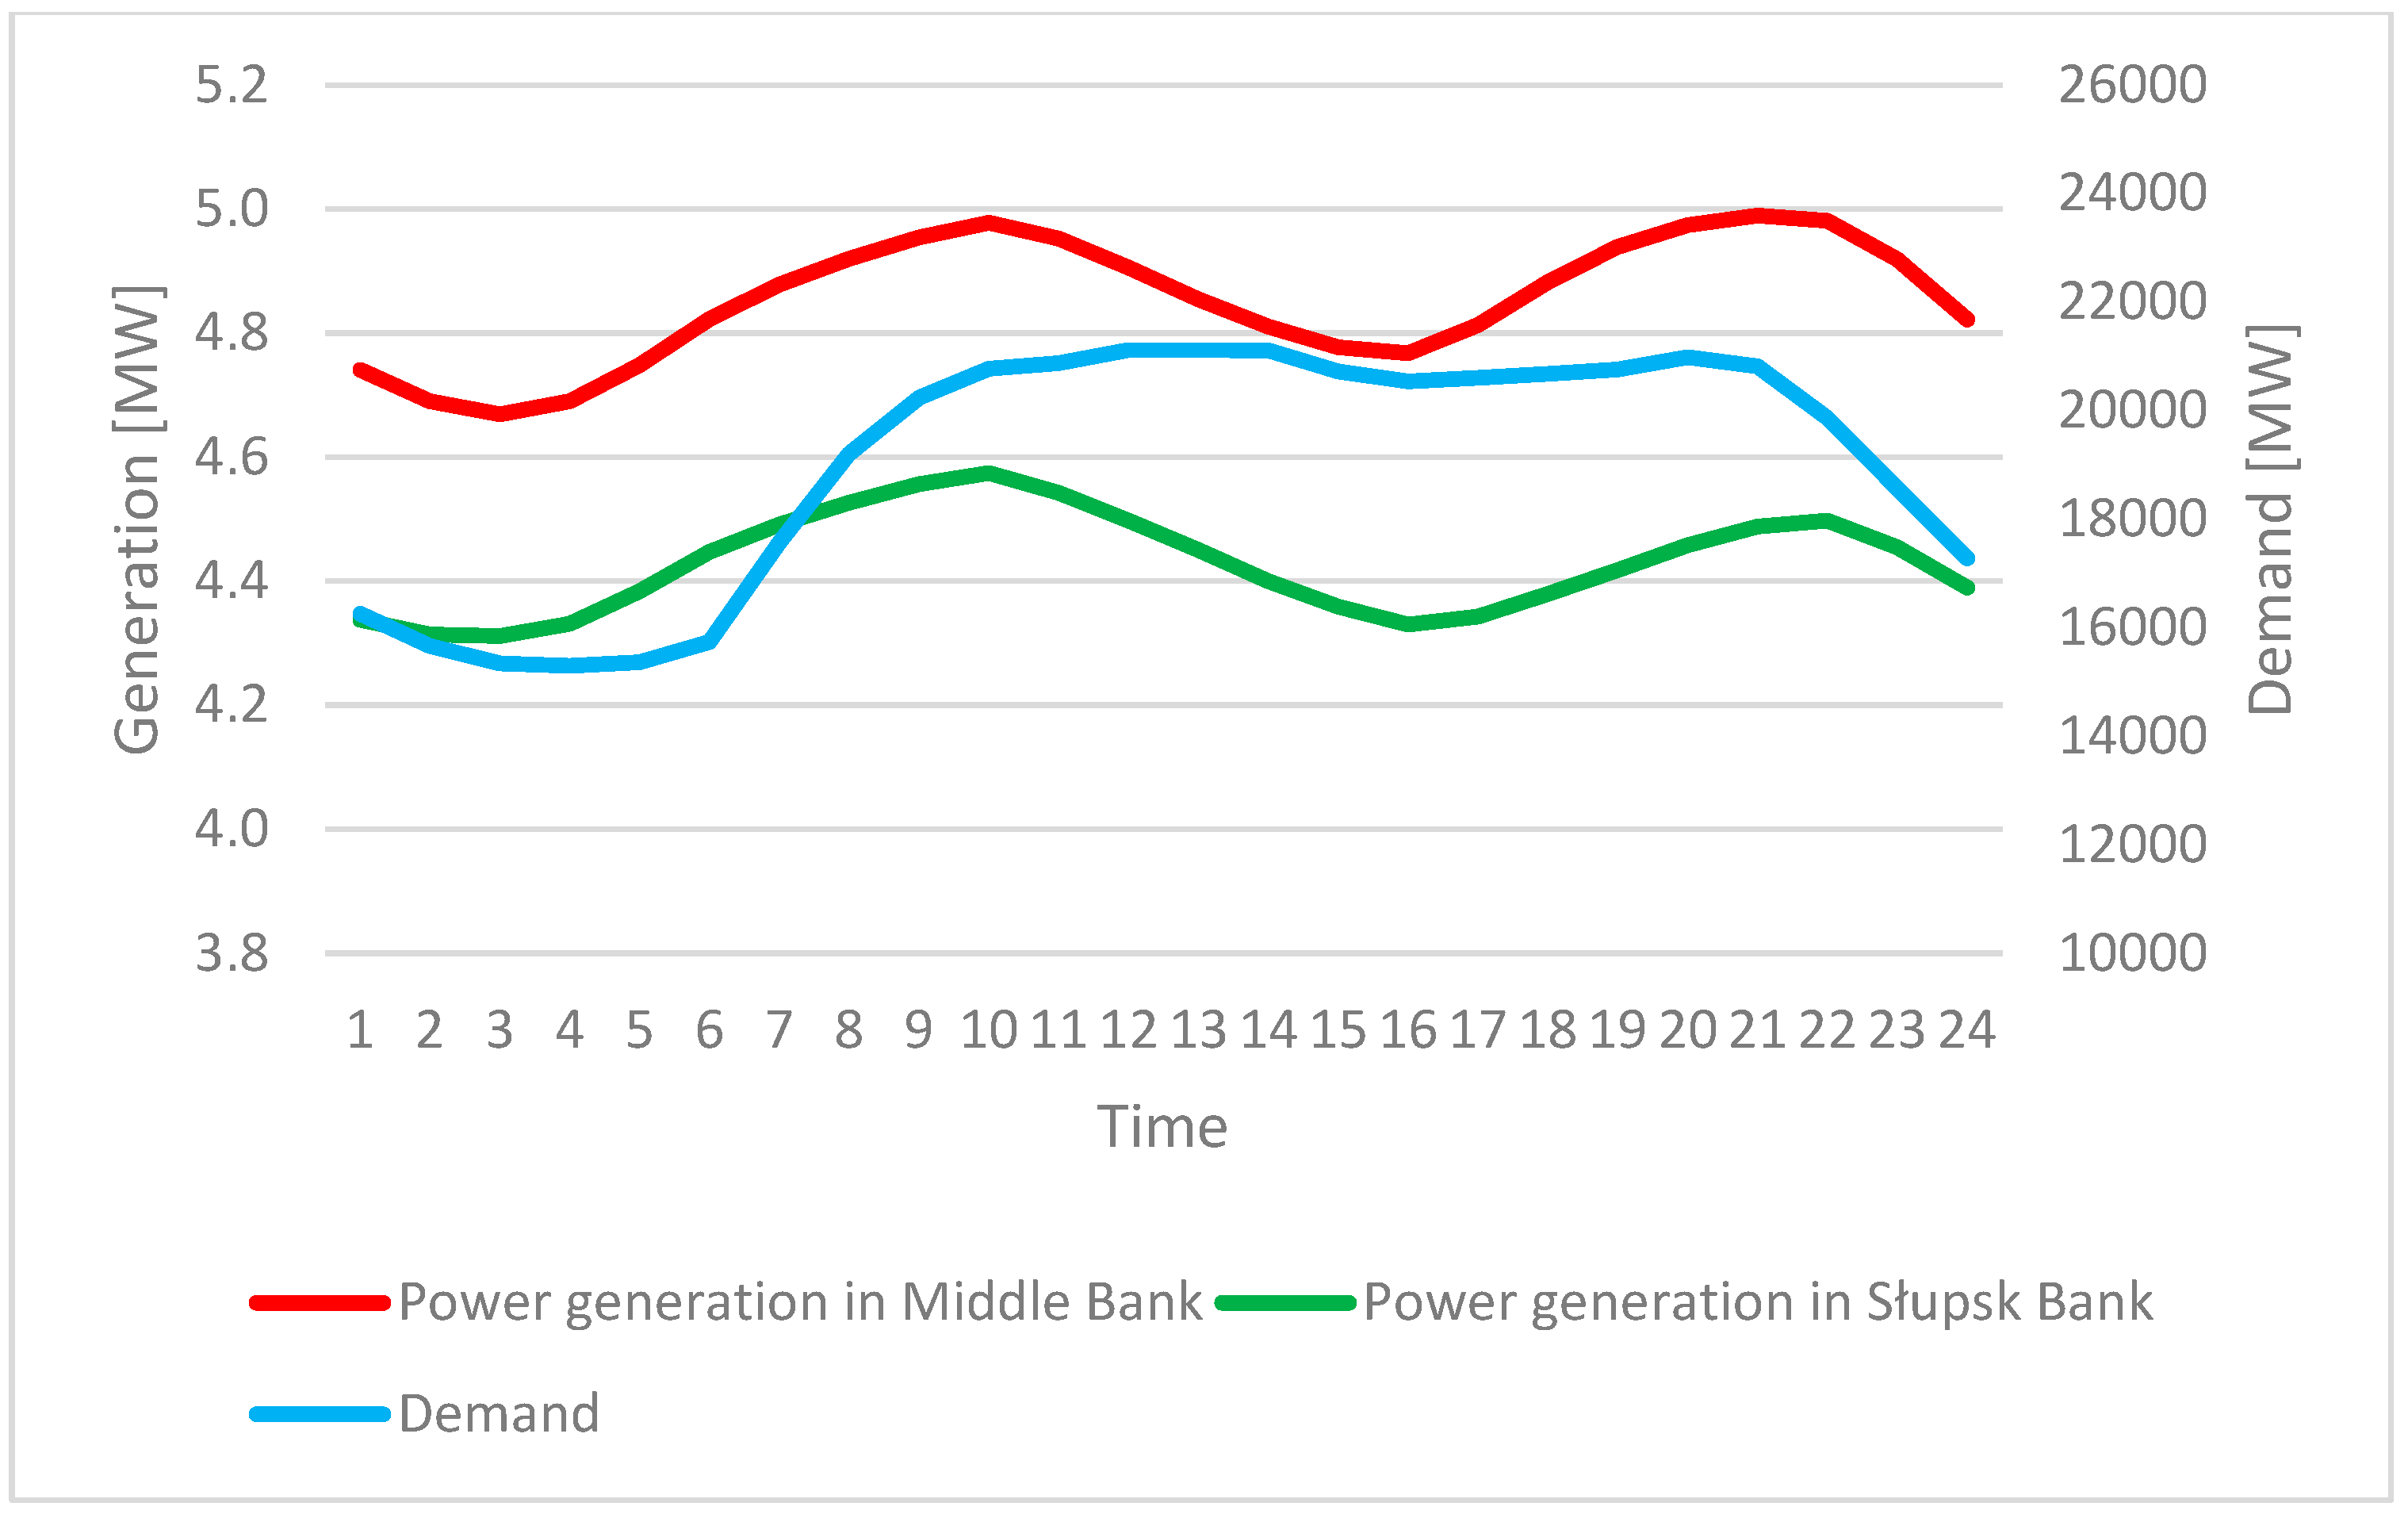
A chart comparing the average hourly demand with generation in OWT is presented in Figure 4.
The figure shows that offshore wind farms will produce less energy at night, which is correlated with demand. Also, during the evening rush, the generation in OWF will be larger, which is a positive feature of them. On the other hand, the morning peak of generation occurs before the peak of demand. Moreover, during the day, between 1 p.m. and 5 p.m., the generation valley follows, which is not correlated with the demand valley.

3.4. Correlation between Generation in OWF and Generation in Other Renewable Sources

Table 10 presents the correlation between the average monthly values of the capacity factor OWF and other renewable sources.
Generation in photovoltaic sources, regardless of geographic location, is strongly negatively correlated with generation in offshore wind farms. The correlation according to the Guilford scale is very high. The fit is very good in most cases, and in the case of PV installations in the southeast of Poland and OWT in the Central Bank, it is good. It follows that the more energy is produced in photovoltaic sources, the lower the generation potential in OWT. At the same time, the less energy is generated by solar farms, the more energy is generated by offshore wind farms. As a result, these are sources that complement each other well in terms of average monthly power generation.
The correlation between generation in offshore and onshore wind turbines is positive and very high. The fit determined by the coefficient of determination is satisfactory. Both offshore and onshore wind farms produce more energy during the same periods of the year. If production in onshore farms decreases, so does offshore production. However, it is not as strongly correlated as generation from photovoltaic farms and offshore wind farms.
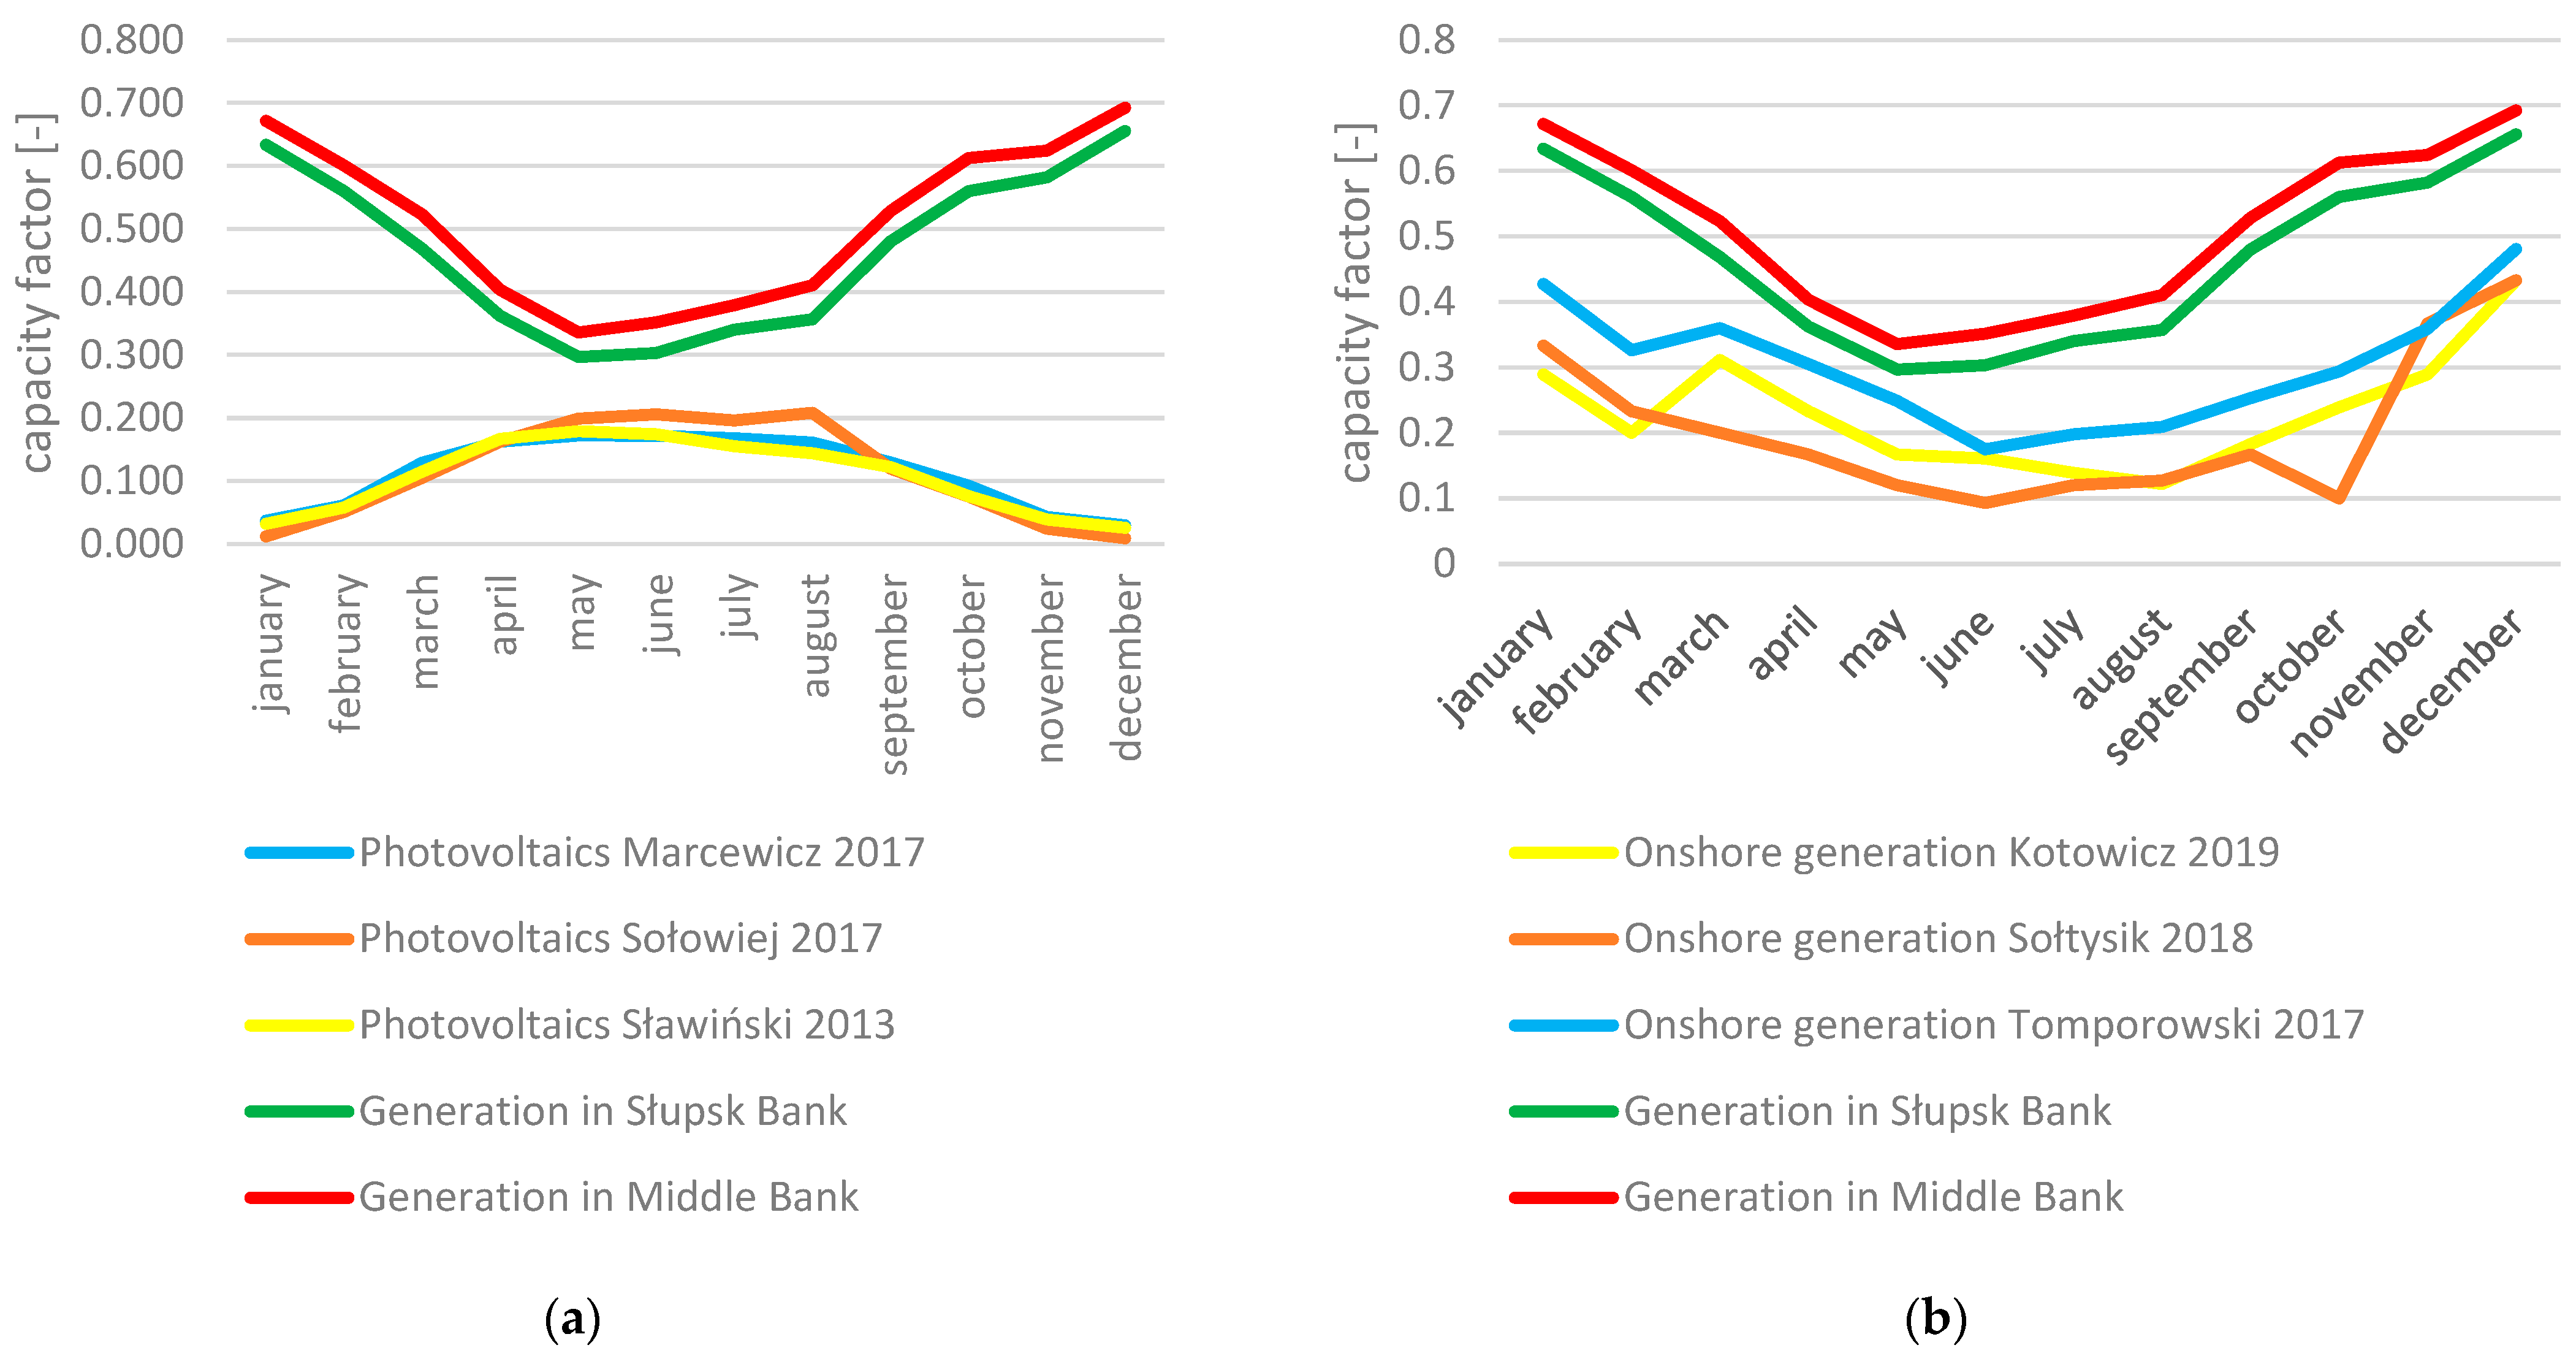
Figure 5 shows the capacity factor changes during the year for OWF and other analyzed renewable sources.
The diagram shows that photovoltaic installations generate the highest power in summer and the minimum in winter. On the other hand, for offshore wind farms, the late autumn and winter months have the highest average power generation. Onshore wind farms generate the highest average power in the late fall months and winter (like offshore wind farms). On the other hand, in spring and summer, they are characterized by lower production. The lowest average power in onshore turbines occurs between June and September, and in the case of offshore turbines, between April and July.

4. Discussion

The obtained capacity factor for the OWT was 0.472–0.514. This is a very high value for wind turbines. The onshore wind turbines used in Poland so far are characterized by an average value of this coefficient at the level of 0.22 [48], and in coastal areas, it reaches 0.34 [53]. However, the value obtained is slightly higher than that currently characterizing wind turbines. Enevoldsen et al. [54] indicate that the average capacity factor for the European OWT analyzed by them was 0.408. PGE Baltica experts estimate that OWF in the Polish sea will have a capacity factor of 0.40–0.45 [6]. The experience of OWF in Great Britain shows that there are farms with a cf index equal to or even higher than the designated one, while most farms have this index lower (the average in Great Britain is 0.397) [55]. On the other hand, Dróżdż et al. [56] indicate that the current estimated capacity factor for OWF is approximately 0.5. The overstatement of the capacity factor is caused by the failure time, rotor inertia or time necessary to start up the turbines, as mentioned in Section 3.2. It is also caused by the fact that data from data reanalysis systems (such as MERRA-2, or the previous version of this system—MERRA) slightly overestimate the value of the capacity factor [57].
The greatest energy production in OWT will occur in the winter months. It is related to higher wind speeds during this period. This is beneficial for the power system due to the positive correlation with the average energy demand and the negative correlation with the photovoltaic sources. A similar tendency is indicated in Great Britain, but there is no correlation with the peak demand in winter (in the periods of the highest demand in winter, OWF energy production is more often lower than the average generation) [58]. Also in Scandinavia, Finland, and the Baltic states, there is an increased generation of electricity from wind power sources in winter [59].
The average production of electricity in offshore wind farms during the day is the highest in the morning and evening hours, i.e., periods with peak demand. This correlation is visible both in Poland, as evidenced by the results obtained and presented in Tarełko’s [60] work, and in other places in the world: the USA [61] or northern Europe [59]. However, the results obtained by Koivisto et al. [59] indicate a much smaller correlation between generation and demand. The correlation is weak positive. This is due to the fact that due to the nature of the data used in this article (the data from MERRA-2 are reliable long-term data), no correlation was calculated for each hour of the year, but only for the mean values. It is necessary to carry out tests for real objects in the future or to make measurement masts measuring the wind speed in the Polish (southern) part of the Baltic Sea.
Energy production in offshore wind farms has a positive correlation with energy production in onshore farms. It is caused by the fact that the best wind conditions are in northern Poland, especially near the Baltic Sea. It causes that both offshore and onshore wind farms are located close to each other and wind conditions there are similar. Generation in OWF has a negative correlation with energy production in photovoltaic sources. In the winter and late autumn months, there are fewer sunny hours, and the radiation is smaller than in summer. It results in smaller energy production in those periods when generation in OWF is largest due to higher wind speeds. Similar results were obtained by Koivisto et al. [59]. They analyzed energy production from seasonally changing renewable sources in Scandinavia, Finland and the Baltic states. However, due to the fact that in their work the average correlation between hourly generation was examined, and in this work the monthly average, the obtained correlation was smaller (correlation between offshore wind and onshore wind: 0.36, correlation between OWF and PV sources: −0.14) compared to the results obtained in this study (correlation between offshore and onshore wind: from 0.77 to 0.868, correlation between OWF and PV sources: from −0.936 to −0.970). In Poland, Jurasz et al. [62] obtained a strong negative correlation between the monthly generation in photovoltaic and wind sources located on land but close to the sea (in Łeba). The mean monthly correlation coefficient was −0.85, which is very close to the results obtained in this study.
The generation of electricity in summer is much lower than that in the winter months. During this period, due to high temperatures and a decrease in the water level, generation is limited in hydroelectric power plants and thermal power plants with an open cooling circuit [63]. The changing distribution of demand throughout the year (increased demand in summer) and the high correlation between onshore and offshore wind generation may make it impossible to maintain an appropriate level of reserves or even result in shortages of energy generation in the case of high saturation of the system with wind sources. In order to reduce this risk, photovoltaic sources might be used as their generation is strongly negatively correlated with generation in OWF. Cooperation between offshore wind and photovoltaic sources could be used to provide enough energy in the system in all months of the year.

5. Conclusions

Based on the research, the following conclusions were made.
  • The obtained results allow us to state that among the developing technologies of renewable sources (wind and solar), offshore wind farms are characterized by the highest capacity factor and produce the most energy in terms of installed capacity. Thanks to this, despite the fact that they are more expensive than both onshore wind farms and photovoltaic sources [64], they have a significant potential for the development and replacement of carbon sources. In addition, offshore wind farms in Poland, compared to other renewable sources such as hydroelectric power plants or geothermal power plants, have the possibility of development due to the fact that Poland has access to the Baltic Sea, which is characterized by good wind conditions, however, the potential in the field of hydro and geothermal energy is small.
  • In late autumn and winter wind speed is much higher than in other months. It results in greater electricity generation. The correlation between monthly average generation and demand is very high and positive. However, due to changing annual demand characteristics and the fact that more energy is needed in the summer months, the correlation decreases. This change will be seen also in the next years [60] so it can lower this correlation.
  • The correlation between the mean hourly values is moderately positive. The correlation of hourly averages is much lower than the monthly values, yet production peaks also occur during the daily demand peaks. On the other hand, between the morning and evening peaks, there is a generation valley, which is not related to such a large demand valley.
  • There is a very high negative correlation between generation in offshore wind farms and generation in photovoltaic sources. It follows that these sources can complement each other. Photovoltaic sources that produce a very small amount of energy in winter and have peak generation in the late spring and summer months can complement offshore wind farms whose generation profile is the opposite. In addition, photovoltaic sources generate a lot of energy on hot and sunny days, when wind generation is low, and the demand is high. Generation in OWF and onshore wind farms are positively correlated. This is a high correlation. It follows that onshore wind farms produce energy during the same periods of time as offshore.
  • The changing distribution of energy demand and the high correlation between generation in offshore and onshore wind farms may pose a threat to the power system.

Author Contributions

Conceptualization, A.D. and J.R.; methodology, J.R. and A.D.; formal analysis, J.R.; investigation, J.R.; writing—original draft preparation, J.R.; writing—review and editing, A.D. All authors have read and agreed to the published version of the manuscript.

Funding

The APC was funded by the Ministry of Education and Science, Poland; the statutory funding at Poznan University of Technology, grant number 0212/SBAD/0566.

Institutional Review Board Statement

Not applicable.

Informed Consent Statement

Not applicable.

Data Availability Statement

Not applicable.

Conflicts of Interest

The authors declare no conflict of interest.

List of Symbols Used

αThe coefficient depends on the type of terrain and roughness class (-)
cfCapacity factor (-)
C(xy)Covariance (-)
EEnergy (MWh)
EavAverage hourly energy demand
EiEnergy demand for the i-th measurement
EmaxEnergy produced by a turbine running at power Pn (MWh)
EmonthThe energy produced in the given month (MWh)
f(v)Weibull distribution function
Γ(x)Gamma linear distribution function
HHeight at which the measurement was taken (m)
HEWThe height of the rotor suspension (m)
kShape parameter (-)
λScale parameter (-)
nNumber of measurements (-)
OWFOffshore wind farm
OWTOffshore wind turbine
PTurbine power for v wind speed (kW)
PavAverage power in a given month (MW)
PiPower for the i-th speed measurement (MW)
PnTurbine rated power (MW)
PxTurbine power for vx wind speed (kW)
RCorrelation coefficient (-)
R2Coefficient of determination (-)
S(x)S(y)Product of standard deviations (-)
TNumber of hours per year (h)
TmonthNumber of hours per month (h)
vWind speed (m/s)
vavAverage wind speed (m/s)
vEWWind speed at the height of the turbine rotor (m/s)
Vnn-th wind speed (m/s)
WFWind farm
WTWind turbine
( y i ^ y a v ) 2 Regression sum of squares (-)
( y i y a v ) 2 Residual sum of squares (-)

References

  1. Polityka Energetyczna Polski do 2040, r. Available online: https://monitorpolski.gov.pl/M2021000026401.pdf (accessed on 12 July 2021). (In Polish)
  2. Ocena Skutków Planowanych Polityk i Środków (Scenariusz PEK)–zał. 2 do KPEiK. Available online: https://www.gov.pl/attachment/a8db078d-535b-4b1b-bfe5-bda64df73778 (accessed on 12 July 2021). (In Polish)
  3. Raport 2020 KSE. Available online: https://www.pse.pl/dane-systemowe/funkcjonowanie-kse/raporty-roczne-z-funkcjonowania-kse-za-rok/raporty-za-rok-2020#t6_1 (accessed on 8 July 2021). (In Polish).
  4. Bronk, L. Możliwości zwiększenia elastyczności pracy Krajowego Systemu Elektroenergetycznego. Zesz. Nauk. Wydziału Elektrotechniki I Autom. Politech. Gdańskiej 2019, 63, 99–102. (In Polish) [Google Scholar] [CrossRef]
  5. Wind Europe 11/2019. Our Energy, Our Future. How Offshore Wind will Help Europe Go Carbon-Neutral; Wind Europe: Brussels, Belgium, 2019. [Google Scholar]
  6. Flaszyński, P.; Mitraszewski, K.; Markowska Cerić, J. Energetyka wiatrowa na Bałtyku. Czyli o energetyce i przyszłości polskich farm wiatrowych na morzu. Mag. Pol. Akad. Nauk. 2021, 1, 56–66. (In Polish) [Google Scholar] [CrossRef]
  7. PSEW 09/2020. Wizja dla Bałtyku. Wizja dla Polski. Rozwój Morskiej Energetyki Wiatrowej w Basenie Morza Bałtyckiego; PSEW: Seattle, WA, USA, 2020; Available online: http://psew.pl/wp-content/uploads/2020/12/psew_raport_pol_v20.pdf (accessed on 8 July 2021). (In Polish)
  8. Kostrzewa, M. Preliminary Baltic Sea wind resource assessment by means of mesoscale and empirical data utilization. Polityka Energetyczna–Energy Policy J. 2018, 21, 21–42. [Google Scholar] [CrossRef]
  9. Dobrzycki, A.; Wodnicki, G. Analiza techniczno-ekonomiczna budowy morskiej farmy wiatrowej w warunkach Polski. Pozn. Univ. Technol. Acad. J. Electr. Eng. 2018, 94, 73–86. (In Polish) [Google Scholar] [CrossRef]
  10. Lubośny, Z. Farmy Wiatrowe w Systemie Elektroenergetycznym, 1st ed.; WNT: Warszawa, Poland, 2016; pp. 12–17. (In polish) [Google Scholar]
  11. Chaouachi, A.; Covrig, C.F.; Ardelean, M. Multi-criteria selection of offshore wind farms: Case study for the Baltic States. Energy Policy 2017, 103, 179–192. [Google Scholar] [CrossRef]
  12. dos Santos, S.P.; de Aquino, R.R.B.; Neto, O.N. A proposal for analysis of operating reserve requirements considering renewable sources on supergrids. Electr. Eng. 2021, 103, 529–540. [Google Scholar] [CrossRef]
  13. Zhang, W.; Liu, W.; Song, P.; Wang, D.; Yang, M.; Zhang, Y. A Multi-objective Optimization Method for Utilizing Seawater Desalination Load to Consume Offshore Wind Power. In Proceedings of the 2021 6th Asia Conference on Power and Electrical Engineering, ACPEE 2021, Chongqing, China, 8–11 April 2021; pp. 1333–1340. [Google Scholar] [CrossRef]
  14. Zhao, J.; Ma, Y.; Liu, Q.; Wen, L.; Jia, C.; Fang, Y. A multi-source coordinated optimal operation model considering the risk of nuclear power peak shaving and wind power consumption. IEEE Access 2020, 8, 189702–189719. [Google Scholar] [CrossRef]
  15. Muller, T. The role of demand side management for the system integration of renewable energies. In Proceedings of the International Conference on the European Energy Market, EEM, Dresden, Germany, 6–9 June 2017; pp. 1–6. [Google Scholar] [CrossRef]
  16. Koivisto, M.; Maule, P.; Cutululis, N.; Sørensen, P. Effects of wind power technology development on large-scale VRE generation variability. In Proceedings of the 2019 IEEE Milan PowerTech, Milan, Italy, 23–27 June 2019. [Google Scholar] [CrossRef] [Green Version]
  17. Koivisto, M.; Cutululis, N.; Ekstrom, J. Minimizing variance in variable renewable energy generation in Northern Europe. In Proceedings of the 2018 International Conference on Probabilistic Methods Applied to Power Systems, PMAPS 2018, Boise, ID, USA, 23–28 June 2018. [Google Scholar] [CrossRef]
  18. Mikulik, J.; Jurasz, J. Net load variability with increased renewables penetration-simulation results for Poland. In Proceedings of the International Conference on Electrical Power Quality and Utilisation, EPQU, Krakow, Poland, 3–7 September 2020. [Google Scholar] [CrossRef]
  19. Pluta, M.; Wyrwa, A.; Suwała, W.; Zyśk, J.; Raczyński, M.; Tokarski, S. A generalized unit commitment and economic dispatch approach for analysing the Polish power system under high renewable penetration. Energies 2020, 13, 1952. [Google Scholar] [CrossRef] [Green Version]
  20. Kaczmarzewski, S.; Olczak, P.; Sołtysik, M. The impact of electricity consumption profile in underground mines to cooperate with res. Energies 2021, 14, 5775. [Google Scholar] [CrossRef]
  21. Sun, W.; Harrison, S.; Harrison, G.P. Value of local offshore renewable resource diversity for network hosting capacity. Energies 2020, 13, 5913. [Google Scholar] [CrossRef]
  22. Acosta, M.N.; Gonzalez-longatt, F.; Roldan-fernandez, J.M.; Burgos-payan, M. A coordinated control of offshore wind power and bess to provide power system flexibility. Energies 2021, 14, 4650. [Google Scholar] [CrossRef]
  23. Wagner, F. Surplus from and storage of electricity generated by intermittent sources. Eur. Phys. J. Plus 2016, 131, 445. [Google Scholar] [CrossRef] [Green Version]
  24. Sayigh, A. Mediterranean Green Buildings Renewable Energy: Selected Papers from the World Renewable Energy Network’s Med Green Forum; Springer International Publishing: Cham, Switzerland, 2017; pp. 1–963. [Google Scholar] [CrossRef]
  25. Santos, S.F.; Gough, M.; Fitiwi, D.Z.; Silva, A.F.P.; Shafie-Khah, M.; Catalao, J.P.S. Influence of Battery Energy Storage Systems on Transmission Grid Operation With a Significant Share of Variable Renewable Energy Sources. IEEE Syst. J. 2021, 16, 1508–1519. [Google Scholar] [CrossRef]
  26. Lu, J.; Yan, L.; Zhou, B.; Shen, J. Integration of renewable resources in East China Grid. In Proceedings of the 2016 IEEE Green Energy and Systems Conference, IGSEC 2016, Long Beach, CA, USA, 6–7 November 2016. [Google Scholar] [CrossRef]
  27. Silva, V.; López-Botet Zulueta, M.; Wang, Y.; Fourment, P.; Hinchliffe, T.; Burtin, A.; Gatti-Bono, C. Anticipating Some of the Challenges and Solutions for 60% Renewable Energy Sources in the European Electricity System. In Springer Proceedings in Mathematics and Statistics; Springer International Publishing: Cham, Switzerland, 2018; Volume 254. [Google Scholar] [CrossRef]
  28. Hu, E.; Gao, S.; Jia, X.; Liu, L.; Ren, A.; Li, Q.; Wang, S.; Shen, Z.; Xing, Y. Research on capacity optimization of offshore wind power flow combined power generation system based on homer. In Proceedings of the 2020 IEEE 4th Conference on Energy Internet and Energy System Integration: Connecting the Grids Towards a Low-Carbon High-Efficiency Energy System, EI2 2020, Wuhan, China, 30 October–1 November 2020; pp. 2684–2689. [Google Scholar] [CrossRef]
  29. Curto, D.; Franzitta, V.; Guercio, A.; Thi Thuy, H.; le Giap, L.N.; Montana, F.; Sanseverino, E.R. Introduction of Offshore Wave, Wind and Solar Energies in Vietnam. In Proceedings of the 2020 Global Oceans 2020: Singapore-U.S. Gulf Coast, Online, 5–30 October 2020. [Google Scholar] [CrossRef]
  30. Li, N.; Wang, X.; Liu, J. Study on Operation Strategy of System Connected to Large Scale Offshore Wind Power. In Proceedings of the 2019 IEEE 2nd International Conference on Power and Energy Applications, ICPEA 2019, Singapore, 27–30 April 2019; pp. 197–201. [Google Scholar] [CrossRef]
  31. Klinger, F.; Müller, L. Wind Energy Statistics in Europe: Onshore and Offshore in Integration of Large Rooftop Photovoltaic Plants in Industrial or Commercial Areas. In Towards 100% Renewable Energy; Springer: Cham, Switzerland, 2017. [Google Scholar] [CrossRef]
  32. Wang, J.; Li, D.; Lv, X.; Meng, X.; Zhang, J.; Ma, T.; Pei, W.; Xiao, H. Two-Stage Energy Management Strategies of Sustainable Wind-PV-Hydrogen-Storage Microgrid Based on Receding Horizon Optimization. Energies 2022, 15, 2861. [Google Scholar] [CrossRef]
  33. Eltamaly, A.M.; Alotaibi, M.A. Novel Fuzzy-Swarm Optimization for Sizing of Hybrid Energy Systems Applying Smart Grid Concepts. IEEE Access 2021, 9, 93629–93650. [Google Scholar] [CrossRef]
  34. Alotaibi, M.A.; Eltamaly, A.M. A Smart Strategy for Sizing of Hybrid Renewable Energy System to Supply Remote Loads in Saudi Arabia. Energies 2021, 14, 7069. [Google Scholar] [CrossRef]
  35. Pires, C.H.M.; Pimenta, F.M.; D’Aquino, C.A.; Saavedra, O.R.; Mao, X.; Assireu, A.T. Coastal wind power in southern santa Catarina. Brazil. Energ. 2020, 13, 5197. [Google Scholar] [CrossRef]
  36. Ortega, C.; Younes, A.; Severy, M.; Chamberlin, C.; Jacobson, A. Resource and load compatibility assessment of wind energy offshore of humboldt county, california. Energies 2020, 13, 5707. [Google Scholar] [CrossRef]
  37. Douville, T.C.; Bhatnagar, D. Exploring the grid value of offshore wind energy in oregon. Energies 2021, 14, 4435. [Google Scholar] [CrossRef]
  38. Bardenhagen, Y.; Nakata, T. Regional spatial analysis of the offshore wind potential in japan. Energies 2020, 13, 6303. [Google Scholar] [CrossRef]
  39. Al-Hinai, A.; Charabi, Y.; Aghay Kaboli, S.H. Offshore wind energy resource assessment across the territory of Oman: A spatial-temporal data analysis. Sustainability 2021, 13, 2862. [Google Scholar] [CrossRef]
  40. Roldan-Fernandez, J.M.; Serrano-Gonzalez, J.; Gonzalez-Longatt, F.; Burgos-Payan, M. Impact of Spanish offshore wind generation in the iberian electricity market: Potential savings and policy implications. Energies 2021, 14, 4481. [Google Scholar] [CrossRef]
  41. Hyun-Goo, K.; Jin-Young, K.; Yong-Heack, K. Comparative Evaluation of the Third-Generation Reanalysis Data for Wind Resource Assessment of the Southwestern Offshore in South Korea. Atmosphere 2018, 2, 73. [Google Scholar] [CrossRef] [Green Version]
  42. Global Modeling and Assimilation Office (GMAO). MERRA-2 tavg1_2d_slv_Nx: 2d,1-Hourly, Time-Averaged, Single-Level, Assimilation, Single-Level Diagnostics V5.12.4; Goddard Earth Sciences Data and Information Services Center (GES DISC): Greenbelt, MD, USA, 2015. [CrossRef]
  43. The Wind Power. Wind Turbine Vestas V164/9500 Data. Available online: https://www.thewindpower.net/turbine_en_1476_mhi-vestas-offshore_v164-9500.php (accessed on 6 April 2021).
  44. Praca KSE-Zapotrzebowanie Mocy KSE. Available online: https://www.pse.pl/dane-systemowe/funkcjonowanie-kse/raporty-dobowe-z-pracy-kse/zapotrzebowanie-mocy-kse (accessed on 12 May 2021). (In Polish).
  45. Marcewicz, T.; Partyka, J.; Mazur, M. Rozwój elektrowni fotowoltaicznych w Polsce-nowoprojektowana elektrownia Dęblin. Przegląd Elektrotechniczny 2017, 5, 17–20. (In polish) [Google Scholar] [CrossRef]
  46. Sołowiej, P.; Neugebauer, M.; Wesołowski, M.; Tejszerski, M. Porównanie uzysków energii elektrycznej z poziomych polikrystalicznych i pionowych monokrystalicznych instalacji fotowoltaicznych w warunkach północno-wschodniej Polski. Przegląd Elektrotechniczny 2017, 7, 54–57. (In polish) [Google Scholar] [CrossRef]
  47. Sławiński, K. Fotowoltaika jako potencjalne źródło energii dla pojazdów elektrycznych. Autobusy Tech. Eksploat. Syst. Transp. 2013, 10, 237–239. (In polish) [Google Scholar]
  48. Kotowicz, J.; Kwiatek, B. Analiza potencjału wytwórczego farmy wiatrowej. Rynek Energii 2019, 4, 38–47. (In polish) [Google Scholar]
  49. Sołtysik, M.; Mucha-Kuś, K.; Rogus, R. Klastry energii w osiąganiu samowystarczalności energetycznej gmin. Zesz. Nauk. Inst. Gospod. Surowcami Miner. I Energią Pol. Akad. Nauk. 2018, 102, 301–312. (In polish) [Google Scholar]
  50. Tomporowski, A.; Flizikowski, J.; Kasner, R.; Kruszelnicka, W. Środowiskowe sterowanie technologią elektrowni wiatrowej. Rocz. Ochr. Sr. 2017, 19, 694–714. (In polish) [Google Scholar]
  51. Hahmann, A.N.; Lange, J.; Pena Diaz, A.; Hasager, C.B. The NORSEWInD Numerical Wind Atlas for the South Baltic; DTU Wind Energy E, No. 0011(EN); DTU Wind Energy: Roskilde, Denmark, 2012. [Google Scholar]
  52. Wind Conditions. Available online: http://windmonitor.iee.fraunhofer.de/windmonitor_en/4_Offshore/3_externe_Bedingungen/2_Windbedingungen/ (accessed on 12 July 2021).
  53. Michalak, J. Analiza opłacalności elektrowni wiatrowych. In Energetyka Wiatrowa w Wybranych Aspektach, 1st ed.; Maj, J., Kwiatkiewicz, P., Eds.; Fundacja na rzecz Czystej Energii: Poznań, Poland, 2016; pp. 55–67. (In polish) [Google Scholar]
  54. Enevoldsen, P.; Jacobson, M.Z. Data investigation of installed and output power densities of onshore and offshore wind turbines worldwide. Energy Sustain. Dev. 2021, 60, 40–51. [Google Scholar] [CrossRef]
  55. UK Offshore Wind Capacity Factors. Available online: https://energynumbers.info/uk-offshore-wind-capacity-factors (accessed on 12 July 2021).
  56. Dróżdż, W.; Mróz-Malik, O.J. Challenges for the Polish energy policy in the field of offshore wind energy development. Polityka Energetyczna–Energy Policy J. 2020, 23, 5–18. [Google Scholar] [CrossRef]
  57. Drew, D.R.; Cannon, D.J.; Brayshaw, D.J.; Barlow, J.F.; Coker, P.J. The Impact of Future Offshore Wind Farms on Wind Power Generation in Great Britain. Resources 2015, 4, 155–171. [Google Scholar] [CrossRef] [Green Version]
  58. Thornton, H.E.; Scaife, A.A.; Hoskins, B.J.; Brayshaw, D.J. The relationship between wind power, electricity demand and winter weather patterns in Great Britain. Environ. Res. Lett. 2017, 12, 064017. [Google Scholar] [CrossRef]
  59. Koivisto, M.; Maule, P.; Nuño, E.; Sorensen, P.; Cutululis, N.A. Statistical Analysis of Offshore Wind and other VRE Generation to Estimate the Variability in Future Residual Load. J. Phys. Conf. Ser. 2018, 1104, 12011. [Google Scholar] [CrossRef]
  60. Tarełko, W. Morskie farmy wiatrowe: Podstawy energetyki wiatrowej. Inżynieria Morska I Geotech. 2015, 2, 116–124. [Google Scholar]
  61. Browning, M.S.; Lenox, C.S. Contribution of offshore wind to the power grid: U.S. air quality implications. Appl. Energy 2020, 276, 115474. [Google Scholar] [CrossRef]
  62. Jurasz, J.; Mikulik, J. Site selection for wind and solar parks based on resources temporal and spatial complementarity–mathematical modelling approach. Przegląd Elektrotechniczny 2017, 9, 86–91. [Google Scholar] [CrossRef] [Green Version]
  63. Sobik, B. Analiza przyczyn wystąpienia zagrożenia bezpieczeństwa dostaw energii elektrycznej w sierpniu 2015 roku w Polsce oraz sposoby zapobiegania takim zdarzeniom. Zesz. Nauk. Inst. Gospod. Surowcami Miner. I Energią PAN 2018, 103, 193–208. (In Polish) [Google Scholar] [CrossRef]
  64. IRENA. Renewable Power Generation Costs in 2019; International Renewable Energy Agency: Abu Dhabi, United Arab Emirates, 2020. [Google Scholar]
Figure 1. Power characteristics of the V164-9.5MW turbine.
Energies 15 03669 g001
Figure 2. Wind velocity histograms and Weibull distribution at a height of 110 m: (a) on Middle Bank; (b) on Słupsk Bank.
Energies 15 03669 g002
Figure 3. Correlation between the generation and the demand for power.
Energies 15 03669 g003
Figure 4. Correlation between generation and average hourly demand.
Energies 15 03669 g004
Figure 5. Capacity factor for OWF and other renewable sources: (a) photovoltaic sources, data from [42,43,44]; (b) onshore wind turbines, data from [45,46,47].
Energies 15 03669 g005
Table 1. Turbine V164-9.5MW parameters adapted from [43].
ParameterUnitValue
Nominal powerkW9500
vcut-inm/s3.5
vnm/s14
vcut-outm/s25
Turbine rotor mounting heightm110
Area of the circle made by the bladesm2164
Table 2. Guilford Scale and Match Scale.
Guilford’s ScaleMatching Scale
RStrength of CorrelationR2Matching
0.0–0.2Weak0.0–0.5Unsatisfactory
0.2–0.4Low0.5–0.6Weak
0.4–0.7Moderate0.6–0.8Satisfactory
0.7–0.9High0.8–0.9Good
0.9–1.0Very high0.9–1.0Very good
Table 3. Generation in photovoltaic sources and onshore wind sources.
MonthCapacity Factor [-]
PhotovoltaicsOnshore Wind
Marcewicz et al. [42]Sołowiej et al. [43]Sławiński [44]Kotowicz et al. [45]Sołtysik et al. [46]Tomporowski et al. [47]
January0.0370.0120.0320.2890.3330.427
February0.0610.0510.0580.2000.2330.326
March0.1290.1050.1150.3110.2000.360
April0.1630.1630.1670.2330.1670.305
May0.1720.1990.1790.1670.1200.249
June0.1720.2060.1740.1610.0930.175
July0.1680.1960.1550.1390.1200.198
August0.1610.2080.1440.1220.1270.209
September0.1290.1200.1220.1830.1670.253
October0.0930.0750.0760.2390.1000.294
November0.0430.0240.0390.2890.3670.359
December0.0300.0090.0260.4330.4330.481
Table 4. Average wind speed at the height of 110 m.
MonthAverage Wind Speed [m/s]
Słupsk BankMiddle Bank
January11.0011.60
February9.9810.60
March8.929.47
April7.678.06
May7.007.37
June7.047.56
July7.427.81
August7.658.24
September9.049.59
October9.9610.60
November10.3010.80
December11.1011.70
Annual average8.929.46
Table 5. Projected energy generation in the V164-9.5MW turbine.
BankE [GWh]cf [-]
Słupsk Bank39.30.472
Middle Bank42.80.514
Table 6. Forecast of energy generation and electric power in individual months of the non-leap year.
MonthSłupsk BankMiddle Bank
Emonth [MWh]Pav [MW]Emonth [MWh]Pav [MW]
January44796.0247476.38
February35755.3238375.71
March33114.4536984.97
April24773.4427583.83
May20982.8223733.19
June20742.8824053.34
July24033.2326783.60
August25223.3929023.90
September32834.5636145.02
October39585.3243305.82
November39825.5342705.93
December46356.2348966.58
Table 7. Forecast of average hourly power generated in the V164-9.5MW turbine.
TimeForecast of Average Power Generated by V164-9.5MW Turbine [MW]
Słupsk BankMiddle Bank
14.3384.741
24.3144.690
34.3124.669
44.3314.690
54.3844.748
64.4474.822
74.4914.878
84.5264.920
94.5574.954
104.5754.978
114.5424.952
124.4974.906
134.4504.854
144.4004.811
154.3594.777
164.3304.767
174.3434.813
184.3794.882
194.4184.939
204.4584.974
214.4884.990
224.4984.981
234.4554.919
244.3894.822
Table 8. Correlation between average monthly values of demand and generation in OWF.
YearsSłupsk BankMiddle Bank
R [-]R2 [-]R [-]R2 [-]
20150.9400.8840.9370.877
20160.9420.8870.9320.869
20170.9050.8180.8930.797
20180.8830.7800.8770.769
20190.8450.7140.8370.700
2015–20190.9350.8730.9260.858
Table 9. Correlation between hourly values.
Słupsk BankMiddle Bank
R [-]R2 [-]R [-]R2 [-]
0.4660.2170.6910.478
Table 10. Generation in photovoltaic sources and onshore wind sources.
PhotovoltaicsOnshore Wind
Marcewicz et al. [42]Sołowiej et al. [43]Sławiński [44]Kotowicz et al. [45]Sołtysik et al. [46]Tomporowski et al. [47]
Słupsk BankR [-]−0.971−0.982−0.9810.7630.8010.855
R2 [-]0.9430.9640.9630.5820.6420.731
Middle BankR [-]−0.963−0.976−0.9770.7570.7830.844
R2 [-]0.9270.9530.9550.5730.6130.712
Publisher’s Note: MDPI stays neutral with regard to jurisdictional claims in published maps and institutional affiliations.

