Article

Triad Analysis of Global Energy Trade Networks and Implications for Energy Trade Stability

by
Shade T. Shutters
1,2,*,
Keith Waters
3 and
Rachata Muneepeerakul
4
1
School of Complex Adaptive Systems, Arizona State University, P.O. Box 872701, Tempe, AZ 85287, USA
2
Global Climate Forum, Neue Promenade 6, 10178 Berlin, Germany
3
School of Complex Adaptive Systems, Arizona State University, 1800 I St. NW, Washington, DC 20006, USA
4
Department of Agricultural and Biological Engineering, University of Florida, P.O. Box 110570, Gainesville, FL 32611, USA
*
Author to whom correspondence should be addressed.
Energies 2022, 15(10), 3673; https://doi.org/10.3390/en15103673
Submission received: 22 April 2022 / Revised: 11 May 2022 / Accepted: 14 May 2022 / Published: 17 May 2022
(This article belongs to the Special Issue International Energy Trade and the Global Economic System)

Abstract

:
An international push to decarbonize economies has initiated a major transition in the global energy system and has begun to disrupt the intricate network of energy trade. As trade patterns begin to reconfigure, it is important that policy makers understand how vulnerabilities of the existing network may present obstacles to a smooth energy transition. We analyze the topology of the global energy trade network in aggregate, for various energy commodities, and for individual countries. Using the network science technique of triad analysis, which examines the prevalence of 3-node subnetworks in a target network, we calculate triad significance profiles for each network. We then analyze whether various triads are under- or over-represented in our networks and find that triads associated with stability appear more frequently than expected, whereas triads associated with conflict appear less frequently than expected. We further find that the global energy trade network is quite robust against disruptions, maintaining its topological characteristics even after random removal of 80% of the network’s nodes. However, when analyzing individual countries, we find that some exhibit a high prevalence of unstable triads or a low prevalence of stabilizing triads, suggesting that vulnerabilities in global energy trade are more pronounced in some countries than others.

1. Introduction

The world stands on the cusp of a major transformation of the global supply system for energy. For at least 20 years, governments and other concerned stakeholder groups have been advocating for a transition to decarbonized economies by shifting from fossil fuels to alternative renewable energy sources [1]. Several countries have begun this transition by, for instance, phasing out coal mining and nuclear energy production [2]. These first steps of a global energy transition will likely disrupt the existing energy trade regime that has fueled the global economy for the last several decades [3]. Growth in solar and wind energy alone is expected to significantly disrupt the global energy system in the next five years [4]. Some energy trade links will disappear, and new ones will form as the global energy trade network reconfigures around new types and geographical sources of energy [5]. For policy makers navigating this complex transition it is crucial to understand vulnerabilities of the existing energy trade network so that risks to energy security can be better managed during a transition [6].

1.1. Network Analysis and Global Trade

Globalization has dramatically increased the interconnectedness of world economies via trade. In 2019, aggregate trade in energy commodities totaled over USD 1.39 trillion globally—up from USD 280 billion just 20 years earlier [7]. This has coincided with substantial increases in both the number of countries engaged in trade and the number of bilateral trade relationships [8]. In response, a rich body of literature has emerged regarding the nature of these complex product flow networks, in aggregate [8,9,10,11,12], for specific industry sectors such as manufacturing [13], and for individual commodity types such as agricultural goods [14,15,16], rare earth metals [17], and energy [18]. Others have constructed networks, not of physical products, but of the resources embedded in goods, such as virtual water [19,20,21] and emergy [22,23], which is the embodied energy required to produce particular goods or services [24].
Whereas many of these studies focus on characterizing the topology of trade networks, others analyze how network topology relates to phenomena such as economic development [14,25,26] or security [27,28,29]. Here, we contribute to the literature by characterizing the topology of the global energy trade network, contrasting it with other known network topologies, and analyzing how certain aspects of that topology are thought to affect system robustness and vulnerability. Although previous studies have examined both aggregate energy trade [23,30] and trade networks of individual commodities, such as crude oil [31,32,33] and coal [34,35], we apply a topological technique to the study of energy trade networks that, to our knowledge, has not been previously used—triad analysis.

1.2. Triad Analysis

Past studies of trade networks have typically focused on global topological properties of networks, such as density, degree distribution, assortativeness and dissortativeness, and clustering. Although these techniques are useful for analyzing the global structure of networks, they tell us little about local structures within networks [36]. Here, we use a technique known as triad analysis to examine the local topology of trade networks instead. A triad is a subset of three nodes within a network. In directed networks, such as those structuring trade, there exist 13 possible triads (Figure 1). We disregard three other configurations having isolated nodes.
Decomposing networks into a frequency of observed triads, known as a triad census, has been used to study human social networks for many years [37,38]. This allows one to characterize a network by comparing the relative frequency of individual triads within and between networks [39]. More recently, this technique has been enhanced by using computational methods to determine the triad frequency distribution that one would obtain in randomly rewired networks with the same degree sequence and the same number of mutual edges [36]. Comparing a triad’s empirical frequency with that obtained in such shuffled networks enables researchers to identify triads that appear significantly more often than expected (motifs) or less often than expected (anti-motifs).
Comparing the actual appearance of all 13 triads in a network with their expected distributions results in a topological characterization of a network known as a triad significance profile, or TSP [40]. Previous studies have used TSPs to examine and compare networks of biological gene transcription [40], neuron connectivity [40], human social networks [40], ant colony communication [41], agricultural product trade [14], global cargo shipping [42], and even word adjacency in languages [40]. This diversity of past examples illustrates one advantage of the TSP method—it allows researchers to compare topological characteristics of networks with a broad range of sizes and densities, and networks governing systems from vastly different disciplinary domains.
Here, we use this method to construct TSPs of energy trade networks to (a) characterize their structures, (b) compare those structures to previously published TSPs, and (c) examine local-scale topological properties of energy trade that have implications for network vulnerability and security. We further apply this technique to individual energy commodities including oil, coal, and natural gas in both liquid and gaseous form. For context, the top 2019 importers and exporters of each of these commodities, by total dollar value, are presented in Table 1.

2. Data and Methods

2.1. Trade Data

We construct energy trade networks using the United Nations Comtrade database. Comtrade data includes annual directional flows of bilateral trade between countries for several goods and services for the period 1962—present [7]. Data is submitted to the United Nations from individual countries and coded using the Harmonized System (HS), with current data using the HS17 code schema. This system includes detailed commodity types such as dairy spreads, shampoos, polyesters, shirts, iron, and clocks. Although Comtrade data is available for 2020, we use 2019 data to avoid trade anomalies and distortions that may be due to the coronavirus pandemic.
Following [18], for all countries, we extract import and export data for energy commodities HS-2701 (Coal), HS-271111 (Petroleum gases and other gaseous hydrocarbons; liquefied, natural gas), HS-271121 (Petroleum gases and other gaseous hydrocarbons; in gaseous state, natural gas), and HS-2709 (Petroleum oils). We exclude records that have a null trading partner or region, records that have an ambiguous trade partner such as “World”, records with a negative trade value, and data on re-exports and re-imports.
In our networks, nodes represent individual countries, whereas edges represent the presence and direction of energy commodity flows between two countries. Thus, if two countries are engaged in mutual energy trade, their nodes will have a bi-directional edge. In the aggregate energy network, such bi-directional edges could be due to the exchange of different energy commodities. For example, if country A exports oil to country B, while country B exports natural gas to country A, the aggregate energy trade network will have a bi-directional edge between countries A and B. We also construct separate trade networks for each energy commodity, and in those cases, using our previous example, the oil trade network would have only a directed edge from A to B, whereas the natural gas network would have only a directed edge from B to A.
Finally, given that some commodities flow from exporter A to importer B, both countries report the value of this flow to the United Nations. However, the reported values are often not exactly equal. In those cases, we average the quantities reported by both partners to determine the value of trade from A to B. In cases where one country reports a value and the partner country does not, we use the value submitted by the one reporting country.

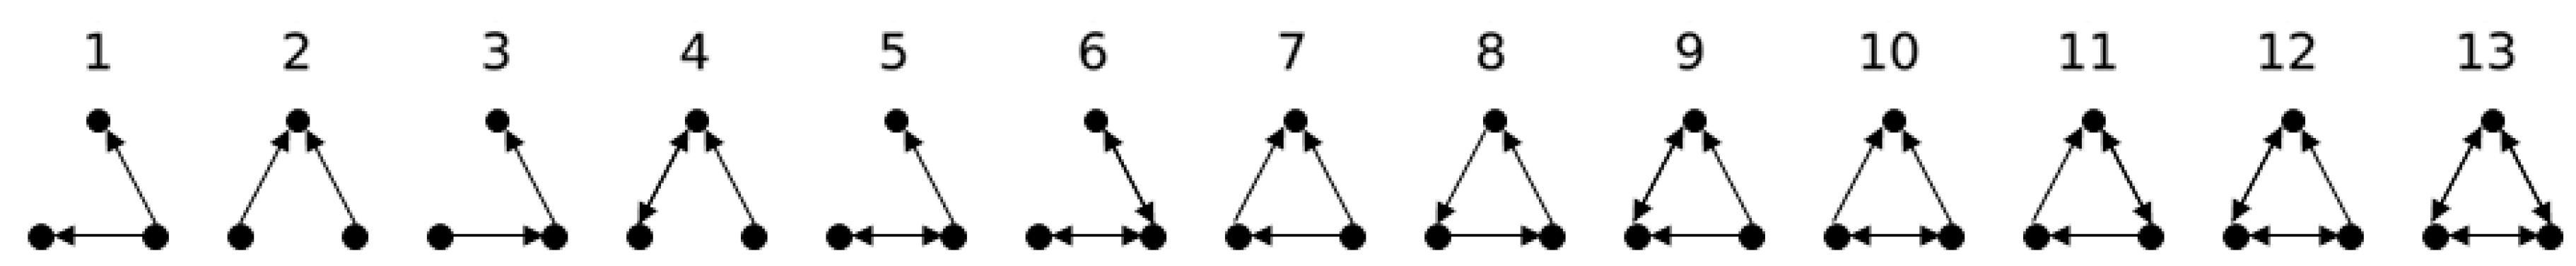
2.2. Constructing a Triad Significance Profle (TSP)

To examine the topology of our trade networks we generate a triad significance profile (TSP) for each network using the method of [40]. We first tabulate the frequency distribution of triads in an empirical network and then compare each triad’s frequency to the mean and standard deviation of a computationally derived frequency distribution of randomized networks. We next calculate a Z-score as
Z i = N i ,     e m p i r i c a l m e a n ( N i ,   r a n d o m i z e d ) s t d ( N i ,   r a n d o m i z e d ) ,
where Ni is triad i’s frequency in either the empirical or randomized network. Finally, to allow for comparison across networks of different sizes and densities, we normalize Z-scores for each triad i as:
normalized   Z i = Z i Z i 2 .
The resulting vector of a network’s 13 normalized Z-scores is known as the network’s triad significance profile or TSP.
We calculate TSPs for the aggregate energy trade network and for the trade networks of each of the four energy commodities. In addition, we calculate a TSP for each country (or equivalent political unit) used in the Comtrade data. We do this for country X by counting only triads in the global network that include X in both the empirical network and the randomized networks used to generate an expected distribution. This allows us to calculate a country-specific Z-score for each triad and thus a country-specific TSP.
Our analysis was conducted using the NetworkX library (2.6.2) in Python for creation and analysis of networks. To calculate network Z-scores and TSPs we used three software platforms in parallel to verify results: mFinder [43], MATLAB, and R.

3. Results and Discussion

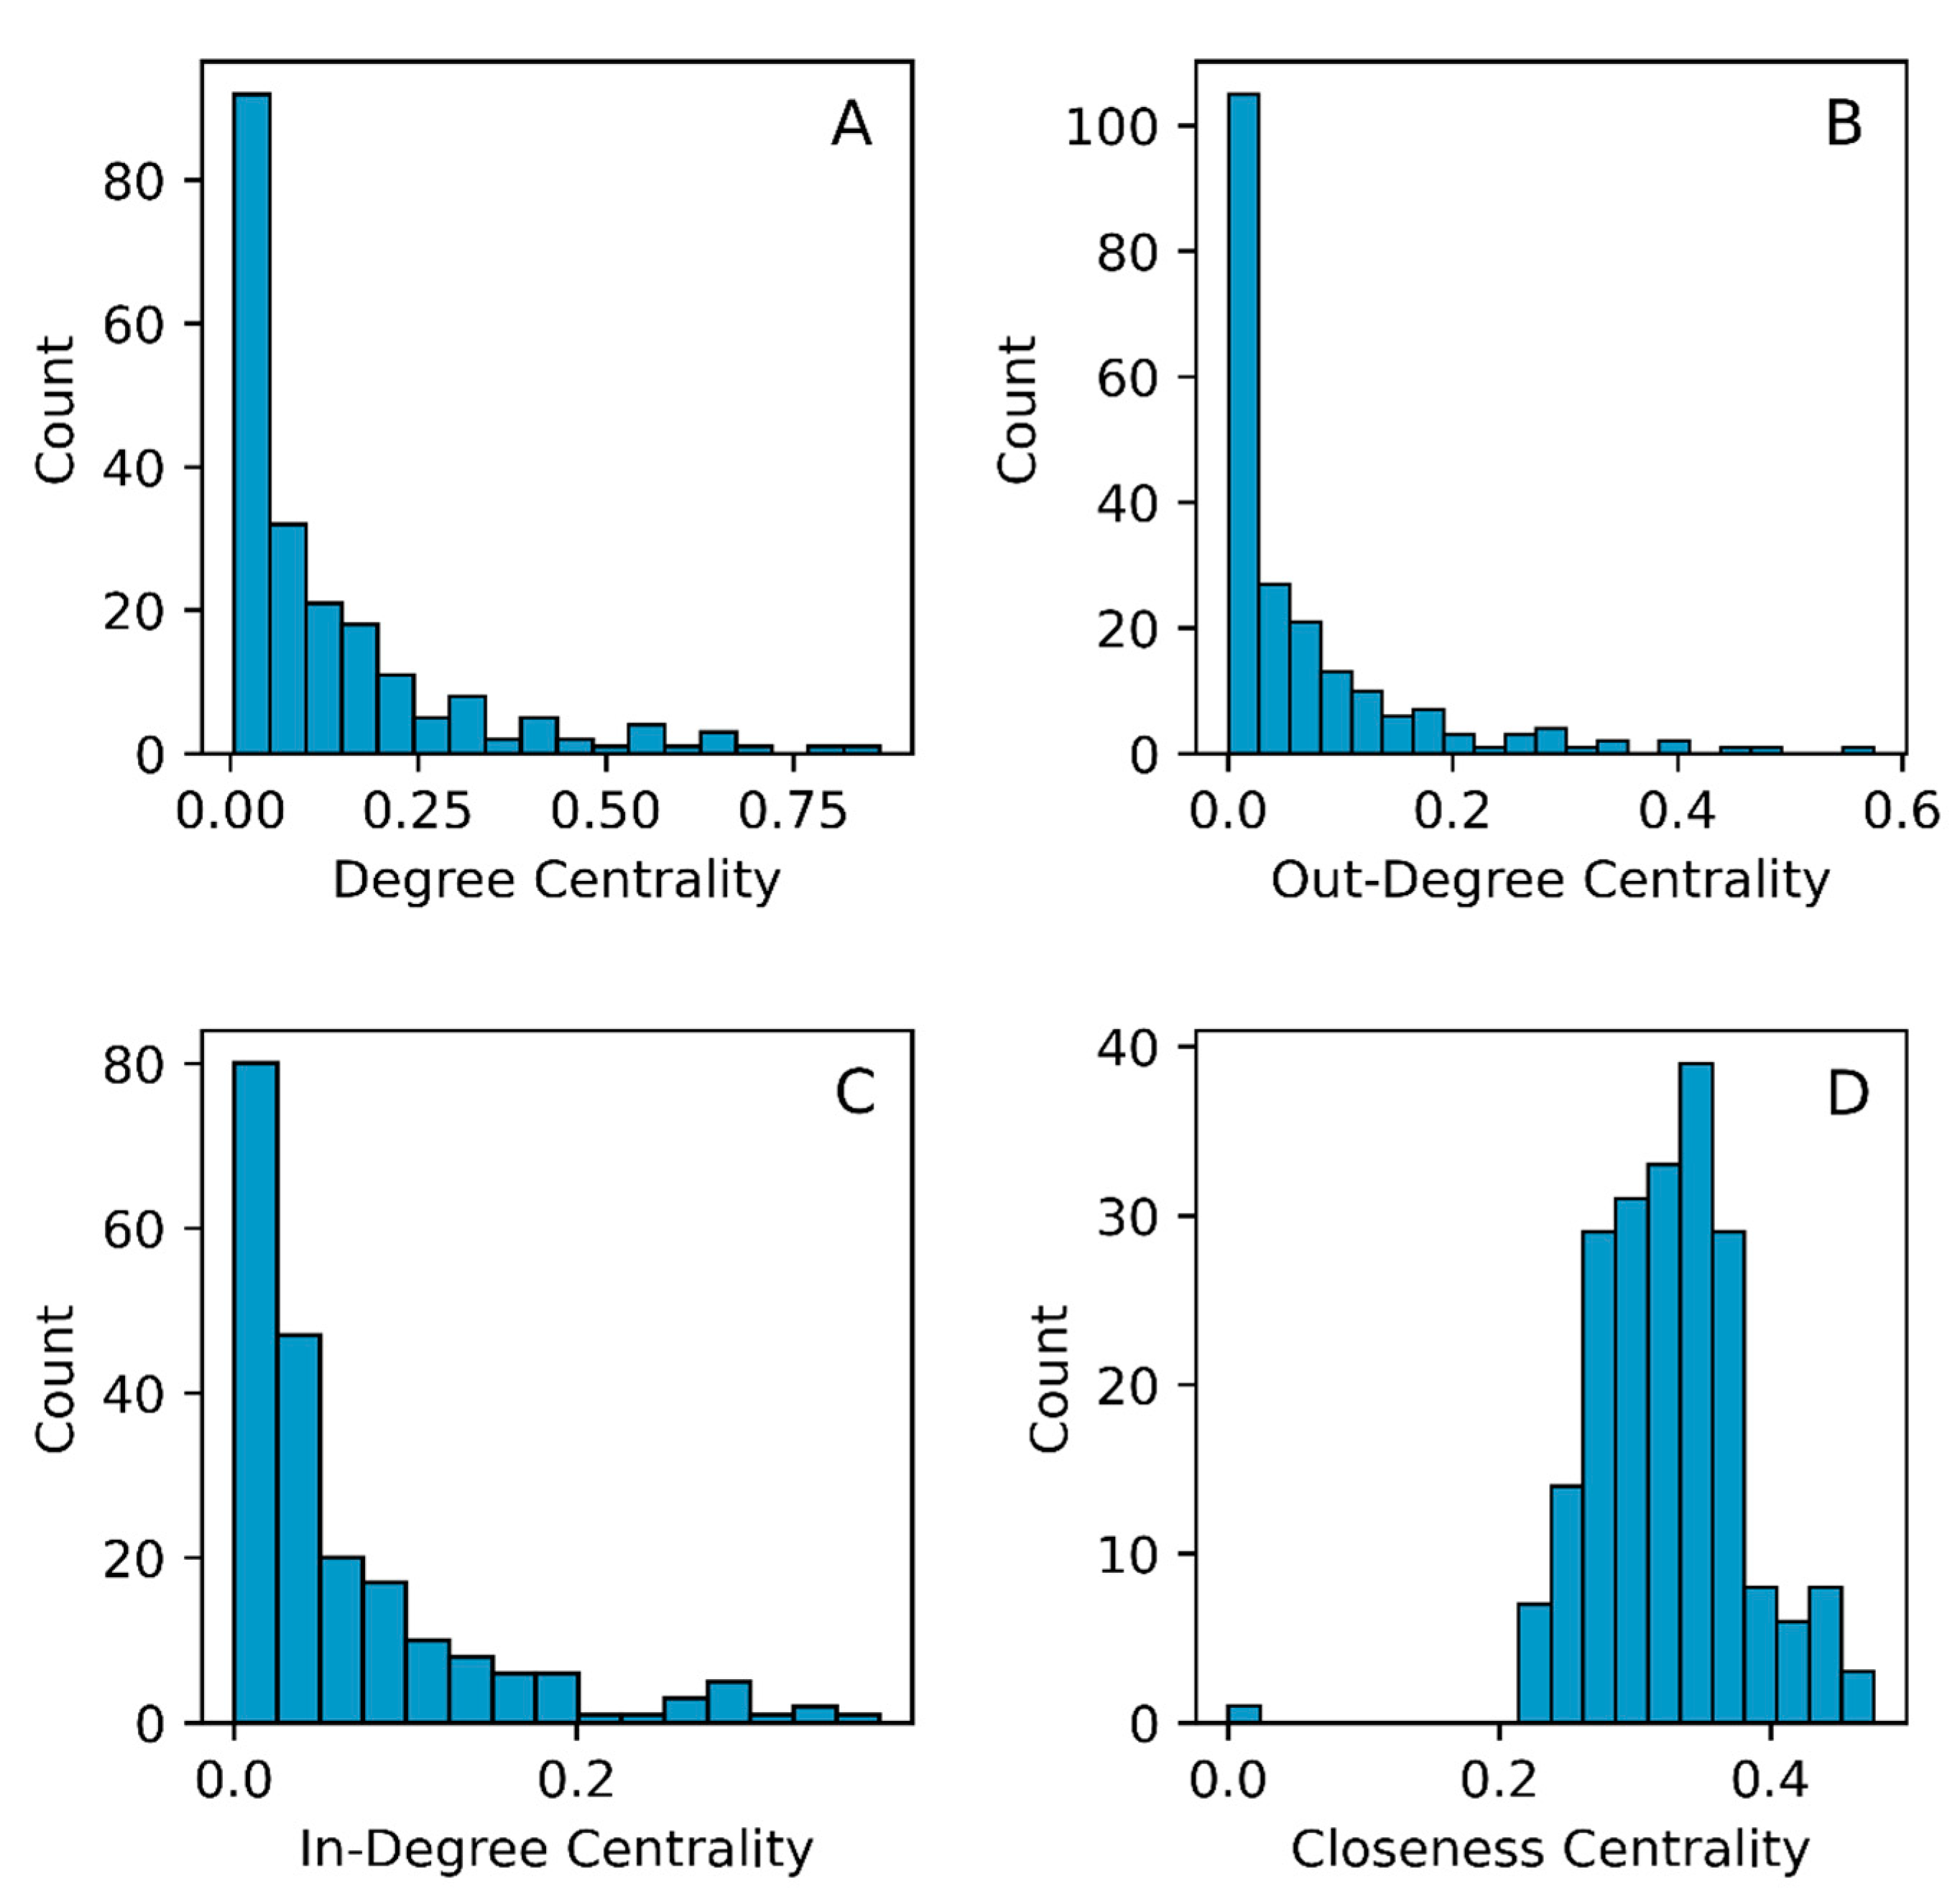
3.1. The Aggregate Energy Trade Network

We first present the distribution of country-level values of degree centrality, which measures connectivity of a node to the rest of the world, finding it to be positively skewed (Figure 2). The US exhibits the highest degree centrality of 0.865, meaning that it is connected to 86.5% of all countries, whereas the mean degree centrality = 0.133. This indicates that a few countries are highly connected to others via energy trade, whereas most countries have few connections. Mean out-degree and mean in-degree centrality, which measure the fraction of export links and import links, respectively, are also skewed, with the US having the highest out-degree centrality at 0.575 and the Netherlands having the highest in-degree centrality at 0.377. Thus, the US exports to more countries than any other and the Netherlands imports from more than any other.
The network’s mean closeness centrality, which measures the inward distance from a node to all reachable nodes, is 0.326. A higher closeness centrality indicates that a country is more centrally located in the trade network and has a short path length to other nodes. We find that the Netherlands has the highest closeness centrality at 0.476, followed by India at 0.456.

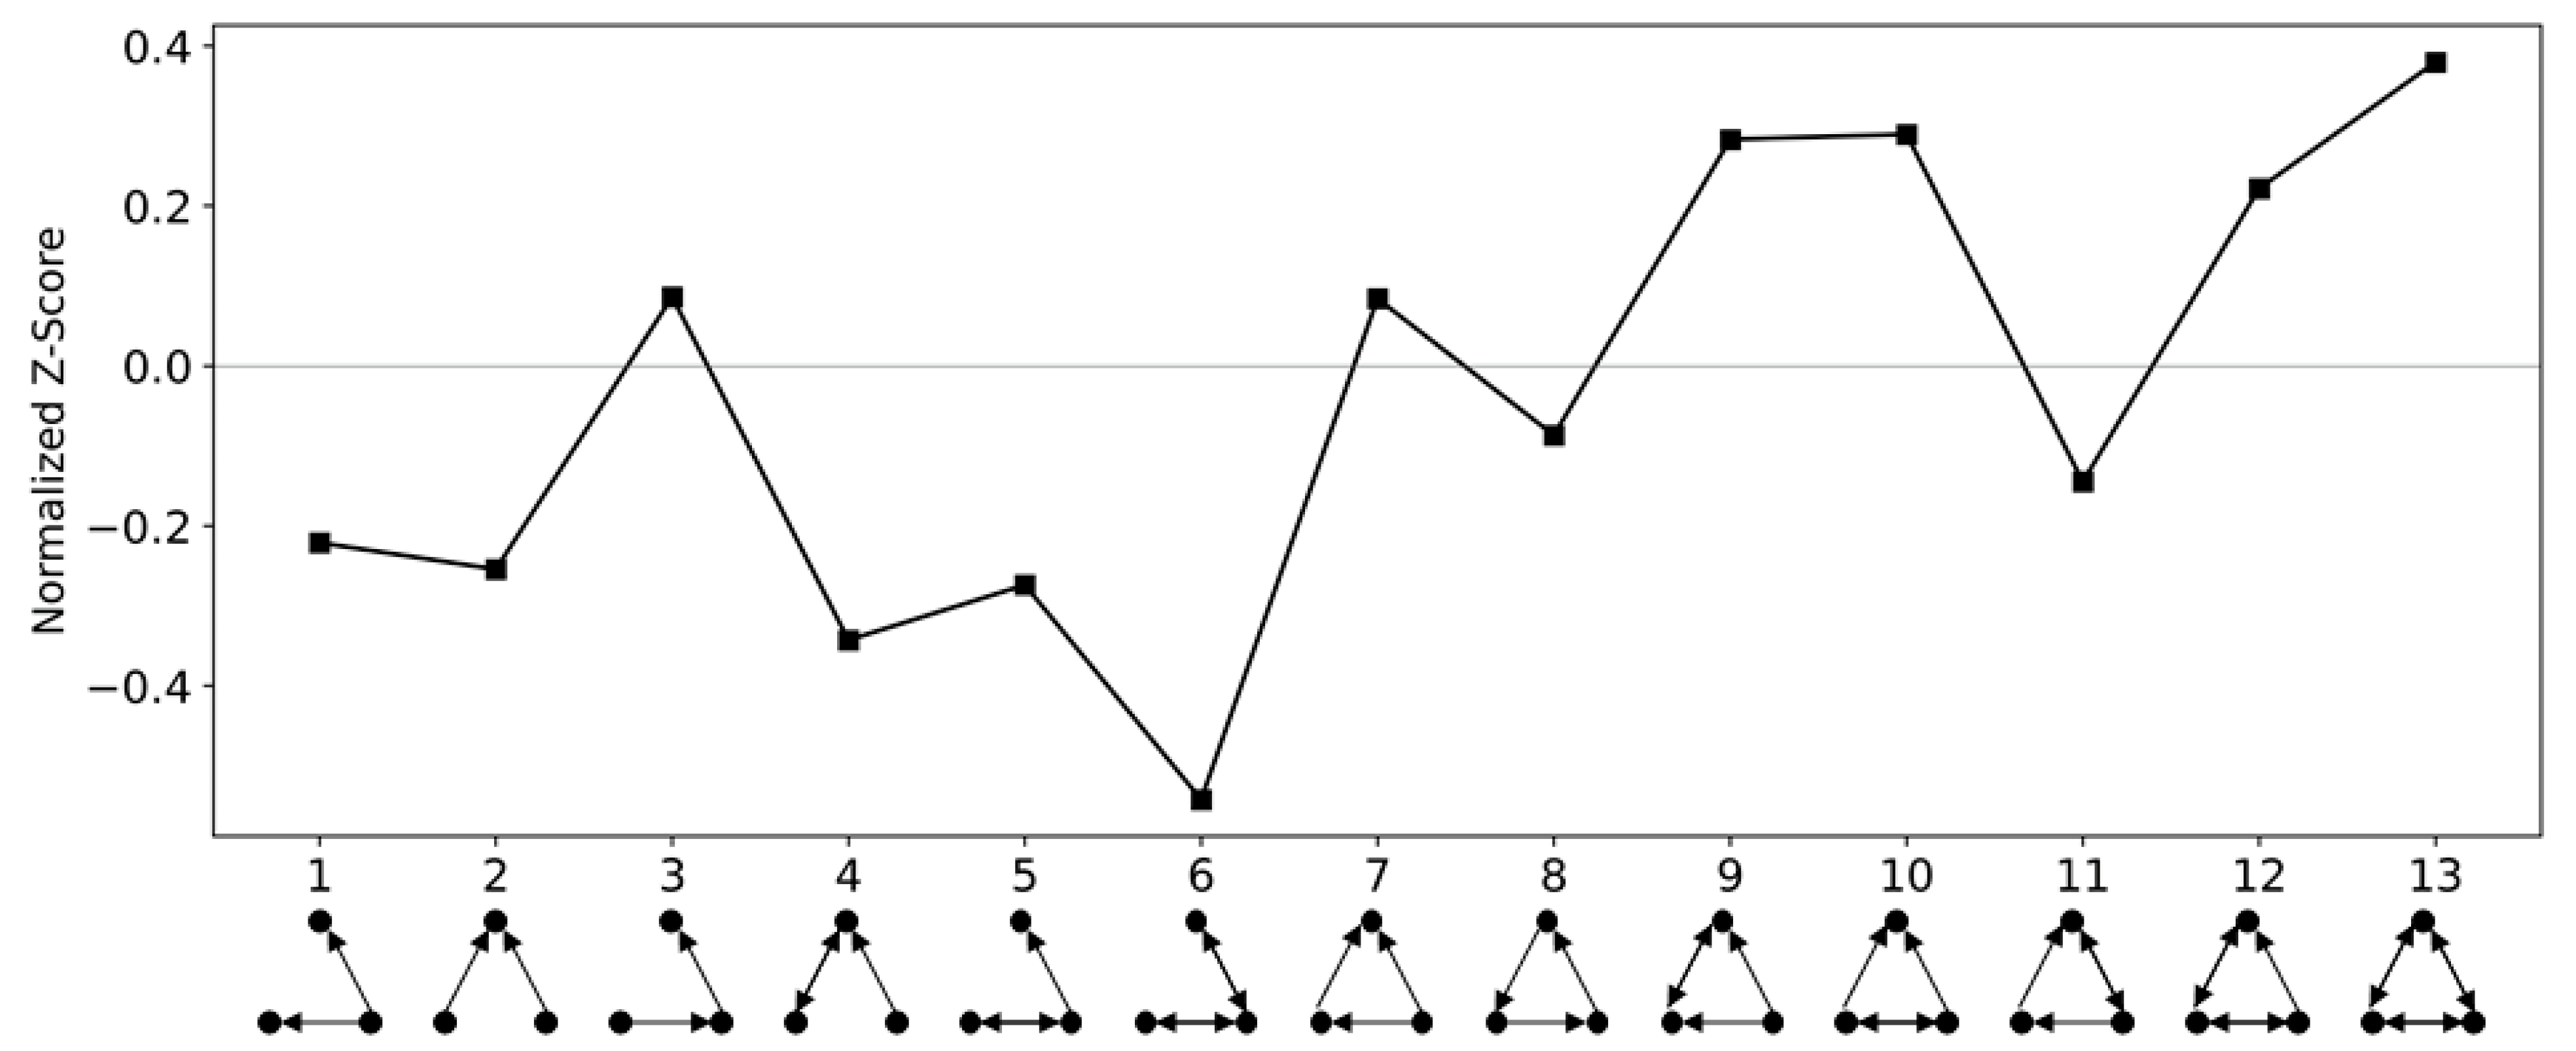
3.2. Triad Significance Profile (TSP): Motifs and Anti-Motifs

The TSP for the aggregate energy trade network is presented in Figure 3. Motifs, meaning triads that appear considerably more often than expected, include triads 9, 10, 12, and 13, with normalized Z-scores of 0.28, 0.29, 0.22, and 0.38, respectively. Anti-motifs, those triads that appear less than expected, include triads 1, 2, 4, 5, and 6 with normalized Z-scores of −0.22, −0.25, −0.34, −0.27, and −0.54, respectively.
Here we focus our discussion on triads that have been shown in the literature to impact network stability, conflict, and efficiency. Triad 13, which exhibits the greatest possible transitivity and is the strongest motif of the energy trade network, is commonly identified as a motif in human social networks [40,44]. Researchers assert that this is due to the phenomenon of triadic closure in social networks, which can be informally described as the pressure for two people that are friends with a third person to also be friends with each other [45,46]. The overrepresentation of triad 13 suggests that energy trade relationships are partly a manifestation of human social dynamics. Because triadic closure is considered to be a more stable configuration, it also suggests that some degree of stability is induced in the structure of the energy trade network through triadic closure.
On the other hand, the intransitive triad 6, referred to as the “frustration” triad, is typically an anti-motif in human social networks. It arises when triadic closure has not occurred and is thus considered destabilizing in structural balance theory [44]. We find triad 6 to be the strongest anti-motif of the aggregate energy trade network, meaning this structurally unstable triad appears far less frequently than expected in the network. This similarity to human social networks, in terms of the low occurrence of this unstable triad, further suggests that energy trade is partly structured by human social dynamics and that this social influence enhances network stability.
Finally, we examine triad 7, known as the “feed-forward loop”, which is known to be critical for efficiency and self-regulation in networks governing multiple types of complex systems, especially evolved biological systems [36,41,47]. A higher-than-expected prevalence of triad 7 in certain genetic signal transduction pathways has even been associated with higher survival rates among breast cancer patients [48]. Although triad 7 was the strongest single motif found in TSPs of ant communication networks [41] and micro-organism gene transcription networks [40], we find that the observed frequency of triad 7 in the energy trade network is similar to its frequency computed from randomized networks.
Systems exhibiting a triad 7 motif have typically evolved over evolutionary time scales, and because global energy trade has largely emerged in only the last century, it may be that energy trade is simply too new for triad 7 to have emerged as a motif at this time. It is also possible that the highly dynamic nature of international trade relations inhibits the emergence of some triads. Regardless of the reason, the absence of triad 7 as a motif of the aggregate energy network suggests that the network is structured more by factors not directly related to trade efficiency, such as political, cultural, or geospatial factors [49].

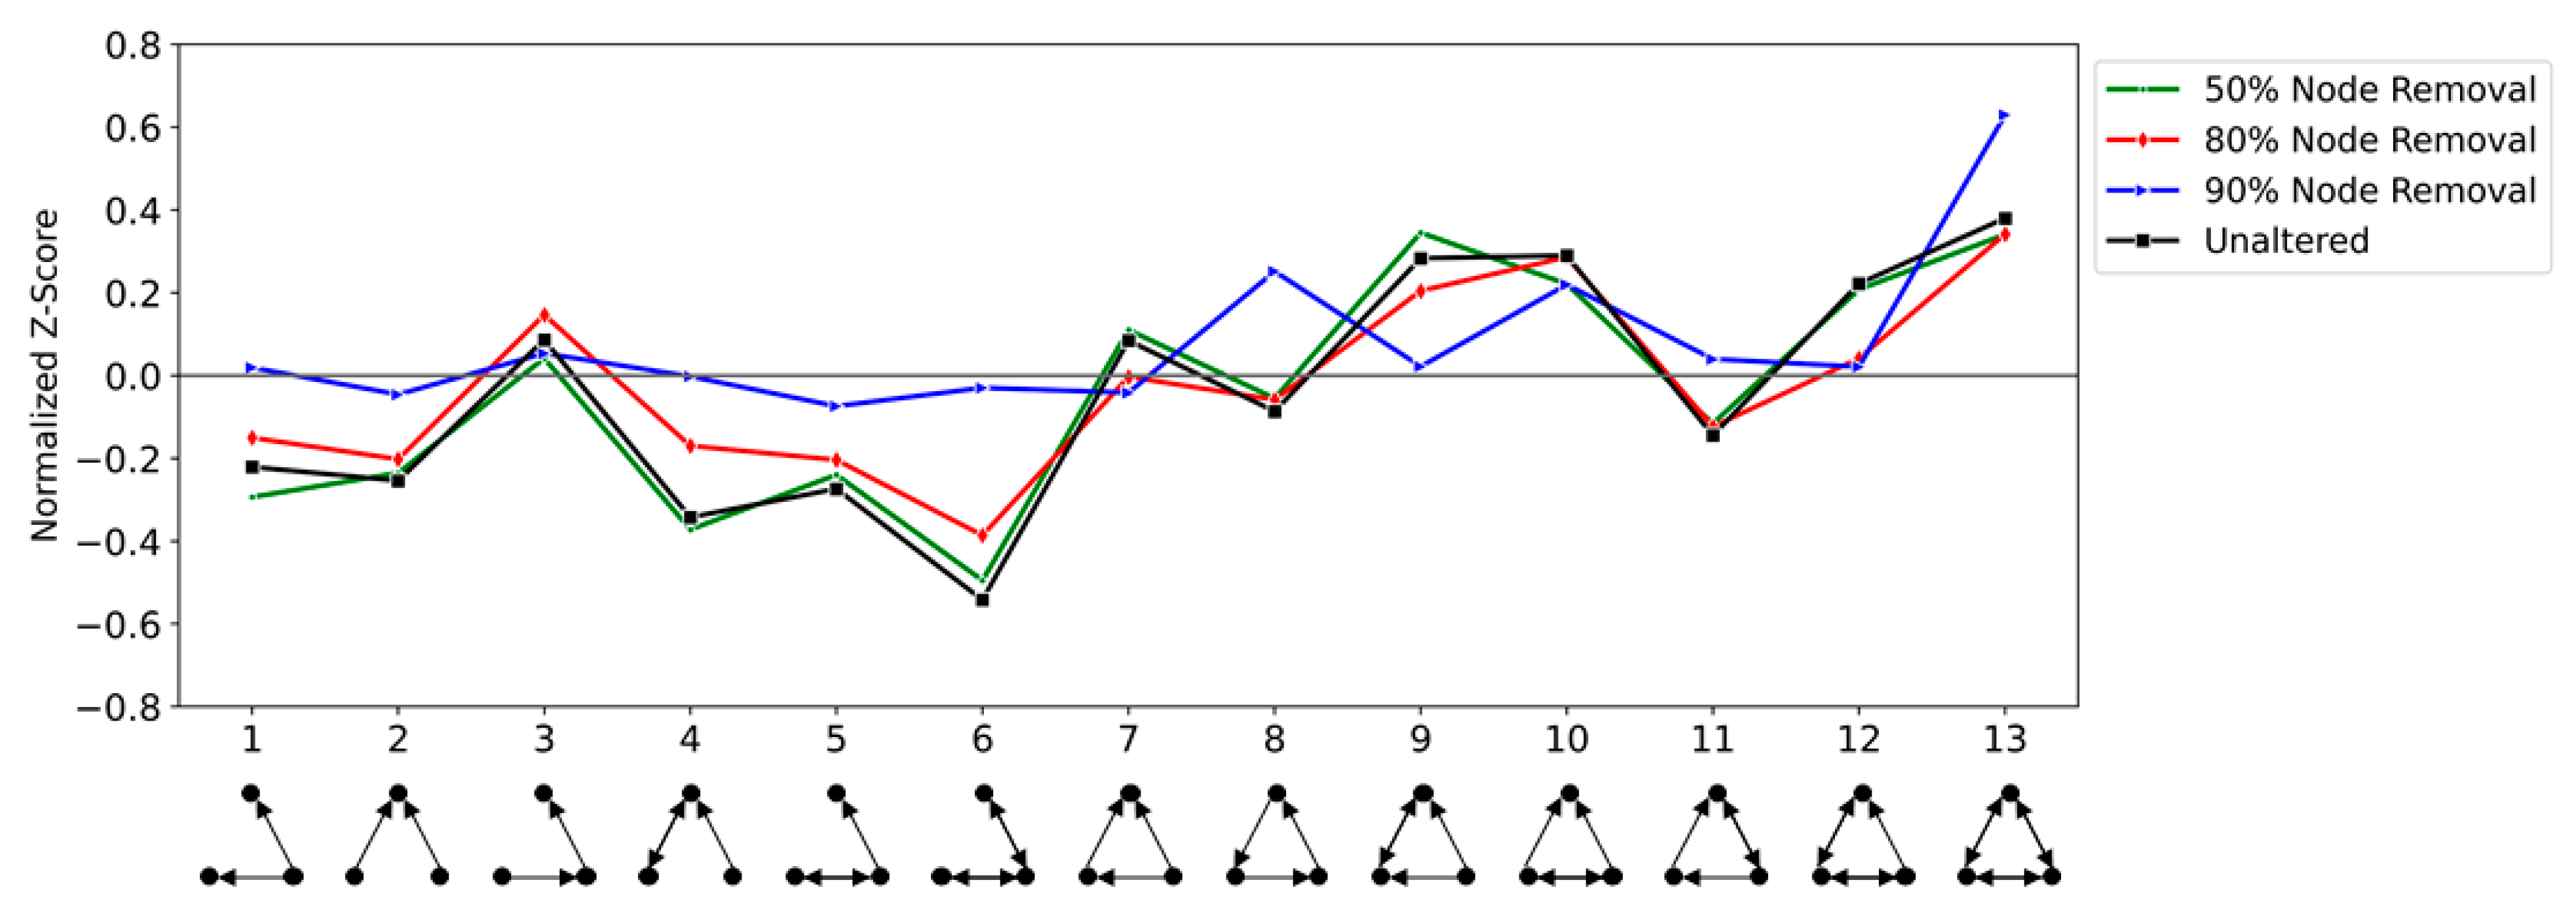
3.3. Network Robustness to Disruption: TSP Integrity under Random Node Removal

Although the presence and absence of certain triads suggest a degree of stability in the energy trade network, we systematically assess the robustness of the aggregate energy trade network to disruptions by randomly removing 25%, 50%, 80%, and 90% of nodes from the network and recalculating the network’s TSP. Note that removal of a node also removes all edges between that node and its partners. Ten replications were performed for each removal level and average TSPs were compared with the TSP of the unaltered network. Results (Figure 4) show virtually no change in the network’s TSP after removal of 50% of nodes (R = 0.99). Even after randomly removing 80% of nodes, the TPS of the disrupted networks and the unaltered network remained highly correlated (R = 0.96), suggesting that the aggregate energy network could experience a relatively large disruption and still maintain its topological integrity. Only after 90% of nodes were removed was the original TSP substantially altered (R = 0.53).

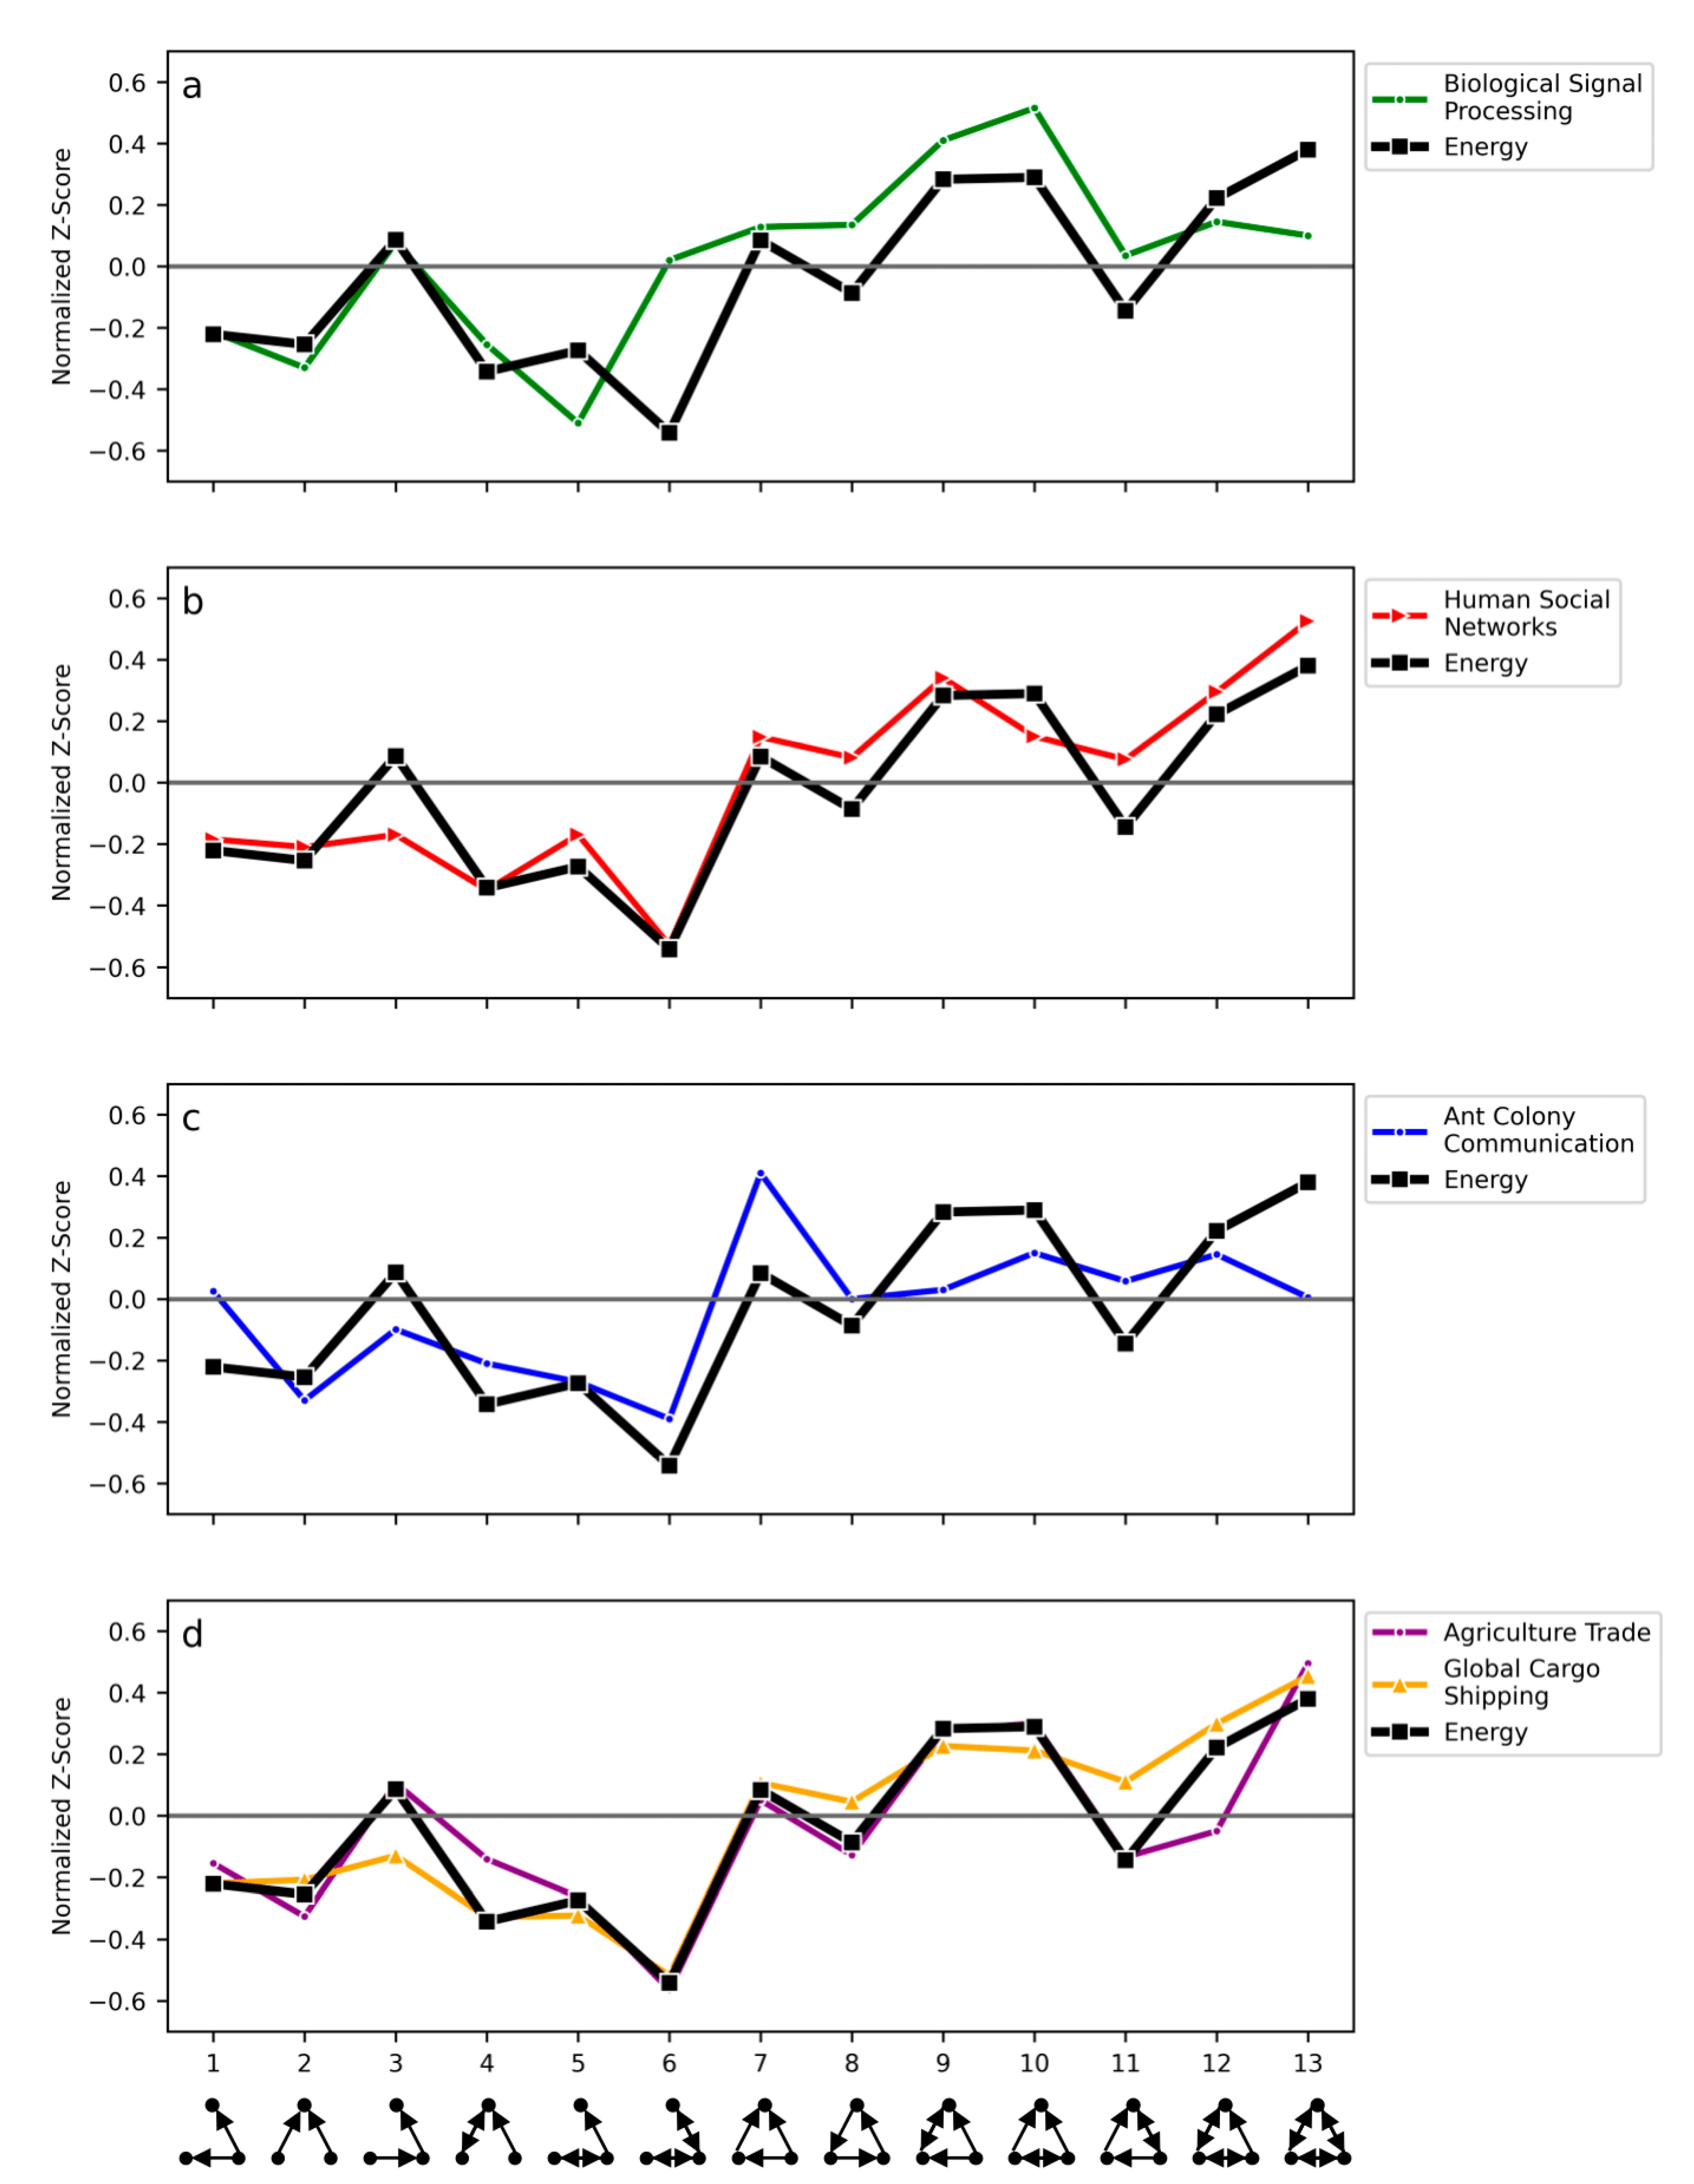
3.4. Comparison of Energy Trade to Other Network TSPs

To contrast the topology of energy trade with other empirical networks, we compare the TSP of the aggregate energy trade network to several other previously published TSPs. These include biological signal processing networks [40], human social networks [40], ant communication networks [41], agricultural trade networks [14], and ocean-based cargo shipping networks [42]. TSP comparisons are shown graphically in Figure 5 with correlation coefficients presented in Table 2.
Not surprisingly, the energy trade network TSP is most highly correlated with those of the global agricultural trade network (R = 0.93) and the ocean cargo shipping network (R = 0.92). As cargo-shipping routes are partly structured with regard for cost-efficiency, its high correlation with energy trade suggests that energy trade patterns are efficient despite the fact that the efficiency-related feed-forward loop (triad 7) is not a strong motif of the energy network.
On the other hand, both energy and agricultural trade differ from the cargo shipping network in terms of triad 3. This “middleman” triad is indicative of products that require multi-stage refining in multiple countries and of the fact that countries may import and export different commodities that are nevertheless grouped under a single commodity code in trade statistics. However, this does not appear to manifest in the cargo shipping network, in which triad 3 is an anti-motif. This is likely because cargo shipping is independent of the commodities being shipped and multi-stage production processes are masked by the efficient scheduling of routes carrying all types of products.
As noted in the analysis of individual triads, the aggregate energy trade network shares a key motif (triad 13) and anti-motif (triad 6) with human social networks. This similarity is reinforced when comparing the full TSPs of energy trade and social networks (R = 0.91). This strong resemblance further reinforces the notion that the topology of global trade is largely a manifestation of human sociality.

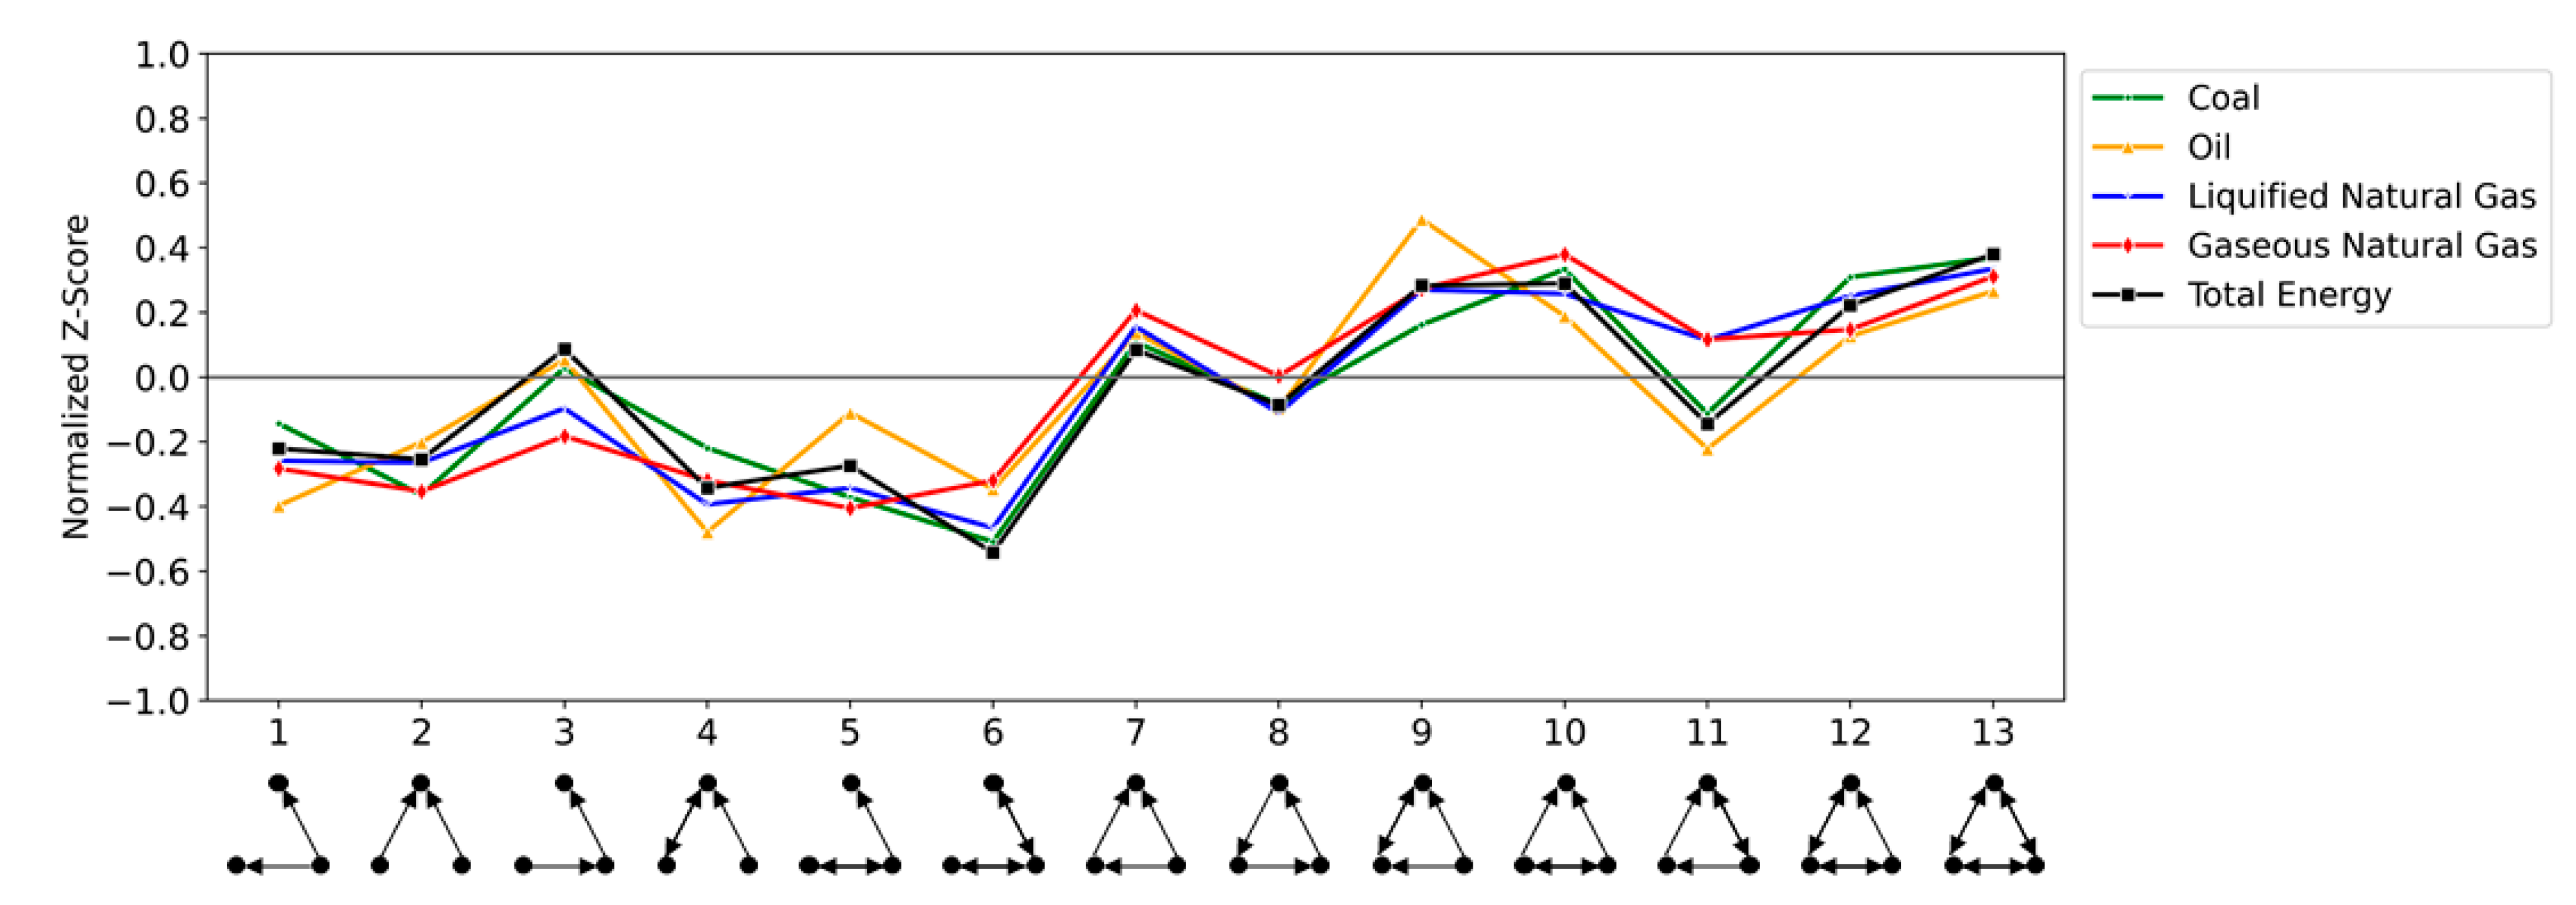
3.5. Disaggregated Energy Trade: Commodity-Specific Trade Networks

Note that when a country A exports more than one energy commodity to a partner B, this is represented by a single link from A to B in the aggregate energy network. Thus, the characteristics of individual commodity networks can be masked when they are collapsed into an aggregate network. Therefore, we also created TSPs for the trade networks of each individual energy commodity (Figure 6). Correlations between these individual commodity networks and other networks discussed in this study are presented in Table 2.
All commodity-specific trade networks are highly correlated with aggregate energy trade, with coal being the most similar (R = 0.96) and gaseous natural gas being the least similar (R = 0.87). The TSPs for both liquid and gaseous natural gas are notable because, unlike aggregate energy, oil, and coal, we identify triad 11 as a motif and triad 3 as an anti-motif.
Triad 3, or the “middleman” triad, is representative of situations in which a country may possess considerable natural resources but lacks the ability to refine those resources into final energy commodities. For instance, after discovering massive petroleum deposits in its territorial waters, Guyana began producing oil in 2019 [50]. However, it still lacks the capacity to refine petroleum and so its oil must be exported to other countries for refinement, even as Guyana remains dependent on imports for energy consumption. This arrangement is an instantiation of triad 3. Thus, it is likely that natural gas requires fewer intermediate production stages than oil or coal.

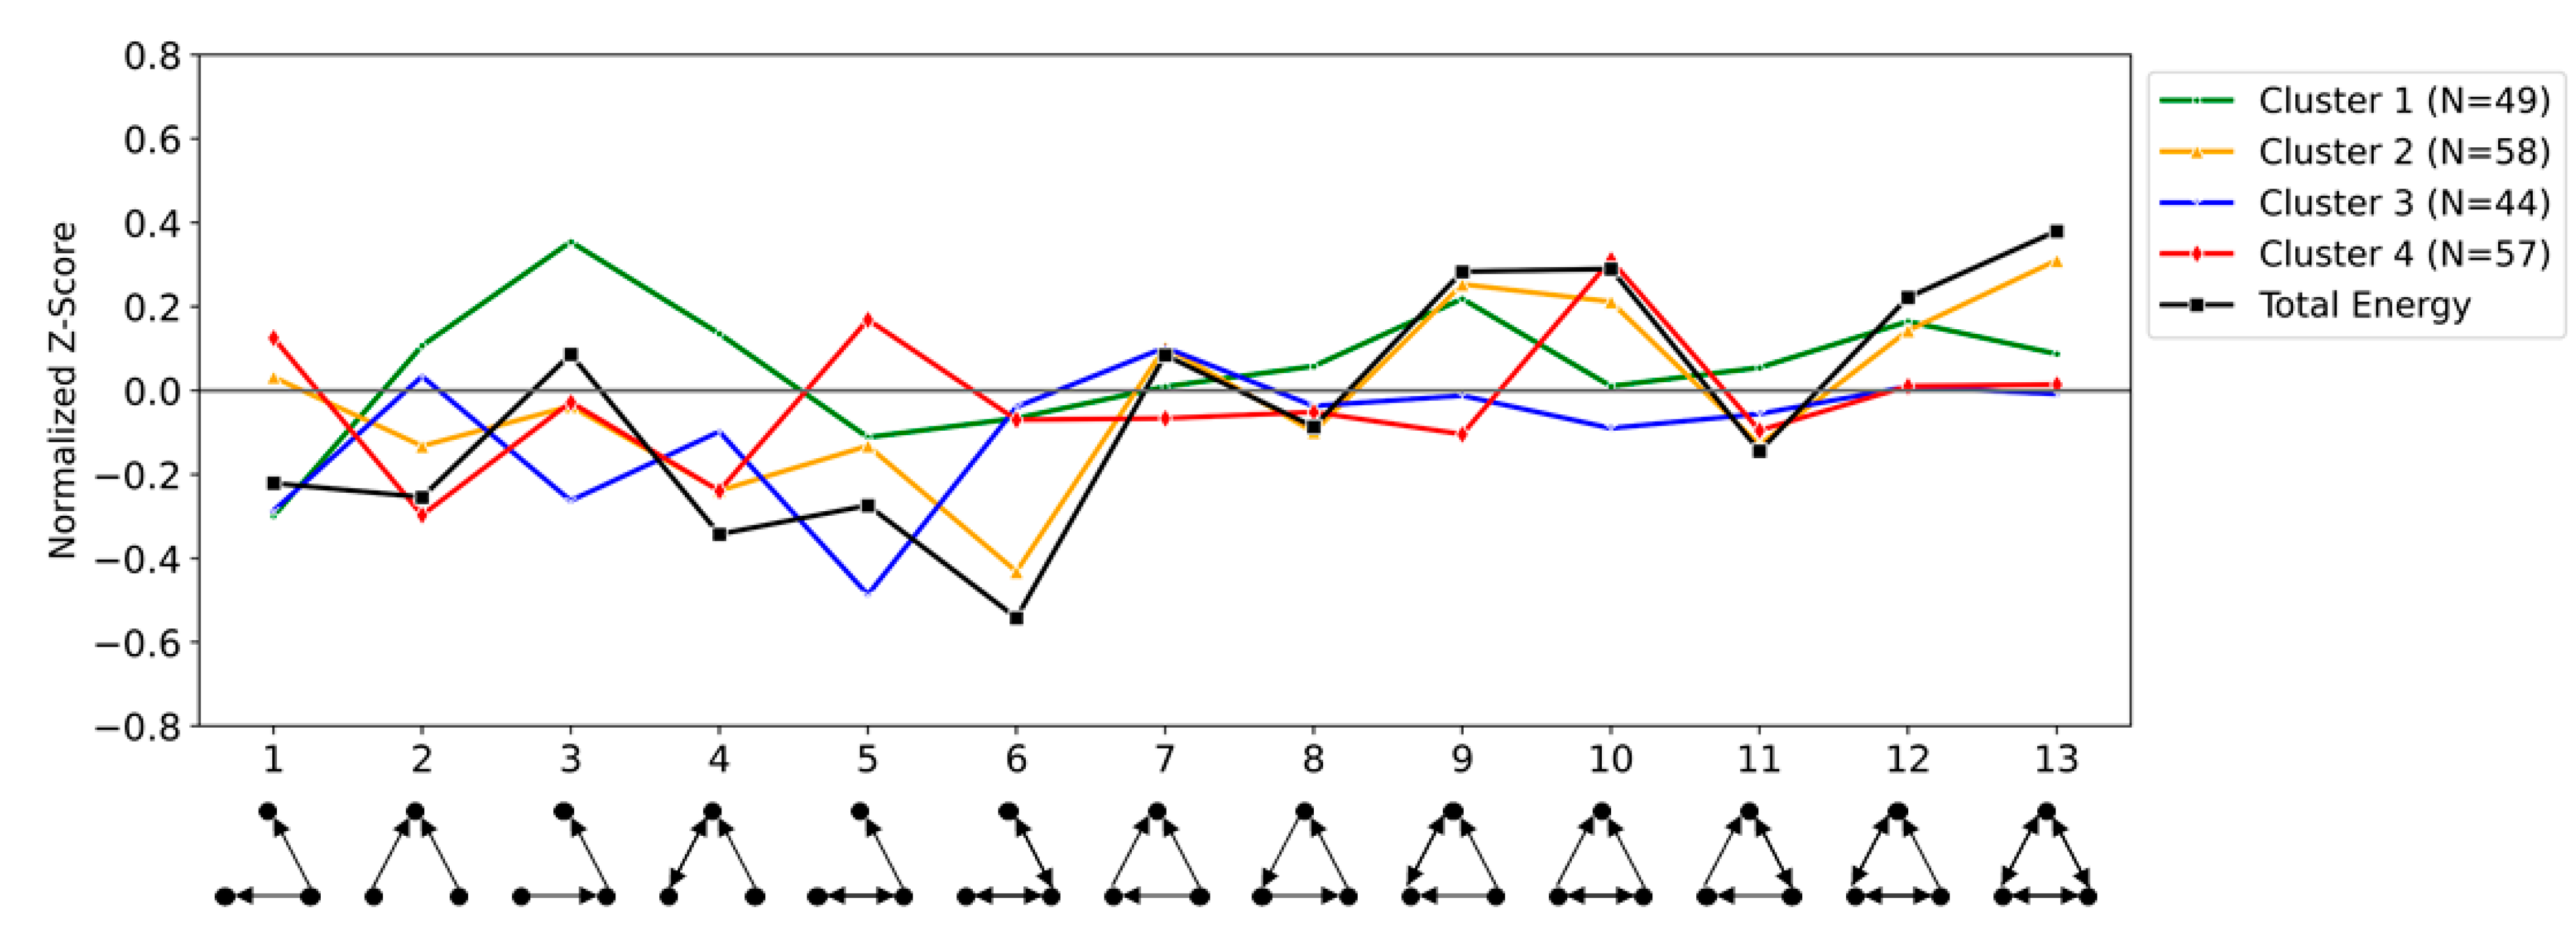
3.6. Disaggregated Energy Trade: Country-Specific Triad Significance Profiles

To understand how the network topology of energy trade varies by country, we calculated TSPs for each country separately. A TSP for country X was calculated by counting the numbers of each triad type that included country X in both the empirical and randomized networks and then comparing those values as we did with the full network. We then used K-means clustering to partition countries into four groups (as suggested by silhouette coefficients). The average (centroid) TSPs of each cluster is presented in Figure 7. See Supplemental Materials for a list of all countries in each cluster.
Most larger economies fall into cluster 2, including the USA, Australia, India, Germany, Japan, Russia, and several members of the European Union. This was the only cluster highly correlated with the aggregate energy network (R = 0.94), suggesting that these countries are relatively well-connected and trade a diversity of different energy commodities. This idea is reinforced by the fact that, among all clusters, only cluster 2 is highly correlated with the global agricultural trade network (R = 0.90), which is composed of trade in a high diversity of agricultural products.
On the other hand, China falls into cluster 1 along with several countries from Africa, including Algeria, Libya, Nigeria, Angola, Congo, Ethiopia, and others. Cluster 1 has less similarity to the aggregate energy network (R = 0.44) and is unique among clusters in having a strong motif in triad 3, the “middleman” triad. As noted above, this may be an indication that many of these countries have limited capacity to fully refine their endowments of natural energy resources.
Clusters 3 and 4 deviate even further from the aggregate energy TSP with R = 0.29 and R = 0.34, respectively. However, they also differ significantly from each other (R = −0.49). Many members of these clusters are less developed economies from the global south as well as smaller and island nations, including nearly all countries of the Caribbean Sea and Pacific Ocean. Countries in these clusters are generally characterized by fewer trade links to other countries, which likely influences their peculiar trade network topology.
Cluster 4 is also unique in that triad 5 is a motif. Triad 5 involves two countries engaged in mutual trade, only one of which exports to an isolated 3rd country. Many of the small, island nations in cluster 4 are dominated by this trade arrangement because of their complete dependence on a large, well-connected neighbor for energy imports. For instance, all energy imported by Macao in Southeast Asia comes from China, whereas all energy imported by the Cayman Islands in the Caribbean Sea comes from the US. However, both China and the US have several bilateral trade relationships meaning that Macao and the Cayman Islands—both members of cluster 4—will be part of several type 5 triads.
One implication of the existence of country clusters in the global network is that shocks may exhibit differential impacts among clusters, particularly when the source of a shock is specific to one country. It is also important to note that the constituents of clusters typically change over time [16], and although it is beyond the scope of this study, temporal analysis would likely enhance our knowledge of the developmental and security implications of different clusters.
In addition to identifying clusters based on country TSPs, we examined the normalized Z-scores of certain triads within individual country TSPs. If global energy trade is, in fact, influenced by triadic closure and structural balance, as are human social networks, it is conceivable that these phenomena impact stability at the country level. In other words, countries with a high prevalence of triad 6, or low prevalence of triad 13—opposite to both human social networks and the aggregate energy trade network—may be less stable than other countries.
Thus, we list those countries in Table 3 that have either a normalized Z-score > 0.15 for triad 6 or a normalized Z-score < −0.15 for triad 13. Note that, with only one exception, countries in both lists come from clusters 1, 3, or 4, suggesting that the energy networks of countries in these clusters are, to some degree, anomalous and should be further researched with regard to energy vulnerability. This is particularly true of the Democratic Republic of the Congo, which appears in both lists.

3.7. Policy Implications

Although the primary benefit of triad analysis is to better understand the fundamental structural properties of networks, this understanding might also be used to enhance policy decisions [51]. For instance, given two possible future trade relationships, a policy maker may explore how each scenario would affect a country’s number of stable and unstable triads. Moreover, for those managing a nation’s energy portfolio, a comparison of a country’s commodity specific TSPs may highlight energy commodities that exhibit more or less stable triad structures. This would allow managers to better allocate risk among components of an energy portfolio and adjust policies accordingly.
This additional information becomes particularly useful during periods of relatively rapid change in trade patterns, such as that expected in a looming global transition to low carbon energy sources. Thus, assessment of risks and vulnerabilities will become increasingly important as a global transition will not only reconfigure existing trade patterns but will likely add novel energy commodities to the mix.
In any case, it is important to understand that triad analysis augments the information available to policy makers, but it should not replace existing information. Its utility is thus in providing additional data and insights with the goal of improving policy outcomes.

3.8. Limitiations of Our Approach and Future Directions

Despite the increasing use of triad analysis and TSPs to compare networks across domains, caution should be taken in interpreting results. Although it is compelling to find that networks governing systems as different as genetic transcription pathways and global oil trade have evolved structural similarities, our methodology cannot explain what has led to those similarities. It is possible that any complex and dynamic system will eventually evolve common non-random connectivity characteristics. It is also possible that the method itself cannot adequately detect subtle differences between network structures. Critics have also argued that results of triad analyses are simply manifestations of lower-order network structures which should instead be the target of research [39,52].
Nevertheless, triad analysis offers several tantalizing directions for future extensions of this research. First, we have examined a only single year of data and additional insights are likely to emerge from analyzing the topologies of trade networks over time. This is especially important for understanding how trade structure responds to global shocks on both short and longer time scales. Such analysis may also reveal that the motifs or anti-motifs we identified are temporary phenomena related to the development trajectories of global trade patterns.
Second, our examination of the robustness of trade to disruption is limited to the systematic removal of random nodes. However, each node in real world trade networks is unique and has differential impacts on global dynamics. Thus, a systematic analysis of disruption due to removal of specific nodes could be undertaken.
Finally, we removed the weights from our networks as a requirement for constructing triad significance profiles. However, this ignores a wealth of additional information concerning trade structure. Future work could incorporate trade value to construct weighted networks and apply novel analytic techniques to those links, such as using entropy to measure the diversity of commodity sources and then analyzing how that entropy relates to national energy security.

Supplementary Materials

The following supporting information can be downloaded at: https://www.mdpi.com/article/10.3390/en15103673/s1, Table S1: Normalized Z-scores of triad significance profiles referenced in the manuscript; Table S2: List of countries by cluster, identified through K-means clustering.

Author Contributions

Conceptualization, S.T.S., K.W. and R.M.; software, S.T.S., K.W. and R.M.; validation, S.T.S., K.W. and R.M.; formal analysis, S.T.S., K.W. and R.M.; data curation, K.W.; writing—original draft preparation, S.T.S., K.W. and R.M.; funding acquisition, S.T.S. All authors have read and agreed to the published version of the manuscript.

Funding

This material is based upon work supported by the Air Force Office of Scientific Research under award number FA9550-21-1-0140. Any opinions, findings, and conclusions or recommendations expressed in this material are those of the author(s) and do not necessarily reflect the views of the United States Air Force.

Data Availability Statement

All data used in this paper is publicly available from the United Nations Statistics Division at http://comtrade.un.org/ (accessed on 24 February 2022). Software for creating triad significance profiles (mFinder v1.2) is freely available from https://www.weizmann.ac.il/mcb/UriAlon/download/network-motif-software (accessed on 14 November 2021).

Conflicts of Interest

The authors declare no conflict of interest.

References

  1. UNEP. Towards a Green Economy: Pathways to Sustainable Development and Poverty Eradication; United Nations Environment Programme: Nairobi, Kenya, 2011. [Google Scholar]
  2. Rockström, J.; Gaffney, O.; Rogelj, J.; Meinshausen, M.; Nakicenovic, N.; Schellnhuber, H.J. A roadmap for rapid decarbonization. Science 2017, 355, 1269–1271. [Google Scholar] [CrossRef] [Green Version]
  3. US. National Academies of Sciences, Engineering, and Medicine. Accelerating Decarbonization in the U.S. Energy System; The National Academies Press: Washington, DC, USA, 2021.
  4. International Energy Agency. Renewables 2021: Analysis and Forecast to 2026; Organisation for Economic Cooperation and Development: Washington, DC, USA, 2021; Available online: https://www.iea.org/reports/renewables-2021 (accessed on 22 March 2022).
  5. Yang, Y. Energy globalization of China: Trade, investment, and embedded energy flows. J. Geogr. Sci. 2022, 32, 377–400. [Google Scholar] [CrossRef]
  6. Finley, M. Energy Security and the Energy Transition: A Classic Framework for a New Challenge; Vol. Baker Institute Report no. 11.25.19; Rice University’s Baker Institute for Public Policy: Houst, TX, USA, 2019. [Google Scholar]
  7. United Nations Statistics Division. UN COMTRADE: International Merchandise Trade Statistics; United Nations: New York, NY, USA, 2021; Available online: http://comtrade.un.org/ (accessed on 24 February 2022).
  8. De Benedictis, L.; Tajoli, L. The World Trade Network. World Econ. 2011, 34, 1417–1454. [Google Scholar] [CrossRef]
  9. Derudder, B.; Witlox, F. World City Networks and Global Commodity Chains: An introduction. Glob. Netw. 2010, 10, 1–11. [Google Scholar] [CrossRef] [Green Version]
  10. Li, X.; Ying Jin, Y.; Chen, G. Complexity and synchronization of the World trade Web. Phys. A Stat. Mech. Its Appl. 2003, 328, 287–296. [Google Scholar] [CrossRef]
  11. Sacks, M.A.; Ventresca, M.J.; Uzzi, B. Global institutions and networks—Contingent change in the structure of world trade advantage, 1965–1980. Am. Behav. Sci. 2001, 44, 1579–1601. [Google Scholar]
  12. Serrano, M.A.; Boguna, M. Topology of the world trade web. Phys. Rev. E 2003, 68 Pt 2, 015101. [Google Scholar] [CrossRef] [Green Version]
  13. De Benedictis, L.; Tajoli, L. Comparing sectoral international trade networks. Aussenwirtschaft 2010, 65, 167–189. [Google Scholar]
  14. Shutters, S.T.; Muneepeerakul, R. Agricultural Trade Networks and Patterns of Economic Development. PLoS ONE 2012, 7, e39756. [Google Scholar] [CrossRef]
  15. Sartori, M.; Schiavo, S. Connected we stand: A network perspective on trade and global food security. Food Policy 2015, 57, 114–127. [Google Scholar] [CrossRef] [Green Version]
  16. Wang, J.; Dai, C. Evolution of Global Food Trade Patterns and Its Implications for Food Security Based on Complex Network Analysis. Foods 2021, 10, 2657. [Google Scholar]
  17. Hou, W.; Liu, H.; Wang, H.; Wu, F. Structure and patterns of the international rare earths trade: A complex network analysis. Resour. Policy 2018, 55, 133–142. [Google Scholar] [CrossRef]
  18. Berdysheva, S.; Ikonnikova, S. The Energy Transition and Shifts in Fossil Fuel Use: The Study of International Energy Trade and Energy Security Dynamics. Energies 2021, 14, 5396. [Google Scholar] [CrossRef]
  19. Dalin, C.; Konar, M.; Hanasaki, N.; Rinaldo, A.; Rodriguez-Iturbe, I. Evolution of the global virtual water trade network. Proc. Natl. Acad. Sci. USA 2012, 109, 5989–5994. [Google Scholar] [CrossRef] [Green Version]
  20. Konar, M.; Dalin, C.; Suweis, S.; Hanasaki, N.; Rinaldo, A.; Rodriguez-Iturbe, I. Water for food: The global virtual water trade network. Water Resour. Res. 2011, 47, W05520. [Google Scholar] [CrossRef] [Green Version]
  21. Suweis, S.; Konar, M.; Dalin, C.; Hanasaki, N.; Rinaldo, A.; Rodriguez-Iturbe, I. Structure and controls of the global virtual water trade network. Geophys. Res. Lett. 2011, 38, L10403. [Google Scholar] [CrossRef] [Green Version]
  22. Chen, B.; Li, J.S.; Wu, X.F.; Han, M.Y.; Zeng, L.; Li, Z.; Chen, G.Q. Global energy flows embodied in international trade: A combination of environmentally extended input–output analysis and complex network analysis. Appl. Energy 2018, 210, 98–107. [Google Scholar] [CrossRef]
  23. Zhong, W.; An, H.; Shen, L.; Fang, W.; Gao, X.; Dong, D. The roles of countries in the international fossil fuel trade: An emergy and network analysis. Energy Policy 2017, 100, 365–376. [Google Scholar] [CrossRef]
  24. Scienceman, D.M. Energy and Emergy. In Environmental Economics: The Analysis of a Major Interface; Pillet, G., Murota, T., Eds.; R. Leimgruber: Geneva, Switzerland, 1987; pp. 257–276. [Google Scholar]
  25. Garlaschelli, D.; Di Matteo, T.; Aste, T.; Caldarelli, G.; Loffredo, M.I. Interplay between topology and dynamics in the World Trade Web. Eur. Phys. J. B 2007, 57, 159–164. [Google Scholar] [CrossRef]
  26. Reyes, J.; Fagiolo, G.; Schiavo, S. Using a Complex Weighted-Network Approach to Assess the Evolution of International Economic Integration: The Cases of East Asia and Latin America; Sant’Anna School of Advanced Studies: Pisa, Italy, 2008. [Google Scholar]
  27. Distefano, T.; Laio, F.; Ridolfi, L.; Schiavo, S. Shock transmission in the International Food Trade Network. PLoS ONE 2018, 13, e0200639. [Google Scholar] [CrossRef] [Green Version]
  28. Piccardi, C.; Tajoli, L. Complexity, centralization, and fragility in economic networks. PLoS ONE 2018, 13, e0208265. [Google Scholar] [CrossRef]
  29. Wong, H.; Lu, Y.; Wang, F.; Landis, S.; Simmons, R.; Shutters, S.T.; Maciejewski, R. A Visual Analytics Framework for Spatiotemporal Trade Network Analysis. IEEE Trans. Vis. Comput. Graph. 2019, 25, 331–341. [Google Scholar] [CrossRef]
  30. Gao, C.; Sun, M.; Shen, B. Features and evolution of international fossil energy trade relationships: A weighted multilayer network analysis. Appl. Energy 2015, 156, 542–554. [Google Scholar] [CrossRef]
  31. Lu, W.; Su, M.; Zhang, Y.; Yang, Z.; Chen, B.; Liu, G. Assessment of energy security in China based on ecological network analysis: A perspective from the security of crude oil supply. Energy Policy 2014, 74, 406–413. [Google Scholar] [CrossRef]
  32. Yang, Y.; Poon, J.P.H.; Liu, Y.; Bagchi Sen, S. Small and flat worlds: A complex network analysis of international trade in crude oil. Energy 2015, 93, 534–543. [Google Scholar]
  33. Zhong, W.; An, H.; Gao, X.; Sun, X. The evolution of communities in the international oil trade network. Phys. A Stat. Mech. Its Appl. 2014, 413, 42–52. [Google Scholar] [CrossRef]
  34. Semanur, S.; Hüseyin, T.; Halil, Ö. An Alternative View to the Global Coal Trade: Complex Network Approach. Stud. Bus. Econ. 2020, 15, 270–288. [Google Scholar] [CrossRef]
  35. Wang, W.; Li, Z.; Cheng, X. Evolution of the global coal trade network: A complex network analysis. Resour. Policy 2019, 62, 496–506. [Google Scholar] [CrossRef]
  36. Milo, R.; Shen-Orr, S.; Itzkovitz, S.; Kashtan, N.; Chklovskii, D.; Alon, U. Network motifs: Simple building blocks of complex networks. Science 2002, 298, 824–827. [Google Scholar]
  37. Holland, P.W.; Leinhardt, S. A Method for Detecting Structure in Sociometric Data. Am. J. Sociol. 1970, 76, 492–513. [Google Scholar]
  38. Prell, C.; Skvoretz, J. Looking at Social Capital through Triad Structures. Connections 2008, 28, 4–16. [Google Scholar]
  39. Faust, K. A puzzle concerning triads in social networks: Graph constraints and the triad census. Soc. Netw. 2010, 32, 221–233. [Google Scholar] [CrossRef]
  40. Milo, R.; Itzkovitz, S.; Kashtan, N.; Levitt, R.; Shen-Orr, S.; Ayzenshtat, I.; Sheffer, M.; Alon, U. Superfamilies of evolved and designed networks. Science 2004, 303, 1538–1542. [Google Scholar]
  41. Waters, J.S.; Fewell, J.H. Information Processing in Social Insect Networks. PLoS ONE 2012, 7, e40337. [Google Scholar] [CrossRef]
  42. Kaluza, P.; Kölzsch, A.; Gastner, M.T.; Blasius, B. The complex network of global cargo ship movements. J. R. Soc. Interface 2010, 7, 1093–1103. [Google Scholar] [CrossRef]
  43. Kashtan, N.; Itzkovitz, S.; Milo, R.; Alon, U. Mfinder Version 1.2: Network Motifs Detection Tool. 2005. Available online: https://www.weizmann.ac.il/mcb/UriAlon/download/network-motif-software (accessed on 14 November 2021).
  44. Facchetti, G.; Iacono, G.; Altafini, C. Computing global structural balance in large-scale signed social networks. Proc. Natl. Acad. Sci. USA 2011, 108, 20953–20958. [Google Scholar] [CrossRef] [Green Version]
  45. Granovetter, M. The Strength of Weak Ties. Am. J. Sociol. 1973, 78, 1360–1380. [Google Scholar]
  46. Rapoport, A. Spread of information through a population with socio-structural bias: I. Assumption of transitivity. Bull. Math. Biophys. 1953, 15, 523–533. [Google Scholar] [CrossRef]
  47. Mangan, S.; Alon, U. Structure and function of the feed-forward loop network motif. Proc. Natl. Acad. Sci. USA 2003, 100, 11980–11985. [Google Scholar] [CrossRef] [Green Version]
  48. McGee, S.R.; Tibiche, C.; Trifiro, M.; Wang, E. Network Analysis Reveals A Signaling Regulatory Loop in the PIK3CA-mutated Breast Cancer Predicting Survival Outcome. Genom. Proteom. Bioinform. 2017, 15, 121–129. [Google Scholar] [CrossRef]
  49. Whitten, G.; Dai, X.; Fan, S.; Pang, Y. Do political relations affect international trade? Evidence from China’s twelve trading partners. J. Shipp. Trade 2020, 5, 21. [Google Scholar] [CrossRef]
  50. Balza, L.H.; Brearley, E.; Clarke, D.; Gauto, V. Traversing a Slipery Slope: Guyana’s Oil Opportunity (IDB Technical Note 1994); Inter-American Development Bank, Infrastucture and Energy Sector: Washington, DC, USA, 2020. [Google Scholar]
  51. Calvert, K. From ‘energy geography’ to ‘energy geographies’:Perspectives on a fertile academic borderland. Prog. Hum. Geogr. 2016, 40, 105–125. [Google Scholar] [CrossRef]
  52. Faust, K. Comparing social networks: Size, density, and local structure. Metodoloski Zv. 2006, 3, 185–216. [Google Scholar]
Figure 1. The 13 possible connected triads in a directed network. We disregard three other triads which have isolated (unlinked) nodes. For each triad type, we tabulate the number of times the triad appears in an empirical network and compare that to an expected value to generate a triad significance profile, or TSP.
Energies 15 03673 g001
Figure 2. Degree distributions for the 2019 global trade network of aggregate energy. Distributions are shown for (A) degree, (B) out-degree, (C) in-degree, and (D) closeness centrality. In all cases N = 208. Note that the network is highly skewed, meaning that most countries trade with a small fraction of possible partners.
Energies 15 03673 g002
Figure 3. Triad significance profile (TSP) of the global energy trade network. Motifs, which are triads that appear more frequently than expected, include triads 9, 10, 12, and 13. Anti-motifs, which are triads that appear less frequently than expected, include triads 1, 2, 4, 5, and 6. Triad 13 is frequently a motif of human social networks, whereas triad 6 is considered unbalanced and is typically an anti-motif of human social networks. Taken together, this suggests the topology of the global energy trade network is influenced by human sociality.
Energies 15 03673 g003
Figure 4. Robustness of aggregate energy trade network to disruption. TSPs of the aggregate energy network and of the same network after 50%, 80%, and 90% of nodes have been randomly removed. Each TSP is the average of 10 networks in which nodes have been randomly removed. Even after 80% of nodes have been removed, the correlation between the disrupted network’s TSP and the unaltered network is R = 0.96. Only after 90% of nodes have been removed is the TSP substantially altered (R = 0.53).
Energies 15 03673 g004
Figure 5. Comparison of the aggregate energy trade network TSP to other published TSPs, including (a) biological signal processing networks, (b) human social networks, (c) ant colony communication networks, (d) and two types of trade-related networks. Although energy trade shares several motifs and anti-motifs with both biological signal processing networks (R = 0.71) and human social networks (R = 0.91), it is most highly correlated with the network for global agricultural trade (R = 0.93). See Table 2 for a full set of correlation coefficients.
Energies 15 03673 g005
Figure 6. TSPs for individual energy commodity trade networks. Aggregate energy trade is included for comparison. All commodity networks are highly correlated with the aggregate energy network (R > 0.86 in all cases), with coal trade being most similar to aggregate energy trade. See Table 2 for full correlation coefficients.
Energies 15 03673 g006
Figure 7. Country cluster triad significance profiles (TSPs). K-means clustering was used to partition country-level TSPs into four groups. Cluster centroids are presented along with the TSP of the aggregate global energy trade network. Most large and developed economies fall into cluster 2, whereas most small and island nations fall into clusters 3 and 4. Cluster TSPs show considerable variability with some clusters being negatively correlated with each other. See Table 2 for full correlations and Supplemental Materials for full list of countries in each cluster.
Energies 15 03673 g007
Table 1. Top 2019 importers and exporters by energy commodity in billions of US dollars.
CommodityTop Exporters$Top Importers$
CoalAustralia43Japan21
Indonesia20India21
Russia18China19
OilSaudi Arabia162China225
Russia124USA128
Iraq81India96
GaseousNorway20Italy14
Natural GasRussia18China13
Turkmenistan9Germany9
LiquidQatar38Japan40
Natural GasAustralia36China29
USA10South Korea21
Note: based on data from [7].
Table 2. Pearson correlation coefficients between all networks examined in this study.
Biological Signal Processing NetworksHuman Social NetworksGlobal Agricultural TradeCargo Shipping—AverageAnt Colony CommunicationsEnergy Trade—AggregateEnergy Trade—CoalEnergy Trade—OilEnergy Trade—Liquid Natural GasEnergy Trade—Gaseous Natural GasEnergy Trade—Country Cluster 1Energy Trade—Country Cluster 2Energy Trade—Country Cluster 3Energy Trade—Country Cluster 4
biological signal processing networks10.590.630.670.600.710.730.690.750.860.360.570.510.27
human social
networks
0.5910.820.980.690.910.880.820.940.880.280.900.380.24
global agricultural trade0.630.8210.830.600.930.900.780.830.800.380.900.190.32
cargo shipping—
average
0.670.980.8310.730.920.920.790.970.920.340.880.460.22
ant colony
communications
0.600.690.600.7310.690.760.530.770.780.040.700.370.32
energy trade—
aggregate
0.710.910.930.920.6910.960.900.940.870.440.940.290.34
energy trade—
coal
0.730.880.900.920.760.9610.780.920.890.360.910.340.37
energy trade—
oil
0.690.820.780.790.530.900.7810.840.790.470.830.290.26
energy trade—
liquid natural gas
0.750.940.830.970.770.940.920.8410.960.350.880.450.27
energy trade—
gaseous natural gas
0.860.880.800.920.780.870.890.790.9610.280.790.530.30
energy trade—
country cluster 1
0.360.280.380.340.040.440.360.470.350.2810.190.33−0.43
energy trade—
country cluster 2
0.570.900.900.880.700.940.910.830.880.790.1910.210.39
energy trade—
country cluster 3
0.510.380.190.460.370.290.340.290.450.530.330.211−0.49
energy trade—
country cluster 4
0.270.240.320.220.320.340.370.260.270.30−0.430.39−0.491
Table 3. Countries with either a normalized Z-score > 0.15 for triad 6 or a normalized Z-score < −0.15 for triad 13.
CountryZ6ClusterCountryZ13Cluster
Malta0.411Iran−0.563
Côte d’Ivoire0.331Israel−0.394
Saint Lucia0.274Dem. Rep. of the Congo−0.363
Niger0.233Serbia−0.311
Ghana0.221Moldova−0.283
Mexico0.214Guatemala−0.274
Dem. Rep. of the Congo0.193Uzbekistan−0.251
Belize0.174Madagascar−0.234
Tunisia0.172Azerbaijan−0.231
Bosnia Herzegovina−0.224
Trinidad and Tobago−0.191
Zambia−0.162
Jordan−0.154
Publisher’s Note: MDPI stays neutral with regard to jurisdictional claims in published maps and institutional affiliations.

