
Assessing the Potential of Implementing a Solar-Based Distributed Energy System for a University Using the Campus Bus Stops


Abstract
:1. Introduction
2. Literature Review
2.1. University Energy Audits
2.2. DES Studies
2.3. Research Gap
3. Methodology
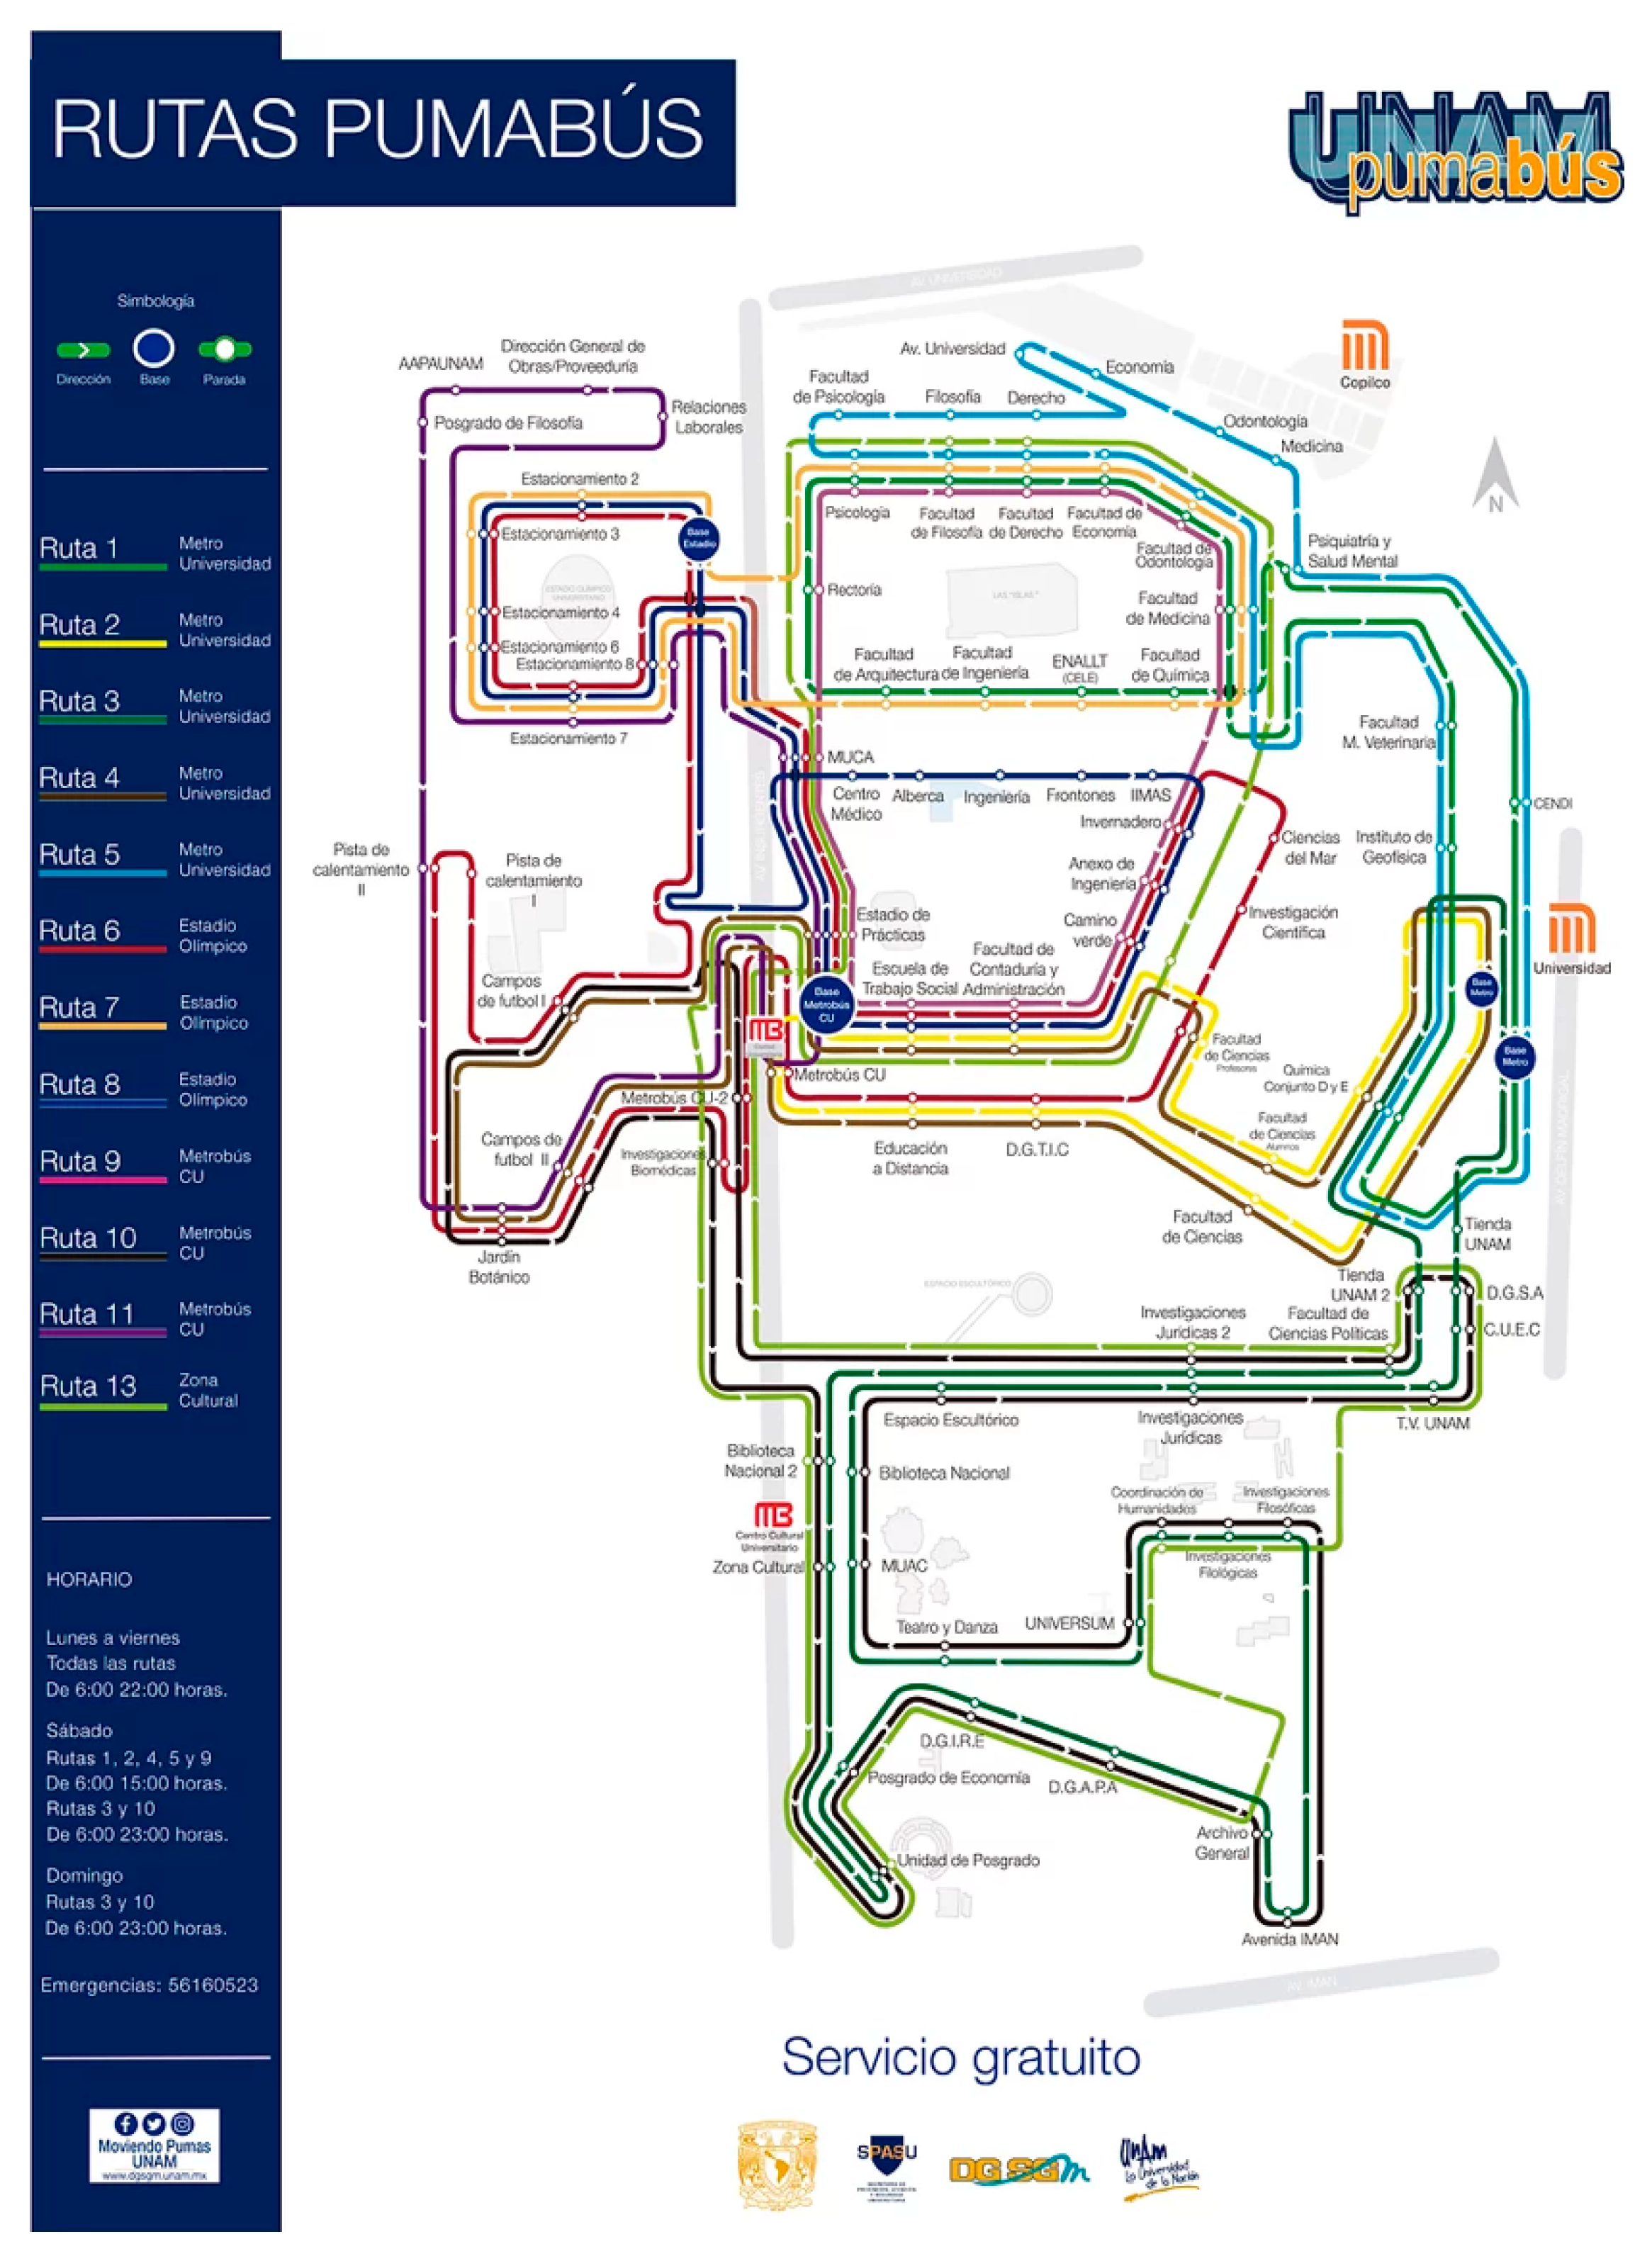
3.1. Case Study
3.2. Bus Stations Energy Survey
- Tour of the facilities’
- Gathering of information on electricity bills;
- Gathering of basic information about the installation;
- Carrying out data collection of energy consuming equipment;
- Analysing the data;
- Identifying potential energy savings;
- Preparing the energy diagnosis report.
- ECO2 = Total carbon dioxide emission [t]
- i = Type of fuel [Natural gas, Diesel, Coal]
- C = Annual fuel consumption [m3 or t]
- PC = Calorific power of fuel [MJ/m3 or MJ/t]
- FE = CO2 emission factor [t/MJ or kg/MJ] = 0.457 kgCO2/kWh.
3.3. Solar Irradiation and Prototype Solar Bus Station
3.3.1. Solar Irradiation Measurement
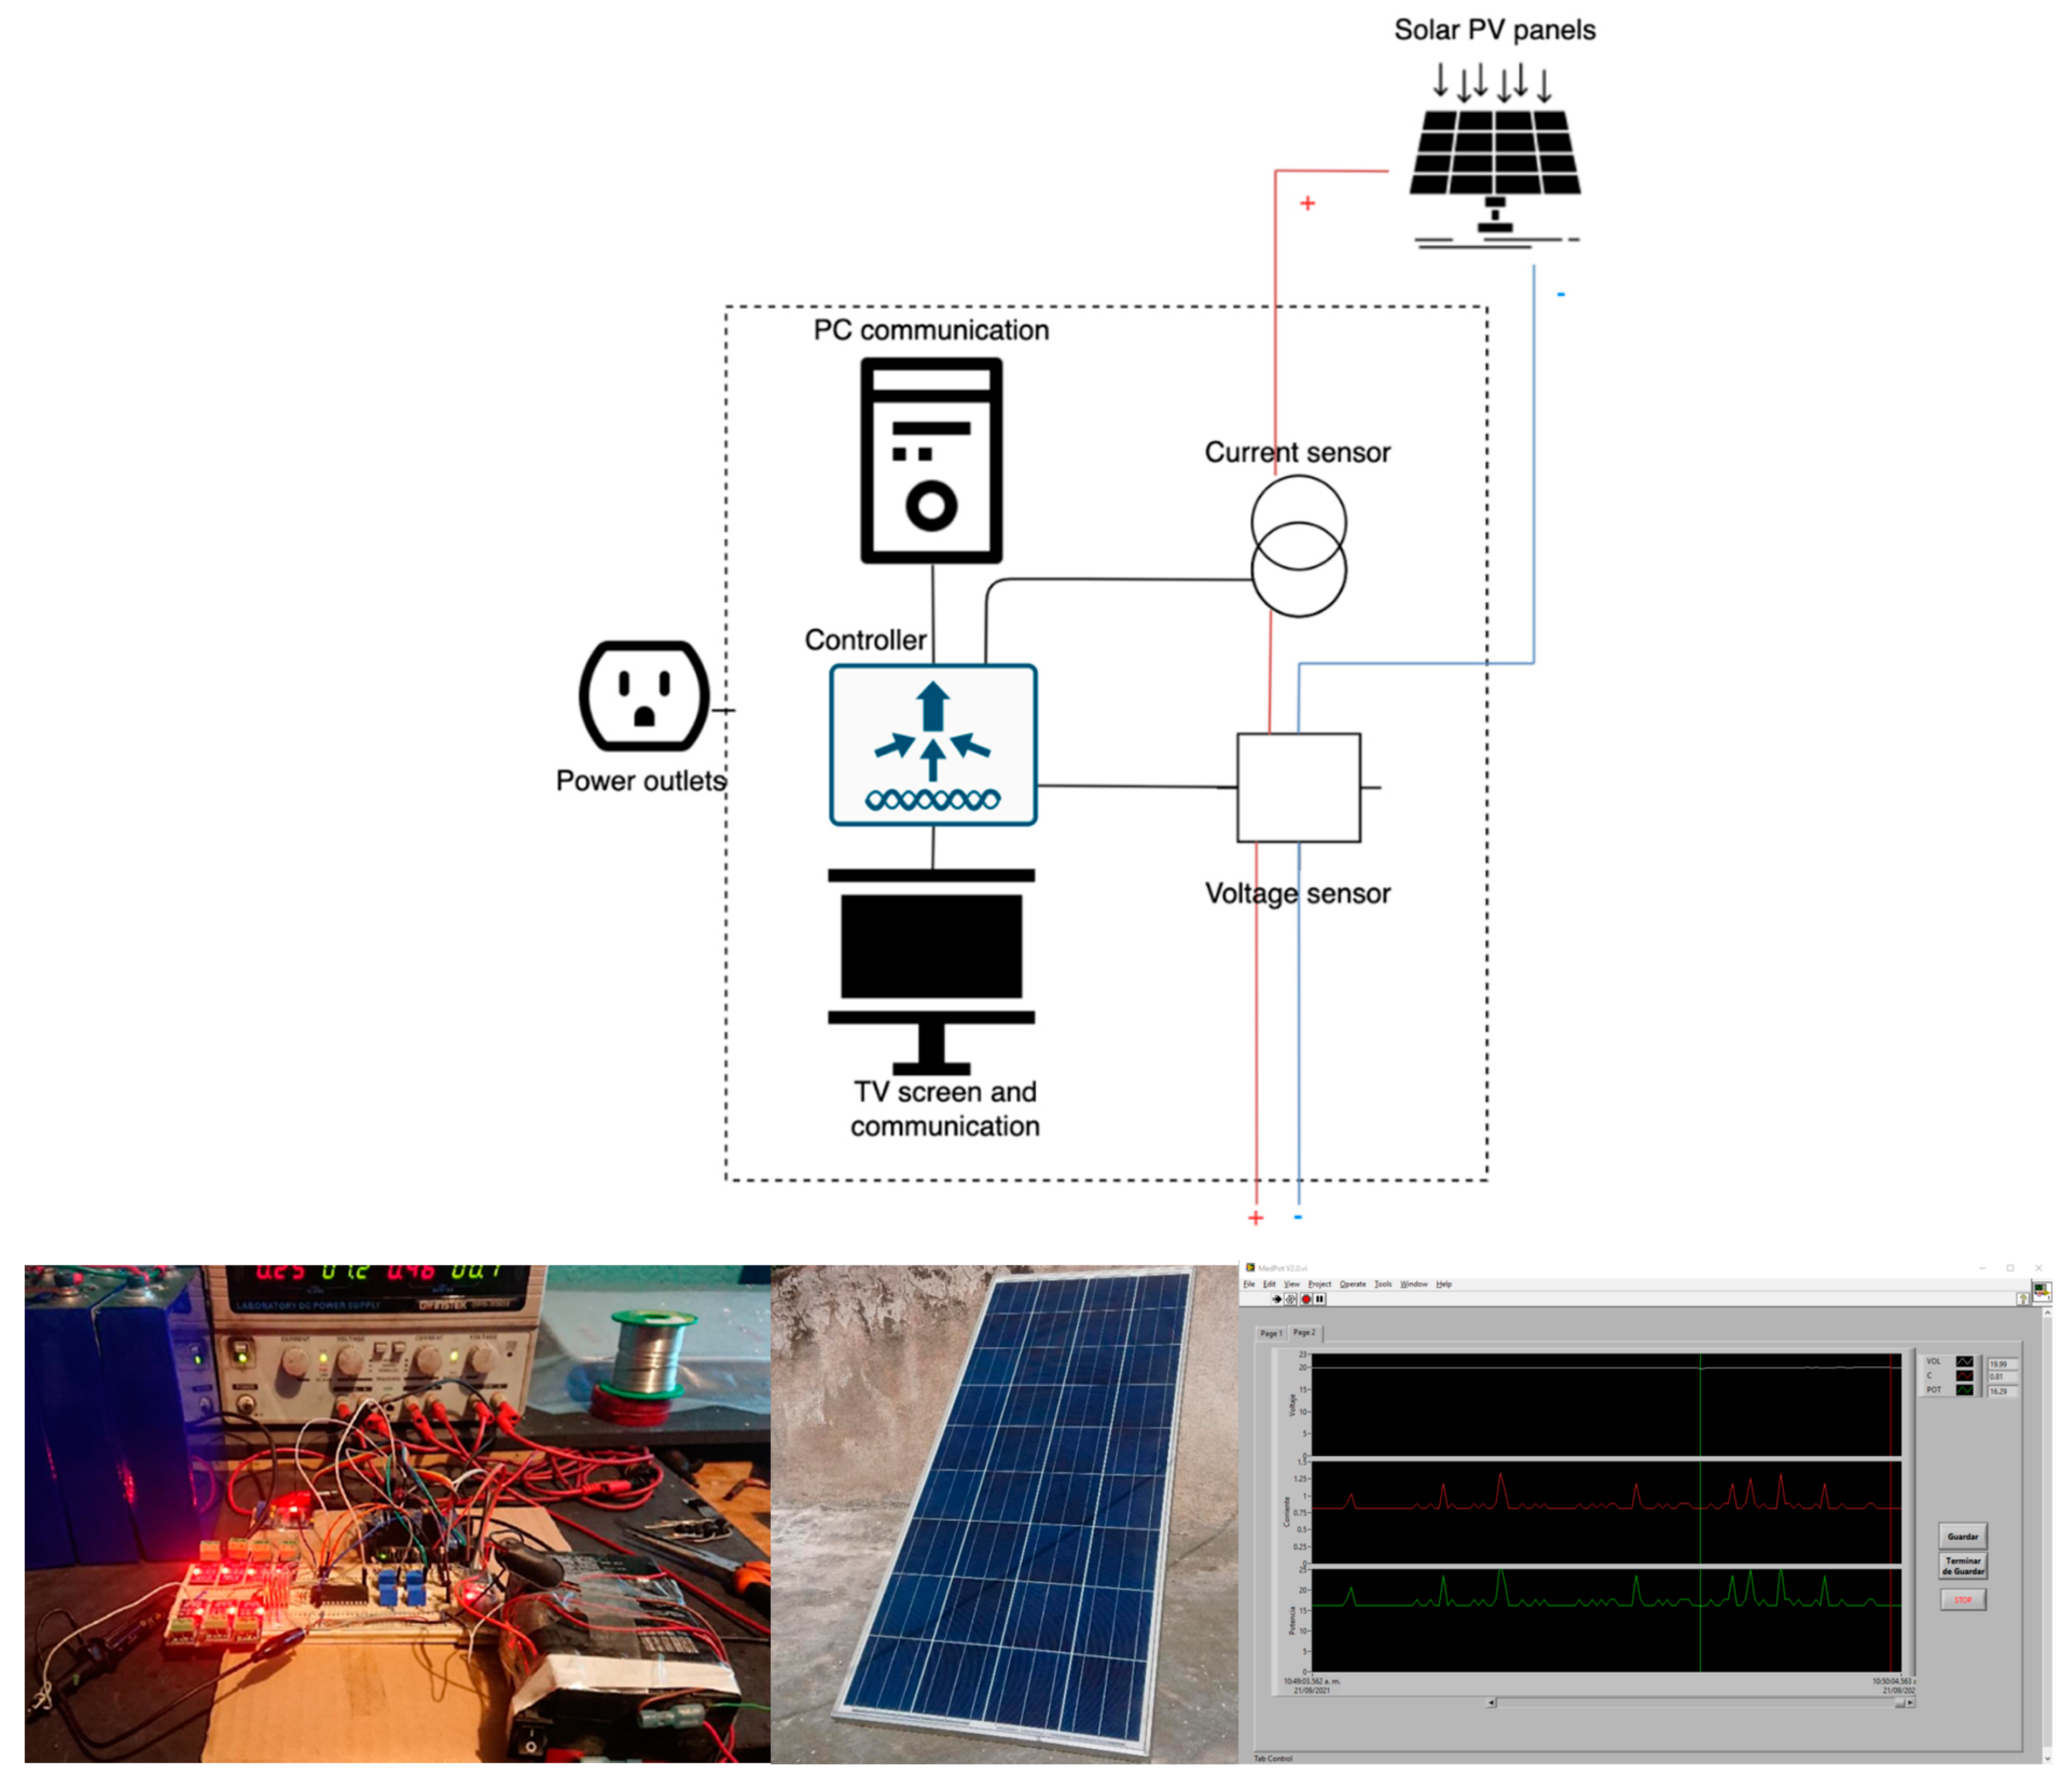
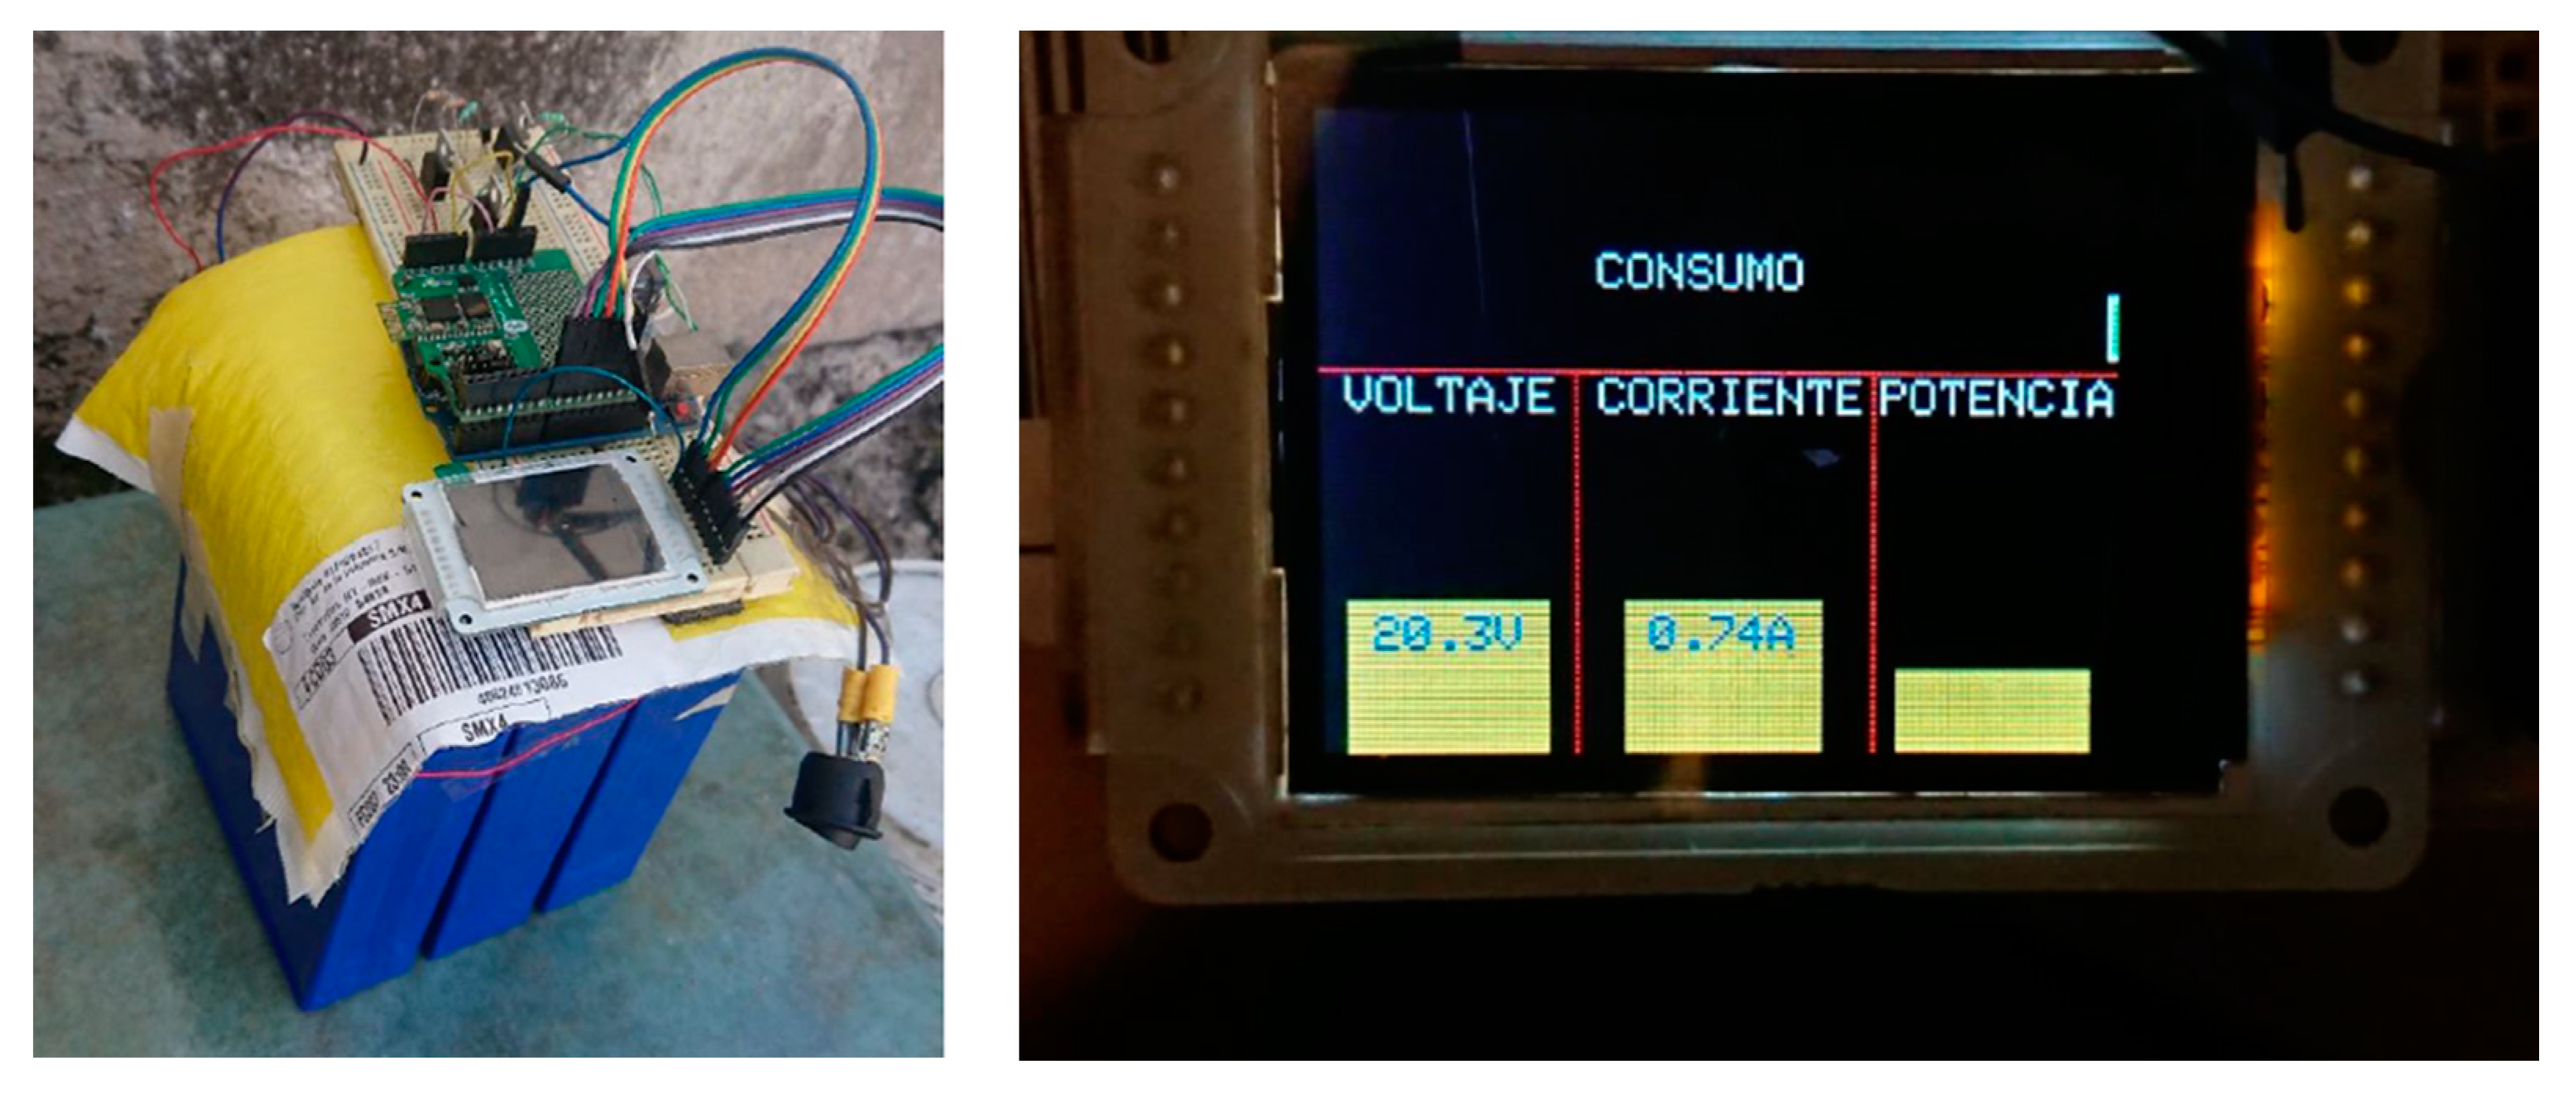
3.3.2. Solar Station System Prototype
4. Results
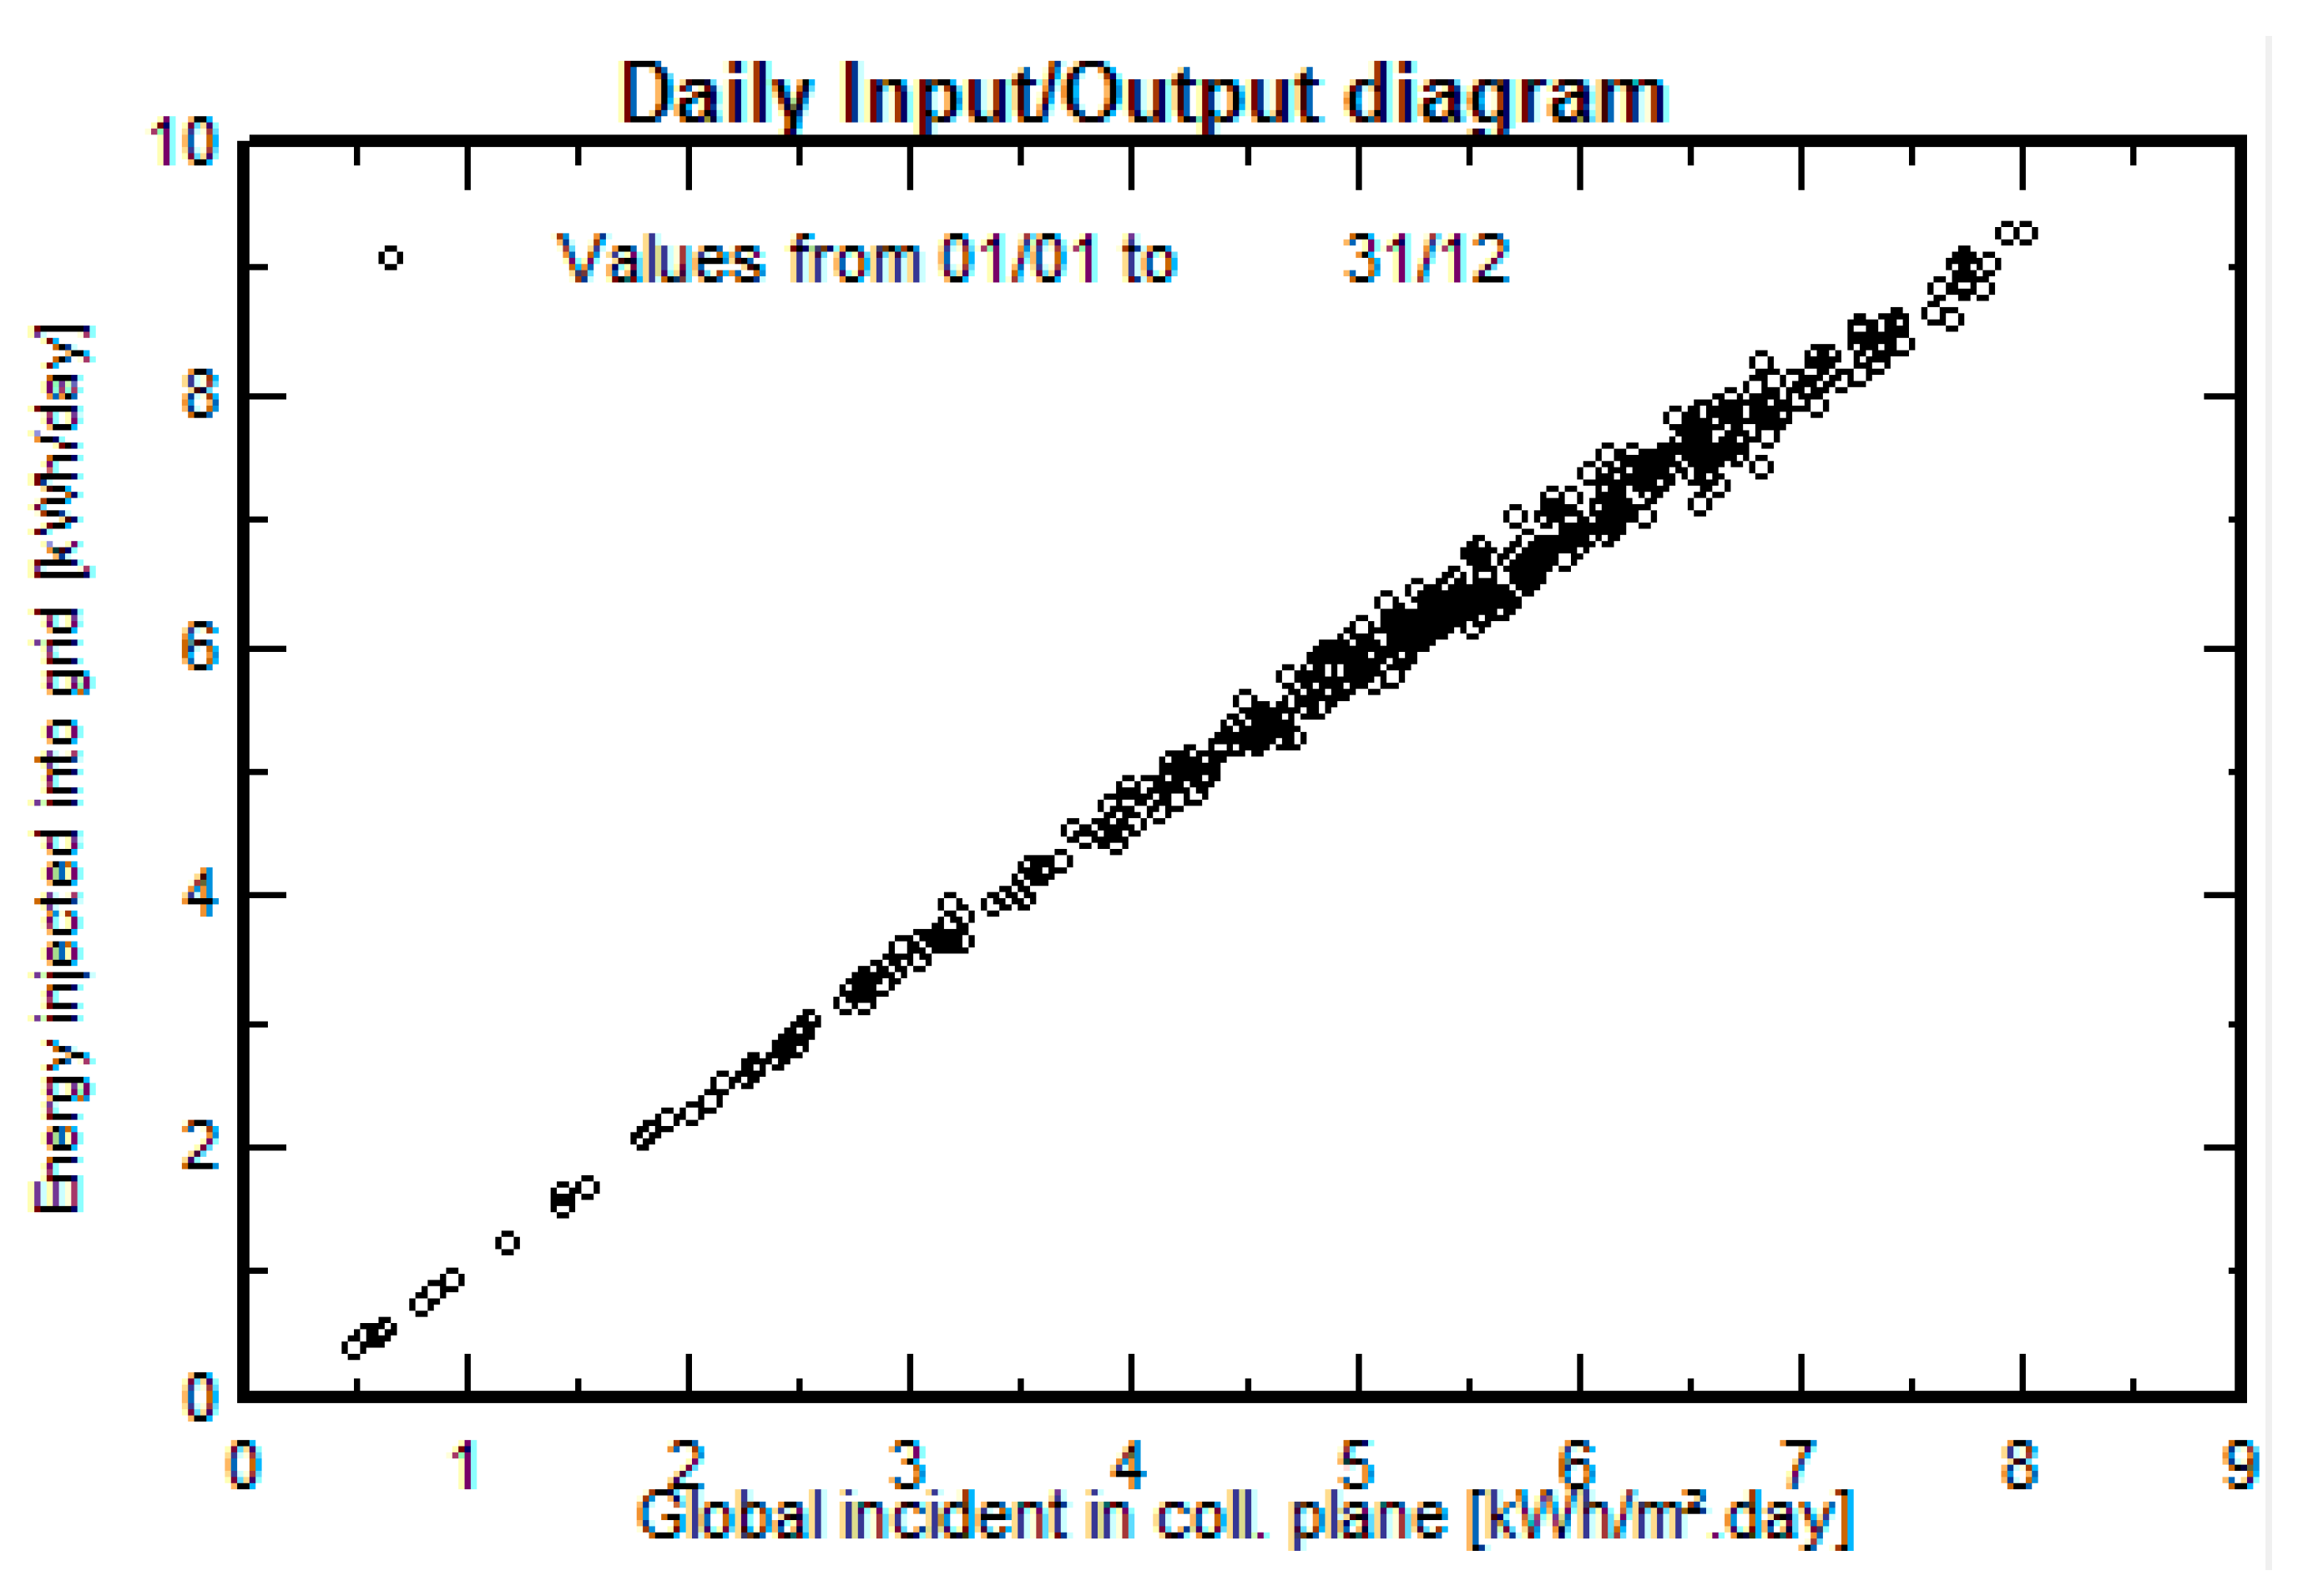
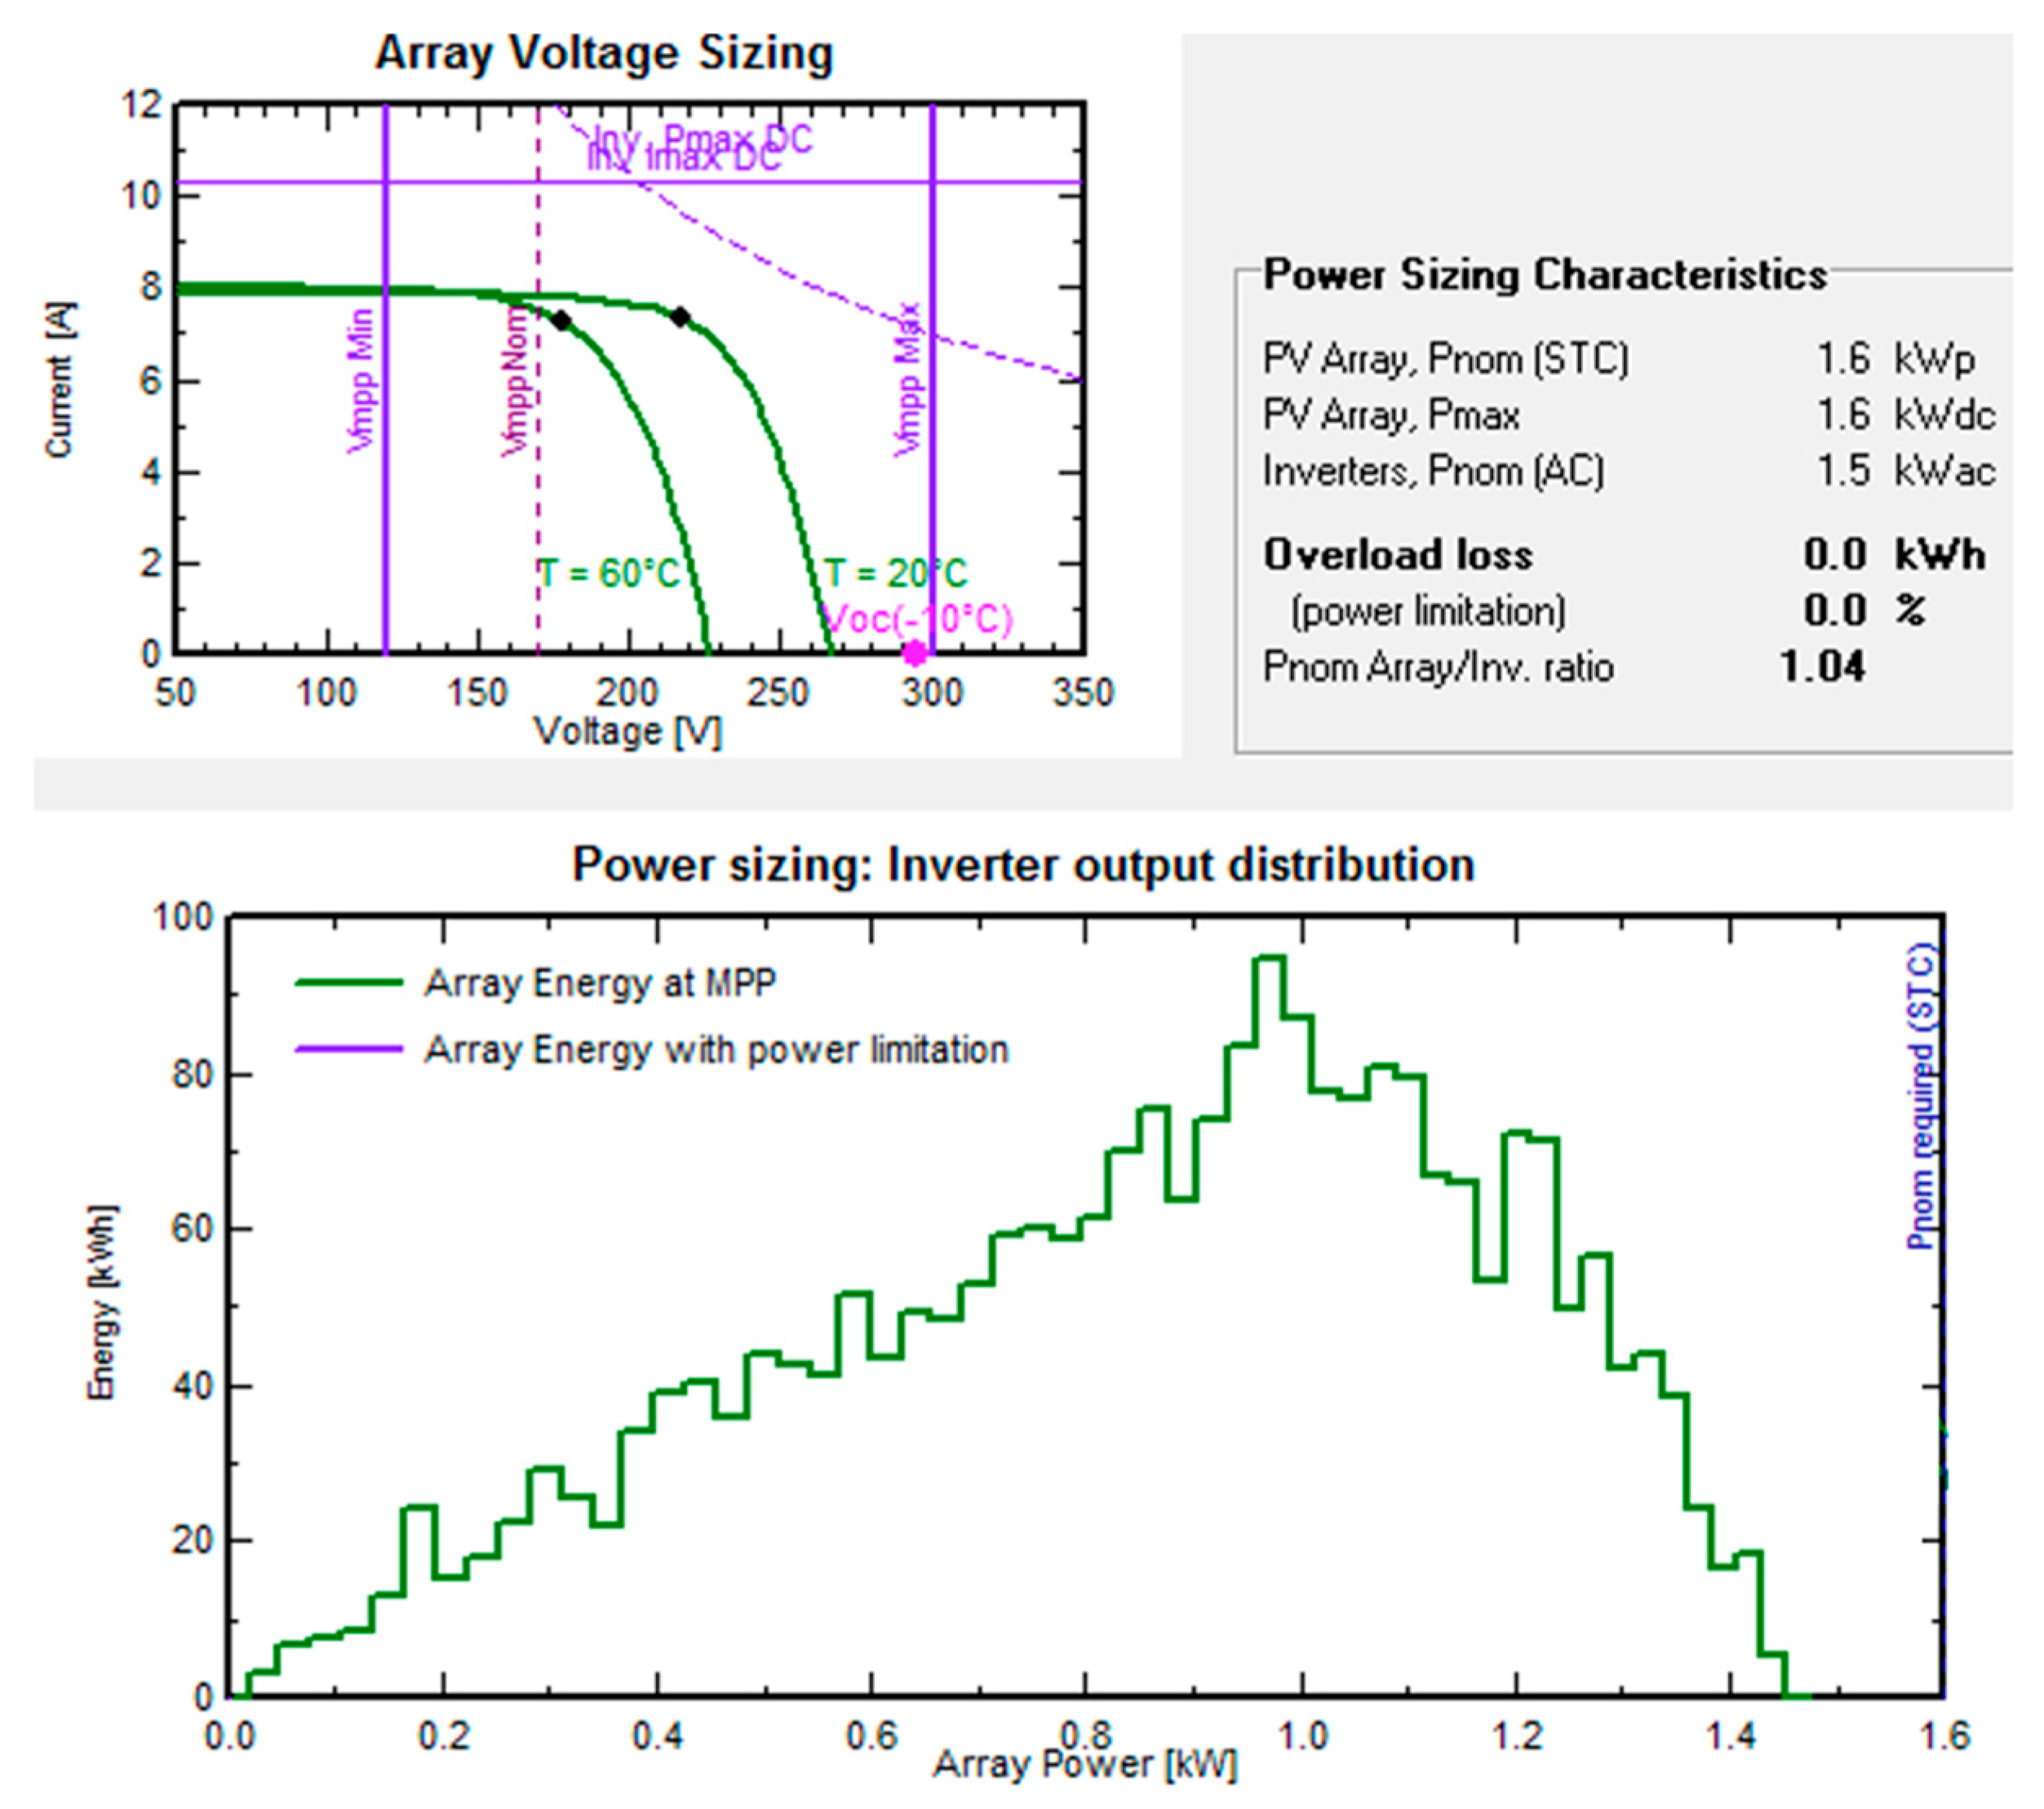
4.1. Simulation Results (Prototype)
4.2. Energy Use and DES Assessment
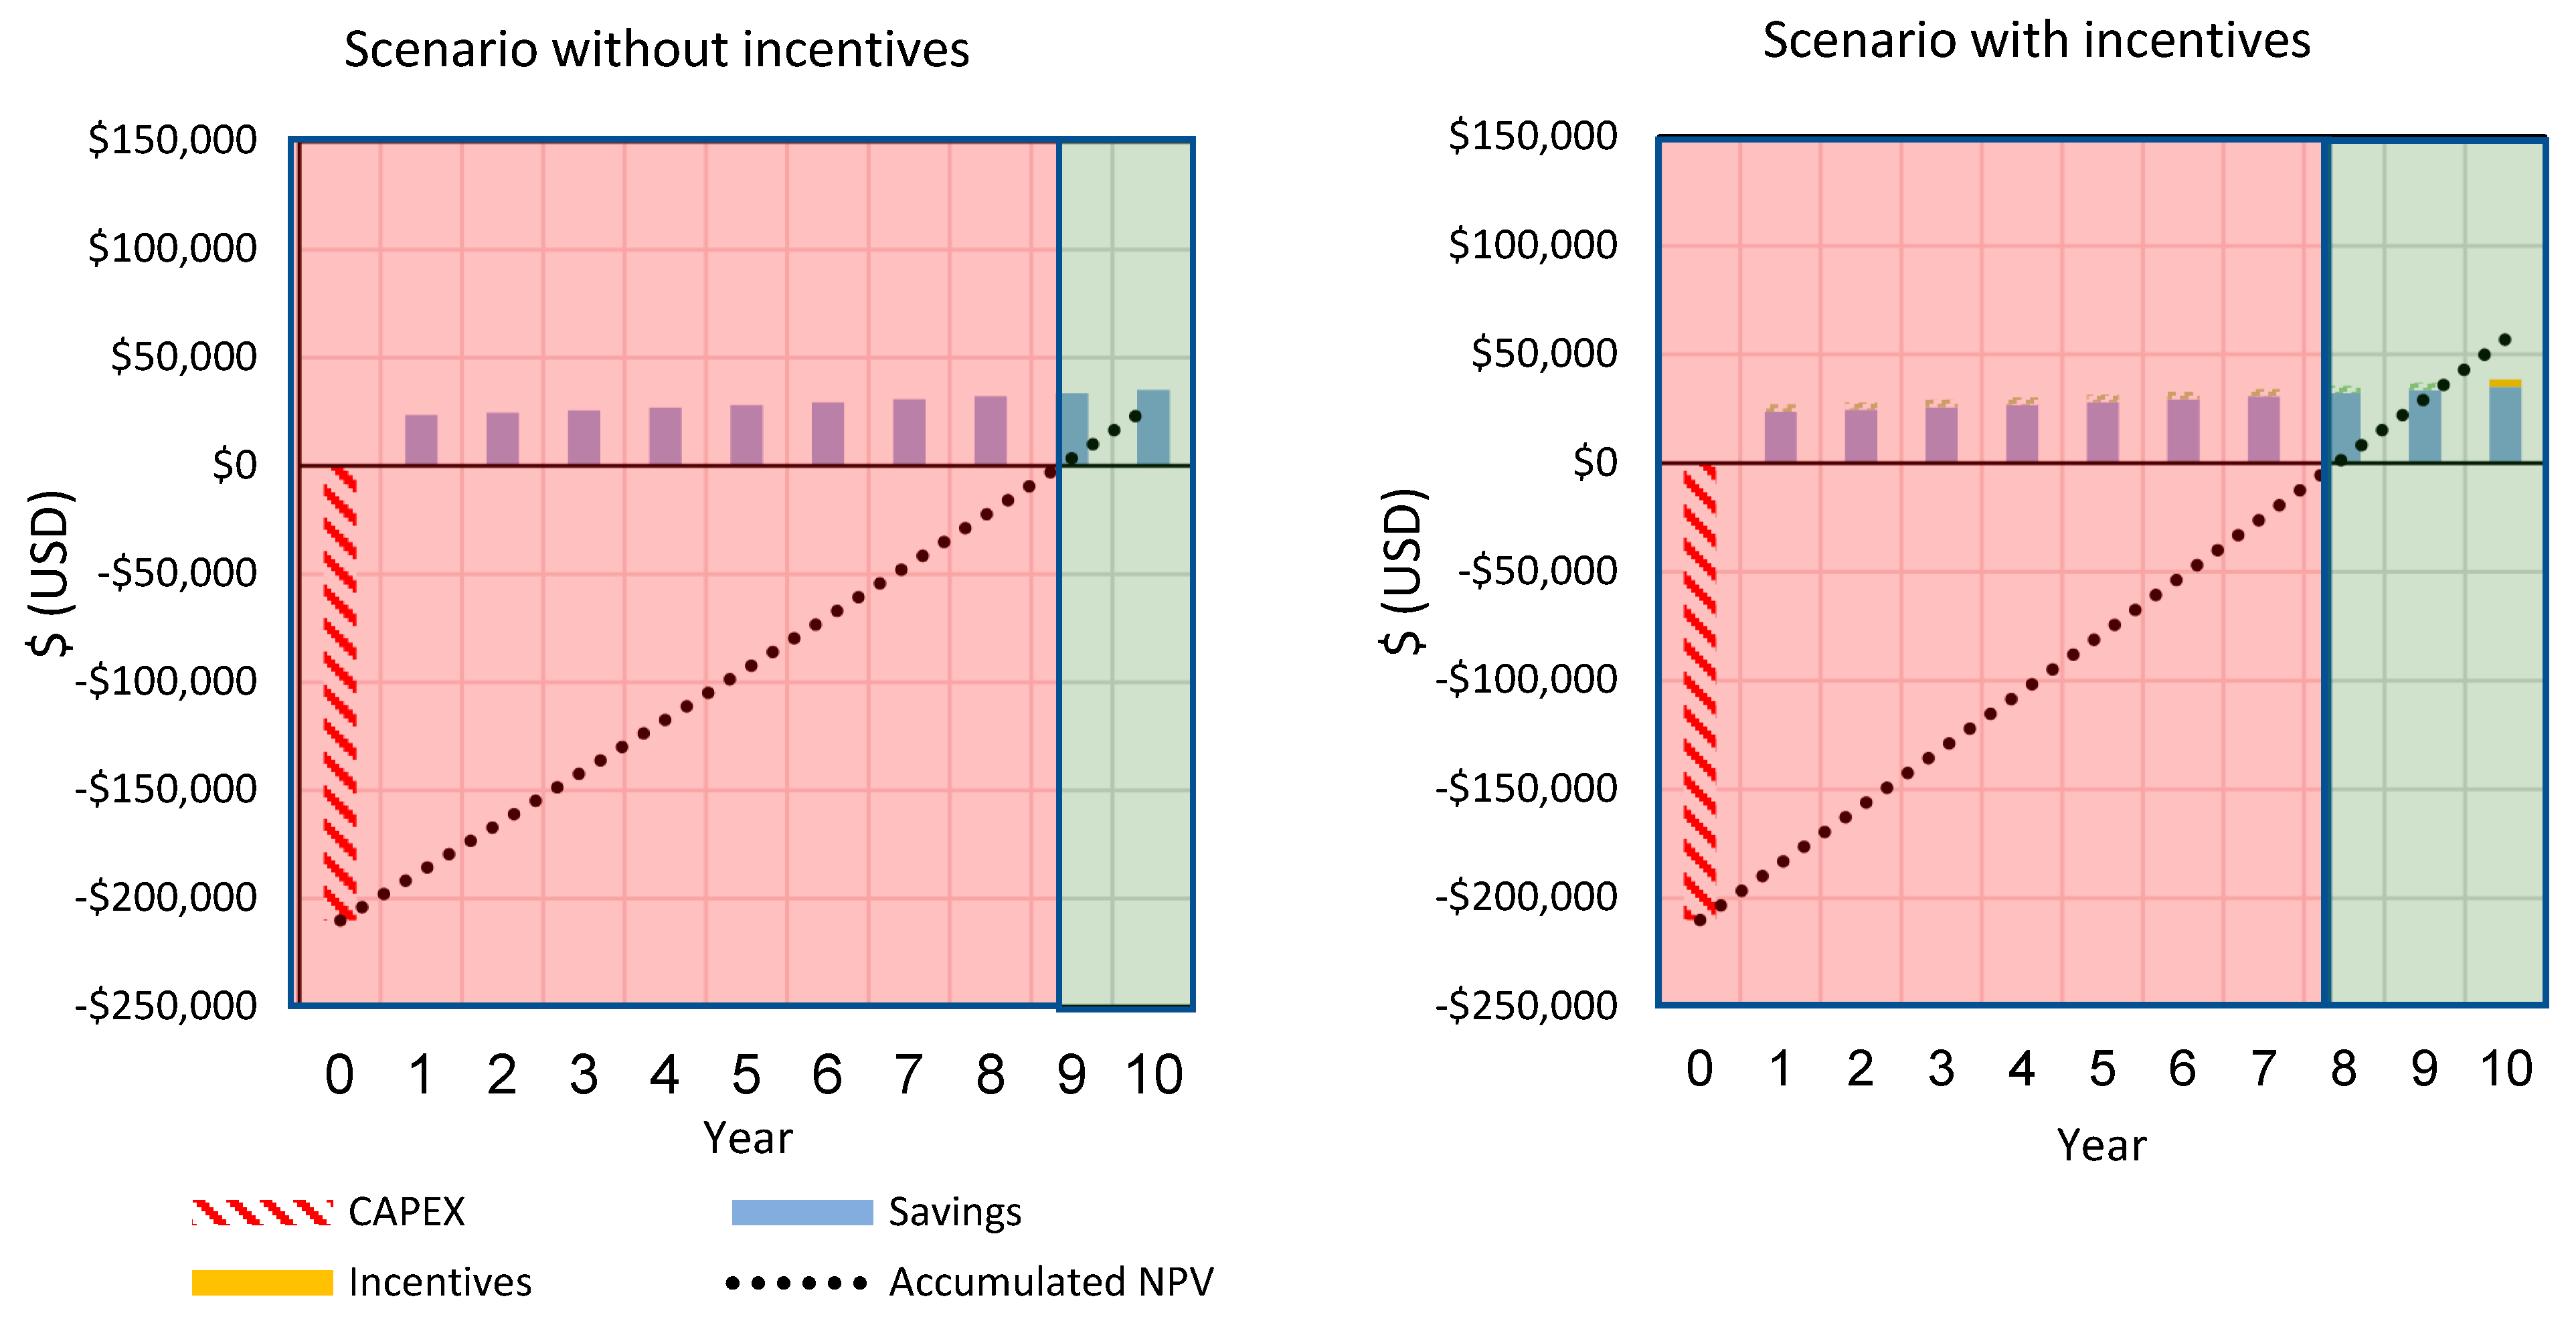
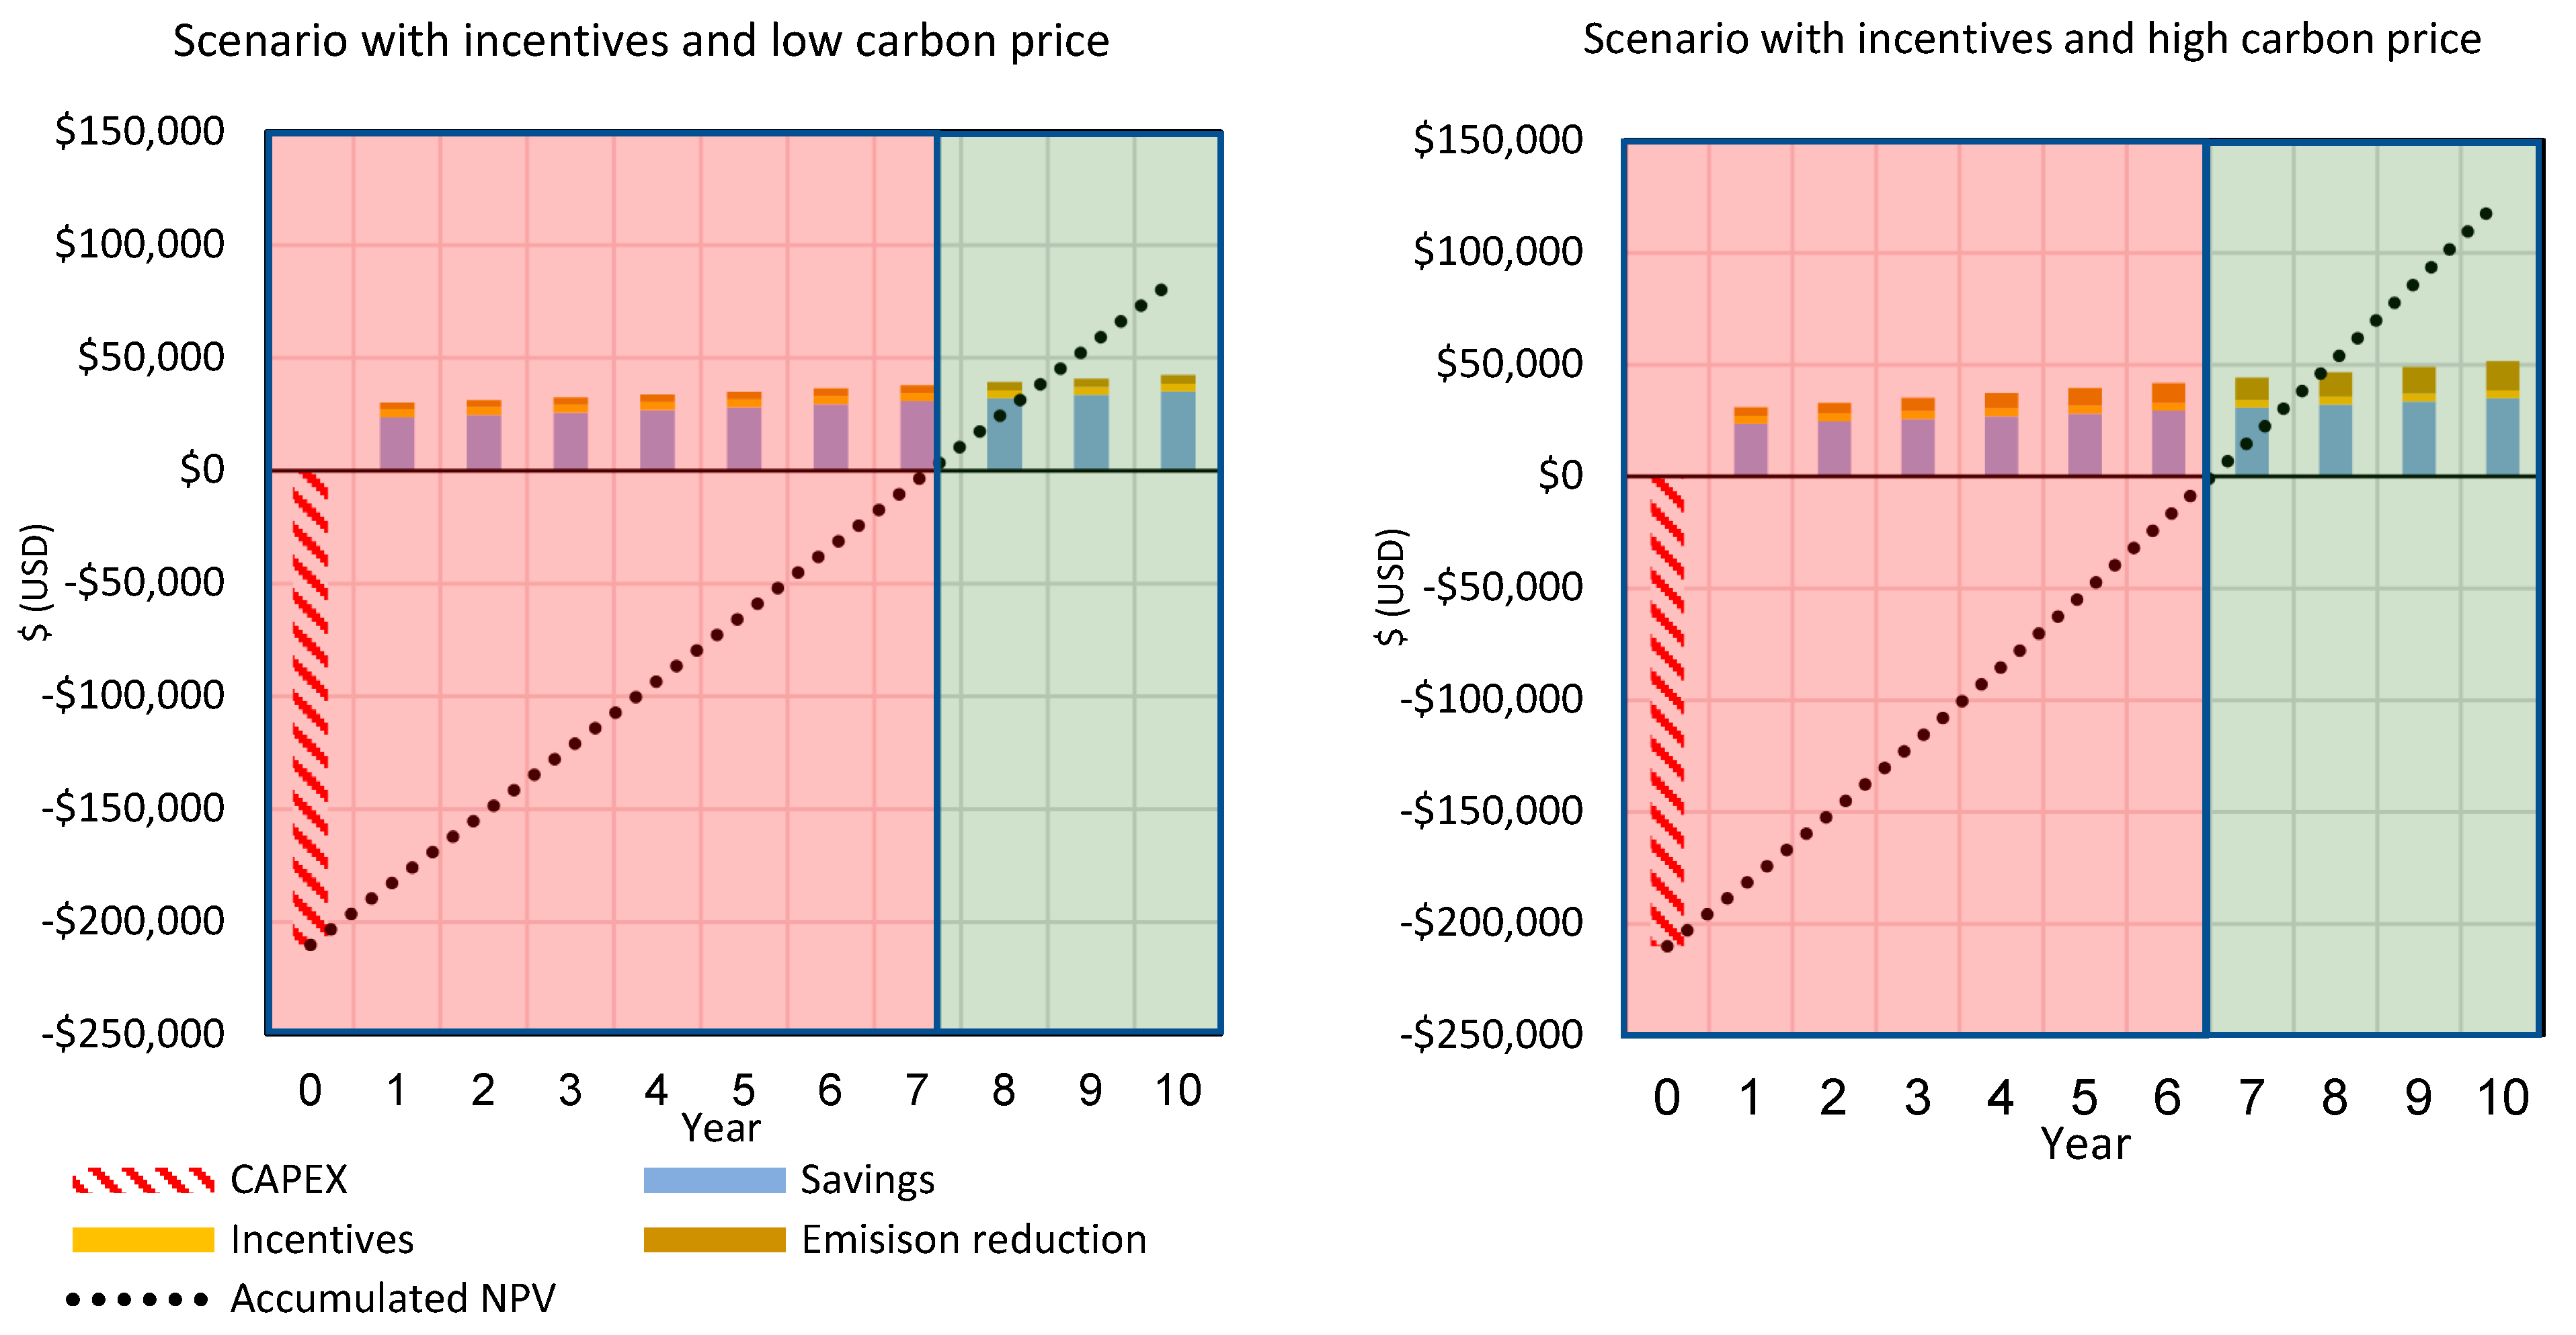
4.3. Economic Analysis
5. Conclusions
Supplementary Materials
Author Contributions
Funding
Institutional Review Board Statement
Informed Consent Statement
Data Availability Statement
Acknowledgments
Conflicts of Interest
References
- ARUP. Distributed Energy Systems. Flexible and Efficient Power for the New Energy Era; Research Report; ARUP: London, UK, 2016. [Google Scholar]
- IEA. Distributed Energy Resources for Net Zero: An Asset or a Hassle to the Electricity Grid? Commentaries; IEA: Paris, France, 2021. [Google Scholar]
- Horowitz, K.; Peterson, Z.; Coddington, M.; Ding, F.; Sigrin, B.; Saleem, D.; Baldwin, S.; Lydic, B.; Stanfield, S.; Enbar, N.; et al. An Overview of Distributed Energy Resource (DER) Interconnection: Current Practices and Emerging Solutions; NREL/TP-6A20-72102; Laboratory NRE: Golden, CO, USA, 2019. [Google Scholar]
- Kazerani, M.; Tehrani, K. Grid of Hybrid AC/DC Microgrids: A New Paradigm for Smart City of Tomorrow. In Proceedings of the 2020 IEEE 15th International Conference of System of Systems Engineering (SoSE), Budapest, Hungary, 2–4 June 2020; pp. 175–180. [Google Scholar]
- Amaral, A.R.; Rodrigues, E.; Gaspar, A.R.; Gomes, Á. Lessons from unsuccessful energy and buildings sustainability actions in university campus operations. J. Clean. Prod. 2021, 297, 126665. [Google Scholar] [CrossRef]
- Yusoff, S.; Abu Bakar, A.; Rahmat Fakri, M.F.; Ahmad, A.Z. Sustainability initiative for a Malaysian university campus: Living laboratories and the reduction of greenhouse gas emissions. Environ. Dev. Sustain. 2021, 23, 14046–14067. [Google Scholar] [CrossRef]
- UNFCCC. Kyoto Protocol to the United Nations Framework Convention on Climate Change. In Proceedings of the United Nations Framework Convention on Climate Change, Kyoto, Japan, 11 December 1997.
- Mohd Zublie, M.F.; Hasanuzzaman, M.; Rahim, N.A. Feasibility Analysis of Solar Power Generation System for Office Building in Academic Institution. IOP Conf. Ser. Mater. Sci. Eng. 2021, 1127, 012039. [Google Scholar] [CrossRef]
- Oyedepo, S.O.; Anifowose, E.G.; Obembe, E.O.; Dirisu, J.O.; Khanmohamadi, S.; Kilanko, O.; Babalola, P.O.; Ohunakin, O.S.; Leramo, R.O.; Olawole, O.C. Assessment of Economic and Environmental Impacts of Energy Conservation Strategies in a University Campus. In Green Energy: Solar Energy, Photovoltaics, and Smart Cities; Wiley: Hoboken, NJ, USA, 2020; pp. 441–468. [Google Scholar]
- Escobedo, A. Análisis y Modelación del Consumo de Energía Eléctrica en Edificios Universitarios con Base a Usos Finales y Parámetros Arquitectónicos; UNAM: Mexico City, Mexico, 2009. [Google Scholar]
- Escobedo, A.; Briceño, S.; Juárez, H.; Castillo, D.; Imaz, M.; Sheinbaum, C. Energy consumption and GHG emission scenarios of a university campus in Mexico. Energy Sustain. Dev. 2014, 18, 49–57. [Google Scholar] [CrossRef]
- Seidl, R.; von Wirth, T.; Krütli, P. Social acceptance of distributed energy systems in Swiss, German, and Austrian energy transitions. Energy Res. Soc. Sci. 2019, 54, 117–128. [Google Scholar] [CrossRef]
- Wolsink, M. Distributed energy systems as common goods: Socio-political acceptance of renewables in intelligent microgrids. Renew. Sustain. Energy Rev. 2020, 127, 109841. [Google Scholar] [CrossRef]
- Zhou, Z.; Liu, P.; Li, Z.; Ni, W. An engineering approach to the optimal design of distributed energy systems in China. Appl. Therm. Eng. 2013, 53, 387–396. [Google Scholar] [CrossRef]
- Mavromatidis, G.; Orehounig, K.; Carmeliet, J. A review of uncertainty characterisation approaches for the optimal design of distributed energy systems. Renew. Sustain. Energy Rev. 2018, 88, 258–277. [Google Scholar] [CrossRef]
- Kotsampopoulos, P.; Lagos, D.; Hatziargyriou, N.; Faruque, M.O.; Lauss, G.; Nzimako, O.; Forsyth, P.; Steurer, M.; Ponci, F.; Monti, A.; et al. A Benchmark System for Hardware-in-the-Loop Testing of Distributed Energy Resources. IEEE Power Energy Technol. Syst. J. 2018, 53, 94–103. [Google Scholar] [CrossRef]
- Falke, T.; Krengel, S.; Meinerzhagen, A.-K.; Schnettler, A. Multi-objective optimization and simulation model for the design of distributed energy systems. Appl. Energy 2016, 184, 1508–1516. [Google Scholar] [CrossRef]
- Perera, A.T.D.; Coccolo, S.; Scartezzini, J.-L. The influence of urban form on the grid integration of renewable energy technologies and distributed energy systems. Sci. Rep. 2019, 9, 17756. [Google Scholar] [CrossRef] [PubMed]
- Wu, Q.; Ren, H.; Gao, W.; Weng, P.; Ren, J. Coupling optimization of urban spatial structure and neighborhood-scale distributed energy systems. Energy 2018, 144, 472–481. [Google Scholar] [CrossRef]
- Roldán-Blay, C.; Escrivá-Escrivá, G.; Roldán-Porta, C. Improving the benefits of demand response participation in facilities with distributed energy resources. Energy 2019, 169, 710–718. [Google Scholar] [CrossRef]
- Fonseca, J.D.; Camargo, M.; Commenge, J.-M.; Falk, L.; Gil, I.D. Trends in design of distributed energy systems using hydrogen as energy vector: A systematic literature review. Int. J. Hydrogen Energy 2019, 44, 9486–9504. [Google Scholar] [CrossRef]
- Yan, B.; Somma, M.D.; Luh, P.B.; Graditi, G. Operation Optimization of Multiple Distributed Energy Systems in an Energy Community. In Proceedings of the 2018 IEEE International Conference on Environment and Electrical Engineering and 2018 IEEE Industrial and Commercial Power Systems Europe (EEEIC/I&CPS Europe), Palermo, Italy, 12–15 June 2018; pp. 1–6. [Google Scholar]
- Li, L.; Zhang, S. Techno-economic and environmental assessment of multiple distributed energy systems coordination under centralized and decentralized framework. Sustain. Cities Soc. 2021, 72, 103076. [Google Scholar] [CrossRef]
- Qiu, R.; Liao, Q.; Yan, J.; Yan, Y.; Guo, Z.; Liang, Y.; Zhang, H. The coupling impact of subsystem interconnection and demand response on the distributed energy systems: A case study of the composite community in China. Energy 2021, 228, 120588. [Google Scholar] [CrossRef]
- Rossi, F.; Heleno, M.; Basosi, R.; Sinicropi, A. Environmental and economic optima of solar home systems design: A combined LCA and LCC approach. Sci. Total Environ. 2020, 744, 140569. [Google Scholar] [CrossRef] [PubMed]
- Iria, J.; Huang, Q. Optimal Sizing of PV-Battery Systems in Buildings Considering Carbon Pricing. In Proceedings of the 2021 31st Australasian Universities Power Engineering Conference (AUPEC), Perth, Australia, 26–30 September 2021. [Google Scholar]
- IPCC. IPCC Guidelines for National Greenhouse Gas Inventories; Prepared by the National Greenhouse Gas Inventories Programme; IGES: Tokyo, Japan, 2006. [Google Scholar]
- Climate_Transparency. Brown to Green: The G20 Transition towards a Low-Carbon Economy; Climate Transparency: Berlin, Germany, 2017. [Google Scholar]
- SENER. Prospectiva del Sector Eléctrico (PRODESEN) 2016–2030; SENER: Mexico City, Mexico, 2016. [Google Scholar]
- IEA. Carbon Pricing Can Help Put Clean Energy at the Heart of Stimulus Packages; Commentaries; International Energy Agency: Paris, France, 2020. [Google Scholar]


| Year | Energy Consumption in UNAM [GWh/Year] |
|---|---|
| 2011 | 81.3 |
| 2018 * | 83.3 |
| 2020 | 61.2 |
| Archetype | Area (m2) | Amount | Lighting Fixture | Photo |
|---|---|---|---|---|
| A | 10 | 15 | T3 | 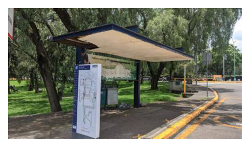 |
| B | 50 | 10 | T5 | 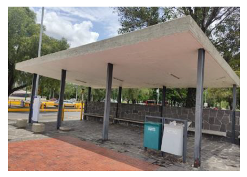 |
| C | 66 | 7 | T5 |  |
| D | 3 | 35 | LED | 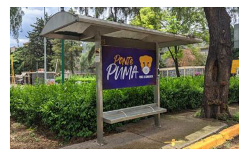 |
| E | 16 | 5 | LED | 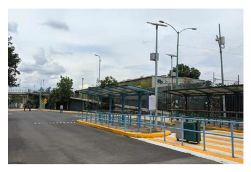 |
| F | 105 | 1 | T5 | 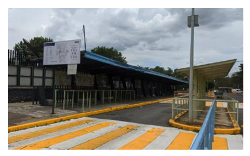 |
| G | 130 | 1 | LED | 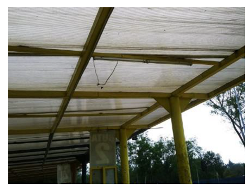 |
| Archetype Station | Energy Use [kWh/Year] | |
|---|---|---|
| 12 h Use | 24 h Use | |
| 1 | 7096 | 14,191 |
| 2 | 14,191 | 28,382 |
| 3 | 13,245 | 26,490 |
| 4 | 11,651 | 23,302 |
| 5 | 1664 | 3329 |
| 6 | 6623 | 13,245 |
| 7 | 999 | 1997 |
| Total | 55,469 | 110,936 |
| Component | Power [W] | Daily Operational Hours [h] | Energy Consumption [Wh] |
|---|---|---|---|
| Elevated CCTV camera | 10 | 24 | 240 |
| Single Channel Video Encoder | 5 | 24 | 120 |
| Internal CCTV camera | 5 | 24 | 120 |
| Modem | 5 | 18 | 90 |
| Antenna | 5 | 18 | 90 |
| LED lighting | 60 | 6 | 360 |
| USB ports (x6) | 60 | 8 | 480 |
| TV (information) | 100 | 24 | 2400 |
| Total | 250 | - | 3900 |
| Month | Average Radiation [kWh/m2] | System Generation [kWh] |
|---|---|---|
| January | 4.86 | 23,508 |
| February | 4.44 | 19,413 |
| March | 6.61 | 31,971 |
| April | 6.89 | 32,240 |
| May | 6.42 | 31,031 |
| June | 5.72 | 26,780 |
| July | 6.47 | 31,299 |
| August | 9.22 | 44,599 |
| September | 5.81 | 27,170 |
| October | 4.81 | 23,240 |
| November | 4.97 | 23,270 |
| December | 4.89 | 27,583 |
| Actual Stations Energy Use | Retrofitted Stations Energy Use [kWh] | Retrofitted Stations Solar Energy Generation [kWh] | |
|---|---|---|---|
| 12 h [kWh] | 24 h [kWh] | ||
| 55,468 | 110,937 | 167,170 | 342,104 |
| Month | Stations Energy Demand [kWh] | Surplus Energy [kWh] |
|---|---|---|
| January | 14,198 | 9310 |
| February | 12,824 | 6589 |
| March | 14,198 | 17,773 |
| April | 13,740 | 18,500 |
| May | 14,198 | 16,833 |
| June | 13,740 | 13,040 |
| July | 14,198 | 17,101 |
| August | 14,198 | 30,401 |
| September | 13,740 | 13,430 |
| October | 14,198 | 9042 |
| November | 13,740 | 9530 |
| December | 14,198 | 13,385 |
Publisher’s Note: MDPI stays neutral with regard to jurisdictional claims in published maps and institutional affiliations. |
© 2022 by the authors. Licensee MDPI, Basel, Switzerland. This article is an open access article distributed under the terms and conditions of the Creative Commons Attribution (CC BY) license (https://creativecommons.org/licenses/by/4.0/).
Share and Cite
Gálvez, D.M.; Kerdan, I.G.; Carmona-Paredes, G. Assessing the Potential of Implementing a Solar-Based Distributed Energy System for a University Using the Campus Bus Stops. Energies 2022, 15, 3660. https://doi.org/10.3390/en15103660
Gálvez DM, Kerdan IG, Carmona-Paredes G. Assessing the Potential of Implementing a Solar-Based Distributed Energy System for a University Using the Campus Bus Stops. Energies. 2022; 15(10):3660. https://doi.org/10.3390/en15103660
Chicago/Turabian StyleGálvez, David Morillón, Iván García Kerdan, and Germán Carmona-Paredes. 2022. "Assessing the Potential of Implementing a Solar-Based Distributed Energy System for a University Using the Campus Bus Stops" Energies 15, no. 10: 3660. https://doi.org/10.3390/en15103660
APA StyleGálvez, D. M., Kerdan, I. G., & Carmona-Paredes, G. (2022). Assessing the Potential of Implementing a Solar-Based Distributed Energy System for a University Using the Campus Bus Stops. Energies, 15(10), 3660. https://doi.org/10.3390/en15103660