
Study on Convective Heat Transfer Characteristics of Supercritical Liquid Hydrogen in a U-Type Tube inside a Moderator

 ,
, 
Abstract
:1. Introduction
2. Numerical Simulation
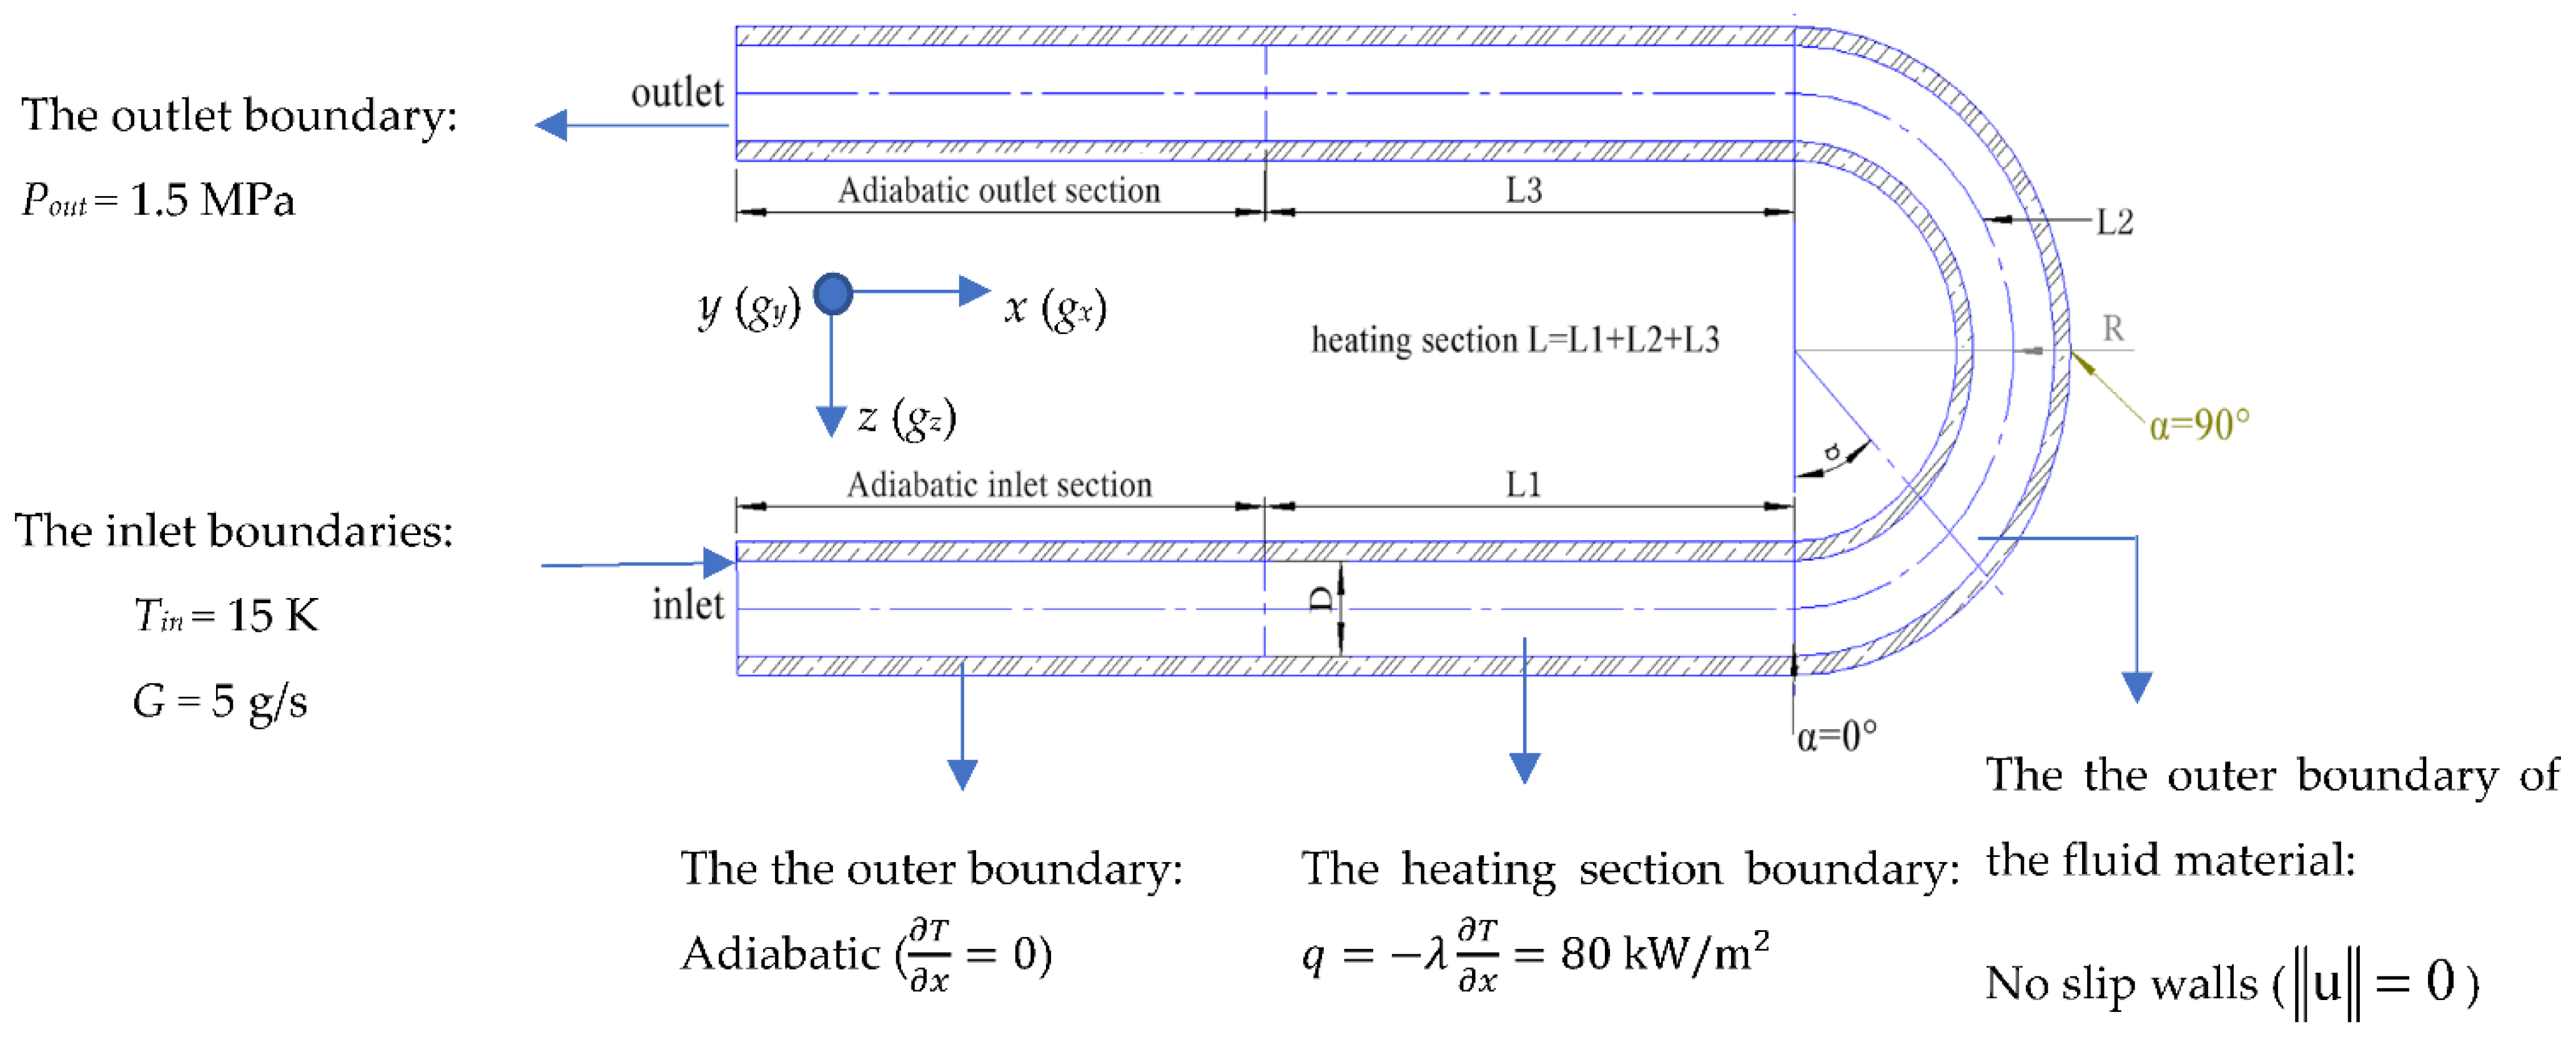
2.1. Physical Model
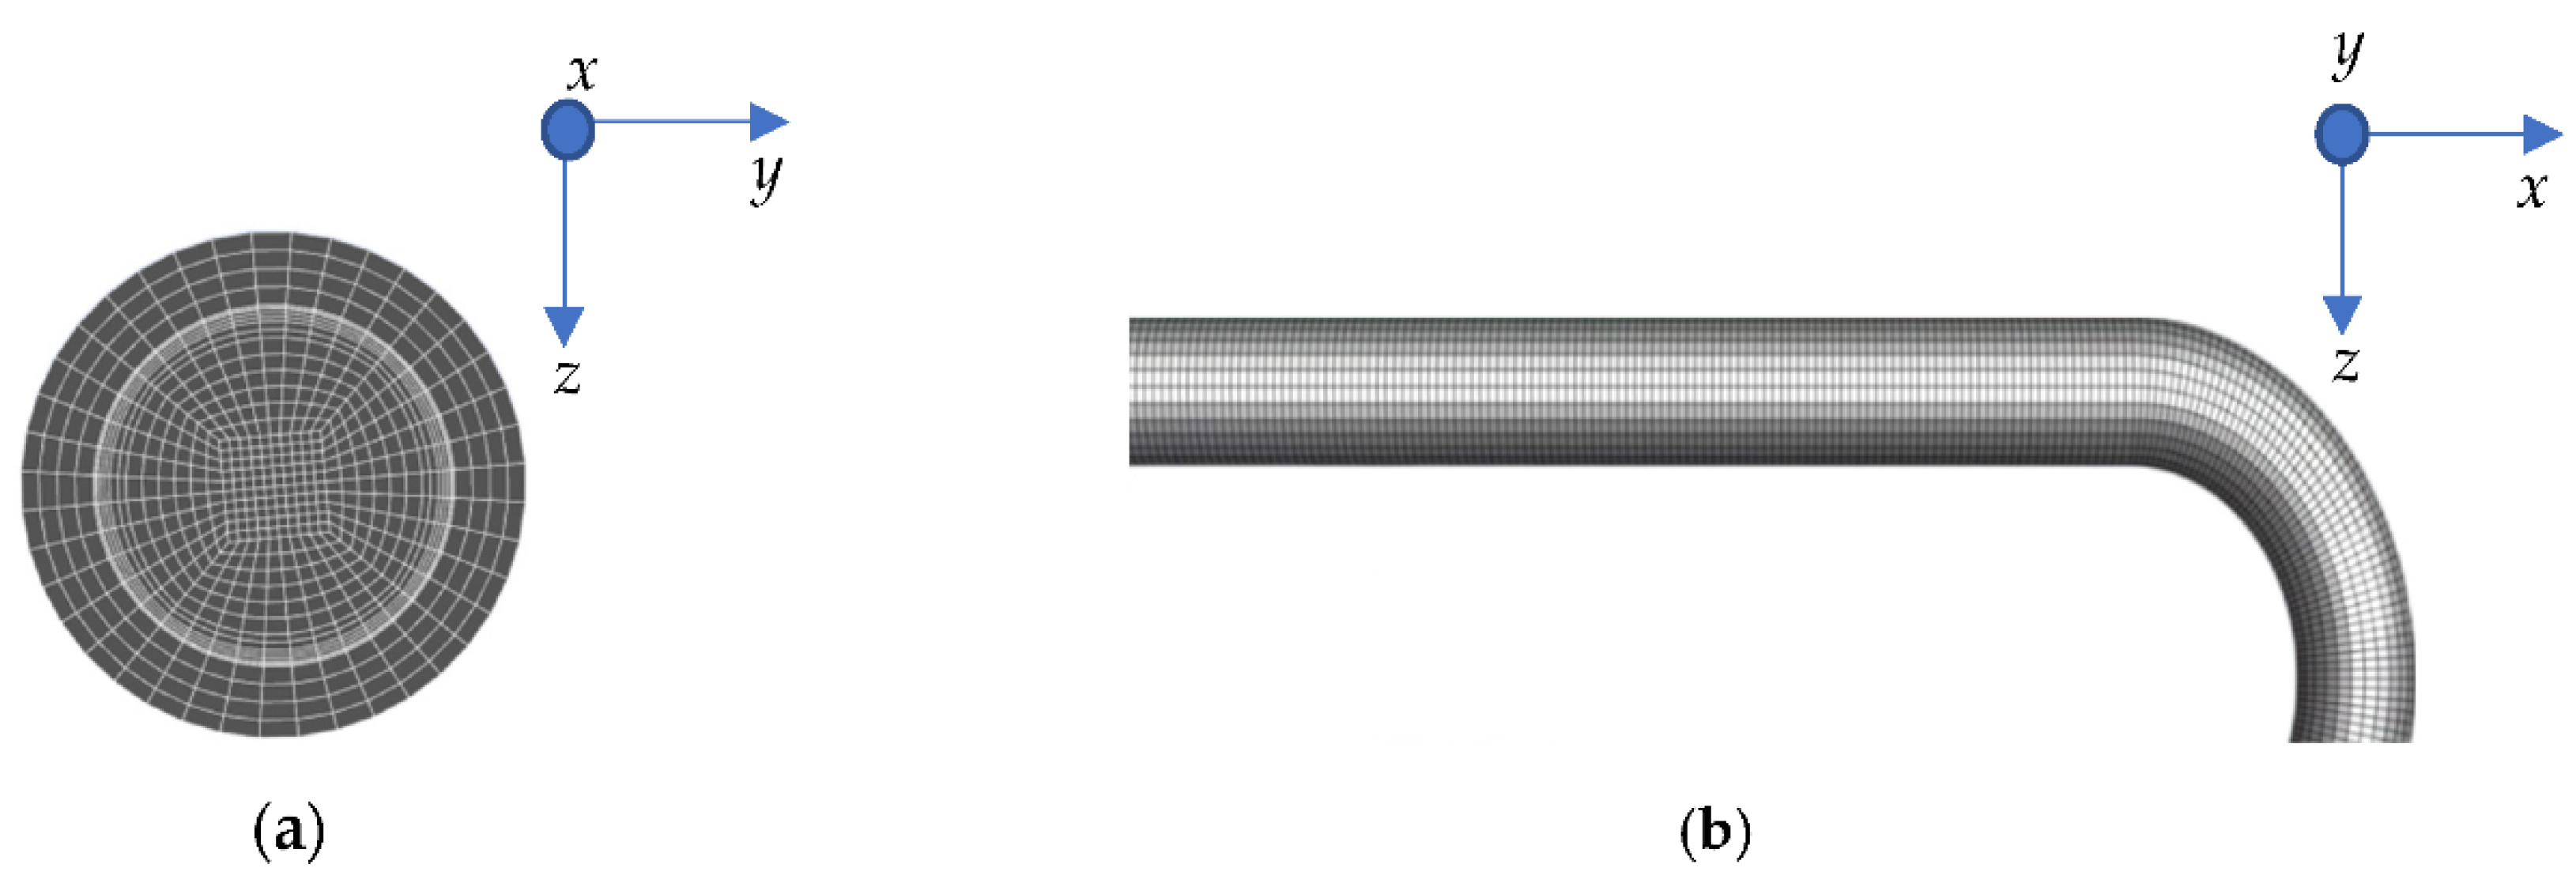
2.2. Meshing
2.3. Governing Equations
2.4. Data Reduction Method
2.5. Calculation Conditions
- Boundary condition setting: Firstly, the reference working condition was established, As shown in Figure 1, the gravity direction was the positive direction of the x-axis, and constant heat flow q was used in wall of the heating section. The boundary conditions are shown in the following.Tin = 15 K, Pout = 1.5 MPa
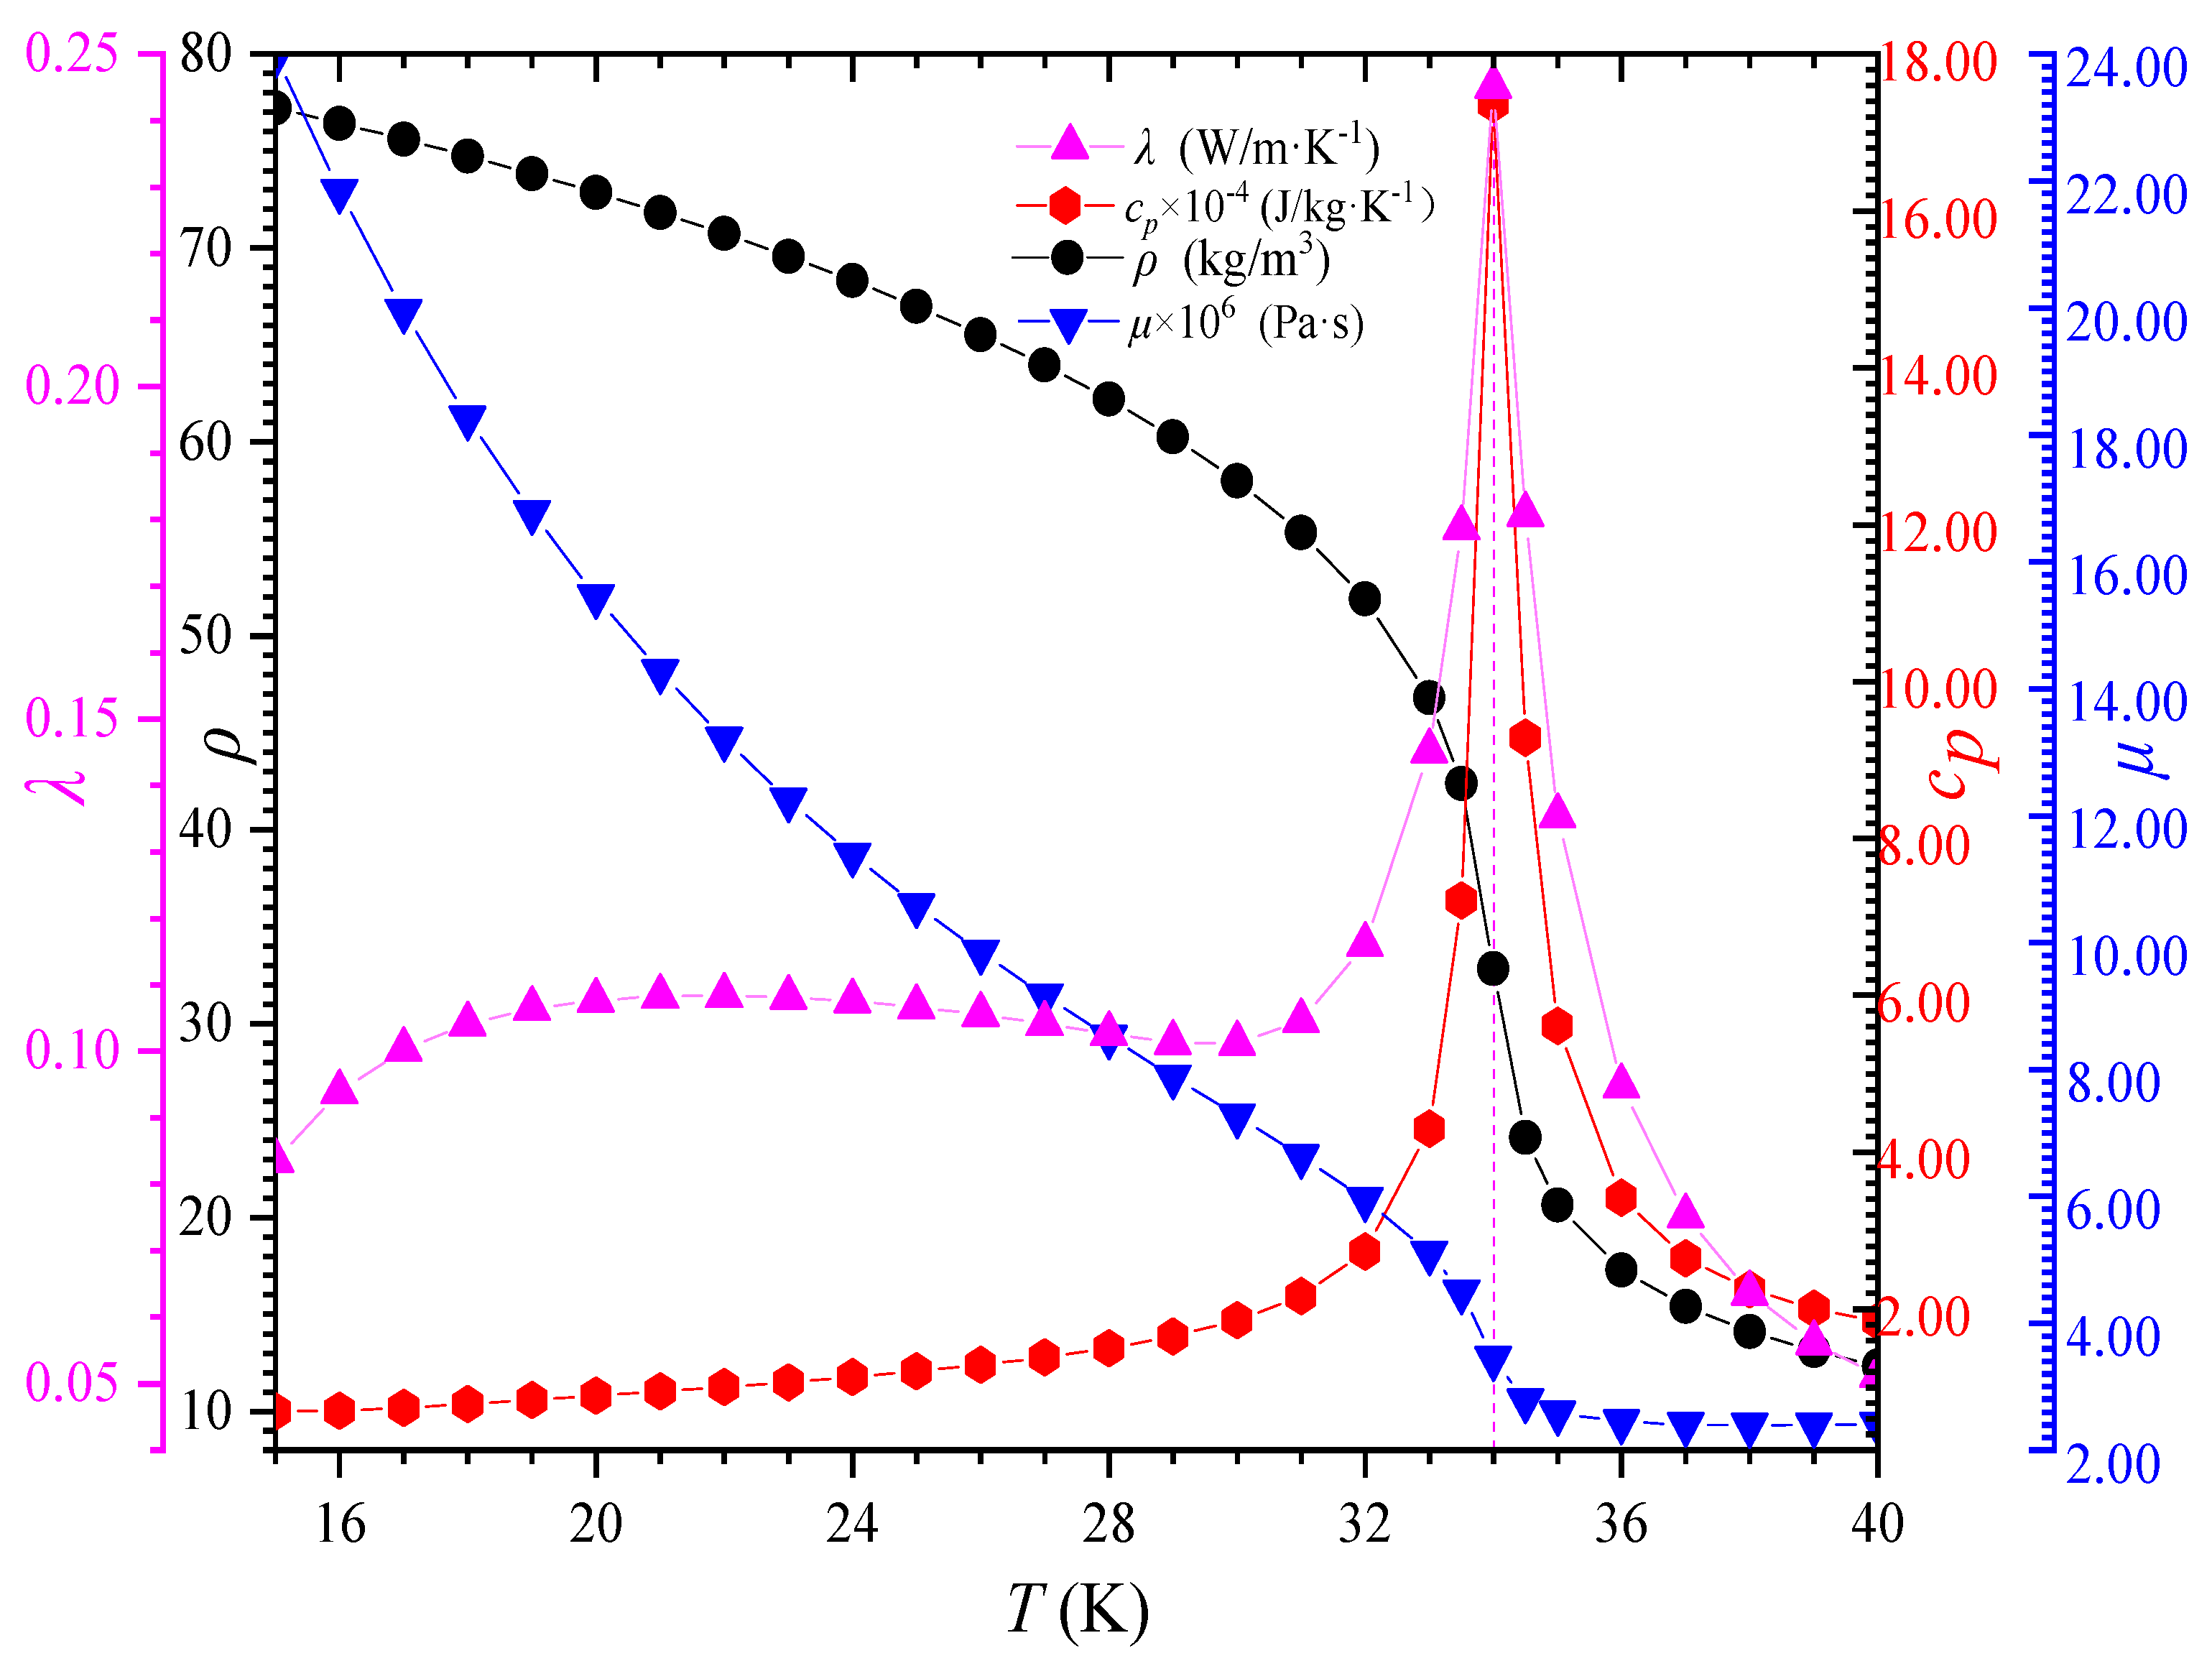
- Parameter settings of physical properties: Thermophysical properties of liquid hydrogen under supercritical conditions can be obtained from data provided by the National Institutes of Standards and Technology (NIST) [21]. The physical properties of liquid hydrogen can be regarded as a single value function of temperature. The corresponding thermal properties were inputted through the piecewise-linear interpolation function of CFX 2021. In this work, GASPAK software was used to calculate the thermophysical parameters of supercritical fluid hydrogen. When the temperature was inputted, the thermophysical parameters of the corresponding fluid were obtained, such as λ, cp, μ, ρ. The temperature range selected in this study was 15 K~40 K. The thermophysical parameters of supercritical liquid hydrogen were plotted by the obtained thermophysical parameters, as shown in Figure 3.
- As shown in Figure 3, the thermophysical properties of liquid hydrogen change with temperature at P = 1.5 MPa. For supercritical fluids, they were near the pseudo-critical temperature (the temperature corresponding to the maximum specific heat capacity of fluid at supercritical constant temperature). The physical properties of fluid will change sharply, which will affect the heat transfer of fluid. In general, the critical pressure and temperature of liquid hydrogen are 1.29 MPa and 33.15 K, respectively. It can be seen from Figure 3 that density, ρ, and dynamic viscosity, μ, both showed a downward trend with the increase in temperature and, finally, tended to converge. The changing trend of specific heat, cp, and thermal conductivity, λ, was similar. Still, the changing trend of specific heat, cp, was more significant, which is not conducive to the stability of liquid hydrogen in heat transfer.
3. Results and Discussion
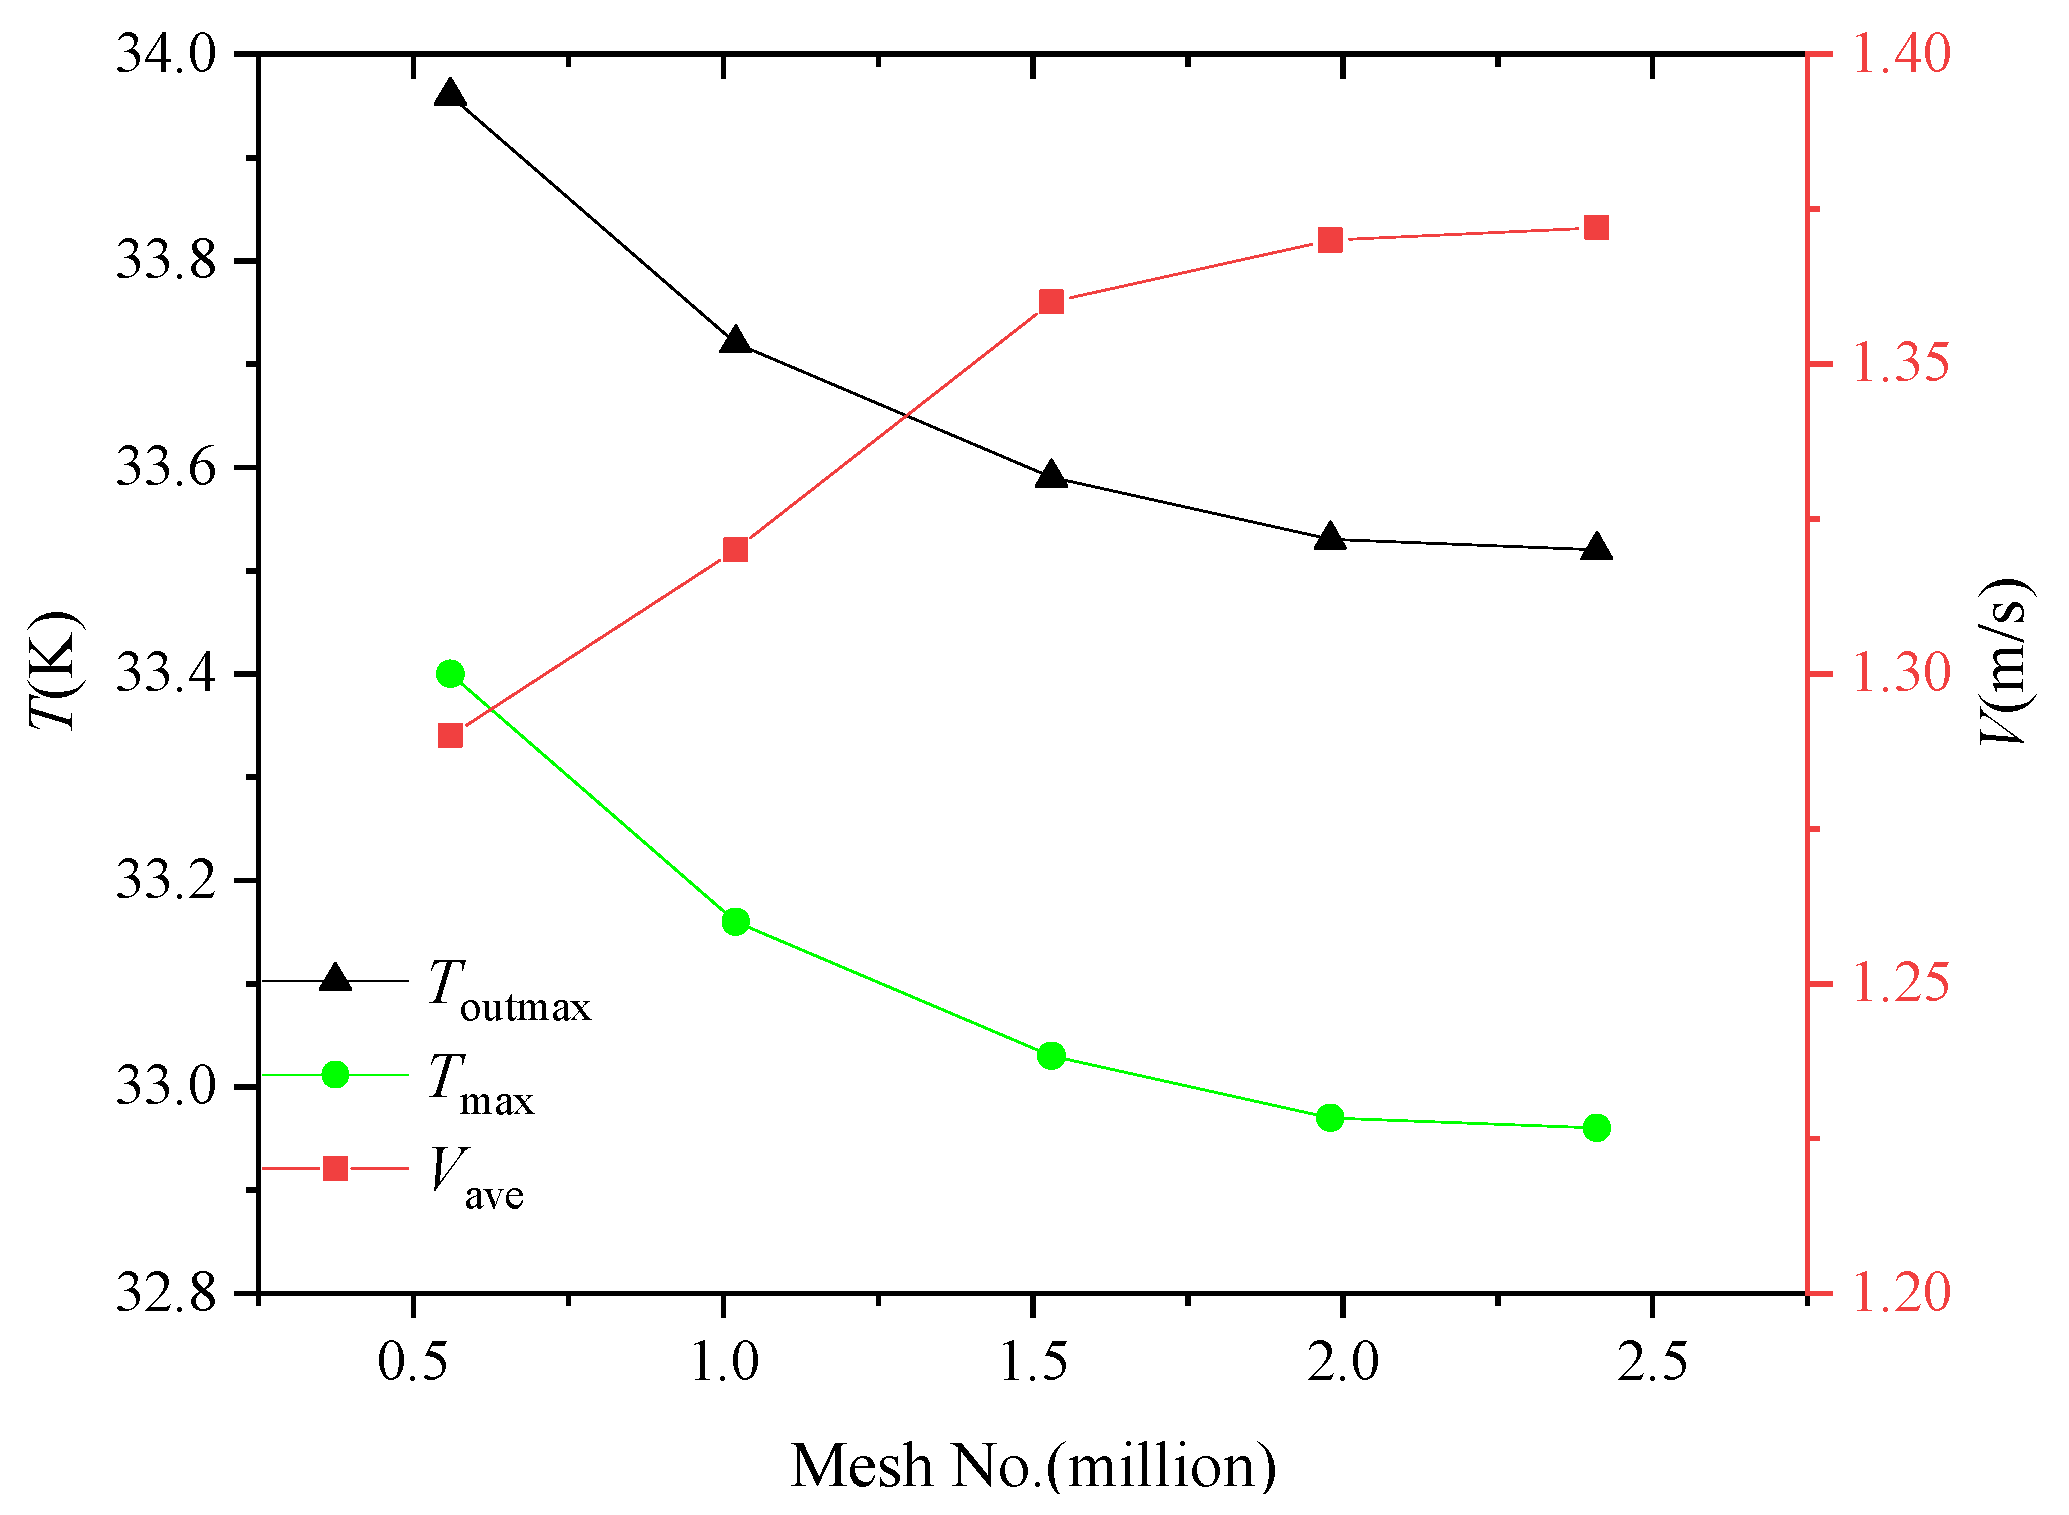
3.1. Verification of Grid Independence
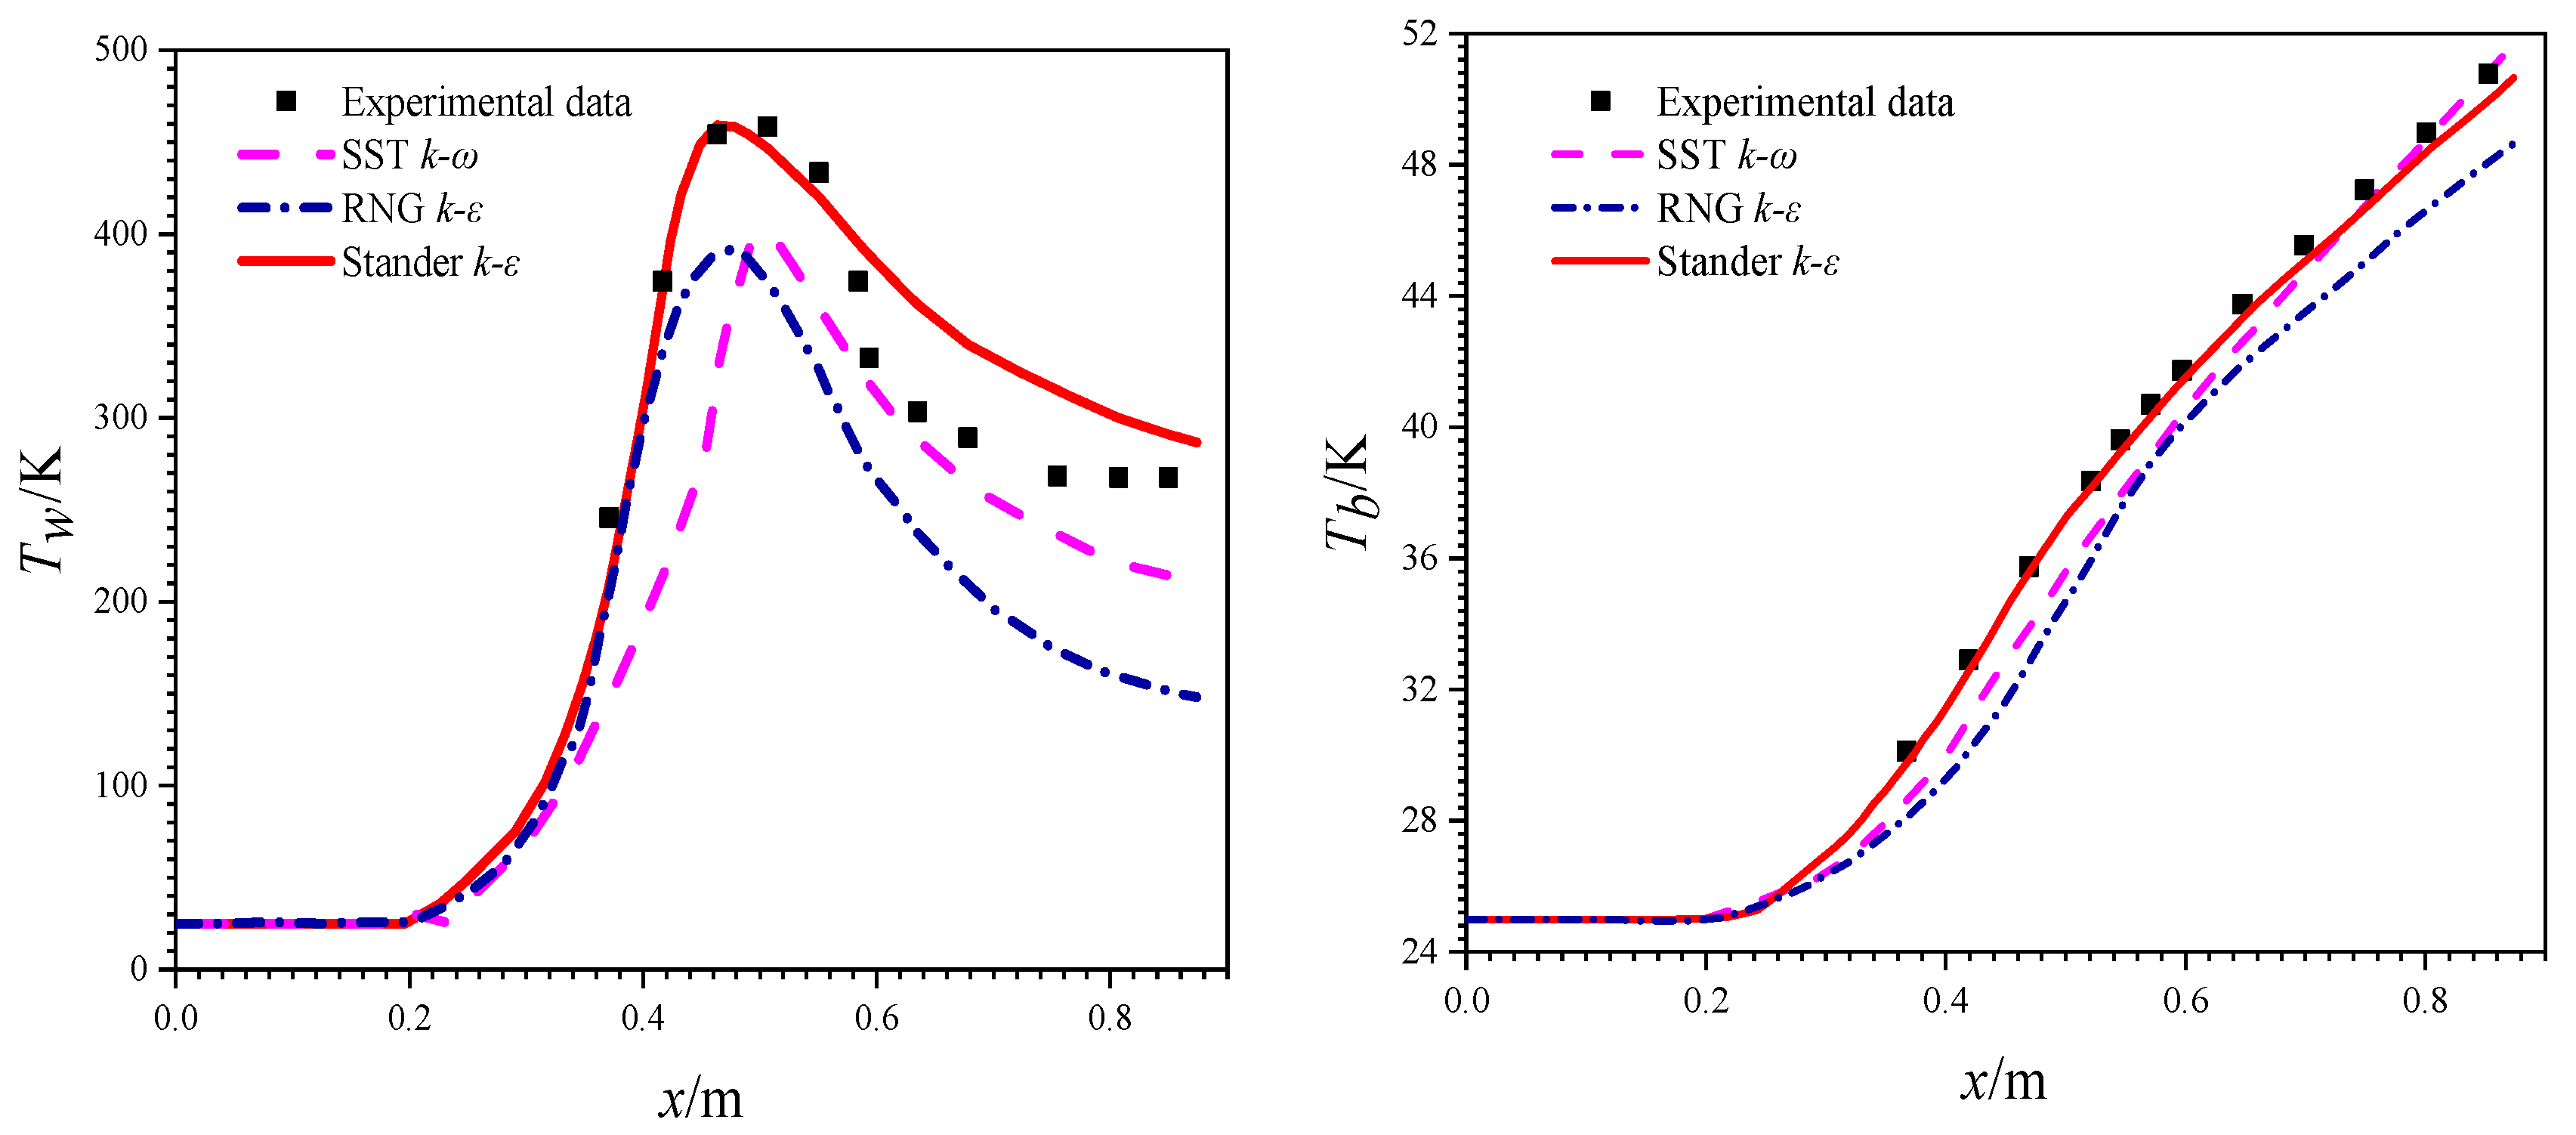
3.2. Sensitivity Analysis of Turbulence Model
3.3. Analysis of Heat Transfer Characteristics under Benchmark Conditions
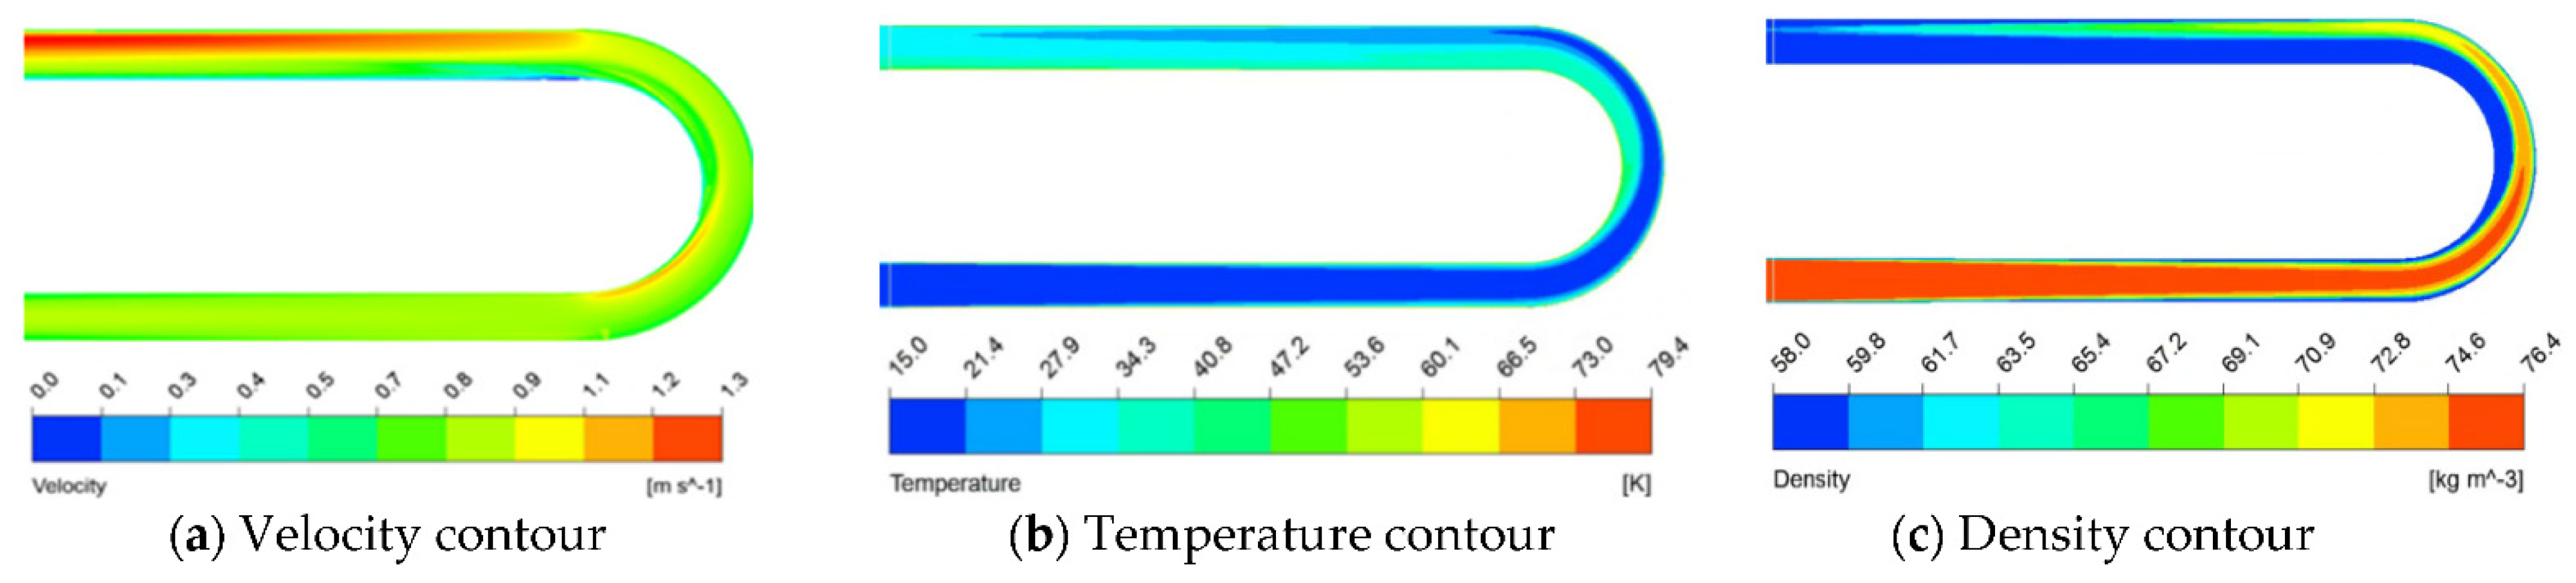
3.3.1. Analysis of Longitudinal Temperature, Density and Velocity under the Reference Condition
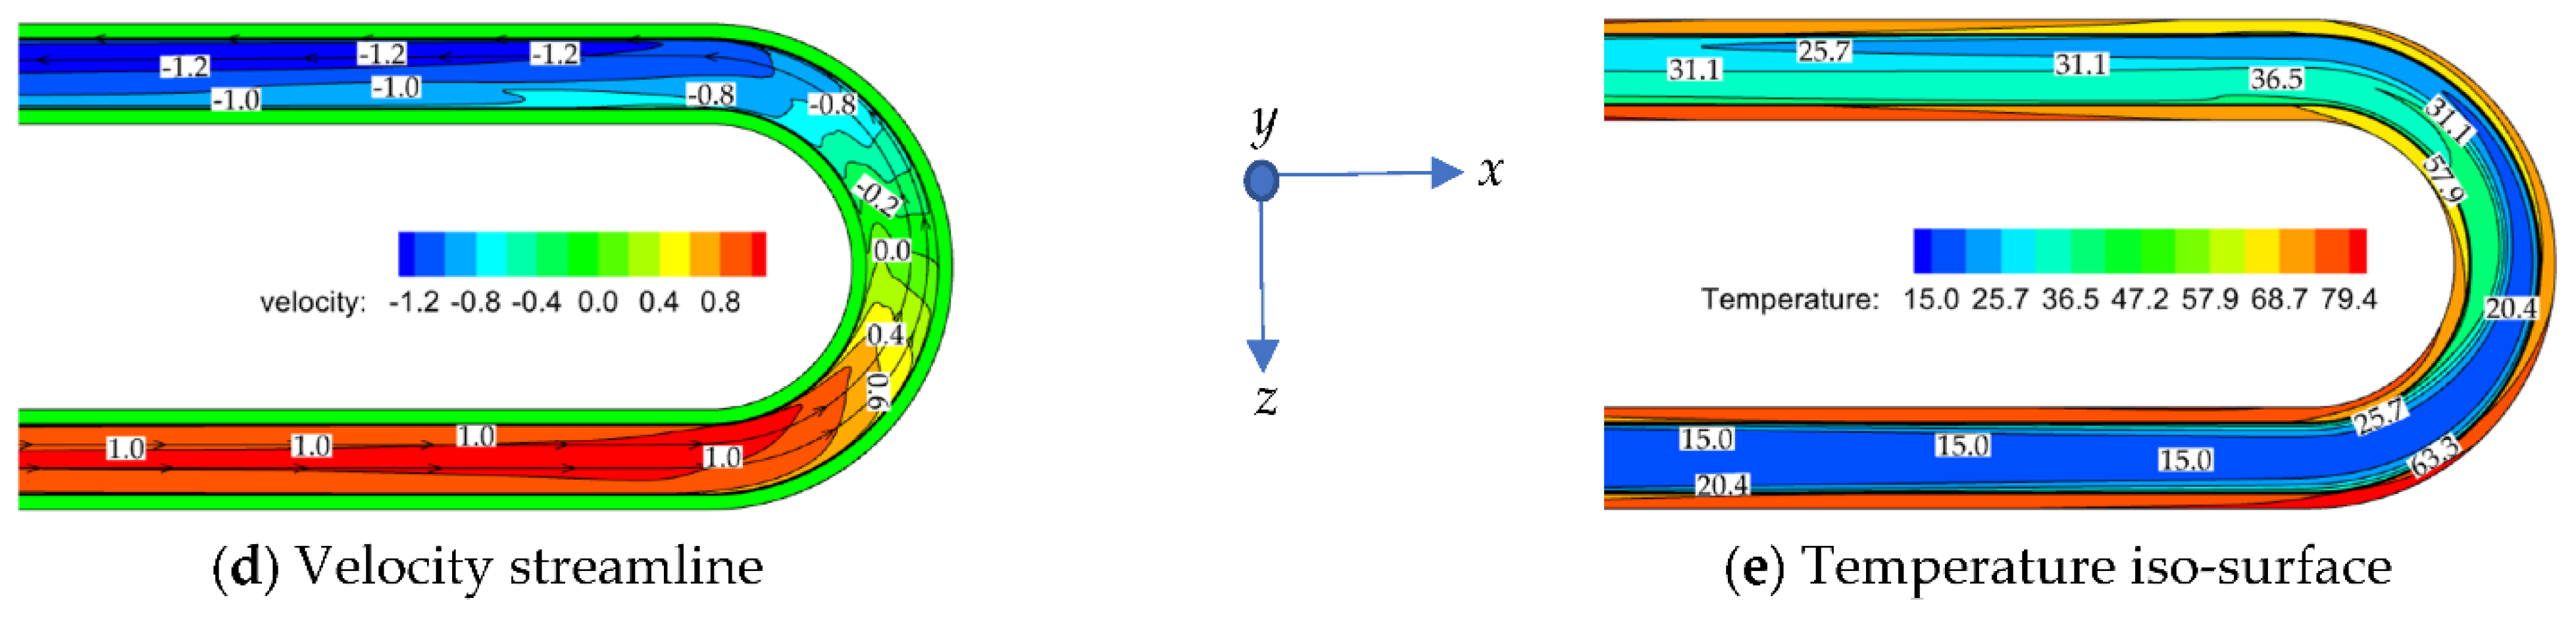
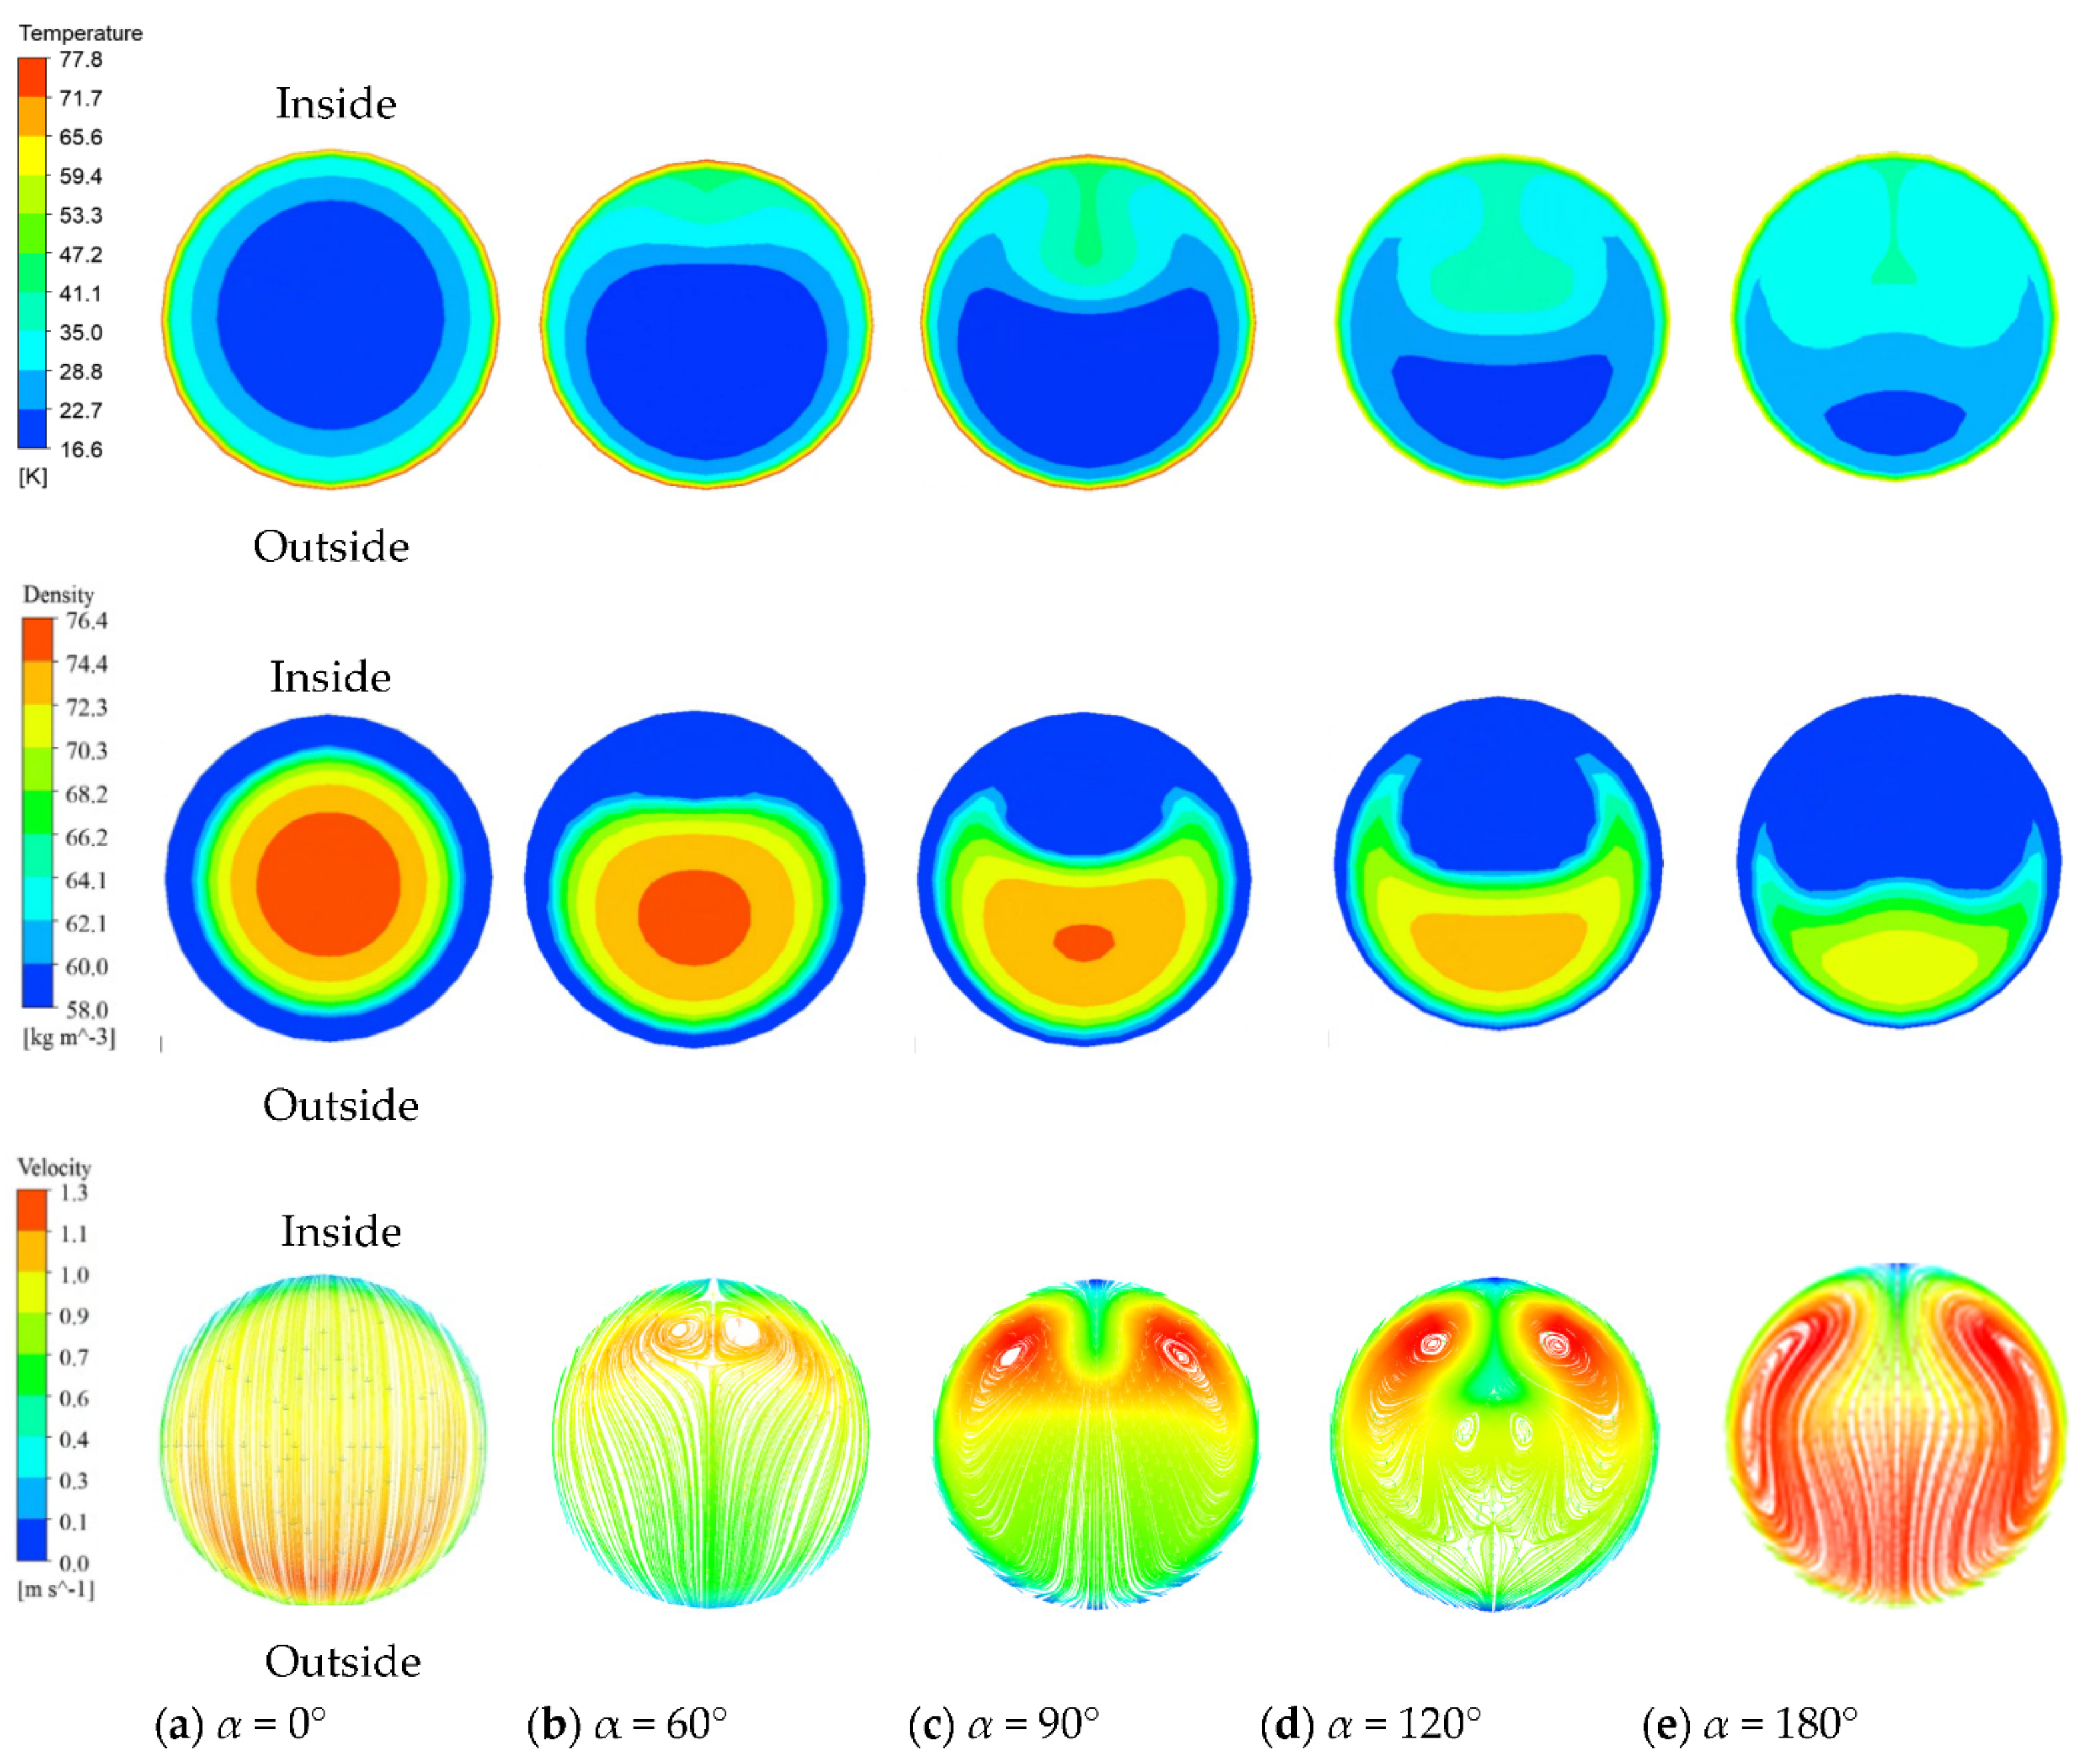
3.3.2. Analysis of Section Temperature, Density and Velocity at the Bend Pipe under the Reference Condition
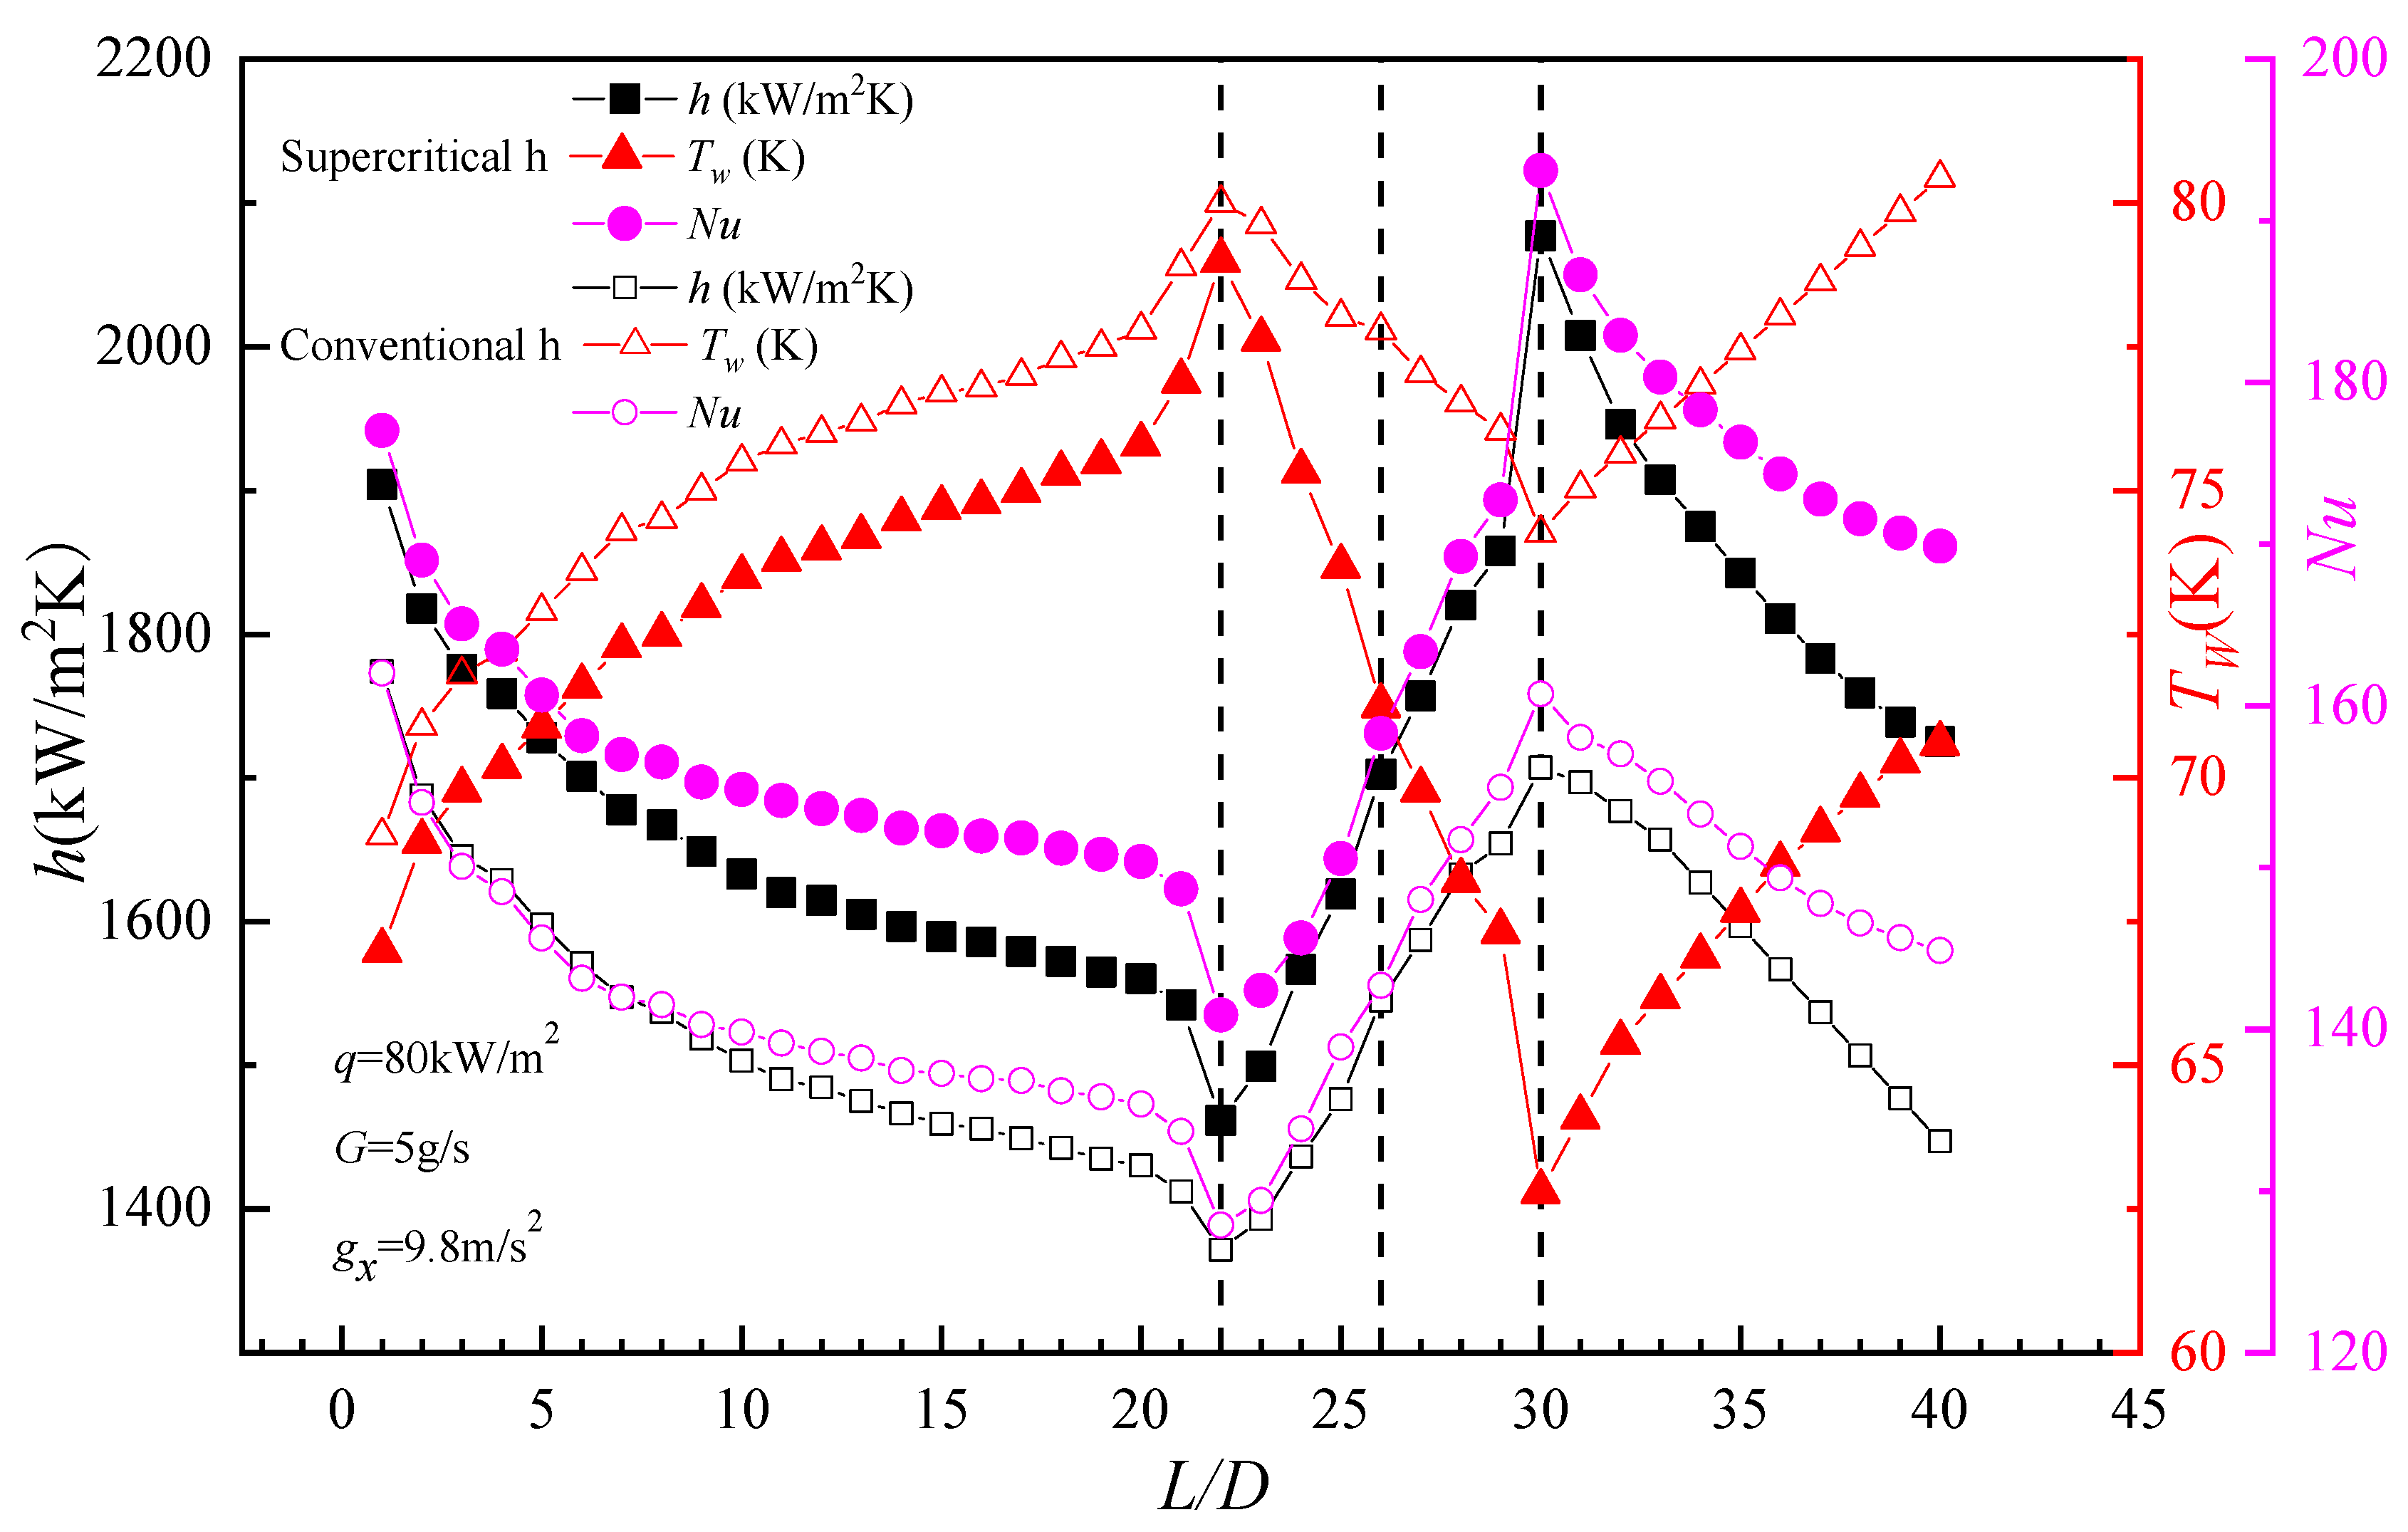
3.3.3. Analysis of Tw, h and Nu in the Tube
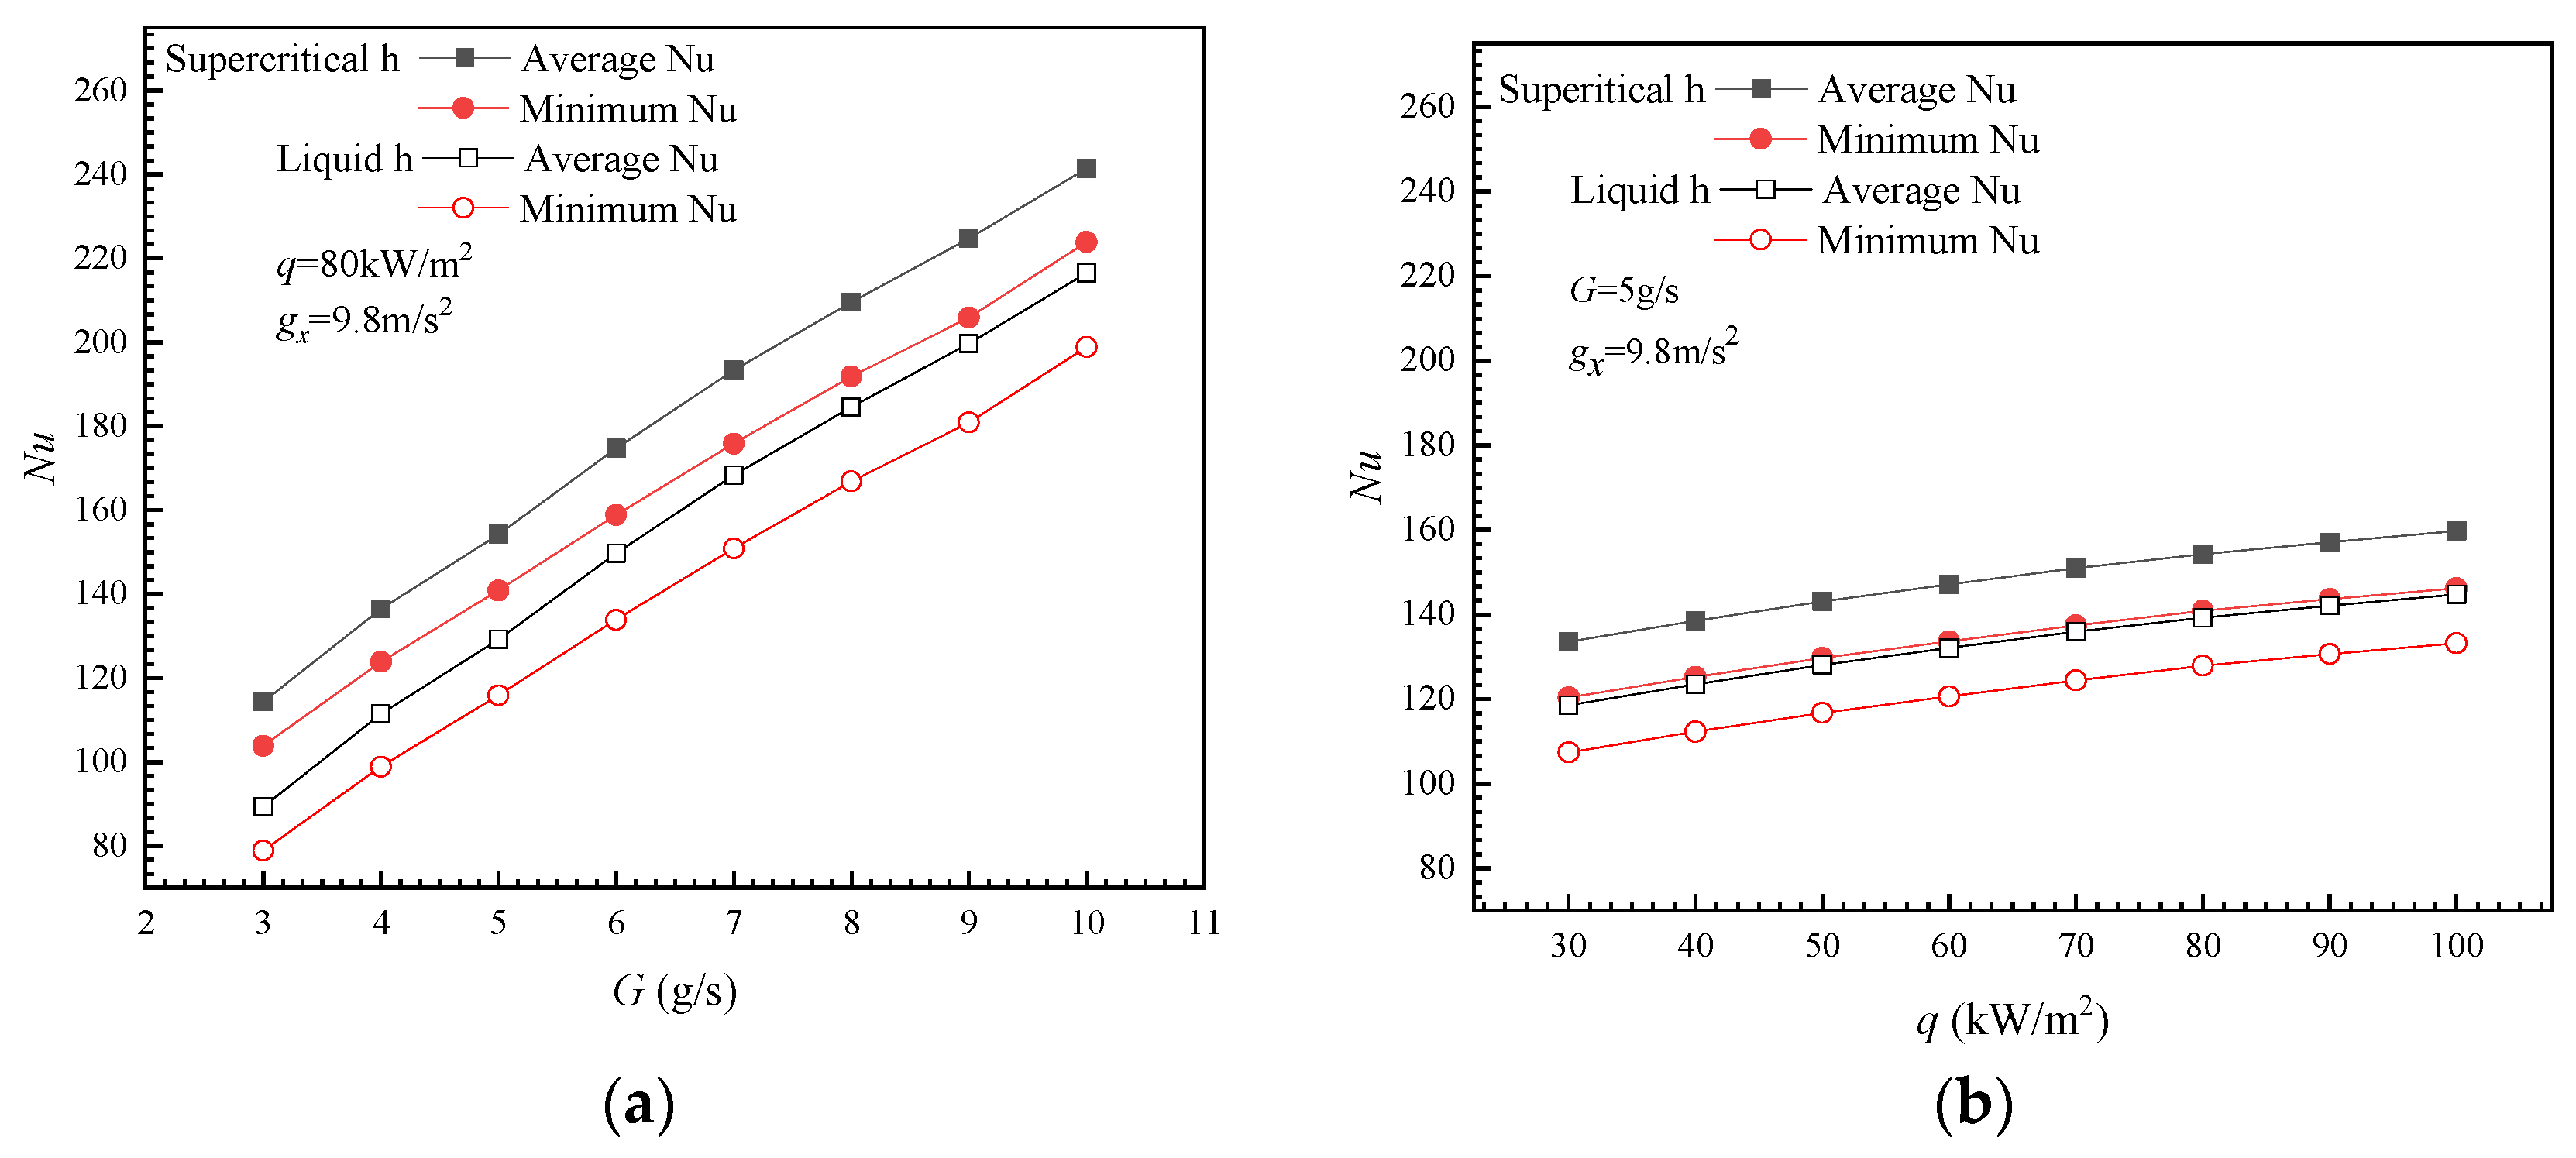
3.4. Analysis of the Average Nu and Minimum Nu under Different Working Conditions
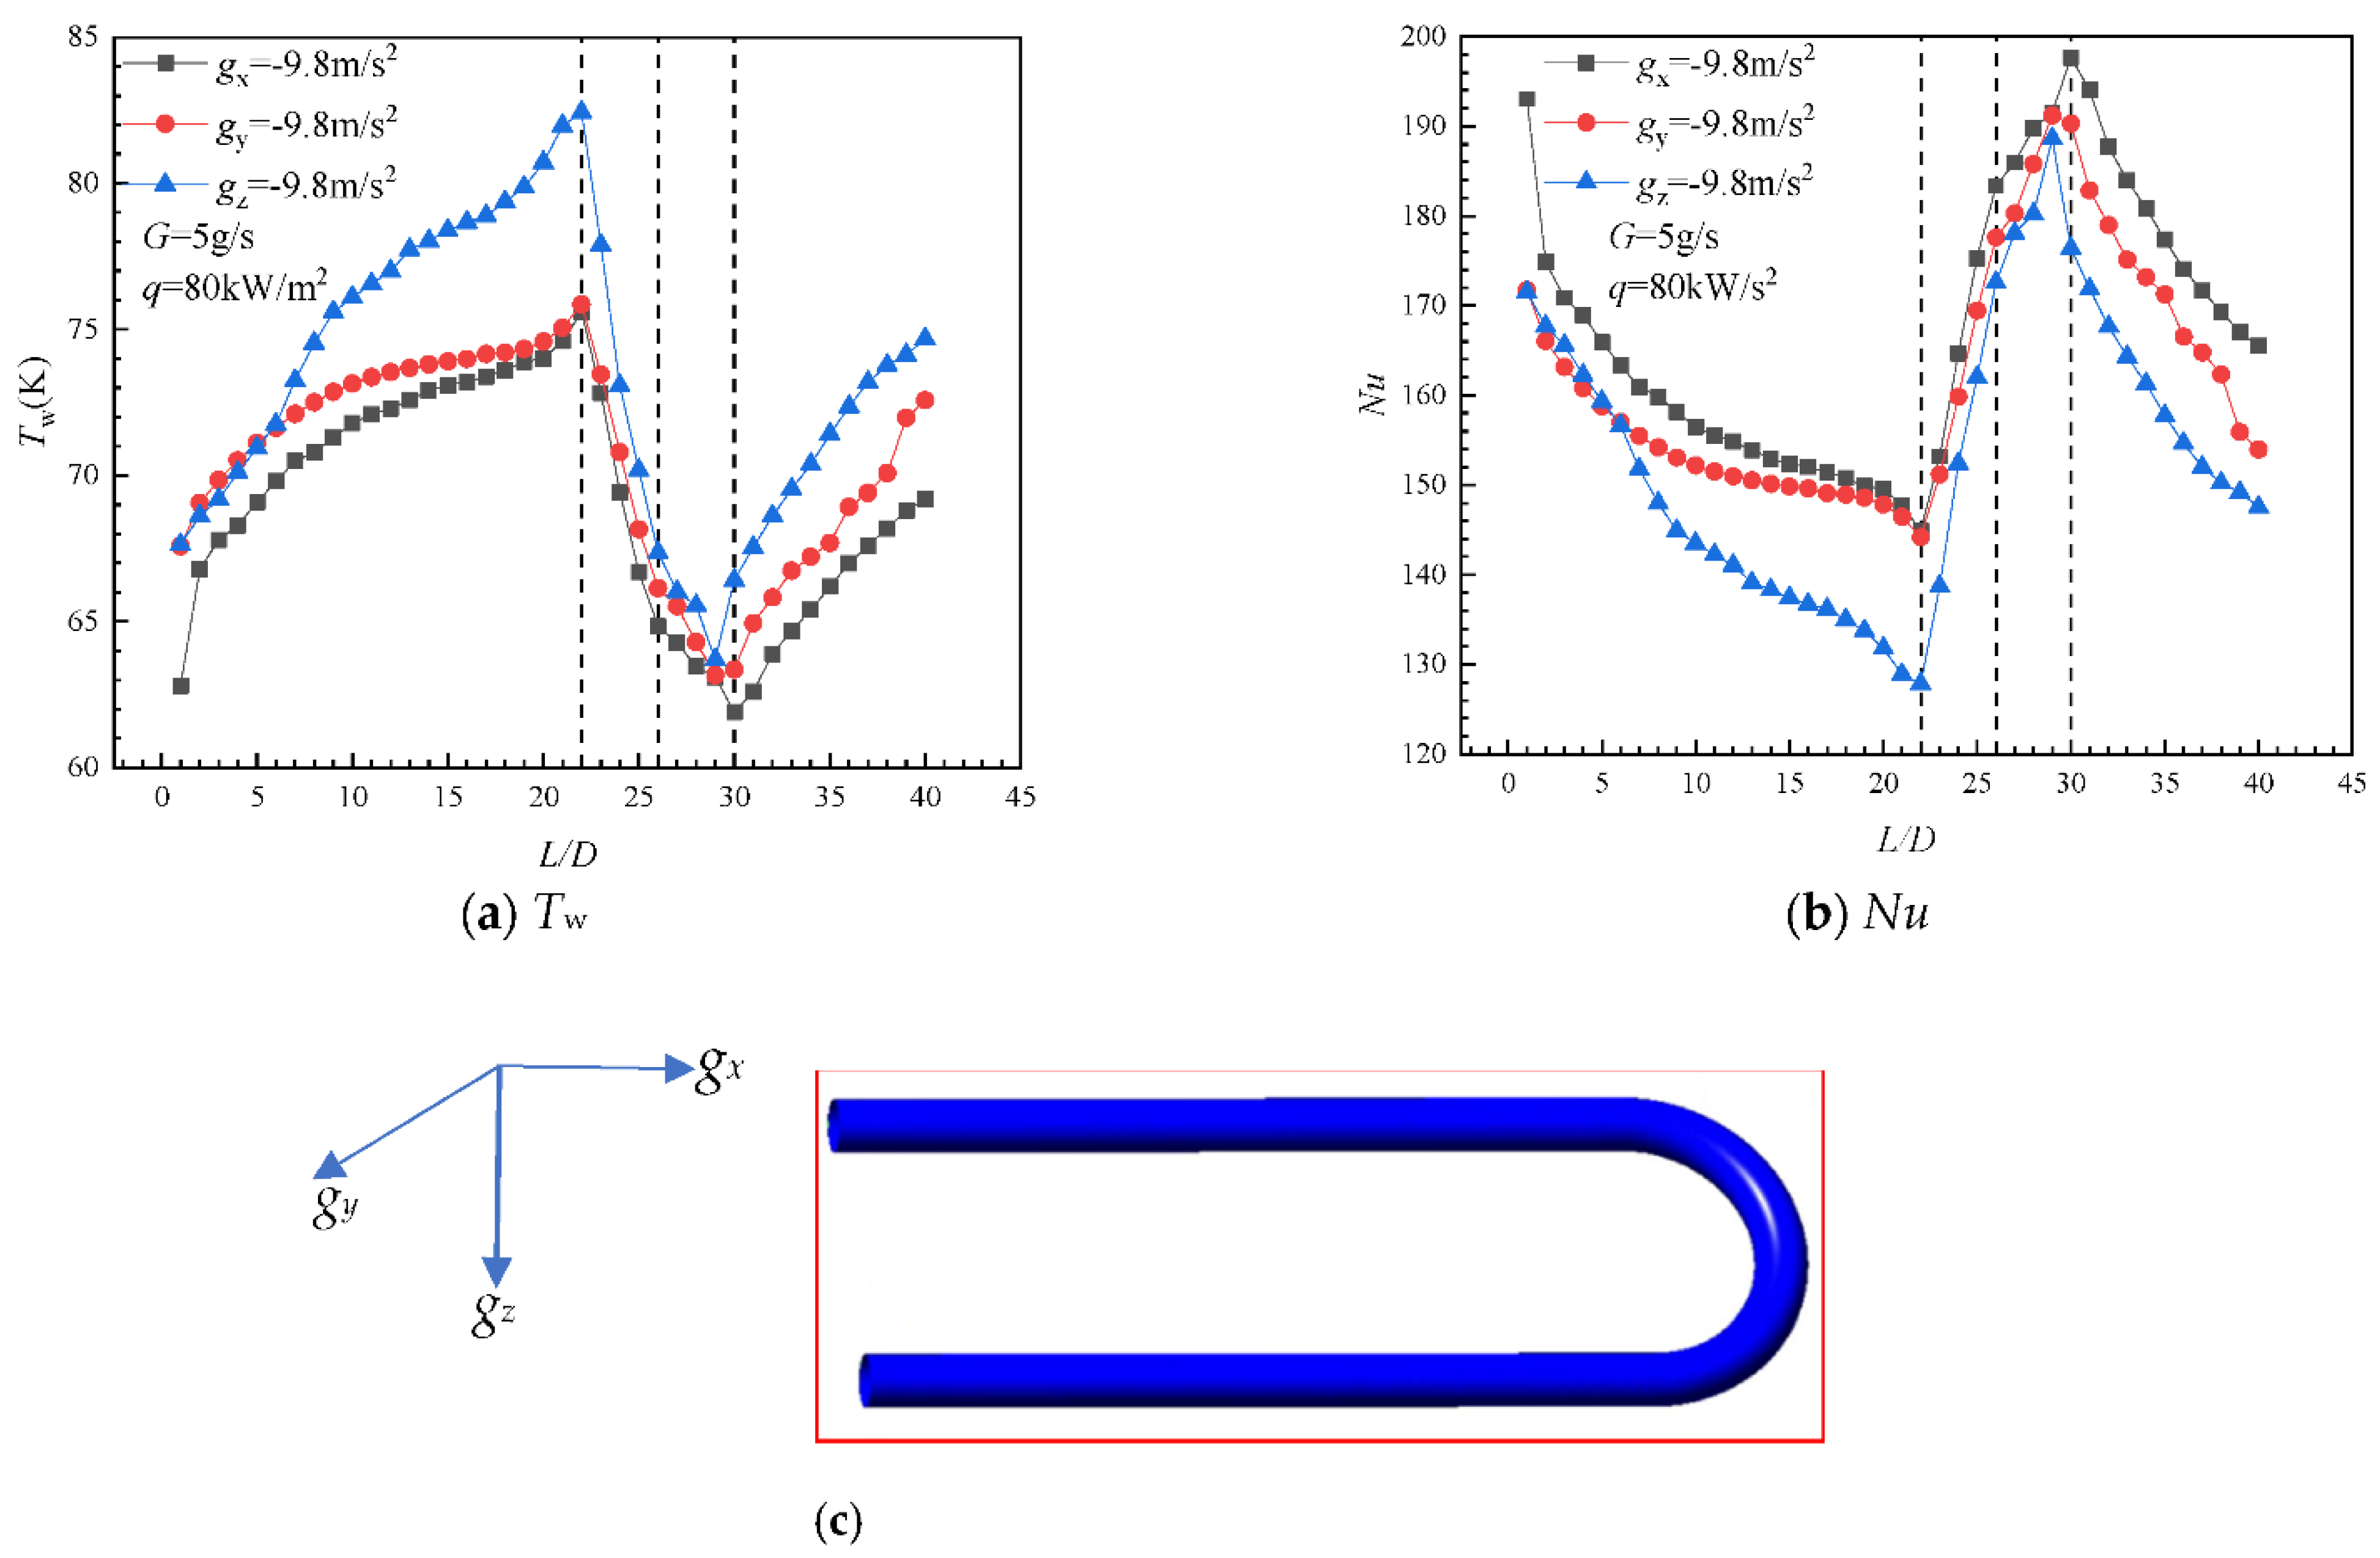
3.5. Effect of Gravity Direction on Flow and Heat Transfer of Supercritical Liquid Hydrogen
4. Conclusions
- During the flow of supercritical liquid hydrogen in U-tube, the heat transfer in the elbow part of the U-tube (α = 0°~180°) was strengthened, and heat transfer deterioration occurred at the elbow outlet (α = 180° L/D = 30).
- For the straight tube, when Re reached 1 × 10⁵, Nu approached to be constant. However, for the vertical elbow, when Re and q were from 27,375 to 54,750 and 80 kW/m2 and 100 kW/m2, Nu increased by 56.6% and 3.7%, and Re had a more significant impact on Nu variation.
- When the gravity direction was consistent with the flow direction of liquid hydrogen (gx direction), the Nu number inside the channel was 4.21%, which is 5.56% higher than that in the gy and gz direction, respectively. The heat transfer capacity of fluid in flow channel along x-axis direction was the strongest, followed by the y-axis direction, and the z-axis direction was the weakest.
Author Contributions
Funding
Institutional Review Board Statement
Informed Consent Statement
Data Availability Statement
Conflicts of Interest
Nomenclature
| A | cross-sectional area: m2 |
| D | tube hydraulic diameter, mm |
| δ | wall thickness, mm |
| τ | stress tensor |
| σk, σε | turbulent Prandtl numbers for k and ε |
| T | bulk fluid temperature, K |
| E | total energy, kJ/kg |
| P | static pressure, Pa |
| Gk, Gb | turbulence kinetic energy, kg/m2s |
| L | characteristic length, mm |
| R | curvature radius of the bend, mm |
| H | bulk liquid enthalpy, kJ/kg |
| Nu | Nussel number |
| Reynolds number | |
| Tw | averaging temperature of wall, K |
| Tb | bulk temperature of fluid, K |
| r | bend radius, mm |
| bending angle | |
| k | turbulence kinetic energy, m2/s2 |
| p | bulk liquid pressure, Pa |
| u | velocity vector, m/s |
| h | heat transfer coefficient, W/m2·K |
| density, kg/m3 | |
| thermal conductivity of the fluid, W/m·K−1 | |
| ε | dissipation rate of turbulent kinetic energy, m2/s3 |
| dynamic viscosity, Pa·S | |
| t | turbulent viscosity, Pa·S |
| qw | local heat flux of the wall, kW/m2 |
| Sk, Sε | source terms |
| ω | axial velocity, m/s |
| specific heat capacity, J/kg·K−1 | |
| ν | kinematic viscosity, m2/s |
| λeff | effective thermal conductivity, W/m·K−1 |
| τeff | shear stress, N/m2 |
| Sh | volumetric heat source |
References
- Chen, Z.J. China Spallation Neutron Source (CSNS). J. Chin. Acad. Sci. 2011, 66, 726–728. [Google Scholar]
- Yin, W.; Liang, T.; Yu, Q. Neutronics design for the coupled para-hydrogen moderator for CSNS. Nucl. Instrum. Methods Phys. Res. Sect. A Accel. Spectrometers Detect. Assoc. Equip. 2011, 631, 105–110. [Google Scholar] [CrossRef]
- Freels, J.D. COMSOL Validation Progress on Supercritical Hydrogen Heat Transfer. Source 2008, 6, 22–24. [Google Scholar]
- Hu, J.; Li, Z.; Gao, Y.; Yang, J.; Liu, L. Investigation into Abnormal Heat Transfer Mechanism of Supercritical Carbon Dioxide in Vertically Upward Tube. Chin. J. Ship Res. 2021, 16, 170–179. [Google Scholar]
- Aso, T.; Kaminaga, M.; Terada, A.; Hino, R. Thermal-Hydraulic Experiments and Analyses on Cold Moderator. In Proceedings of the ICANS-XV, Tsukuba, Japan, 11 November 2000; pp. 6–9. [Google Scholar]
- Aso, T.; Monde, M.; Sato, H.; Hino, R.; Tatsumoto, H.; Kato, T. Experimental Investigation of Characteristics of Impinging Jet Heat Transfer and Application to JSNS Moderator Design. Trans. At. Energy Soc. Jpn. 2006, 5, 179–189. [Google Scholar] [CrossRef]
- Hendricks, R.C.; Simon, F.F. Heat transfer to hydrogen flowing in a curved tube. Chem. Prop. 1963, 7, 7–9. [Google Scholar]
- Beech, J.C. Forced Convection Heat Transfer to Supercritical Cryogenic Hydrogen: Part 1. Lit. Surv. 1969, 12, 47–50. [Google Scholar]
- Zhou, B.; Ji, Y.; Sun, J.; Sun, Y.; Shi, L. Numerical Investigations of Supercritical Hydrogen Flow and Heat Transfer in Curved Tube. Hedongli Gongcheng/Nucl. Power Eng. 2019, 40, 197–201. [Google Scholar]
- Ortiz, F.J.G.; López-Guirao, F.; Jiménez-Espadafor, F.J.; Benjumea, J.M. Heat Transfer Limitations in Supercritical Water Gasification. Energies 2022, 15, 177. [Google Scholar] [CrossRef]
- Toor, S.S.; Shah, A.A.; Sharma, K.; Seehar, T.H.; Pedersen, T.H.; Rosendahl, L.A. Bio-Crude Production from Protein-Extracted Grass Residue through Hydrothermal Liquefaction. Energies 2022, 15, 364. [Google Scholar] [CrossRef]
- Diao, L. Numerical Simulation of Flow and Heat Transfer Characteristics of Supercritical CO2 in Straight and Spiral Tubes. Master’s Thesis, Guangdong University of Technology, Guangzhou, China, 2020. [Google Scholar]
- Zhang, K.; Han, C.; Ren, J.; Zhou, Y.; Bi, M. Numerical Simulation on Heat Transfer of Supercritical LNG in Coil Tubes of Submerged Combustion Vaporizer. Huagong Xuebao/CIESC J. 2015, 66, 4788–4795. [Google Scholar]
- Yu, B.W.; Fan, Y.Y.; Wang, Y.S.; Hong, W.P.; Niu, X.J. Numerical study on heat transfer characteristics of supercritical CO2-DME mixture in vertical circular tube. Eng. Thermophys. 2021, 42, 481–488. [Google Scholar]
- Wang, Y.; Lu, Y.; Li, S.; Dong, M. Numerical Study on Heat Transfer of Supercritical-Pressure RP-3 Aviation Kerosene in U-Turn Circular Tubes. Huagong Xuebao/CIESC J. 2021, 72, 4639–4648. [Google Scholar]
- Wu, M.T. Numerical Study on Flow and Heat Transfer of n-Decane in Supercritical State; Northeast Electric Power University: Jilin City, China, 2021. [Google Scholar]
- Wu, X.M.; Zhao, R.; Wei, Z.F. Study on flow boiling heat transfer characteristics of CO2/propane mixture in horizontal tube. J. Eng. Thermophys. 2013, 34, 4. [Google Scholar]
- Keshavarzzadeh, A.H.; Ahmadi, P.; Safaei, M.R. Assessment and Optimization of an Integrated Energy System with Electrolysis and Fuel Cells for Electricity, Cooling and Hydrogen Production Using Various Optimization Techniques. Int. J. Hydrogen Energy 2019, 44, 21379–21396. [Google Scholar] [CrossRef]
- Han, C.L.; Ren, J.J.; Dong, W.P.; Bi, M.S. Numerical Investigation of Supercritical LNG Convective Heat Transfer in a Horizontal Serpentine Tube. Cryogenics (Guildf) 2016, 78, 1–13. [Google Scholar] [CrossRef]
- Matsson, J.E. An Intrduction to ANSYS Fluent 2021; SDS Publications: Mission, KS, USA, 2021; pp. 75–83. [Google Scholar]
- Lemmon, E.; McLinden, M.O.; Huber, M.L. NIST Reference Fluid Thermodynamic and Transport Properties-REFPROP. Chem. Prop. 2002, 23, v7. [Google Scholar]
- An, E.K.; Zhang, R.; Han, Y.F. Grid independence analysis of numerical simulation of multiphase turbulent combustion. Boil. Technol. 2018, 49, 5. [Google Scholar]
- Friedman, R.; Graham, R.W.; Hendricks, R.C.; Hsu, Y.Y. Experimental Heat-Transfer Results for Cryogenic Hydrogen Flowing in Tubes at Subcritical and Supercritical Pressures to 800 Pounds per Square Inch Absolute. Natl. Aeronaut. Space Admin. 2016, 16, 1–23. [Google Scholar]
- Zhu, L.; Lu, Y.; Tong, J.; Liang, T.; Lu, Y.; Fu, W.; Wang, B.; Zhang, Y. Sensitivity Analysis of Influencing Factors of Supercritical Methane Flow and Heat Transfer in a U-Tube. Energies 2021, 14, 5714. [Google Scholar] [CrossRef]
- Mao, S.; Zhou, T.; Wei, D.; Liu, W.; Zhang, Y. Heat transfer characteristics of supercritical water in channels: A systematic literature review of 20 years of research. Appl. Therm. Eng. 2021, 197, 117403. [Google Scholar] [CrossRef]


Publisher’s Note: MDPI stays neutral with regard to jurisdictional claims in published maps and institutional affiliations. |
© 2022 by the authors. Licensee MDPI, Basel, Switzerland. This article is an open access article distributed under the terms and conditions of the Creative Commons Attribution (CC BY) license (https://creativecommons.org/licenses/by/4.0/).
Share and Cite
Fu, W.; Lu, Y.; Shen, F.; Mei, L.; Wang, S.; Lu, Y.; Zhu, L.; Fu, S.; Tong, J. Study on Convective Heat Transfer Characteristics of Supercritical Liquid Hydrogen in a U-Type Tube inside a Moderator. Energies 2022, 15, 3605. https://doi.org/10.3390/en15103605
Fu W, Lu Y, Shen F, Mei L, Wang S, Lu Y, Zhu L, Fu S, Tong J. Study on Convective Heat Transfer Characteristics of Supercritical Liquid Hydrogen in a U-Type Tube inside a Moderator. Energies. 2022; 15(10):3605. https://doi.org/10.3390/en15103605
Chicago/Turabian StyleFu, Weida, Yiping Lu, Fei Shen, Longwei Mei, Songlin Wang, Youlian Lu, Lingbo Zhu, Shinian Fu, and Jianfei Tong. 2022. "Study on Convective Heat Transfer Characteristics of Supercritical Liquid Hydrogen in a U-Type Tube inside a Moderator" Energies 15, no. 10: 3605. https://doi.org/10.3390/en15103605
APA StyleFu, W., Lu, Y., Shen, F., Mei, L., Wang, S., Lu, Y., Zhu, L., Fu, S., & Tong, J. (2022). Study on Convective Heat Transfer Characteristics of Supercritical Liquid Hydrogen in a U-Type Tube inside a Moderator. Energies, 15(10), 3605. https://doi.org/10.3390/en15103605