1. Introduction
The thermal radiation effect has been widely used in the fields of industry and renewable energy [
1,
2], among others. With the increase of combustion temperatures, the thermal radiation effect for hot components in the new generation of aero-engines has become a key factor in the combustion process, cooling structure design, and thermal protection [
3]. Under actual operating conditions, a turbine’s frontal and hot components are in a high temperature environment with great thermal radiation impact. Owing to full-field, non-grey, and coupling characteristics, thermal radiation is not only associated with gas temperature, composition. and concentration, but also with multiple physical processes of fuel evaporation, atomization, combustion, carbon black generation, and turbulence fluctuation [
4]. The prediction and measurement of thermal radiation characteristics for hot gas [
5] and thermal barrier coating (TBC) surfaces [
6] is therefore a challenging topic. A radiation loading system can be used as an external heat source to simulate the real thermal environment of hot components in aero-engines.
Aerodynamic heating and thermal radiation heating are two approaches mainly used for thermal performance testing in the aeronautic and astronautic fields [
7]. The former approach simulates an aerodynamic heating environment using a high temperature and speed wind tunnel and a gas heating device [
8,
9]. The latter possesses the competitive advantages of longer heating time, higher heating power, and multi-zone control [
10], and has become an effective and widely used method for full-scale thermal performance tests. Thermal radiation heaters include graphite element heaters, solar furnaces, quartz lamps, xenon lamps, etc. [
11,
12]. Graphite heaters allow for thermal test environments with higher heating temperatures. However, the heating rate of graphite heaters is low and cannot satisfy rapid temperature/heat flux change requirements [
13]. Solar furnaces have the advantages of high temperature and efficiency; heating stability is the main drawback that hinders their application [
14]. At present, quartz lamp heaters are commonly used in aerodynamic heating test simulations. Most thermal radiation heaters employ parallel long strips or wires of lamp heaters that form modular heating elements or surround the target structure [
7]. Because the long quartz lamps heaters overlap with each other and should be treated as extended sources, optical transmission is difficult to control. The drawback lies in inflexible heat flux distribution that does not represent the real conditions in a gas turbine. Xenon lamps, on the other hand, can be normally treated as point optical sources [
15], which are particularly suitable for optical optimization. Xenon lamps combined with reflecting mirrors can be used for optimized control of target heat flux distribution, as well as total radiation energy.
Optimization methods have been developed for decades. Metaheuristic algorithms such as ray optimization [
16], spiral dynamics inspired optimization [
17], central force optimization [
18], etc., have been adopted for physics problems. Novel optics-inspired optimization algorithms have been introduced based on the optical characteristics of concave and convex mirrors [
19]. The Ant Colony Optimization (ACO) algorithm, combined with dynamic source-target mapping, was adopted to find suitable aiming vectors for modular reflectors for solar power stations in space [
20]. Non-imaging optics mainly concern energy transmission efficiency and heat flux distribution instead of imaging quality [
21]. This meet current requirement of achieving specific heat flux on a target surface. In the area of non-imaging optics, the edge-ray principle and some specific methods have been developed for optical optimizations [
22]. Typical non-imaging design methods include the Wassermann–Wolf differential equation method [
23], the simultaneous multiple surface (SMS) method [
24], source-target mapping [
25], and multi-parameter optimizations [
26]. Freeform surfaces (FFS) designed by non-imaging optics do not have a fixed mathematical expression. Instead, they are described by B-spline curves or surfaces [
27], and therefore have extremely high controllable freedom. Freeform optical systems are widely used in illumination engineering [
28] and solar energy application systems [
29]. The Geometrical Construction Method (GCM), combined with feedback modifications, has been widely applied for Light Emitting Diode (LED) modules.
With the aid of freeform optics and the feedback optimization method, the current study develops a concentrating-type radiation heating system for the leading-edge surfaces of C3X turbine vanes. A xenon lamp combined with a freeform reflector was optimized for controllable heat flux. A design method in the area of illumination engineering was innovatively extended for the current model. The source-target mapping between the optical emitter and receiving surface was built first. The initial discrete points of the freeform reflector were generated through GCM. The FFS was constructed by connecting these points by Delaunay triangulation. Considering the effect of polar angular radiative flux distribution of a xenon lamp, the Monte Carlo ray tracing (MCRT) method was adopted to evaluate the optical performance. Feedback modifications based on Bayesian theory were adopted to obtain the optimal shape of the FFS for target heat flux. The current study seeks a feasible way to generate 3-D heat flux distribution for complex curved surfaces, such as turbine vane surfaces, and helps to simulate the real thermal environment of hot components in aero-engines.
2. Optical System Description
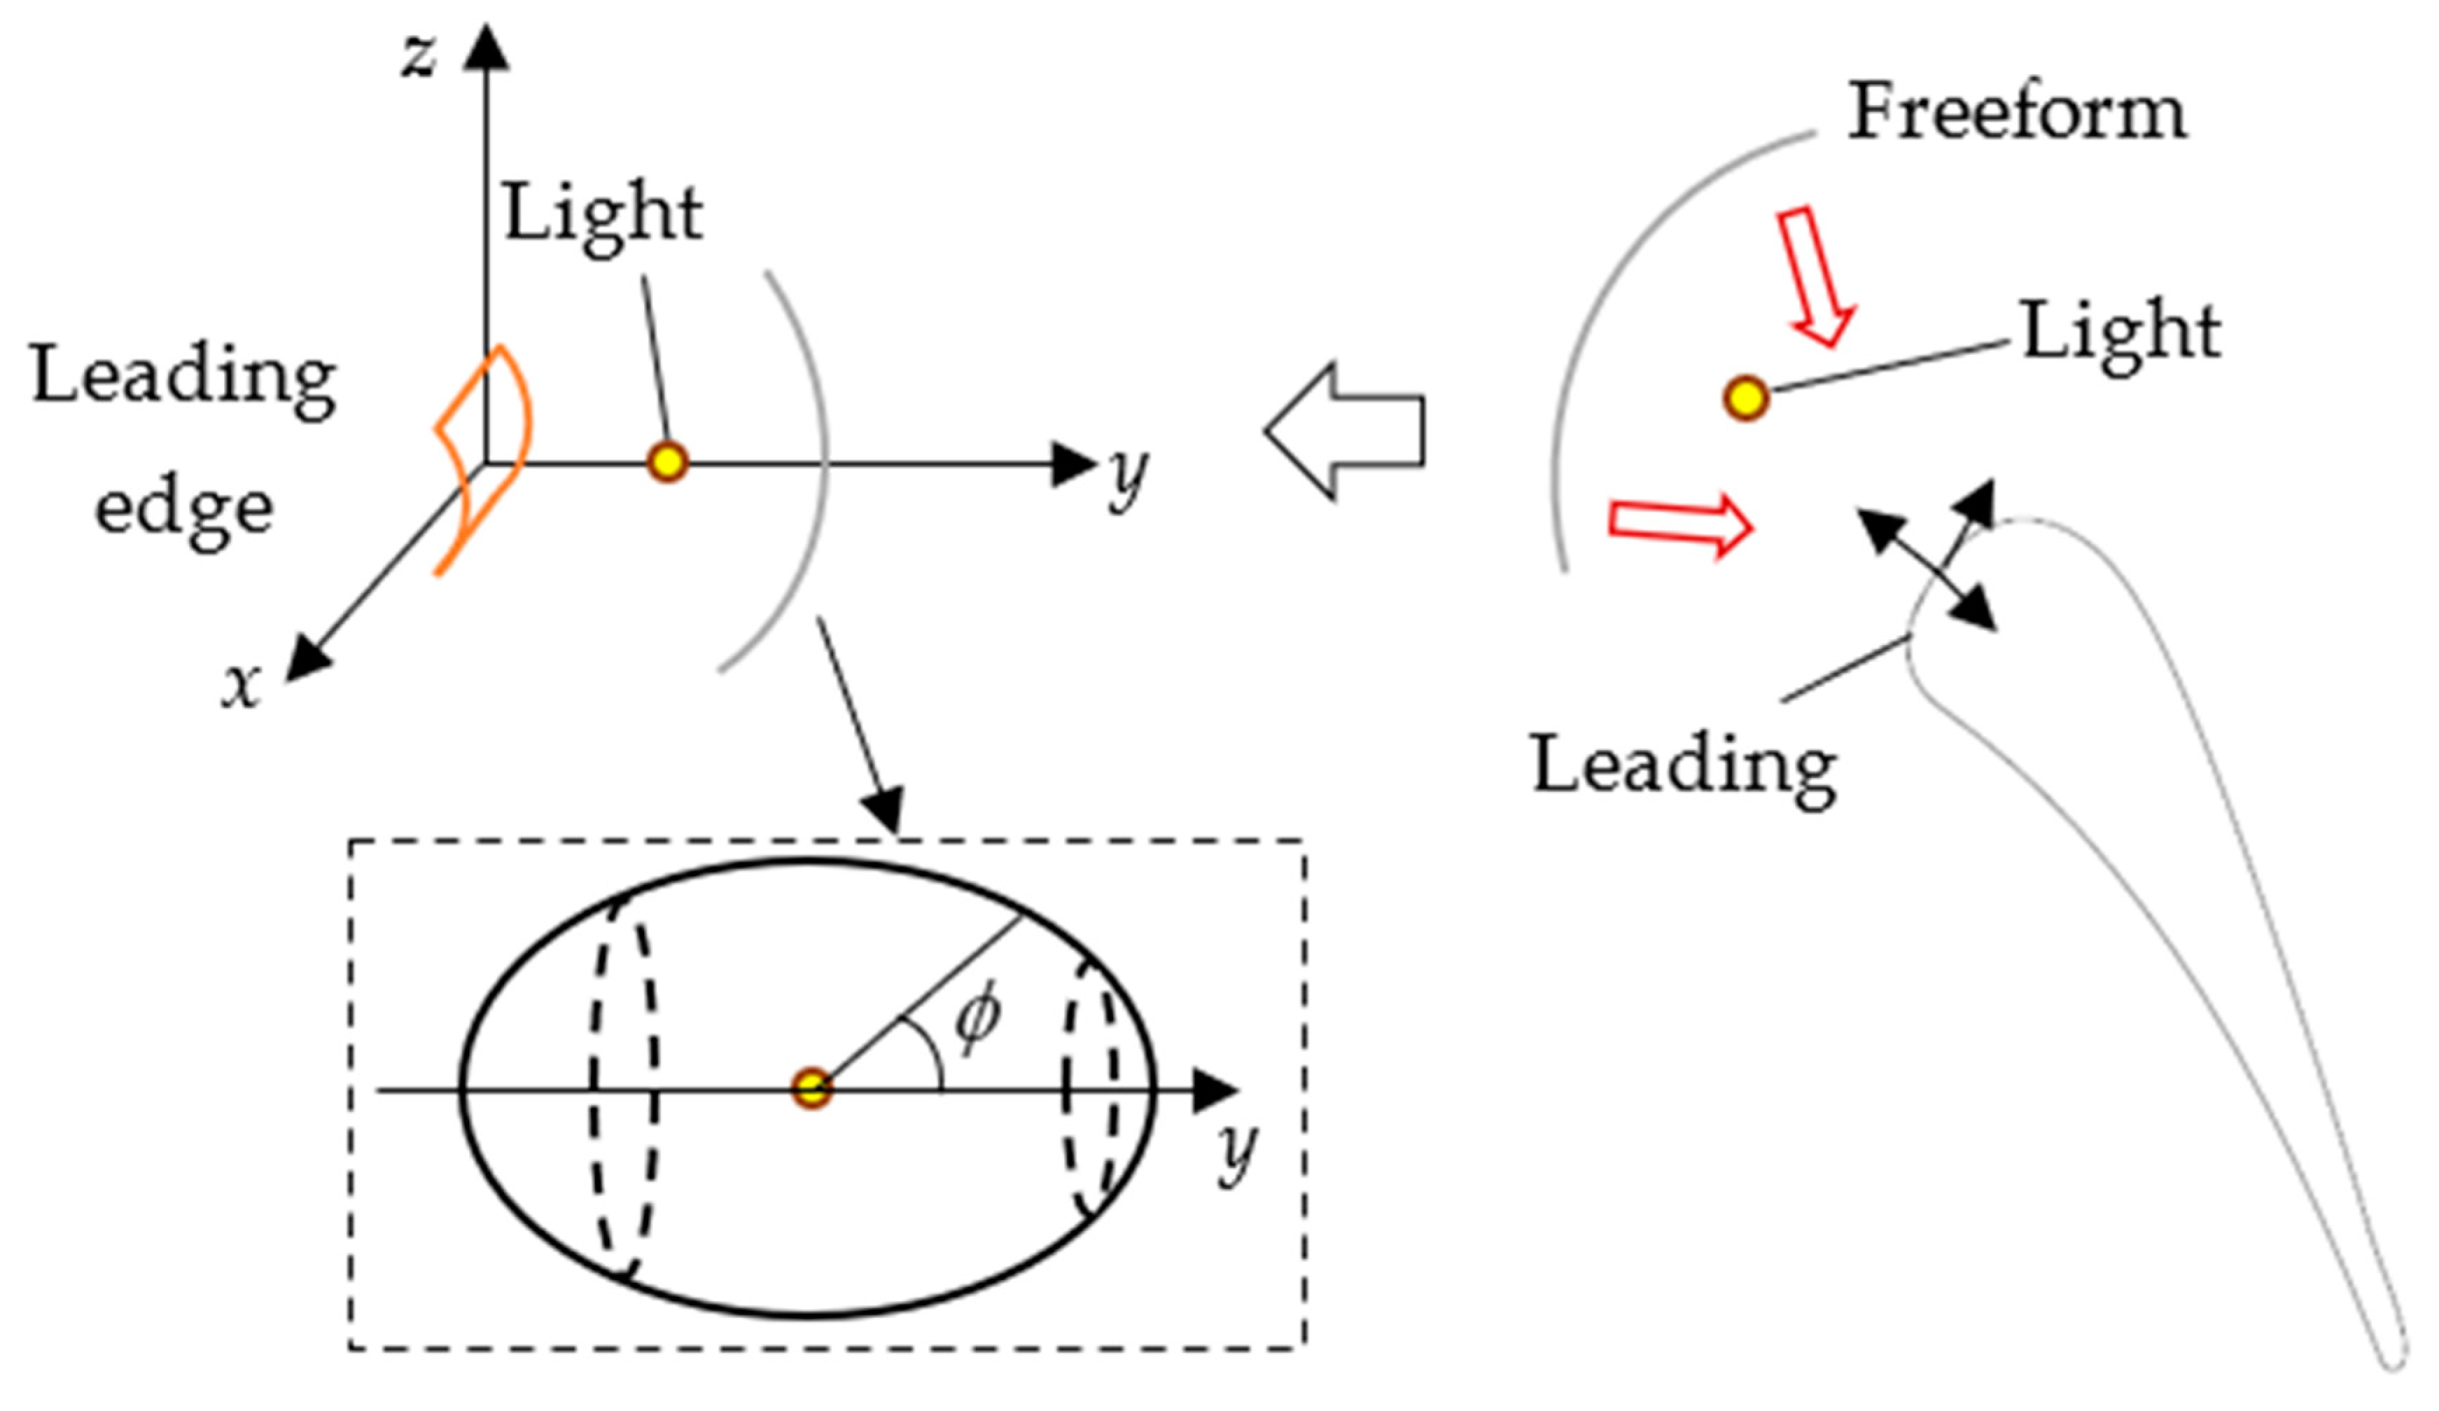
The leading-edge surface of a C3X turbine vane was selected as the heating target in the process of optical simulation. The sketch of the radiation heating system is shown in
Figure 1, including a turbine vane surface, light source, and freeform reflector. The leading edge of the turbine vane presents a 3-D rectangular curved surface that faces complex heat flux distribution formed by combustor exit total temperature distortion (i.e., hot streak), residual swirl, turbulence intensity, radiation, rotational effects, blade row interactions, etc. [
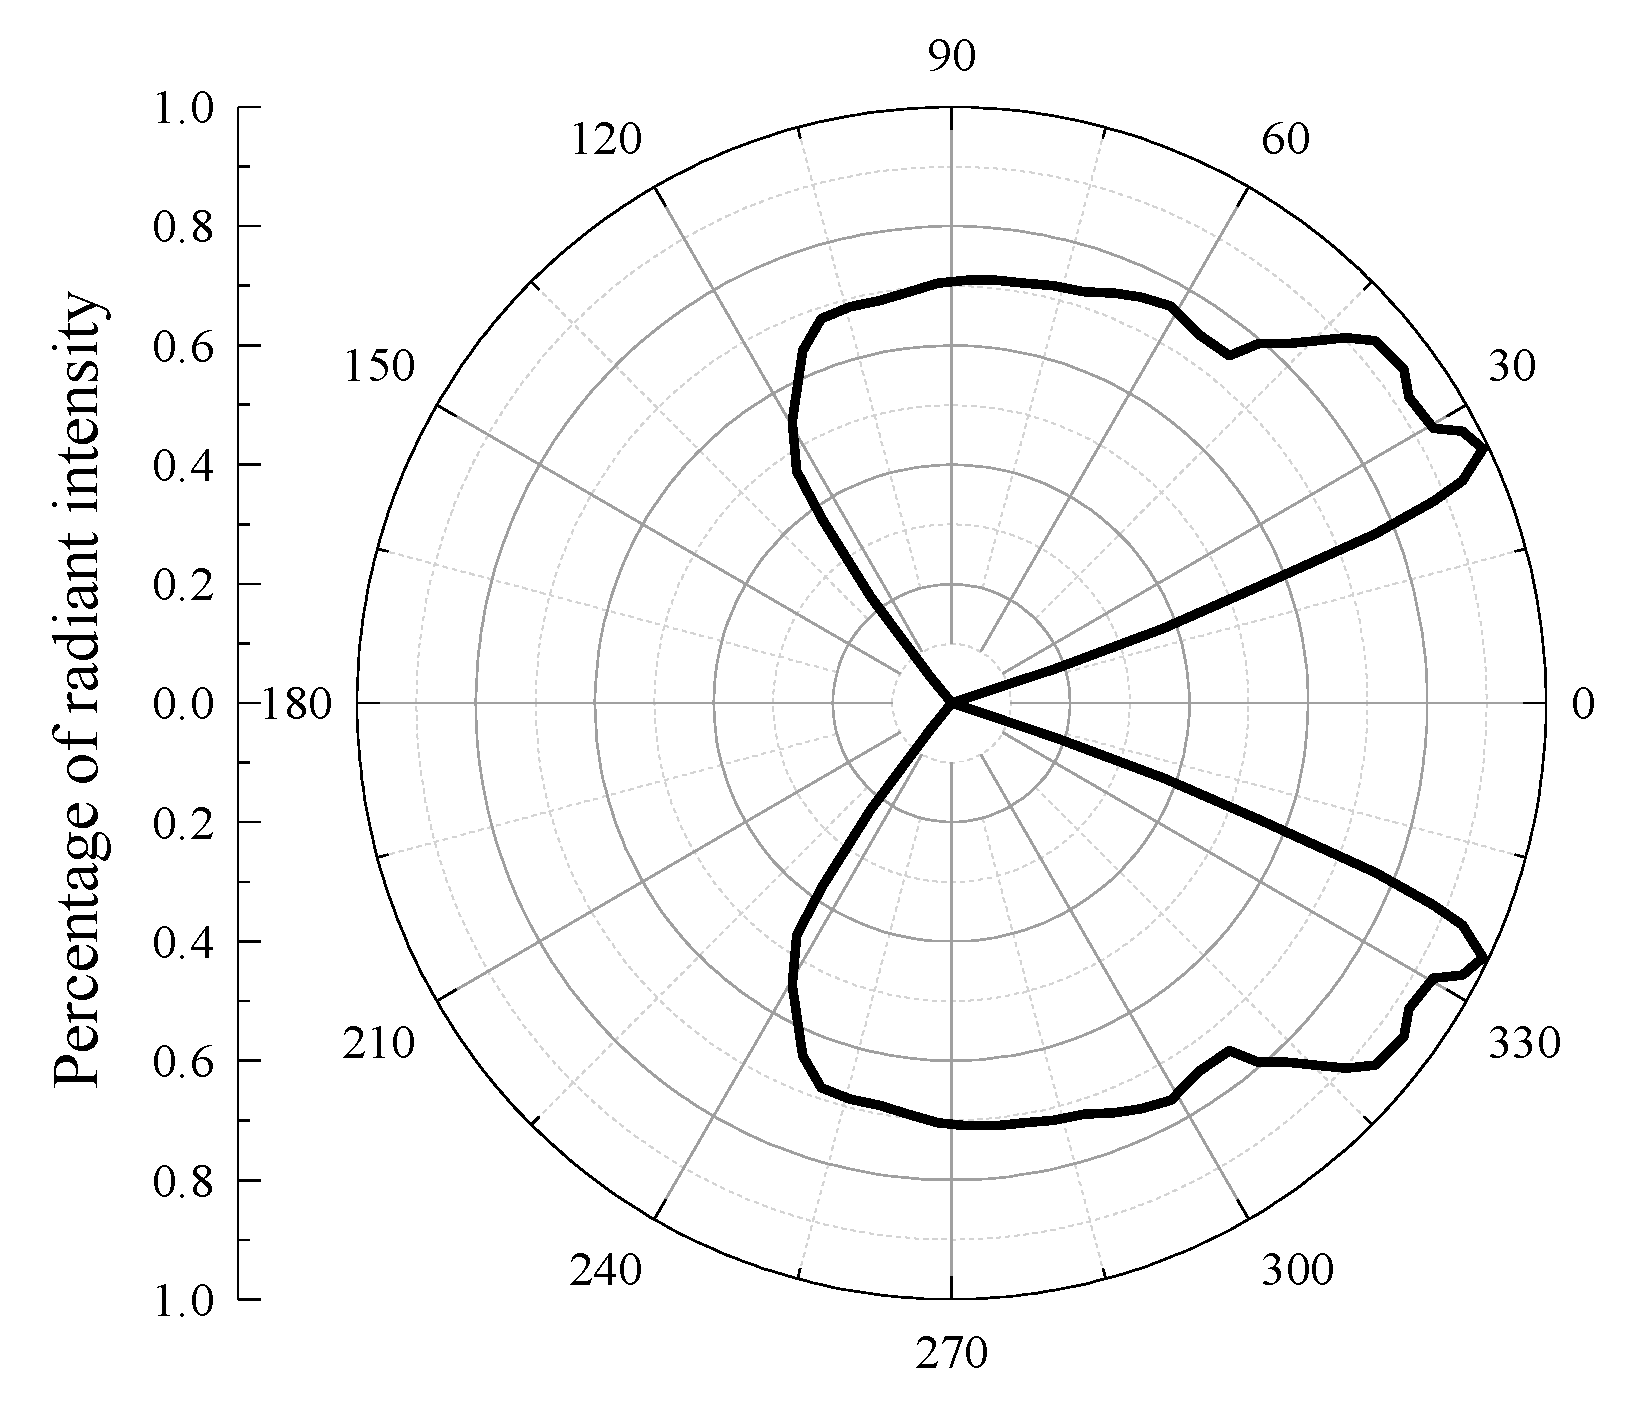
30]. In this article, certain particular heat flux distributions are intended as the optimization target. A short arc xenon lamp arranged on the central region of a reflector, according to its unique light principle, can be normally treated as a point light source [
31] that enables flexible control of optical transmission. The model of xenon lamp is the Osram XBO 4000 W HS OFR. The corresponding polar angular radiative flux distribution is shown in
Figure 2 [
31]. The generated light of the xenon lamp presents an approximately solar spectrum. The emitting rays with directional intensity characteristics are collected by the freeform reflectors and hit the leading-edge surfaces. This forms a specific distribution that depends on the surface shape of the reflector.
In 3-D Cartesian coordinates, the structure parameters in
Figure 1 are as follows: a square section of the leading-edge area is located around the origin and is arranged asymmetrically on the y-axis, and the intersection point is 0 mm, 1.4 mm, 0 mm. The projection size of the receiver is 100 × 100 mm (length along x-axis and z-axis). Here, the point light source is arranged on the y-axis with the coordinates 0 mm, 1000 mm, 0 mm. The freeform reflector is generated through an emitting vector matrix from the point light source to an assumed ellipsoid surface with half axes of 650 mm, 400 mm, and 650 mm. The tilt angle
on the meridian plane for beginning/ending boundary ranges is between 16 and 132 degrees. It should be noted that the leading edge of the turbine vane should be narrow and long instead of square shaped. The projection size of the receiver/leading edge area of the C3X turbine vane is 76.2 × 13.97 mm (length along x-axis and z-axis). Combining around three lamp heating systems allows the easy matching of the real shape through the current optimization and optical design method. This article only focuses on the modeling method and discusses the square target shape as an example, which can be extended for other complex and 3-D shape targets. The surface generation method is as follows.
3. Freeform Surface Generation and Mathematical Model
Freeform surfaces can be regarded as many small facets patched together under specific continuity conditions, thereby achieving a high degree of controllable freedom. Expressions such as B-spline surfaces are typically adopted for each facet. This method is widely used in illumination engineering, imaging/non-imaging optics, solar energy utilization, etc. The design process of freeform surfaces is based on a multi-step optimization method. Therefore, a specific energy transmission or distribution can be satisfied by optical refraction/reflection through freeform components.
With the aid of freeform optics and the feedback optimization method, the current study develops a concentrating-type radiation heating system fit for the leading-edge surface of C3X turbine vanes. A xenon lamp combined with a freeform reflector was optimized for controllable heat flux. A design method in the area of illumination engineering was innovatively extended for the current model. The source-target mapping between optical emitter and receiving surface was built first. The initial discrete points of the freeform reflector can be generated through GCM. The FFS was constructed by connecting these points by Delaunay triangulation. Considering the effect of polar angular radiative flux distribution of a Xenon lamp, Monte Carlo ray tracing (MCRT) method would be adopted to evaluate the optical performance. Feedback modifications based on Bayesian theory were adopted to obtain the optimal shape of the FFS for target heat flux.
3.1. Source-Target Mapping
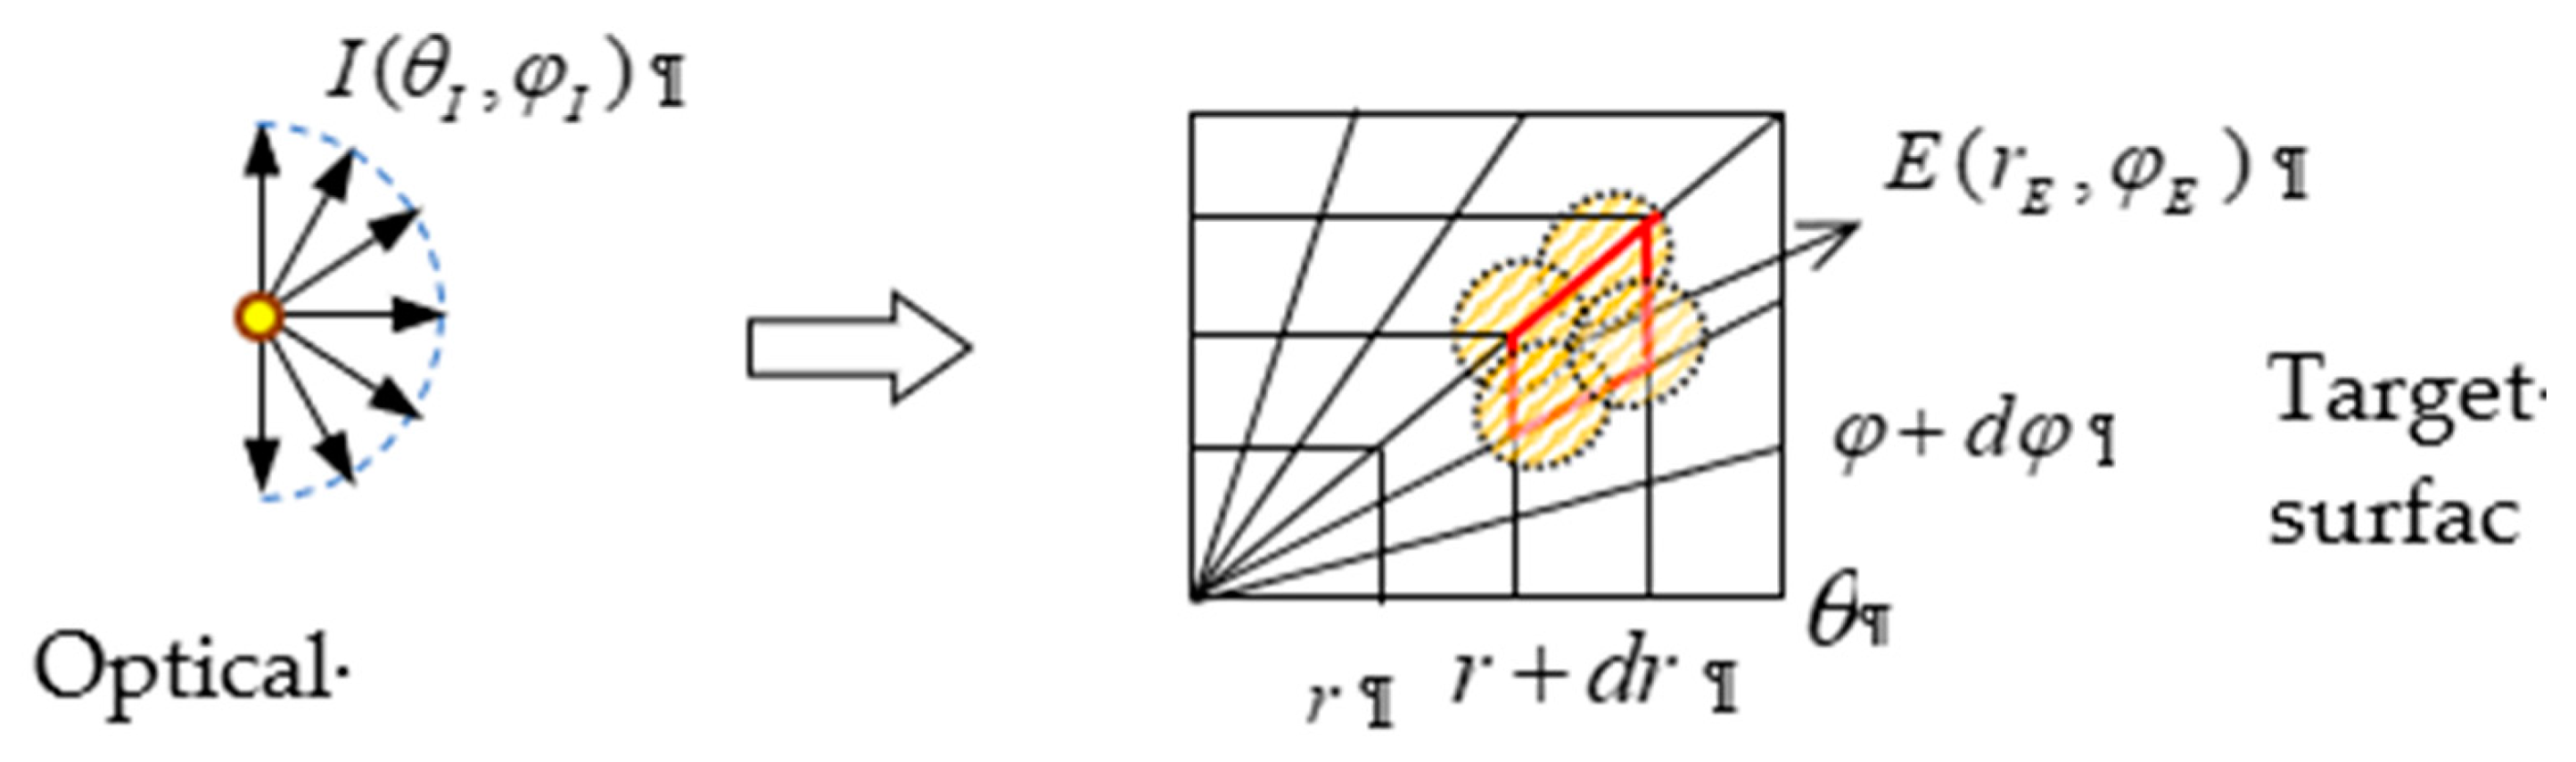
Optical transmission in the current study is assumed to be lossless and based on geometry optics. According to the energy conservation principle, optical transmission between the xenon lamp and the leading-edge surface of the turbine vane can be expressed by the source-target mapping formula:
where
and
represent zenith angles and circular angles, respectively, as shown in
Figure 3.
stands for the evenly divided radius.
represents the heat flux intensity of the corresponding discrete points with polar coordinates
on the target surface.
I represents the radiation intensity on the target surface.
It should be noted that there is a determined relation between all the discrete points from the optical source and the target surface. However, the numerical solution of Equation (1) faces a large challenge. Due to the existence of surface error and the xenon lamp working as an extended light source in practical situations, the assumptions can be simplified. Point-to-point mapping can be converted to point-surface mapping, as shown in
Figure 3. Several focal spots meet together on one target cell, so the target heat flux
can be achieved by changing only one parameter of
. The following equation is satisfied:
Here, g is a continuous function determining the relation between the position of source and the radius of the target surface .
With the aid of the above equations, radial mapping as in
Figure 3 was adopted in the current study. The target points on the leading-edge surface are generated as in
Figure 4; when the whole area can be evenly covered, it guarantees accurate initial heat flux distributions for the later optimizations. The separated grid number here is 64 × 64 in polar coordinates.
3.2. Creating the Initial 3-D Freeform Geometry
The GCM is a widely used and effective method for constructing straight lines and forming freeform surfaces based on the characteristics of optical transmission. The GCM can be improved by connecting several circular arc segments [
29], which has been proven to be accurate in 2-D modeling. However, this is not suitable for 3-D modeling because of deviation in multi-orientation.
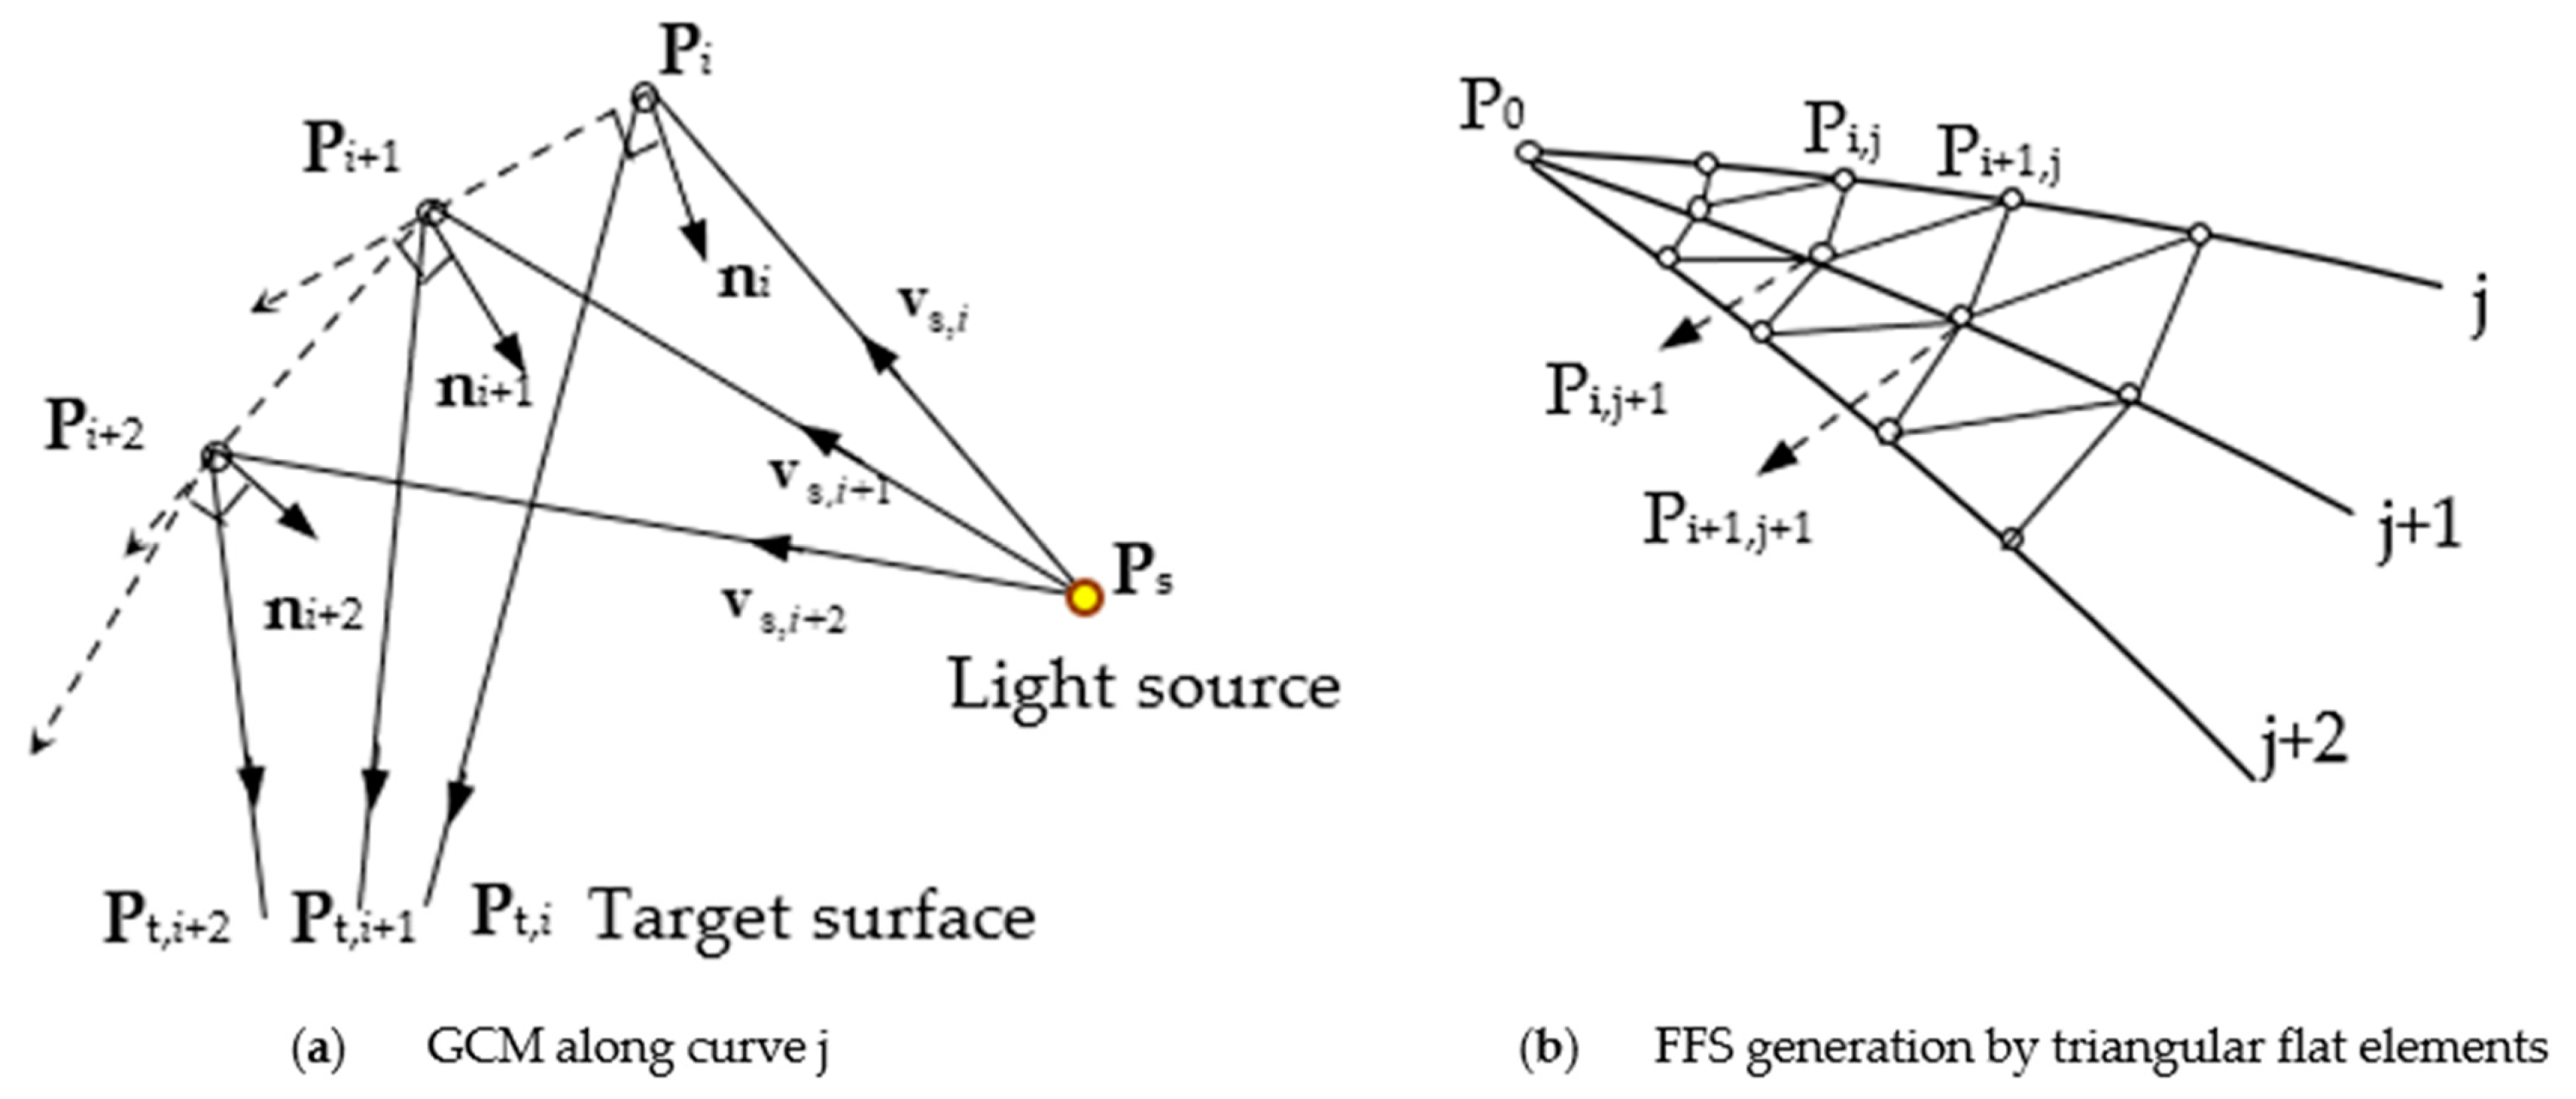
With the aid of the ray mapping method above, the corresponding source vectors and target discrete points can be obtained, while an initial FF profile can be generated through GCM along specific directions, based on which FF surfaces can be constructed through jointing small facets, such as triangular elements formed by these points.
In the field of optical engineering, traditional methods such as the geometry construction method (GCM) have been widely used for the optical design of LEDs [
32], headlight lighting, street lighting [
33], etc. As can be seen in
Figure 5a, suppose that subscripts
i, i + 1,
i + 2… stand for the order number.
Ps,
Pt,
P represent emission points, target points, and generated discrete points for FF surfaces, respectively. Based on the working principle of xenon lamps, the incident vectors
are all known quantities. When we generate the FF discrete points, the initial emission vector
and first intersection point
Pi are preset to locate the whole optical system; therefore, the normal vector
ni can be solved according to the law of mirror reflection and the known target point
Pt,i from source-target mapping. After that, the intersection between second incident vector
and normal vector n
i can be achieved as P
i+1. For the rest, all the other discrete points of the FF surface can be achieved. The number of discrete points depends on the division density of emitting vectors from initial emission points P
s.
After the generation of discrete points, Delaunay triangulation [
34,
35] was adopted to form the whole freeform surface. Since the generated points present a radial structure which is smooth and regular, the current study built the cell as shown in
Figure 5b. Different sequences along j, j + 1, j + 2 were individually generated by GCM, and all these points were joined via triangular elements such as triangle
and
, respectively. This can ensure that the FFS is ‘well-shaped’ using Delaunay triangulation.
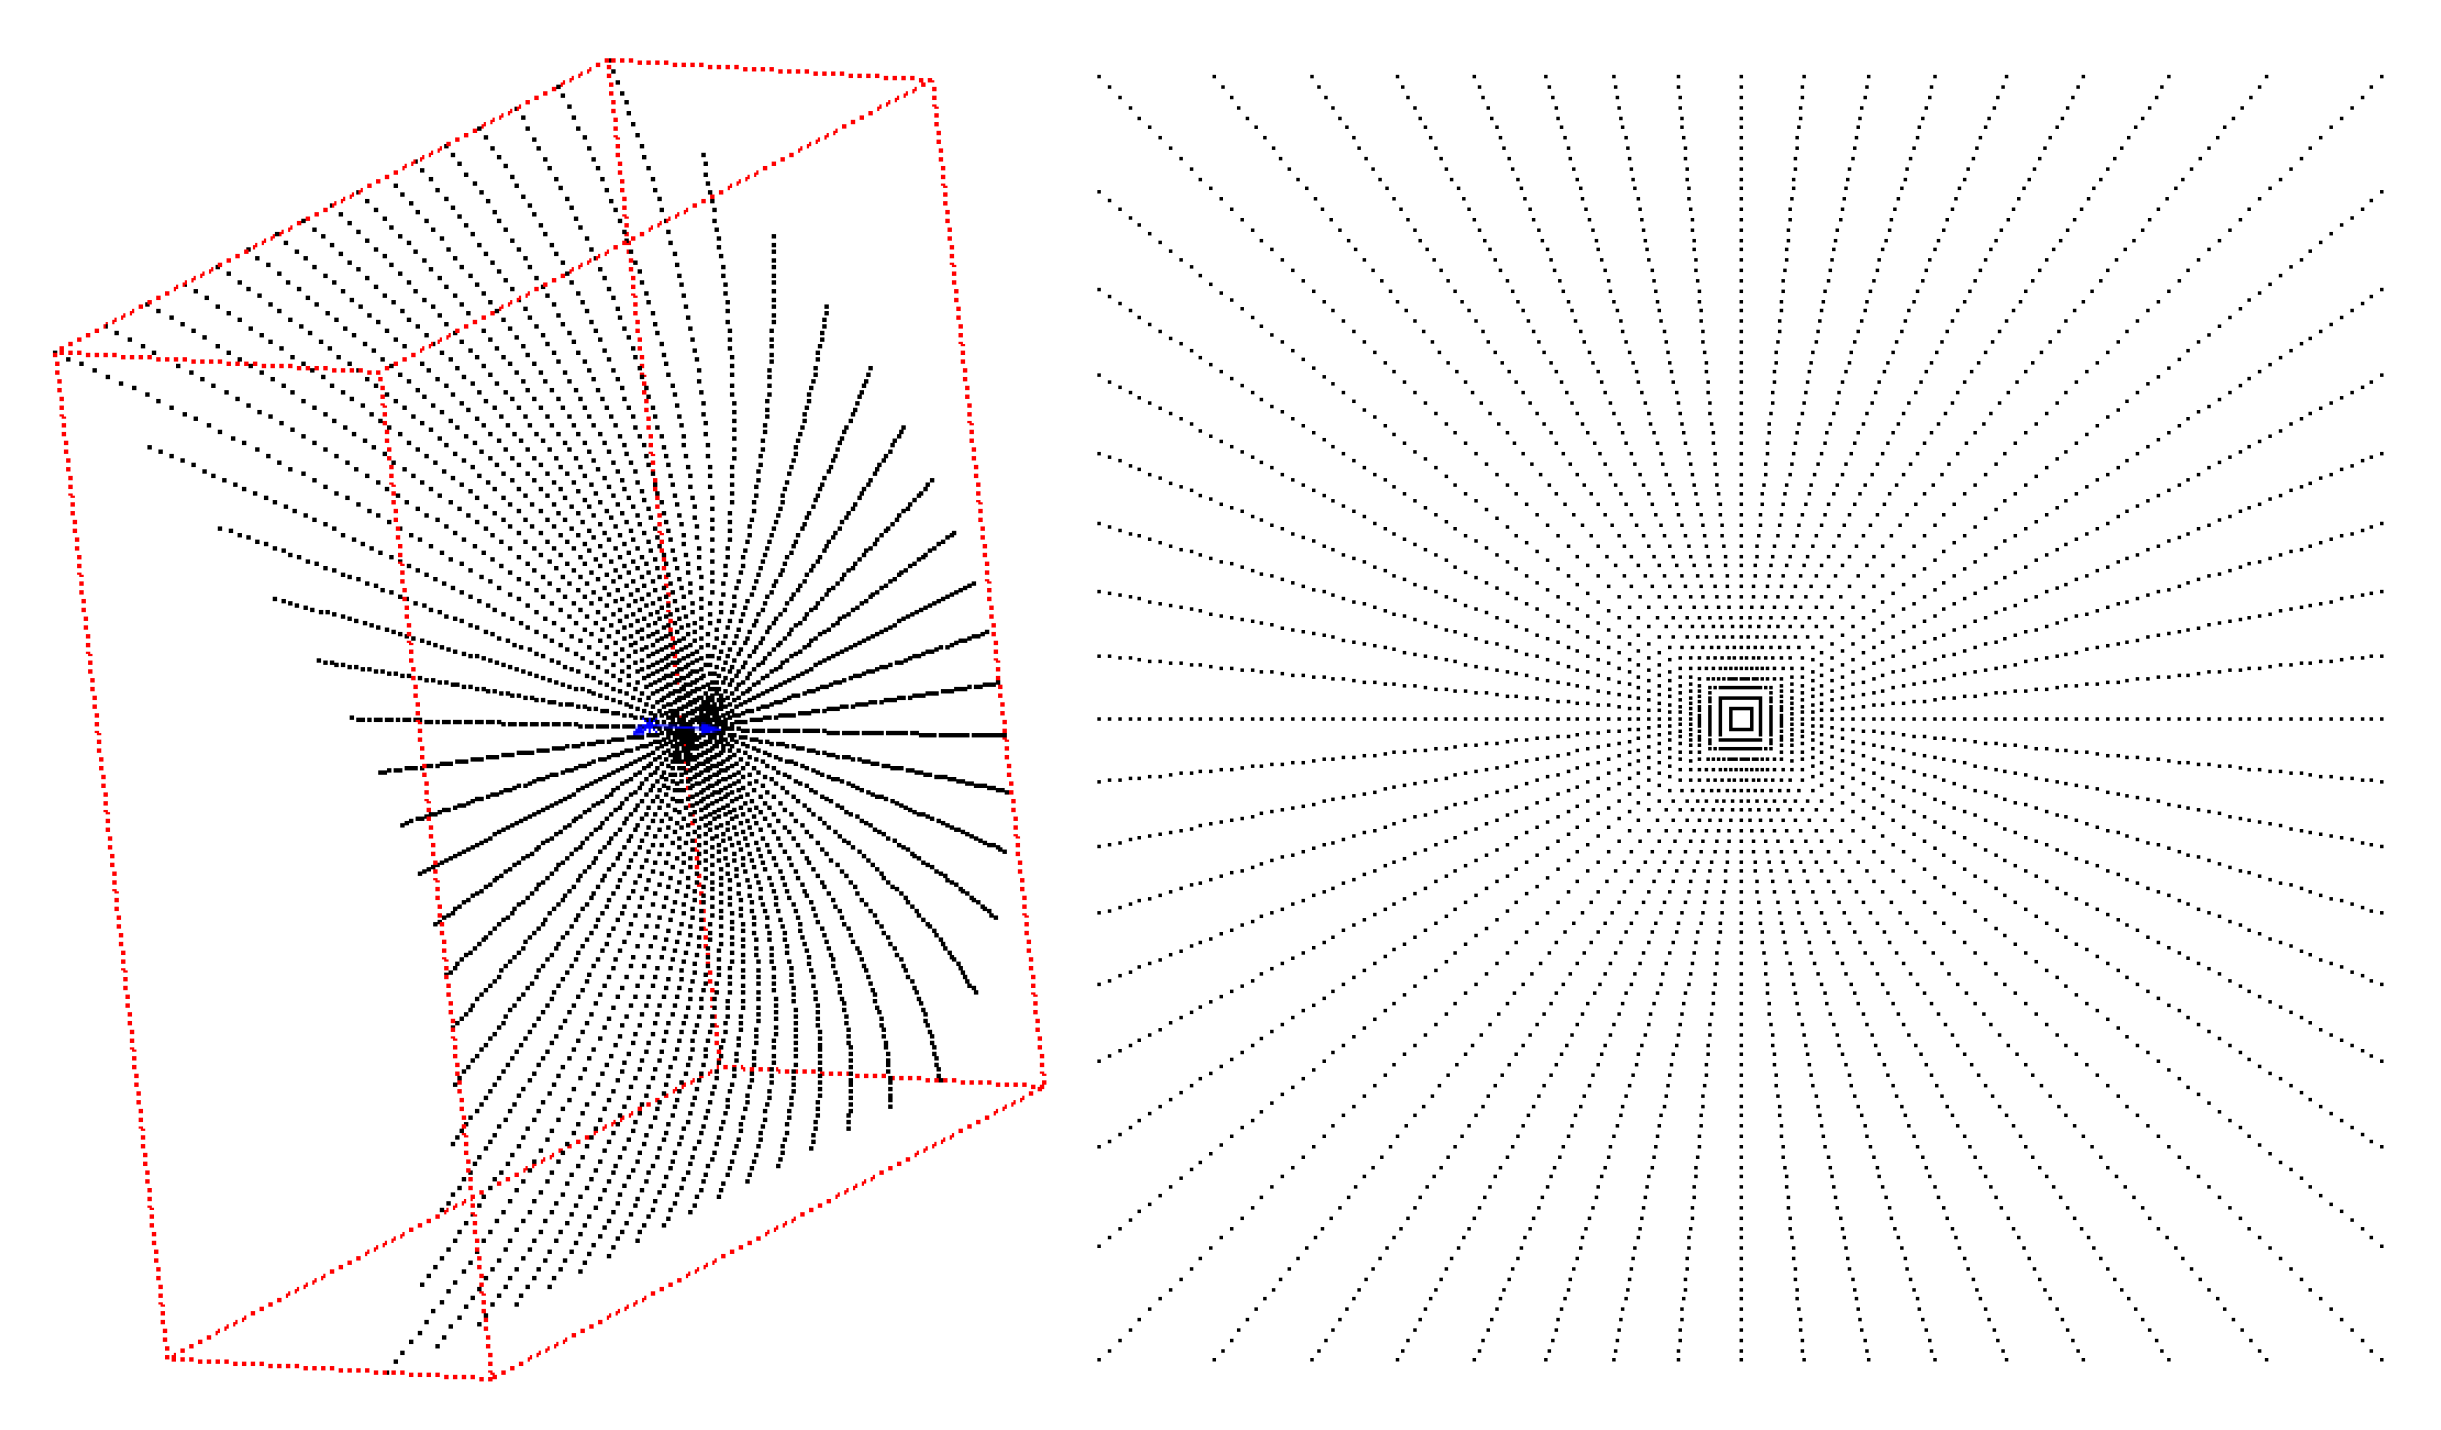
Figure 6 shows the generated discrete points of a freeform reflector using the structure parameters above. Points on the FFS were generated along the meridian plane separately in circular
space and the division grids were 32 × 64. After this, the ray tracing method was adopted by seeking out the intersections between emitting rays and these triangular surfaces.
3.3. Ray Tracing Method
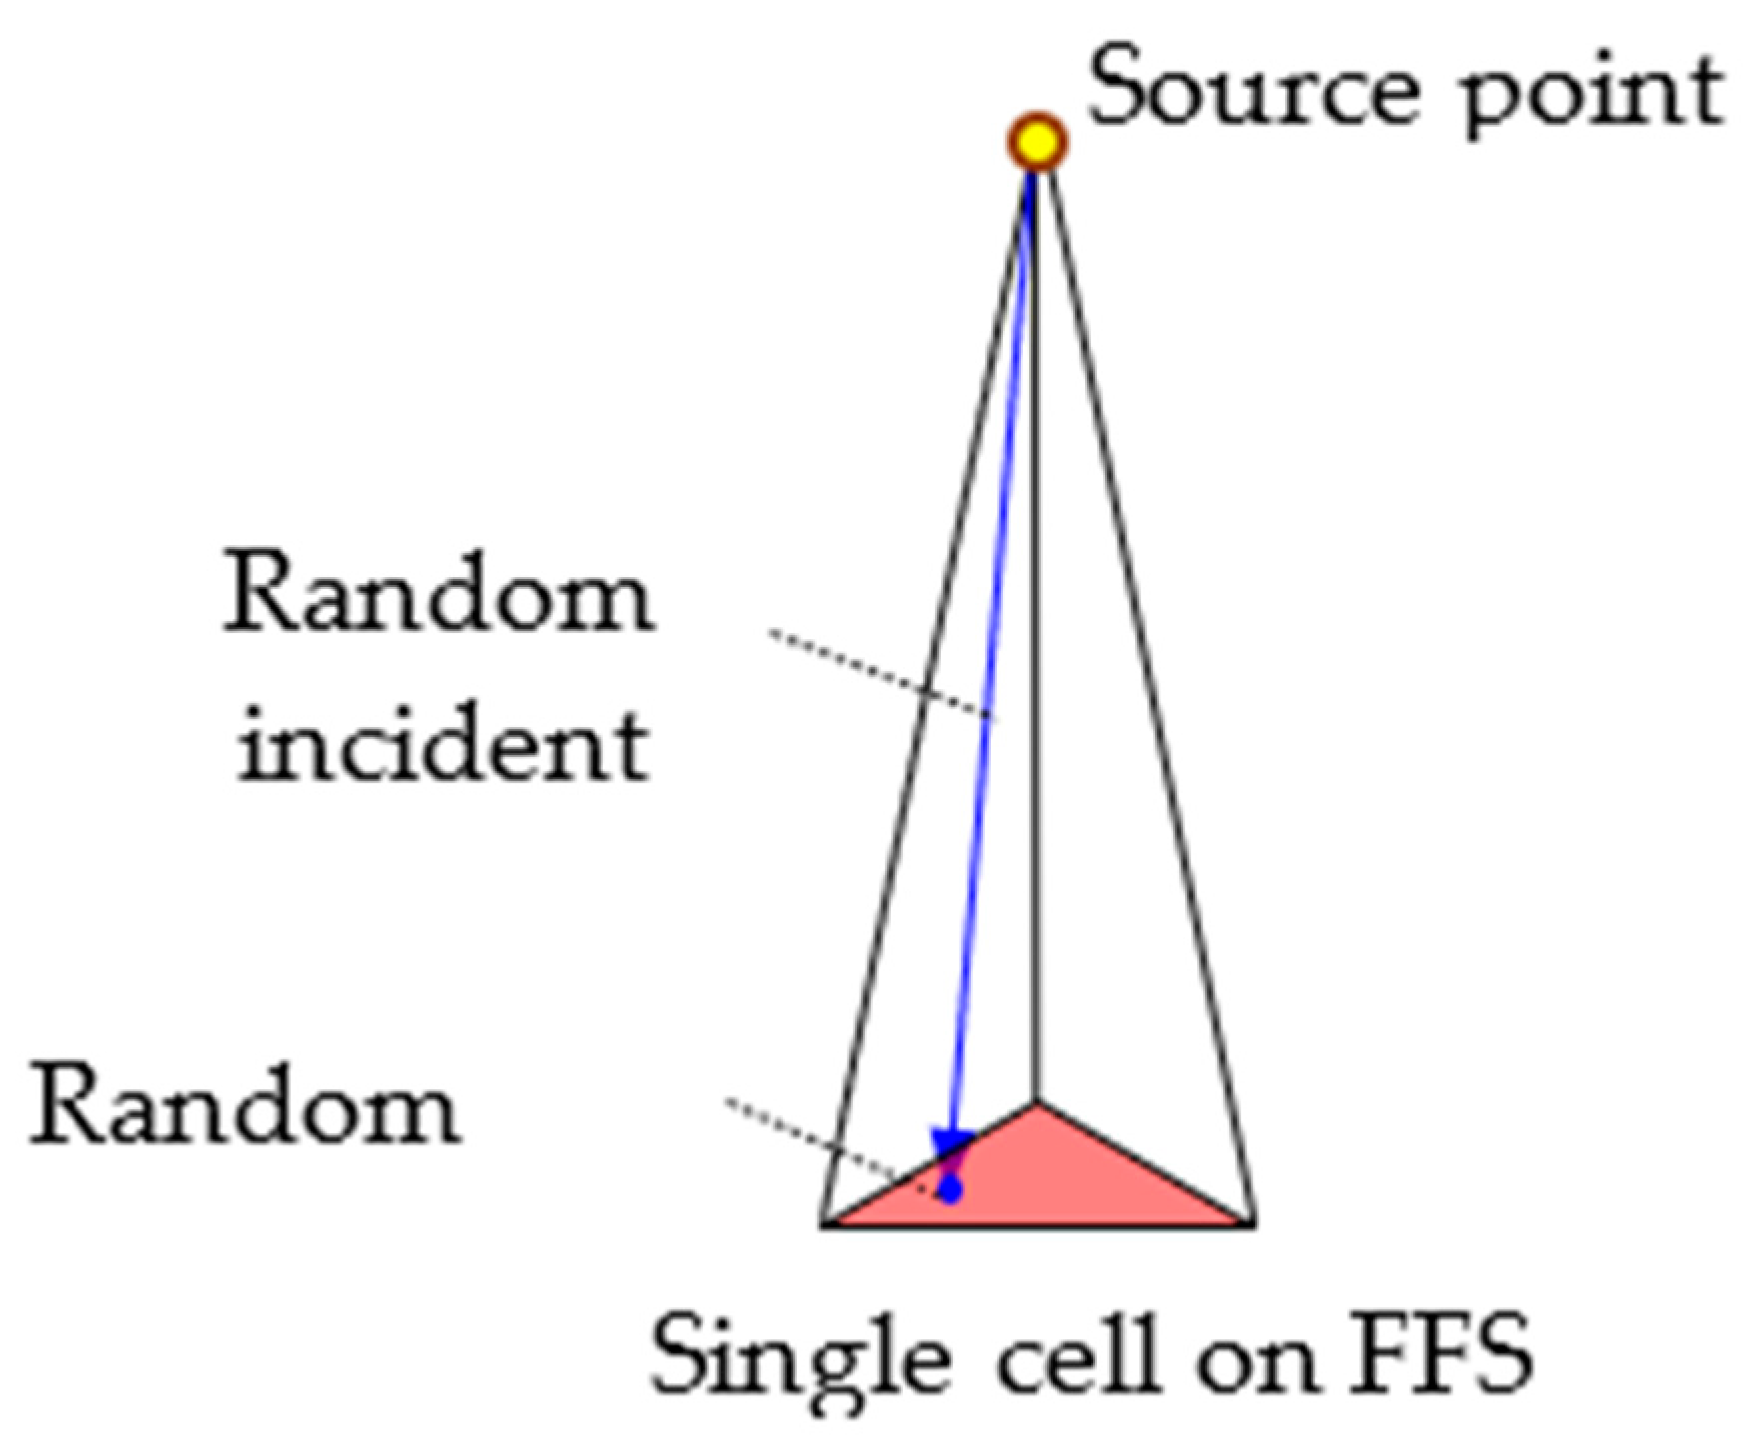
In this paper, the Monte Carlo ray tracing (MCRT) method was employed to investigate the energy transfer characteristics of freeform surface systems. Without using the partition allocation method, traditional ray tracing causes the calculation cost of FF surface optimizations to be extremely high. The number of generating cells is too large, making the judging of ray intersections rather difficult. In the current study, the whole radiation region was divided into small regions to reduce the calculation cost, as
Figure 7 shows. For every triangular cell on the FFS, random incident vectors were generated by randomly selecting points inside the triangle. A large number of rays were sampled within these cells.
The following procedure was adopted to simulate radiation transmission based on MCRT:
- 1.
Number all the cells on the FFS in sequence
S based on three adjacent points as shown, in
Figure 5b, and put this in the storage. Select one triangular surface
Sk and sample a random incident vector by choosing a random point inside the small surface;
- 2.
Assume the source point is and the incident vector is . An arbitrary point in the system can be then expressed as , which is substituted into the surface equation of Sk.
- 3.
It must be noted that the incident vector corresponds to the full covering range of vectors for single cell Sk. Therefore, the value can be quickly solved.
- 4.
Name the normal vector of FFS as . Reject the value when in the wrong direction. Keep the single solution of so the intersection point with Sk can be determined.
- 5.
Call the mirror reflection subroutine. Solve the reflected vector of the ray by the known vectors using and keep tracing the next intersection with the receiving surface or the outside envelope surface. Reflection error has been considered in the MCRT model. The three-dimensional errors of reflecting vectors for the FF surface are random within 3.5 mrad obtained in pseudo-random fashion.
- 6.
Randomly sample another incident vector for the small cell Sk and repeat the above procedure. Set a total ray number for cell Sk as 1000, for example. Trace the rays for the next cell in sequence S when the maximum number for Sk is reached. Therefore, the total ray tracing number is 1000 × 32 × 64. Although the discrete points should be changed by GCM after feedback modifications, the range of incident vectors for small cells Sk is not changed, according to the principle of GCM.
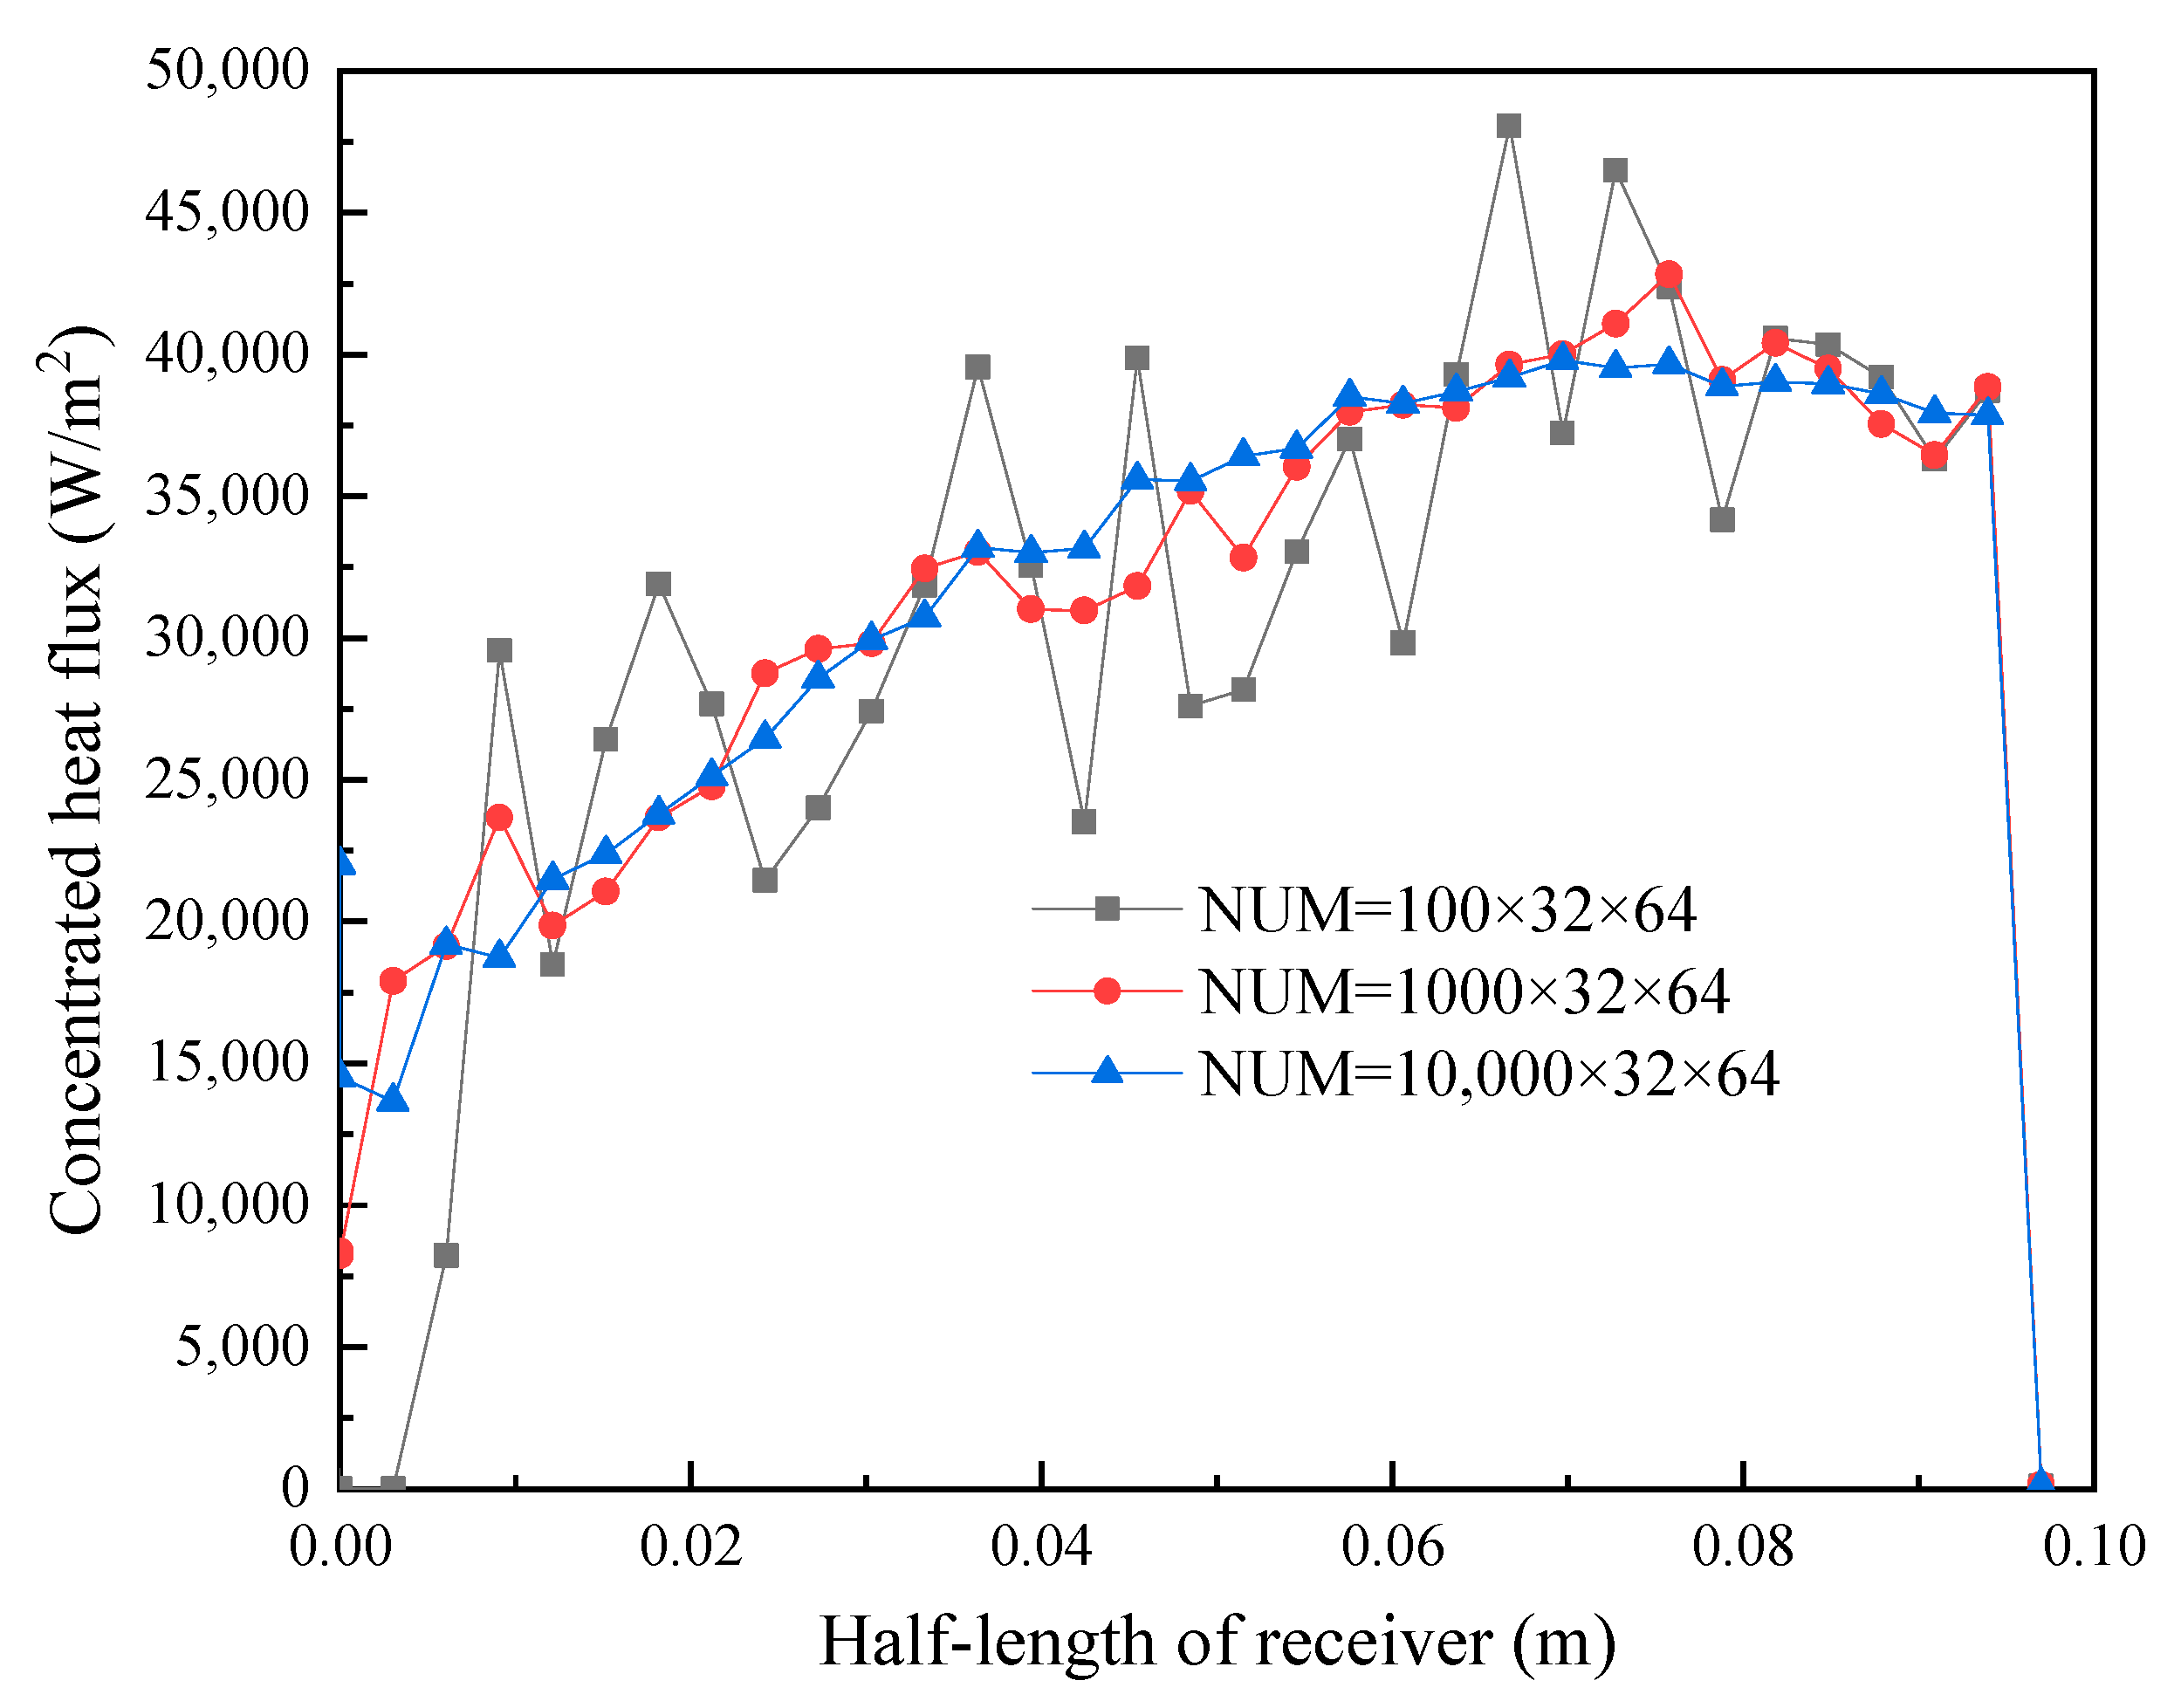
The number of tracing rays has a large influence on the simulation stability in the Monte Carlo method. The numerically probabilistic convergence of MCRT has been detailed before in [
36]. In the current study, the effect of different ray numbers is shown in
Figure 8 by simulating the concentrated heat flux along the radius (z = 0) of the receiver. We can see that with the increase of the total tracing number from 100 × 32 × 64 to 10,000 × 32 × 64, the heat flux distribution tends to be smoother. Simulation accuracy is obviously improved with a larger tracing number. Considering both the simulation cost and accuracy, the total tracing number was set to be 10,000 × 32 × 64 in the current study.
3.4. Feedback Modification Method
As mentioned previously, the surface design using GCM only ensures that there are accurate normal vectors along the generating direction of each curve. However, for a 3-D surface, the geometric deviations that appear in the space between the supporting curves may lead to the deviation of the target heat flux. Achieving acceptable simulated distribution requires multiple iterations. The current study proposed a feedback modification method based on Bayes’ theorem. According to the initial target heat flux
and simulated heat flux at
k-th iterations
, a feedback modification coefficient
can be obtained using the relation:
where
and
are the weight proportions related to the modification speed.
Based on the above coefficient, a new target heat flux at
k-th iterations can be obtained:
Equation (3) and (4) mean the new target heat flux on cell at k-th iterations should be taken according to the initial heat flux and all previous simulation results .
A merit function (
MF) is defined in order to evaluate the effectiveness of optimization, as follows:
where
m and
n are the dividing portions along meridian plane and circumference. The value of
MF presents the variance of heat flux on the target surface before and after optimization.
4. Optimized Results and Discussions
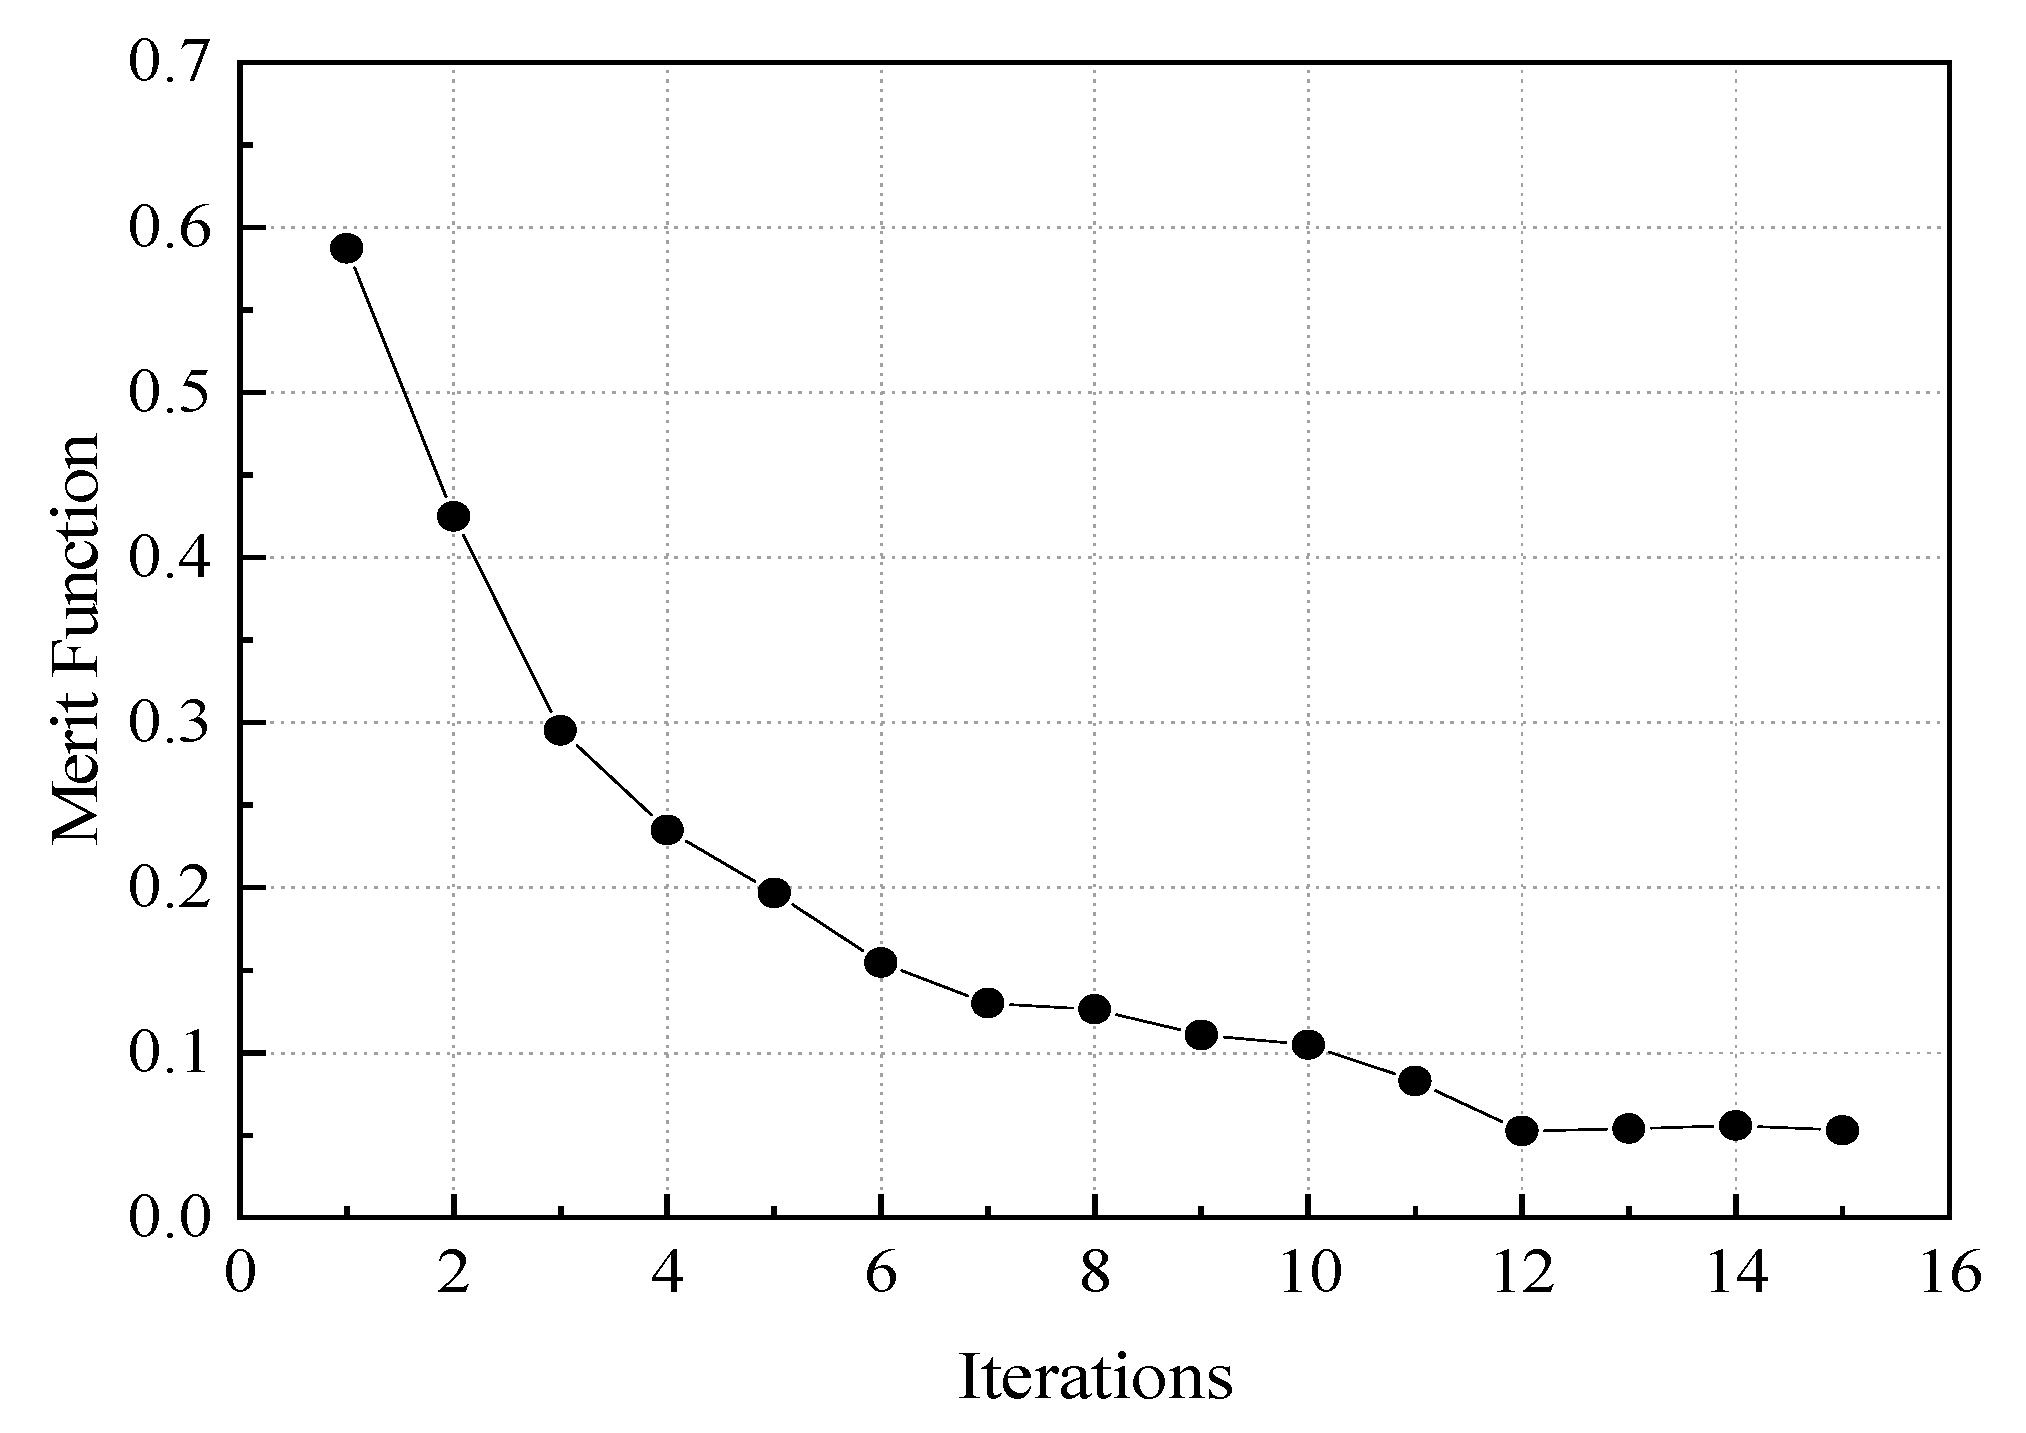
In the current study, the optimization target in the x-o-z projection is 0.14 × 0.14 m, and the display receiving size is 0.2 × 0.2 m. The number of sampled tracing rays using the Monte Carlo method was set to 10,000 × 32 × 64 considering both simulation accuracy and calculation cost. For the case of the Gaussian distribution target, the change of the
MF value with iterations is shown in
Figure 9. The simulating time for every step was around 6 min using a 3.2 GHz Intel (R) Core (
TM) i5-3470 CPU. The
MF value reaches the minimum of 0.034 after 12 iterations and 72 min. Without using the partition allocation method in
Section 3.3, the simulating time is in the dozens of hours.
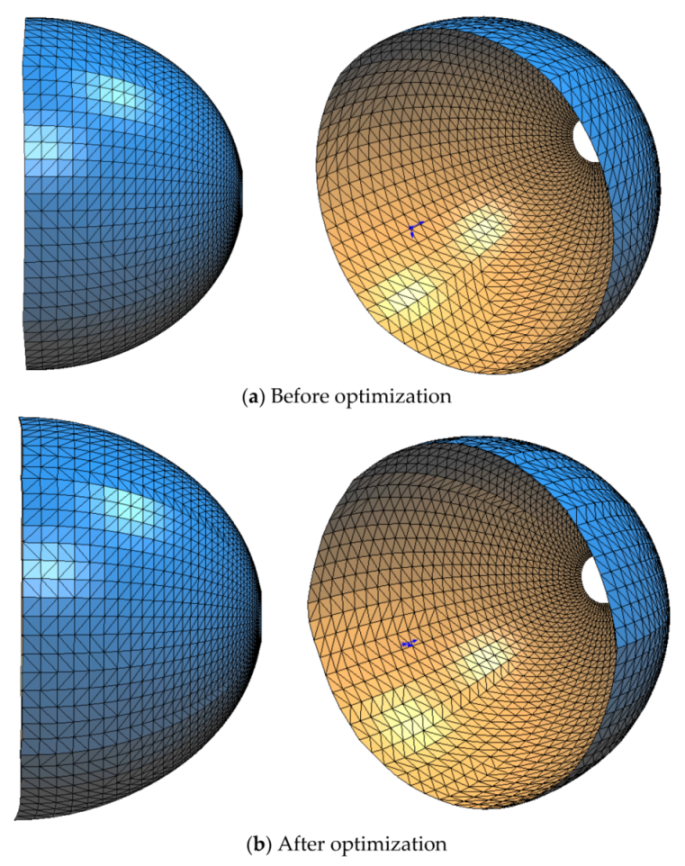
Figure 10 shows the surface drawings (before and after modification) generated by Computer-aided Design software. We can observe that the freeform surface is continuous and smooth. After optimization, the reflector frame tends to be square in circular sections; this is caused by the square mapping pattern.
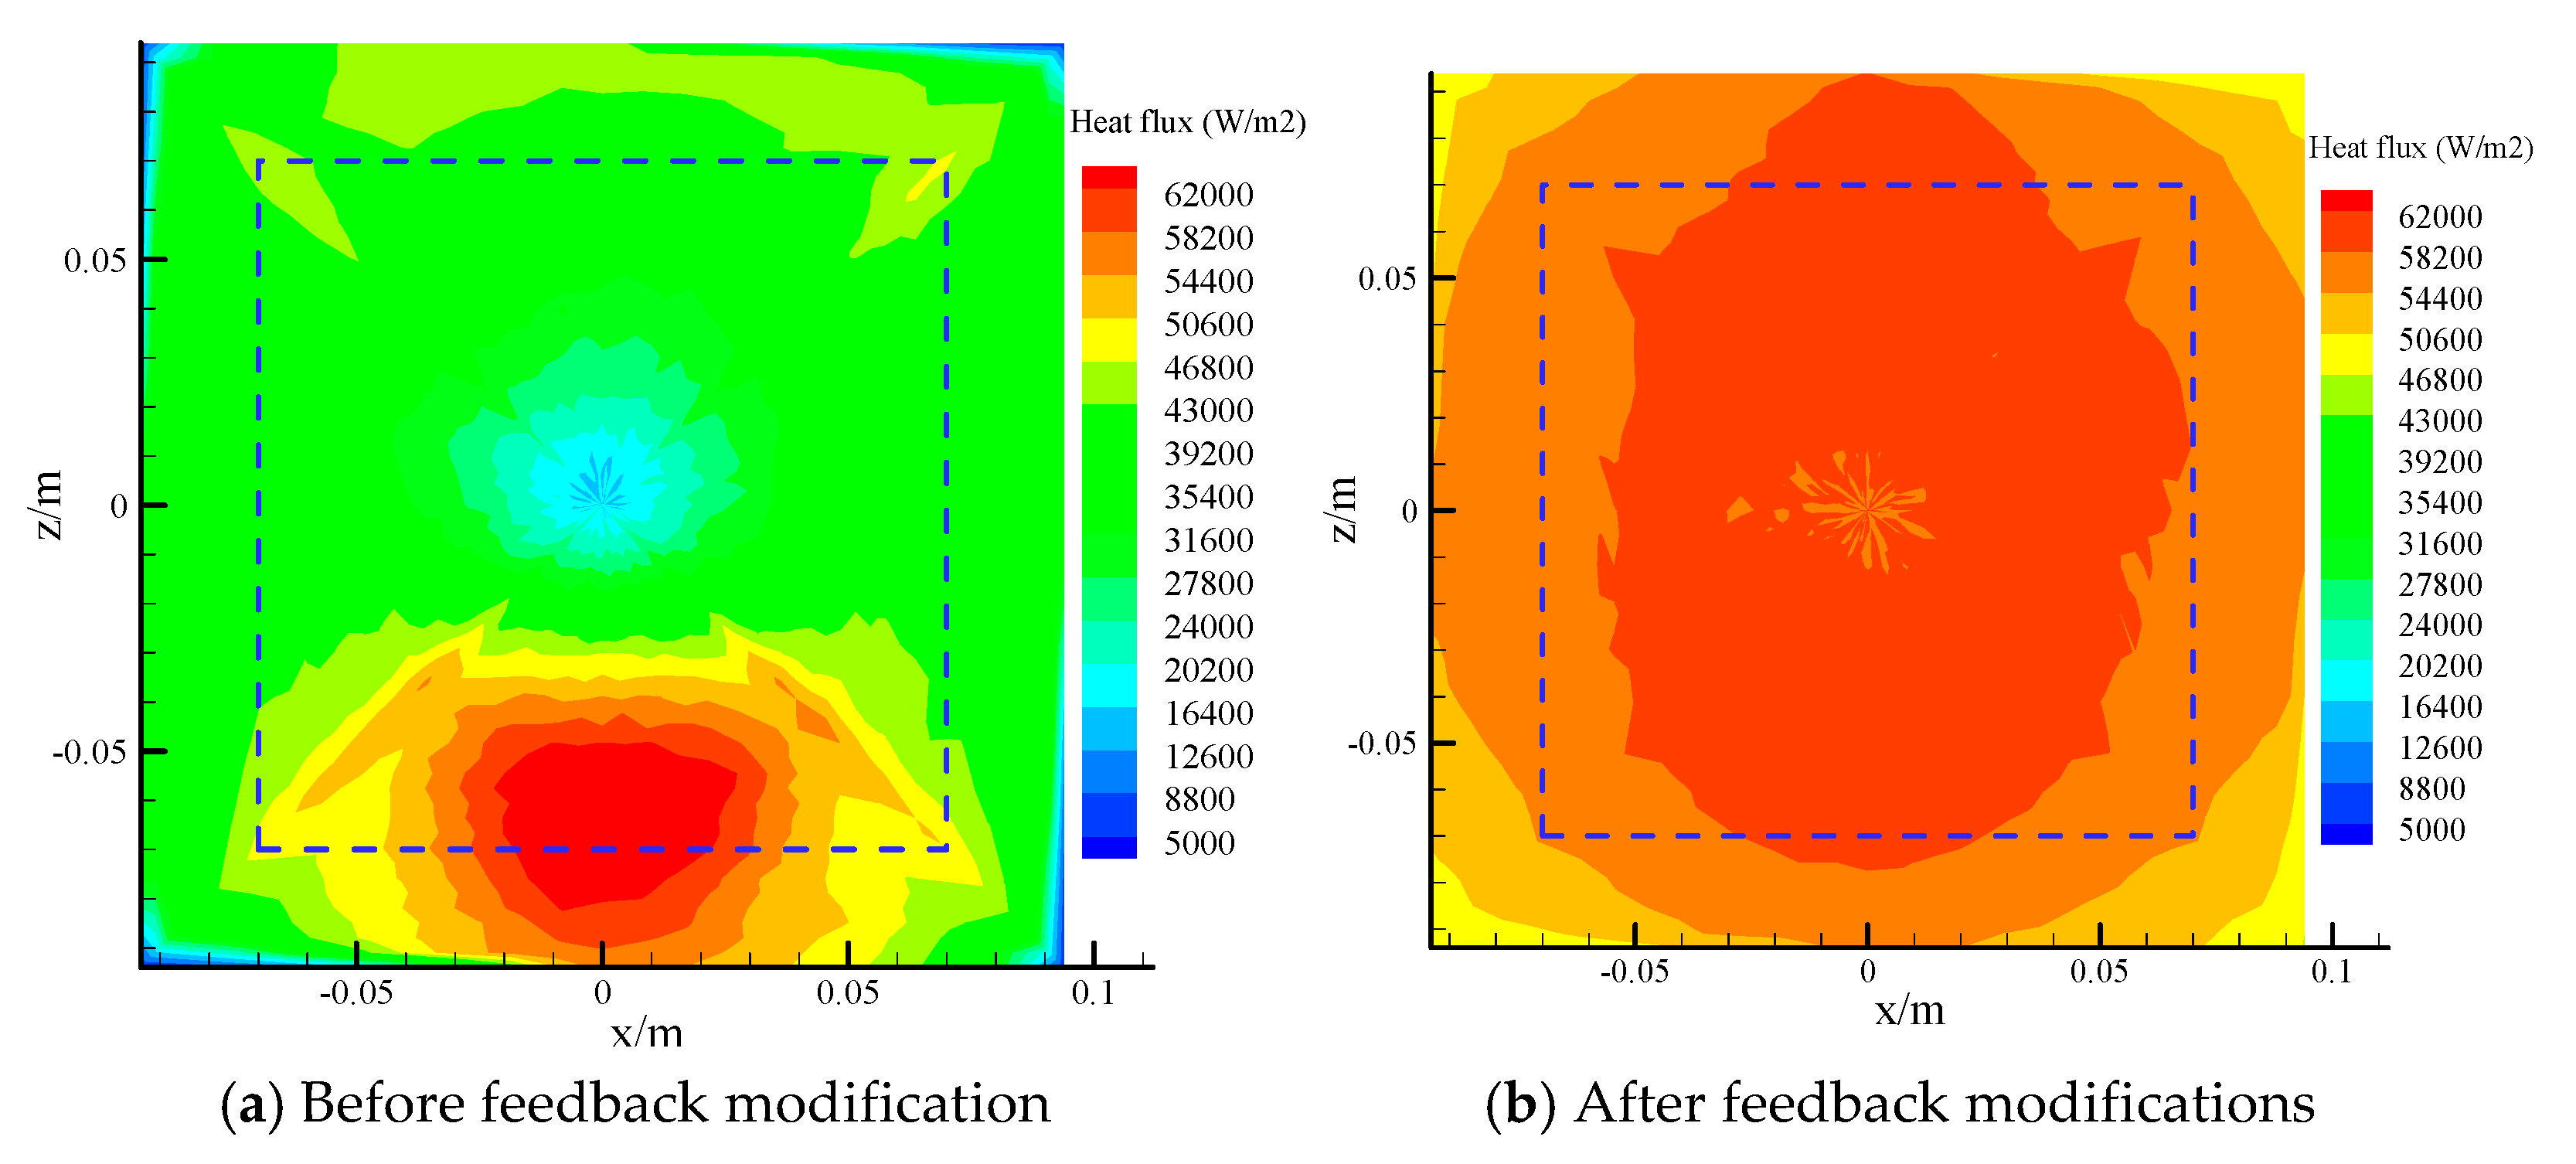
For 60 kW/m
2 uniform target distribution, the heat fluxes on the receiving surface before and after optimizations are compared in
Figure 11. The dotted square represents the target receiving size 0.07 × 0.07 m. The heat flux on the receiving surface is dramatically non-uniform by direct GCM modeling, as shown in
Figure 11a. A higher peak concentration and a large fluctuation appears on the receiving surface, due to the ray path length difference along the z axis and the construction error caused by initial GCM. From
Figure 11b, the uniformity of the receiving heat flux is much improved. The central radiation heat flux is close to the target one (60 kW/m
2). In addition, the heat flux around the edge drops steeply because fewer focal spots of reflecting cells cover this region. In practical applications, the outer edge part that is not be included in the source-target mapping would be truncated.
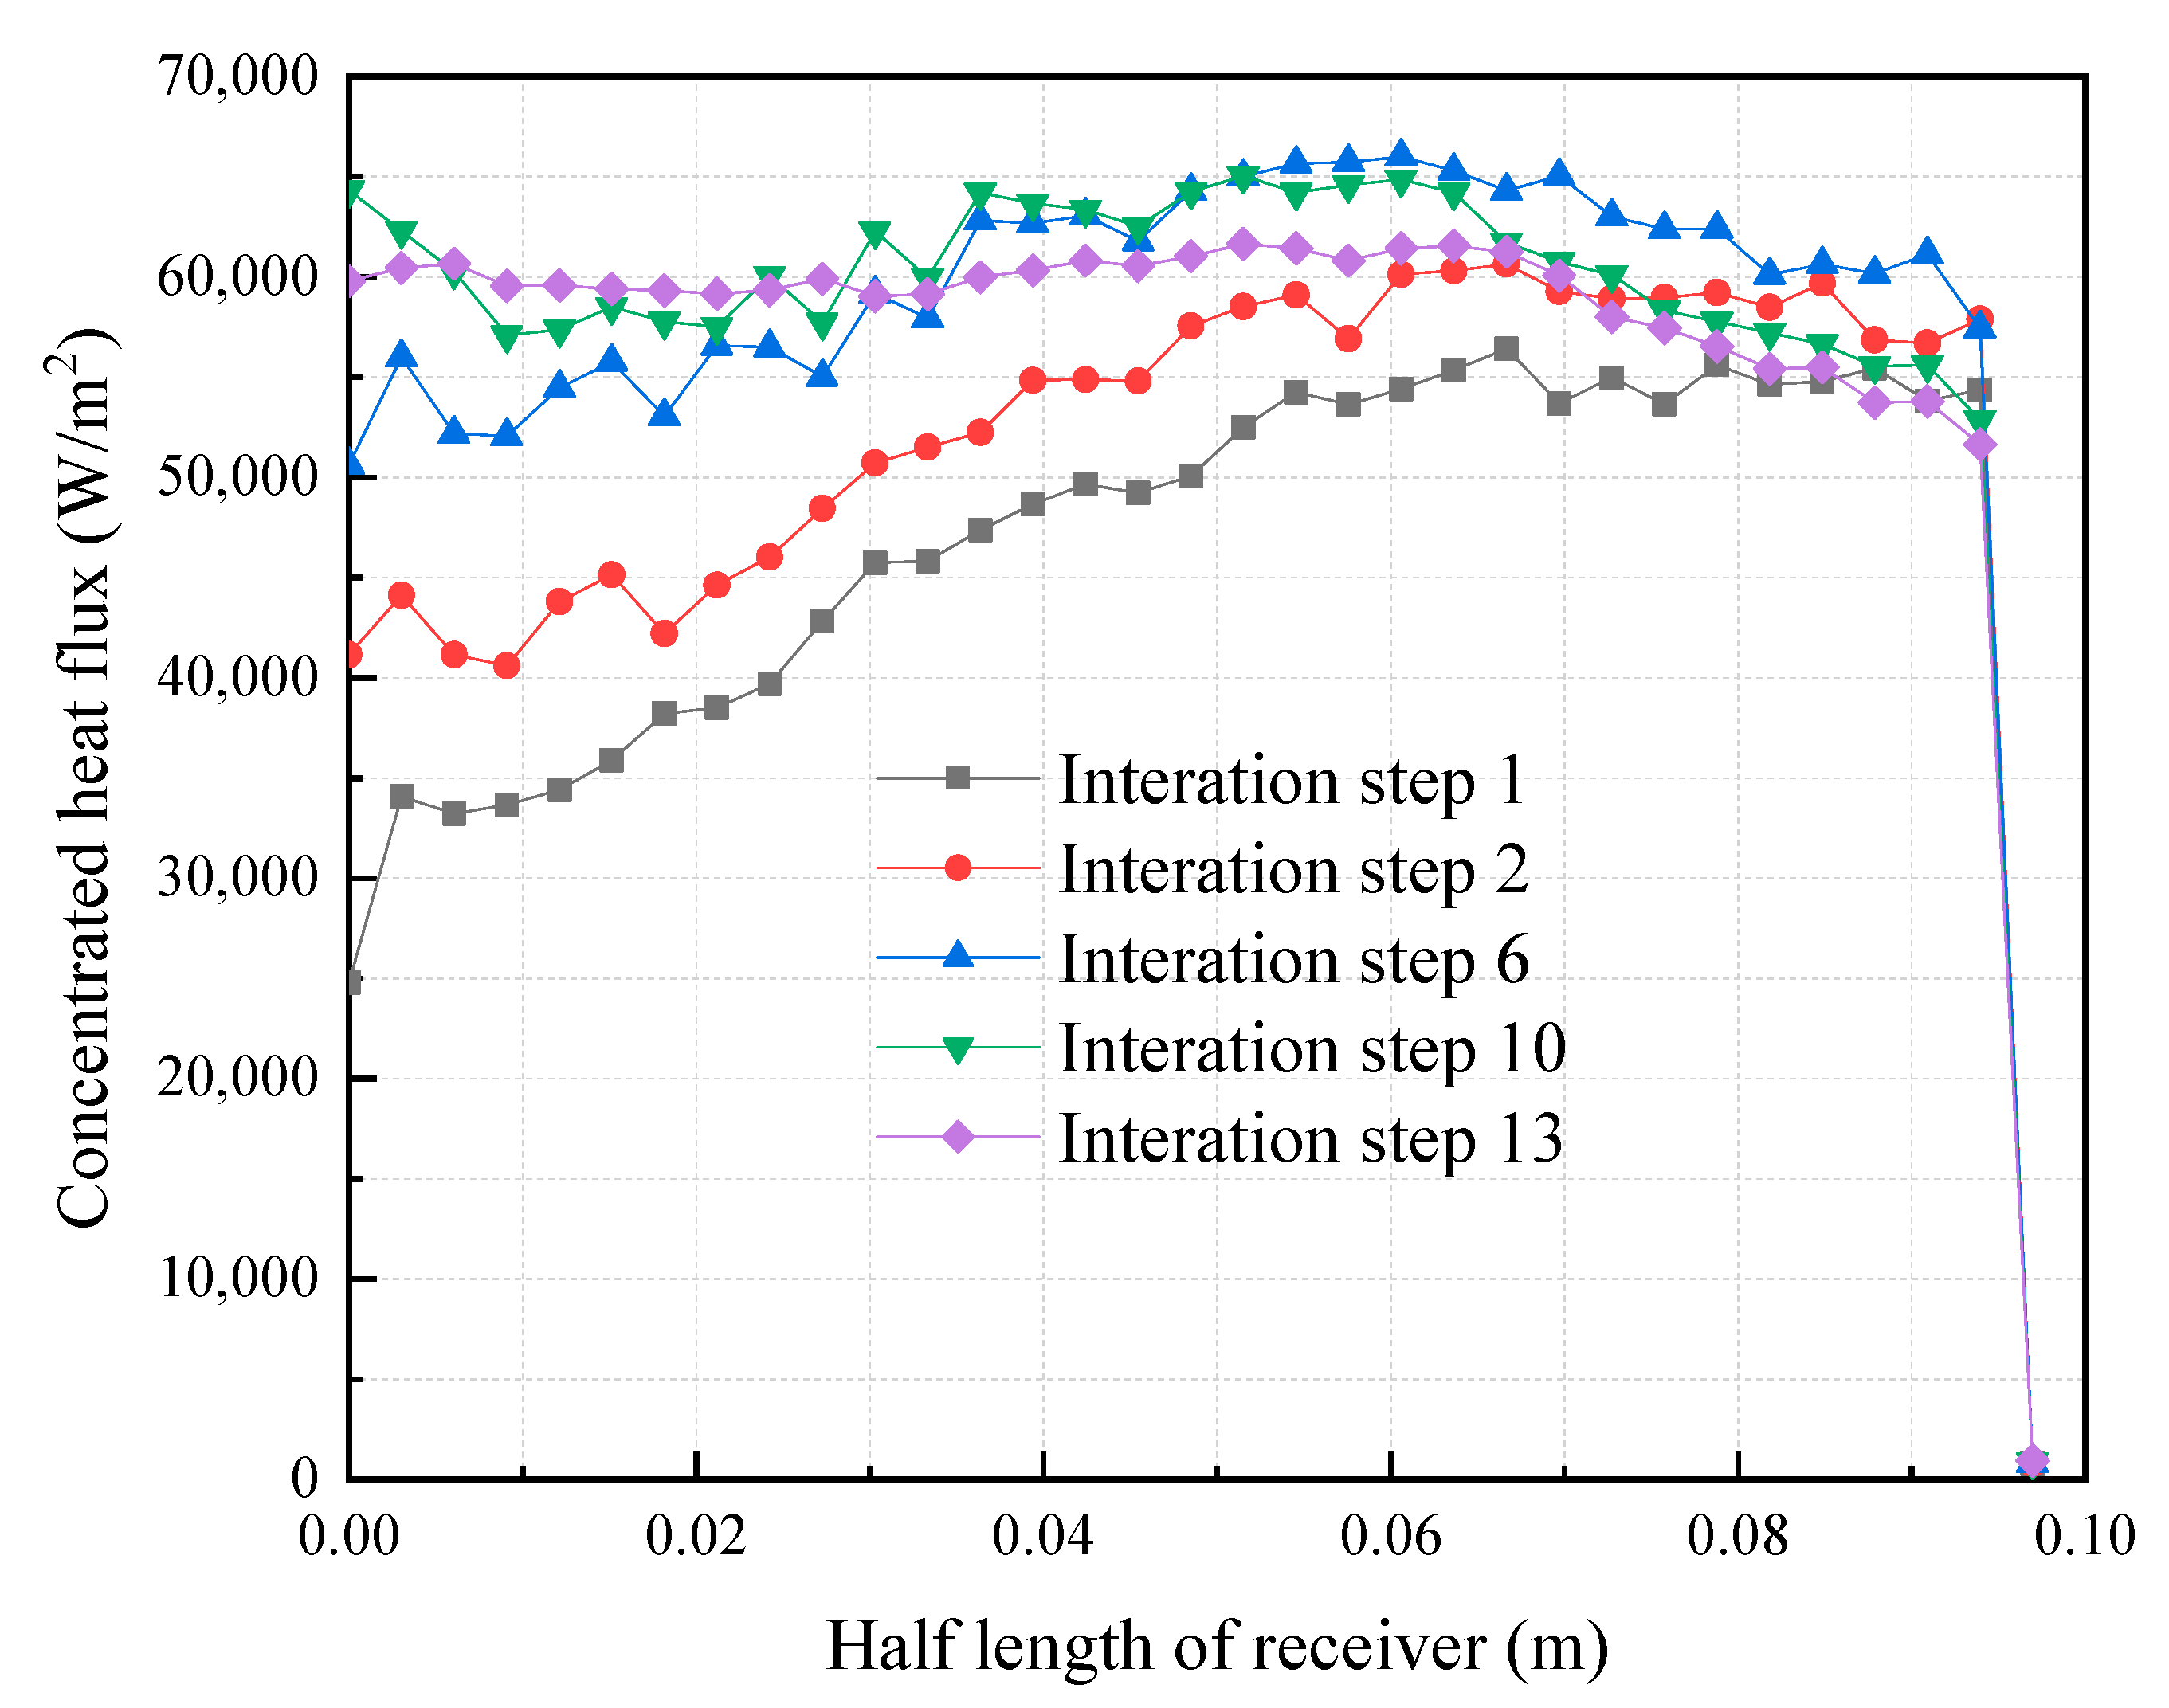
In order to further demonstrate the optimization effect by the feedback modification method, the concentrated heat flux along the radius of the receiver with iteration steps has been obtained, as shown in
Figure 12. We can find that the heat flux differs greatly from the target heat flux 60 kW/m
2, especially for the central region of the receiver. With the iterations, the receiving heat flux distribution is modified by Bayesian theory and becomes closer to the target value.
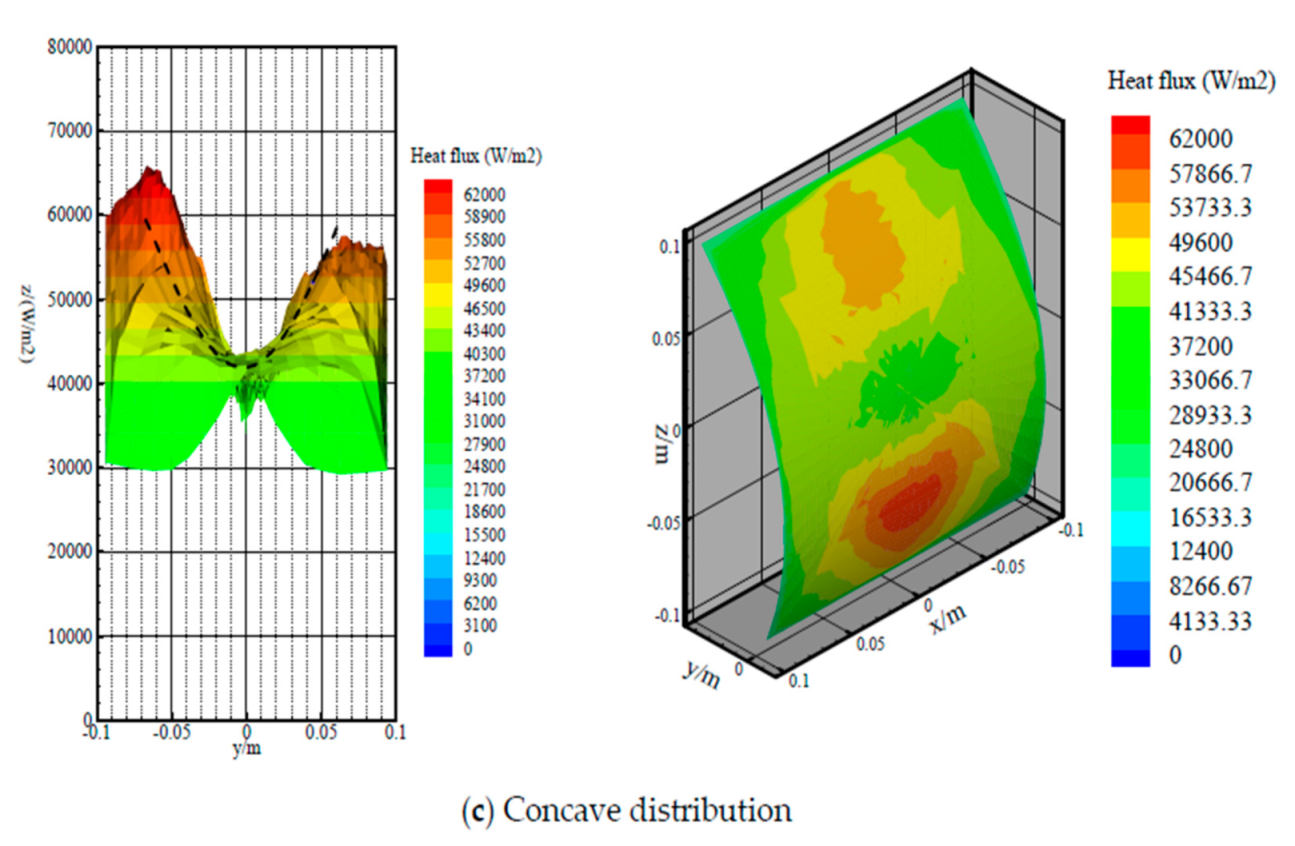
The corresponding different target distributions and the heat flux distributions after optimization are shown in
Figure 13. Both the 2-D projected section and the 3-D distribution have been provided. The black lines represent the corresponding target distribution.
Figure 13a is the Gaussian distribution with
of the target heat flux, where
.
Figure 13b is the uniform distribution with a target heat flux of 60,000 W/m
2.
Figure 13c is the concave distribution with a target heat flux
, where
.
In can be seen that the heat flux distribution conformed to our expected targets; therefore, our optimization model was well verified. Some matching errors with target heat flux appear in local regions, which are caused by errors in the GCM and triangular flat elements. In the edge part, a sharp decrease still occurs in three cases. This can be explained by the existence of reflection error and surface generation error. However, the optimization results within selected area works well. It should be noted that the leading edge of the turbine vane should be narrow and long instead of square shaped. Combining around three lamp heating systems allows the easy matching of the real shape through the current optimization and optical design method. This article only focuses on the modeling method and discusses a square target shape as an example, which can be extended for other complex and 3-D shape targets.
5. Conclusions
With the aid of freeform optics and the feedback optimization method, the current study developed a concentrating-type radiation heating system for the leading-edge part of C3X turbine vanes. The solving procedure involved source-target mapping, GCM, MCRT, and feedback modifications. Using the above method, the MF value decreased to the minimum of 0.034 after 12 iterations. For uniform target distribution, the heat flux distributions on the receiving surface before and after optimization have been compared. Due to the ray path length difference along the z axis and the construction error caused by initial GCM, the heat flux is obviously non-uniform when directly using GCM. After optimization, heat flux uniformity was significantly improved, especially for the central uniform region. In the corresponding Gaussian distribution, uniform distribution, and concave distribution, the heat flux distributions also conformed to our expected targets; therefore, our optimization model was well verified. The current study seeks a feasible way to generate 3-D heat flux distribution for complex curved surfaces, such as turbine vane surfaces, and helps to simulate the real thermal environment of hot components in aero-engines.


