Article

Comparative Research on Ventilation Characteristics of Scattering and Sample Room from Chinese Spallation Neutron Source

1
Department of Mechanical and Power Engineering, Harbin University of Science and Technology, Harbin 150080, China
2
Institute of High Energy Physics, Chinese Academy of Sciences, Beijing 100049, China
3
China Spallation Neutron Source Science Center, Dongguan 523803, China
4
School of Energy Science and Engineering, Harbin Institute of Technology, Harbin 150001, China
*
Authors to whom correspondence should be addressed.
Energies 2022, 15(11), 4001; https://doi.org/10.3390/en15114001
Submission received: 11 April 2022 / Revised: 23 May 2022 / Accepted: 26 May 2022 / Published: 29 May 2022
(This article belongs to the Special Issue Advanced Thermal Analysis and Management Technology)

Abstract

:
Ventilation design of the scattering room and sample room in the Chinese Spallation Neutron Source (CSNS) is of great significance to maintain good indoor air quality and ensure the health of radiation workers. Based on the computational fluid dynamics (CFD) theory, the three-dimensional models of the scattering and sample rooms were established and fourteen layout schemes were simulated. Subsequently, the best schemes were selected among three typical layout schemes. On this basis, the paper presents research about the influence of changing the height of the outlet on the ventilation quality. The results show that the trend of numerical simulation is consistent with experimental data, which verifies the reliability of the numerical method. The change of the exhaust port position has an apparent influence on indoor ventilation, which reduces the air age by 4–27%. When the position of the outlet descends 0.5 m, the air age decreases by 2–11%, and this study provides guidance and suggestions for the design of the scattering and sample rooms.

1. Introduction

Chinese Spallation Neutron Source (CSNS) is a large-scale primary scientific facility that was recently completed in 2018. The principle of CSNS is that a 1.6 GeV proton beam generated by accelerator bombards the tungsten target and splits, resulting in high-energy pulsed neutrons. The target station spectrometer is an essential part of CSNS. The scattering room and sample room inside it provide reflection and measurement space for the neutron incident sample of the spectrometer, while shielding the radiation generated. In the operation of the spallation neutron source, neutrons were extracted from the catheter after moderating and projected into the sample room, fixed on the sample in the center of the sample stage. The sample room is used as an experimental space for scattering samples, and the fron and back ends are isolated from the collimating system and scattering room by a vacuum. A suitable and safe working environment is provided for the radiation worker, and a labyrinth channel is set to ensure wind velocity remains stable. How to ensure good indoor air quality is of great significance to protect the health of radiation workers and for the comfort of the working environment.
According to statistics, humans inhale 10 m3 air every day, and spend 80–90% of their time in an indoor environment [1,2]. When indoor pollutant emissions are poor and ventilation rates are low, it will lead to more severe air pollution than outdoors, so the indoor air quality has a significant impact on people’s health [3,4]. Ventilation is an effective way to improve air quality, therefore, reasonable ventilation mode was selected to meet air quality standards, and appropriate temperature as well as humidity were provided to ensure the comfortable working environment [5,6]. At present, the commonly used ventilation methods include natural ventilation and mechanical ventilation [7,8]. Natural ventilation has no demand for equipment and gains power through wind pressure and hot pressing to achieve the purpose of ventilation. It not only saves energy and reduces energy consumption [9,10,11], but also has further advantages in improving thermal comfort under a warm climate [12,13]. However, this method is susceptible to the environment and difficult to control [14]. Mechanical ventilation produces pressure difference by giving air momentum through the fan. It is easy to handle and has high efficiency, but increases electricity costs [15,16].
The air pollutants have wide varieties [17,18], including solid particles, nitrogen dioxide, carbon monoxide, sulfur dioxide, microorganisms, chemical volatile organic compounds, and outdoor air, which are the most common types of air pollutants encountered indoors and have different hazards to human bodies [19,20,21]. By optimizing the ventilation mode to reduce air pollutant content, this improves the indoor air quality and meets the needs of radiation workers. At present, there are two main research methods for indoor ventilation optimization [22], namely, indoor experiment method and simulation calculation method. An experimental process based on its own characteristics can more truly reflect the various parameters of the indoor flow field, such as velocity, temperature, and pollutant concentration. However, this method requires a long experimental time and high cost, which significantly reduces the efficiency. The mass concentration and elemental composition of PM2.5 and PAHs were measured in 30 residential apartments in Xi’an and Chongqing in China through an experimental method [23]. Under indoor natural ventilation conditions, experiments were conducted and the results show that building configuration and wind direction are especially important factors [24]. The results show that most of the elemental pollution came from external sources. With the continuous improvement of computer performance, computational fluid dynamics (CFD) technology has been widely used in ventilation optimization design [25,26].
For scattering room and sample room, research mainly focused on radiation shielding, by changing material and thickness to achieve shielding radiation requirements [27]. However, there is no corresponding research on indoor air circulation in scattering room and sample room. When the irradiation work is completed, the radioactive gas contained in the scattering room and sample room, as well as the exhaust gas generated by the vacuum extraction of equipment, needs to be dealt with by the staff immediately. Consequently, it needs to be noticed that they should wear protective clothing before entering the scattering room and the sample room. In general, sufficient ventilation for a long time can be carried out in advance to discharge the gas containing radionuclide and reduce the damage to the staff. Therefore, it is necessary to replace the indoor air to ensure the health of radiation workers.
In summary, this project uses the CFD commercial software Fluent and user defined function (UDF) to numerically simulate and analyze the air flow field in the scattering room and sample room of CSNS. The purposes of this study are: (1) Various design schemes of exhaust outlet locations, and deduce the influence of changes on indoor air flow. (2) Use the ventilation schemes of the scattering room and sample room which were obtained by comparative analysis, which provide guidance and suggestions for ventilation design of the scattering room and sample room.

2. Physical Model, Ventilation Layout, and Meshing
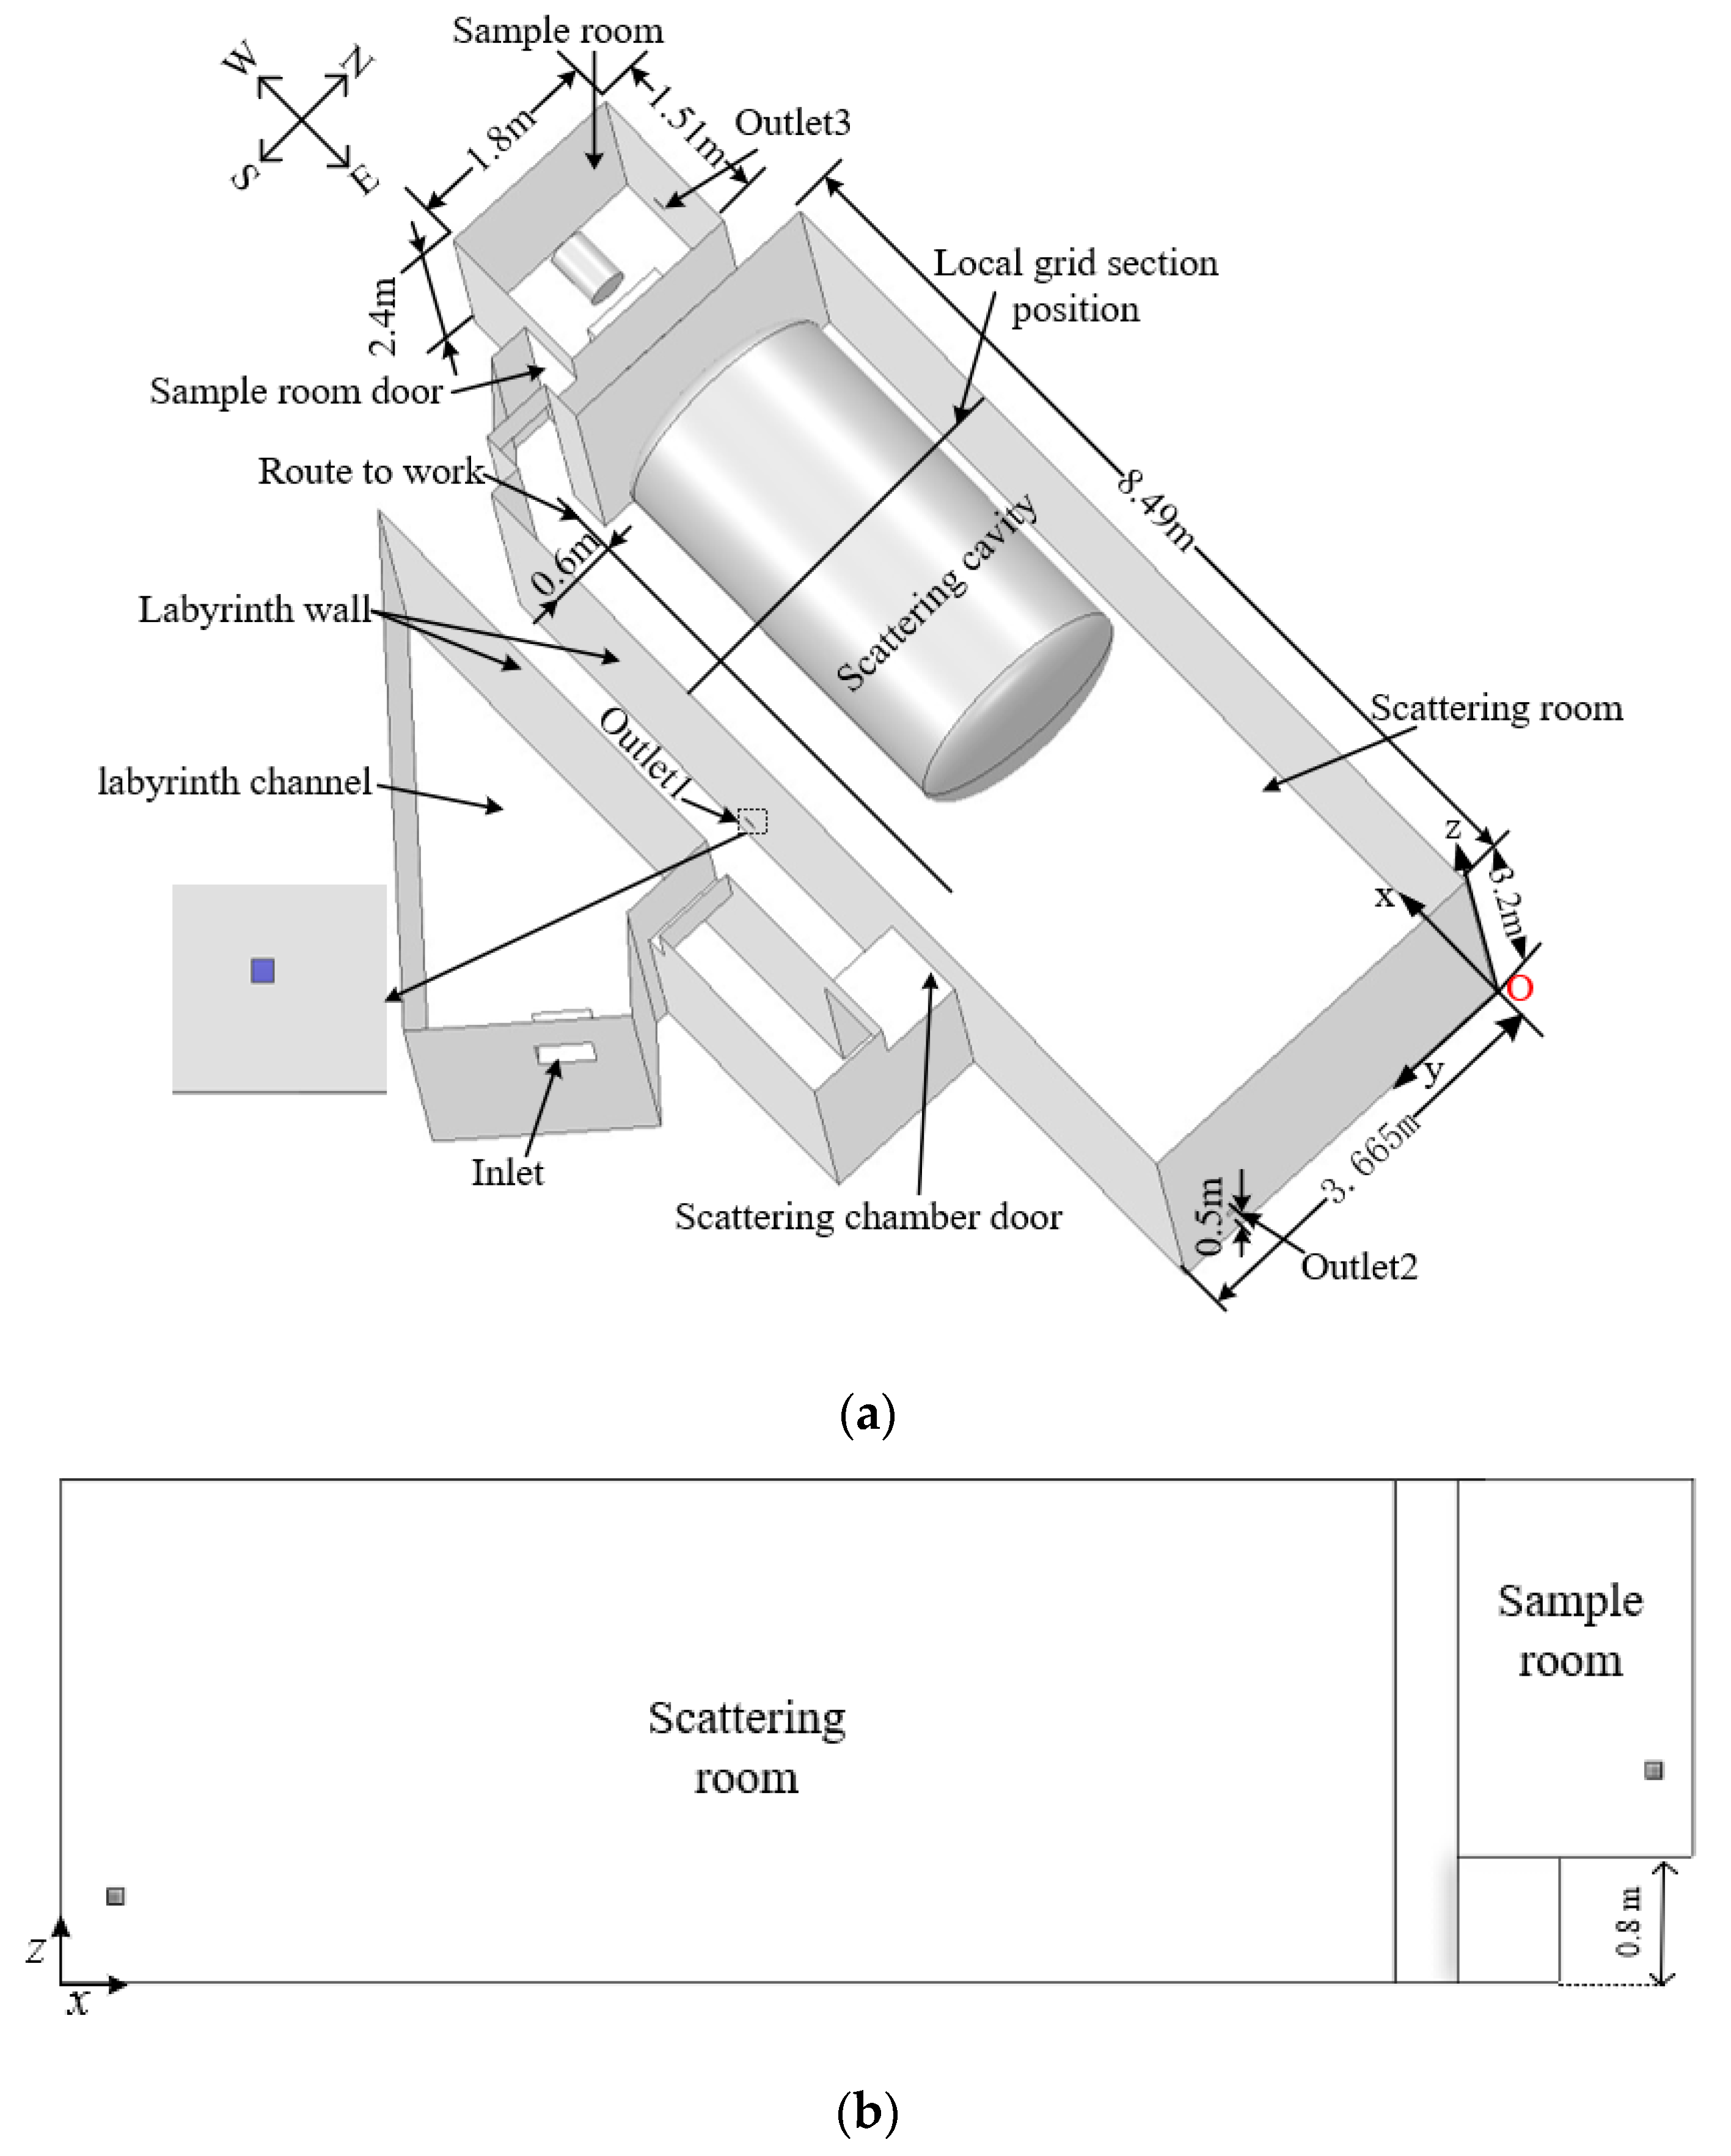
2.1. Physical Model

The research object of this work is located in the scattering room of the first-stage target station spectrometer of Chinese Spallation Neutron Source in Dongguan, Guangdong Province. The overall structure is shown in Figure 1, where air enters from the inlet, flows through the labyrinth channel, enters the scattering room, some air flows out through outlet 1 and 2, and other air flows into the sample room around the scattering cavity (no air enters, no longer in the calculation domain), and finally flows out through outlet 3. The size of the inlet is 0.5 m × 0.5 m, and the height is 2 m. The central part of the scattering room is a scattering cavity, with an inlet and outlet neutron scattering experimental device, and the sample room has a table placed device and an outlet. The practical space of the sample chamber is 1.51 m × 1.8 m × 2.4 m, and the height is 2.4 m. The ground of the sample room is 0.8 m above ground of the scattering room. There are steps and doors between the sample room and scattering room, which are convenient for the radiation worker to enter the sample room for installation and disassembly of samples. Three outlets are arranged on the side wall with a relative ground height of 0.5 m.

2.2. Layout Schemes of Ventilation
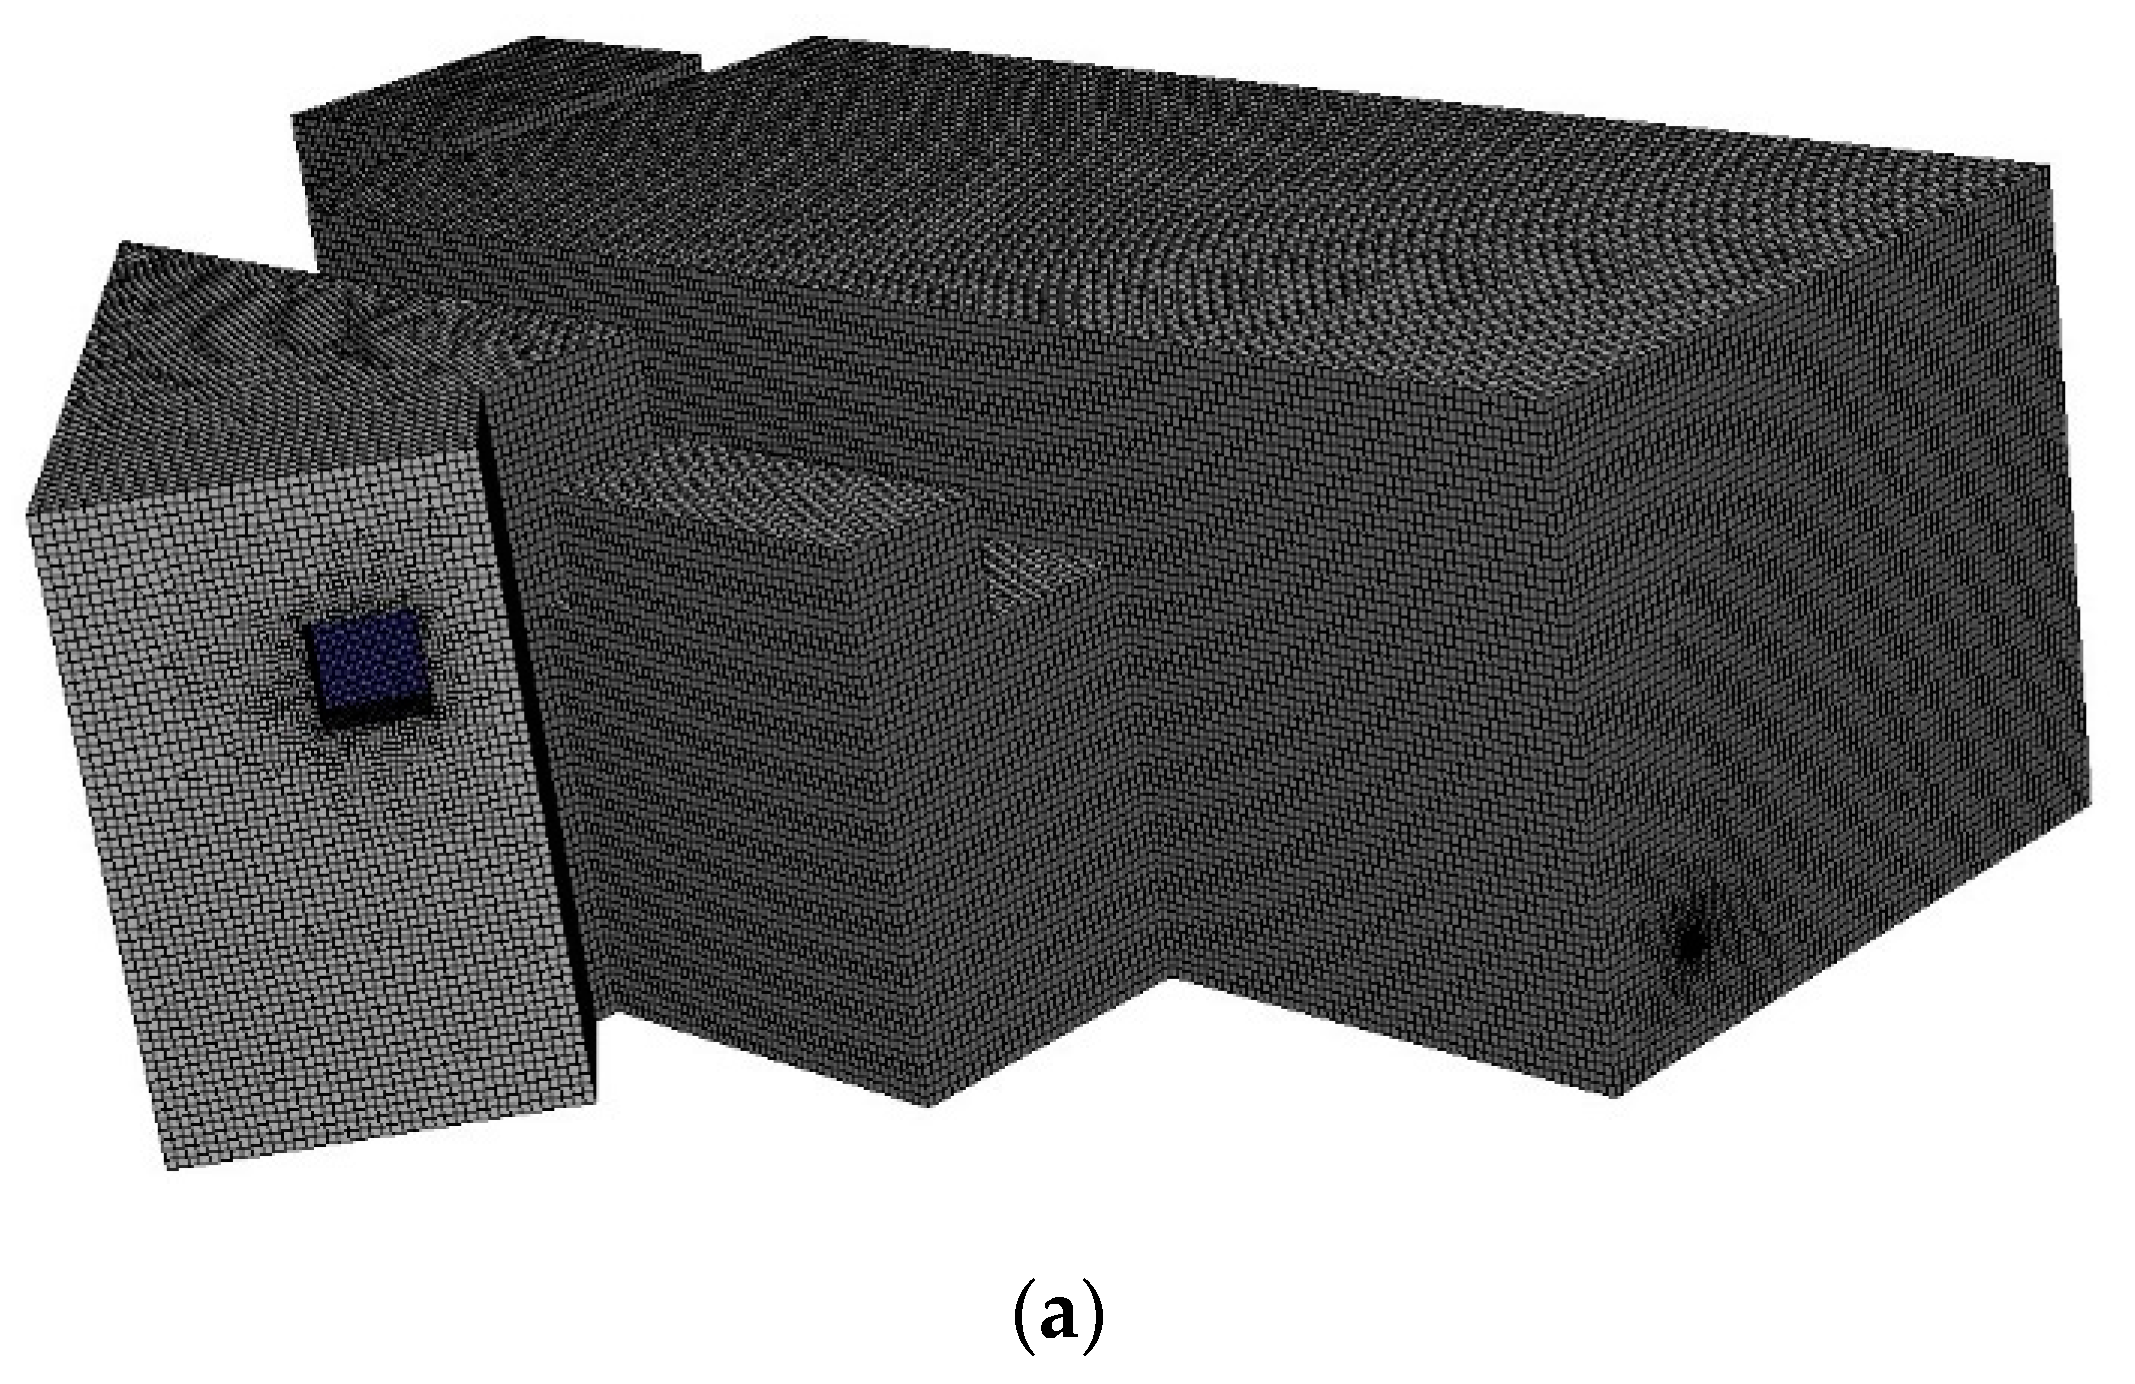
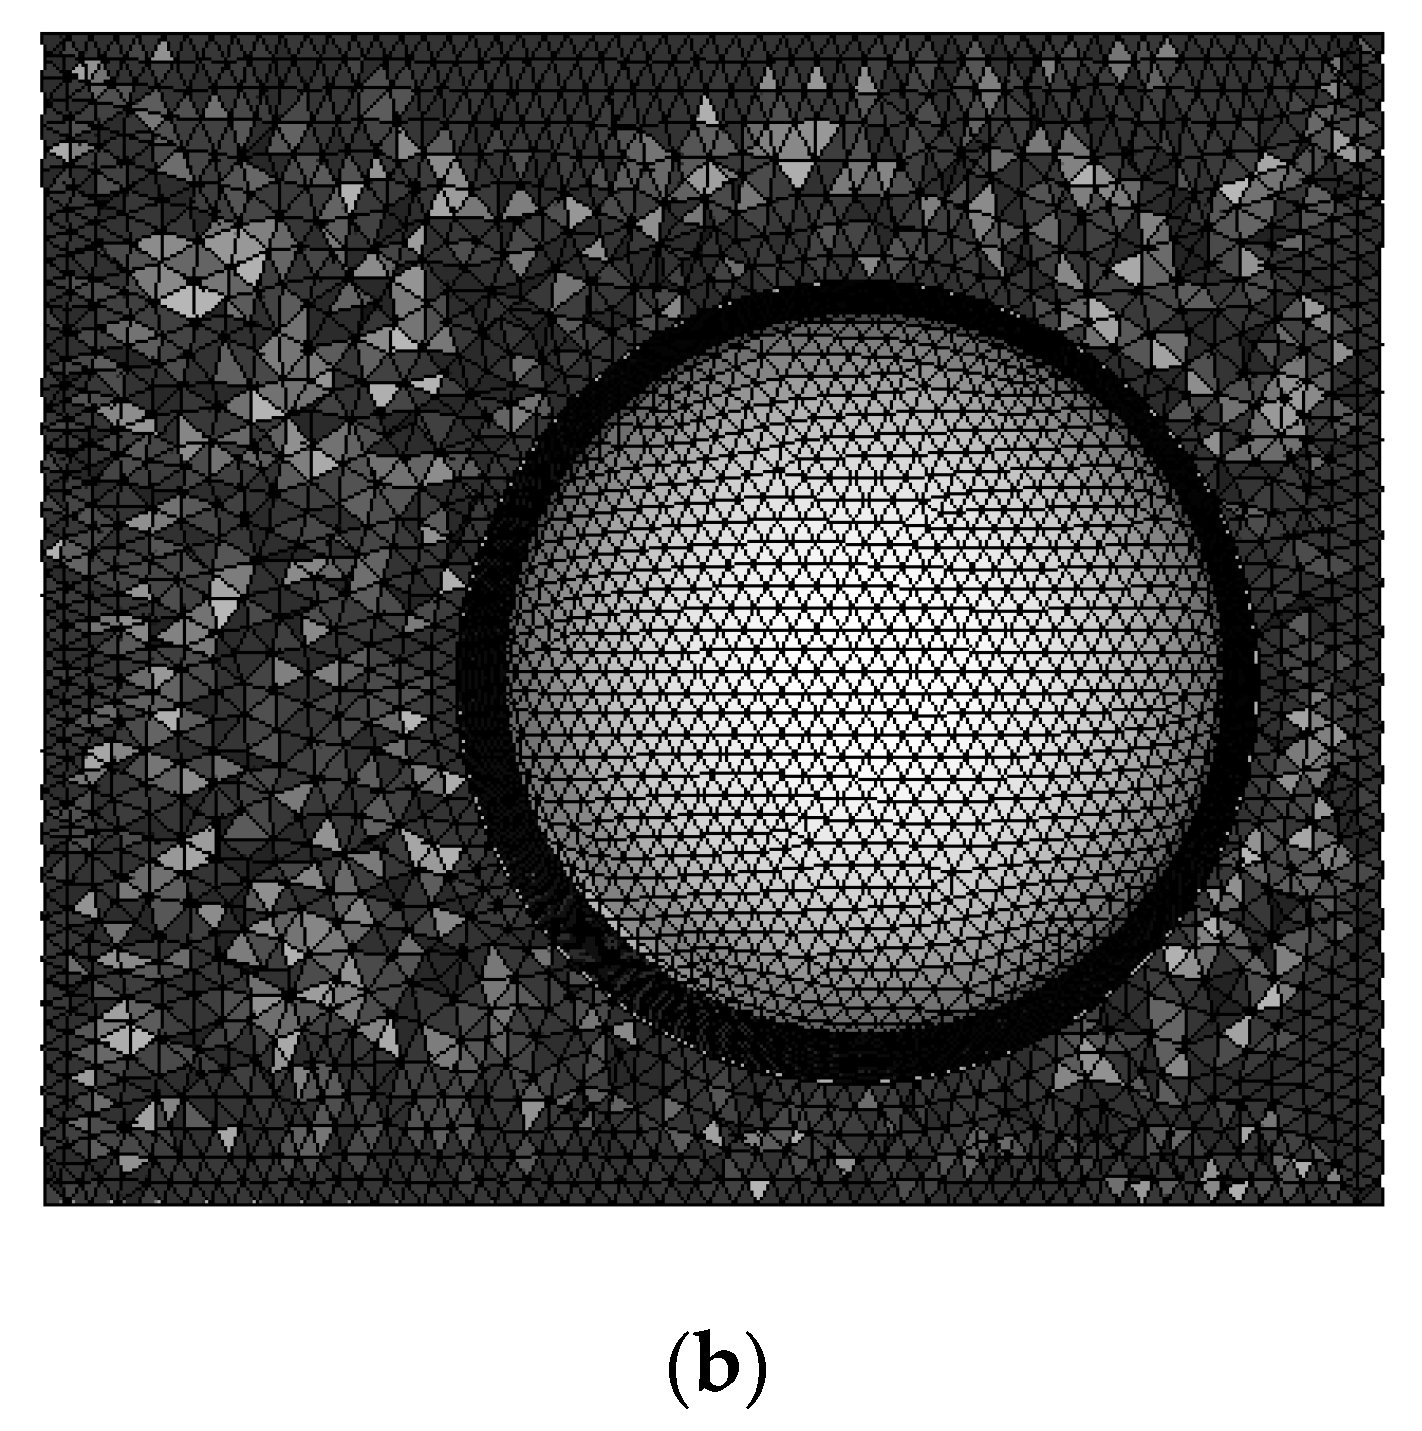
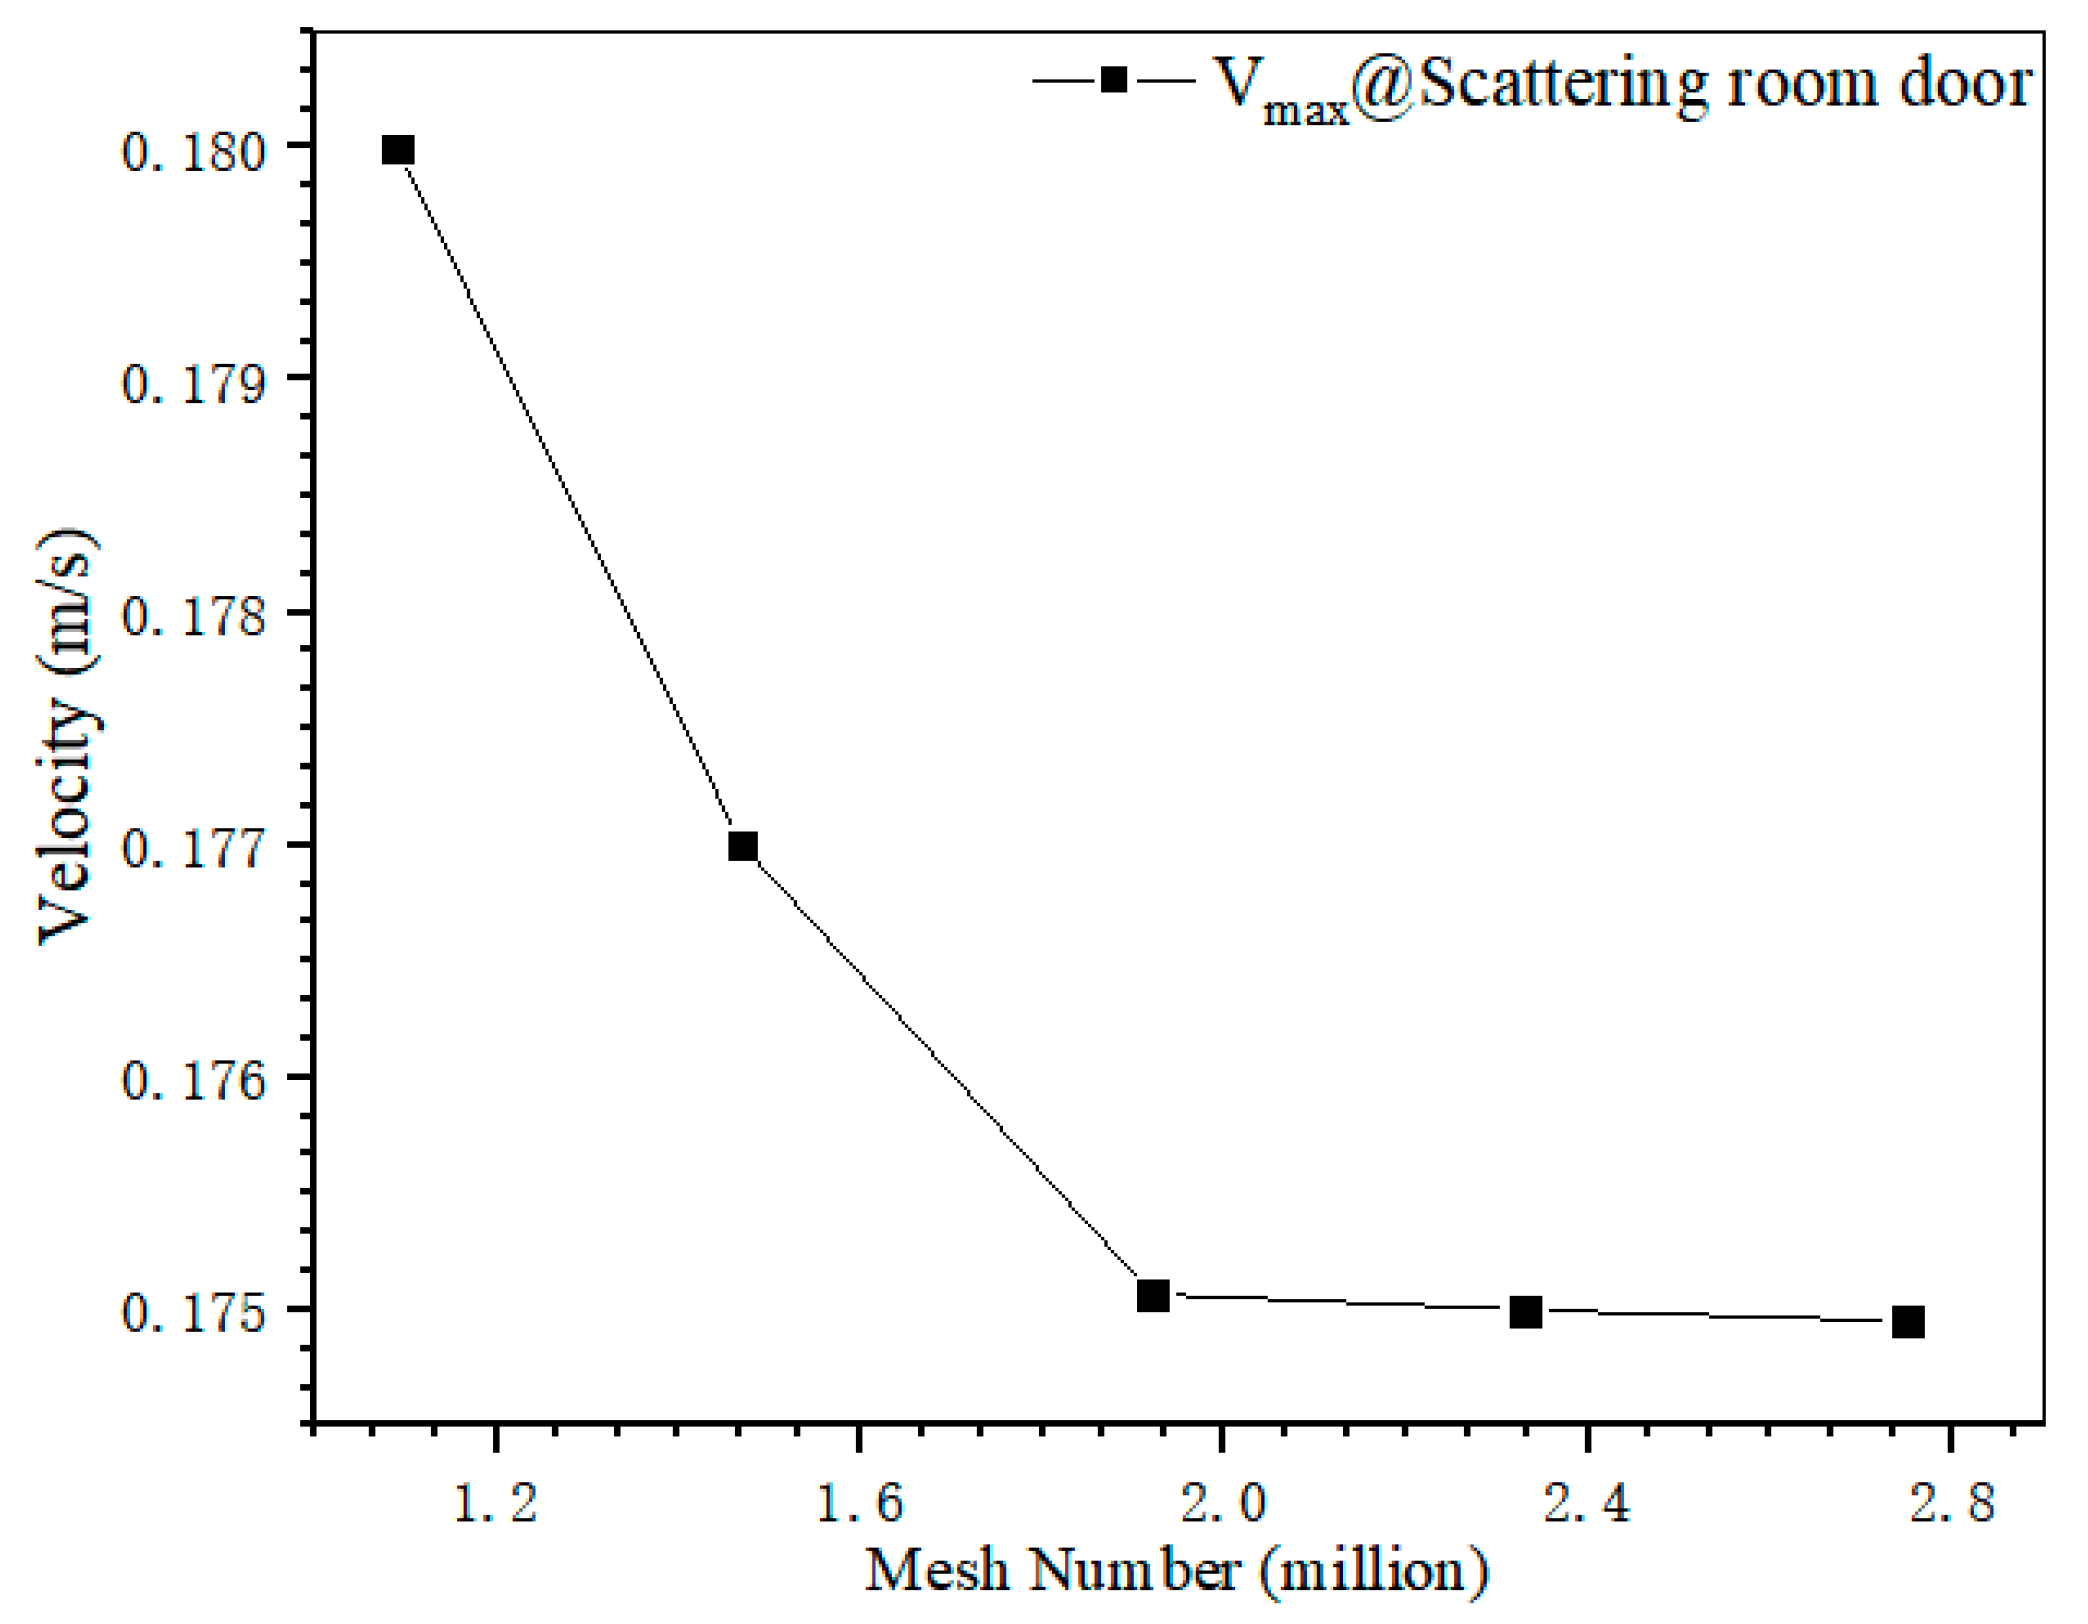
This study mainly researched the ventilation effect from two aspects: one is to determine the best layout scheme by changing the position of the outlet. On this basis, by changing the height of the outlet, the influence of the outlet height on the ventilation quality was studied. The specific location relationship is shown in Table 1. Outlet 1 is arranged in the south wall of the scattering chamber, outlet 2 changes in the east, south, and north walls of the scattering room, and outlet 3 changes in the east and north walls of the sample room.

2.3. Meshing

The overall model was meshed by ICEM 2021. Due to the large and irregular model, the tetrahedral unstructured mesh was adopted. The inlet and outlet surfaces and the places with a large velocity gradient were locally encrypted to improve the calculation accuracy. The local mesh section position of scattering room was marked in Figure 1. The mesh was divided as shown in Figure 2.
Five different mesh densities (1.09 million, 1.41 million, 1.91 million, 2.32 million, 2.74 million) were used to test the grid independence of air velocity. Figure 3 shows the simulation results of the air velocity of five grids. The results show that when the number of grids reached 1.91 million or more, the air velocity basically remained unchanged.
The grid convergence index (GCI) was used to quantify the grid independence. Replace Nos. 1, 2, 3, 4, and 5 with 1.09 million, 1.41 million, 1.91 million, 2.32 million, and 2.74 million, respectively.
Grid convergence index (GCI) is defined as [28]:
G C I = F s | ε | r p 1
ε = f 1 f 2 f
r k , k + 1 = N k + 1 N k 3
where F s is the safety factor value of 1.25; P is the convergence accuracy value of 1.97; ƒ is the maximum value of ƒ1 ƒ2, take the outlet velocity value; N k is the number of grids; GCI12 is 0.65%, GCI23 is 2.58%, GCI34 is 0.79%, GCI45 is 1.32%, and the values are less than 3%, indicating that the numerical simulation results are independent of the number of grids. Considering the accuracy and efficiency, this paper selected 2.32 million grids to finally simulate.

3. Mathematical Model and Solving Conditions

The assumption conditions of indoor air flow are as following:
  • The internal air flows at a low velocity with a Mach number far below 0.3 and a small density change, which were regarded as incompressible fluid and satisfy the Boussinesq assumption;
  • The Reynolds number calculated reached 13,000, and the flow pattern was judged to be in a turbulent state.

3.1. Flow Control Equations

In the current work, the finite volume method was adopted to simulate the three-dimensional steady flow of the ventilation process in a computational domain. Gas flow satisfies the continuity equation and momentum equation. The control equations are as follows [29]:
( ρ u i ) = 0
( ρ u i u j ) = P + τ i j + ( ρ u i u j ¯ )
τ i j = μ ( u i + ( u i ) T 2 3 δ i j ( u i ) )
where ρ is density; u i is velocity tensor in which subscript i can be 1, 2 or 3, representing three directions in Cartesian coordinate. Where P is pressure; δ is kronecker symbol; μ is viscosity, and τ i j is viscous stress tensor.
The k-ε Launder and Sharmae equation model was used to simulate turbulent flow:
( ρ u i k ) = [ ( μ + μ t σ k ) k ] + P k ρ ε S k
( ρ u i ε ) = [ ( μ + μ t σ ε ) ε ] + C ε 1 f 1 ε k P k C ε 2 f 2 ρ ε 2 k + S k
where C ε 1 , C ε 2 , σ k , and σ ε are constants; f 1 and f 2 are work; ε is turbulent dissipation rate; S k and S ε are the source terms of k and ε , respectively; Pk is a turbulent kinetic energy term produced by shear force, which is expressed as follows:
P k = ρ u i u j ¯ u i

3.2. Airflow Quality and Uniformity Evaluation Index

3.2.1. Air Age

Air age is the time when air has stranded at certain points in the room; it reflects the freshness of indoor air, which can comprehensively measure the ventilation effect of room and is an important indicator for evaluating indoor air quality. The older air age means the longer air replacement time, the worse air quality. In the numerical simulation, air age at inlet is 0, and air age at outlet is the largest. The calculation expression of air age at a point n in room is [30]:
τ n = 0 C ( τ ) d τ c 0
where c 0 is n initial concentration; C ( τ ) is instantaneous concentration, and τ is air age.
The transport equation of air age is:
x ( u τ n ) + x ( v τ n ) + x ( w τ n ) = x ( Γ τ n x ) + y ( Γ τ n y ) + z ( Γ τ n z ) + 1
According to the transport equation of air age, the distribution of air age can be calculated by numerical calculation. As air age was not included in the software simulation, its calculation expression was used to simulate with user defined function (UDF).

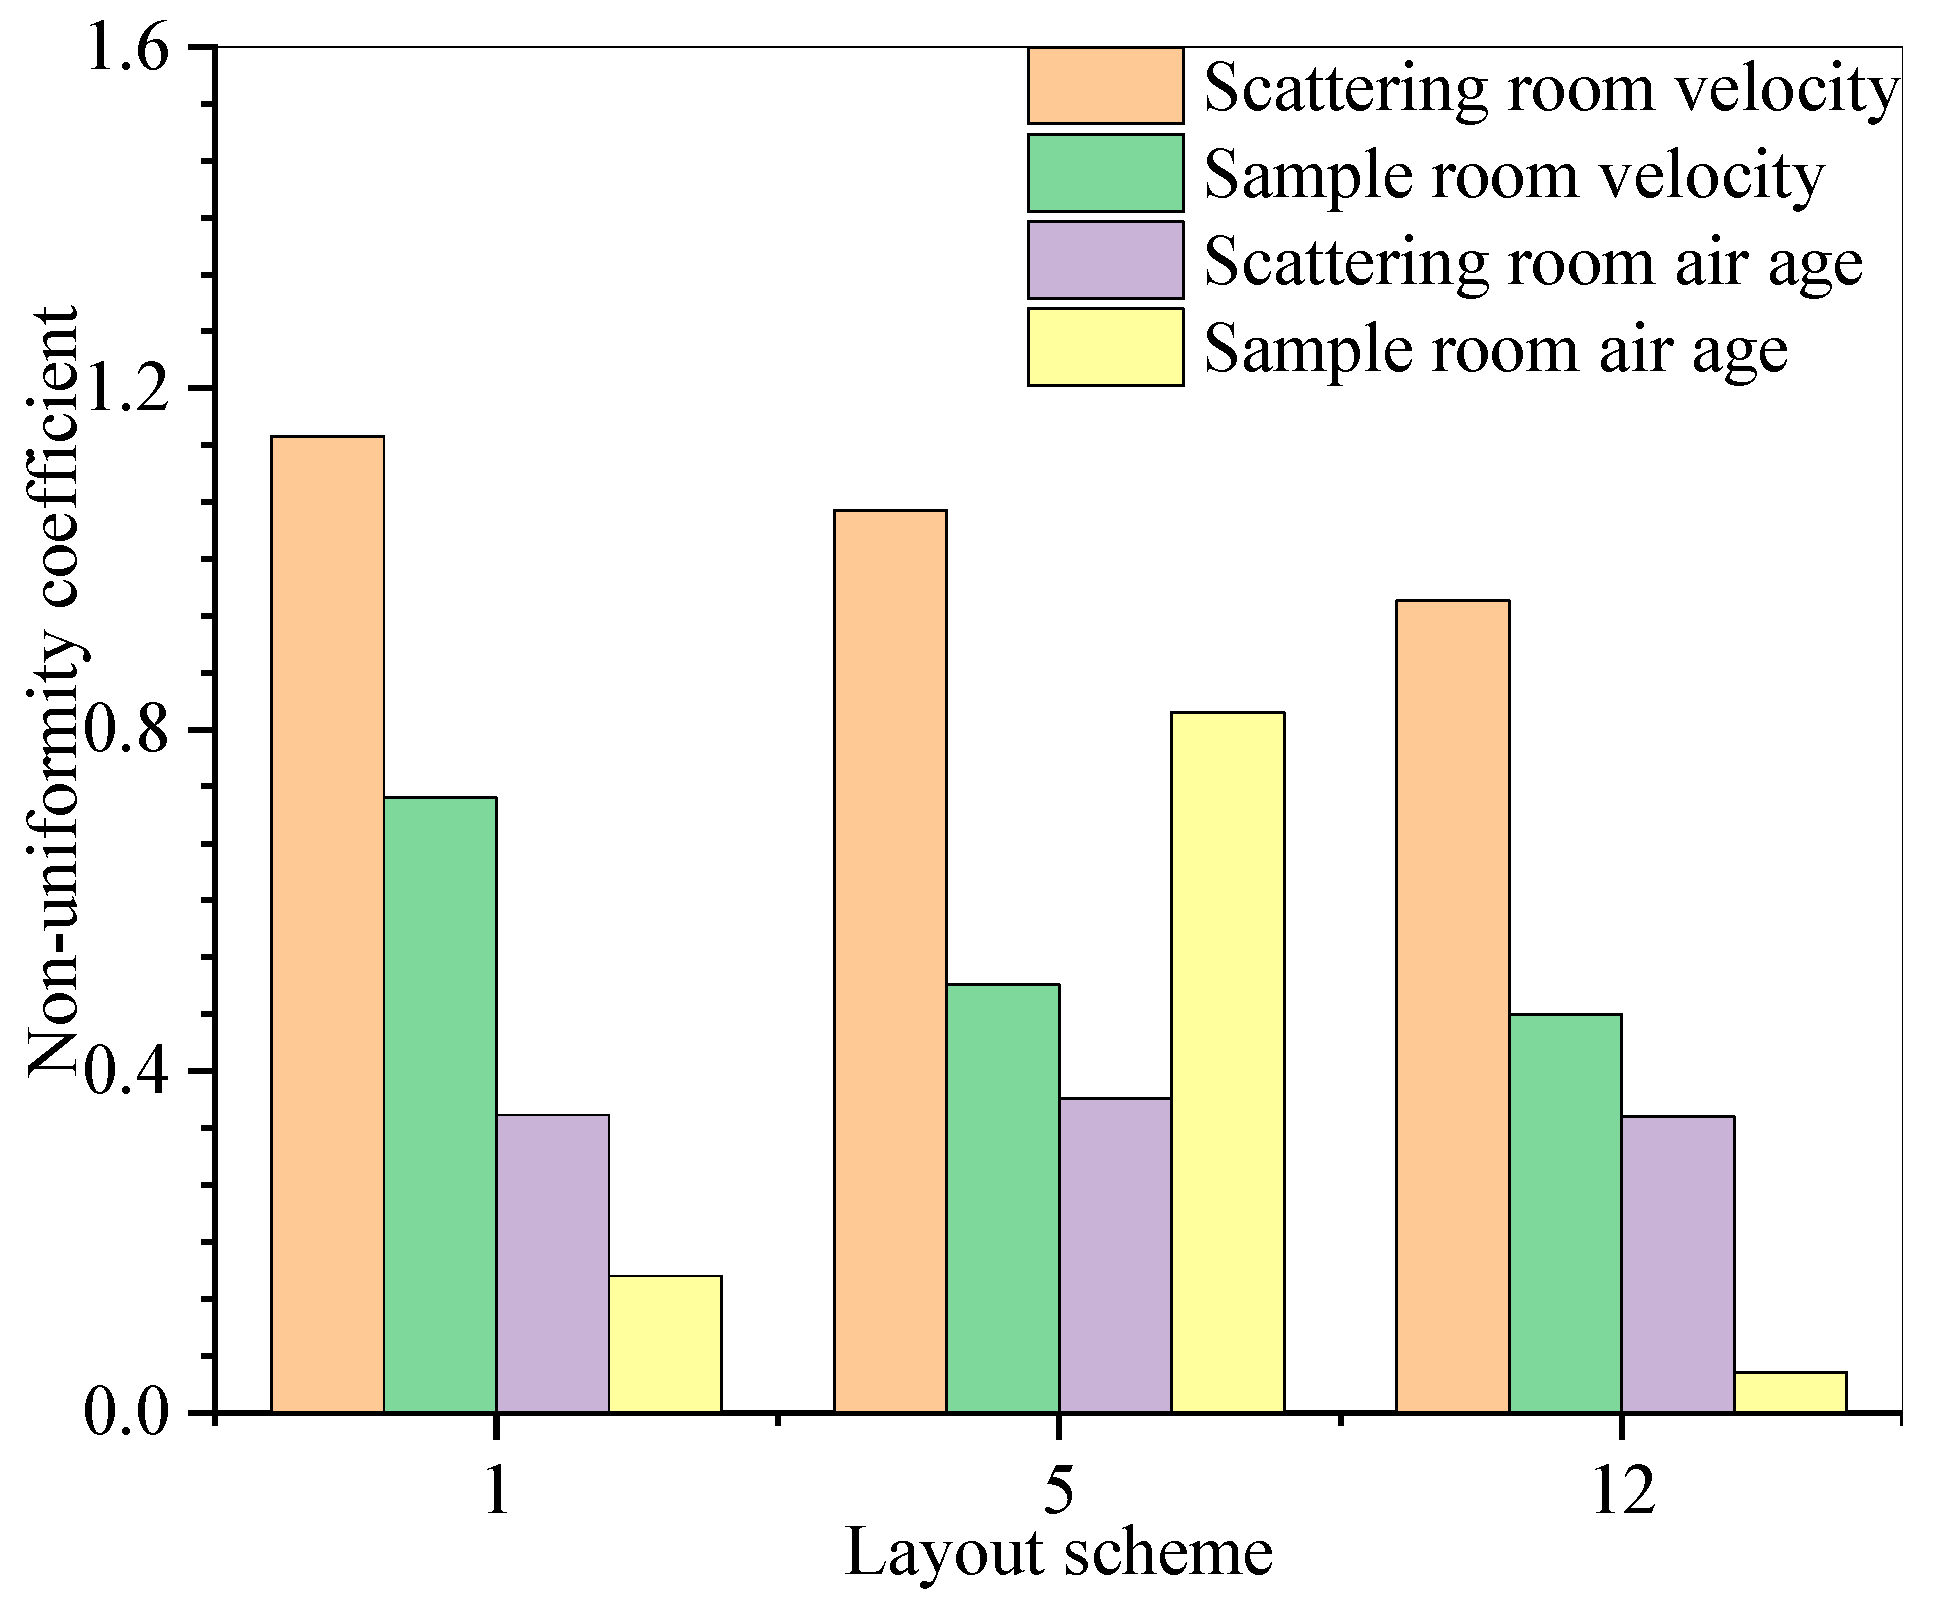
3.2.2. Non-Uniformity Coefficient of Air Distribution

Due to the characteristics of air turbulence, the wind velocity and air age at each point of the indoor air flow field were different. In order to compare and analyze the simulation results of each scheme more accurately, the concept of non-uniformity coefficient in statistics was used to evaluate the airflow uniformity index in the room.
Selecting n measuring points in the measuring area, the velocity and air age of each point were measured respectively, and average value was calculated [31]:
u ¯ = u i n
τ n ¯ = τ i n
The root mean square deviation is:
σ u = ( u i u ¯ ) 2 n
σ τ n = ( τ n τ n ¯ ) n
The non-uniformity coefficient is defined as:
k u = σ u u ¯
k τ n = σ τ n τ n ¯
where k u is velocity non-uniformity coefficient and k τ n is air age non-uniformity coefficient, and k u   k τ n are dimensionless parameters. The larger the value of k u and k τ n , the more discrete the data, and the more worse the uniformity. The smaller the coefficient, the opposite conclusion.

3.3. Boundary Conditions

The equation was discretized by finite volume method, and discrete scheme adopted the second-order upwind scheme. Semi-Implicit Method for Pressure Linked Equations (SIMPLE) algorithm was used for velocity-pressure coupling. Standard wall function method was used for wall treatment. The convergence residual was set to 10−6, and the grid independent convergence solution was obtained.
The air exchange rate of sample room and scattering room was calculated according to the air exchange rate of 2 times per hour. In order to reduce the pressure of ventilation system, sample room and scattering room were connected in series, and overall exhaust volume was 400 m3/h. The inlet boundary condition was set to flow inlet with flow rate at 0.12 kg/s. The outlet pressure was set to 0 Pa. Other inner wall boundary conditions were defined as wall.

4. Results and Discussion

In this section, the steady-state three-dimensional numerical simulation of scattering room inside the target station spectrometer was carried out, and results were analyzed. The simulation aimed to determine the different fields under flow structure, such as velocity field and air age.

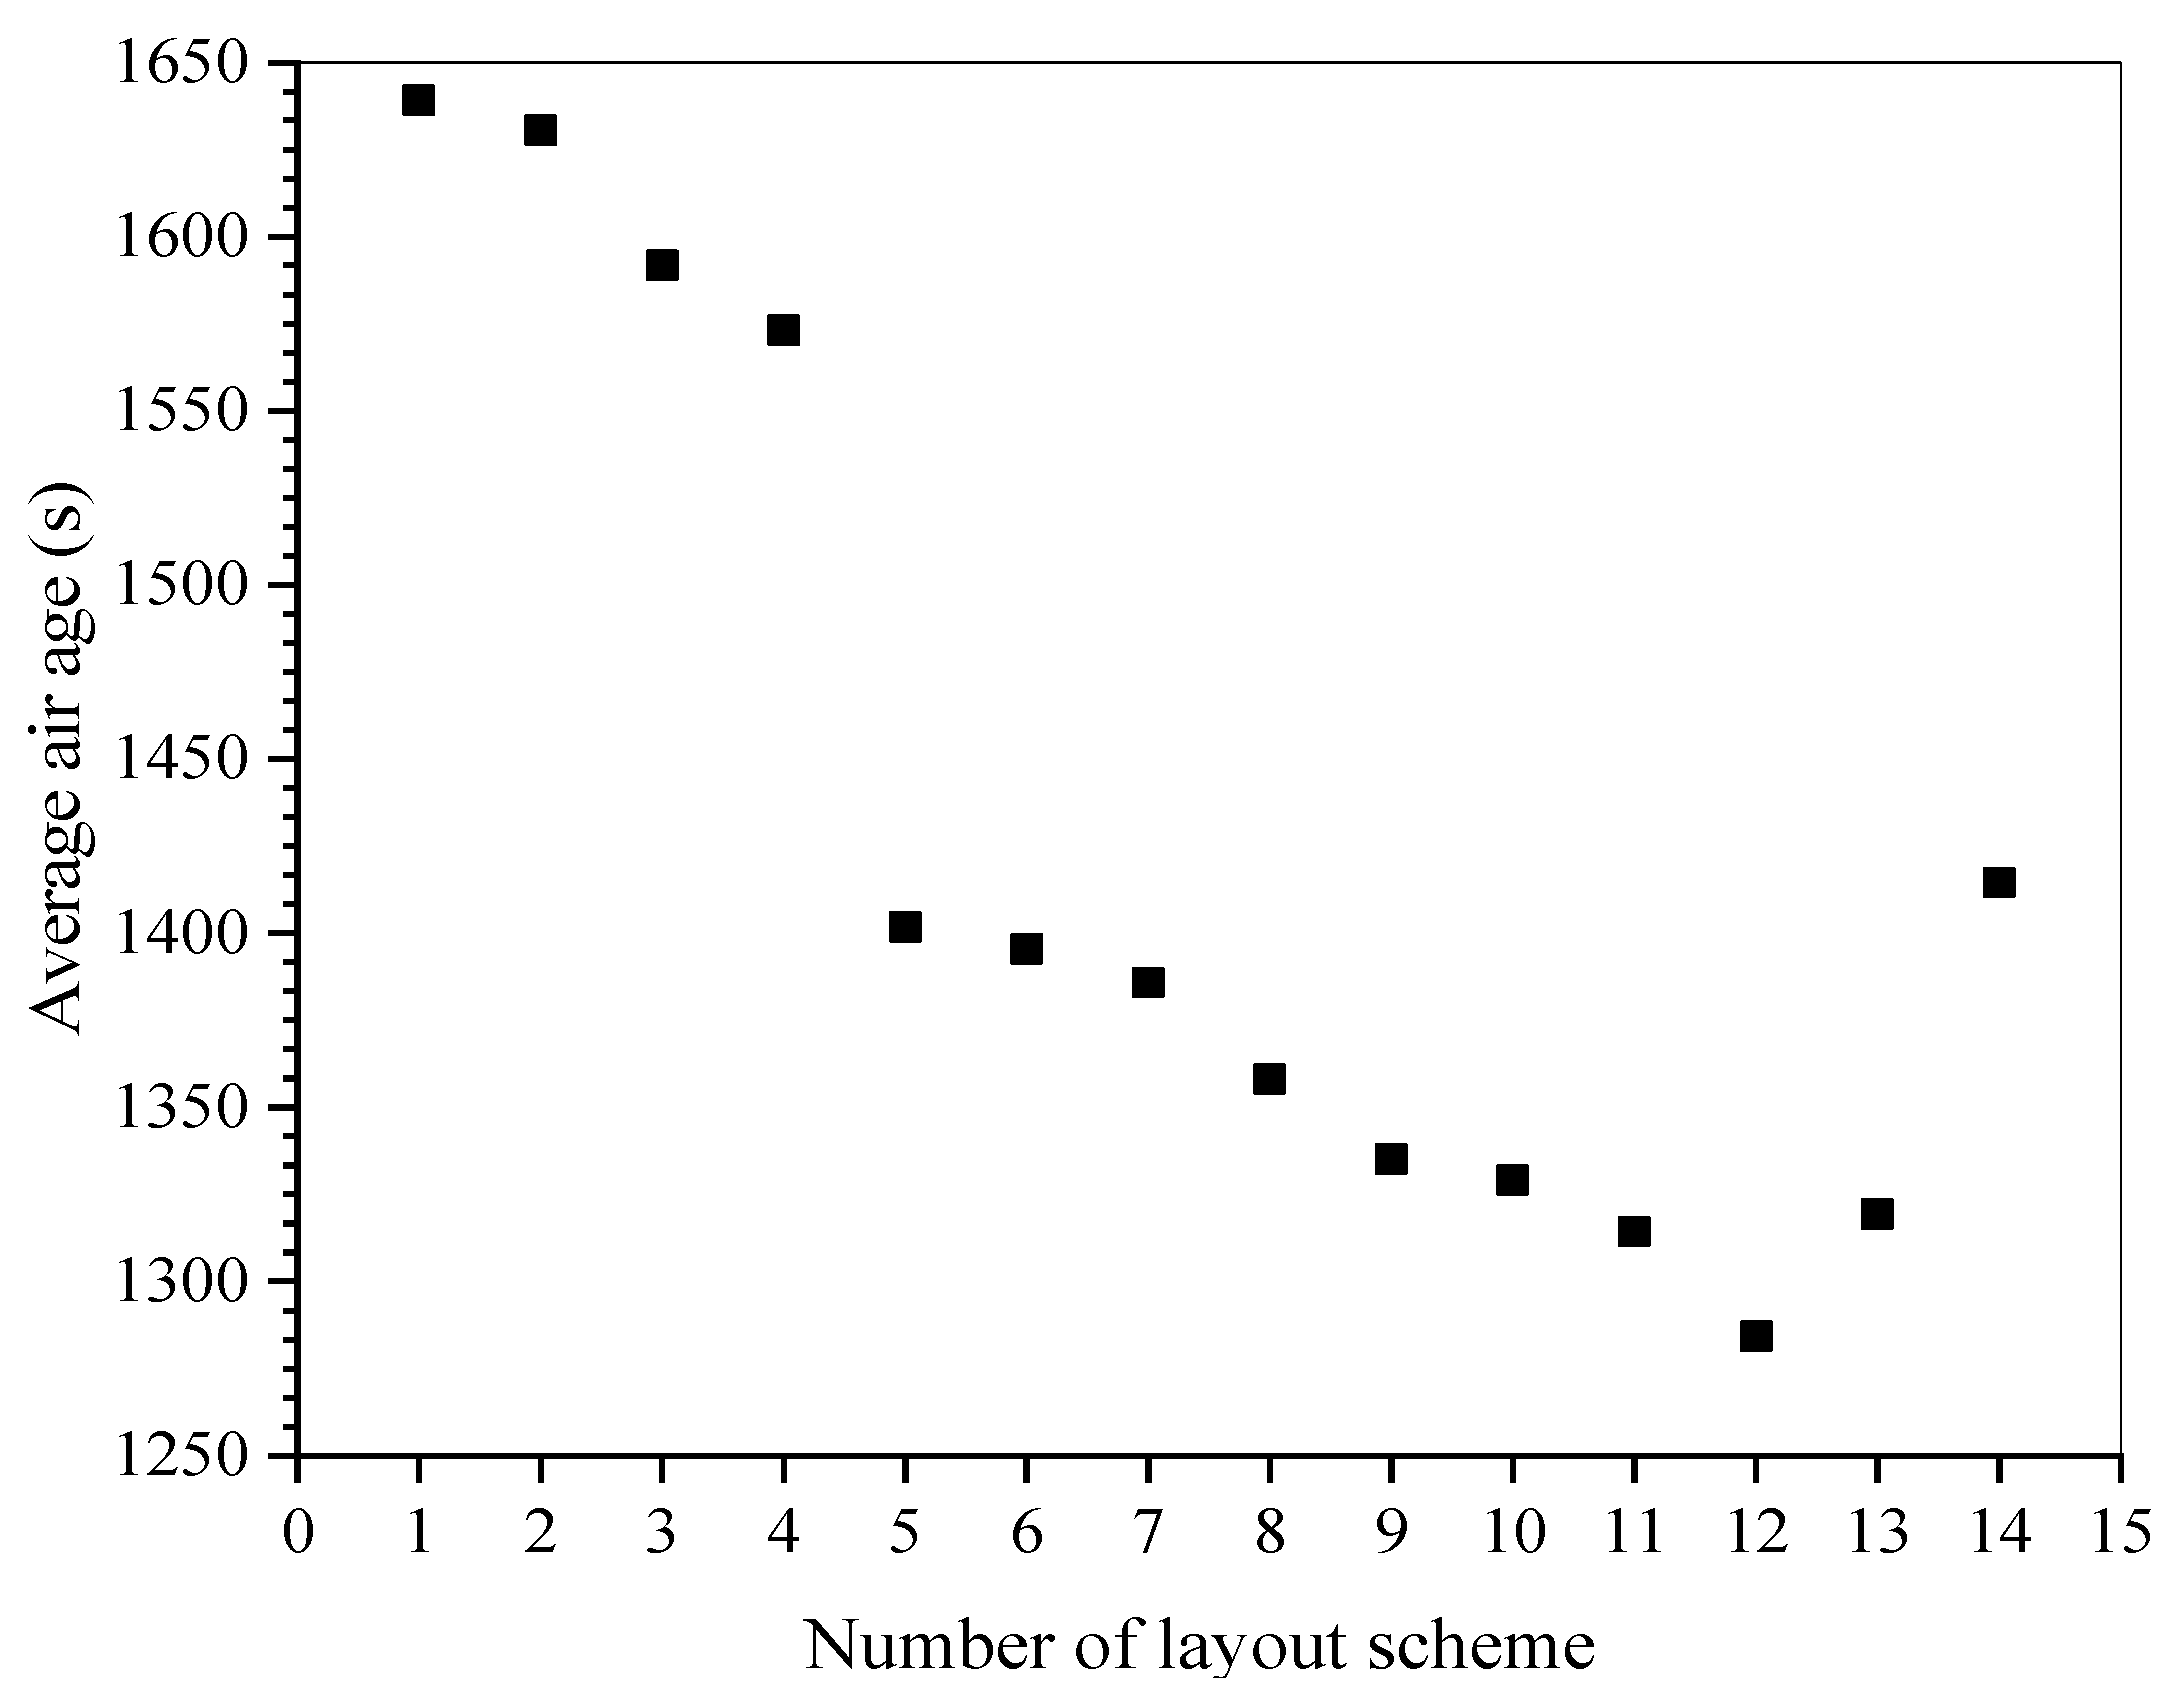
4.1. Initial Choice of Layout Schemes

In order to determine the optimal layout scheme, this work simulated fourteen layout schemes. The air age in the sample chamber is large because its airflow is farthest. Therefore, the average air age of fourteen sample rooms are compared in this work and the results are shown in Figure 4. It can be found in this picture that the maximum average air age is 1650 s and the minimum average air age is less than 1300 s. The first twelve layouts mainly change the outlet position instead of the outlet height, while the later three layouts mainly change the outlet height rather than the outlet position. Next, Table 1 and Figure 4 are analyzed, because export 3 is located in the sample room, so its position should be changed during the study but the positions of export 1 and 2 are not changed. Finally, by comparing schemes 3, 7, and 12, it can be seen that when the coordinate of export 3 x-axis increases, the coordinate of y-axis decreases, which decreases the average air age in the sample room. Moreover, through the comparison of schemes 12, 13, and 14, it can be seen that when the coordinate of outlet height decreases, the indoor air age of the sample room can be reduced, but the effect of reduction is inapparent compared to changing the outlet position.
Furthermore, this study selects layout schemes 1, 5, 12, 13, 14 for the five kinds of typical schemes for subsequent analysis and comparison.

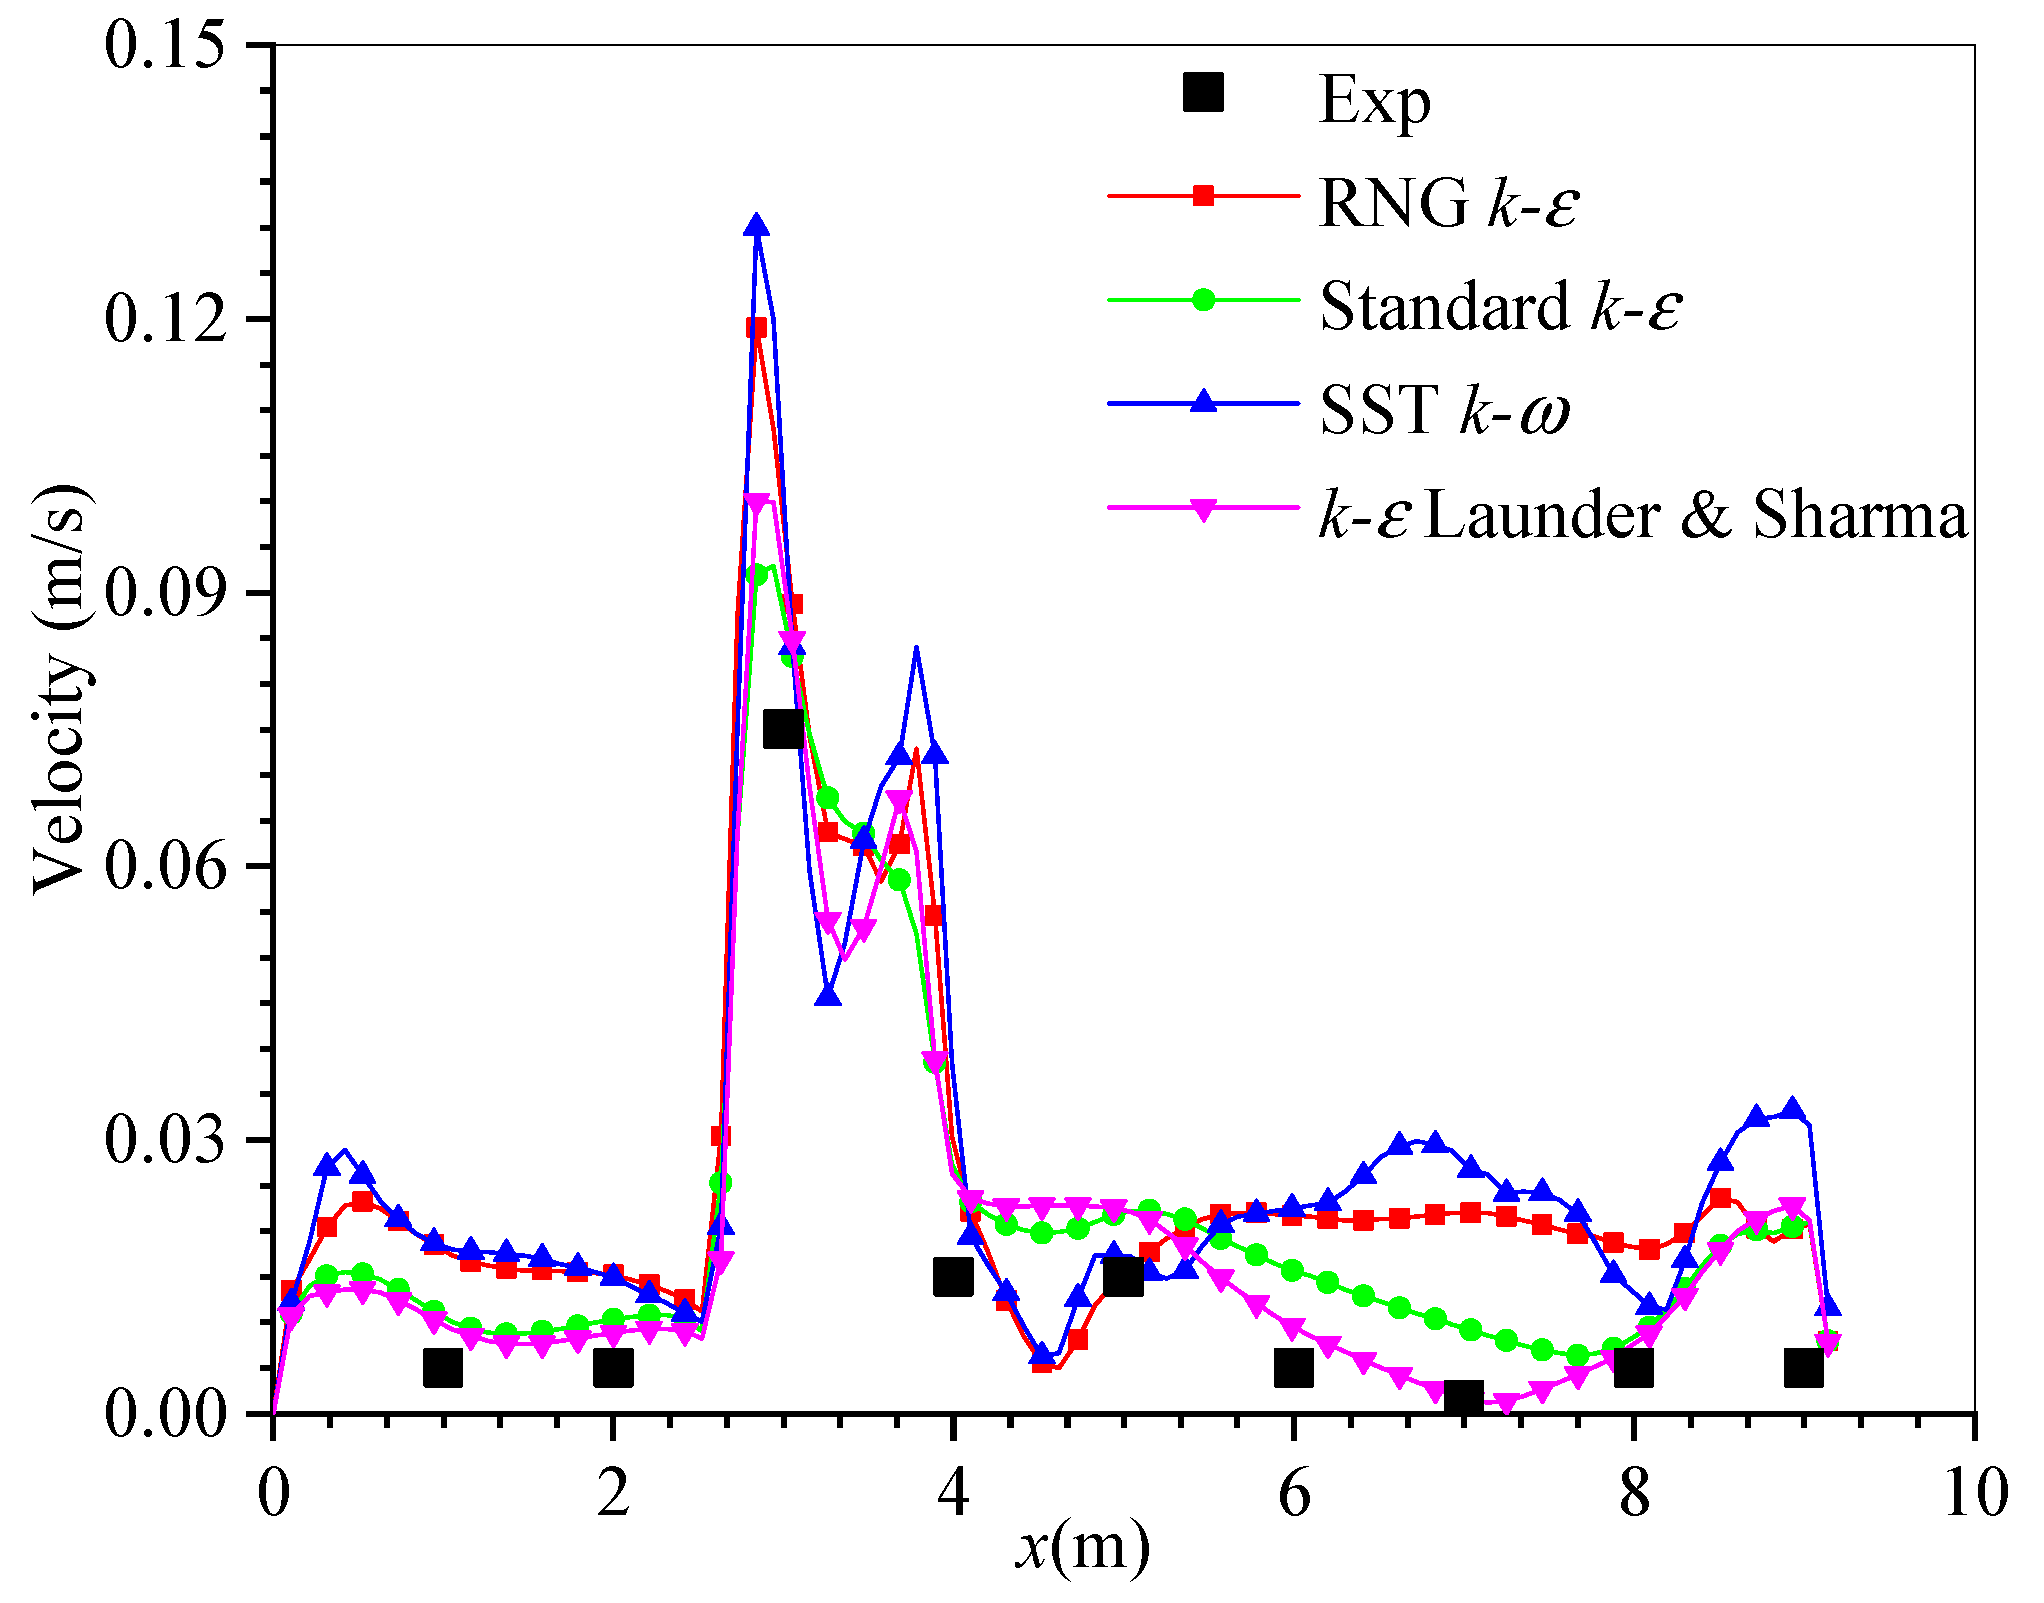
4.2. Sensitivity of Turbulence Models

The section y = 3.065 m close to the maze wall is the position where a radiation worker walks frequently. Here, 1.6 m (z = 1.6 m) height of breathing when standing was selected for velocity comparison, and the layout scheme 12 was selected for verification of different turbulence models. Figure 5 shows that the results of different turbulence models are consistent. Due to the influence of accuracy and position of the hot wire anemometer on air flow, the experimental value is low, and there is a specific error between practical value and simulation value, which is within the allowable error range. It can be seen from Figure 5 that when z = 1.6 m, the velocity distribution through the k-ε Launder and Sharmae model simulation results and experimental measurement results are in good agreement, therefore, this paper selects the k-ε Launder and Sharmae model for flow field simulation.

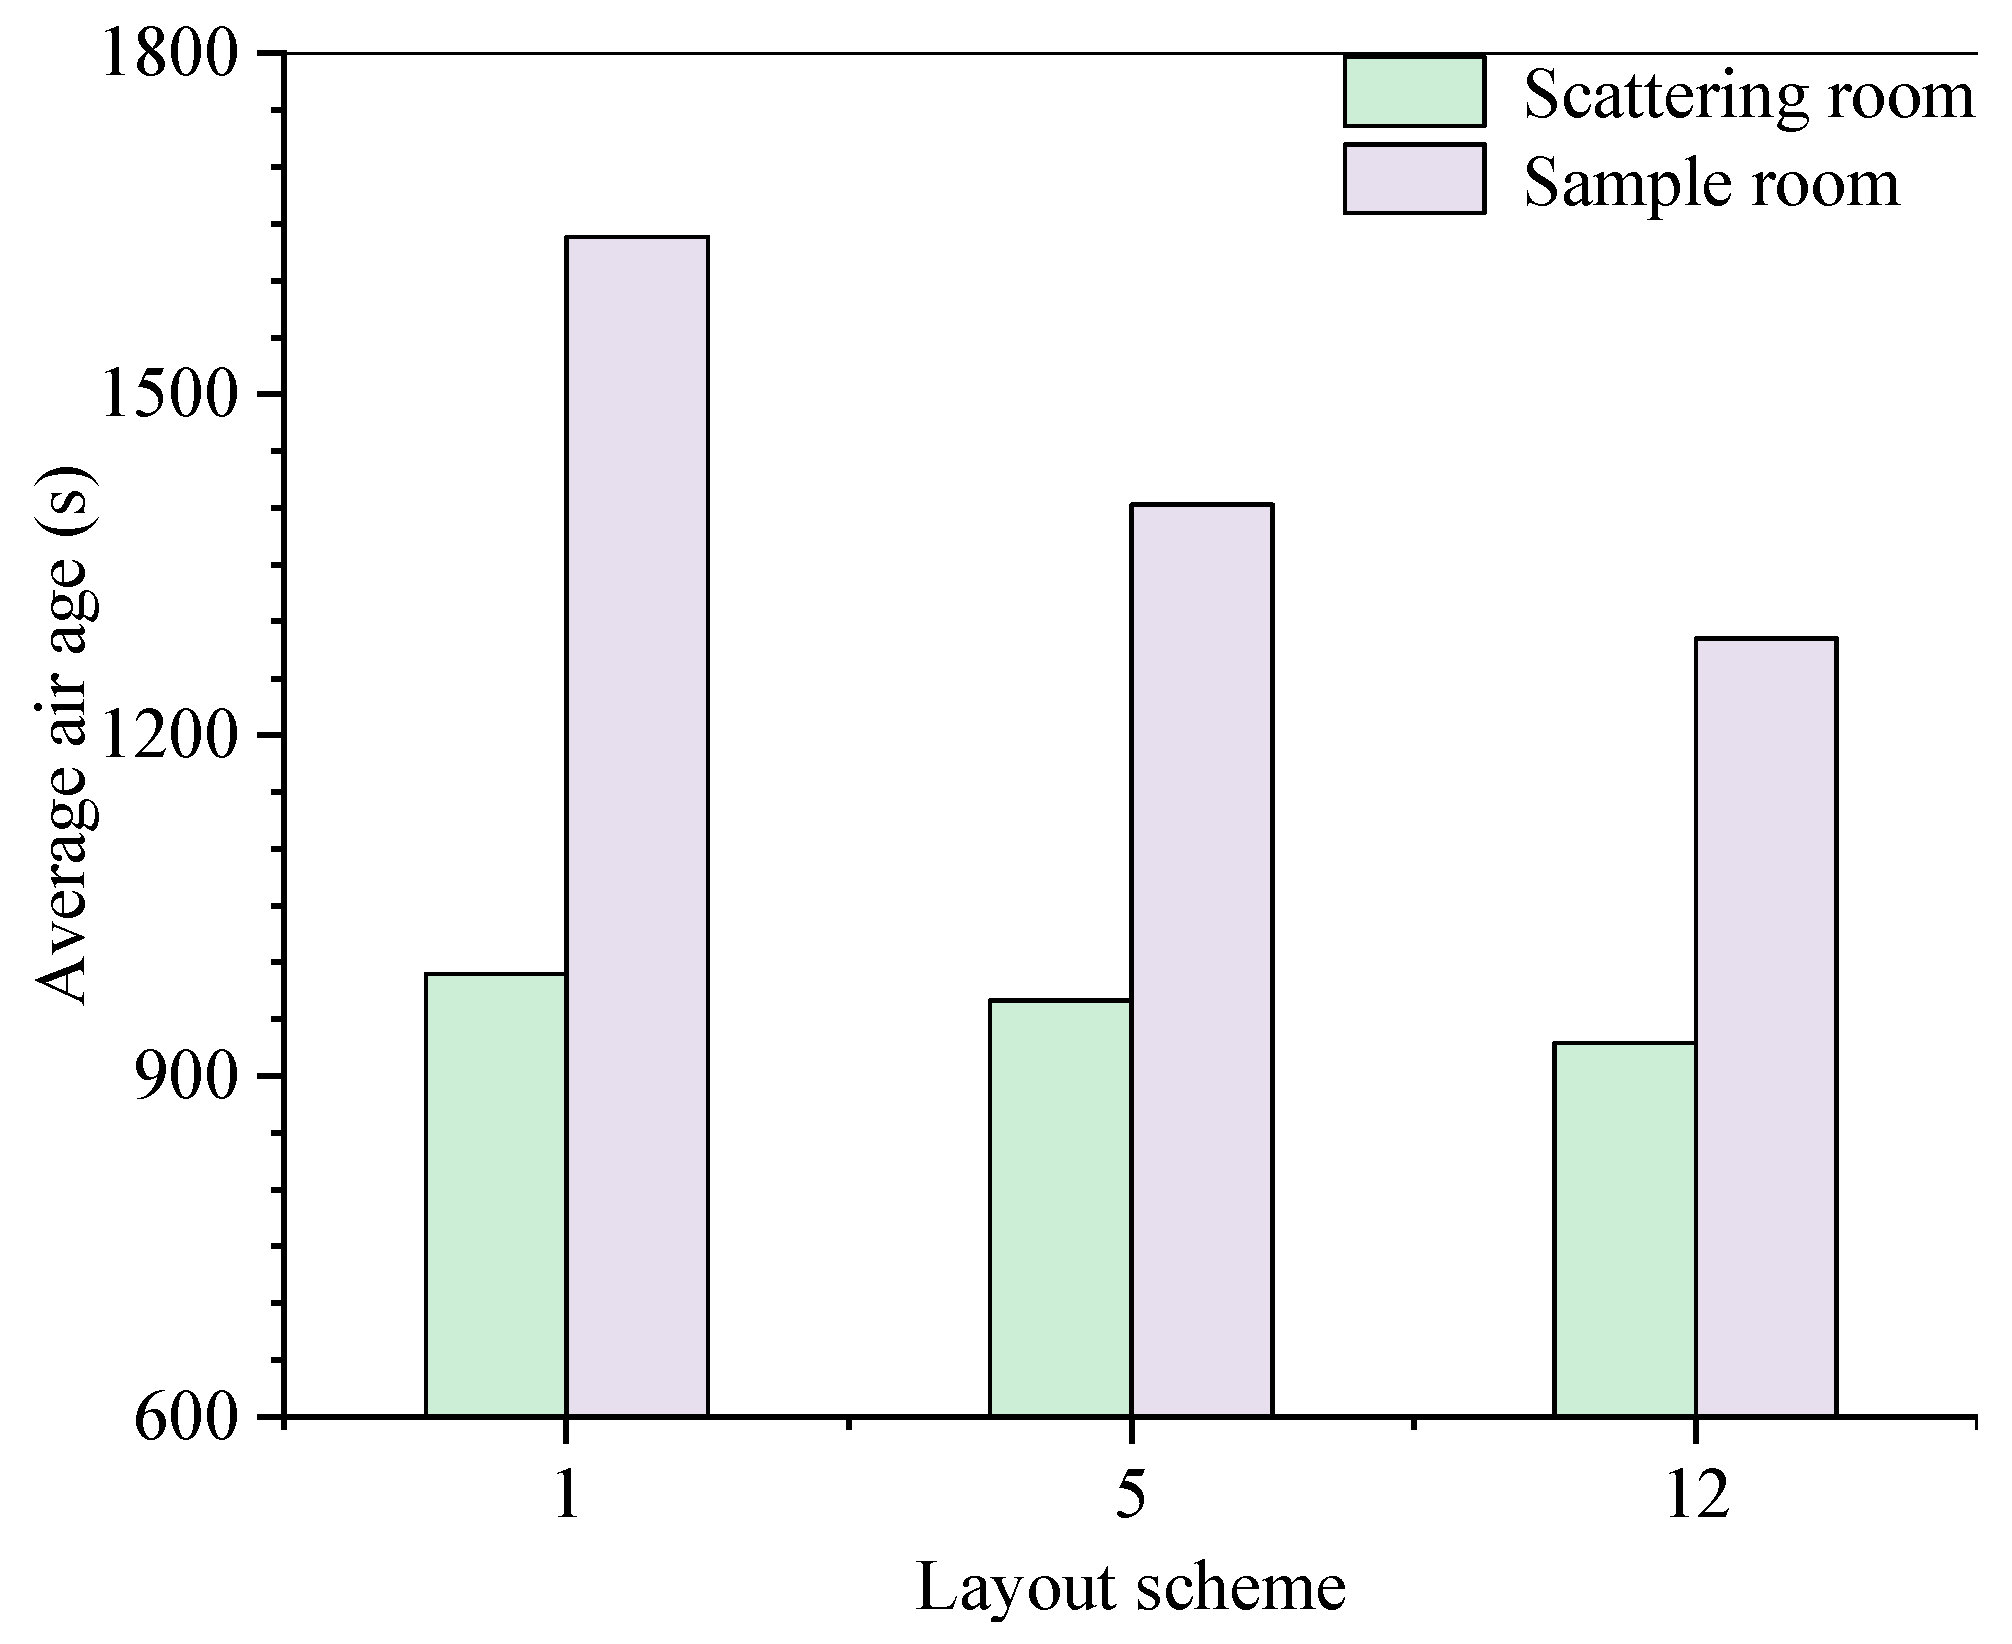
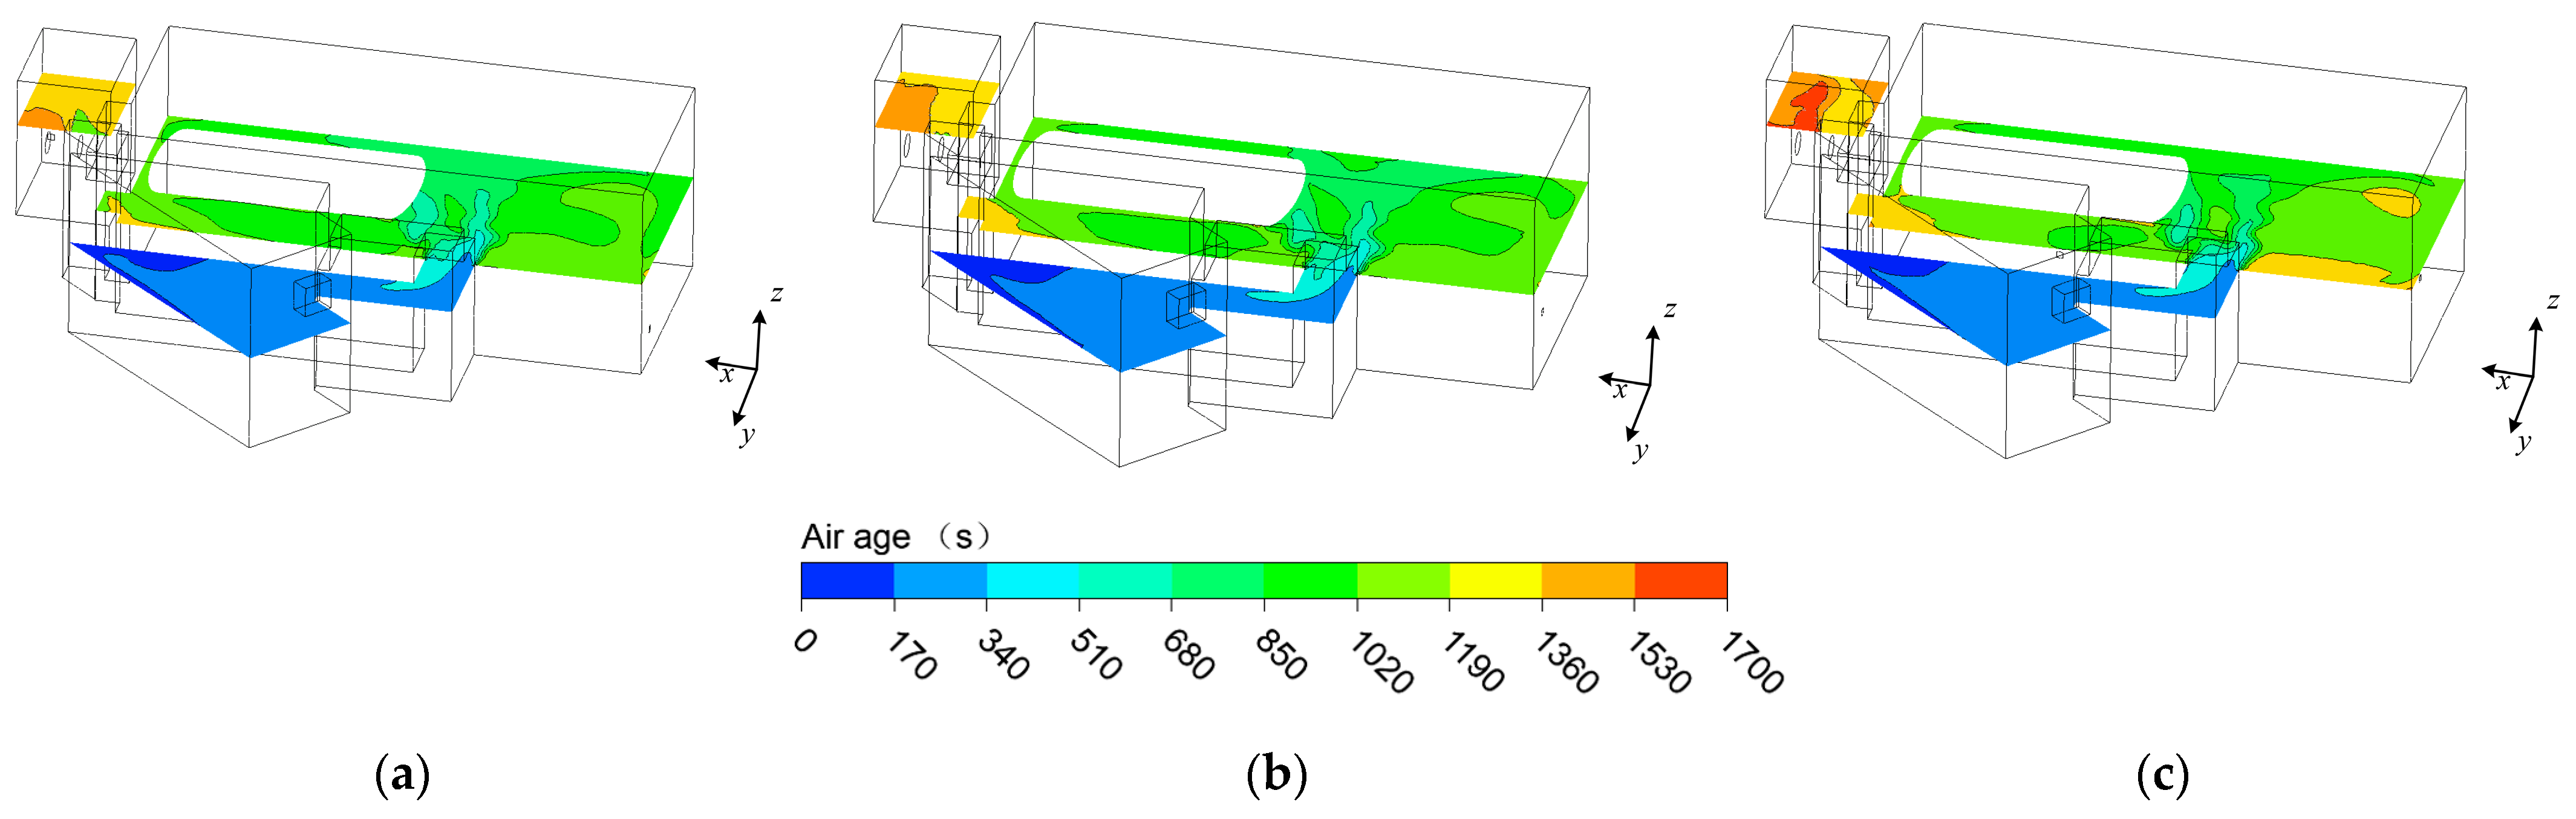
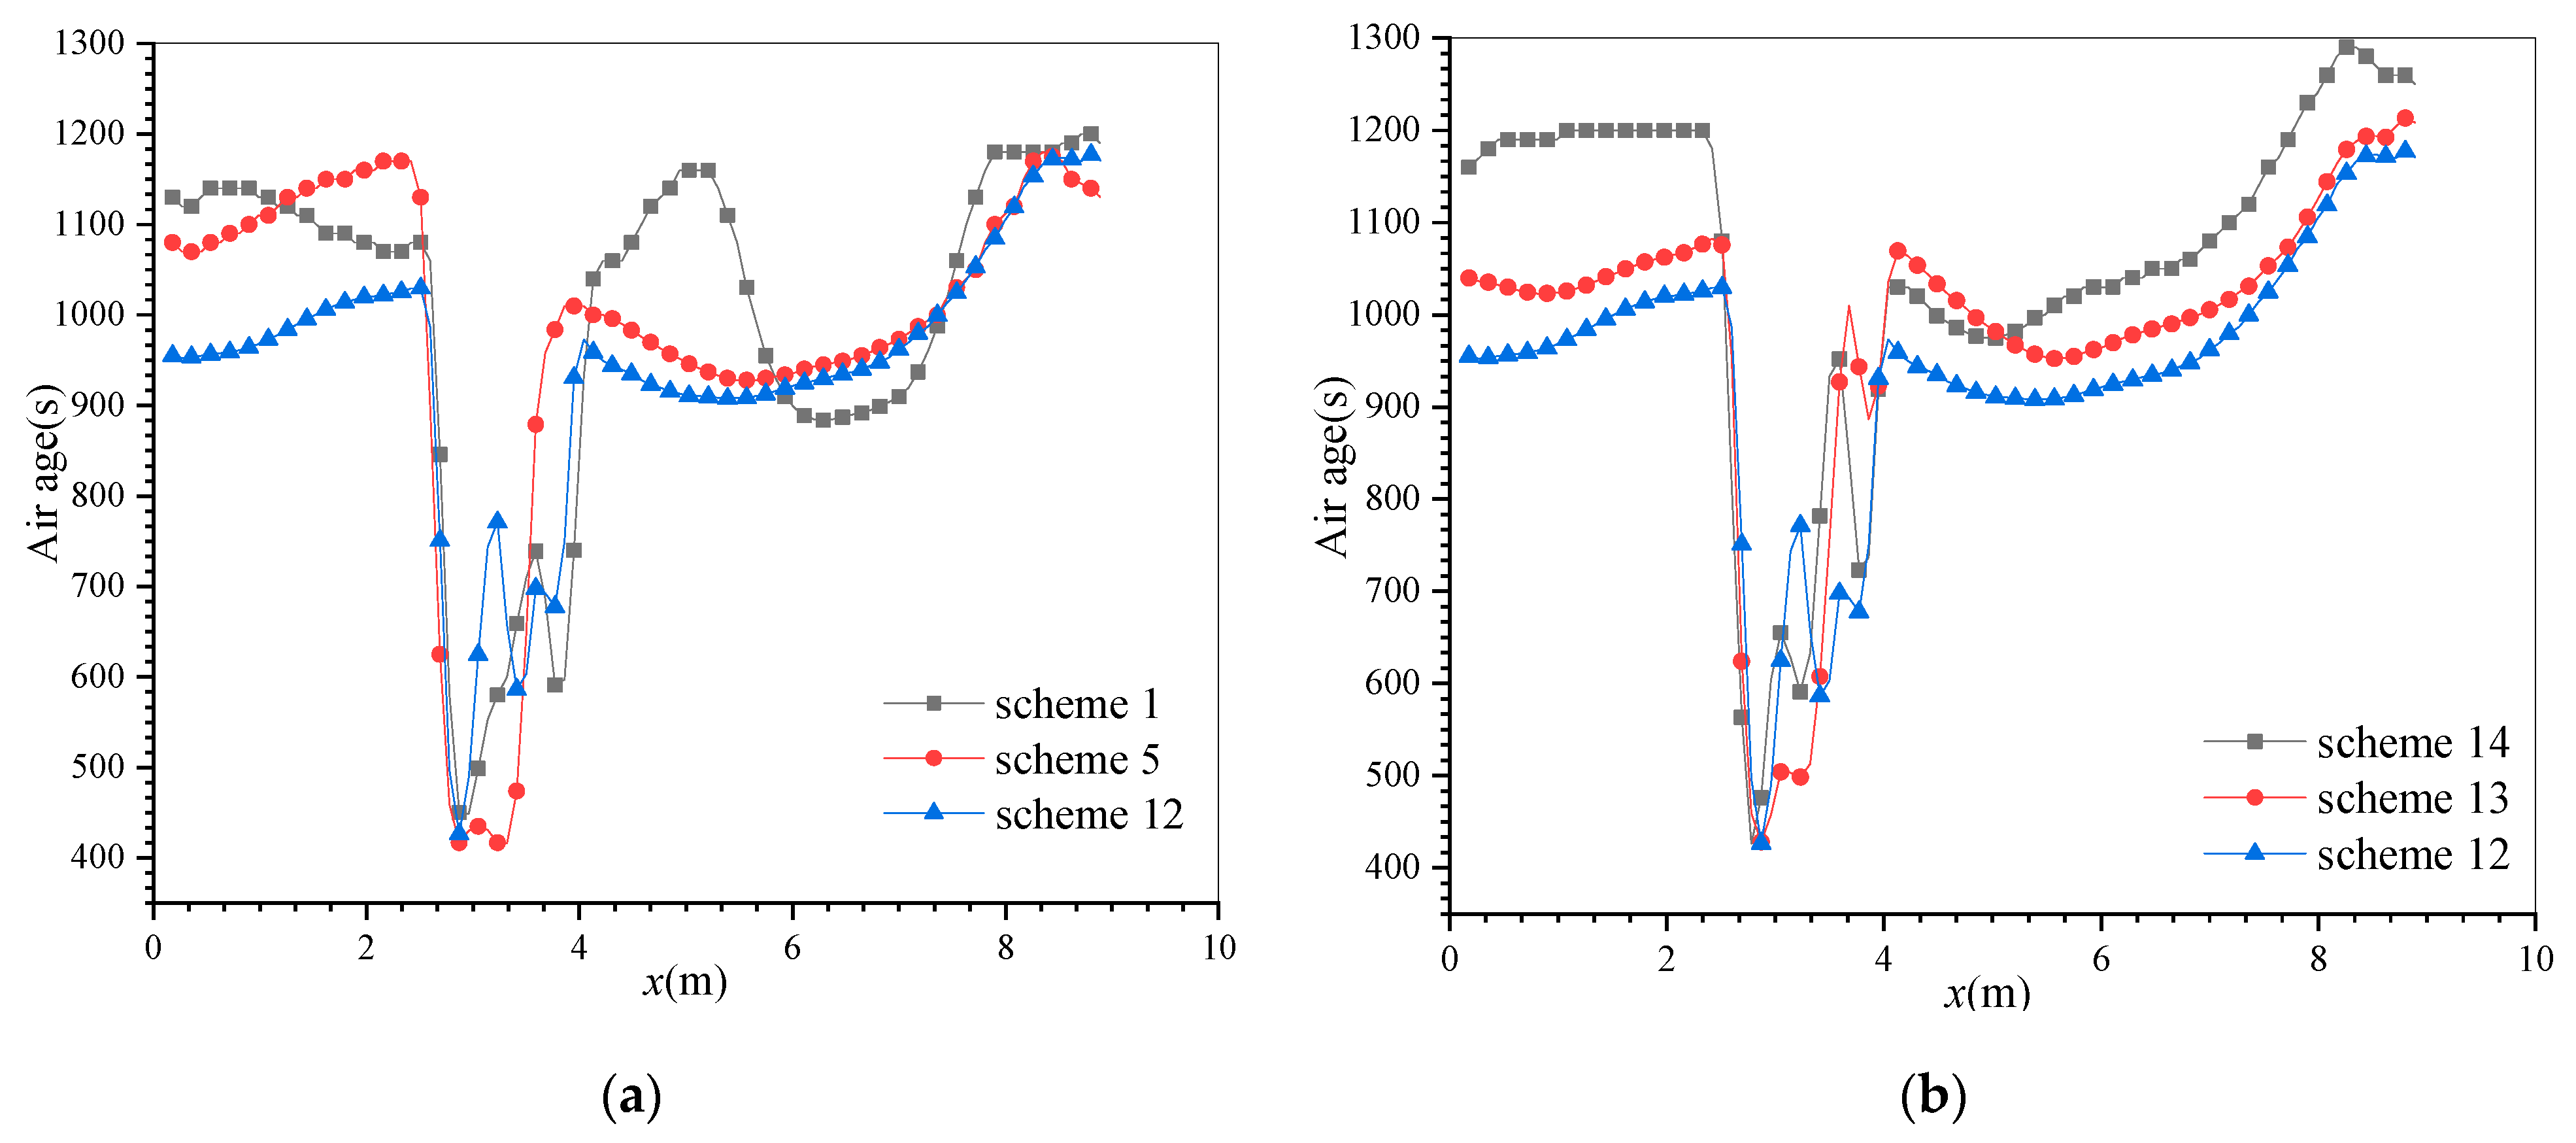
4.3. Analysis Based on the Influence of the Horizontal Position of an Outlet on Ventilation Effect

Due to the long working hours of a radiation worker being upright, the air quality of breathing should be guaranteed. Therefore, the air quality at cross-section z = 1.6 m was studied. Since the ground of sample room is 0.8 m higher than that of scattering room, the cross-section selected by sample room is as the same. The position of 1, 5, and 12 outlet is different. Figure 6 is the velocity contour of layout scheme 12. As the velocity of three layout schemes was roughly similar, the layout scheme 1 is displayed. Fresh air flows from the inlet, so the flow velocity at the inlet is the largest. Since inlet is higher than the cross-section, the inflow wind hits the maze wall and spreads downward, so the flow velocity at the triangle in the figure is the largest, avoiding the pedestrian route. In order to stabilize the air velocity in the scattering room and sample room, the labyrinth channel is increased and the rate is continuously attenuated during the flow. Since the scattering cavity blocks the airflow, the airflow velocity near the south wall and scattering cavity is basically 0~0.02 m/s, while the cross-section at the door of the sample room becomes smaller and the flow velocity increases, so the flow velocity is 0.04~0.06 m/s. The airflow velocity in the working area is less than 0.3 m/s, which meets the requirements of ISO 7730 [32].
The indoor air age distribution of three layout schemes (the scattering room z = 1.6 m and the sample room z = 2.4 m) are shown in Figure 7 where it can be seen that the most miniature air age is at the inlet and labyrinth channel, and the largest is in the sample room. By the comparison of Figure 7a,c, it can be found that the air age of the layout scheme 12 is relatively small. The change of outlet 3 decreases the air age of sample room and the transformation of outlet 2 reduces air age of the scattering room. The air age of the scattering room was small so the reduction has a non-significant influence on the scattering room. Therefore, layout scheme 12 which reduces air retention time is more conducive to indoor air circulation.
Figure 8 shows the comparison of average air age indoors. It can be seen in Figure 8 that changing the layout scheme of the scattering room does not have much effect on reduction of air age. It can be concluded through calculating that compared with air ages in layout scheme 12, the air ages of scattering rooms in layout schemes 1 and 5 are 4 to 7 percent higher, and air ages of sample rooms are 9 to 27 percent higher. Therefore, layout scheme 12 air flow is better and the air is fresher.
Figure 9 shows the comparison of velocity and air age under the non-uniformity coefficient. It can be seen from Figure 9 that the velocity non-uniformity coefficient is the smallest in the scattering room and sample room of layout scheme 12. The velocity non-uniformity coefficient of the scattering room in layout schemes 1 and 5 are 11 and 20 percent, respectively, higher than that in layout scheme 12. Moreover, their velocity non-uniformity coefficient of sample room is 54 and 7 percent, respectively, and more heightened than that in layout scheme 12. The air age non-uniformity coefficient of scattering room in layout schemes 1 and 5 is 1 and 6 percent, respectively, higher than that in layout scheme 12. Their air age non-uniformity coefficient of the sample room is 2 and 16 times, respectively, and more elevated than that in layout scheme 12. In conclusion, the uniformity of velocity and air age in layout scheme 12 is better than 1 and 5, therefore, it is suggested to select layout scheme 12 as the first choice.

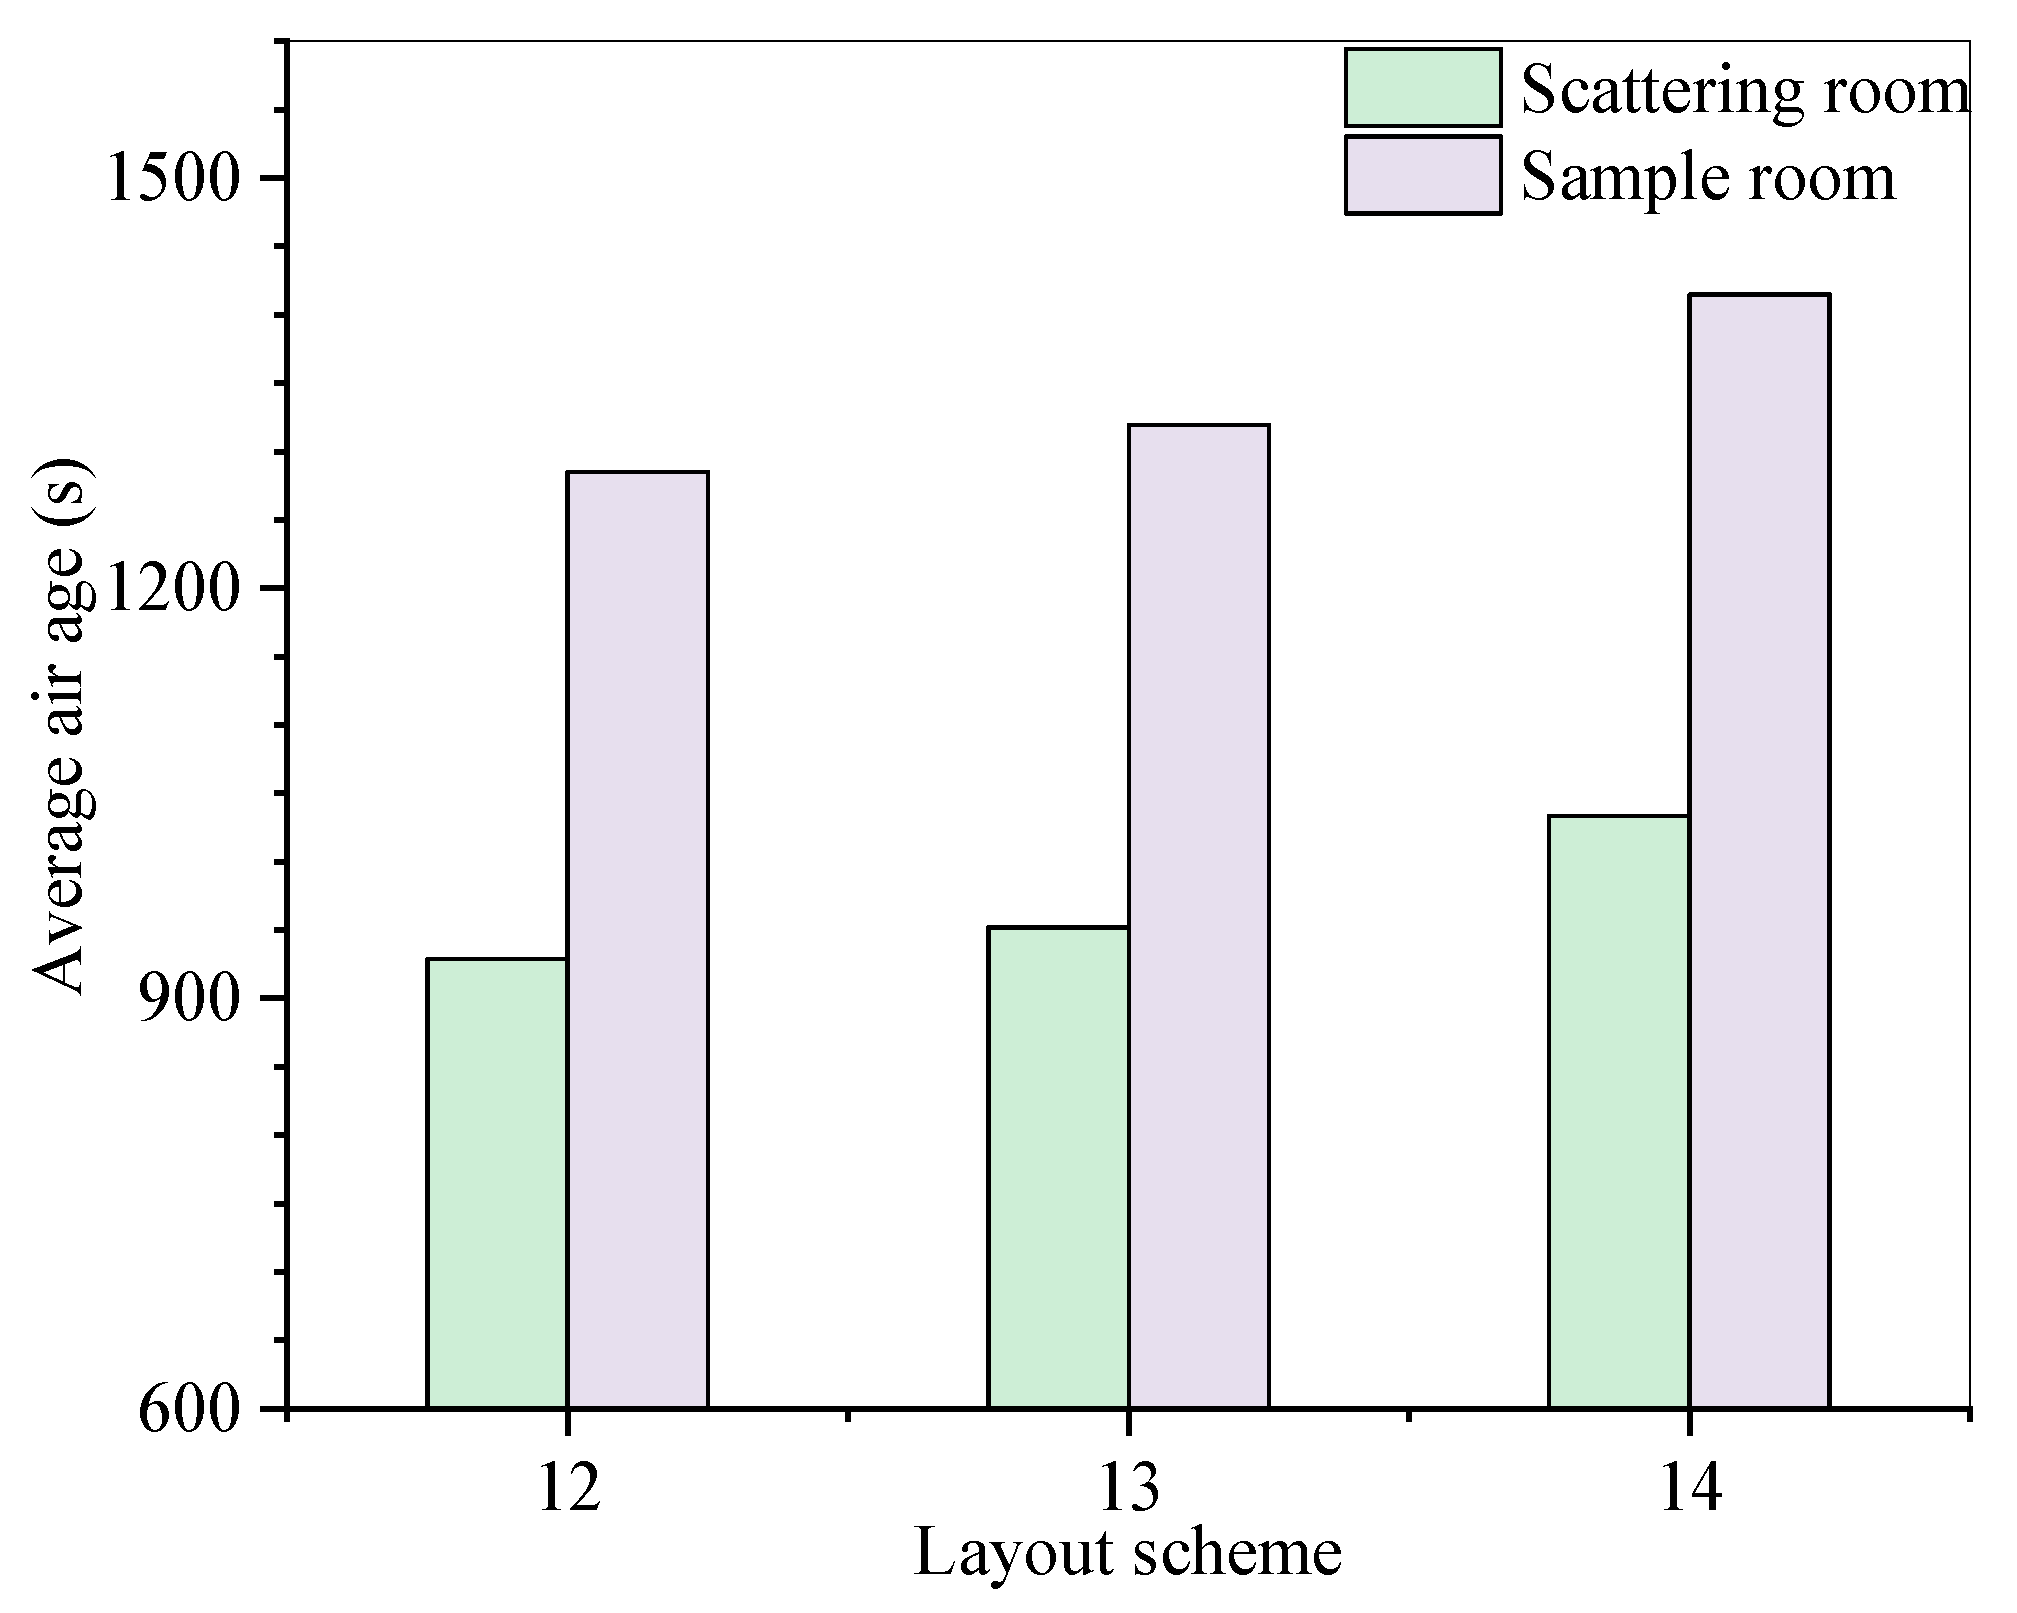
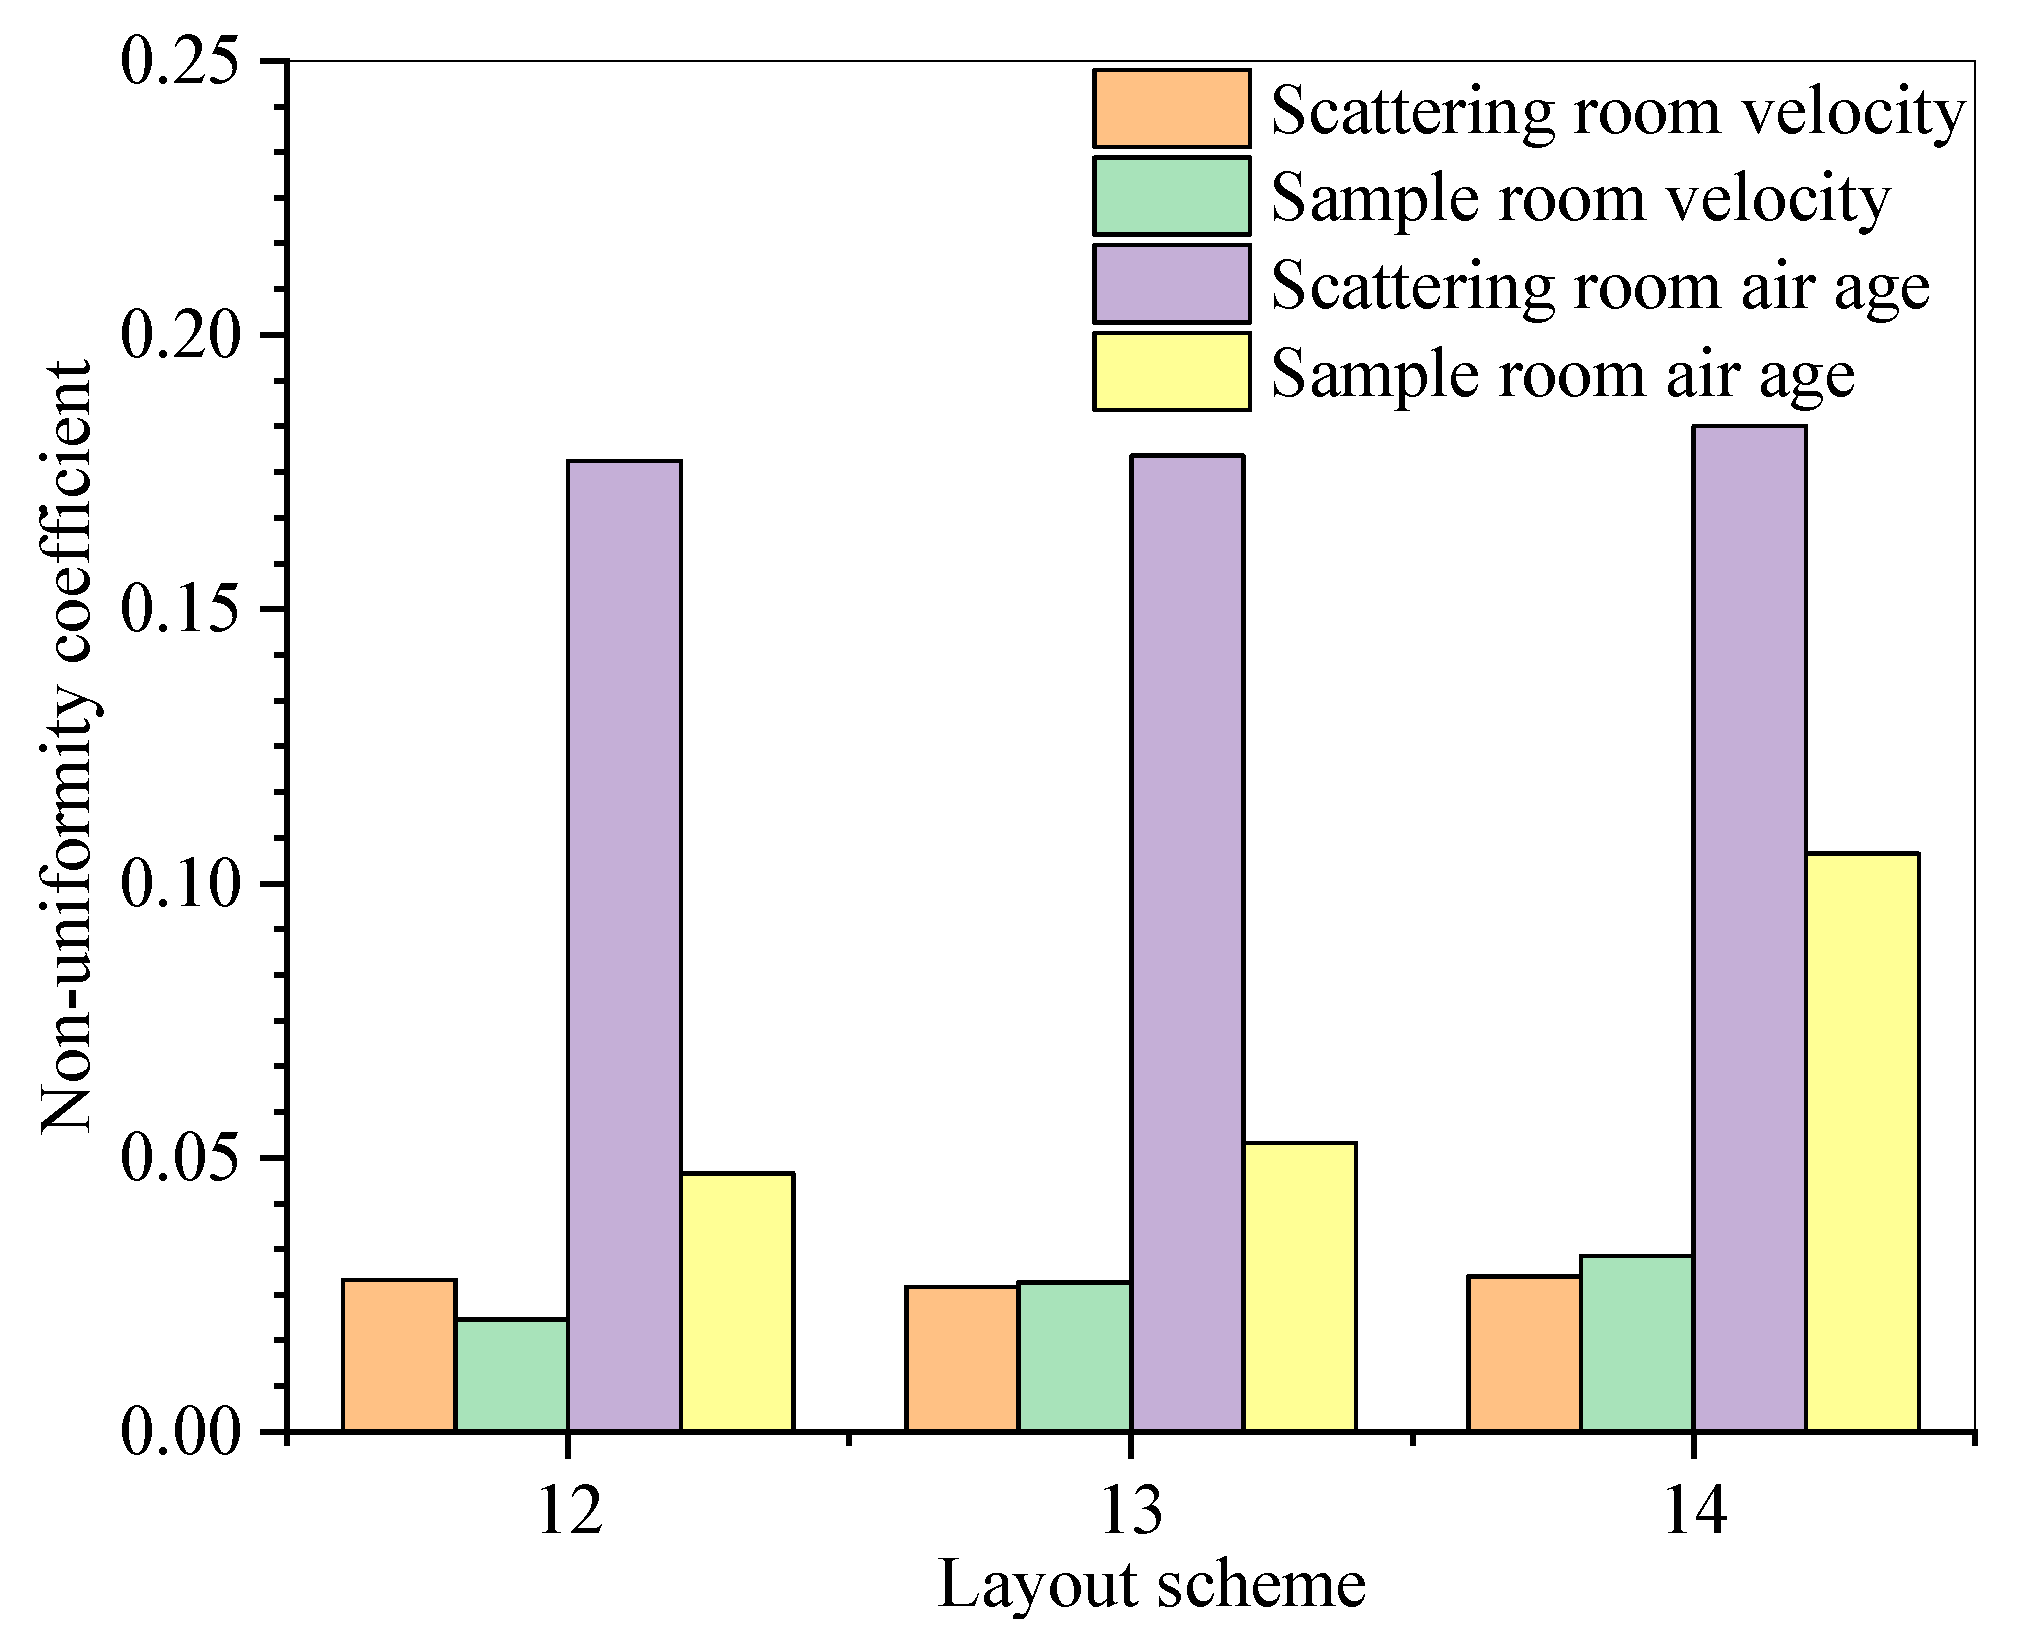
4.4. Analysis Based on the Influence of Outlet Height on Ventilation Effect

Based on the above research, the influence of three different heights of outlet on indoor air quality was studied by layout scheme 12, and air quality of breathing height (the scattering room z = 1.6 m and the sample room z = 2.4 m) of an indoor radiation worker when standing was observed. The three outlet heights are consistent, and three different heights are set for comparison. The low outlet height is 0.5 m (layout scheme 12), middle outlet height is 1 m (layout scheme 13), high outlet height is 1.5 m (layout scheme 14). The velocity distribution is roughly similar and has no significant change, similar to Figure 5.
Figure 10 is the air age distribution at 1.6 m in room. Figure 10a,c is air age distribution of layout scheme 12, 13, and 14, respectively. It can be seen from Figure 10a,c that the increase of outlet height results in an extension in residence time of air indoor and increase of air age, which causes the poor air circulation and is not conducive to expel indoor air. Due to the maximum velocity at the entrance, the impact of airflow to the labyrinth channel will result in excessive velocity at the labyrinth wall, relatively short air residence time, and low air age. The highest point of air age is located in the sample room where the airflow is the furthest, so the air age here is the largest. It can be seen by contour that the indoor air age at layout scheme 12, whose circulation is relatively preferable, is lower than that at layout scheme 13 and layout scheme 14.
Figure 11 presents the comparison of average air age among layout schemes in the sample room and scattering room. In the scattering room, the average air age of layout scheme 13 and layout scheme 14 are 2 and 11 percent higher than that of layout scheme 12. Moreover, the air retention time indoors of layout scheme 12 is shorter and the layout is relatively reasonable. In the sample room, the average air age of layout scheme 13 and layout scheme 14 is 3 and 10 percent higher than that of layout scheme 12. In general, layout scheme 12 has a better effect on indoor air circulation and ventilation.
Figure 12 shows the non-uniformity coefficient of velocity and air age among schemes in the scattering and sample rooms. In this figure, non-uniformity coefficients of velocity among three schemes in the scattering and sample rooms are especially small and their velocity is uniform. Besides, non-uniformity coefficients of air age among the three schemes in the scattering room are basically the same. However, in sample room, the non-uniformity coefficients of air age at layout scheme 13 and layout scheme 14 are 12 and 124 percent higher than that at layout scheme 12. Therefore, according to the above research, it is recommended to select layout scheme 12.

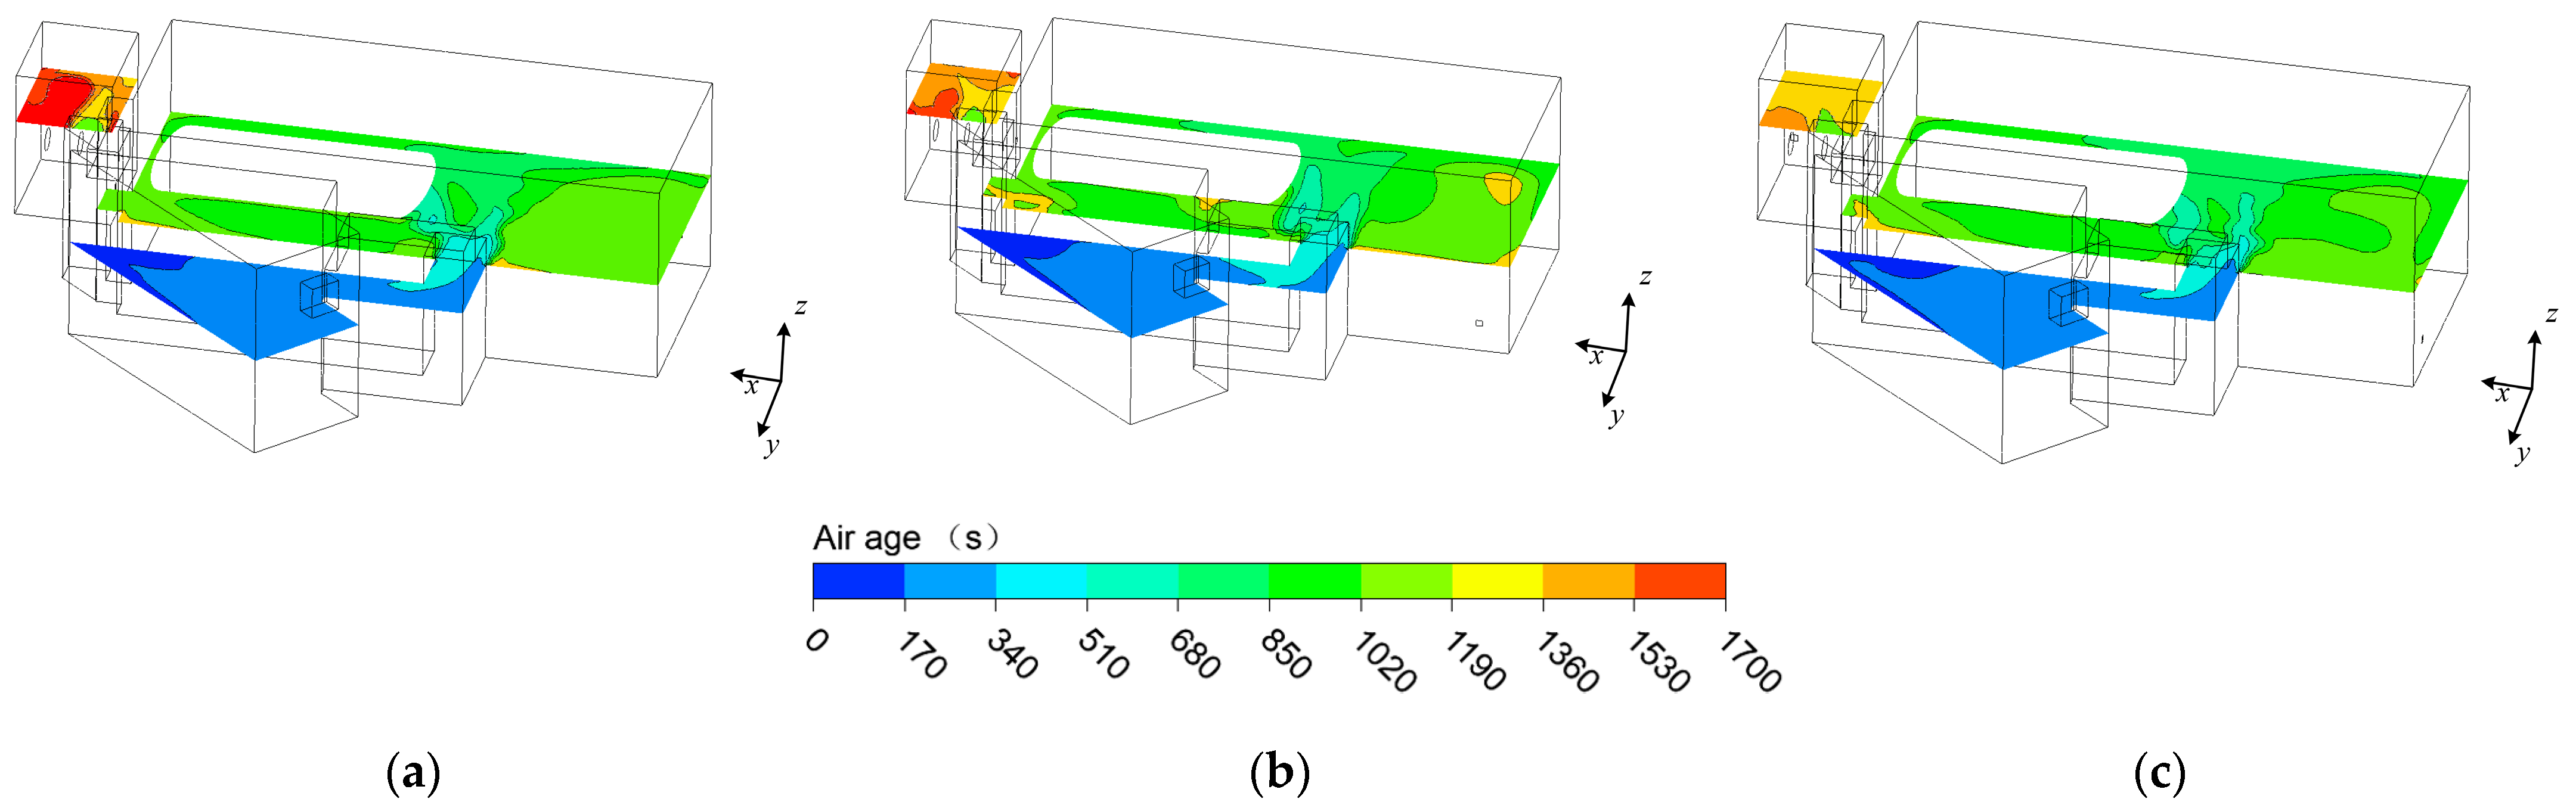
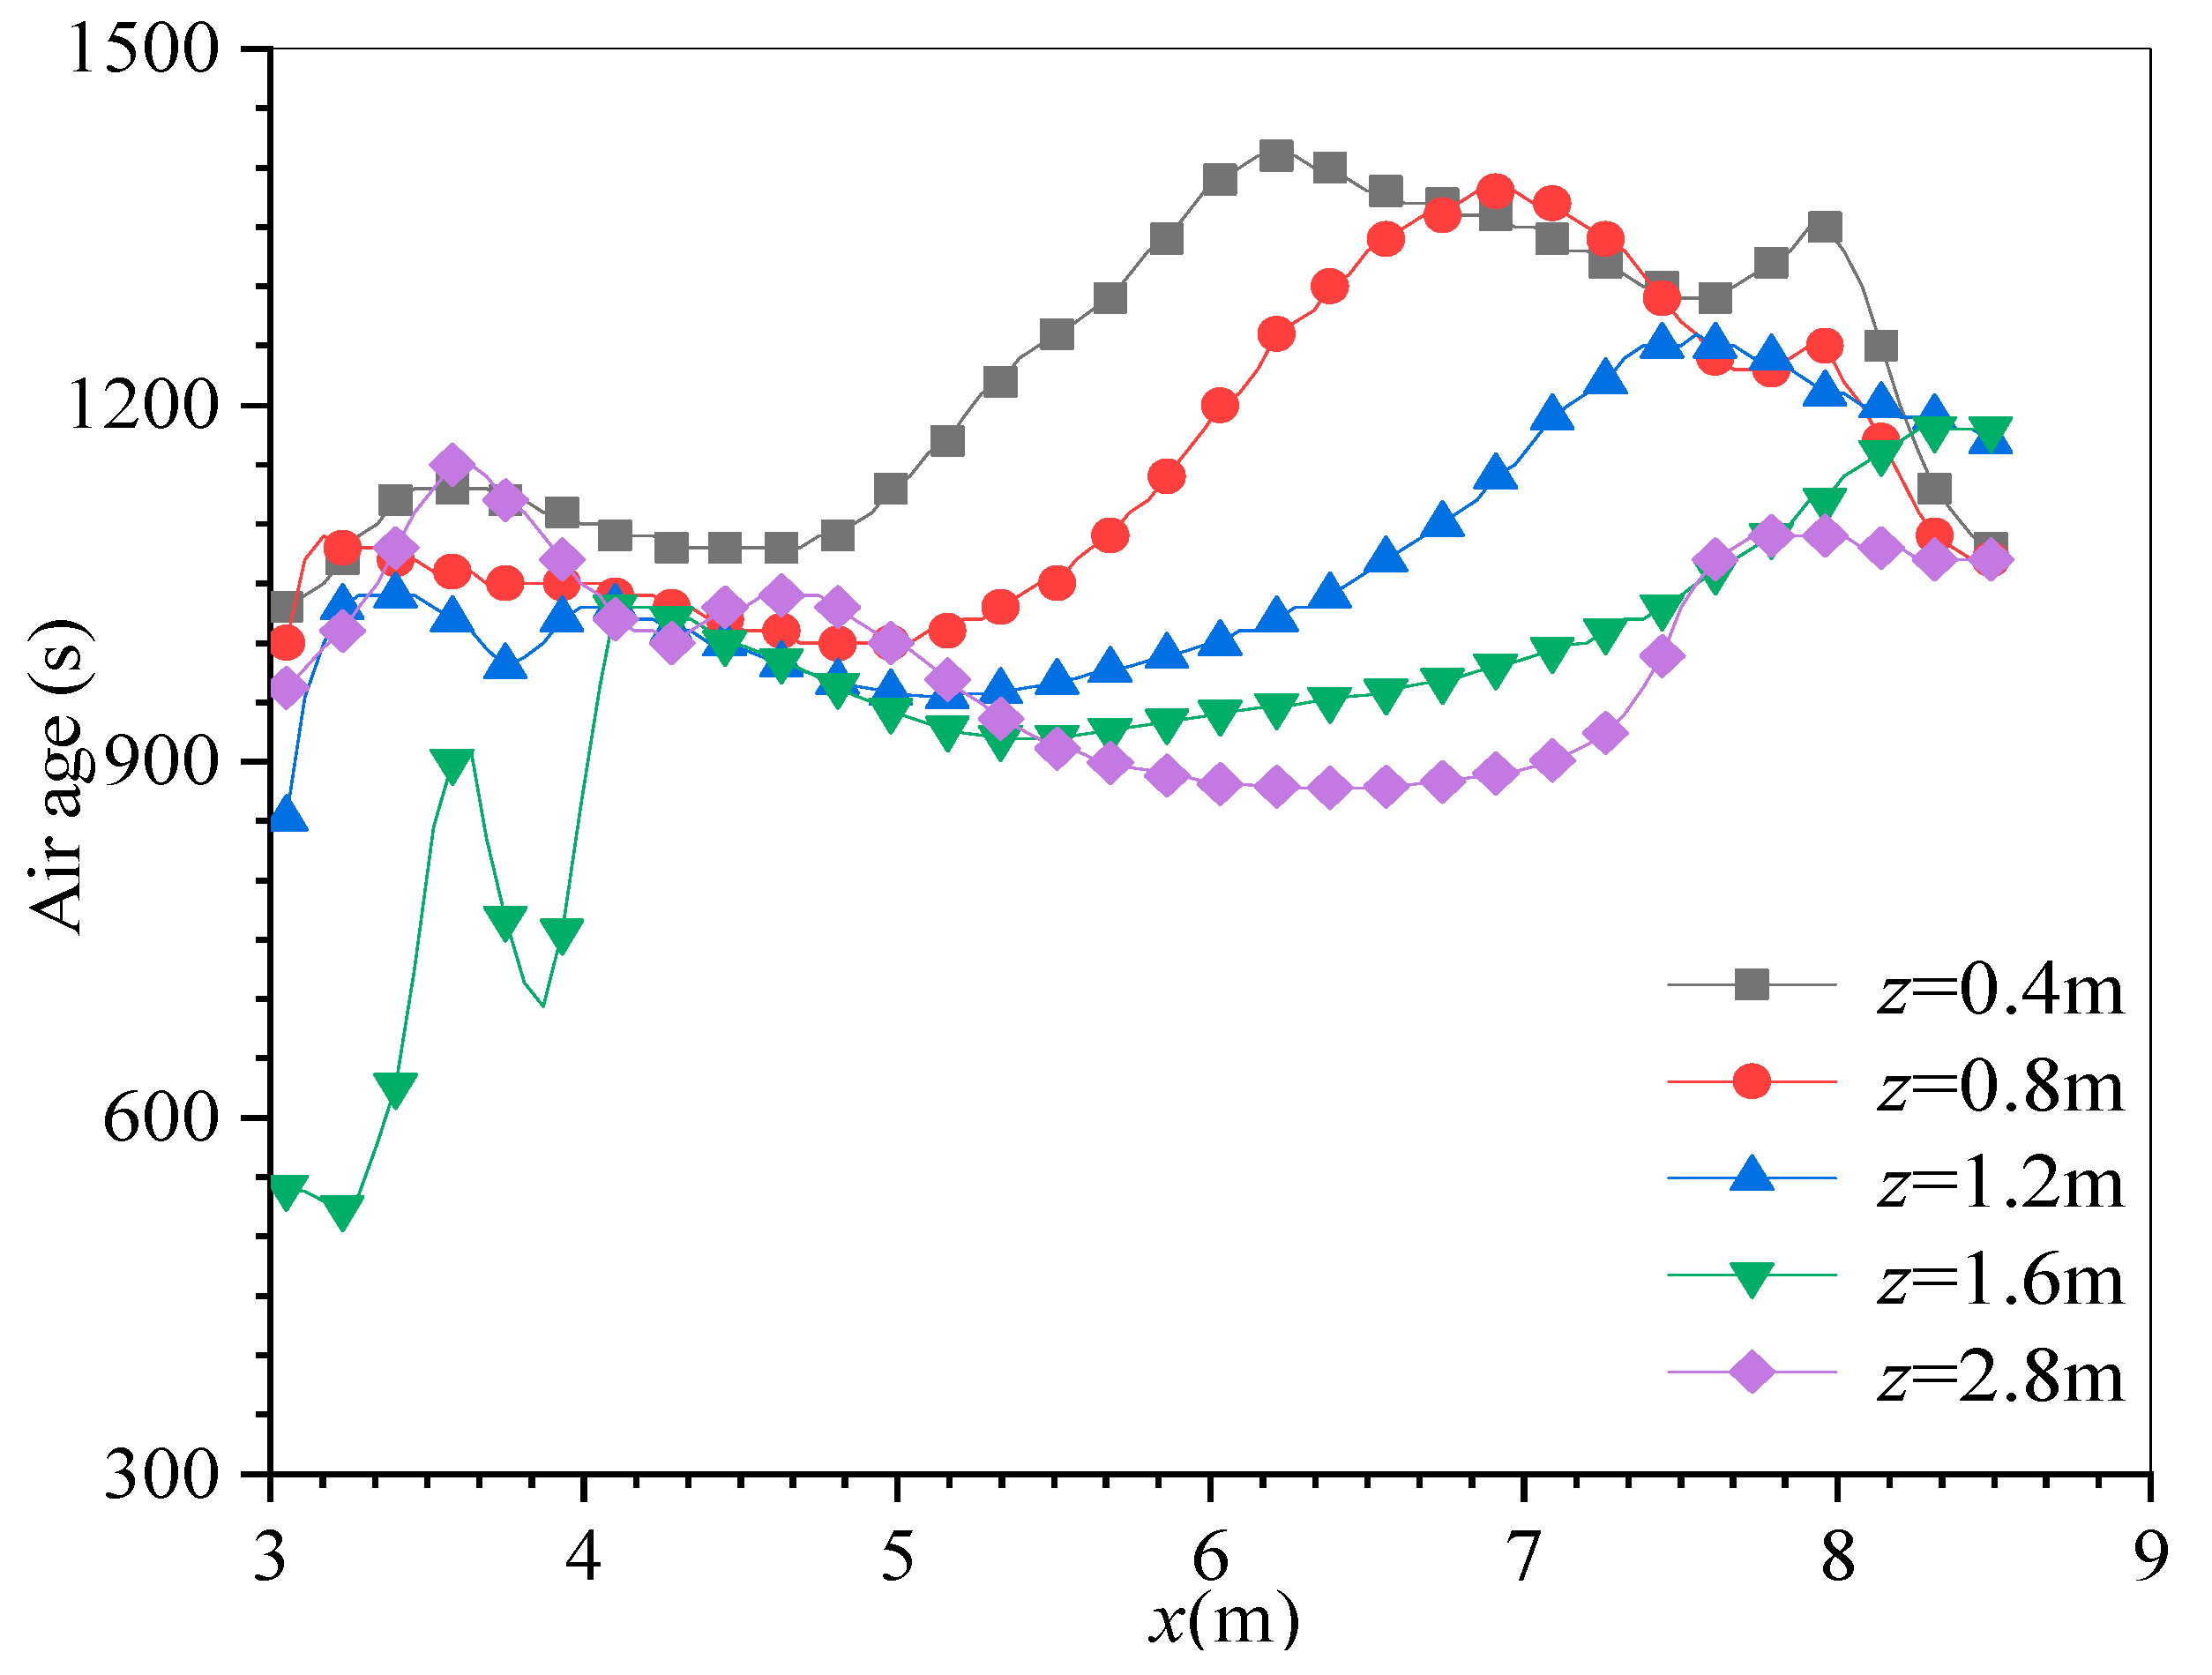
4.5. Distribution of Air Age at Different Heights

The path that people often work and walk on is 0.6 m (y = 3.065) near the maze wall in the scattering room and was marked in Figure 1. The air age changes in different outlet layout schemes at standard breathing height are shown in Figure 13.
It can be seen in Figure 13a that the air age of layout scheme 12 at 0 to 2 m is lower than layout scheme 1 and 5, therefore, the circulation is relatively well. Due to too much wind at the door, the air age at 2 to 4 m is so small that it is not considered. In the layout scheme 1, the outlet 3 is arranged near the door of the sample room, so it has a large fluctuation on the air age of 4 to 9 m. The scattering cavity is arranged at the place where air age reduced, and the cross-sectional area of flowing is decreased, which results in an increase in the flow and a diminution in the air age. The outlet 3 of layout scheme 5 moves 0.665 m in the negative direction of the y-axis relative to the outlet 3 of layout scheme 1, so its influence on the scattering room is reduced. The outlet 3 of layout scheme 12 is located directly opposite the door of the sample room, and there is no large eddy current, therefore, the flow is good. Figure 13b shows that the air age decreases with the decline of outlet height between 0 to 2 m and 4 to 9 m, which proves that layout scheme 12 is better for air circulation.
The results of air age at different heights on the path are shown in Figure 14. Select layout scheme 12 to study. Select the height of 0.4 m as a radiation worker to detect maintenance and observe the height of breathing under the scattering cavity. Select the height of 0.8 m as radiation worker squat breathing height. Select the height of 1.2 m to represent a radiation worker sitting and breathing. Select the height of 1.6 m to represent the radiation worker standing and breathing. Select the height of 2.8 m as the height of the radiation worker to detect maintenance and observe the upper scattering cavity breathing.
The cross-section x = 3 m is the position of the scattering room door. As airflow flowing through the labyrinth channel comes from the scattering room door to the scattering room, the air age here is the lowest on the walking route of the scattering room. As outlet 1 is located on the left side of the scattering room door, the air age decreases slightly at x = 4~5 m. On the left side of outlet 1, because there is no vent, air can only flow into the sample chamber. The air residence time and air age both are increasing. Due to the scattering cavity, the airflow velocity near the scattering cavity and the south wall of the scattering room increases with the enhancement of height, and air age decreases with increase of height. From the overall Figure 14, it can be seen that air age at z = 1.6 m is lower than that at z = 0.4 m, 0.8 m, and 1.2 m. The highest air age at z = 1.6 m is less than 10–40% compared with air age at 0.4 m, which meets the minimum requirement of air age at standing breathing height of a radiation worker.

5. Conclusions

In this project, different ventilation design schemes of the CSNS scattering room and sample room were compared. The influence of the outlet on air quality was studied by numerical simulation, and air quality was evaluated based on air age and non-uniformity. The main conclusions are as follows:
  • When the outlet position 1 is arranged in the middle of the scattering chamber door and sample chamber door, outlet position 2 is set on the south wall of the scattering chamber, and outlet 3 is arranged opposite to the sample chamber door. This layout scheme (scheme 12) reduces the air age of the scattering room by 4–7% and the air age of the sample room by 9–27%, which can improve the air age uniformity of the sample room by 2~16 times and reduce the indoor air retention time. In the above study, layout 12 has the lowest air age and the best uniformity, therefore, it is suggested to adopt layout 12 to ventilate the scattering chamber and sample chamber.
  • When the outlet height is 0.5 m, the air age is reduced by 2–11%. Meanwhile, the uneven coefficient is lower. Therefore, the outlet height has a significant effect on indoor airflow.
  • Changing the export position has a more significant impact than changing the export height. Combining with the previous two conclusions, it can be concluded that changing the export position plays a crucial role in reducing the air age. Therefore, when researchers select the optimal solution, they should firstly determine the outlet position and then study the export height.
  • When the outlet height is 0.5 m, the air age of the normal breathing height on the working path is smaller. The air age at z = 1.6 m is 10–40% lower than that at 0.4 m, which meets the minimum air age of respiratory height of radiation workers when standing.

Author Contributions

S.W. and Y.L. are the main authors of this manuscript. All the authors contributed to this manuscript. Y.L. modified the paper many times. S.W. and J.T. conceived the novel idea, and Y.L. and J.T. performed the analysis. L.Z. and W.Y. measurements of data. H.Z. and C.Y. analyzed the data and contributed analysis tools. S.W. and J.T. wrote the entire paper. Y.K. and L.M. checked, reviewed, and revised the paper. S.F. performed the final proofreading and supervised this research. All authors have read and agreed to the published version of the manuscript.

Funding

This work was supported by the Program for Guangdong Introducing Innovative and Entrepreneurial Teams, grant number 2017ZT07S225, the National Natural Science Foundation of China, grant number U1932219, National Natural Science Foundation of China, grant number 11805033, and State Key Laboratory of Nuclear Power Safety Monitoring Technology and Equipment, grant number K-A2019.418.

Institutional Review Board Statement

Not applicable.

Informed Consent Statement

Not applicable.

Data Availability Statement

Not applicable.

Conflicts of Interest

The authors declare no conflict of interest.

References

  1. Hassan, A.; Zeeshan, M.; Bhatti, M.F. Indoor and Outdoor Microbiological Air Quality in Naturally and Mechanically Ventilated University Libraries. Atmos. Pollut. Res. 2021, 12, 101136. [Google Scholar] [CrossRef]
  2. Wang, W.; Shan, X.; Hussain, S.A.; Wang, C.; Ji, Y. Comparison of Multi-Control Strategies for the Control of Indoor Air Temperature and CO2 with Openmodelica Modeling. Energies 2020, 13, 4425. [Google Scholar] [CrossRef]
  3. Sundell, J. Reflections on the History of Indoor Air Science, Focusing on the Last 50 Years. Indoor Air 2017, 27, 708–724. [Google Scholar] [CrossRef] [PubMed]
  4. Hou, J.; Zhang, Y.; Sun, Y.; Wang, P.; Zhang, Q.; Kong, X.; Sundell, J. Air Change Rates at Night in Northeast Chinese Homes. Build. Environ. 2018, 132, 273–281. [Google Scholar] [CrossRef]
  5. Jin, Z.Y.; Wu, M.; Han, R.Q.; Zhang, X.F.; Wang, X.S.; Liu, A.M.; Zhou, J.Y.; Lu, Q.Y.; Kim, C.H.; Mu, L.; et al. Household Ventilation May Reduce Effects of Indoor Air Pollutants for Prevention of Lung Cancer: A Case-Control Study in a Chinese Population. PLoS ONE 2014, 9, e102685. [Google Scholar] [CrossRef] [PubMed]
  6. Rackes, A.; Waring, M.S. Modeling Impacts of Dynamic Ventilation Strategies on Indoor Air Quality of Offices in Six US Cities. Build. Environ. 2013, 60, 243–253. [Google Scholar] [CrossRef]
  7. Mavrogianni, A.; Mumovic, D. Onthe Use of Windcatchers in Schools: Climate Change, Occupancy Patterns, and Adaptation Strategies. Indoor Built Environ. 2010, 19, 340–354. [Google Scholar] [CrossRef]
  8. Sui, X.; Tian, Z.; Liu, H.; Chen, H.; Wang, D. Field Measurements on Indoor Air Quality of a Residential Building in Xi’an under Different Ventilation Modes in Winter. J. Build. Eng. 2021, 42, 103040. [Google Scholar] [CrossRef]
  9. Deng, X.; Tan, Z. Numerical Analysis of Local Thermal Comfort in a Plan Office under Natural Ventilation. Indoor Built Environ. 2020, 29, 972–986. [Google Scholar] [CrossRef]
  10. Liu, Y.; Wang, Z.; Zhang, Z.; Hong, J.; Lin, B. Investigation on the Indoor Environment Quality of Health Care Facilities in China. Build. Environ. 2018, 141, 273–287. [Google Scholar] [CrossRef]
  11. Yin, H.; Liu, C.; Zhang, L.; Li, A.; Ma, Z. Measurement and Evaluation of Indoor Air Quality in Naturally Ventilated Residential Buildings. Indoor Built Environ. 2019, 28, 1307–1323. [Google Scholar] [CrossRef]
  12. Hirose, C.; Ikegaya, N.; Hagishima, A.; Tanimoto, J. Indoor Airflow and Thermal Comfort in a Cross-Ventilated Building within an Urban-like Block Array Using Large-Eddy Simulations. Build. Environ. 2021, 196, 107811. [Google Scholar] [CrossRef]
  13. Rahman, N.M.A.; Haw, L.C.; Fazlizan, A. A Literature Review of Naturally Ventilated Public Hospital Wards in Tropical Climate Countries for Thermal Comfort and Energy Saving Improvements. Energies 2021, 14, 435. [Google Scholar] [CrossRef]
  14. Rocha, L.J.C.; Souza, H.A. Numerical Study of the Influence of Internal Heat Source in Naturally Ventilated Offices. Rev. Esc. Minas. 2016, 69, 45–51. [Google Scholar] [CrossRef] [Green Version]
  15. Paul, T.; Sree, D.; Aglan, H. Effect of Mechanically Induced Ventilation on the Indoor Air Quality of Building Envelopes. Energy Build. 2010, 42, 326–332. [Google Scholar] [CrossRef]
  16. Seduikyte, L.; Stasiuliene, L.; Prasauskas, T.; Martuzevičius, D.; Černeckiene, J.; Ždankus, T.; Dobravalskis, M.; Fokaides, P. Field Measurements and Numerical Simulation for the Definition of the Thermal Stratification and Ventilation Performance in a Mechanically Ventilated Sports Hall. Energies 2019, 12, 2243. [Google Scholar] [CrossRef] [Green Version]
  17. El-Hougeiri, N.; El Fadel, M. Correlation of Indoor-Outdoor Air Quality in Urban Areas. Indoor Built Environ. 2004, 13, 421–431. [Google Scholar] [CrossRef]
  18. Ibrahim, I.Z.; Chong, W.T.; Yusoff, S.; Wang, C.T.; Xiang, X.; Muzammil, W.K. Evaluation of Common Indoor Air Pollutant Reduction by a Botanical Indoor Air Biofilter System. Indoor Built Environ. 2021, 30, 7–21. [Google Scholar] [CrossRef]
  19. Gitau, J.K.; Sundberg, C.; Mendum, R.; Mutune, J.; Njenga, M. Use of Biochar-Producing Gasifier Cookstove Improves Energy Use Efficiency and Indoor Air Quality in Rural Households. Energies 2019, 12, 4285. [Google Scholar] [CrossRef] [Green Version]
  20. Mocová, P.; Mohelníková, J. Indoor Climate Performance in a Renovated School Building. Energies 2021, 14, 2827. [Google Scholar] [CrossRef]
  21. Bernstein, J.A.; Alexis, N.; Bacchus, H.; Bernstein, I.L.; Fritz, P.; Horner, E.; Li, N.; Mason, S.; Nel, A.; Oullette, J.; et al. The Health Effects of Nonindustrial Indoor Air Pollution. J. Allergy Clin. Immunol. 2008, 121, 585–591. [Google Scholar] [CrossRef] [PubMed]
  22. Pereira, P.F.; Ramos, N.M.M. The Impact of Mechanical Ventilation Operation Strategies on Indoor CO2 Concentration and Air Exchange Rates in Residential Buildings. Indoor Built Environ. 2020, 30, 1–15. [Google Scholar] [CrossRef]
  23. Wang, Z.; Liu, J. Spring-Time PM2.5 Elemental Analysis and Polycyclic Aromatic Hydrocarbons Measurement in High-Rise Residential Buildings in Chongqing and Xian, China. Energy Build. 2018, 173, 623–633. [Google Scholar] [CrossRef]
  24. Limane, A.; Fellouah, H.; Galanis, N. Simulation of Airflow with Heat and Mass Transfer in an Indoor Swimming Pool by OpenFOAM. Int. J. Heat Mass Transf. 2017, 109, 862–878. [Google Scholar] [CrossRef]
  25. Bady, M.; Kato, S.; Takahashi, T.; Huang, H. Experimental investigations of the indoor natural ventilation for different building configurations and incidences. Build. Environ. 2011, 46, 65–74. [Google Scholar] [CrossRef]
  26. Wang, Y.H.; Yen, K.C.; Chang, H.Y.; Lai, C.M. Heat Removal and Hybrid Ventilation Characteristics of a Vertical Dry Storage Cask for Spent Nuclear Fuel. Nucl. Eng. Des. 2021, 378, 111183. [Google Scholar] [CrossRef]
  27. Shen, F. Shielding design of the Multi-Purpose Reflectometer Instrument of CSNS and Neutronics Study for ADS. Ph.D. Dissertation, Lanzhou University, Lanzhou, China, 2014. [Google Scholar]
  28. An, E.; Zhang, R.; Han, Y.; Liu, D. Numerical Simulation Mesh Independence of Multi—Phase Turbulent Combustion. Boil. Technol. 2018, 49, 54–58. [Google Scholar]
  29. Tao, Z.; Cheng, Z.; Zhu, J.; Hu, X.; Wang, L. Correction of Low-Reynolds Number Turbulence Model to Hydrocarbon Fuel at Supercritical Pressure. Aerosp. Sci. Technol. 2018, 77, 156–167. [Google Scholar] [CrossRef]
  30. Li, X.; Li, D.; Yang, X.; Yang, J. Total Air Age: An Extension of the Air Age Concept. Build. Environ. 2003, 38, 1263–1269. [Google Scholar] [CrossRef]
  31. Li, L.; Yang, H. Comparison of Four Kinds of Air Conditioning Systems in a Building with High and Large Space. Build. Energy Environ. 2012, 31, 60–62. [Google Scholar]
  32. Olesen, B.W.; Parsons, K.C. Introduction to Thermal Comfort Standards and to the Proposed New Version of EN ISO 7730. Energy Build. 2002, 34, 537–548. [Google Scholar] [CrossRef]
Figure 1. The calculation domain model. (a) Three-dimensional structure diagram of scattering room and sample room. (b) The side view of scattering and sample room.
Energies 15 04001 g001
Figure 2. Meshing of computing domain. (a) Overall computational domain. (b) Local mesh of scattering room.
Energies 15 04001 g002aEnergies 15 04001 g002b
Figure 3. Grid independence test.
Energies 15 04001 g003
Figure 4. Comparison of average air age in sample rooms under different schemes.
Energies 15 04001 g004
Figure 5. Comparison of simulation results of turbulence model with experimental data (z = 1.6 m).
Energies 15 04001 g005
Figure 6. Velocity contour of layout scheme 12 (The scattering room z = 1.6 m and the sample room z = 2.4 m).
Energies 15 04001 g006
Figure 7. Air age contour of the same cross height section at three layout schemes (The scattering room z = 1.6 m and the sample room z = 2.4 m). (a) Air age of layout scheme 1. (b) Air age of layout scheme 5. (c) Air age of layout scheme 12.
Energies 15 04001 g007
Figure 8. Comparison of average air age of three layout schemes (The scattering room z = 1.6 m and the sample room z = 2.4 m).
Energies 15 04001 g008
Figure 9. Comparison of non-uniformity coefficient of three layout schemes (The scattering room z = 1.6 m and the sample room z = 2.4 m).
Energies 15 04001 g009
Figure 10. Air age contour of the same cross height section at three outlet heights (The scattering room z = 1.6 m and the sample room z = 2.4 m). (a) Air age of layout scheme 12. (b) Air age of layout scheme 13. (c) Air age of layout scheme 14.
Energies 15 04001 g010
Figure 11. Comparison of average air age of three outlet heights (The scattering room z = 1.6 m and the sample room z = 2.4 m).
Energies 15 04001 g011
Figure 12. Comparison of three outlet height non-uniformity coefficients (The scattering room z = 1.6 m and the sample room z = 2.4 m).
Energies 15 04001 g012
Figure 13. Comparison of air age in different layout schemes (z = 1.6 m and y = 3.065 m). (a) Air age on the working path at three layout schemes. (b) Air age of three export heights on the working path.
Energies 15 04001 g013
Figure 14. Comparison of air age at different heights under the same path.
Energies 15 04001 g014
Table 1. Center position coordinates of the ventilation outlet for different layout schemes (↑ is the same as above).
Layout SchemeOutlet 1Outlet 2Outlet 3
1(5.5, 3.665, 0.5)(0.5, 0, 0.5)(8.89, 1.5, 1.3)
2Up ↑(0.5, 3.665, 0.5)Up ↑
3Up ↑(0, 3.065, 0.5)Up ↑
4Up ↑(0, 1.833, 0.5)Up ↑
5Up ↑(0.5, 3.665, 0.5)(8.89, 0.835, 1.3)
6Up ↑(0.5, 0, 0.5)Up ↑
7Up ↑(0, 3.065, 0.5)Up ↑
8Up ↑(0, 1.833, 0.5)Up ↑
9Up ↑(0.5, 3.665, 0.5)(9.9, 0.535, 1.3)
10Up ↑(0.5, 0, 0.5)Up ↑
11Up ↑(0, 1.833, 0.5)Up ↑
12Up ↑(0, 3.065, 0.5)Up ↑
13(5.5, 3.665, 1)(0, 3.065, 1.0)(9.9, 0.535, 1.8)
14(5.5, 3.665, 1.5)(0, 3.065, 1.5)(9.9, 0.535, 2.3)
Publisher’s Note: MDPI stays neutral with regard to jurisdictional claims in published maps and institutional affiliations.

