Abstract
The energy transition from inefficient fossil-based to sustainable energy systems can face various lock-ins. There are no pathways that are free of stress. However, many routes are possible. A good understanding of the dynamic behavior of systems is crucial, and proper support tools are needed to assess the outcomes of every selected pathway. This study aims to develop an Internet-based interface tool for the national energy simulation model as a tool for a “hybrid forum”; study energy transition lock-ins in one of the Eastern European countries; and apply the interface tool to study different pathways to Latvia’s climate and energy goals. System dynamics are used to reach the goals of the study. A causal loop diagram is applied to study feedback loops and lock-ins, a stock-and-flow structure is used to build a simulation model, and a user interface tool is built on top of it. The results show that the developed interface tool is user-friendly and can be used as a discussion platform. The results from the case study reveal how the soft power of Russia can lock in the energy transition in Eastern European countries by creating policy choices with additive effects and what pathways towards energy transition can be used to lock-out.
1. Introduction
“Policy choices with addictive effects are insidious because they look good in the short term, but once chosen they are very difficult to reverse” (D. Meadows).
The European Green Deal has set ambitious goals to tackle climate change [1]. The energy sector constitutes 53.5% of the total greenhouse gas emissions in the EU [2]. The energy transition is a key in driving progress towards climate-neutral and sustainable energy systems. EU energy policy includes the Directive on Energy Efficiency [3], Directive on the Promotion of Use of Energy from Renewable Sources [4], Directive on Energy Performance of Buildings [5] as part of Clean Energy for All Europeans Package [6].
The energy sector is complex, deeply embedded in societal structures, and involves many stakeholders interacting in different feedback structures with nonlinear relations [7,8]. However, the human mind is not adapted to understand how social systems behave. Consequently, when faced with complex systems, people make wrong decisions, and many policy programs cause the reverse effect of desired results, for example, dramatic policy failure of the UK Green Deal for energy efficiency [9], or unintended effects from using natural gas as a bridge from coal to the renewable energy sources [10]. In that case, policies only solve problems in the short term since a self-regulating system is at work. Although people like to blame outside forces for creating problems, an analysis shows that problems are caused by internal policies [11]. The impact of reinforcing feedback loops, such as accumulation of knowledge [12], network effects [13], economies of scale [14], adaptive expectations [15], the rebound effect [16], crowding out effect [17], and others [18] have been observed before societal lock-ins of unsustainable behaviors [19]. The undesirable effects of policies can grow the frustration of society with actors that attempt to manage societal systems. However, there are no modes of behavior that are free of pressures and stresses. Many modes of behavior are possible, and some are more desirable than others, and a good understanding of the dynamic behavior of systems is crucial to finding sustainable behaviors in social systems [11]. Stakeholders may face policy resistance when the system defeats the policies that have been designed to improve it [20,21]. Policy resistance arises from feedback loops pushing systems back towards their initial condition, and system dynamics is an approach that supports understanding and overcoming policy resistance by studying the underlying feedback loops [15,22].
Energy transition, like any other transition, is challenging, and it is vital to understand the underlying structures that drive the behavior of transitions [23]. For example, in the Netherlands, where the transition thinking is the foundation for energy policies, results did not meet expectations [24], and the identified balancing feedback loops explain the policy resistance that plagues the Dutch energy transition [25]. However, key aspects of energy systems are poorly understood by most people [26]. Policymakers often view different policy instruments from a cost-benefit perspective. Although barriers related to market failures are most studied, economic and regulatory instruments alone cannot reduce the barriers [27]. Policy tools have to address all barriers to reduce efforts of decision making [28,29,30]. It is essential to identify and assess the factors reinforcing or hindering the effectiveness of the interaction between various policy tools and mitigate side effects [25,31,32].
The design of national energy transition from fossil-based low energy efficiency energy system towards renewable and sustainable energy needs energy system analysis models able to model complex multi-loop nonlinear feedback systems. The role of energy system modeling in the transition away from fossil fuels in democratic societies is crucial [33]. Although social-behavioral modeling is challenged by uncertainties caused by the imperfect insights into complex adaptive systems, modeling can help plan, operate, and adapt in complex systems [34]. Various national energy models have been developed and applied, including optimization models, such as Homer [35], TIMES [36], and Balmoral [37], and simulation models, such as EnergyPLAN [38] and EnergyPRO [39]. These two archetypical national energy models have different implications for politics, planning, and rationality [33].
The typical optimization model relies on the neoclassical economic theory and searches for the optimal solution for a given country as the optimal balance of economic costs and benefits or the least costly way of reaching a specific goal. Simulation models are rooted in institutional economics and are used to analyze and compare different scenarios in relation to various key parameters. Simulation models provide several alternative routes and end states that do not have similar strengths and weaknesses. The detailed description of the current energy system in optimization models is essential, while it is less critical for simulation models because more detailed future options are the key issue. Optimization models help backcast (a future goal is defined, and the various pathways to reach it need to be identified), and simulation models are helpful for both backcasting and forecasting (an overview of future implications of different policy choices).
Energy transition accounts for political decision making between different developmental paths that are based on hard choices. This calls for creating the “hybrid forum” for the democratic process during public debates on techno-scientific issues [40]. The authors of [33] illustrate with examples from the Danish energy policy development that optimization modeling turns the role of politics into the administration of the implementation of optimal scenarios. In contrast, simulation models and scenarios provide space for democratic political decision making by involving many stakeholders. The authors of [25] use an energy transition study to show that in the transition studies, simulation models provide a middle ground between the multi-level perspective and the transition management approach by explaining the structure of the system and mapping the structure of the system responsible for energy policy resistance, which enables the identification of high leverage points for the transition process.
Interactive models help reduce cognitive challenges created by the dynamic behavior of complex systems. They also allow studying various policy scenarios cost and risk-free [41,42]. However, most optimization tools do not provide user-friendly interfaces and can be used only by professional modelers, limiting their accessibility to diverse users. A user-friendly interface is a crucial feature for the simulation tools that can serve as the platform for stakeholders during policy building discussions. It enables stakeholders to build energy transition pathways interactively by receiving immediate feedback on the effects of selected policies. The Climate Action Simulation uses this approach. It is an interactive simulation-based role-play designed to educate participants about the transition to a low carbon economy and is based on the interactive computer model En-ROADS [26]. Simulations of this sort are powerful educational tools since they foster deep learning and motivate action by simultaneously accessing analytic, affective, and social learning pathways [26].
This study will address two research questions, analyzing and assessing the past and future policies:
- How can the simulation model be used as a “hybrid forum” by decision-makers and other stakeholders in the democratic decision-making process, and how would it facilitate a more integrated policy mix to promote the development and take-up of the energy transition?
- How do different lock-in mechanisms of the socio-technical regime in the energy system influence transition pathways to the sustainable energy system in Eastern European countries? How have policies previously interacted to create drivers or barriers for the energy transition? How would the simulation model and its interface facilitate the promotion of a more integrated policy mix to the take-up of the energy transition?
This study has three main objectives: (1) develop a user-friendly free access Internet-based interface tool for the national energy simulation model as a tool for a “hybrid forum” for the policymakers and other stakeholders to analyze and discuss different pathways towards climate-neutral energy system, (2) study energy transition lock-ins and policy resistance on the way to climate and energy goals in one of the Eastern Europe country, and (3) apply simulation model and its interface to study different pathways to Latvia’s climate and energy goals.
The paper starts with an introduction, followed by a description of the methodology, a presentation of results, and discussions.
2. Materials and Methods
The national energy system is highly complex and dynamic; hence system dynamics is used to study underlying feedback mechanisms and nonlinearities. System dynamics is a mathematical modeling approach pioneered by Jay Forrester at MIT. In system dynamics, models are not obtained statistically from time-series data but are exposing underlying system structure and the policies that guide decisions. Every decision is made within the feedback loop. The decision controls actions that alter the system levels, which influence the decisions. A decision process can be part of more than one feedback loop. System dynamics models do not depend on a shortage of information and data, which is one of the major drawbacks of other approaches since available information about system structure and decision-making policies is sufficient [11]. By identifying the feedback loops, causal loop diagrams uncover the source of policy resistance [43] and support identifying high leverage points within those feedback loops [11]. System dynamics models are simulation models. However, they may identify optimal solutions, but this is not their primary purpose or strength.
Four important aspects are considered when system dynamics are applied to modeling energy transitions, including information feedback loops affecting demand and investment decisions; regulations and policy implications; awareness of society; material and information delays; co-development and mutual interaction of material and non-material stocks; and non-linear causal relations governed by reinforcing and balancing forces, which are characteristic for technology disruptions in socio-technical systems [44].
The study applies a stepwise methodology. First, previously developed supply-side models [44,45,46,47] and demand-side sectoral models [48,49,50,51] are joined in one aggregated model. The model is validated during the second step by a set of validation tests and historical data. In the third step, an Internet-based interface for policymakers and stakeholders is developed and tested. In the final step, analysis of lock-ins and policy resistance of national energy transition of the case study of Latvia is carried out, and the policies to assess various scenarios are developed.
2.1. Causal Loop Diagrams
Figure 1 illustrates the broad system’s main feedback structure that helps capture the causes of dynamics and governs the national energy transition process dynamics.
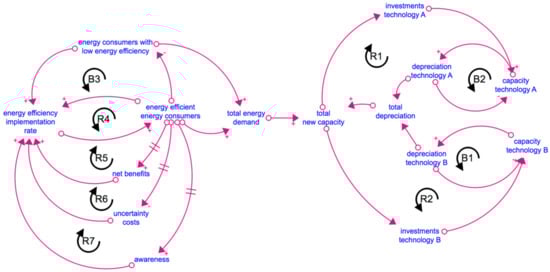
Figure 1.
Broad causal loop diagram for the energy system. (R- reinforcing loops; B-balancing loops; ‘+’ is positive feedback link; ‘-‘ is negative feedback link).
Two energy supply technologies (A and B) are used to illustrate the general feedback structure of the energy supply sector. Both technologies compete via reinforcing loops R1 and R2: the higher capacity of one technology, the lower capacity of the other technology. Each reinforcing loop represents how the share of the technology increases (determined by the investment, operation, and inconvenience costs) the investment and further the technology’s capacity. The higher the share in one of the technologies, the less it is in the other technology. Balancing loops B1 and B2 reduce the installed capacity of each of the technologies. When the capacity has depreciated and is decommissioned, it is allocated to the new installed capacity. The behavior of the energy supply-side system is determined by the interactions between investment and depreciation flows and the capacity stock. We have built multiple investments and depreciation structures for different energy supply technologies in the stock-and-flow structure of the model (hydro energy, natural gas, biomass, biogas, solar PV, heat pumps). The share of each technology is allocated via the logit function [52]. The model structure also includes the learning effects of RES technologies.
The second parameter that determines the installed capacity of energy supply capacity is energy demand. The higher the demand, the higher the installed capacity of energy-producing technologies. Energy consumption of consumers with high and low energy efficiency drives total energy demand. The energy efficiency diffusion rate governs the diffusion process of energy efficiency improvements. The main driver of this process in demand-side sectors is the individual decisions of energy consumers to implement energy efficiency projects. Traditionally, behavior studies related to energy efficiency are grounded in rational choice models assuming that humans are rational agents and decide based on costs and benefits. However, rational choice models often cannot fully explain the behavior, and other theories and models are applied to describe wider dimensions such as attitudes, beliefs, morals, habits, lifestyles, and social context. This study is based on the attitude–behavior–context model developed by Stern and Oskamp [53], accounting for motivations, attitudes and values, contextual or situational factors, social influences, personal capabilities, and habits. It is capable of describing and predicting pro-environmental consumer behavior. It is rooted in Kurt Lewin’s “field theory” [54], which examines patterns of interaction between an individual and the total field or environment. Lewin’s “field theory” states that behavior is a function of a person and the environment. This approach suggests that a sophisticated policy approach is needed and should include different incentive structures, facilitating conditions and situational factors, institutional context, social and cultural context, business practices and their impact, helping communities to help themselves, its own environmental and social performance. There are many different internal and external barriers to the implementation of energy efficiency measures.
The causal loop of the energy demand side has three reinforcing loops R4 to R7 and one balancing loop B3. The most critical parameter in these loops is the energy efficiency implementation rate. The energy consumers with low energy efficiency and consumers with high energy efficiency are the main stocks. The rate of energy efficiency implementation increases the number of consumers with high energy efficiency at a certain rate that depends on awareness, net benefits, and uncertainty costs. The net benefits are calculated as financial benefits from the implementation of energy efficiency measures. However, the rate is slow even if financial benefits are obvious. The reason is barriers that discourage energy efficiency measures, and uncertainty costs represent these barriers in monetary terms.
People are made aware of the importance of energy efficiency in the awareness-raising process (reinforcing loop R7). At first, this process can be encouraged with information campaigns, but at later stages, this loop becomes the word-of-mouth effect that increases the number of potential projects. The potential projects create demand and have an impact on net benefits. The higher number of efficient energy consumers, the higher the net benefits (reinforcing loop R5) due to increased energy savings and reduced investment costs. The costs are lowered due to the economies of scale, accumulation of experience, and the entrance of new companies into the market if other factors remain the same. The model also considers the time required for materials and technology suppliers to build up capacity. If the costs are high due to external factors, market distortion, or insufficient supply, the net benefits decrease, and thus, the energy efficiency measures’ implementation rate. When the costs decrease, demand for energy efficiency projects increases, reducing costs even more. Since the time between the event and the moment when it has been perceived is often relatively long, an information delay is included in the loop. This delay can last for many years.
Increasing the number of consumers with high energy efficiency in reinforcing loop R6 (uncertainty costs loop) decreases uncertainty costs. Similar to net benefits, uncertainty costs are also perceived, processed, and acted upon, demanding time, thus creating an information delay in the system. Decreasing uncertainty costs increase the rate of implementation of energy efficiency measures. The number of energy-efficient users increases when the rate increases, although this occurs with a delay (material delay).
Balancing loop B3 slows down all three reinforcing loops with a delay. With an increase in the number of energy-efficient consumers, the number of consumers with low energy efficiency decreases. As a result, the rate of energy efficiency implementation decreases because there are now fewer consumers that need energy efficiency measures. The number of low energy efficiency consumers is affected by the overall number of energy consumers. This loop comes into operation very late, only at the very end of the diffusion process.
2.2. Model Structure
In system dynamics, a stock-and-flow structure is used to simulate the behavior of the studied system, and a causal mapping is employed to study the causes of dynamics of a complex system with feedbacks and nonlinearities. In this study, the previously built separate system dynamics models of energy supply [44,45,46,47] and demand sectors [48,49,50,51] are adopted and joined. The model is built in Stella Architect software. The aggregated level model structure presented in Figure 2 consists of several modules, including the energy supply side, energy demand side, national climate goals, macroeconomics and population, and policies. Each of the main modules has sub-modules. The energy supply-side module contains large-scale electricity production, district heating, individual heating, and prosumers. The demand side has sub-modules of the household, industrial, tertiary, transport, and public sectors. The macroeconomics and population module include macroeconomics and population sub-modules. The transport sector is another sub-module but is not included in the scope of this study. The policies module includes different submodules related to different sectors, such as financial policy tools (climate fund, taxes, financial support programs, EU funding, penalty-reward scheme), normative (building energy efficiency standards and norms), information campaigns for every energy demand and supply sector, energy efficiency obligation scheme, mandatory energy audits and energy management schemes, and support schemes for housing leaders. The stock-and-flow structure contains 1494 variables, 191 stocks, 426 flows, 877 converters, and 1146 equations.
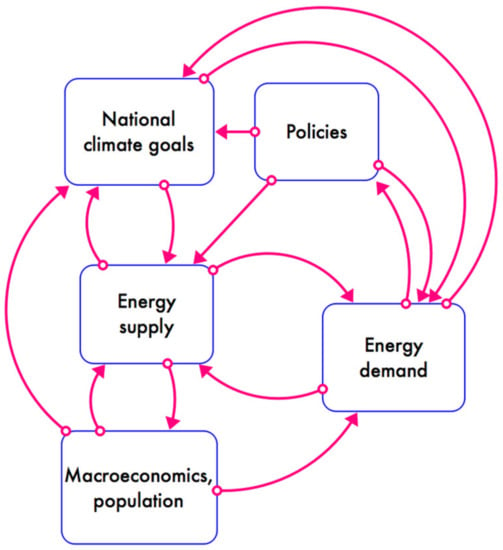
Figure 2.
Aggregated level structure of the model.
Stock-and-Flow Structure
The supply-side causal loop diagram is converted in the generic stock-and-flow structure used for two competing energy production technologies A and B, on the energy supply side (Figure 3). This structure is described in more detail in [45].
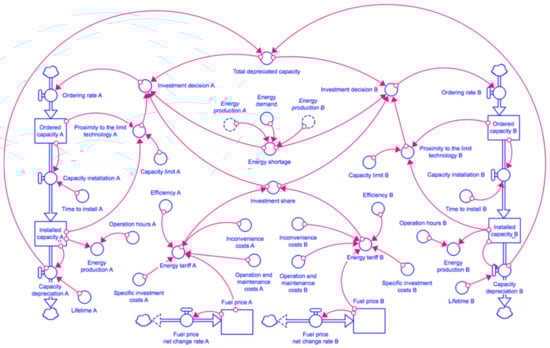
Figure 3.
Generic stock-and-flow structure for energy supply sector.
Figure 4 presents the generic stock-and-flow structure of energy demand-side sectors. This is a simplified structure of the energy efficiency diffusion process. In this structure, two factors affect the energy efficiency implementation rate via the probability of investment in energy efficiency. The value of factor A type parameters changes via feedback link from the stock of energy-efficient energy consumers, e.g., word of mouth reinforcing loop R7, net benefit reinforcing loop R5 and partly reinforcing loop R6 (see Figure 1). The value of factor B type parameters is determined exogenously outside the system. The structure is described in more detail in [50].
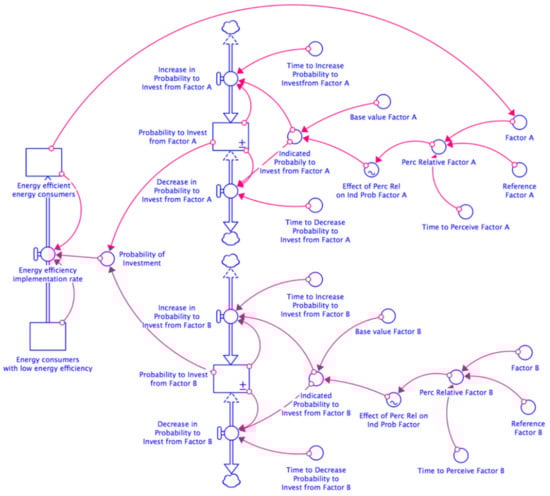
Figure 4.
Generic stock-and-flow structure for energy demand sector.
The proposed policy tools aim to lockout existing dependence on fossil fuel and energy dependence and provide a range of positive externalities by enhancing substitution, mitigating uncertainties, and accelerating the natural rate of diffusion.
A range of policy instruments that could drive energy transition on the supply side includes financial support to RES technologies, increased fossil fuel taxes, simplification of procedures and awareness-raising activities to reduce information lock-ins.
In the demand-side sectors, each sector is supplemented with various policy tools to increase the diffusion rate of energy efficiency. In the industry and tertiary sector, legal requirements on the mandatory energy audit or energy management system increase the importance of energy efficiency to the management of companies. Sectoral awareness-raising activities increase the involvement of energy manager, support of co-workers, knowledge about energy efficiency measures, and additional costs and risks associated with energy efficiency, reduce time and resources needed for the implementation of energy efficiency measures and fear of failure, increase trust in consultants and energy efficiency suppliers and competence. Financial support and reduced interest rates for energy efficiency measures reduce payback time of energy efficiency measures and increase sufficiency of financial means. Support to R&D increases the availability of energy efficiency technologies.
In the public sector, all municipalities are obliged to install energy management systems, and a penalty is foreseen for not fulfilling the obligation. This will increase the importance of energy efficiency for municipality management. It has to be strengthened with awareness-raising activities that increase the involvement of energy manager, support of co-workers, knowledge about energy efficiency measures, and additional costs and risks associated with energy efficiency, reduce time and resources needed for the implementation of energy efficiency measures and fear of failure, increase trust in consultants and energy efficiency suppliers, and cooperation with other municipalities and competence. Financial support for energy efficiency measures reduces the payback time of energy efficiency measures and increases the sufficiency of financial means. Increased building standards on building energy performance reduce the energy consumption of renovated buildings.
In the residential sector, the sustainable financial support program has to be established, generating income from either a penalty-reward scheme (real estate tax related to building energy performance), energy tax, or EU funds. It has to be strengthened with awareness-raising activities to increase support from the maintenance companies, seeing long-term benefits, assurance of benefits, positive attitude towards energy efficiency, and trust in neighbors. The number of renovated buildings increases the knowledge of someone who lives in renovated buildings. Increased building standards on building energy performance reduce the energy consumption of renovated buildings. Support to R&D increases the efficiency of renovation technologies. Support program to “champions” of renovation projects in multi-family buildings increases the presence of a “champion” in the house. For energy service companies, setting up the reinvestment fund and awareness-raising activities are included in the model.
The energy efficiency obligation scheme is a horizontal policy tool for all sectors, and the savings goal can be adjusted. The revision of the calculation of savings from information activities defined in the Energy Efficiency Catalogue has to be carried out. A transparent methodology for the calculation of energy savings obtained from tax increases has to be developed.
2.3. Validation of the Model
System dynamics models are causal-descriptive or theory-like models where causality in a structure matters. For this type of model, the validity of the internal structure of the model is crucial, while proper output behavior is not sufficient for the validity. Furthermore, the validation of the structure of a system is the central issue if causes of behavior have to be explained and changes in the behavior are needed. The validation’s primary goal is to build confidence that the model can generate the “right output behavior for the right reasons” [55]. Validation tests are based on comparing model and empirical reality [56].
First, the model was filled in with data from Latvia’s s energy system. Input data were obtained from different data sources [57,58,59]. Second, structural and behavior tests of aggregated models were carried out to validate the model according to [55]. After that, the model was validated with historical data [58,59] and compared with simulation results. Figure 5 shows that the model generates similar behavior to real observed behavior. The main reason for the difference in the model and historic data for natural gas and hydro energy is that hydro energy production is heavily based on weather conditions, and each year weather conditions differ. Hydro energy production is based on average production value over ten years; therefore, there are no distinct up and down values for model results. Based on the fact that historic hydro energy ups and downs are smoothed in the model because of the utilization of the average values, natural gas consumption is also smoothed. However, the model does not consider the weather effect. Oscillations in the real-life system happen because natural gas is the main alternative when hydro energy production is low, while natural gas consumption is reduced when hydro energy production is high. Although oscillations in the model do not happen, the average production trend over the validation time period remains similar; therefore, it can be assumed that overall model precision is sufficient even without modeling weather effects.
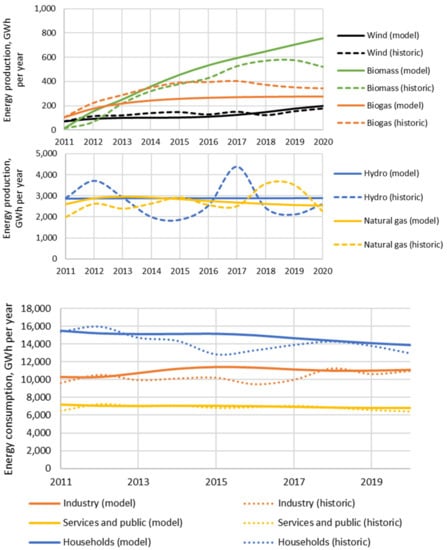
Figure 5.
Validation of simulation results with actual data for energy demand and supply sectors.
2.4. Interface for Policymakers
After the validation, a user-friendly free access Internet-based interface tool for the policymakers and other interested stakeholders for the national energy simulation model was developed. It can serve as a “hybrid forum” for stakeholders during policy building discussions and enables stakeholders to build energy transition pathways interactively by receiving immediate feedback on the effects of selected policies. It is also an educational tool that can foster deep learning and motivate action by simultaneously accessing analytic, affective, and social learning pathways.
The interface is created in Stella Architect software solely by the authors of this study. The software enables the creation and web-based deployment of system dynamics model interfaces. The interface development emphasizes packaging rather than developing model-based insights. It can have graphs and tables. Each policy instrument is connected to a variable in the stock-and-flow structure of the model. The model provides immediate feedback on how changes in any of the variables affect the total system.
The interface of the tool is available at https://exchange.iseesystems.com/public/andra/national-energy-model/index.html (accessed on 20 December 2021.). The first page of the tool illustrates total cumulative savings, RES share, total costs, and financial support (Figure A1 in Appendix A). The second page of the interface offers the possibility to adjust input values for macroeconomics indicators (GDP, population) and energy prices (Figure A2 in Appendix A).
The supply-side interface has one summary page and two pages for each supply-side subsector (centralized electricity production, district heating, and decentralized energy production). In the summary page (Figure A3 in Appendix A), the user can select whether EU funding is provided, the amount of support, and support intensity for all technologies in each of the supply-side subsectors. If support should be provided only for specific energy technologies, the user has to go to the page of the selected subsector, where more details are provided. The summary page illustrates results as annual support per technology, total costs and support for all technologies, share of RES in total national energy production, and RES share by energy type. Figure A4 in Appendix A illustrates the first page of one of the energy supply subsectors. The user can change the price for each fuel and energy, initial investment costs, and investment costs for each RES technology. The graphs provide immediate feedback to the users as a graph over time for fuel price (EUR/MWh), investment in each technology (EUR/MW), generated energy per energy type (GWh/year), installed capacity of wind energy and PV panels, and RES share in the national energy production. Figure A5 in Appendix A illustrates the second page of one of the energy supply subsectors. The user can change the values of different policies, including support, taxes, and other policies. Graphs are the same as on the first page of the energy supply subsector.
The interface of each energy demand-side sector (residential, industrial, tertiary, public) provides two layers to analyze the sub-sector. Both layers include different policy tools that can be applied to change the system’s behavior in each sub-sector (described in more detail in Section 2.2 (Stock-and-Flow Structure)). The system’s dynamic behavior is illustrated in graphs on the right-hand side of the page, and the industry sector is used as an example to illustrate the interface. The first layer illustrated in Figure A6 in Appendix A provides five groups of policy instruments, including funding, interest rate for loans for energy efficiency projects, awareness raising, support to research and development, and mandatory energy management system or energy audits. Each policy tool has several parameters that can be adjusted to reach the national cumulative savings goal displayed in the graph. The second graph shows the annual and cumulative costs of any combination of the policy tools. Figure A7 in Appendix A illustrates the second layer of the model interface for each demand-side sector, providing insights into industry sector decision making dynamics. First, the user can set the start values of all factors influencing decision making. Then, the user can apply different policy tools and determine their impact on the values of these factors.
An interface screenshot for the Energy Efficiency Obligation Scheme is presented in Figure A8 in Appendix A and CO2 tax, excise tax, natural resource tax, and ETS allowance price in Figure A9 in Appendix A.
Four online model interface test sessions to gain feedback about the user’s experience were carried out. The first session was conducted with thirty-five Master level Environmental Engineering students in the scope of study course Environmental Policy. They were assigned a task to become the head of the Energy and Environmental Department in the Ministry of Economics and develop policy scenarios to reach national climate and energy goals. They had to apply four additional criteria: (1) who is assigned the responsibility for reaching energy savings, (2) where to derive additional financial means to support energy users and producers, (3) how to assure that the funding is distributed in a socially fair manner, (4) how to assure that the most cost-effective measures achieve the most significant energy savings. Finally, they were asked to provide feedback on the usability of the interface of the tool. Obtained comments and feedback were analyzed, and adjustments were made to the interface. The second session was carried out with nine Doctoral level students in Environmental Engineering with the same procedure. The last two sessions were carried out with fifteen stakeholders and experts and twenty-three policymakers from the Ministry of Economics. One of the tasks in the online workshops was dividing participants into smaller groups of 3–5 persons where different stakeholders were mixed. They were tasked to reach national energy and climate goals either in one energy demand sector or several sectors. During discussions, they used the interface to learn about different policy tools that can be applied. All participants provided positive feedback that this complex social decision-making process in a risk-free environment was very valuable to learn that only cooperation and compromise can lead to meeting the goal and that the interface is a practical and advantageous tool for democratic policy discussions. They reported that it helped to increase understanding about different policies and their leveraging impact, single policies are not sufficient to reach the goal, and a combination of policies is needed and that it served as an eye-opening tool because they have not considered long-term effects before, e.g., a negative long-term effect of an unsustainable financing scheme on the energy efficiency renovation projects in the residential sector. They also found it beneficial to have interface pages with factors influencing energy efficiency policies. These results correspond to results reported in [26]. The obtained comments and feedback were analyzed, and adjustments were made to the interface.
Furthermore, the interface tool of the simulation model was presented in two online workshops for 75 stakeholders interested in energy planning, 13 modeling and sustainability experts from the National Bank of Latvia, 5 energy experts in Riga city Energy Agency, and 15 energy experts from the international project on smart energy cities.
3. Results
3.1. Energy Transition Lock-Ins and Path-Dependency: The Case of Latvia
Latvia is located in the East North part of the European Union and is a former Soviet Union country. It has been a member of the EU since 2004. Latvia has a population of 1.9 million with decreasing trend. GDP per capita was EUR 18,000 in 2019 [59]. In 2018, final energy consumption was 179 PJ, and it was shared among decentralized heating (40%), transport (30%), district heating (17%), and electricity (13%). Thirty-nine percent of primary energy was produced from renewable energy sources, including 25% in individual heating, 6% in district heating, 7% in centralized electricity production, and 0.8% in transport. Industry sector consumes 21%, transport sector 30%, residential sector 31%, tertiary and public sector 16%, and others 2% [59].
Table 1 shows that the primary energy consumption of Latvia makes up only 0.3% of the total primary energy consumption of the EU and 1.8% of the total primary energy consumption of Central and Eastern European countries. The largest energy consumers in Latvia are the transport sector and households, similar to EU and CEE. Gross electricity production in Latvia in 2019 was 6438 GWh, while gross heat production was 7948 GWh [60]. The share of renewable energy in gross final energy consumption in Latvia in 2019 was 41%, while the share of renewable energy in electricity was 53%, and in heating and cooling, it was 58%. The lowest share of renewable energy is in the transport sector–5% [59].

Table 1.
Comparison of energy consumption in EU, Central and Eastern Europe and Latvia in 2019, TWh [60].
Latvia, along with other EU countries, has adopted policy measures to promote the development of renewable energy and energy efficiency technologies. However, the current fossil-based energy system forms a techno-institutional complex locked in by mutually reinforcing technological and institutional factors. Current policy measures are not enough to reach national energy and climate goals. Thus, it is necessary to investigate how a better mix of policy instruments could overcome this lock-in and enhance the path to national energy goals.
In this section, the main lock-in mechanisms of Latvia’s energy transition are discussed, including the role of technological and institutional lock-in mechanisms and the negative and positive effects of the lock-in mechanisms on the energy transition towards a sustainable energy system. This will improve understanding of the existence of the dominant socio-technical regimes and the difficulties for emerging technologies.
As Djatkoviča [61] concludes, since 1991, Russia has openly used energy dependency from the natural gas supply as an instrument of political manipulation in Eastern and Central European countries, including Latvia. However, this approach has been present in more hidden forms during the last decade via Russia-affiliated business people and political elites. Conley et al. [62] have studied this influence, and they state that Latvia is vulnerable to Russia’s economic capture because, as in other Eastern and Central European countries, Russia uses its power in Latvia through an opaque patronage network to shape, influence, and guide public policy and decision making through corruption and soft power. It is a strategy of influence rather than visible force. Although many activities take place in the shadows and causality is difficult to prove, the observed patterns point to declining governance standards and the erosion of democracy.
The soft power locks in Latvia’s transition of energy systems towards climate neutrality in many ways on both supply and demand sides. It arises from feedback loops pushing the system towards its initial condition; thus, it is crucial to study and understand the underlying feedback loops and different lock-in strategies. The path-dependency is created and sustained via a complex and obscure system of social, economic, and cultural settings in which new trajectories of sustainable technologies are discouraged. This includes the characteristics of the initial market, the opinion of consumers, and the institutional and regulatory factors favoring incumbent technologies and discouraging the introduction of new technologies. The central feature of this influence is a well-developed and hidden network of interconnected lock-in mechanisms.
The main lock-in strategy is applied via complexity and opacity of politics by using political authority to enhance asymmetries of power to discourage new trajectories for renewable energy sources and energy efficiency. Latvia’s energy system’s supply side is locked in the reinforcing process of fossil fuels capacity building. Simultaneously, the diffusion of renewable energy sources is dampened by a variety of measures. In the 1990s and early 2000s, the government issued a limited number of RES quotas and allocated all of them to companies owned by politicians and oligarchs. They also received a double feed-in tariff for electricity produced. In 2008, the mandatory procurement scheme was set. This scheme legally binds the state to pay for installed capacity and produced energy from natural gas cogeneration plants and renewable energy sources at an increasing rate until 2038 [63], and the total support would reach EUR 5 billion. The smallest share of this scheme provides support to renewable energies. This has locked in the energy system in incumbent fossil technologies. Most of the power plants receiving financial support are directly or indirectly owned by politicians and their families. This is due to positive developments of investment costs in wind technology, which drives the RES reinforcing loop because it is profitable and has lower production costs. Parallel to that, informational increasing returns lock-in was activated and continuously sustained. The central message conveyed to the public via mass media owned by oligarchs is the negative image of RES as very expensive and unjust energy technologies. Although the minor share of the mandatory procurement scheme was allocated to renewable energy sources, mass media named it “support to green technologies”. It is reinforced by dominating narrative in public information space that Latvia already has a high share of RES, and no more additional efforts are needed to increase the share in the future. However, national statistics show that the growth rate of renewables has stalled since 2014 [59]. In the wood-processing industry, the share of RES is decreasing while production capacity grows [59]. Another strengthening of technological lock-in is carried out by different tax exemptions for fossil fuels [64].
Energy transition in Latvia is also locked-in via institutional complementarities when ministries and business interest groups closely related to politicians develop symbiotic relationships and favor incremental instead of radical changes. They are supported by another powerful tool used to lock in the current energy system, namely national energy modeling. It has been solely allocated to a single institution since the 1990s, and since 2021, secondary legislation has secured its role. Historically, the scientific outcomes from this institution support pathway towards energy dependence from natural gas and strengthen the lock-in by supporting it with so-called “scientific evidence” from the optimization model.
The reinforcing effects have also spread in many everyday activities where the natural gas company positions itself positively, e.g., sponsoring the Latvian ice-hockey team, the annual national classical music award, the annual national research award, etc.
On the demand side, all energy transition reinforcing loops are weakened by different methods and approaches. At first glance, energy efficiency policies are implemented according to the EU Directive on Energy Efficiency [3]. However, most of them have various side effects that directly or indirectly weaken their effects. Institutional lock-ins are used in various forms and combinations of constraints or lack of constraints devised to weaken diffusion of energy savings. In such ways, institutional factors reinforce the lock-in of the current fossil fuel-dominated technological system. A mandatory energy audit or energy management system has to be installed in the industry and tertiary sector and the three most cost-effective energy efficiency measures implemented. Many companies have followed the legal requirements. However, in many cases, simple and least investment intensive measures were formally implemented, e.g., change of few light bulbs in the energy-intensive plant [65,66]. In the public sector, large and wealthy municipalities were obliged to install energy management systems. Nevertheless, the largest cities did not follow this legal requirement because no penalty was foreseen for not fulfilling the obligation [67]. In the residential sector, the unsustainable financial support program has led to the unexpected side effects caused by the ratio between demand for renovation and supply of construction companies, which further led to the chain of other side effects [50]. Energy service companies have been facing a lack of support and significant resistance at the ministry level to install reinvestment funds, which is crucial for this business. The negative image of ESCO is created in the media space. The significant national cumulative savings (60%) were expected from the voluntary scheme. Only 1% were reached due to lack of any “carrot and stick” [68]. The only policy tool that has generated savings as it was planned is the energy efficiency obligation scheme. It is a marginal policy instrument because it was planned that it would generate only 2.4% of the total national savings. However, it has a major shortage; namely, the savings from any energy-saving measure are defined by the Energy Efficiency Catalogue. The specific energy savings assigned to information activities are too high, thus impeding the implementation of technological measures [69]. Reports to the EU about the progress of implementation of National Energy Efficiency Action Plans show that the major share of Latvia’s cumulative savings is achieved due to tax increase [70]. However, taxes were neither increased nor decreased during the reporting period [64]. The method and calculations used for savings calculation from taxes cannot be traced. The State Audit Office of the Republic of Latvia warned the Ministry of Economics that Latvia would not achieve national energy efficiency goals by 2020; therefore, it must act proactively and responsibly to ensure that the goals are achieved [71].
As concluded by [72], the only way out of this energy transition lock-in and getting off the current path-dependency is through energy independence.
3.2. Policy Interventions
In this section, the model is used to explore a series of scenarios that answer “what if” questions regarding the implementation of different policies to unlock the energy transition. This section of the paper illustrates how the simulation model and its interface tool could be applied as the platform for democratic discussions about energy transition pathways. According to [33], politicians, planners, and citizens can play active roles in the policy development process by applying this dialogue or deliberation model. The tool provides immediate graphical feedback on changes in input values and allows assessment of political arguments raised during discussions with stakeholders, which leads to communication, dialogue, and deliberation. Furthermore, this reduces the undesirable effects of policies that later can grow the frustration of society with policymakers that attempt to manage societal systems. Although there are no modes of behavior free of pressures and stresses, many modes of behavior are possible, and some are more desirable than others [11].
The interface allows users to analyze and compare options and/or scenarios that differ in relation to various key output parameters, including total and sub-sectoral (all demand-side sectors) cumulative energy savings, total and sub-sectoral (individual and large electricity production, district heating, and individual heating) RES share, annual costs and financial support of measures, total and sub-sectoral cumulative costs and financial support, and annual energy balance for all energy sources all sectors and sub-sectors. When scenarios are discussed, stakeholders can have an even more advanced approach, for example, by including criteria, such as who is assigned the responsibility for reaching energy savings, where to derive additional financial means to support energy users and producers, how to assure that the funding is distributed in a socially fair manner, how to assure that the most cost-effective measures and achieve the most significant energy savings, etc. The tool can be well applied while discussing a broader set of criteria.
Three sample scenarios of policy recommendations based on the underlying loop structure of the model are developed and studied in the context of the national energy and climate goals 2030 with cumulative energy savings of 15,500 GWh and 50% RES share. To boost Latvia’s energy transition and eliminate the power of Russian manipulations carried out via energy dependency, the policy should focus on weakening the reinforcing loop of fossil fuels capacity building, strengthening the RES capacity building reinforcing loop, and strengthening all demand-side reinforcing loops. Conley et al. [62] suggest reducing Russian influence by strengthening the balancing loop of governance, enhancement of anticorruption, transparency, market diversification, and competition at the national level. It would strengthen RES and energy efficiency reinforcing loops. However, the analysis of this balancing process is beyond the scope of this study.
Scenario 1, “the baseline”, is based on the current ongoing policy in Latvia according to the National Energy and Climate Plan 2030. Only policy tools enshrined in the legislation by 2021 are included in this scenario. The energy supply sector does not have any policy measures set in the legislation (supply-side loops are not changed). In the demand sector, EEOS-obliged parties are electricity providers (annual sales >10 GWh) with a binding saving goal of 1.5% per year in households and small enterprises, and the goal is reached by implementing only awareness-raising activities. Multi-family buildings will have the total available EU funding of EUR 200 million with a support intensity of 50 % starting in 2022 (strengthening loop R5). The grassroots information activities provide the information, mainly carried out by the Ministry of Economics and local governments (input value for the impact of information activities in the model is set at 0.9) (strengthening loop R7). Large and wealthy municipalities and state-owned real estate companies must implement an energy management system with no binding energy savings goal. Large energy consumers and large enterprises must have either energy audits or an energy management system and implement the three most cost-effective energy efficiency measures.
In Scenario 2, on the energy supply-side RES reinforcing loop is locked out by providing funding of EUR 400 million with 30% financial support to investment costs for heat pumps, solar collectors, and biomass technologies in district heating and individual production. As the power to heat technology, heat pumps give flexibility for the electricity produced from renewable sources (wind and solar). On the demand side, policy tools are slightly improved in all sectors compared to Scenario 1. In the residential sector, single and multi-family buildings have available EU funding of EUR 800 million with a support intensity of 30% starting in 2022. It is supported by building a “champions” program that runs to half load (50,000 EUR/year). In the tertiary sector and industry sector, energy efficiency projects are supported from EU funding of EUR 500 million with 30% support intensity from 2022 in each sector. Large companies and large energy users in both sectors must have energy audits or energy management systems. All municipalities are obliged to have an energy management system and have the financial support of EUR 500 million with 50% intensity. EEOS obliged parties to include all electricity providers and have obligations to save energy 1.5% per year in the residential sector and small enterprises. They are penalized if the goal is not reached. The national administration runs a general awareness-raising campaign, which is not well-targeted at each sector (information campaign input value is set at 0.5), financially supports research and development activities in all sectors but not to the full extent (EUR 2.5 million per year in the industrial and tertiary sectors each and EUR 10 million per year in the residential sector).
In Scenario 3, on the energy supply side, the RES reinforcing loop is locked out by providing funding of EUR 500 million with 30% financial support to investment costs for heat pumps, solar collectors, and biomass technologies in district heating and individual production. As the power to heat technology, heat pumps give flexibility for the electricity produced from renewable sources (wind and solar). Support is obtained from reducing excise tax relief for fossil fuels or increasing excise tax on all fossil fuels used in the energy sector. On the demand side, policy tools are significantly improved in all sectors compared to Scenario 1. In the residential sector, single and multi-family buildings have available EU funding of EUR 1.1 billion with a support intensity of 50% starting in 2022. It is supported by building a “champions” program that runs at full load (100,000 EUR/year). In the tertiary sector and industry sector, energy efficiency projects are supported from EU funding of EUR 1 billion with 30% support intensity from 2022 in each sector. Large companies and large energy users in both sectors must have energy audits or energy management systems. All municipalities are obliged to have an energy management system and have the financial support of EUR 1 billion with 50% intensity. EEOS obliged parties to include all electricity and district heating providers and have obligations to save energy 1.5% per year in the residential sector and small enterprises. They are penalized if the goal is not reached. The government has set up an ESCO reinvestment fund and developed a monitoring and verification system for ESCOs. The national administration runs well-targeted at each sector awareness-raising campaign (information campaign input value is set at 1), financially supports research and development activities in all sectors to the full extent (EUR 5 million per year in the industrial and tertiary sectors each and EUR 20 million per year in the residential sector), increases requirements of national building standards from 2021 by strengthening norms every five years by energy performance increase for building renovation 3 kWh/m2/year, sets price limits for energy-efficient projects in public and residential sectors, and ensures that the quality of energy auditors, engineers, and architects are according to set standards. Excise tax for natural gas is increased at an annual growth rate of 20%.
Three sample pathways were selected to illustrate the application of the model and its interface as a helpful tool during democratic policy discussions. The input values were selected in the interface, and the model was simulated for all three pathways. Figure 6 illustrates the results of cumulative energy savings for all three scenarios. In Scenario 1 and 2, the national energy savings goal (15,500 GWh) is not reached because all three demand-side reinforcing loops (net benefit, inconvenience costs, and awareness) are too weak to boost energy efficiency diffusion. In the net benefit loop, low and unsustainable financial support increases the costs of energy efficiency measures and reduces net benefits in combination with low energy tariffs. The costs are also increased due to construction companies’ demand/capacity ratio because of unsustainable financing. Low support to R&D results in lower energy savings and higher costs of measures. The lack of reinforcing building energy performance standards is another cause of low net benefits. In the “uncertainties costs” loop, various effects are low, including the learning effect, the economy of scale effect, support to “champions” in the multi-family building sector, the effect of the share of successful projects due to renovation quality. The awareness loop is weak because awareness-raising activities are too general and are not well-targeted for each sector; thus, they are not able to increase support and involvement of energy managers, company or municipal leaders, and employees in energy efficiency projects, increase awareness about risks and additional costs associated with energy efficiency, increase knowledge and competence about energy efficiency measures, reduce fear from failure, increase trust in external consultants and suppliers. In Scenario 3, all policy tools are set at their highest values, thus significantly strengthening all three reinforcing loops, leading to reaching the national energy efficiency goal.
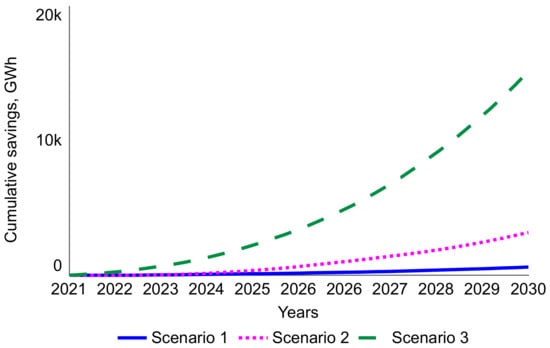
Figure 6.
Cumulative energy savings for three policy scenarios.
Figure 7 illustrates the results for three pathways to the RES goal. In Scenario 1 and 2, the goal is not met, while in Scenario 3, the goal is reached. In all scenarios, the diffusion of RES is strongly weakened by the lock-in of incumbent fossil technologies as they will be depreciated only around 2035. On the other hand, the share of RES is increasing due to positive developments of investment costs in wind technology, which drives the RES reinforcing loop because it is profitable and has lower production costs. However, it is not enough to reach the goal, as illustrated in Scenario 1, where no policy instruments are applied to weaken the reinforcing loop of fossil fuels and strengthen the reinforcing loop of RES diffusion. The results of Scenario 2 show that even though financial support is provided to RES technologies in district heating and individual heating sectors, it is not enough to boost the RES reinforcing loop and weaken the reinforcing loop of fossil capacity if the energy demand is reduced only slightly (see Figure 1) and a high supply capacity is still required. In Scenario 3, the goal is reached because energy demand is reduced significantly, RES technologies are financially supported, and excise tax for fossil fuel grows.
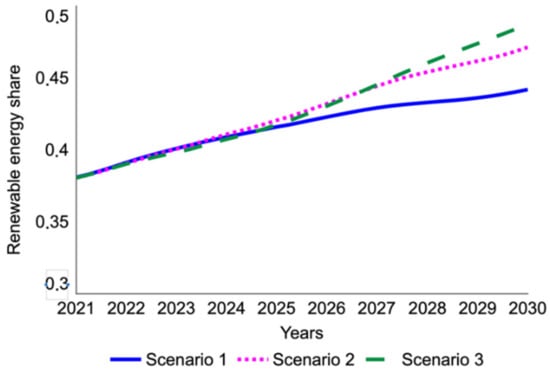
Figure 7.
Renewable energy share for three policy scenarios.
The cumulative costs by 2030 are EUR 0.5 billion for Scenario 1, EUR 2.8 billion, and EUR 7.6 billion for Scenario 3 (see Figure 8).
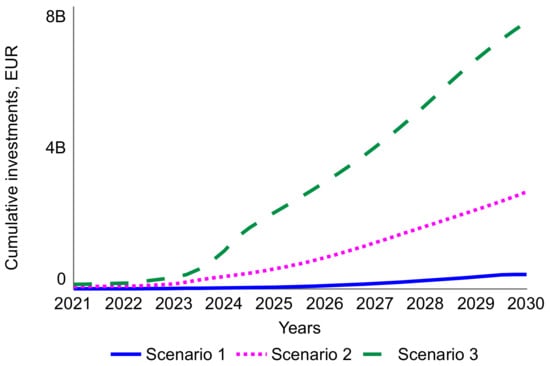
Figure 8.
Cumulative investments in energy efficiency measures and RES technologies for three policy scenarios.
4. Discussion and Conclusions
This study has addressed two research questions related to the past and future policies.
The first research question asked in this study was how the simulation model can be used as a “hybrid forum” by decision-makers and other stakeholders in the democratic decision-making process, and how would it facilitate a more integrated policy mix to promote the development and take-up of the energy transition. In this study, a user-friendly free access Internet-based interface tool for the national energy simulation model was developed as a tool for a “hybrid forum” for the policymakers and other stakeholders to analyze and discuss different pathways towards a climate-neutral energy system. The simulation model can be used as a platform by decision-makers and other stakeholders in the democratic decision-making process. It helps to facilitate a more integrated policy mix to promote the development and take-up of the energy transition by providing calculated outcomes as arguments in societal situations of techno-scientific transition. This tool encourages dialogue between politicians, planners, and stakeholders. Each party provides arguments that can be instantly simulated in the interface and provides immediate feedback on the outcome that can serve as a basis for further discussions. This makes decisions more qualified, considers affected parties, and assesses political arguments. The feedback from the test sessions of the interface coincides with the findings of [33] that simulation tools can serve as a tool for communication, dialogue, and deliberation.
The tool can be used by either a single person or during group discussions, and it does not require time-consuming prior training. A short video is included on the main page of the tool, where the interface’s main features are explained.
The tool can be applied to other countries if input values are adjusted. If needed, the structure of the stock-and-flow structure and the parameters provided in the interface can be adjusted to suit the country’s specifics better.
The second research question of this study addressed different lock-in mechanisms of the socio-technical regime in the energy system, their influence on transition pathways to the sustainable energy system in Eastern European countries, and how policies previously interacted to create drivers or barriers for the energy transition. It also questions how the simulation model and its interface tool would promote a more integrated policy mix to the take-up of the energy transition.
The methodology used in this study allows understanding why energy transition is hard to come about and identifies ways to overcome policy resistance. A causal loop diagram illustrates causal relations that matter to a system and serves as a tool to understand how to steer the system in the path of events by finding the best policy levers. In this research, Latvia is used as a case study on energy transition lock-ins and policy resistance on climate and energy goals in Eastern European countries. The case study illustrates that energy transition is deeply embedded in economic, social, and political reality structures. Results show that, similar to other Eastern and Central European countries, Latvia experiences energy transition lock-ins due to asymmetries of power applied by Russia. The soft power locks in Latvia’s transition of energy systems towards climate neutrality in many ways on both supply and demand sides. It arises from feedback loops pushing the system towards its initial condition. The path-dependency is created and sustained via a complex and opaque system of social, economic, and cultural settings in which new trajectories of sustainable technologies are discouraged. This includes the particular characteristics of the initial market, the opinion of consumers, and the institutional and regulatory factors favoring incumbent technologies and discouraging the introduction of new technologies. The central feature of this influence is a well-developed and hidden network of interconnected lock-in mechanisms. The government established the national climate and energy targets without underpinning them with reinforcing regulations for energy efficiency and renewable energy sources. As suggested by [18], symbiotic relationships between the powerful actor in the incumbent regime and essential political players supported by a research institution can undermine policy coordination’s institutional learning effects since the incumbent regime’s actor will favor incremental changes or no changes instead of radical changes. To combat this influence, a balancing loop of governance strengthening, enhancement of anticorruption, transparency, market diversification, and competition at the national level would strengthen RES and energy efficiency reinforcing loops. However, the analysis of this balancing process is beyond the scope of energy policy and requires the involvement of governmental institutions from other sectors. If this loop is weakened, the government could develop ambitious targets for deploying new technologies and reinforce these targets with regulations favoring solutions.
This study provides an insight into how different scenarios would have led to the national climate and energy goals if power asymmetries’ lock-in is weakened and how the simulation model and its interface can assist during this exercise. Three sample pathways were selected to illustrate the application of the model and its interface as a helpful tool during democratic policy discussions. The input values were selected in the interface, and the model was simulated for all three pathways. Results show how different sets of policy instruments can weaken the reinforcing loop of fossil fuels and strengthen the reinforcing loop of RES and energy efficiency diffusion and how supply and demand sectors interact and reinforce or weaken each other. To reach the goal, all demand-side sectors have to have a mix of different policy instruments, while in the supply sector, only financial support to power to heat technologies and increased the excise tax on natural gas can ensure that the RES share goal is met. These findings coincide with conclusions from the studies of lock-ins in energy transitions [18,73] that lock-in mechanisms are naturally interconnected and have an impact on the energy transition pathways. The simulation results show that these mechanisms can relate to each other in various ways, e.g., learning effects and technological interrelatedness reinforces each other in the supply sector through the implementation of power-to-heat technologies in district heating, “crowding out effect” created by running several support schemes simultaneously in different demand-side sectors can diminish the learning effect, information can reinforce or weaken learning effects in all sectors, economies of scale reinforce learning effects in all sectors, learning effects reinforce collective action in the multi-family sector, asymmetries of power can reinforce or weaken collective action in all energy demand sectors through activity and involvement of energy managers and management in companies and public bodies and activity of “champions” in the residential sector.
However, this study has limitations. The policy tools included in the current version of the model are based on the real system. If policy sets proposed in this study were applied to the real policy-making process, other lock-in mechanisms might appear, such as local context-specific mechanisms, e.g., knowledge and competencies of local industries, existing renewable energy technologies as incumbent technologies, and they have to be further studied and included in the model.
The main limitation of system dynamics application to transition studies is the lack of attention to the political dimension of the policy process because the simulation models assume a perfect perception of the system by the policymakers [25,74]. As illustrated by the case study, the power dimension of implementing policies can play a crucial role, especially if individual stakes prevent policymakers from implementing high leverage policies. In this study, the attempt to include political power was implemented by analyzing the past and current situation.
Future studies should address another limitation of this study. The model’s structure is built for aggregated parameters, which limits the application of this modeling approach to study social dynamics evolving from individual behavior as it can be conducted with other simulation methods, e.g., agent-based modeling. This should be considered in further studies.
During the workshops, participants from the public sector suggested modifying and adapting the model for municipality scale and needs; thus, further research will be focused on this topic. A new interface page will be added to insert municipality-specific input values. If needed, the structure of the stock-and-flow structure and the parameters provided in the interface can be adjusted to suit municipality specifics better.
Author Contributions
This research is the joint efforts of all authors. Conceptualization and methodology, A.B., D.B. and A.G.; software and validation, A.B. and A.G.; formal analysis and investigation, D.B.; resources and data curation, A.B. and A.G.; writing—original draft preparation, A.B.; writing—review and editing, D.B. and A.G.; visualization, A.G.; supervision, project administration, and funding acquisition A.B. All authors have read and agreed to the published version of the manuscript.
Funding
This research was funded by the Ministry of Economics of the Republic of Latvia, National Research Program Energy, the project “Energy and climate modelling towards net zero emissions”, project No. VPP-EM-2018/NEKP-0001.
Institutional Review Board Statement
Not applicable.
Informed Consent Statement
Not applicable.
Conflicts of Interest
The authors declare no conflict of interest. The funders had no role in the design of the study; in the collection, analyses, or interpretation of data; in the writing of the manuscript; or in the decision to publish the results.
Appendix A
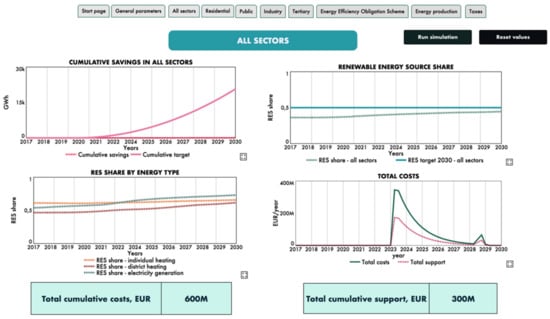
Figure A1.
Internet-based model interface page for all sectors.
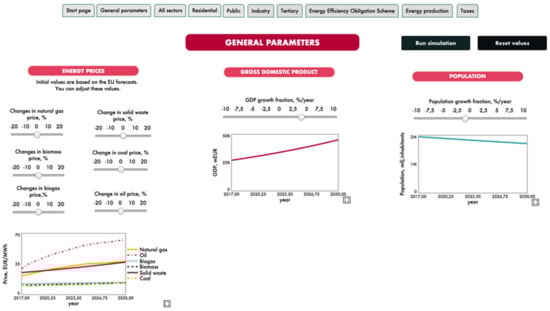
Figure A2.
Internet-based model interface page for selection of general input parameters.
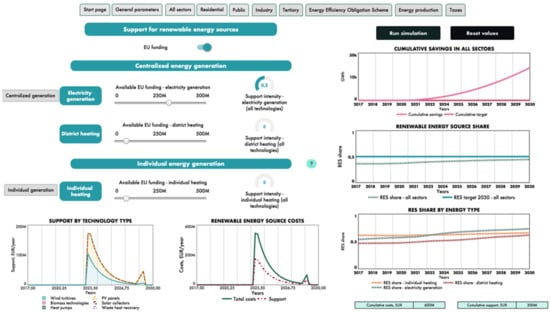
Figure A3.
The summary page of Internet-based model interface for energy supply policy tools.
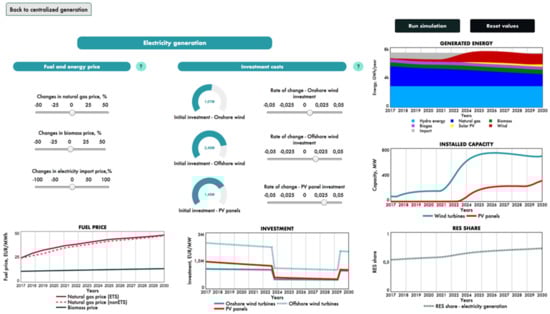
Figure A4.
The first page of Internet-based model interface for energy supply subsector policy tools.
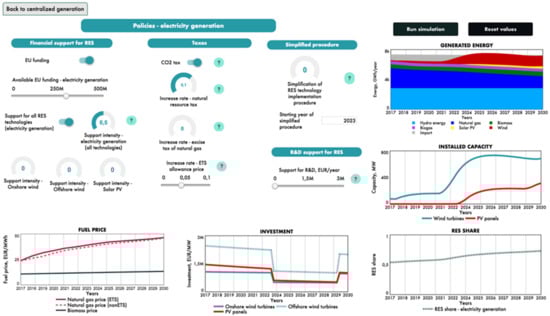
Figure A5.
The second page of Internet-based model interface for energy supply subsector policy tools.
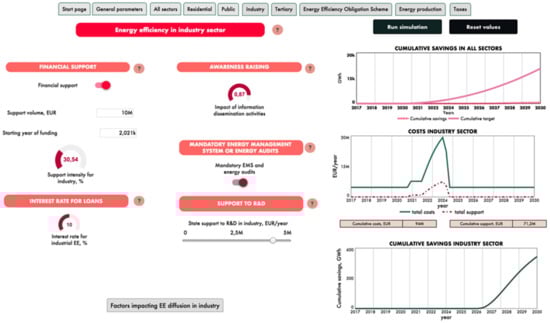
Figure A6.
The first layer of Internet-based model interface for selection of policy tools for industry sector.
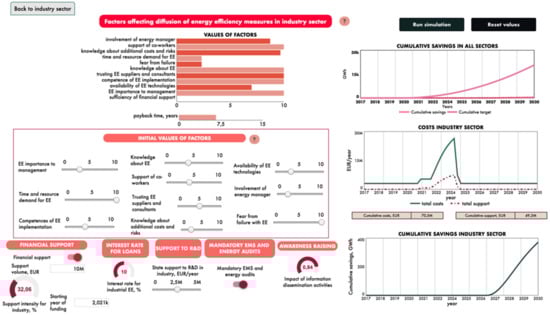
Figure A7.
The second layer of Internet-based model interface for selection of policy tools for industry sector.
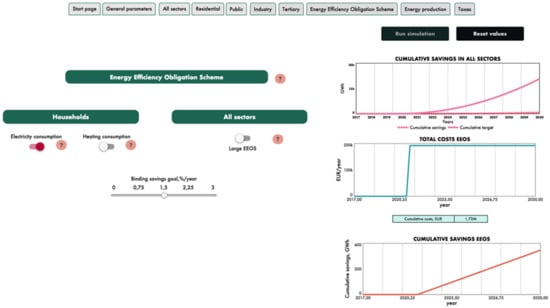
Figure A8.
Internet-based model interface for the Energy Efficiency Obligation Scheme.
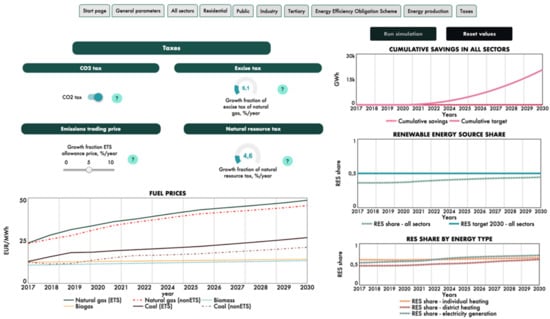
Figure A9.
Internet-based model interface for taxes.
References
- European Commission. The European Green Deal; Communication from The Commission To The European Parliament, The European Council, The Council, The European Economic And Social Committee And The Committee Of The Regions; European Commission: Brussels, Belgium, 2019; 11.12.2019 COM 640 final. [Google Scholar]
- Eurostat. Energy, Transport and Environmental Statistics: 2020 Edition; European Union: Brussels, Belgium, 2020. [Google Scholar]
- European Commission. Directive 2018/2002 of the European Parliament and of the Council Amending Directive 2012/27/EU on Energy Efficiency; European Commission: Brussels, Belgium, 2018. [Google Scholar]
- European Commission. Directive 2018/2001 of the European Parliament and of the Council on the Promotion of the Use of Energy from Renewable Sources; European Commission: Brussels, Belgium, 2018. [Google Scholar]
- European Commission. Directive 2018/884 of the European Parliament and of the Council Amending Directive 2010/31/EU on the Energy Performance of Buildings and Directive 2012/27/EU on Energy Efficiency; European Commission: Brussels, Belgium, 2018. [Google Scholar]
- Directorate-General for Energy. Clean Energy for All Europeans; European Commission: Brussels, Belgium, 2018. [Google Scholar]
- Rosenow, J.; Kern, F.; Rogge, K. The need for comprehensive and well targeted instrument mixes to stimulate energy transitions—The case of energy efficiency policy. Energy Res. Soc. Sci. 2017, 33, 95–104. [Google Scholar] [CrossRef]
- Hoekstra, A.; Steinbuch, M.; Verbong, G. Creating agent-based energy transition management models that can uncover profitable pathways to climate change mitigation. Complexity 2017, 2017, 1967645. [Google Scholar] [CrossRef] [Green Version]
- Rosenow, J.; Eyre, N. A post mortem of the Green Deal: Austerity, energy efficiency, and failure in British energy policy. Energy Res. Soc. Sci. 2016, 21, 141–144. [Google Scholar] [CrossRef]
- Gursan, C.; de Gooyert, V. The systemic impact of a transition fuel: Does natural gas help or hinder the energy transition? Renew. Sustain. Energy Rev. 2021, 138, 110552. [Google Scholar] [CrossRef]
- Forrester, J.W. Counterintuitive behavior of social systems. Technol. Forecast. Soc. Chang. 1971, 3, 1–22. [Google Scholar] [CrossRef]
- Moxnes, E. Misperceptions of basic dynamics: The case of renewable resource management. Syst. Dyn. Rev. 2004, 20, 139–162. [Google Scholar] [CrossRef]
- Rahmandad, H.; Sterman, J.D. Heterogeneity and Network Structure in the Dynamics of Diffusion: Comparing Agent-Based and Differential Equation Models. Manag. Sci. 2008, 54, 998–1014. [Google Scholar] [CrossRef] [Green Version]
- Arthur, W.B. Positive Feedbacks in the Economy. Sci. Am. 1990, 262, 92–99. [Google Scholar] [CrossRef]
- Sterman, J.D. Business Dynamics: Systems Thinking and Modeling for a Complex World; Irwin/McGraw-Hill: Boston, MA, USA, 2000. [Google Scholar]
- Herring, H.; Sorrell, S. (Eds.) Energy Efficiency and Sustainable Consumption: The Rebound Effect; Palgrave Macmillan: Houndmills, UK, 2008. [Google Scholar]
- Menges, R. Supporting renewable energy on liberalised markets: Green electricity between additionality and consumer sovereignty. Energy Policy 2003, 31, 583–596. [Google Scholar] [CrossRef]
- Klitkou, A.; Bolwig, S.; Hansen, T.; Wessberg, N. The role of lock-in mechanisms in transition processes: The case of energy for road transport. Environ. Innov. Soc. Transit. 2015, 16, 22–37. [Google Scholar] [CrossRef] [Green Version]
- Foxon, T.J.; Hammond, G.P.; Pearson, P.J.G. Developing transition pathways for a low carbon electricity system in the UK. Technol. Forecast. Soc. Chang. 2010, 77, 1203–1213. [Google Scholar] [CrossRef] [Green Version]
- Sterman, J.D. Learning in and about complex systems. Syst. Dyn. Rev. 1994, 10, 291–330. [Google Scholar] [CrossRef] [Green Version]
- Meadows, D. Whole Earth Models and Systems. Co-Evol. Q. 1982, 34, 98–108. [Google Scholar]
- Geels, F.W. Technological transitions as evolutionary reconfiguration processes: A multi-level perspective and a case-study. Res. Policy 2002, 31, 1257–1274. [Google Scholar] [CrossRef] [Green Version]
- Ripple, W.J.; Wolf, C.; Newsome, T.M.; Galetti, M.; Alamgir, M.; Crist, E.; Mahmoud, M.I.; Laurance, W.F. World Scientists’ Warning to Humanity: A Second Notice. BioScience 2017, 67, 1026–1028. [Google Scholar] [CrossRef]
- Kern, F.; Smith, A. Restructuring energy systems for sustainability? Energy transition policy in The Netherlands. Energy Policy 2008, 36, 4093–4103. [Google Scholar] [CrossRef]
- De Gooyert, V.; Rouwette, E.; van Kranenburg, H.; Freeman, E.; van Breen, H. Sustainability transition dynamics; Towards overcoming policy resistance. Technol. Forecast. Soc. Chang. 2016, 111, 135–145. [Google Scholar] [CrossRef] [Green Version]
- Rooney-Varga, J.N.; Kapmeier, F.; Sterman, J.D.; Jones, A.P.; Putko, M.; Rath, K. The Climate Action Simulation. Simul. Gaming 2020, 51, 114–140. [Google Scholar] [CrossRef] [Green Version]
- Cattaneo, C. Internal and external barriers to energy efficiency: Which role for policy interventions? Energy Effic. 2019, 12, 1293–1311. [Google Scholar] [CrossRef] [Green Version]
- Heinzle, S.L. Disclosure of energy operating cost information: A silver bullet for overcoming the energy-efficiency gap? J. Consum. Policy 2012, 35, 43–64. [Google Scholar] [CrossRef]
- Camilleri, A.R.; Larrick, R.P. Metric and scale design as choice architecture tools. J. Public Policy Mark. 2014, 33, 108–125. [Google Scholar] [CrossRef]
- Ungemach, C.; Camilleri, A.R.; Johnson, E.J.; Larrick, R.P.; Weber, E.U. Translated attributes as choice architecture: Aligning objectives and choices through decision signposts. Manag. Sci. 2007, 64, 1975–2471. [Google Scholar] [CrossRef] [Green Version]
- Cunningham, P.; Edler, J.; Flanagan, K.; Laredo, P. Innovation Policy Mix and Instrument Interaction: A Review. In Compendium of Evidence on the Effectiveness of Innovation Policy Intervention Project; Nesta Working Paper 13/20; Manchester Institute for Innovation Research, University of Manchester: Manchester, UK, 2013. [Google Scholar]
- Wiese, C.; Larsen, A.; Pade, L.-L. Energy Efficiency Policy: A Review of Instruments and Potential Interaction Effects. In Proceedings of the 40th Annual IAEE International Conference, Singapore, 18–21 June 2017. [Google Scholar]
- Lund, H.; Arler, F.; Østergaard, P.A.; Hvelplund, F.; Connolly, D.; Mathiesen, B.V.; Karnøe, P. Simulation versus Optimisation: Theoretical Positions in Energy System Modelling. Energies 2017, 10, 840. [Google Scholar] [CrossRef]
- Davis, P.K.; O’Mahony, A.; Pfautz, J. Social-Behavioral Modeling for Complex Systems; Stevens Institute Series on Complex Systems and Enterprises; Rouse, W.B., Ed.; John Whiley and Sons Inc.: Hoboken, NJ, USA, 2019; p. 992. [Google Scholar]
- Givler, T.; Lilienthal, P. Using HOMER® Software, NREL’s Micropower Optimization Model, to Explore the Role of Gen-Sets in Small Solar Power Systems; Case Study: Sri Lanka; Technical Report No. NREL/TP-710-36774; National Renewable Energy Laboratory: Golden, CO, USA, 2005. [Google Scholar]
- Loulou, R.; Goldstein, G.; Kanudia, A.; Lettila, A.; Remme, U.; Noble, K. Documentation for the TIMES Model PART I: Concepts and Theory. 2016. Available online: https://iea-etsap.org/docs/Documentation_for_the_TIMES_Model-Part-I_July-2016.pdf (accessed on 1 November 2021).
- Wiese, F.; Bramstoft, R.; Koduver, H.; Alonoso, A.P.; Balyk, O.; Kirkerud, J.G.; Tveten, A.G.; Bolkesjo, T.F.; Munster, M.; Ravn, H. Balmorel open source energy system model. Energy Strategy Rev. 2018, 20, 26–34. [Google Scholar] [CrossRef]
- Lund, H.; Thellufsen, J.Z. EnergyPLAN Advanced Energy Systems Analysis Computer Model Documentation; Version 15.1; Zenodo: Genève, Switzerland, 2020. [Google Scholar] [CrossRef]
- EMD International, EnergyPRO Modelling Tool. Available online: http://www.emd.dk/energypro/ (accessed on 8 December 2021).
- Callon, M.; Lascoumes, P.; Barthe, Y. Acting in an Uncertain World: An Essay on Technical Democracy, 2nd ed.; The MIT Press: Cambridge, MA, USA, 2001. [Google Scholar]
- Sterman, J.D. Communicating climate change risks in a skeptical world. Clim. Chang. 2011, 108, 811–826. [Google Scholar] [CrossRef] [Green Version]
- Sterman, J.D. Sustaining Sustainability: Creating a Systems Science in a Fragmented Academy and Polarized World. In Sustainability Science: The Emerging Paradigm and the Urban Environment; Weinstein, M., Turner, R.E., Eds.; Springer: New York, NY, USA, 2012; pp. 21–58. [Google Scholar]
- Ghaffarzadegan, N.; Lyneis, J.; Richardson, G.P. How small system dynamics models can help the public policy process. Syst. Dyn. Rev. 2011, 27, 22–44. [Google Scholar] [CrossRef] [Green Version]
- Bolwig, S.; Bazbauers, G.; Klitkou, A.; Lund, P.; Blumberga, A.; Gravelsins, A.; Blumberga, D. Review of modelling energy transitions pathways with application to energy system flexibility. Renew. Sustain. Energy Rev. 2019, 101, 440–452. [Google Scholar] [CrossRef]
- Blumberga, D.; Blumberga, A.; Barisa, A.; Rosa, M.; Lauka, D. Modelling the Latvian power market to evaluate its environmental long-term performance. Appl. Energy 2016, 162, 1593–1600. [Google Scholar] [CrossRef]
- Gravelsins, A.; Bazbauers, G.; Blumberga, A.; Blumberga, D.; Bolwig, S.; Klitkou, A.; Lund, P.D. Modelling energy production flexibility: System dynamics approach. Energy Procedia 2018, 147, 503–509. [Google Scholar] [CrossRef]
- Ziemele, J.; Gravelsins, A.; Blumberga, A.; Vigants, G.; Blumberga, D. System dynamics model analysis of pathway to 4th generation district heating in Latvia. Energy 2016, 110, 85–94. [Google Scholar] [CrossRef]
- Blumberga, A.; Zogla, G.; Moxnes, E.; Davidsen, P. Residential Energy Efficiency Policy in Latvia: A System Dynamics Approach. In Proceedings of the 29th International Conference of the System Dynamics Society, Washington, DC, USA, 24–28 July 2011; pp. 373–396. [Google Scholar]
- Blumberga, A.; Blumberga, D.; Bažbauers, G.; Žogla, G.; Laicāne, I. Sustainable Development Modelling for the Energy Sector. J. Clean. Prod. 2014, 63, 134–142. [Google Scholar] [CrossRef]
- Blumberga, A.; Bazbauers, G.; Vancane, S.; Ijabs, I.; Nikisins, J.; Blumberga, D. Unintended effects of energy efficiency policy: Lessons learned in the residential sector. Energies 2021, 14, 7792. [Google Scholar] [CrossRef]
- Asere, L.; Blumberga, A. Government and Municipality Owned Building Energy Efficiency System Dynamics Modelling. Energy Procedia 2014, 72, 180–187. [Google Scholar] [CrossRef] [Green Version]
- Moxnes, E. Interfuel substitution in OECD-European electricity production. Syst. Dyn. Rev. 1990, 6, 44–65. [Google Scholar] [CrossRef] [Green Version]
- Stern, P.C.; Oskamp, S. Handbook of Environmental Psychology; Wiley: New York, NY, USA, 1987. [Google Scholar]
- Lewin, K. Field theory and experiment in social psychology: Concepts and methods. Am. J. Sociol. 1939, 44, 868–896. [Google Scholar] [CrossRef]
- Barlas, Y. Formal aspects of model validity and validation in system dynamics. Syst. Dyn. Rev. 1996, 12, 183–210. [Google Scholar] [CrossRef]
- Forrester, J.; Senge, P. Tests for building confidence in system dynamics models. TIMS Stud. Manag. Sci. 1980, 14, 209–228. [Google Scholar]
- Danish Energy Agency. Technology Data. Available online: https://ens.dk/en/our-services/projections-and-models/technology-data (accessed on 8 November 2021).
- Ministry of Economics Republic of Latvia. Available online: https://www.em.gov.lv/lv (accessed on 8 December 2021).
- Central Statistical Bureau Republic of Latvia. Available online: https://www.csp.gov.lv/lv (accessed on 8 December 2021).
- Eurostat. Simplified Energy Balances. Available online: https://ec.europa.eu/eurostat/data/database (accessed on 12 December 2021).
- Djatkoviča, E. Gas and Dirty Money: Russian Corrosive Capital in Latvia; The Authoritarian Corrosive Capital in CEE Series; edited by the Central European Institute of Asian Studies; Central European Institute of Asian Studies: Bratislava, Slovakia, 2020. [Google Scholar]
- Conley, A.H.; Stefanov, R.; Mina, J.; Vladimirov, M. The Kremlin Playbook: Understand Russian Influence in Central and Eastern Europe; Center for Strategic and International Studies; Rowman & Littlefield: New York, NY, USA, 2016. [Google Scholar]
- The Saeima. Electricity Market Law; The Saeima: Riga, Latvia, 8 June 2005. [Google Scholar]
- Ministry of Finance of the Republic of Latvia. Nodokļu Atvieglojumu Ziņojums Par 2017. Gadu; ar likumdošanas izmaiņām, kas stājušās spēkā no 2018.gada; Ministry of Finance of the Republic of Latvia: Riga, Latvia, 2018. [Google Scholar]
- Kubule, A.; Locmelis, K.; Blumberga, D. Analysis of the results of national energy audit program in Latvia. Energy 2020, 202, 117679. [Google Scholar] [CrossRef]
- Locmelis, K.; Blumberga, D.; Blumberga, A.; Kubule, A. Benchmarking of Industrial Energy Efficiency. Outcomes of an Energy Audit Policy Program. Energies 2020, 13, 2210. [Google Scholar] [CrossRef]
- Blumberga, A.; Azis, R.; Blumberga, D. Like a broken stick and no carrot: Ex-post analysis of public sector energy efficiency. In Proceedings of the eceee 2021 Summer Study on Energy Efficiency: A new reality? Online, 7–11 June 2021. [Google Scholar]
- Institute of Energy Systems and Environment. Collection and Analysis of Data on Existing Latvian Energy Efficiency Policy Instruments with an Ex-Post Method and Analysis and Recommendations of the Existing Energy Efficiency Monitoring and Savings Verification System; Project Report; Institute of Energy Systems and Environment, Riga Technical University: Riga, Latvia, 2019; p. 131. [Google Scholar]
- Blumberga, A.; Āzis, R.; Reinbergs, D.; Pakere, I.; Blumberga, D. The Bright and Dark Sides of Energy Efficiency Obligation Scheme: The Case of Latvia. Energies 2021, 14, 4467. [Google Scholar] [CrossRef]
- Ministry of Economics Republic of Latvia. Ziņojums Par Virzību Uz Valsts Energoefektivitātes Mērķu 2020. Gadam Izpildi Par 2017. Gadu Atbilstoši Direktīvas 2012/27/ES 24. Panta 1. Punkta Un XIV Pielikuma 1. Daļas Prasībām; Ministry of Economics Republic of Latvia: Riga, Latvia, 2019. [Google Scholar]
- The State Audit Office of the Republic of Latvia. Vai tiek īstenota mērķtiecīga energoefektivitātes politika plānotā enerģijas gala patēriņa ietaupījuma sasniegšanai? Riga, Latvia. 2018. Available online: https://www.environmental-auditing.org/media/112843/audit-report-latvian.pdf (accessed on 8 December 2021).
- Brown, S. Russia’s Use of the Energy Weapon: How Russia Manipulates Ukraine, Georgia, and the Baltic States. Sch. Horiz. Univ. Minn. Morris Undergrad. J. 2019, 6, 1. [Google Scholar]
- Unruhs, G.C. Escaping carbon lock-in. Energy Policy 2002, 30, 317–325. [Google Scholar] [CrossRef]
- Geels, F.W.; Sovacool, B.K.; Schwanen, T.; Sorell, S. The Socio-Technical Dynamics of Low-Carbon Transitions. Joules 2017, 1, 463–479. [Google Scholar] [CrossRef] [Green Version]
Publisher’s Note: MDPI stays neutral with regard to jurisdictional claims in published maps and institutional affiliations. |
© 2021 by the authors. Licensee MDPI, Basel, Switzerland. This article is an open access article distributed under the terms and conditions of the Creative Commons Attribution (CC BY) license (https://creativecommons.org/licenses/by/4.0/).