
Comparative Life-Cycle Assessment of Liquefied Natural Gas and Diesel Tractor-Trailer in China


Abstract
:1. Introduction

| Authors | Vehicle Type | Country/ Region | Research Boundary | Assessed Environmental Loads/Impacts |
|---|---|---|---|---|
| Arteconi, et al. [26] | HGVs powered by diesel, LNG under two procurement scenarios (the regasification terminal or producing LNG locally with small-scale plants) | EU-15 (i) | Fuel cycle | GHG emissions |
| Tong, Jaramillo, and Azevedo [27] | 7 types of medium- and heavy-duty vehicles powered by conventional gas, diesel, and NG-based fuels | U.S. | Fuel cycle | GHG emissions |
| Tu, Yang, Xu, and Chen [25] | LNG and diesel mixer | China | Fuel cycle + vehicle cycle | GHG and criteria air pollutant emissions |
| Tu, Xu, Chen, and Yang [24] | LNG and diesel mixer | China | Fuel cycle + vehicle cycle | Energy consumption |
| Cai, et al. [28] | LNG combination short-haul truck, compressed natural gas (CNG) transit bus, CNG refuse truck and their diesel counterparts | U.S. | Fuel cycle | Freshwater consumption, GHG emissions, NOx and PM emissions |
| Song, Ou, Yuan, Yu, and Wang [4] | LNG and diesel HDVs (tractor, dump, freight, and special truck) | China | Fuel cycle + vehicle cycle | Energy consumption and GHG emissions |
| Ozbilen, et al. [29] | Class 8 trucks powered by LNG, CNG, Euro IV diesel, Biodiesel, Fisher–Tropsch diesel | Canada | Vehicle cycle + Operation stage + road cycle | Global warming potential (GWP) |
| Cooper, Hawkes, and Balcombe [23] | HGVs powered by CNG, LNG (dedicated and dual fuel), diesel, biodiesel, dimethyl ether, and electric battery | U.K. | Fuel cycle | GWP, land use change, particulate matter and photochemical ozone formation potential, human toxicity potential and metals depletion, and fossil fuel depletion potential |
| Langshaw, et al. [30] | LNG and diesel long-haul HGVs | U.K. | Fuel cycle | GHG emissions |
| Yuan, Ou, Peng, and Yan [5] | CNG, LNG and diesel transit buses with 12.5–14.5 ton and heavy-duty truck with 20–25 ton | China | Fuel cycle | GHG emissions |
2. Materials and Methods
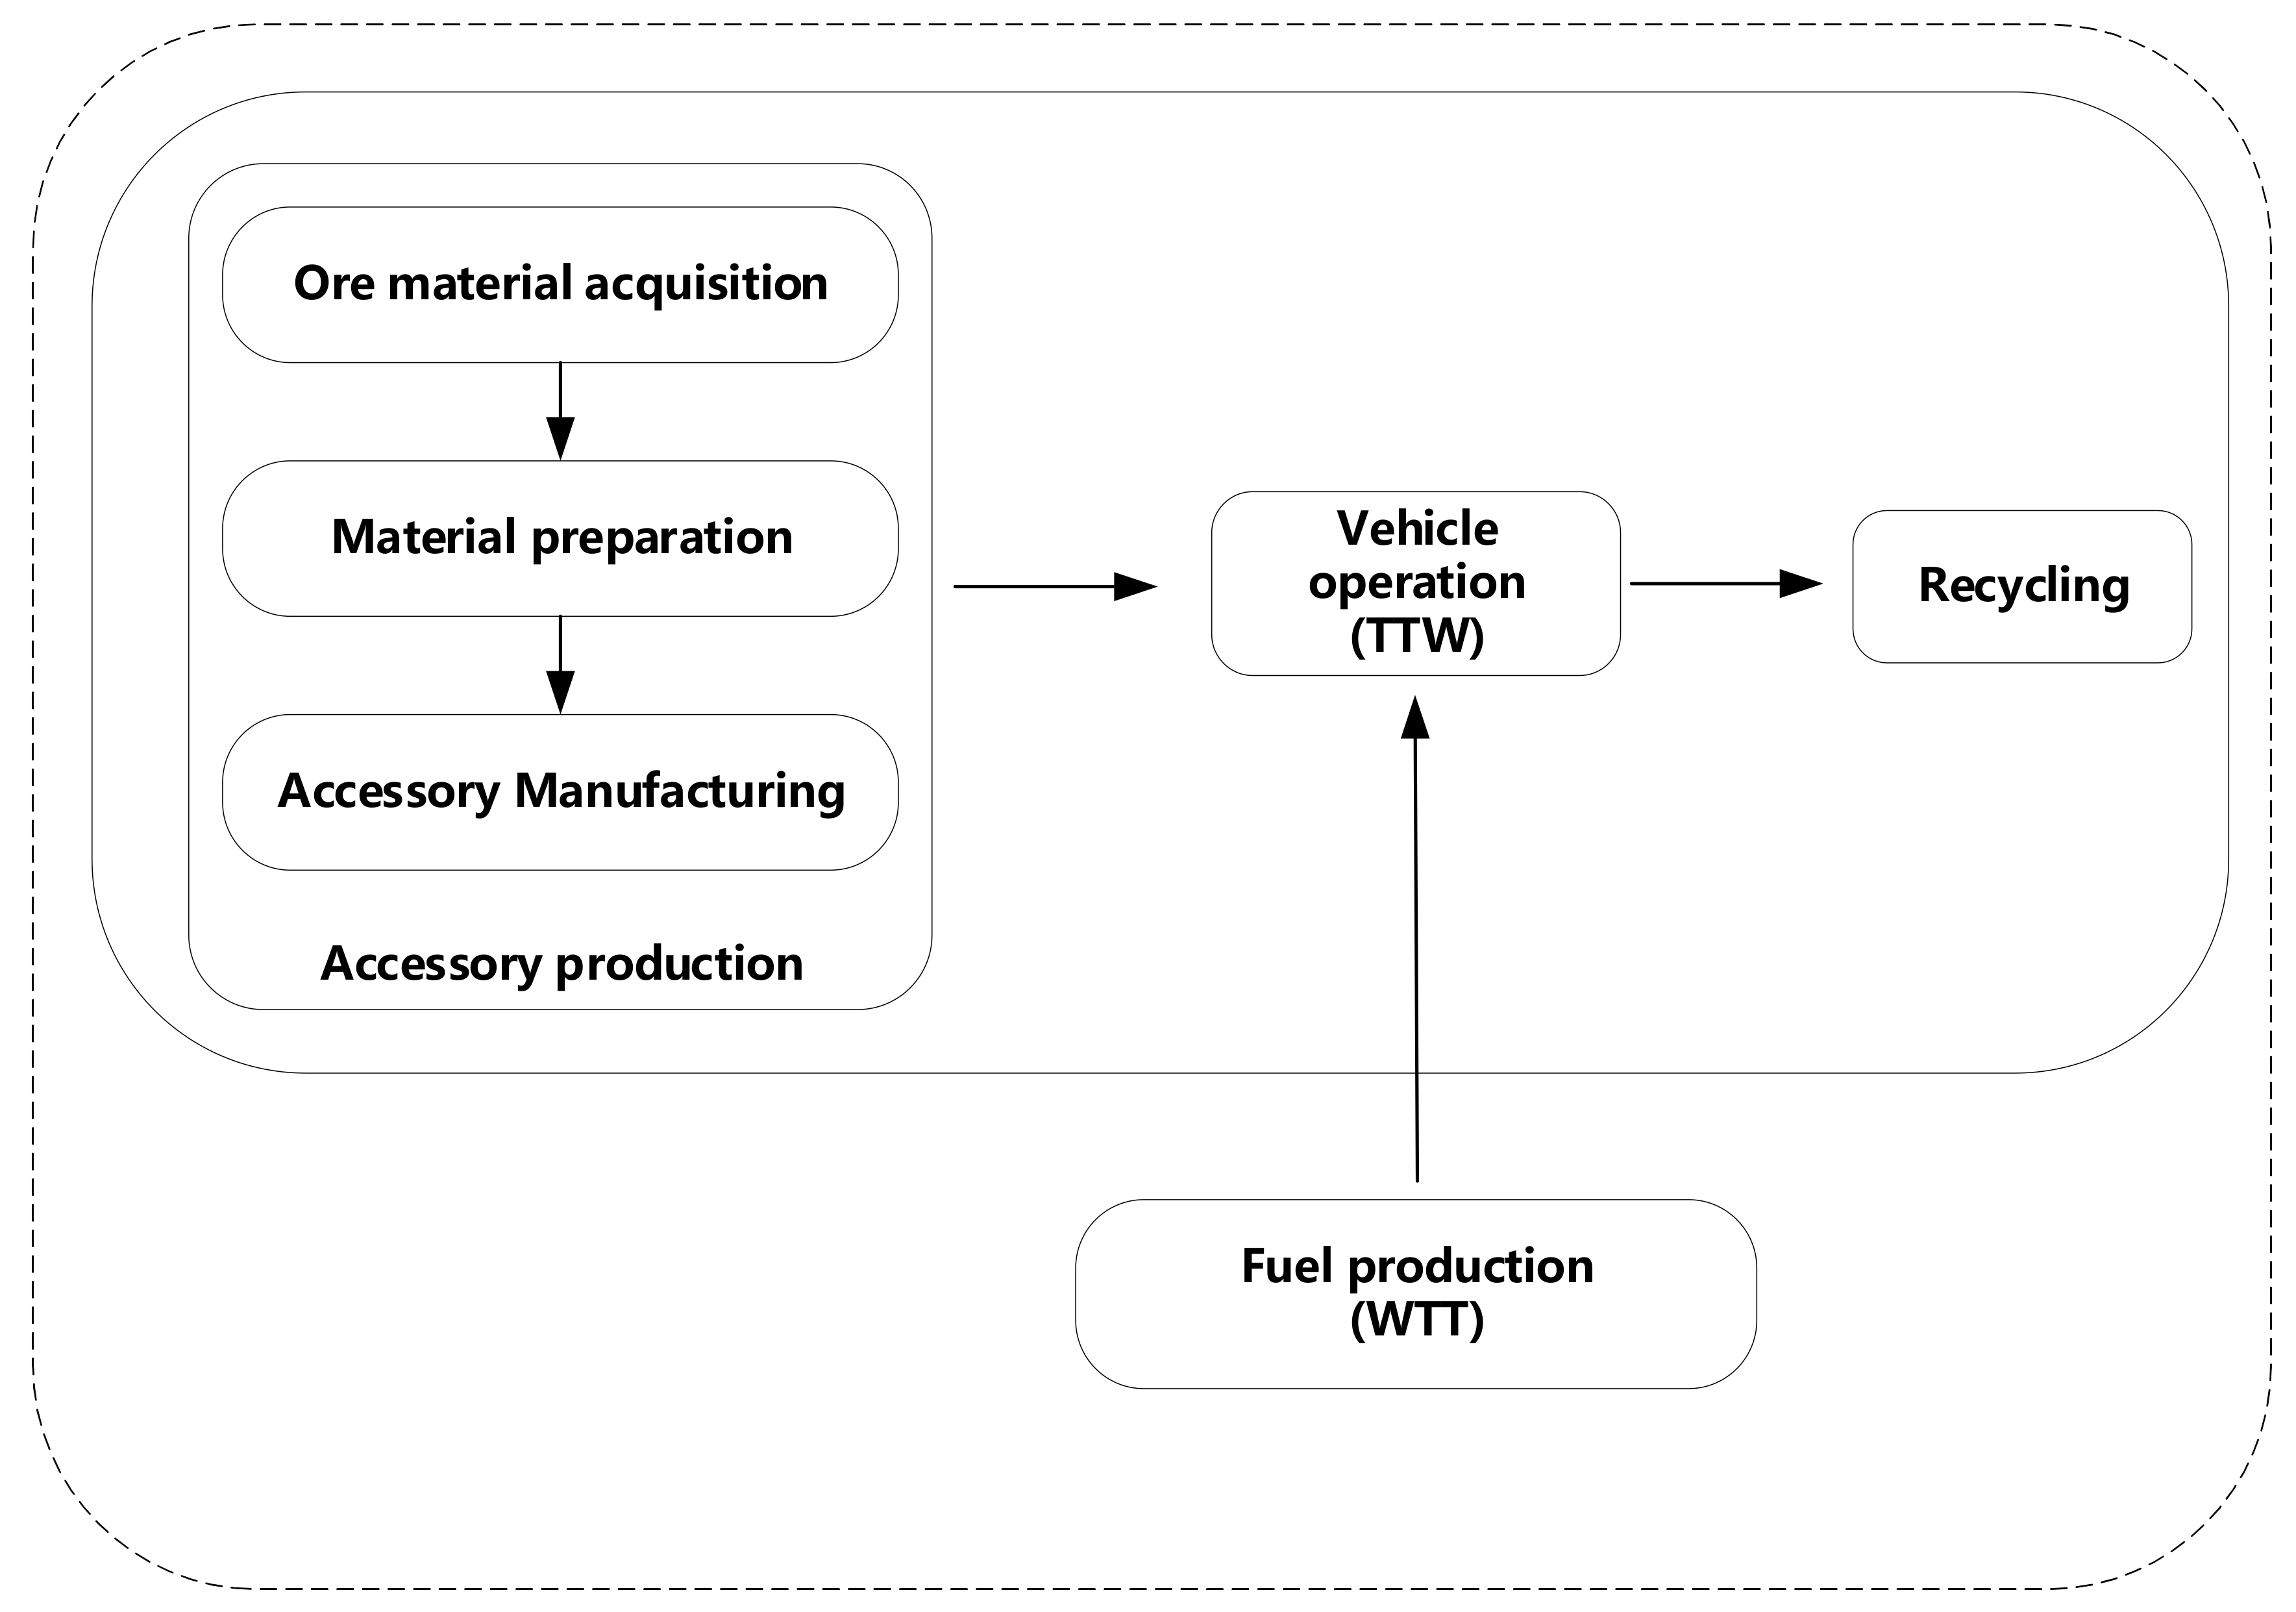
2.1. Goal and Scope Definition
2.2. Life-Cycle Inventory (LCI) Analysis
2.2.1. Model for Differences in Environmental Loads
- Matrix for mass difference of accessory materials
- 2.
- Calculation of ore material consumption difference
- 3.
- Calculation of the difference in energy consumption and air emission
2.2.2. Data and Assumption
2.3. Life-Cycle Impact Assessment (LCIA)
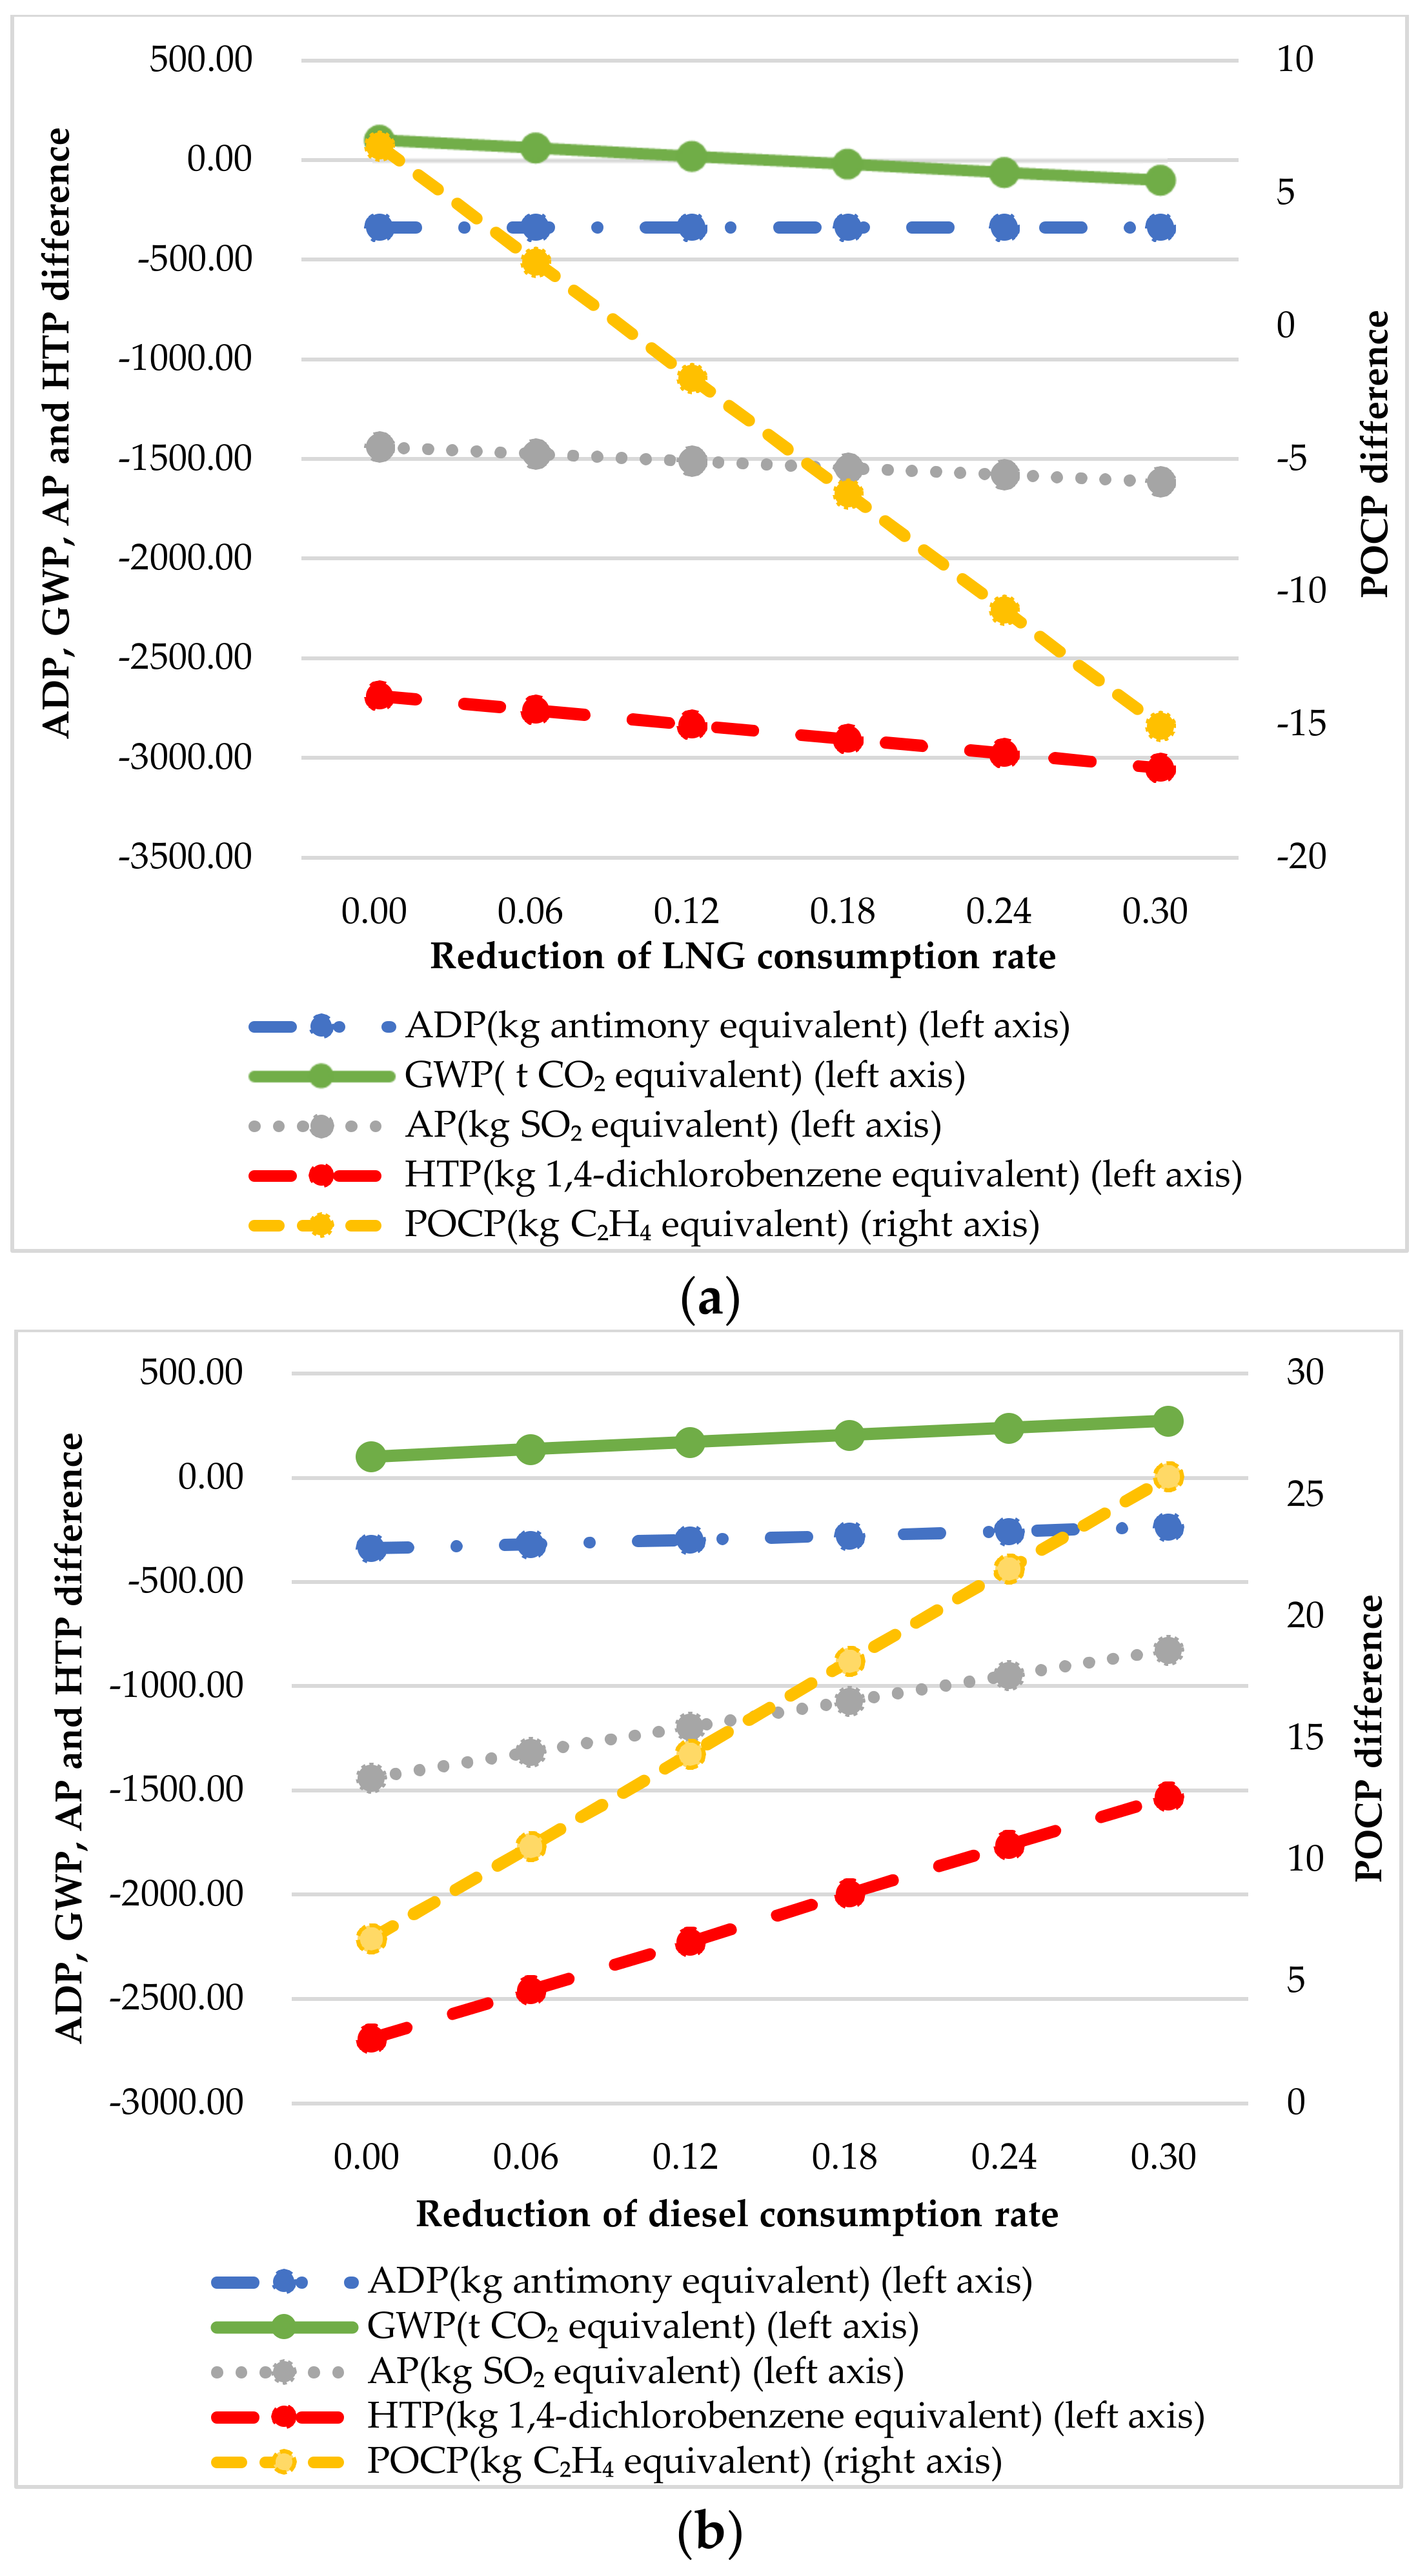
2.4. Sensitivity Analysis
3. Results and Discussion
3.1. LCI Results
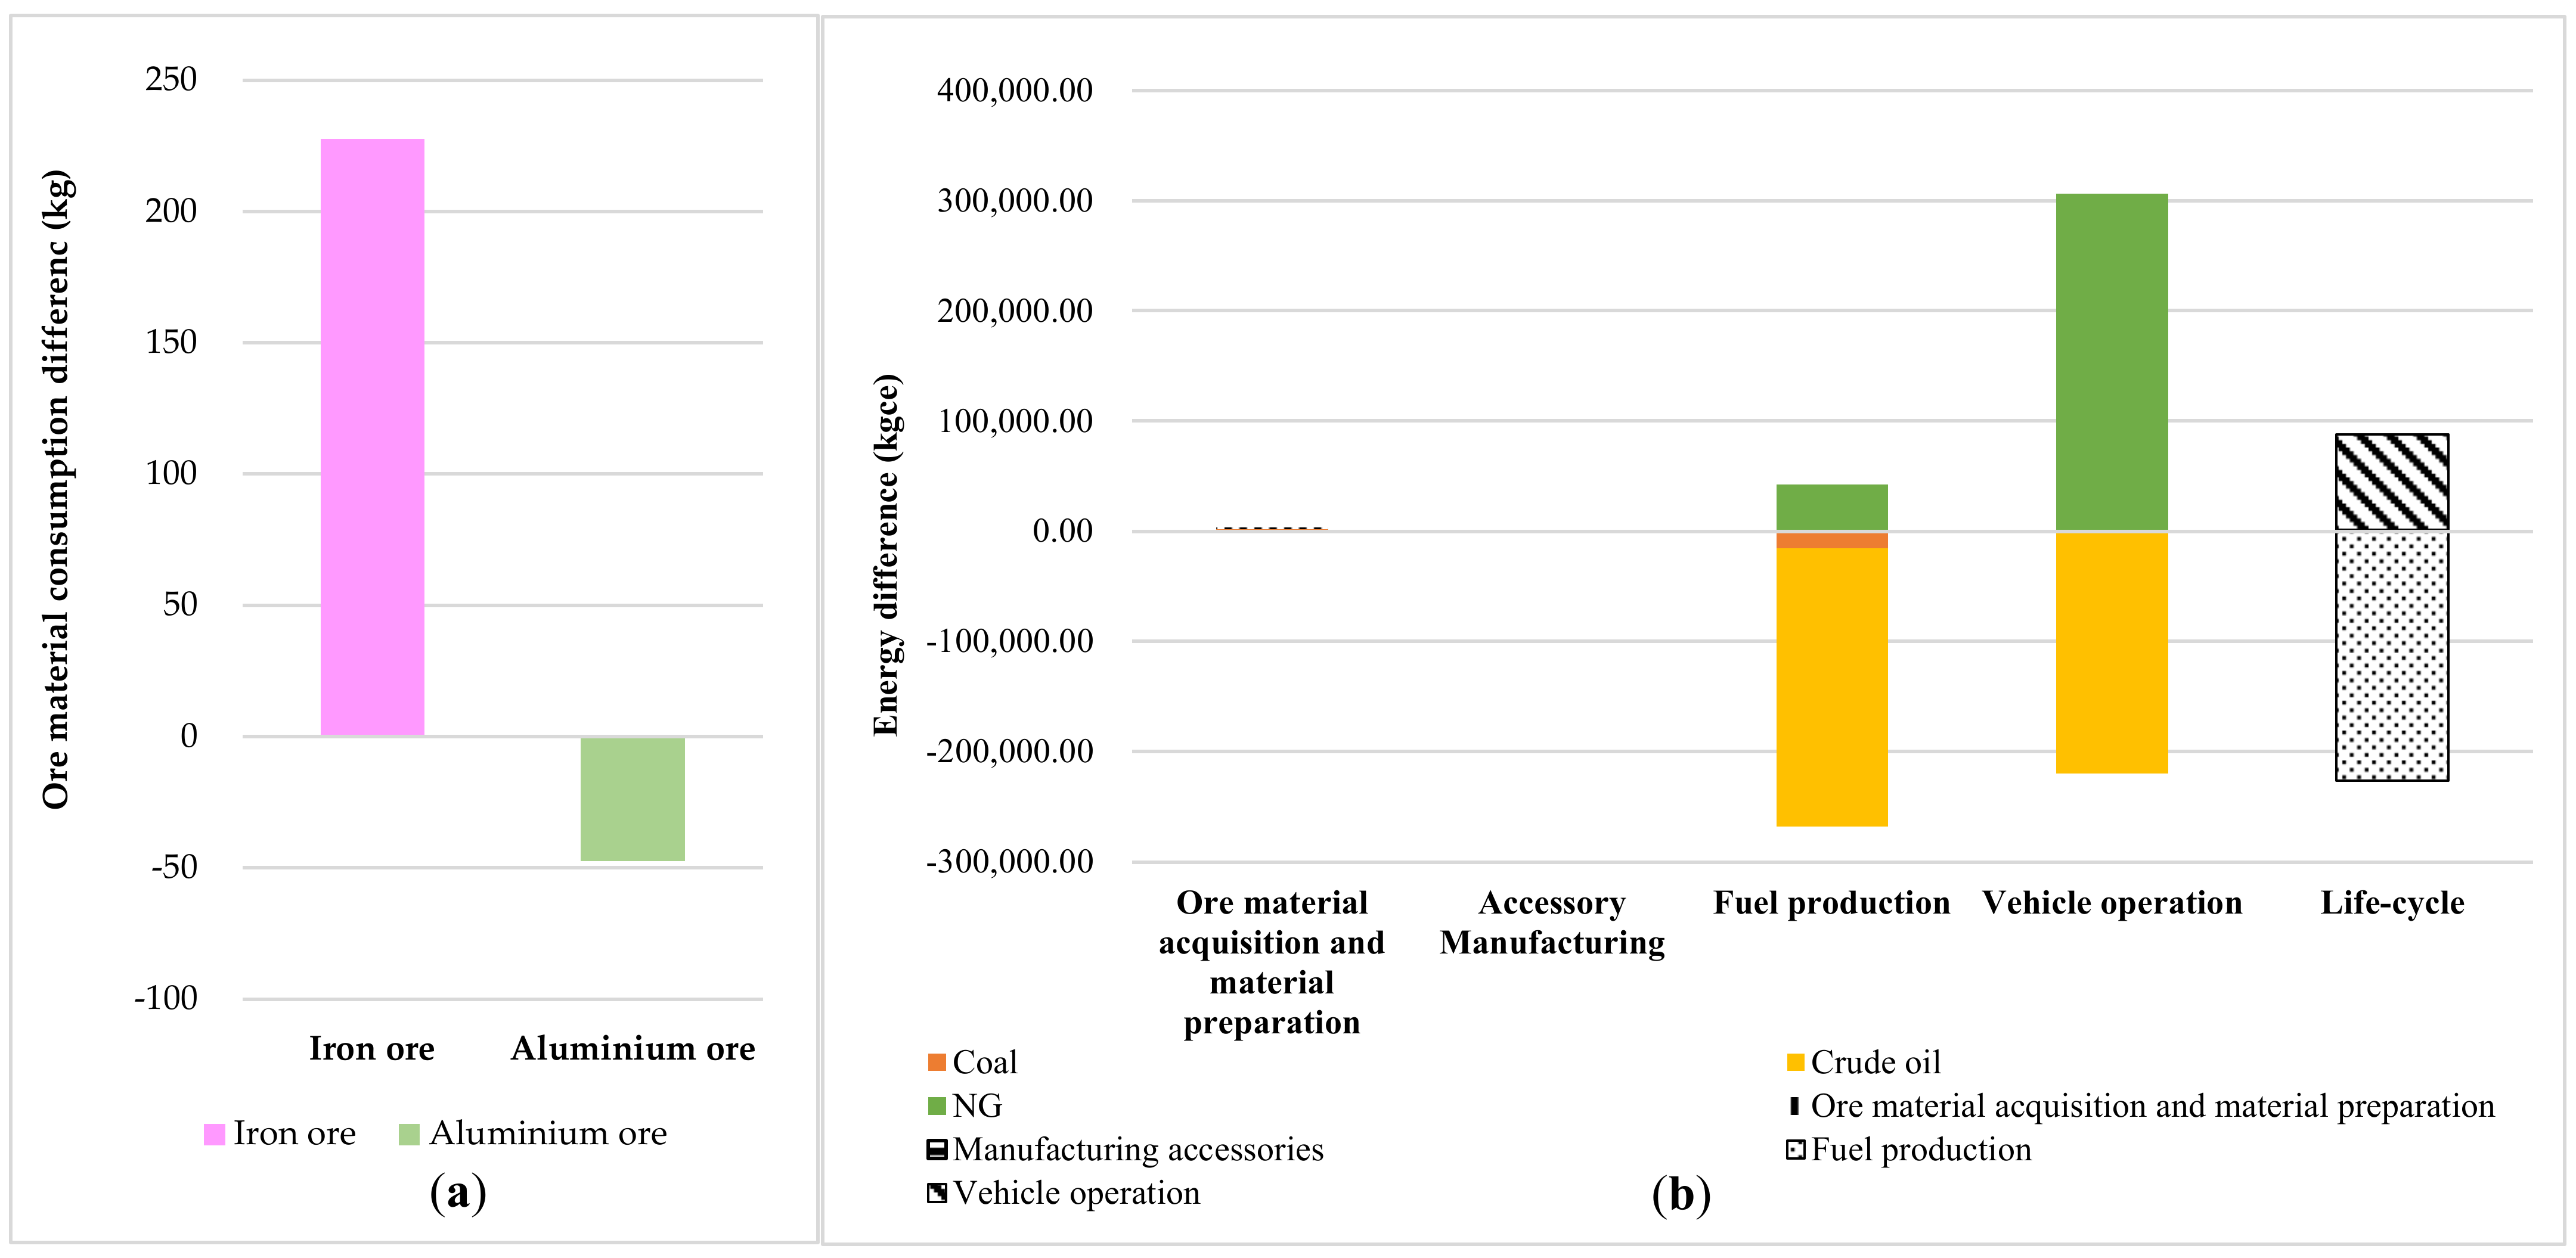
3.1.1. Resource Consumption
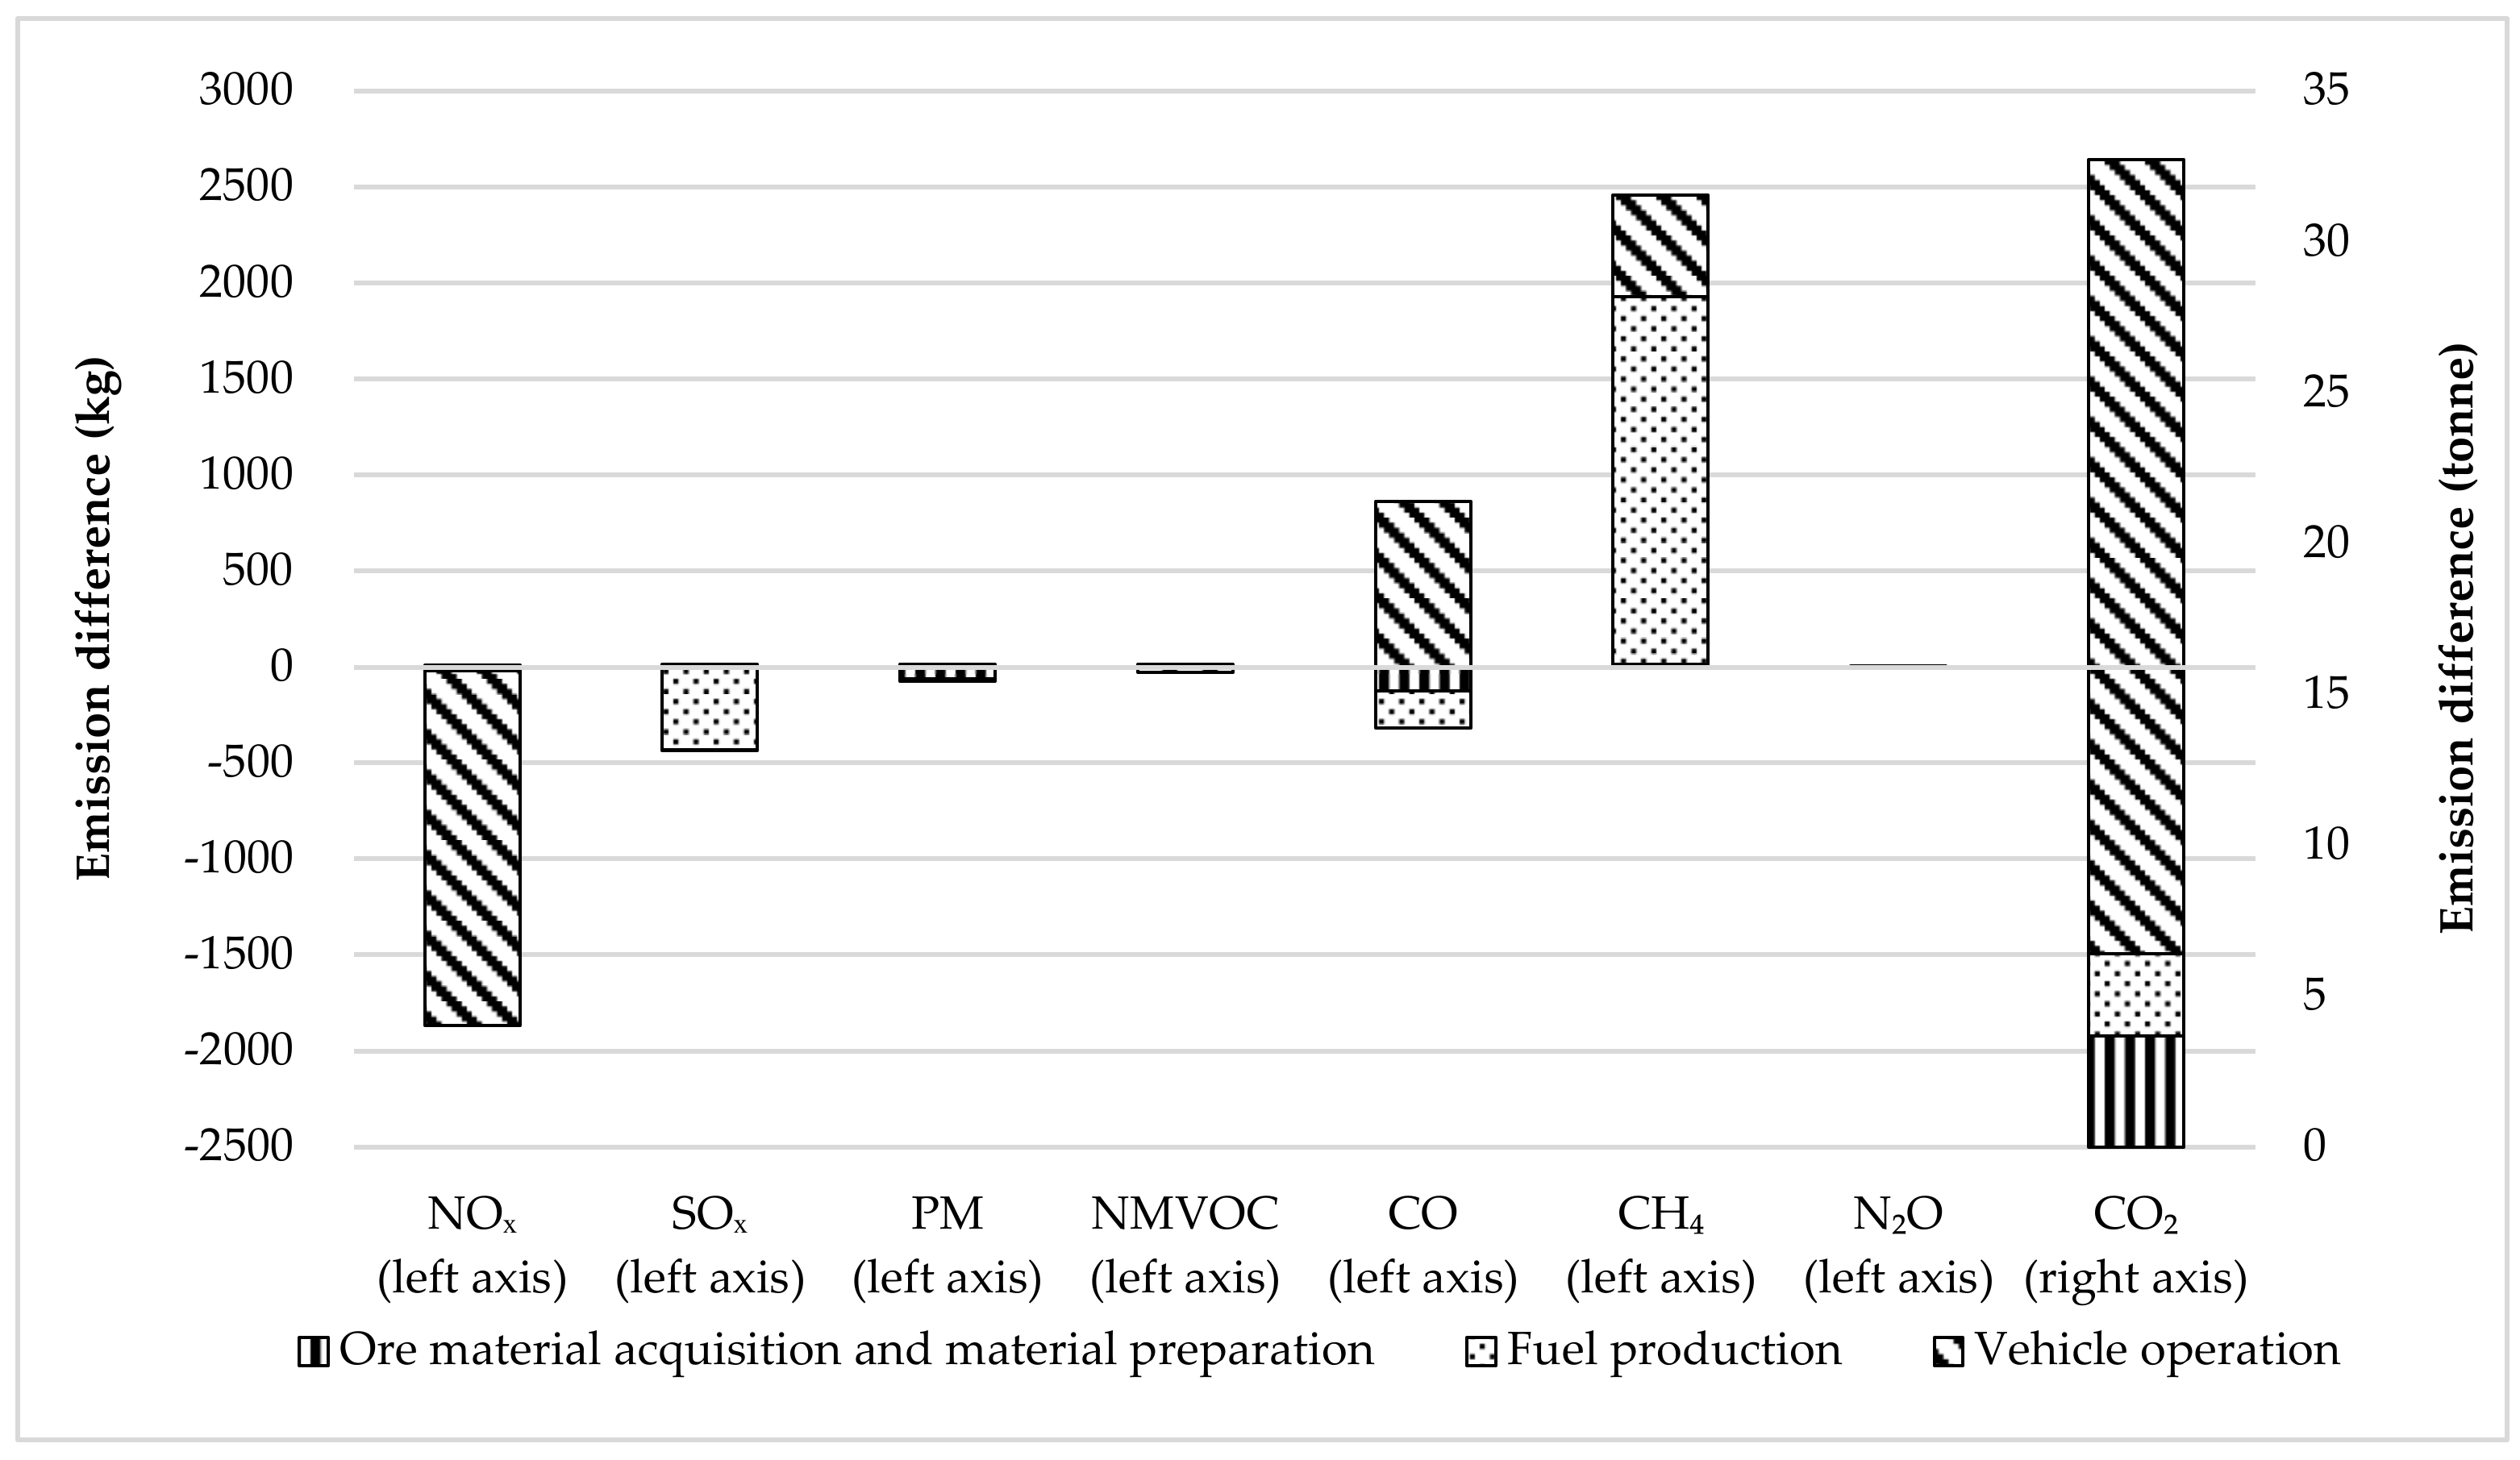
3.1.2. Air Emission
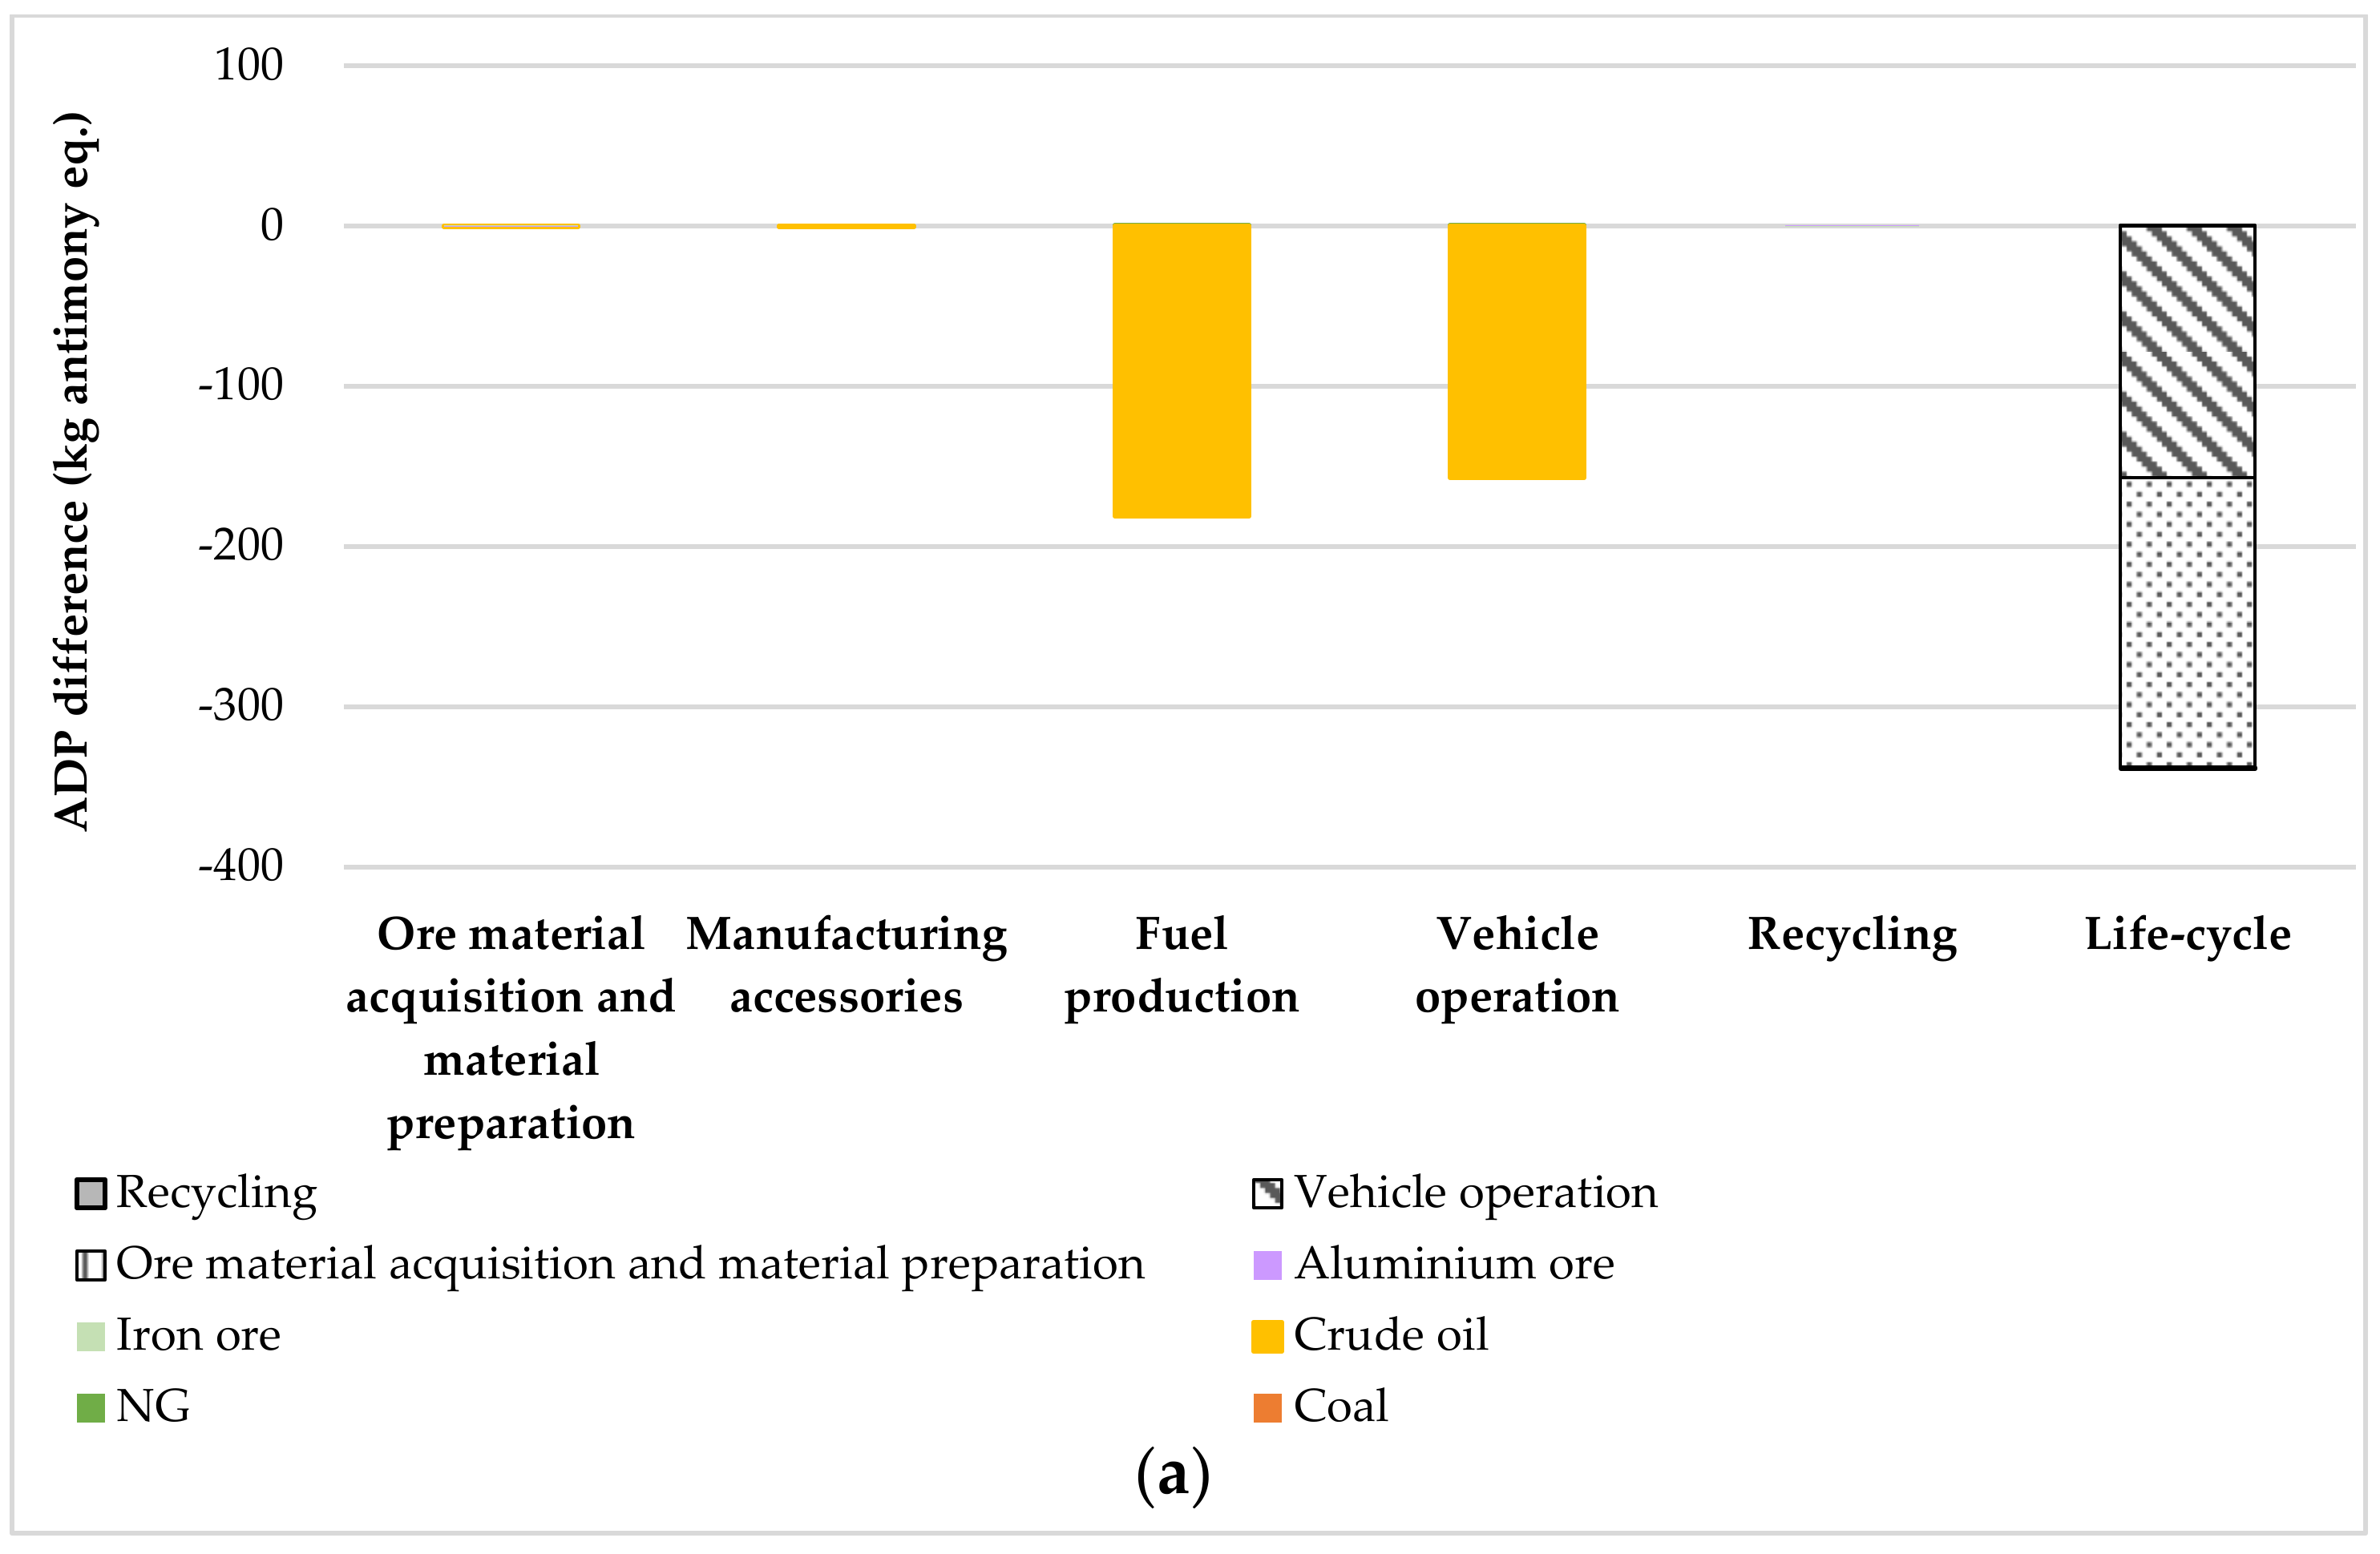
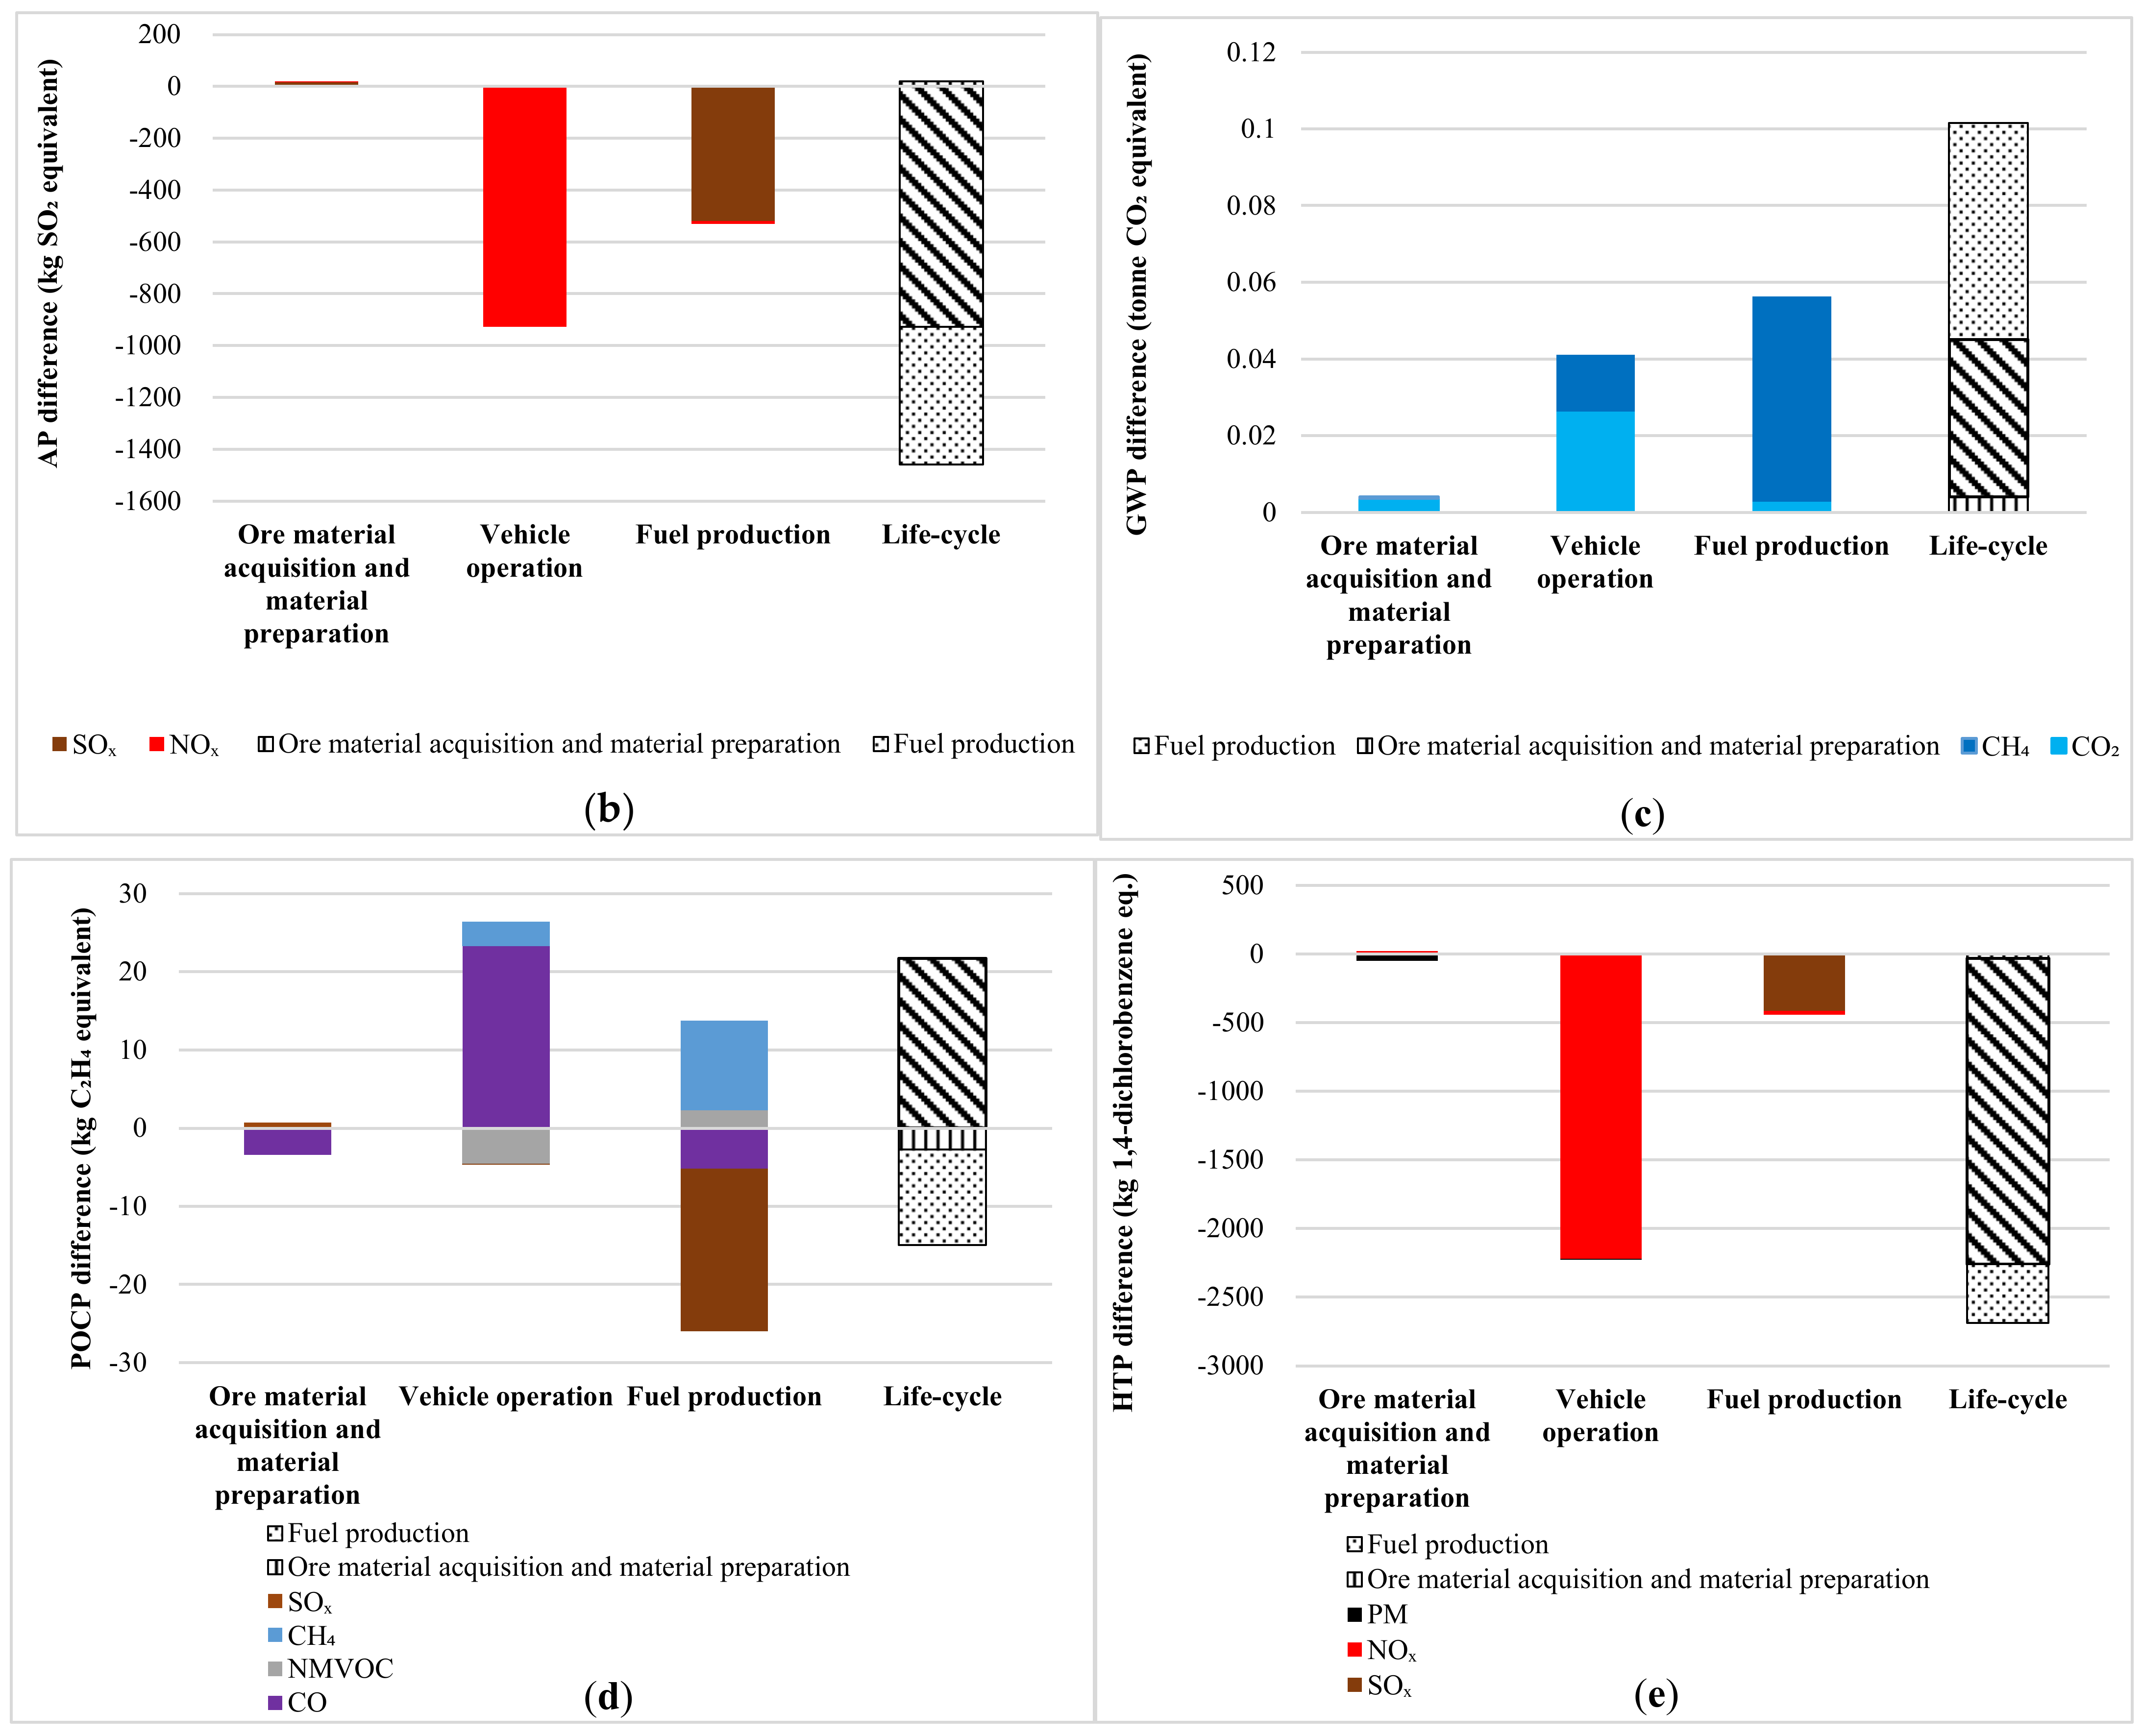
3.2. LCIA Results
3.3. Sensitivity Analysis Results
4. Conclusions
Author Contributions
Funding
Institutional Review Board Statement
Informed Consent Statement
Data Availability Statement
Acknowledgments
Conflicts of Interest
Appendix A
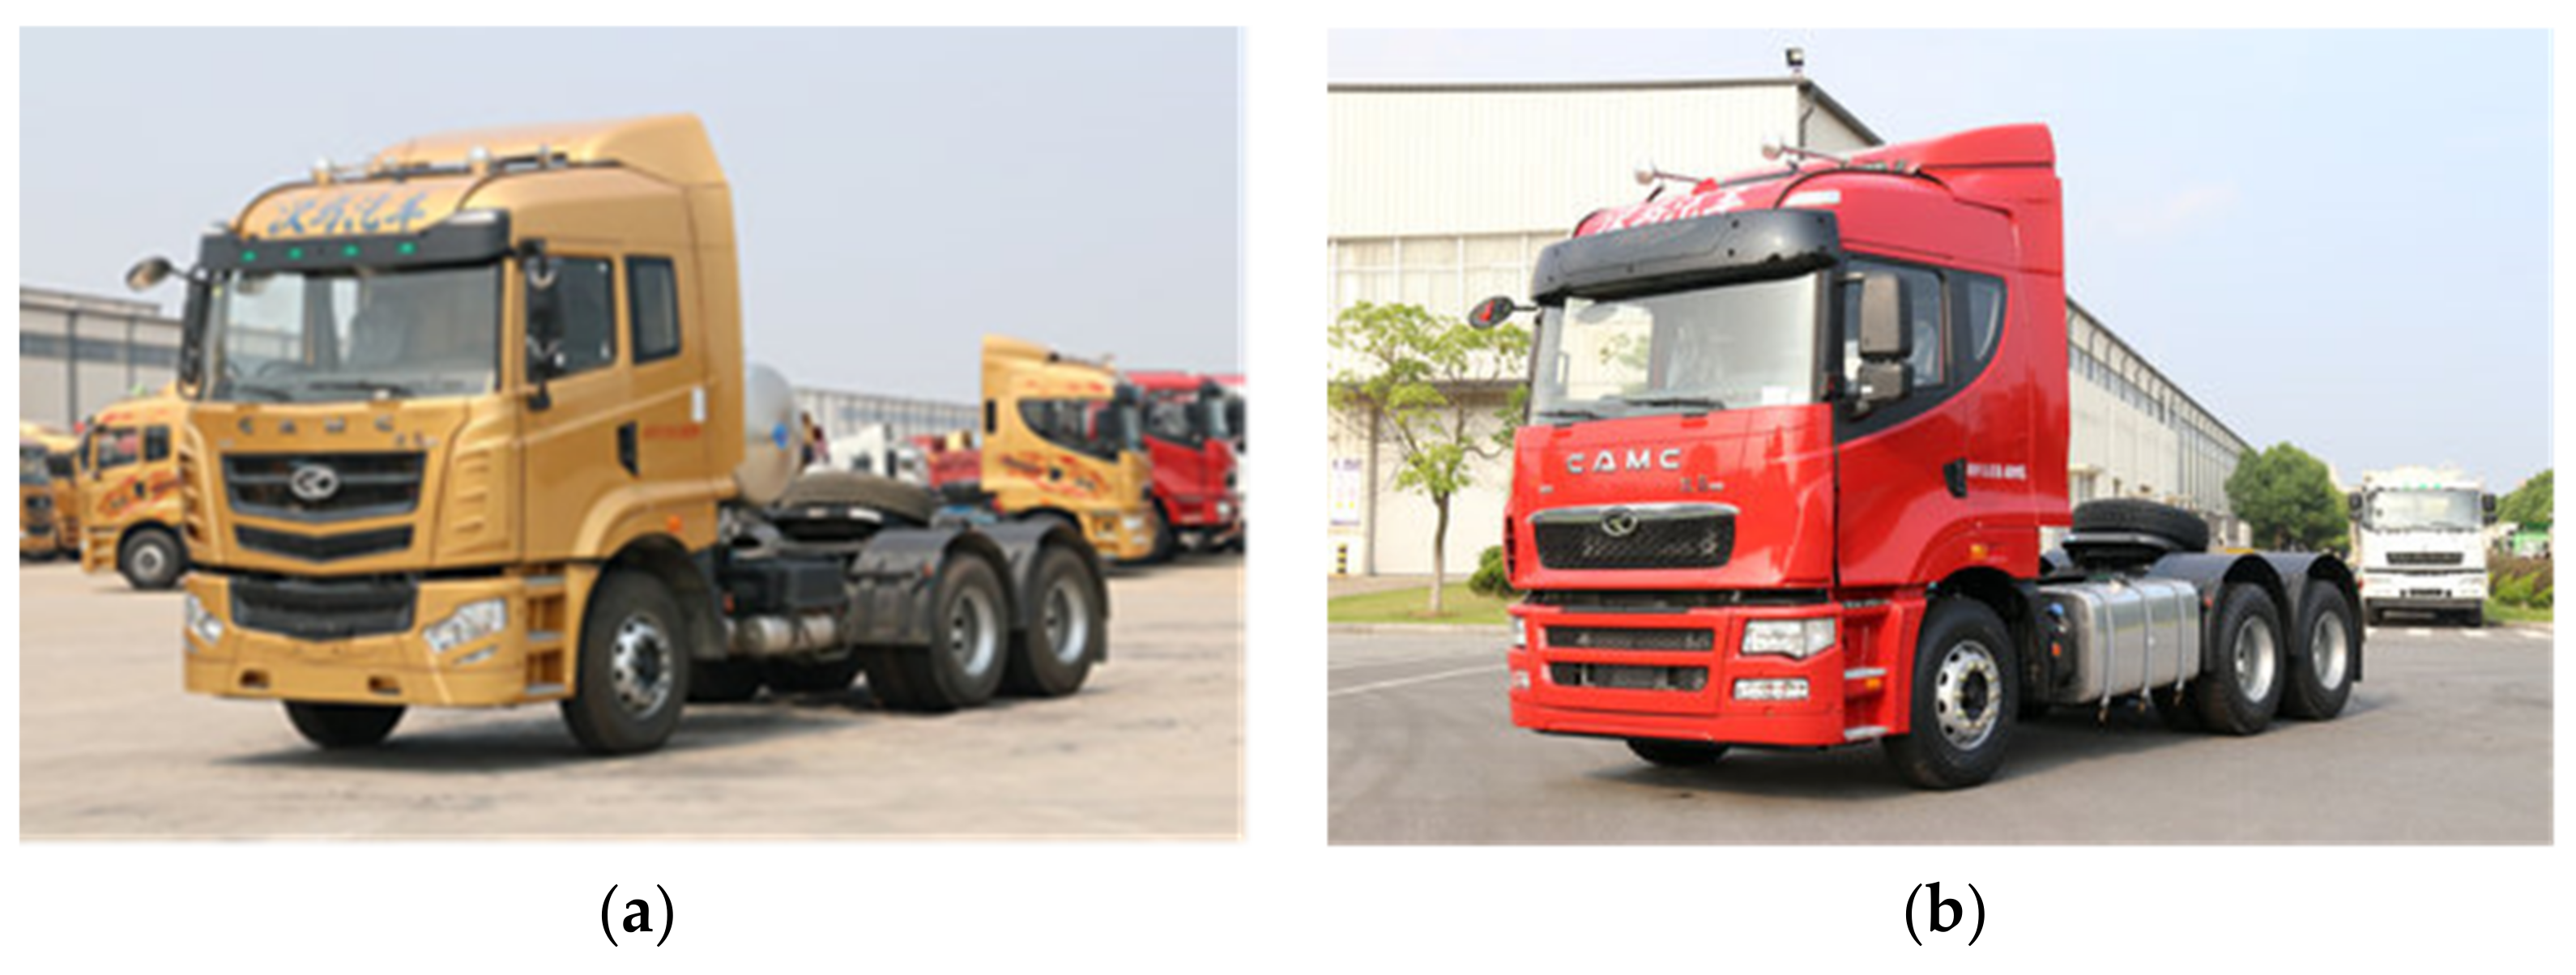
| Vehicle | Diesel Tractor-Trailer | LNG Tractor-Trailer |
|---|---|---|
| Boundary dimensions | 7085 × 2550 × 3800 | 7490 × 2550 × 3800 |
| Length × width × height | ||
| (mm × mm × mm) | ||
| Tractive weight (t) | 40 | 40 |
| Wheelbase (mm) | 3400 + 1350 | 3800 + 1350 |
| Curb weight (kg) | 8700 | 9680 |
| Volume of feed system (L) | 800 | 1000 |
| Rated power (kW) | 327 | 316 |
| Fuel consumption rate (L/100 km) | 44.8 | 100 |
| Life-Cycle Stage | Data Types | Value | |
|---|---|---|---|
| Ore material acquisition and material preparation | Use ratios of materials during ore material acquisition and material preparation (%) (i) | Steel | 32.77 |
| Cast aluminum | 22.67 | ||
| Integrated energy intensity data for acquiring and preparing steel (kg/kg for raw coal and crude oil, kg/m3 for natural gas) | Raw coal | 1.1548 | |
| Crude oil | 0.0094 | ||
| Natural gas | 0.0046 | ||
| Integrated emission intensity data for acquiring and preparing steel (g/kg) | NMVOC | 0.0418 | |
| SOx | 9.5569 | ||
| NOx | 4.4640 | ||
| CO | 0.3230 | ||
| PM | 9.4156 | ||
| CH4 | 5.3481 | ||
| N2O | 0.0062 | ||
| CO2 | 2133.7190 | ||
| Integrated energy intensity data for acquiring and preparing cast aluminum (kg/kg for raw coal and crude oil, kg/m3 for natural gas) | Raw coal | 5.8566 | |
| Crude oil | 0.6927 | ||
| Natural gas | 0.2315 | ||
| Integrated emission intensity data for acquiring and preparing cast aluminum (g/kg) | NMVOC | 25.2767 | |
| SOx | 78.6827 | ||
| NOx | 25.2767 | ||
| CO | 504.9787 | ||
| PM | 374.7286 | ||
| CH4 | 11.8997 | ||
| N2O | 0.1420 | ||
| CO2 | 14,098.6340 | ||
| Conversion factors from physical unit to coal equivalent (kgce/kg for raw coal and crude oil, kgce/m3 for natural gas) | Raw coal | 0.7143 | |
| Crude oil | 1.4286 | ||
| Natural gas | 1.215 (ii) | ||
| Accessory manufacturing | Use ratios of materials during accessory manufacture (%) | Steel | 55 |
| Cast aluminum | 80 | ||
| Amount of energy consumption for manufacturing fuel tank and bracket (kgce) | LNG tractor-trailer | 149 | |
| Diesel tractor-trailer | 210 | ||
| Recycling | Recovery ratio of materials (%) | Steel | 93.3 |
| Cast aluminum | 81.3 | ||
| Fuel production | Amount of energy consumption for producing a unit of LNG (kg/kg for raw coal and crude oil, kg/m for natural gas) | Raw coal | 2.4707 |
| Crude oil | 10.3424 | ||
| Natural gas | 179.3640 | ||
| Amount of energy consumption for producing a unit of LNG (Btu/mmBtu) | Raw coal | 2470.6820 | |
| Crude oil | 10,342.4188 | ||
| Natural gas | 179,363.9926 | ||
| Amount of air emission for producing a unit of LNG (g/kgce) (ii) | NMVOC | 0.2157 | |
| SOx | 0.3618 | ||
| NOx | 0.8039 | ||
| CO | 0.5575 | ||
| PM | 0.0530 | ||
| CH4 | 6.5327 | ||
| N2O | 0.0048 | ||
| CO2 | 325.5496 | ||
| Amount of energy consumption for producing a unit of diesel (kg/kg for raw coal and crude oil, kg/m3 for natural gas) | Raw coal | 0.1488 | |
| Crude oil | 1.1882 | ||
| Natural gas | 0.0701 | ||
| Amount of air emission for producing a unit of diesel (g/kgce) | NMVOC | 0.2312 | |
| SOx | 2.4746 | ||
| NOx | 1.2199 | ||
| CO | 1.6518 | ||
| PM | 0.0077 | ||
| CH4 | 0.3949 | ||
| N2O | 0.0066 | ||
| CO2 | 441.3109 | ||
| Vehicle operation | Fuel consumption rate (L/100 km) | LNG tractor-trailer | 100 |
| Diesel tractor-trailer | 44.8 | ||
| Amount of NMVOC, NOx, CO, PM, and CH4 emission per unit work for LNG engine operation (g/(kW · h)) | NMVOC | 0 | |
| NOx | 0.2640 | ||
| CO | 0.5610 | ||
| PM | 0.0000 | ||
| CH4 | 0.2110 | ||
| Amount of NMVOC, NOx, CO, PM, and CH4 emission per unit work for diesel engine operation (g/(kW · h)) | NMVOC | 0.0170 | |
| NOx | 1.4000 | ||
| CO | 0.3000 | ||
| PM | 0.0070 | ||
| CH4 | 0 | ||
| Sulfur in fuel (mg/kg) | LNG | 0.0000 | |
| Diesel | 10 | ||
| CO2 emission factor of fuel (g/MJ) | LNG | 56.10 | |
| Diesel | 74.10 | ||
| Conversion factor from physical unit to coal equivalent (kgce/MJ for heat, kgce/kW · h for electricity) | Heat | 0.03412 | |
| Electricity | 0.1229 | ||
| Calorific value (MJ/kg) | LNG | 49.3381 (iii) | |
| Diesel | 42.652 | ||
| Density (kg/L) | LNG | 0.455 (iv) | |
| Diesel | 0.843 | ||
| Impact Category | Contributor | Characterization Coefficient | Unit |
|---|---|---|---|
| ADP | Crude oil | 2.44 × 10⁻⁵ | kg antimony eq./MJ |
| Natural gas | 3.34 × 10⁻⁸ | kg antimony eq./MJ | |
| Coal | 2.78 × 10⁻⁸ | kg antimony eq./MJ | |
| Iron | 1.05 × 10⁻⁴ | kg antimony eq./kg | |
| Aluminum | 3.46 × 10⁻⁴ | kg antimony eq./kg | |
| GWP 100 | CO2 | 1.00 × 10 | kg CO2 eq./kg |
| N2O | 2.65 × 10² | kg CO2 eq./kg | |
| CH4 | 2.80 × 101 | kg CO2 eq./kg | |
| AP | SOx | 1.20 × 10 | kg SO2 eq./kg |
| NOx | 5.00 × 10⁻¹ | kg SO2 eq./kg | |
| HTP | SOx | 9.6 × 10⁻² | kg 1,4-dichlorobenzene eq./kg |
| NOx | 1.20 × 10 | kg 1,4-dichlorobenzene eq./kg | |
| PM | 8.20 × 10⁻¹ | kg 1,4-dichlorobenzene eq./kg | |
| POCP | SOx | 4.80 × 10⁻² | kg C2H4 eq./kg |
| CO | 2.70 × 10⁻² | kg C2H4 eq./kg | |
| NMVOC | 1.50 × 10⁻¹ | kg C2H4 eq./kg |
References
- Li, B.; Yin, H.; Wang, F. Will China’s “dash for gas” halt in the future? Resour. Conserv. Recycl. 2018, 134, 303–312. [Google Scholar] [CrossRef]
- Meyer, P.A.; Snowden-Swan, L.J.; Jones, S.B.; Rappe, K.G.; Hartley, D.S. The effect of feedstock composition on fast pyrolysis and upgrading to transportation fuels: Techno-economic analysis and greenhouse gas life cycle analysis. Fuel 2020, 259, 11. [Google Scholar] [CrossRef]
- Shell Shell LNG outlook 2021. Available online: https://www.shell.com/energy-and-innovation/natural-gas/liquefied-natural-gas-lng/lng-outlook-2021.html (accessed on 1 November 2021).
- Song, H.; Ou, X.; Yuan, J.; Yu, M.; Wang, C. Energy consumption and greenhouse gas emissions of diesel/LNG heavy-duty vehicle fleets in China based on a bottom-up model analysis. Energy 2017, 140, 966–978. [Google Scholar] [CrossRef]
- Yuan, Z.; Ou, X.; Peng, T.; Yan, X. Life cycle greenhouse gas emissions of multi-pathways natural gas vehicles in china considering methane leakage. Appl. Energy 2019, 253, 113472. [Google Scholar] [CrossRef]
- Luis Osorio-Tejada, J.; Llera-Sastresa, E.; Scarpellini, S. A multi-criteria sustainability assessment for biodiesel and liquefied natural gas as alternative fuels in transport systems. J. Nat. Gas Sci. Eng. 2017, 42, 169–186. [Google Scholar] [CrossRef]
- Sharafian, A.; Blomerus, P.; Merida, W. Liquefied natural gas tanker truck-to-tank transfer for on-road transportation. Appl. Therm. Eng. 2019, 162, 15. [Google Scholar] [CrossRef]
- Kung, L.; Butler, T.; Georges, G.; Boulouchos, K. How much energy does a car need on the road? Appl. Energy 2019, 256, 19. [Google Scholar] [CrossRef]
- Khan, M.I.; Yasmin, T.; Shakoor, A. Technical overview of compressed natural gas (CNG) as a transportation fuel. Renew. Sustain. Energy Rev. 2015, 51, 785–797. [Google Scholar] [CrossRef]
- Tong, F.; Jaramillo, P.; Azevedo, I.M.L. Comparison of Life Cycle Greenhouse Gases from Natural Gas Pathways for Light-Duty Vehicles. Energy Fuels 2015, 29, 6008–6018. [Google Scholar] [CrossRef]
- Li, W.; Dai, Y.; Ma, L.; Hao, H.; Lu, H.; Albinson, R.; Li, Z. Oil-saving pathways until 2030 for road freight transportation in China based on a cost-optimization model. Energy 2015, 86, 369–384. [Google Scholar] [CrossRef]
- National Bureau of Statistics of China. China Statistical Yearbook 2021; China Statistics Press: Beijing, China, 2020.
- China Association of Automobile Manufacturers Ltd. China Automotive Industry Yearbook 2021; China Automobile Industry Editing and Publishing House: Tianjing, China, 2021. [Google Scholar]
- Hao, H.; Wang, H.W.; Ouyang, M.G. Fuel consumption and life cycle GHG emissions by China’s on-road trucks: Future trends through 2050 and evaluation of mitigation measures. Energy Policy 2012, 43, 244–251. [Google Scholar] [CrossRef]
- Yang, Y.; Ji, D.S.; Sun, J.; Wang, Y.H.; Yao, D.; Zhao, S.; Yu, X.N.; Zeng, L.M.; Zhang, R.J.; Zhang, H.; et al. Ambient volatile organic compounds in a suburban site between Beijing and Tianjin: Concentration levels, source apportionment and health risk assessment. Sci. Total Environ. 2019, 695, 13. [Google Scholar] [CrossRef]
- Zhou, J.B.; Guo, Y.J.; Huang, Z.W.; Wang, C. A review and prospects of gas mixture containing hydrogen as vehicle fuel in China. Int. J. Hydrogen Energy 2019, 44, 29776–29784. [Google Scholar] [CrossRef]
- Held, M.; Schuecking, M. Utilization effects on battery electric vehicle life-cycle assessment: A case-driven analysis of two commercial mobility applications. Transp. Res. Part D Transp. Environ. 2019, 75, 87–105. [Google Scholar] [CrossRef]
- Lee, D.-Y.; Elgowainy, A.; Kotz, A.; Vijayagopal, R.; Marcinkoski, J. Life-cycle implications of hydrogen fuel cell electric vehicle technology for medium- and heavy-duty trucks. J. Power Source 2018, 393, 217–229. [Google Scholar] [CrossRef]
- Hernandez, M.; Messagie, M.; De Gennaro, M.; Van Mierlo, J. Resource depletion in an electric vehicle powertrain using different LCA impact methods. Resour. Conserv. Recycl. 2017, 120, 119–130. [Google Scholar] [CrossRef]
- Yu, A.; Wei, Y.; Chen, W.; Peng, N.; Peng, L. Life cycle environmental impacts and carbon emissions: A case study of electric and gasoline vehicles in China. Transp. Res. Part D Transp. Environ. 2018, 65, 409–420. [Google Scholar] [CrossRef]
- Petrauskienė, K.; Skvarnavičiūtė, M.; Dvarionienė, J. Comparative environmental life cycle assessment of electric and conventional vehicles in Lithuania. J. Clean. Prod. 2019, 246, 119042. [Google Scholar] [CrossRef]
- Bicer, Y.; Dincer, I. Life cycle environmental impact assessments and comparisons of alternative fuels for clean vehicles. Resour. Conserv. Recycl. 2018, 132, 141–157. [Google Scholar] [CrossRef]
- Cooper, J.; Hawkes, A.; Balcombe, P. Life cycle environmental impacts of natural gas drivetrains used in UK road freighting and impacts to UK emission targets. Sci. Total Environ. 2019, 674, 482–493. [Google Scholar] [CrossRef]
- Tu, X.; Xu, J.; Chen, Y.; Yang, Y. An evaluation of differences between LNG and diesel commercial vehicle’s life cycle energy consumption. China Mech. Eng. 2013, 24, 3211–3215. [Google Scholar] [CrossRef]
- Tu, X.; Yang, Y.; Xu, J.; Chen, Y. Evaluation of Difference between LNG and Diesel Heavy-duty Commercial Vehicle’s Life Cycle Environmental Emission. China Mech. Eng. 2013, 24, 1525–1530. [Google Scholar] [CrossRef]
- Arteconi, A.; Brandoni, C.; Evangelista, D.; Polonara, F. Life-cycle greenhouse gas analysis of LNG as a heavy vehicle fuel in Europe. Appl. Energy 2010, 87, 2005–2013. [Google Scholar] [CrossRef]
- Tong, F.; Jaramillo, P.; Azevedo, I.M. Comparison of life cycle greenhouse gases from natural gas pathways for medium and heavy-duty vehicles. Environ. Sci. Technol. 2015, 49, 7123–7133. [Google Scholar] [CrossRef]
- Cai, H.; Burnham, A.; Chen, R.; Wang, M. Wells to wheels: Environmental implications of natural gas as a transportation fuel. Energy Policy 2017, 109, 565–578. [Google Scholar] [CrossRef]
- Ozbilen, A.; Dincer, I.; Hosseini, M. Comparative Life Cycle Environmental Impact Assessment of Natural Gas and Conventional Vehicles. In Exergetic, Energetic and Environmental Dimensions; Academic Press: Cambridge, MA, USA, 2018; pp. 913–934. [Google Scholar]
- Langshaw, L.; Ainalis, D.; Acha, S.; Shah, N.; Stettler, M.E.J. Environmental and economic analysis of liquefied natural gas (LNG) for heavy goods vehicles in the UK: A Well-to-Wheel and total cost of ownership evaluation. Energy Policy 2019, 137, 111161. [Google Scholar] [CrossRef]
- Chen, Y.; Yang, Y.; Li, X.; Dong, H.; Bai, R. Life cycle resource consumption of automotive power seats. Int. J. Environ. Stud. 2014, 71, 449–462. [Google Scholar] [CrossRef]
- National Engineering Laboratory of Industrial Big-Data Application Technology, SinoCenter 2.0; National Engineering Laboratory of Industrial Big-Data Application Technology: Beijing, China, 2019.
- Argonne National Laboratory. The Greenhouse Gases, Regulated Emissions, and Energy Use in Transportation Model 2020. Available online: http://greet.es.anl.gov/ (accessed on 21 June 2021).
- Ministry of Environmental Protection. Technical Guidelines for Compiling Air Pollutant Emission Inventory of On-Road Vehicles (Trial); Ministry of Environmental Protection (MEP): Beijing, China, 2014.
- WorldAutoSteel, UCSB Model 5. 2017. Available online: https://www.worldautosteel.org/downloads/ucsb-model-5/ (accessed on 24 November 2021).
- National Bureau of Statistics of China. China Energy Statistical Yearbook 2019; China Statistics Press: Beijing, China, 2020.
- Administration, S. Chinese National Standard for Automobile Diesel Fuels (GB 19147-2016); ChineseStandard: Singapore, 2016; Available online: https://www.chinesestandard.net/PDF.aspx/GB19147-2016 (accessed on 24 November 2021).
- IPCC. 2006 IPCC Guidelines for National Greenhouse Gas Inventories; IPCC: Geneva, Switzerland, 2007. [Google Scholar]
- BP. BP Statistical Review of World Energy 2020; BP: London, UK, 2020. [Google Scholar]
- Chen, Y.; Ding, Z.; Liu, J.; Ma, J. Life cycle assessment of end-of-life vehicle recycling in China: A comparative study of environmental burden and benefit. Int. J. Environ. Stud. 2019, 76, 1019–1040. [Google Scholar] [CrossRef]
- Li, W.; Bai, H.; Yin, J.; Xu, H. Life cycle assessment of end-of-life vehicle recycling processes in China—Take Corolla taxis for example. J. Clean. Prod. 2016, 117, 176–187. [Google Scholar] [CrossRef]
- Guinée, J. Operational Guide to the ISO Standards; Springer: Berlin, Germany, 2002. [Google Scholar]
- Zhang, Y.; Feng, G.; Wang, Z. Updated Resource Depletion Characterization Factors for Life Cycle Assessment-Case Studies on Iron and Steel Production in China. Mater. Sci. Forum 2016, 847, 358–365. [Google Scholar] [CrossRef]
- Oers, L.V. CML-IA Database, Characterisation and Normalisation Factors for Midpoint Impact Category Indicators (Version 4.5); Leiden University: Leiden, The Netherlands, 2015; Available online: http://www.cml.leiden.edu/software/data-cmlia.html (accessed on 24 November 2021).
- Leach, F.; Kalghatgi, G.; Stone, R.; Miles, P. The scope for improving the efficiency and environmental impact of internal combustion engines. Transp. Eng. 2020, 1, 100005. [Google Scholar] [CrossRef]
- OECD. Taxing Energy Use 2019; OECD: Paris, France, 2019. [Google Scholar]


| Material Types | Mass (kg) | ||
|---|---|---|---|
| Vehicle and Accessory Types | Steel | Al–Mg Alloy | |
| LNG tractor-trailer | Fuel tank (LNG cylinder) | 510 | 0 |
| (HN4250NGX41C9M5) | Bracket | 142 | 0 |
| Diesel tractor-trailer | Fuel tank (diesel tank) | 0 | 46 |
| (HN4250H40C4M5) | Bracket | 39 | 0 |
| Life-Cycle Stage | Data Types | Data Source |
|---|---|---|
| Ore material acquisition and material preparation | Use ratios during ore material acquisition and material preparation for steel (i) and cast aluminum (ii) | SinoCenter [32] |
| Integrated energy intensity data on coal, crude oil, and NG for acquiring and preparing steel (i) and cast aluminum (ii) | SinoCenter [32] | |
| Integrated emission intensity data on NMVOC, SOx, NOx, CO, CO2, PM and CH4 for acquiring and preparing steel (i) and cast aluminum (ii) | SinoCenter [32] | |
| Accessory manufacture | Use ratios of steel and cat aluminum during accessory manufacture | WorldAutoSteel (2017) [35] |
| Amount of direct energy consumption for manufacturing fuel tank and bracket in coal equivalent | Tu, Yang, Xu and Chen (2013) [24] | |
| Conversion factor from electricity to coal equivalent | China Energy Statistical Yearbook 2019 [36] | |
| Amount of coal, Crude oil, and NG consumption for producing 1 kW·h electricity | SinoCenter [32] | |
| Recycling | Recovery ratio of steel and aluminum | WorldAutoSteel (2017) [35] |
| Fuel production | Amount of coal, crude oil, and NG consumption for producing a unit of LNG (iii) | GREET 2020 [33] |
| Amount of NMVOC, SOx, NOx, CO, CO2, PM, and CH4 emissions for producing a unit of LNG (iii) | GREET 2020 [33] | |
| Amount of coal, crude oil, and NG consumption for producing a unit of diesel (iv) | SinoCenter [32] | |
| Amount of NMVOC, SOx, NOx, CO, CO2, PM, and CH4 emissions for producing a unit of diesel (iv) | SinoCenter [32] | |
| Vehicle operation | Amount of LNG and diesel consumption per unit distance | CAMC |
| Amount of NMVOC (v), NOx, CO, CO2, PM, and CH4 emission per unit work for operating LNG tractor-trailer and its diesel counterpart | CAMC (tested by National Motor Vehicle Quality Supervision and Inspection Center through ESC and ELR experiments) | |
| Sulfur in diesel fuel (vi) | GB 19147—2016 [37] | |
| CO2 emission factor of natural gas and diesel | IPCC 2006 [38] | |
| Conversion factor from heat and electricity to coal equivalent and calorific value of diesel | China Energy Statistical Yearbook 2019 [36] | |
| Calorific value of LNG and diesel density | BP Statistical Review of World Energy 2020 [39] | |
| LNG density | https://www.unitrove.com/engineering/gas-technology/liquefied-natural-gas (15 October 2021) |
| Impact Category | Description | Unit | Main Contributors |
|---|---|---|---|
| ADP | Resource depletion | kg antimony eq. | Diesel, NG, Iron ore, Aluminum ore |
| GWP 100 | Climate change within a time horizon of 100 years | kg CO2 eq. | CO2, N2O, CH4 |
| AP | Environmental deterioration: acid rain corrosion | kg SO2 eq. | SOx, NOx |
| HTP | Health damage | kg 1,4-dichlorobenzene eq. | SOx, NOx, PM |
| POCP | Environmental deterioration: photochemical smog pollution | kg C2H4 eq. | SOx, CO, NMVOC, CH4 |
| Processes | Ore Material Acquisition and Material Preparation | Accessory Manufacturing | Fuel Production | Vehicle Operation | Life-Cycle |
|---|---|---|---|---|---|
| Difference | |||||
| NG (kgce) | −52.33 | −3.53 | 42,096.57 | 306,381.71 | 348,422.41 |
| Crude oil (kgce) | −205.53 | −0.34 | −252,950.12 | −219,843.69 | −472,999.68 |
| Coal (kgce) | 1744.40 | −103.37 | −15,279.37 | 0 | −13,638.34 |
| Total energy (kgce) | 1486.54 | −107.24 | −226,132.93 | 86,538.02 | −138,215.61 |
| Processes | Ore Material Acquisition and Material Preparation | Fuel Production | Vehicle Operation | Life-Cycle |
|---|---|---|---|---|
| Difference | ||||
| NOx (kg) | 8.77 | −21.9 | −1846.94 | −1860.07 |
| SOx (kg) | 12.55 | −433.48 | −3.02 | −423.95 |
| PM (kg) | −63.02 | 14.55 | −12.53 | −61 |
| NMVOC (kg) | 0.06 | 15.26 | −30.42 | −15.1 |
| CO (kg) | −126.98 | −192.33 | 862.25 | 542.93 |
| N2O (kg) | −0.01 | 0.01 | 0 | 0 |
| CH4 (kg) | 15.17 | 1914.66 | 526.22 | 2456.05 |
| CO2 (t) | 3.68 | 2.72 | 26.32 | 32.72 |
| Process | Ore material Acquisition and Material Preparation | Accessory Manufacturing | Fuel Production | Vehicle Operation | Recycling | Life-Cycle | |
|---|---|---|---|---|---|---|---|
| Difference | |||||||
| ADP (kg antimony eq.) | Coal | 0.00 | 0.00 | −0.01 | 0.00 | — | −0.01 |
| NG | 0.00 | 0.00 | 0.04 | 0.30 | — | 0.34 | |
| Crude oil | −0.15 | 0.00 | −180.89 | −157.22 | — | −338.26 | |
| Iron ore | 0.36 | — | — | — | −0.33 | 0.03 | |
| Aluminum ore | −0.09 | — | — | — | 0.07 | −0.02 | |
| Sum | 0.12 | — | −180.86 | −156.92 | −0.26 | −337.92 | |
| AP (kg SO2 eq.) | SOx | 15.06 | — | −520.17 | −3.63 | — | −508.74 |
| NOx | 4.39 | — | −10.95 | −923.47 | — | −930.03 | |
| Sum | 19.44 | — | −531.12 | −927.10 | — | −1438.78 | |
| GWP (t CO2 eq.) | CO2 | 3.68 | — | 2.72 | 26.32 | — | 32.72 |
| N2O | 0.00 | 0.00 | 0.00 | — | 0.00 | ||
| CH4 | 0.42 | — | 53.61 | 14.73 | — | 68.76 | |
| Sum | 4.11 | — | 56.33 | 41.05 | — | 101.49 | |
| POCP (kg C2H4 eq.) | CO | −3.43 | — | −5.19 | 23.28 | — | 14.66 |
| NMVOC | 0.01 | — | 2.29 | −4.56 | — | −2.26 | |
| CH4 | 0.09 | — | 11.49 | 3.16 | — | 14.74 | |
| SOx | 0.60 | — | −20.81 | −0.15 | — | −20.36 | |
| Sum | −2.73 | — | −12.22 | 21.73 | — | 6.78 | |
| HTP (kg 1,4-dichlorobenzene eq.) | SOx | 12.05 | — | −416.14 | −2.90 | — | −406.99 |
| NOx | 10.53 | — | −26.28 | −2216.32 | — | −2232.07 | |
| PM | −51.68 | — | 11.93 | −10.27 | — | −50.02 | |
| Sum | −29.11 | — | −430.49 | −2229.50 | — | −2689.09 |
Publisher’s Note: MDPI stays neutral with regard to jurisdictional claims in published maps and institutional affiliations. |
© 2022 by the authors. Licensee MDPI, Basel, Switzerland. This article is an open access article distributed under the terms and conditions of the Creative Commons Attribution (CC BY) license (https://creativecommons.org/licenses/by/4.0/).
Share and Cite
Hu, S.; Chen, H. Comparative Life-Cycle Assessment of Liquefied Natural Gas and Diesel Tractor-Trailer in China. Energies 2022, 15, 392. https://doi.org/10.3390/en15010392
Hu S, Chen H. Comparative Life-Cycle Assessment of Liquefied Natural Gas and Diesel Tractor-Trailer in China. Energies. 2022; 15(1):392. https://doi.org/10.3390/en15010392
Chicago/Turabian StyleHu, Shuhan, and Hongyuan Chen. 2022. "Comparative Life-Cycle Assessment of Liquefied Natural Gas and Diesel Tractor-Trailer in China" Energies 15, no. 1: 392. https://doi.org/10.3390/en15010392
APA StyleHu, S., & Chen, H. (2022). Comparative Life-Cycle Assessment of Liquefied Natural Gas and Diesel Tractor-Trailer in China. Energies, 15(1), 392. https://doi.org/10.3390/en15010392