Article

How Does the World View China’s Carbon Policy? A Sentiment Analysis on Twitter Data

1
Institute of Geographic Sciences and Natural Resources Research, Chinese Academy of Sciences, Beijing 100101, China
2
College of Resources and Environment, University of Chinese Academy of Sciences, Beijing 100049, China
3
School of Economics, Hebei University of Geosciences, Shijiazhuang 050031, China
*
Authors to whom correspondence should be addressed.
Energies 2021, 14(22), 7782; https://doi.org/10.3390/en14227782
Submission received: 30 October 2021 / Revised: 14 November 2021 / Accepted: 17 November 2021 / Published: 19 November 2021
(This article belongs to the Collection Energy Transition towards Carbon Neutrality)

Abstract

:
China has recently put forth an ambitious plan to achieve carbon peak around 2030 and carbon neutrality around 2060. However, there are quite a few differences regarding the public views about China’s carbon policy between the Chinese people and the people from other countries, especially concerning the doubt of foreign people about the fidelity of China’s carbon policy goals. Based on Twitter data related to China’s carbon policy topics from 2008 to 2020, this study shows the inter- and intra-annual trends in the count of tweets about China’s carbon policy, conducts sentiment analysis, extracts top frequency words from different attitudes, and analyzes the impact of China’s official Twitter accounts on the global view of China’s carbon policy. Our results show: (1) the global attention to China’s carbon policy gradually rises and occasionally rises suddenly due to important carbon events; (2) the proportion of Twitter users with negative sentiment about China’s carbon policy has increased rapidly and has exceeded the proportion of Twitter users with positive sentiment since 2019; (3) people in developing countries hold more positive or neutral attitudes towards China’s carbon policy, while developed countries hold more negative attitudes; (4) China’s official Twitter accounts serve to improve the global views on China’s carbon policy.

1. Introduction

The increase of greenhouse gases concentration in the atmosphere such as carbon dioxide has caused the global temperature to rise since the beginning of the industrial revolution. Currently, China is the world’s largest carbon emitter [1], although its per capita carbon emissions are less than half of those of developed countries. China is actively leading global climate governances to achieve reductions in carbon emissions [2,3,4]. In the 75th United Nations General Assembly, China made a commitment to reach carbon peak by 2030 and achieve carbon neutrality by 2060 [5]. At the Climate Ambition Summit 2020, UN Secretary General Guterres warned that the current commitments of all countries are far from enough to curtail the end-of-the-century global temperature rise to within 1.5 °C and further suggested that it may even rise by more than 3 °C. Recent research has shown that China’s carbon-neutral target agrees well with the 1.5 °C warming limit [6,7]. If China’s carbon neutrality can be achieved in the expected timeframe, the effect of China’s carbon neutrality, alone, would reduce the projected increase in global average temperature by 0.2 to 0.3 °C [8]. The temperature will increase by 2.7 °C by 2100 under the currently submitted nationally determined contributions (NDCs). If everything else were to remain the same, China’s 2060 carbon neutrality commitment alone will account for 25% of the climate effort required to control the global average temperature rise within the target range of the Paris Agreement of 1.5 °C [9].
Many academic studies hold a positive attitude towards China’s commitment to control carbon emissions. These studies proposed feasible actions for China’s carbon emission control from all aspects. In terms of energy structure, some researchers believe that China needs to increase its use of clean energy, especially nuclear power, and reduce the use of its primary energy source, coal [10,11]. Although renewable energy has not yet been effective in reducing CO2 emissions in China, it needs more time for development and understanding from home and abroad [12,13,14]. In terms of energy consumption, researchers believe that if China reduces energy consumption and shifts to low-carbon fuels, then China’s commitment to peak CO2 emissions is achievable [15]. In terms of energy policy, China will require environmental policies and institutions capable of enabling major shifts in the way the country produces and uses energy [16]. Some researchers believe that China needs to control GDP growth and reduce its annual GDP growth rate to less than 4.5% to reach carbon peak by 2030 [17]. Other researchers think bioenergy with carbon capture and storage (BECCS) and afforestation efforts can significantly reduce the loss of GDP to achieve the carbon-neutral target by 2060 [18]. At the same time, a carbon tax policy is considered necessary to encourage controlling carbon emissions and the diffusion of energy technologies in China [19].
Compared with academic research, the mainstream media in the West have more negative and skeptical views regarding China’s carbon policy. First, the Chinese commitment to carbon emissions is portrayed to be politically motivated. According to a BBC report, observers believed that China’s proposed initiative to achieve carbon neutrality by 2060 is taking advantage of the reluctance of the United States to address the climate question, which demonstrated its interest in climate issues as a geopolitical tool [20]. Second, there is an impression that emission reduction plans are lacking. Some media sources emphasized that although China has a grand carbon neutrality target, there is no specific plan on how to achieve it [21,22]. Due to the impact of COVID-19, China’s coal consumption began to rise again as China’s economy encountered obstacles and the government tried to boost industrial growth. The increased power generation raised concerns in the media about whether China can fulfill its commitments to fight global warming, although the economy growth has slowed down [23,24]. Third, there seems to be a call for China to do more to limit global warming. A report from the Associated Press believed that China needs to reach its peak emissions by 2030 and achieve zero carbon emissions by 2050, ten years earlier than its goal, because by then it will have become a wealthy developed country [25]. There was a report that China’s current goal only became compatible with a 2 °C end-of-the-century warming. To meet the 1.5 °C benchmark, China needs to achieve carbon peaks faster, by reducing coal and other fossil fuel use more than the expected plan and establishing a clearer timetable [26].
How to better understand the global view and the associated changes of foreign mainstream media concerning China’s carbon policy has become an important issue for China’s international image. A positive national image could offer important international support for national interests, while a negative one would isolate China and cause other countries to resist Chinese protocol resulting in severe damage to state interests [27,28,29]. China’s realization of carbon neutrality needs the recognition and support of the international community. A good international image and active and sufficient positive publicity for carbon neutrality will help to reduce differences with other governments, expand recognition, and obtain more support. As one of the most popular social media platforms in the world, Twitter is widely applied for receiving and sharing news, especially political information [30,31]. Recent research shows that users from different backgrounds discuss climate change issues on Twitter, including NGOs, grassroots activists, celebrities, and politicians [32,33]. In particular, climate change is widely discussed on Twitter, for example, whether climate change is real, whether the public is aware of it, and whether scientists agree [34,35]. Furthermore, the causes of climate change (e.g., carbon emissions) and possible solutions (e.g., a carbon tax and geoengineering) are also very hot topics [36,37,38]. In addition, many tweets mentioned the impact of climate change on real life, including warming temperature and extreme precipitation [39,40,41]. Furthermore, the geographic location information contained in tweets is also widely used by researchers [42,43,44]. Therefore, Twitter is an effective means to assess public opinion about an issue, and the topic of climate change is no exception. In particular, the advent of natural language processing (NLP) makes it possible to conduct sentiment analysis about tweets from people all over the world, as the sentiment expressed in tweets could play a role in diffusing information and building solidarity [45,46,47]. Sentiment analysis could be used to study the emotional tone behind a series of words and help decision-makers understand whether people’s reactions to a particular topic are positive, negative, or neutral [48,49,50,51]. It is now used in many aspects, such as the consumers’ perceptions of their products/brands in business, the change of people’s emotions during COVID-19 and the public option analysis during the political general election [52,53,54,55,56]. In addition, the Chinese government has set up some official diplomatic Twitter accounts to promote China’s good image [57], but its effect remains unclear.
Although China has put forward an ambitious carbon emission reduction plan, the global views towards China’s carbon policy is not clear. To solve this problem, in this study, we choose Twitter as a platform to infer the international views concerning China’s carbon policy and to evaluate the effects of the official diplomatic tweets upon the global views concerning China’s carbon policy. Specifically, we apply the methods of sentiment analysis using natural language processing (NLP) and multiple regression to resolve the following problems: (1) How does the attentiveness of the world’s people to China’s carbon policy change over time? (2) Are the global views of China’s carbon policy positive or negative and is there any geographic bias to these views? (3) Have the official tweets of the Chinese government made significant changes in world views of China’s carbon policy? Answering these questions will improve the quantitative understanding of the public views about China’s carbon policy and provide a basis for China to implement stronger carbon emission reduction policies and enhance China’s good image.

2. Data and Methods

2.1. Data Description

In this study, a Twitter full-archive search of the application programming interface (API) was performed to extract data from Twitter about China’s carbon policy. We collected all the Twitter data (not retweeted) on China’s carbon policy, carbon neutrality, and climate change related to keywords from January 2008 to June 2021. We also collected the Twitter posts (including Retweets) from China’s 13 official diplomatic Twitter accounts using the Twitter timelines API (Table 1) [58]. The collected Twitter data includes the content of the tweet, public metrics of the tweet (number of replies, likes, quotes of tweet), and geographic information (limited availability). In this study, the language of the collected tweets is in English, considering that English is the most widely used language in the world and social media.

2.2. Data Preprocessing

Tweets are usually composed of a lot of noise such as incomplete and poorly structured sentences, as well as irregular expressions, ill-formed words, and non-dictionary terms [59]. Before performing sentiment analysis, tweets need to be preprocessed. Preprocessing is performed extensively in the existing approaches, especially in machine learning-based approaches [60,61,62]. In the preprocessing steps, several functions are used to clean the data. Firstly, for noise removal, we removed the HTML tags, punctuation, numbers, single characters, and multiple spaces from the tweets [63]. Each character that did not indicate any meaningful communication was also replaced with a space separately. Secondly, regarding tokenization, the tweets’ text was divided into smaller components to access each word. Finally, for stopwords removal, some common words such as “and”, “but”, and “so” that do not provide relevant information were removed. In this study, we used the stopwords provided from NLTK.

2.3. Sentiment Analysis

Valence Aware Dictionary and sEntiment Reasoner (VADER) is an open-source sentiment tool often used to provide the highest sentiment analysis for Twitter data, which is a model for applying natural language processing methods [64,65]. VADER includes a robust sentiment lexicon containing over 7500 words that are each rated by 10 independent human analysts. VADER recognizes a variety of grammatical and orthographic markers of negation, hedging, and magnification, including punctuation, in a colloquial idiomatic online language. Additionally, current studies show that VADER scores provide a reliable proxy for mood and subjective well-being and individual mood variations [66,67]. The compound score of VADER is the most commonly used indicator for researchers in sentiment analysis. The range of compound score is between −1 (most extreme negative) and +1 (most extreme positive), which is computed by summing the valence scores of each word in the lexicon and then normalized. Different scores reflect different types of emotions: (1) a compound score ≥ 0.05 indicates positive sentiment; (2) a compound score ≤ −0.05 indicates negative sentiment; (3) a neutral sentiment is satisfied by the condition, –0.05 < compound score < 0.05. In this study, the VADER sentiment tool was used to calculate the emotional tendency of each tweet and to classify each Tweet into one of the three categories of positive, negative, and neutral emotions.

2.4. Word Cloud

A word cloud was used to extract the deep-seated information that determines people’s attitudes towards China’s carbon policy. When conducting in-depth analysis of text-based data, it is difficult to extract and analyze important information in the text. Word clouds can solve this problem under such situations. In this study, a word cloud was used to determine which words are most frequently used in tweets about China’s carbon policy. Since words have their own polarity, this method of analysis helps to understand the world views of China’s carbon policy behind Twitter.

2.5. Multiple Regression Model

The multiple regression model is used to determine what factors affect the world’s attention to China’s carbon policy in Section 3.5. The multiple regression model can be used to effectively investigate the influence of a specific independent variable on the dependent variable while keeping other factors unchanged. The formula of the multiple regression model is as follows:
y = β 0 + β 1 x 1 + β 2 x 2 + β 3 x 3 + β 4 x 4 + β 5 x 5 + u
where β 0 is intercept, β 1 is the parameter associated with x 1 , β 2 is the parameter associated with x 2 , and other parameters can be deduced via analogy. The variable u represents the error term, which includes some factors that affect y in addition to x 1 , x 2 , x 3 , x 4 , x 5 . The independent variables x 1 , x 2 , x 3 , x 4 , x 5 are the count of original tweets released by China’s official accounts, the associated retweets, replies, likes, and quotes, respectively. The dependent variable y in different multiple regression models is the total count of tweets, the count of positive emotion tweets, the count of neutral emotion tweets, and the count of negative emotion tweets about China’s carbon policy.
The t-test of multiple regression was used to detect whether a variable is significant. The calculation formula of the t-value is as follows:
t - v a l u e = β j ^ a j s e ( β j ^ )
where β j ^ is the estimation of the independent variable coefficient, a j is the assumed value of the independent variable coefficient, and s e ( β j ^ ) is the standard error of the independent variable coefficient. A higher t-value represents higher significance. In addition, the p-value in the t-test has three meanings: (1) p < 0.01 represents that the relationship between dependent variable x and independent variable y is significant; (2) p > 0.2 represents that the relationship between dependent variable x and independent variable y is not significant; (3) 0.2 > p > 0.01 indicates that the relationship between dependent variable x and independent variable y is uncertain.

3. Results

3.1. Inter- and Intra-Annual Trend in the Count of Tweets about China’s Carbon Policy

In order to construct a timeline that indicates the number of tweets about China’s carbon emissions, a visual depiction is needed to illustrate the time series for the data. Figure 1 displays the count of daily tweets about China’s carbon emissions from 2008 to 2021. Trend analysis reveals that the count of daily tweets about China’s carbon policy gradually increases, with the notable exception of six sudden rises. Furthermore, these six rises are directly associated with six important and newsworthy carbon events in China. In terms of magnitude, the 2021 average number of daily tweets about China’s carbon policy is approximately 150 times greater than that which occurred in 2008 to 2010. However, the average number of daily tweets about China’s carbon policy is approximately 387 from 2011 to 2021. These results imply that the world has paid an increasing amount of attention to China’s carbon policy from 2008 to 2021, and the level of attention is related to China’s carbon events.
In addition to understanding the growth rate of tweets about China’s Carbon policy from 2008 to 2021, the average annual count of tweets about China’s carbon policy is shown in Figure 2. Similar to Figure 1, the count gradually increases each year on the whole. Specifically, the average count increases approximately 46.11 times each year. However, the count every year does not exceed the previous year all the time. The years 2015 and 2018 are all lower than the previous year. First, China proposed its intention to achieve its carbon peak around 2030 in 2014 (Figure 1), which aroused widespread world discussion on Twitter in 2014. Therefore, the count of tweets about China’s carbon policy increases sharply in 2014. Although the joint statement of the presidents of China and the United States on climate change occurs in 2015, the critical level is lower than the first proposal regarding the carbon peak. This seems to be the reason why the count of tweets about China’s carbon policy in 2014 is more than in 2015. Second, there were important Chinese carbon events in 2015, 2016, and 2017. However, there was no important Chinese carbon event in 2018. These reasons cause the average count of tweets about China’s carbon policy in 2018 to decrease sharply. Therefore, the public’s attitude towards China’s carbon policy is directly related to the importance of China’s official carbon events.
To further show the intra-annual trend in the count of tweets about China’s carbon policy every year, the box chart of the daily count of tweets about China’s carbon policy from 2008 to 2021 is shown in Figure 3. The maximum count of tweets about China’s carbon policy is more than 3000 in 2014, 2015, 2016, 2017, and 2021. It is worth noting that important Chinese carbon events occurred in these years, which is shown in Figure 1. Specifically, China and the United States jointly released the “U.S.-China Joint Announcement on Climate Change” on 12 November 2014, in which the Chinese government first proposed to reach peak carbon emissions around 2030. President Xi Jinping issued a joint statement on climate change with President Obama in Washington on 25 September 2015. The National People’s Congress of the People’s Republic of China approved China’s accession to the Paris climate change agreement on 3 September 2016. President Donald Trump of the United States announced in Washington that the United States would withdraw from the Paris Agreement on global climate change on 1 June 2017. These important carbon events sparked widespread public discussion, which caused the intra-annual change of the count of tweets about China’s carbon policy during these years.

3.2. Sentiment Analysis for China Carbon Policy Tweets

Although the world is paying closer attention to China’s carbon policy, the public attitude towards China’s carbon policy is not clear. Figure 4 shows the percentage of positive, negative, and neutral attitudes toward China’s carbon policy from 2008 to 2021 on Twitter. In terms of trend, both the percentage of positive and negative attitudes gradually increase, but, in a relative sense, the rate of increase for the percentage of negative attitudes is greater than that for positive attitudes from 2008 to 2021. It is also apparent that the percentage of neutral attitudes decreases. In terms of magnitude, the increased rates of positive and negative attitudes are approximately 0.35%/year and 0.96%/year, respectively. The decrease in the rate of neutral attitudes is approximately 1.31%/year. These results show that the decreased rate of neutral attitudes equals the increased rate of the positive attitudes and negative attitudes added together, which further shows that the public attitudes towards China’s carbon emissions are becoming increasingly clear, and the positive and negative attitudes are essentially evenly split.
The percentage of neutral attitudes decreases sharply, and the percentage of negative attitudes increases sharply in 2012. This first-order discontinuity is very distinct from the overall trend. Many Western media hold a negative attitude towards China’s carbon policy. For example, some media like the BBC believe that China’s carbon policy is only for geopolitical purposes [20]. Other media believe that China’s carbon policy is empty talk and has no practical plan [21,22]. These media’s negative views on China’s carbon policy may also have an impact on Twitter users, which leads to an increase in negative emotional tweets. On the other hand, Zheng found that China’s carbon emissions were rising rapidly during 2012–2016 [68], which is consistent with the increasing trend of the percentage of negative attitudes. Therefore, the attitude of the public towards China’s carbon policy may be related to the condition of China’s carbon emissions. When China announced its accession to the Paris climate change agreement in September 2016, Twitter users displayed a relatively high preference for China’s carbon policy. From 2008 to 2021, the trend of the percentage of positive attitudes was relatively flat. Finally, the percentage of negative attitudes exceeded the percentage of positive attitudes in 2019 and 2020. Therefore, to improve the public attitude towards China’s carbon policy, the Chinese government needs to take more effective actions.

3.3. Top Frequency Words (Positive, Negative, Neutral) for China Carbon Policy Tweets

To help understand the points of public concern associated with positive, negative, and neutral attitudes, Figure 5 shows the most frequent words related to positive, negative, and neutral attitudes. In Figure 5a, there are mainly three kinds of high-frequency words. The first type includes the name of some countries, which include the United States, Russia, Canada, Australia, and India. The second type includes some measurements for improving the environment, e.g., clean energy, renewable energy, and tax. Finally, the words, “Paris Agreement” serve as an indicator. It may be related to China’s decision to join the Paris Agreement, which has brought the goodwill of the public towards China. These results show that people who have a positive attitude pay attention to measures taken by different countries to reduce carbon emissions and important carbon events. In Figure 5b, there are also three kinds of high-frequency words. First, there are many negative words, which include hoax, crisis, doesn’t, and problem. These words indeed show a negative attitude towards China’s carbon policy. Second, there is a set of polluted environment vocabulary, which includes fossil, fuel, and pollution. Third, there is the name of the American President Donald “Trump.” This comes as no surprise since Trump has repeatedly criticized China’s carbon emissions on Twitter, which arouses people’s negative discussions about China’s carbon policy. In Figure 5c, no special high-frequency words appear in the discussions of people with neutral attitudes.
Combinings Figure 5a,b, “India” appears more frequently in positive and negative Tweets about China’s carbon policy. As the world’s second-most populous country and an important economy, India is also a major carbon emitter like China. Therefore, China and India are often lumped together carbon policy is discussed.

3.4. Twitter Location Analysis

Users can record their location information when sending tweets, which provides an opportunity to analyze the attitudes of different countries towards China’s carbon policy. To ensure data validity, only countries whose location data exceeds a sample size of 1000 can be analyzed (a total of 29,276 tweets record location information). Figure 6 shows the percentage of the three attitudes among 24 countries towards China’s carbon policy. First, the five countries with the highest percentages of positive attitudes (in descending order) are Pakistan > France > India > Sweden > South Africa. This result is indicative of the good relationship between China and Pakistan. The proportion of positive feelings from India is also very high, which is inconsistent with the tension between China and India caused by border issues. This may be related to the fact that the Western media often criticize China and India together on the issue of climate change and carbon emissions. Second, the top five countries with negative attitude percentages are Ireland > United States > Canada > Australia > Germany. Tweets from the United States tend to have high negative emotions, which may be related to the fact that the United States has always regarded China as a potential rival [69]. Ireland, Canada, Australia, and Germany, all allies of the United States, may be ideologically influenced by the United States, resulting in high negative sentiment on Twitter about China’s carbon policy. Finally, the five countries with the highest percentages of neutral attitudes are Mexico > Brazil > Netherlands > Colombia > Spain. The overall results show that people in developed countries, especially countries that are allies of the United States, have more negative attitudes towards China’s carbon policy and people in developing countries hold more positive or neutral attitudes. The reason may be that developing countries usually have to address the contradiction between sustaining and balancing carbon emission reductions and economic development, which may make these countries better understand China and each other.

3.5. Impact of China’s Official Twitter Accounts

The multivariate ordinary least squares regression model is used to analyze the impact of China’s official accounts Twitter data on the count of tweets about China’s carbon policy. The independent variables are the count of original tweets released by China’s official accounts, the associated retweets, replies, likes, and quotes. The dependent variables include the total count of tweets, the count of positive emotion tweets, the count of neutral emotion tweets, and the count of negative emotion tweets about China’s carbon policy.
Table 2 shows the impact of China’s official accounts Twitter data on the total count of tweets about China’s carbon policy. It is apparent that most independent variables (the count of original tweets, retweets, replies, and quotes) are statistically significant, but one independent variable (the count of likes) is insignificant within a 95% confidence interval. Specifically, the count of original tweets released by China’s official Twitter accounts and quotes have a positive effect on the total count of tweets about China’s carbon policy. The count of retweets and replies has a negative effect on the total count of tweets about China’s carbon policy. This result shows that the action of China’s official accounts is indeed directly related to the total count of tweets about China’s carbon policy. However, the count of likes in Chinese official tweets is not related to the attention of the world on China’s carbon policy.
Similar to Table 2 and Table 3 shows that Twitter data from China’s official accounts are related to the number of positive tweets about China’s carbon policy in most aspects (the count of original tweets, retweets, replies, and quotes), which shows that China’s official tweets can promote a positive international image. The count of likes in China’s official tweets does not affect the number of positive tweets. Additionally, the count of original tweets released by China’s official accounts and quotes has a positive effect, and the count of tetweets and replies has a negative effect.
Table 4 shows that the count of original tweets released by China’s official Twitter accounts is not related to the count of negative tweets towards China’s carbon policy, which is different from its effect upon the count of positive tweets towards China’s carbon policy. Other effects are approximately consistent. The count of quotes has a positive effect, and the count of retweets and replies has a negative effect.
In Table 5, all independent variables are significant. Three variables (the count of original tweets, replies, and quotes) have a positive effect and two variables (the count of retweets and replies) have a negative effect. This result implies that every aspect of China’s official accounts affects the world’s neutral attitude towards China’s carbon policy, which is different than its effect on positive and negative attitudes.
Table 2, Table 3, Table 4 and Table 5 show that China’s official accounts Twitter data has the greatest impact on the total count of tweets about China’s carbon policy among the four counts. Furthermore, China’s official accounts Twitter data have the greatest impact on the count of positive tweets towards China’s carbon policy among three different emotion tweets, especially the count of quotes. Therefore, the count of quotes from China’s official Twitter data is more conducive to increasing the count of Tweets about China’s carbon policy than simple retweets, which is more conducive to enhancing China’s international image. In summary, China’s official accounts Twitter data plays an important role in improving the world’s positive views on China’s carbon reduction policy, which is consistent with the intended role of the Chinese government’s official Twitter accounts in promoting a positive national image as described in previous studies [58,70].

4. Discussion

China’s carbon emissions are still growing and have not yet reached their peak. China has formulated an ambitious emissions reduction plan and proposed a goal of achieving carbon neutrality by around 2060. However, our study finds that more and more negative sentiment about China’s carbon policy on Twitter may be related not only to China’s growing carbon emissions, but also to political, economic, cultural, and other factors.
The political reason centers around the ideological prejudice against China. The literature consistently reveals that Western media’s view of China is largely negative and ideologically biased since the founding of the People’s Republic of China in 1949 [71,72,73]. Therefore, there are a large number of tweets about the negative sentiment of China’s carbon policy on Twitter. The economic reason for increasingly unfavorable attitudes towards China’s carbon policy may be the increase of its international responsibility and potential threat, which was brought on by the enhancement of China’s economic power. Rapid economic development has made China the second largest economy. This has led to more and more discussions on China’s international responsibilities, such as climate change, and many western countries believe that China has not taken ownership of its corresponding international responsibilities [74,75,76], which may have led to a considerable number of negative evaluations. Although Twitter is a very popular social media tool all over the world, online social media depends upon good network infrastructure, and most Twitter users come from more developed countries and regions. Studies have shown that the main factor that affects China’s image in a country is its economic and social developmental level [77]. People from rich countries do not need to look to a “China model” for developing their economy. They are more concerned about lifestyle choices, political liberties, and post-industrial values. Therefore, they may perceive that an increasingly powerful China may threaten their political freedom and way of life, which may also lead to a considerable number of negative evaluations.
The cultural reason may lie within the cultural differences between the East and the West. A survey found that China’s popular culture is not attractive to American people and they condemn China for evading necessary international responsibilities and have no impression of democratic prospects in China [78]. In contrast, people who have had life experiences in China tend to have a great impression of China, because they may have acquired a deeper understanding of Chinese culture [79], much like East Asian countries that are geographically and culturally close to China have a positive view of China’s rise [80]. Therefore, the differences between and ignorance of Eastern and Western cultures may have led to a large number of tweets with negative comments regarding China’s carbon policy.

5. Conclusions

In this study, we collected a total of 1,590,143 tweets about China’s carbon policy topics from 1 January 2008, to 29 June 2021. First, the count of daily tweets about China’s carbon policy was used to analyze the inter- and intra-annual trends. Second, VADER was used to conduct sentiment analysis to judge the global attitude towards China’s carbon policy. Furthermore, a word cloud was used to extract top frequency words most closely associated with three different attitudes (positive, negative, and neutral). Third, the attitude among other countries towards China’s carbon policy was analyzed. Finally, the multiple regression model was used to analyze the impact of China’s official Twitter accounts on the view of China’s carbon policy. The main findings of this study are as follows:
(1)
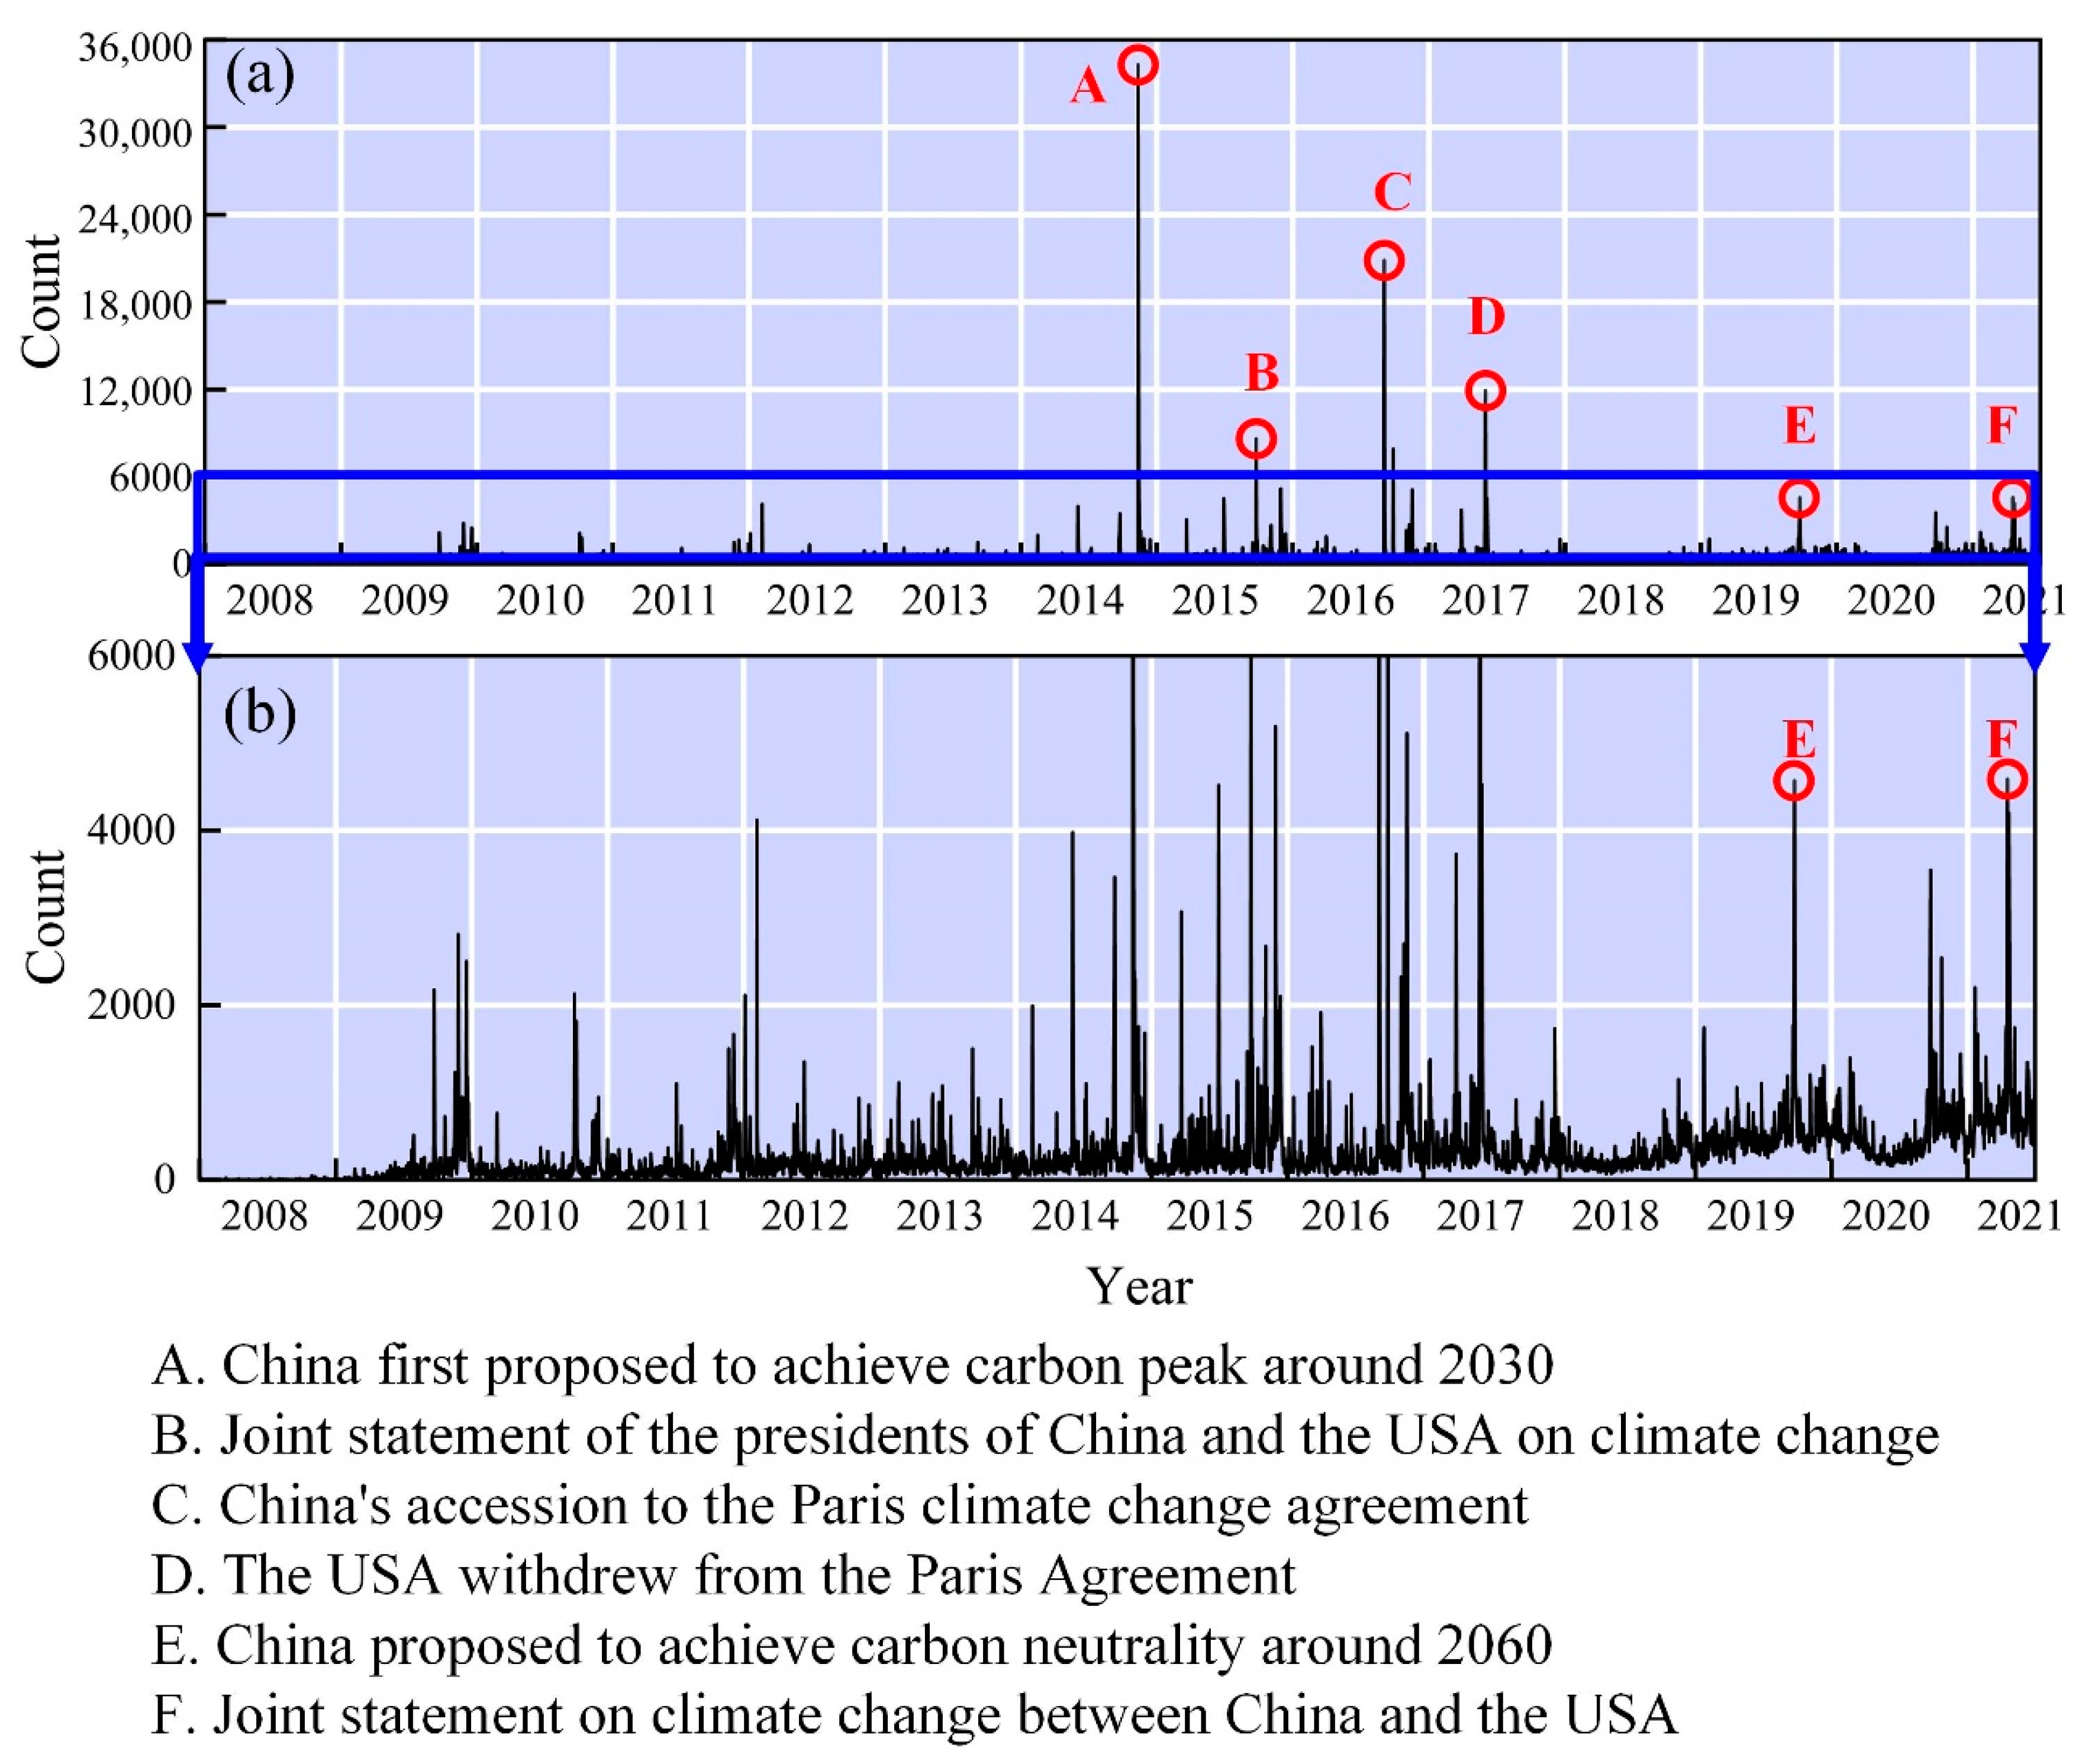
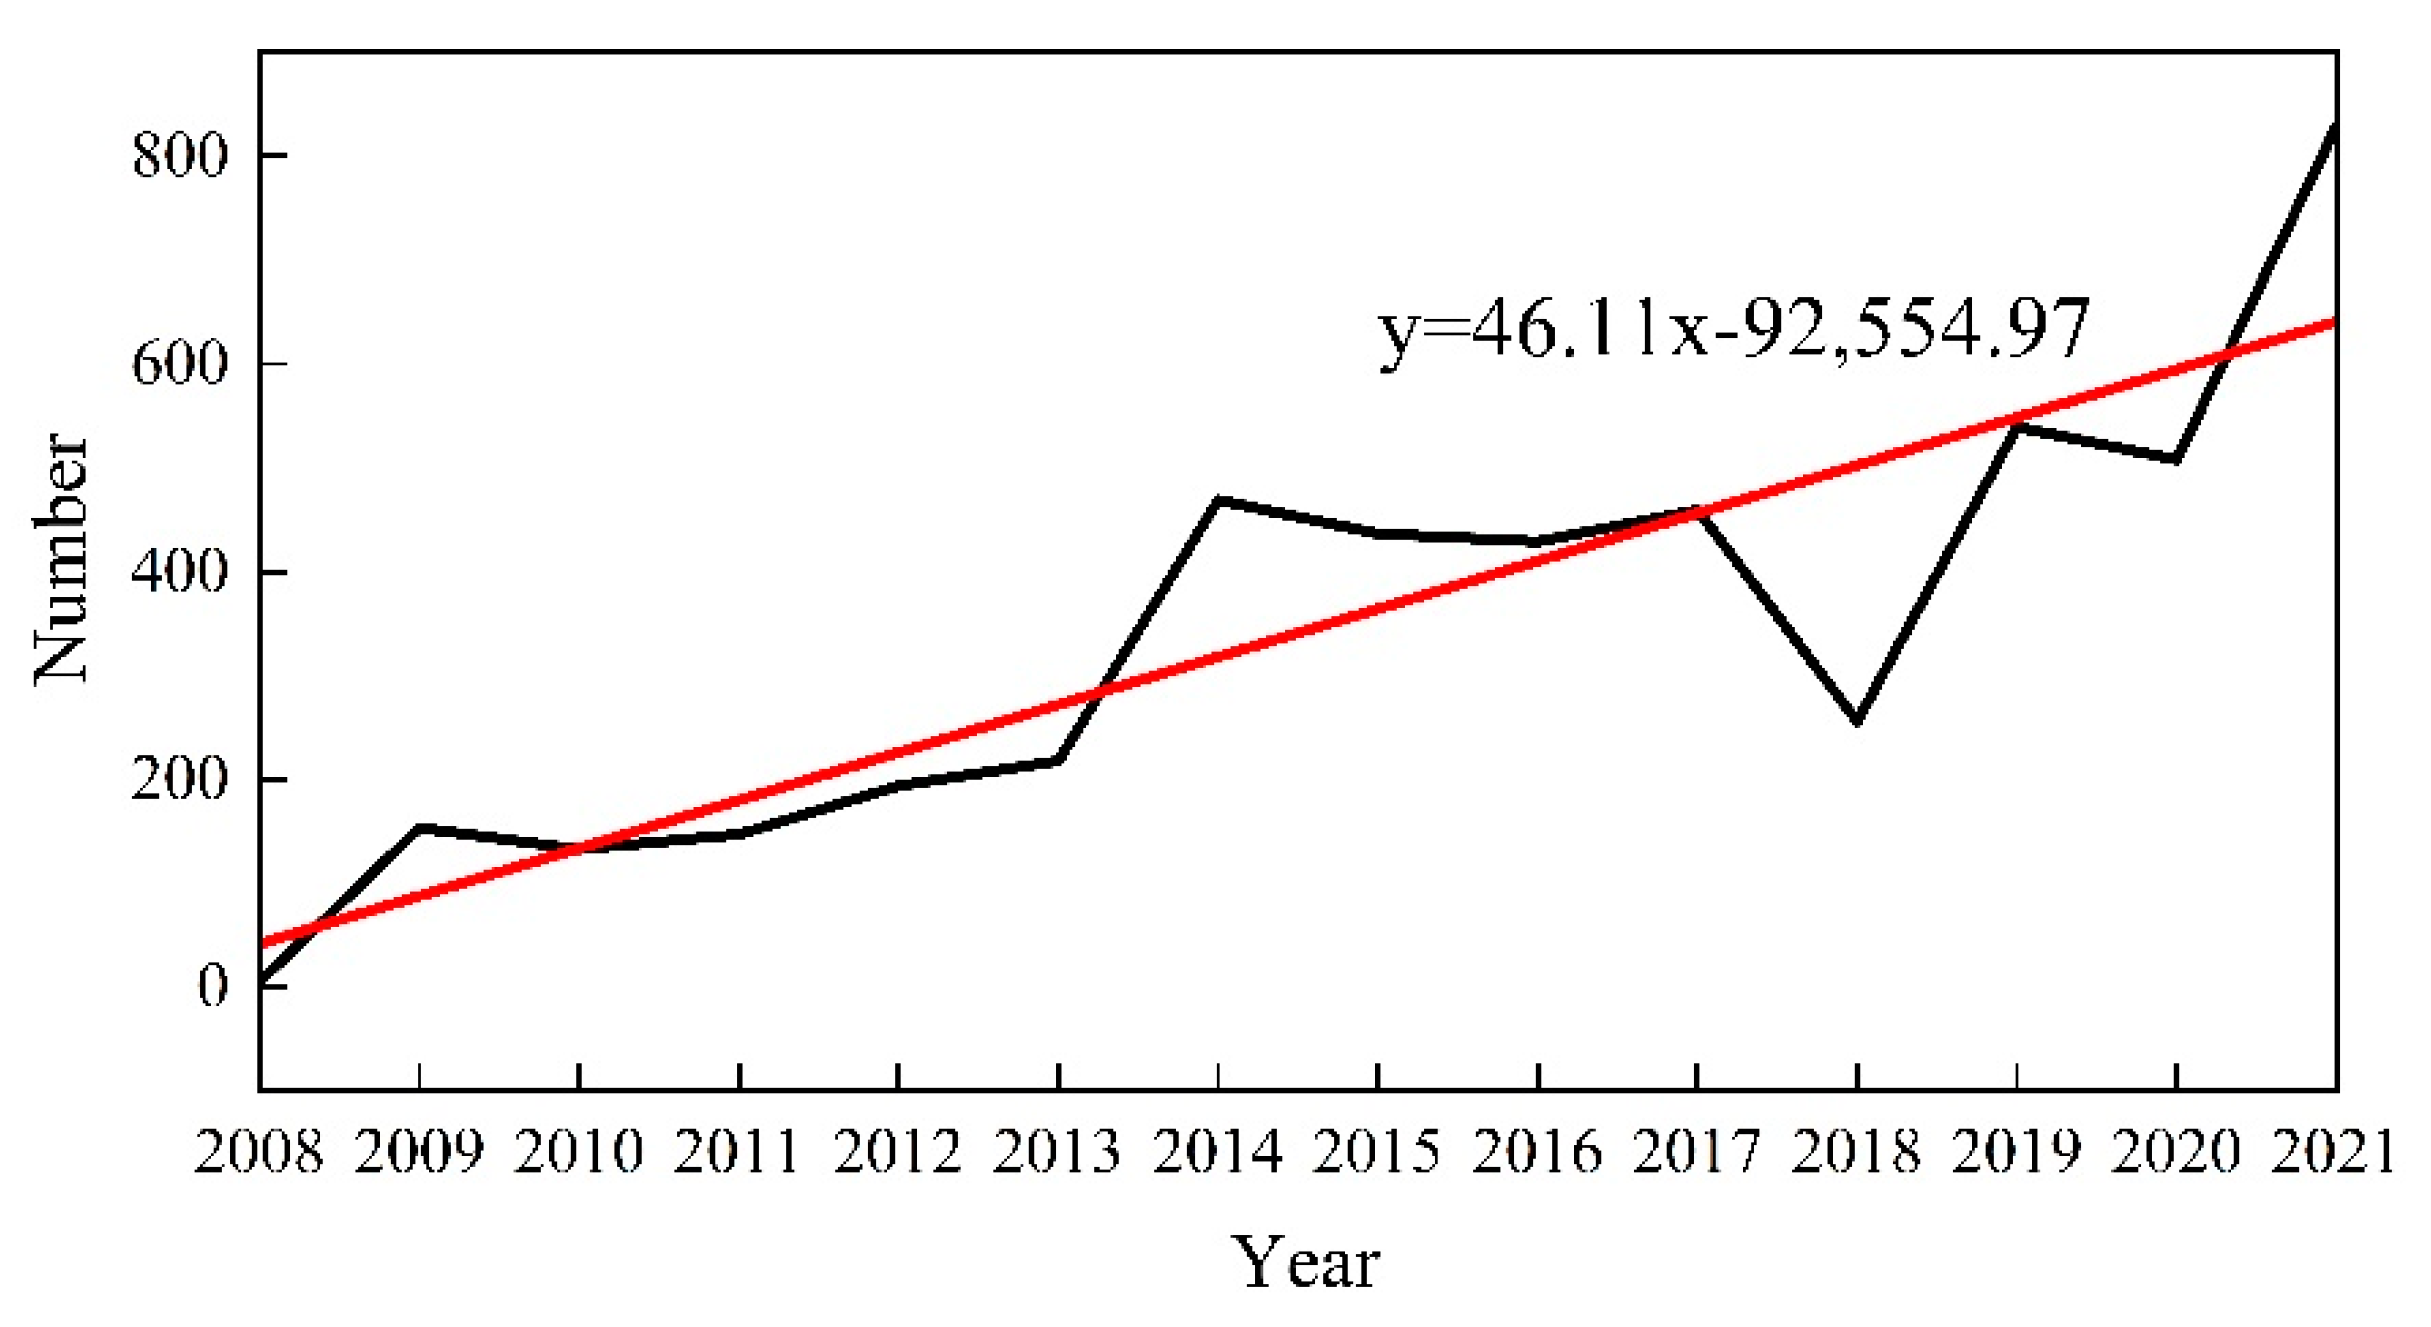
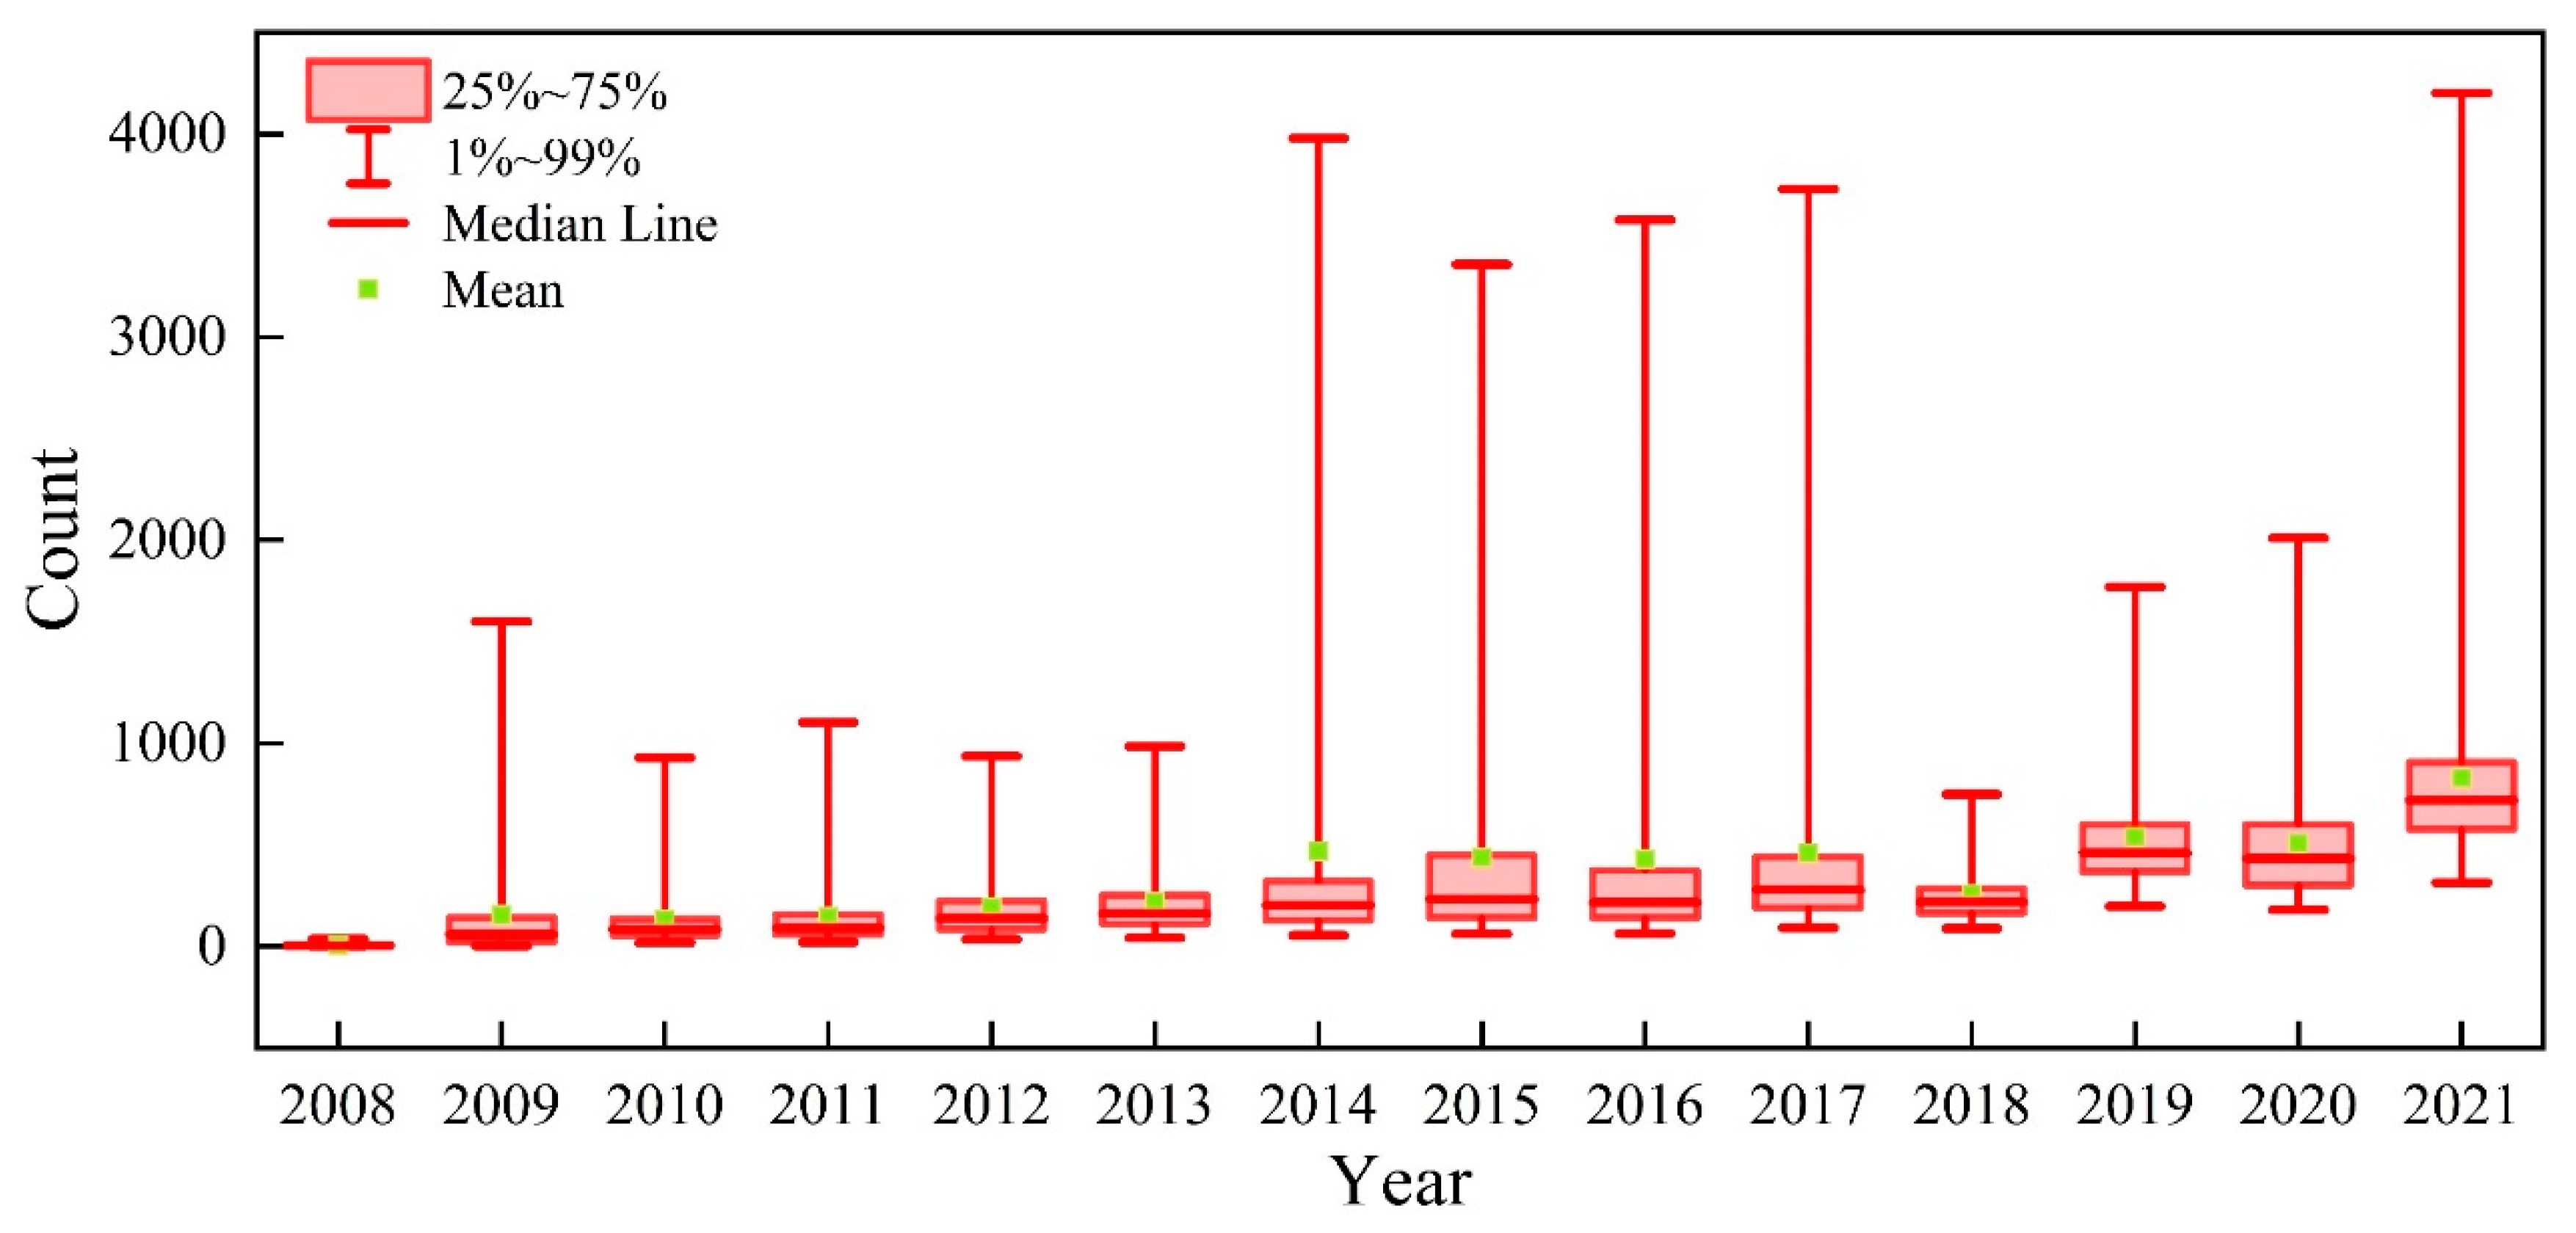
The global attention to China’s carbon policy is gradually increasing but is found to exhibit sudden spikes due to the occurrence of some important carbon-newsworthy events. Furthermore, the average count increases approximately 46.11 times each year. The maximum counts of tweets about China’s carbon policy exceed 3000 per day in 2014, 2015, 2016, 2017, and 2021, which are all related to important carbon events.
(2)
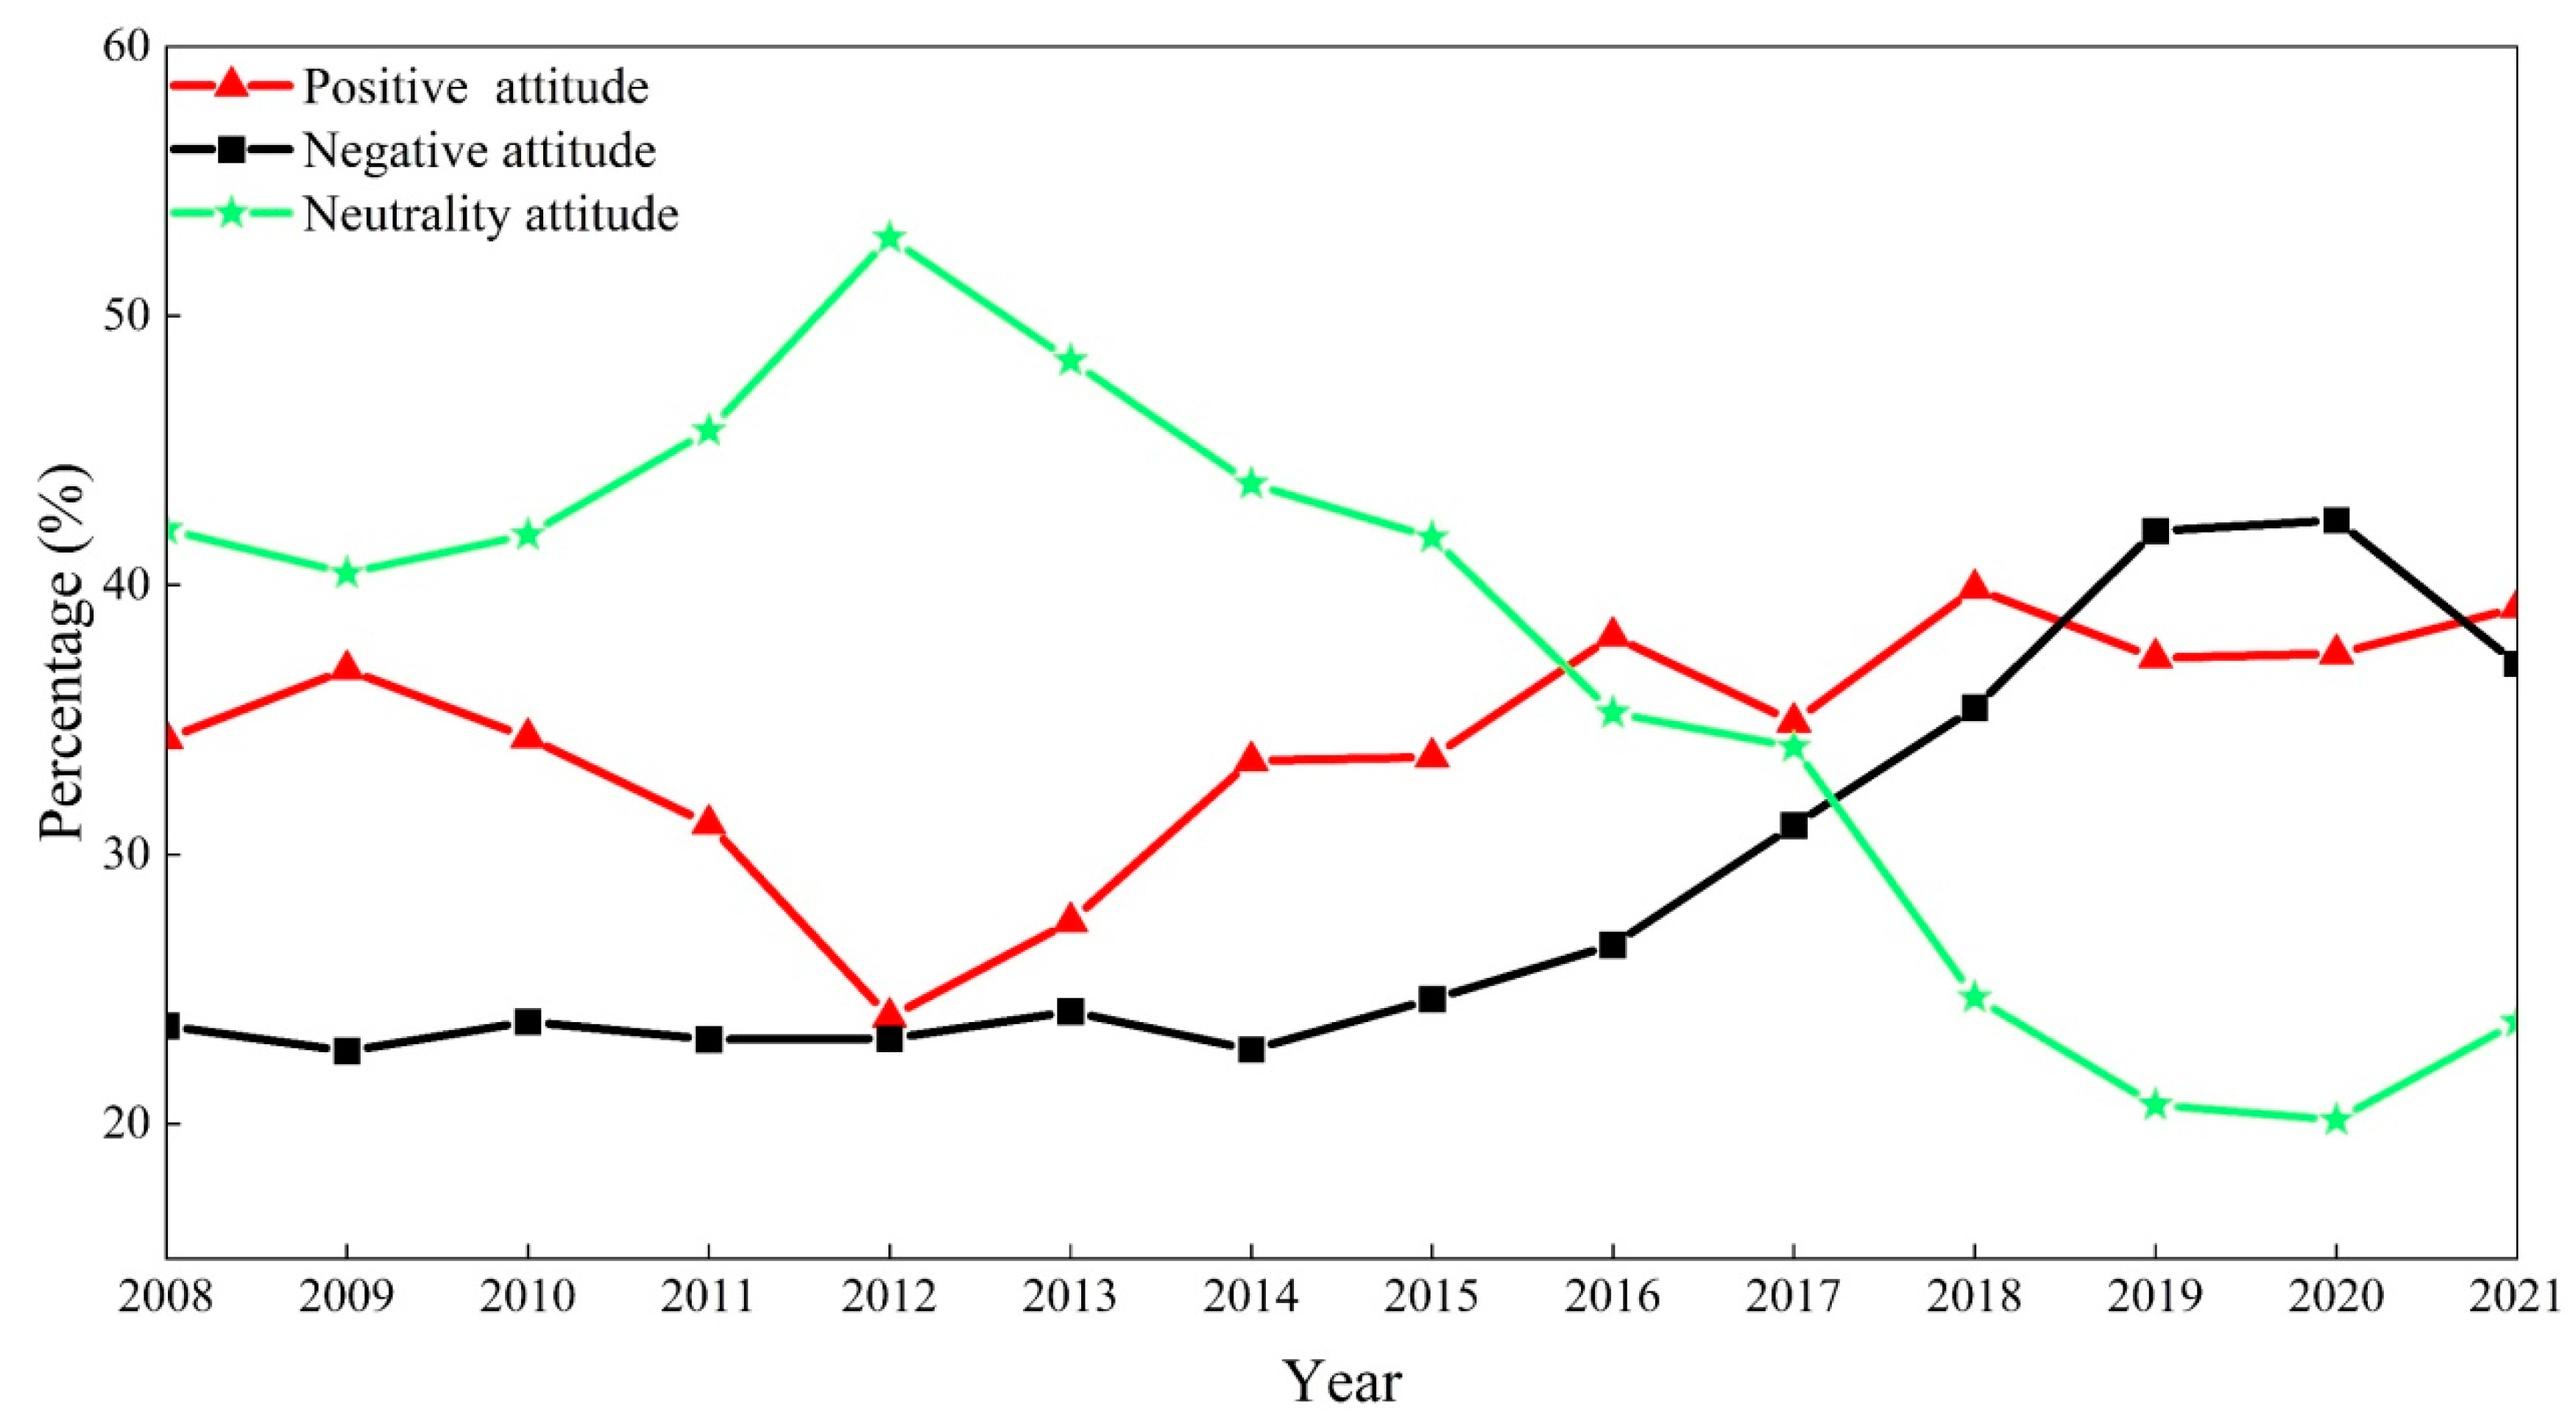
From 2008 to 2020, inferred positive and negative attitudes increase by approximately 0.35%/year and 0.96%/year, respectively, and the rate of decrease for neutral attitudes is approximately 1.31%/yr. The proportion of tweets with negative sentiment about China’s carbon policy has increased rapidly and recently exceeded the proportion of tweets with positive sentiment. Therefore, the Chinese government may need to monitor and understand the impact of the increasing negative evaluation of China’s carbon policy on China’s image and take more practical actions to reduce carbon emissions.
(3)
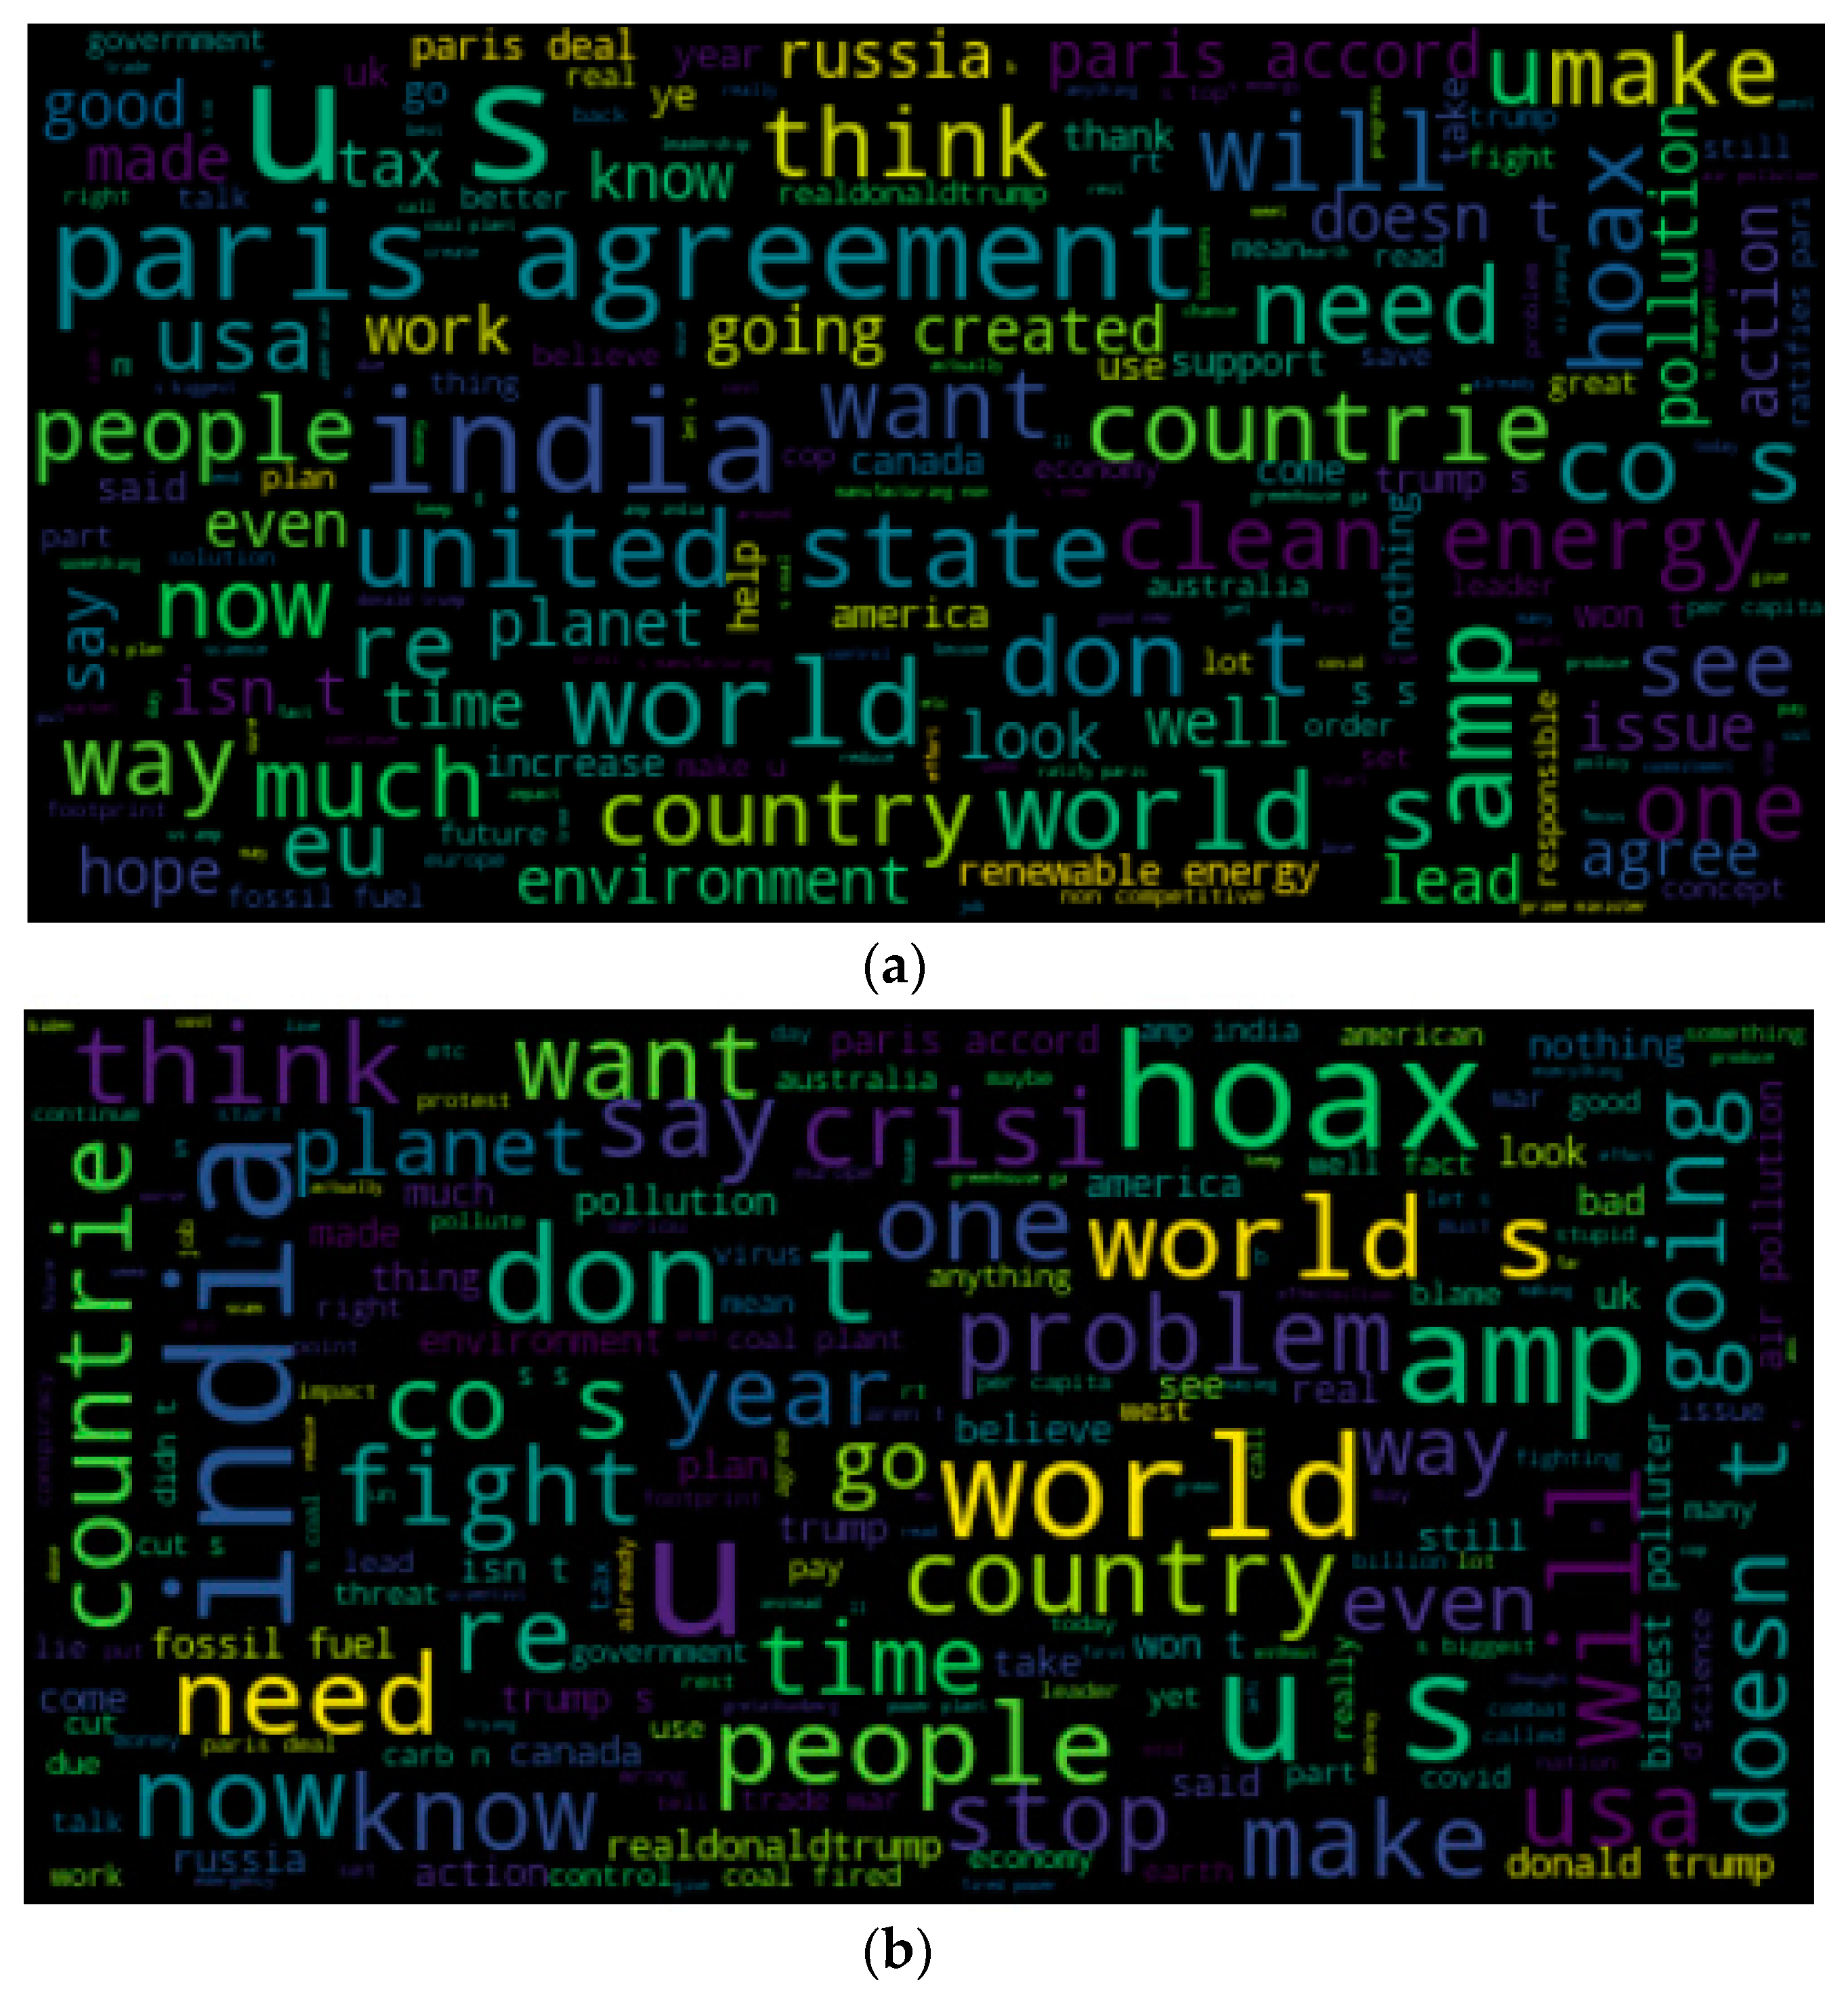
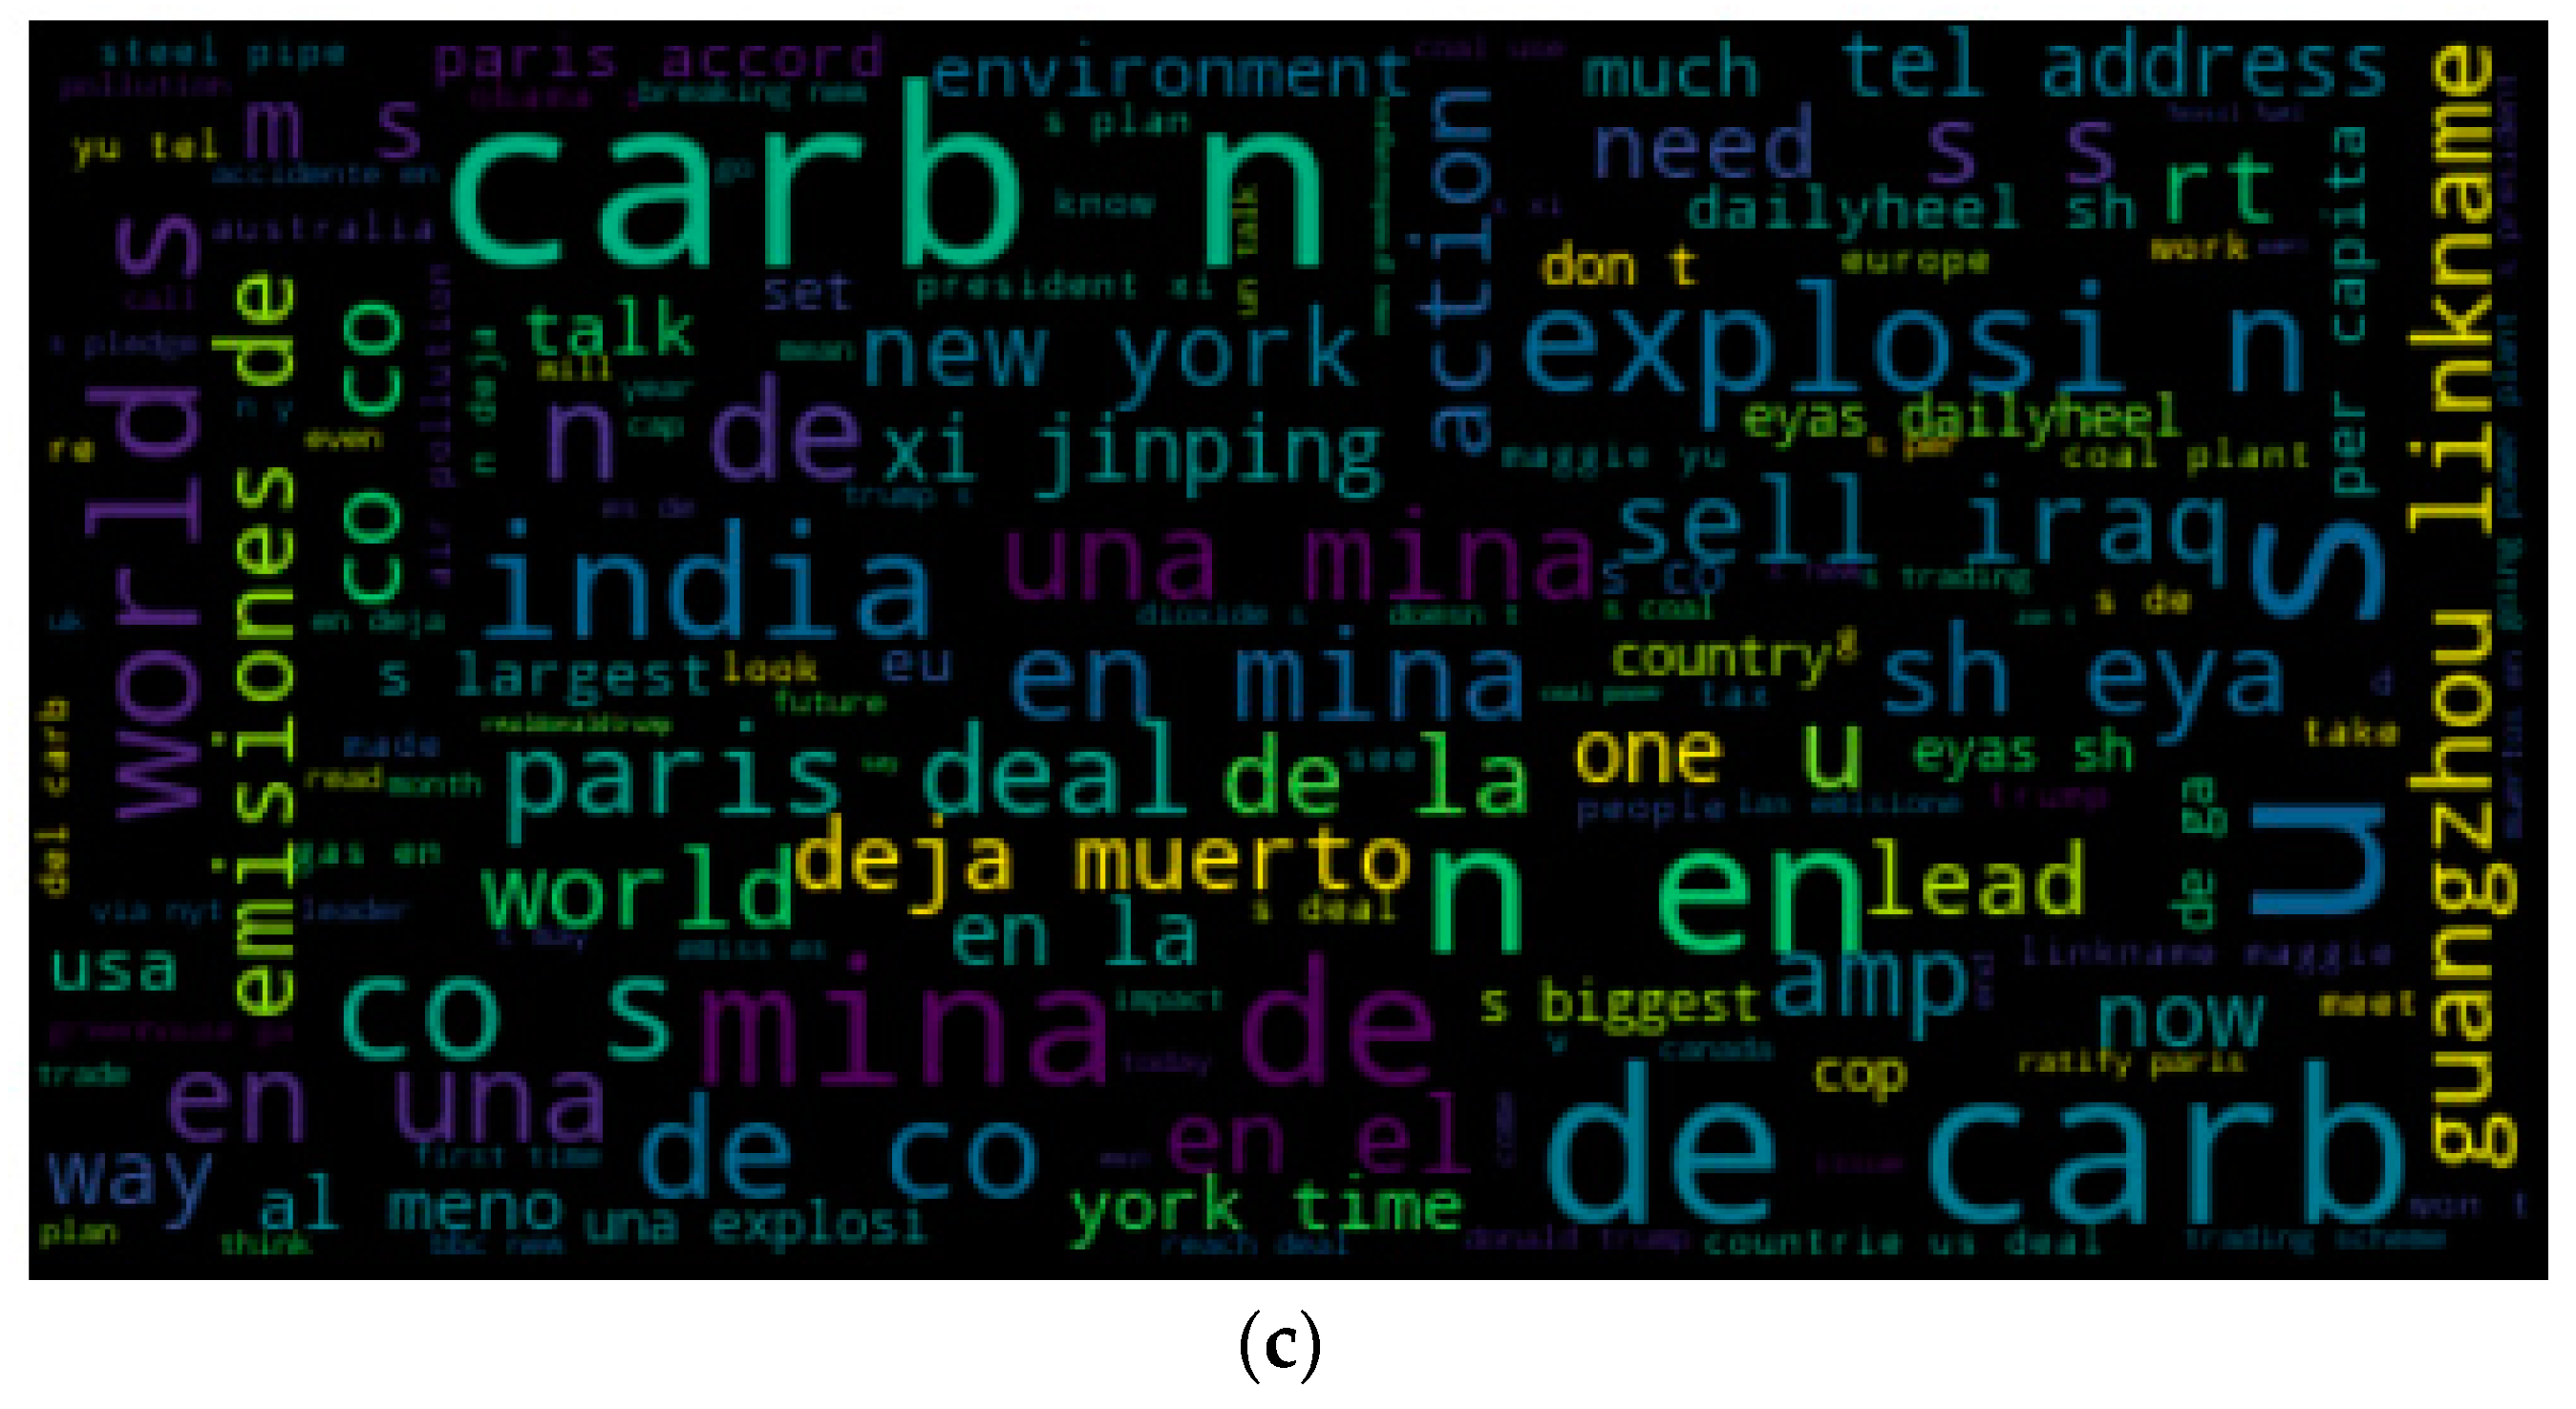
People who hold positive attitudes are concerned about reducing carbon emissions and important carbon events, and people who hold negative attitudes tend to be associated with negative words and polluted environment vocabularies. No special high-frequency words appear in the discussions of people with neutral attitudes.
(4)
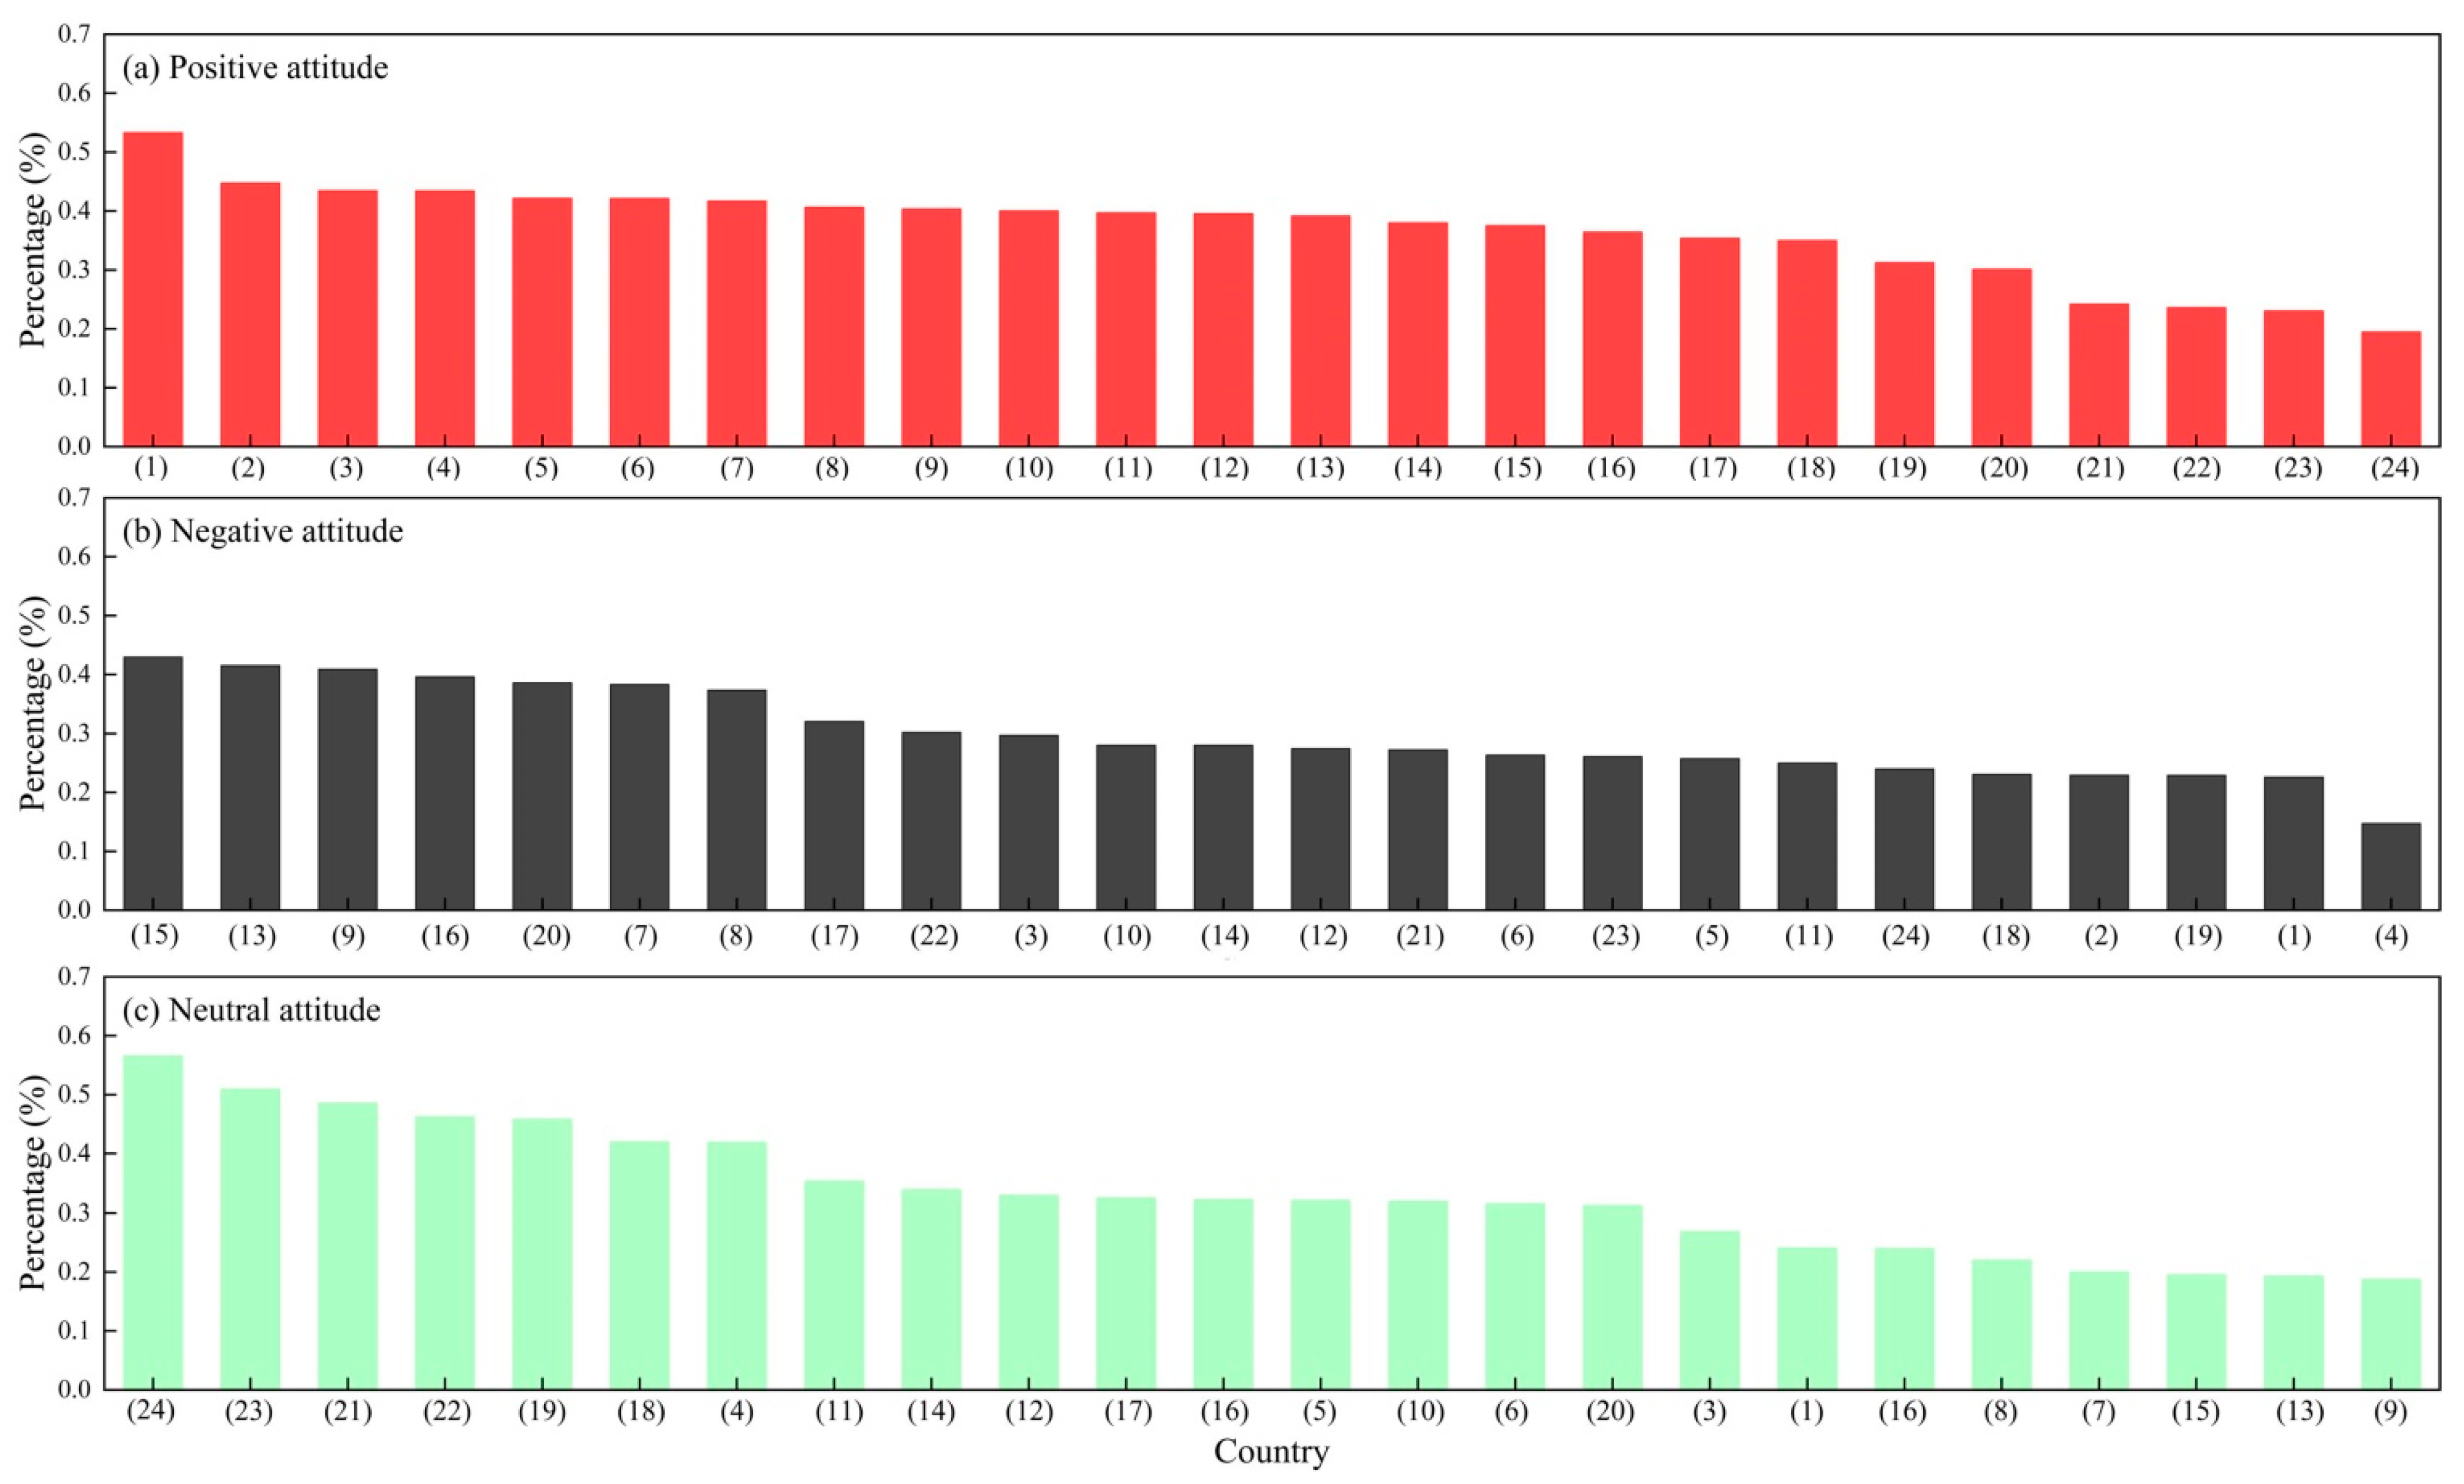
People in different countries have different attitudes towards China’s carbon policy. Generally speaking, the developed countries led by the United States may hold a negative attitude towards China’s carbon policy because of ideology and other reasons. People in developing countries generally hold either a more positive or neutral attitude towards China’s carbon policy. This shows that the Chinese government can unite more developing countries and win the support of developing countries to deal with the pressure of developed countries on the issue of climate change.
(5)
Tweets sent from China’s official diplomatic Twitter account do help to enhance China’s good image. In order to maintain China’s image as a responsible great power and reduce the negative global perceptions of China, it may be particularly important to give full play to the influence of China’s official social media accounts.
In future research, we will further consider the mechanisms related to the impact of social media topics related to China’s carbon policy on China’s image and the impact of social media on China’s carbon policy-making. We will further investigate and analyze the nature of Twitter accounts and Twitter user categories, in addition to screening robot accounts and determining whether the referenced Twitter account data are sourced from media or personal accounts, to further explore the impact of different types of Twitter accounts on China’s carbon policy [81,82,83,84]. Due to the limited use of Twitter in China, the degree to which people use Twitter in different regions will affect the research results. Lastly, we intend to explore discussions on China’s carbon policy on Sina Weibo, a local Twitter-like platform in China, and compare those findings with Twitter data.

Author Contributions

Conceptualization, N.X., L.W. and S.Z.; methodology, N.X., L.W. and S.Z.; validation, N.X.; formal analysis, N.X.; investigation, N.X.; resources, N.X., C.Z., B.W. and Q.Q.; data curation, N.X., C.Z., B.W. and Q.Q.; writing—original draft preparation, N.X.; writing—review and editing, N.X., L.W., S.Z. and C.Z.; supervision, L.W.; project administration, L.W.; funding acquisition, L.W. and S.Z. All authors have read and agreed to the published version of the manuscript.

Funding

This research was funded by the National Natural Science Foundation of China, Grant No. 41971163, 71991484, 71991480, 42071281 and 71633006. Humanities and Social Science Research Project of Hebei Education Department, Grant No. SQ2021081.

Data Availability Statement

Not applicable.

Acknowledgments

The authors would like to thank the support of the Institute of Geographic Sciences and Natural Resources Research, Beijing, and the University of Chinese Academy of Sciences, Beijing.

Conflicts of Interest

The authors declare no conflict of interest.

References

  1. Qi, X.; Han, Y. Energy quota trading can achieve energy savings and emission reduction: Evidence from China’s pilots. Environ. Sci. Pollut. Res. Int. 2021, 28, 52431–52458. [Google Scholar] [CrossRef]
  2. Liu, L.; Chen, C.; Zhao, Y.; Zhao, E. China’s carbon-emissions trading: Overview, challenges and future. Renew. Sustain. Energy Rev. 2015, 49, 254–266. [Google Scholar] [CrossRef]
  3. Qi, X.; Han, Y. How Carbon Trading Reduces China’s Pilot Emissions: An Exploration Combining LMDI Decomposition and Synthetic Control Methods. Pol. J. Environ. Stud. 2020, 29, 3273–3284. [Google Scholar] [CrossRef]
  4. Gao, Y.; Li, M.; Xue, J.; Liu, Y. Evaluation of effectiveness of China’s carbon emissions trading scheme in carbon mitigation—ScienceDirect. Energy Econ. 2020, 90, 104872. [Google Scholar] [CrossRef]
  5. Zhang, S.; Chen, L.; Zheng, Y.; Li, Y.; Li, Y.; Zeng, M. How Policies Guide and Promoted Wind Power to Market Transactions in China during the 2010s. Energies 2021, 14, 4096. [Google Scholar] [CrossRef]
  6. Duan, H.; Zhou, S.; Jiang, K.; Bertram, C.; Harmsen, M.; Kriegler, E.; van Vuuren, D.P.; Wang, S.; Fujimori, S.; Tavoni, M. Assessing China’s efforts to pursue the 1.5 degrees C warming limit. Science 2021, 372, 378–385. [Google Scholar] [CrossRef] [PubMed]
  7. Chen, J.; Cui, H.; Xu, Y.; Ge, Q. Long-term temperature and sea-level rise stabilization before and beyond 2100: Estimating the additional climate mitigation contribution from China’s recent 2060 carbon neutrality pledge. Environ. Res. Lett. 2021, 16, 074032. [Google Scholar] [CrossRef]
  8. Tracker, C.A. China Going Carbon Neutral before 2060 Would Lower Warming Projections by around 0.2 to 0.3 Degrees C. Available online: https://climateactiontracker.org/press/china-carbon-neutral-before-2060-would-lower-warming-projections-by-around-2-to-3-tenths-of-a-degree/ (accessed on 23 September 2020).
  9. Tracker, C.A. The CAT Thermometer. Available online: https://climateactiontracker.org/global/cat-thermometer/ (accessed on 4 May 2021).
  10. Mallapaty, S. How China could be carbon neutral by mid-century. Nature 2020, 586, 482–483. [Google Scholar] [CrossRef]
  11. Wang, Z.; Zhu, Y.; Zhu, Y.; Shi, Y. Energy structure change and carbon emission trends in China. Energy 2016, 115, 369–377. [Google Scholar] [CrossRef]
  12. Lin, B.; Moubarak, M. Renewable energy consumption—Economic growth nexus for China. Renew. Sustain. Energy Rev. 2014, 40, 111–117. [Google Scholar] [CrossRef]
  13. Pata, U.K.; Caglar, A.E. Investigating the EKC hypothesis with renewable energy consumption, human capital, globalization and trade openness for China: Evidence from augmented ARDL approach with a structural break. Energy 2021, 216, 119220. [Google Scholar] [CrossRef]
  14. Zheng, H.; Song, M.; Shen, Z. The evolution of renewable energy and its impact on carbon reduction in China. Energy 2021, 237, 121639. [Google Scholar] [CrossRef]
  15. Xu, G.; Schwarz, P.; Yang, H. Adjusting energy consumption structure to achieve China’s CO2 emissions peak. Renew. Sustain. Energy Rev. 2020, 122, 109737. [Google Scholar] [CrossRef]
  16. Davidson, M.; Karplus, V.J.; Zhang, D.; Zhang, X. Policies and Institutions to Support Carbon Neutrality in China by 2060. Econ. Energy Environ. Policy 2021, 10, 7–24. [Google Scholar] [CrossRef]
  17. Mi, Z.; Wei, Y.-M.; Wang, B.; Meng, J.; Liu, Z.; Shan, Y.; Liu, J.; Guan, D. Socioeconomic impact assessment of China’s CO2 emissions peak prior to 2030. J. Clean. Prod. 2017, 142, 2227–2236. [Google Scholar] [CrossRef] [Green Version]
  18. Weng, Y.; Cai, W.; Wang, C. Evaluating the use of BECCS and afforestation under China’s carbon-neutral target for 2060. Appl. Energy 2021, 299, 117263. [Google Scholar] [CrossRef]
  19. Ding, S.; Zhang, M.; Song, Y. Exploring China’s carbon emissions peak for different carbon tax scenarios. Energy Policy 2019, 129, 1245–1252. [Google Scholar] [CrossRef]
  20. McGrath, M. Climate Change: China Aims for ‘Carbon Neutrality by 2060′. Available online: https://www.bbc.com/news/science-environment-54256826 (accessed on 22 September 2020).
  21. García-Herrero, A.; Tagliapietra, S. China Has a Grand Carbon Neutrality Target but Where Is the Plan? Available online: https://www.bruegel.org/2021/04/chinas-has-a-grand-carbon-neutrality-target-but-where-is-the-plan/ (accessed on 14 April 2021).
  22. Press, T.A. China, Top Global Emitter, Aims to Go Carbon-Neutral by 2060. Available online: https://apnews.com/article/climate-climate-change-paris-xi-jinping-emissions-reduction-7a4216ad4026090adb8d600fab210406 (accessed on 23 September 2020).
  23. Myers, S.L. China’s Pledge to Be Carbon Neutral by 2060: What It Means. Available online: https://www.nytimes.com/2020/09/23/world/asia/china-climate-change.html (accessed on 23 September 2020).
  24. Economist. China’s Climate Sincerity Is Being Put to the Test. Available online: https://www.economist.com/china/2021/06/17/chinas-climate-sincerity-is-being-put-to-the-test (accessed on 17 June 2021).
  25. Soo, Z. China Sticks to Goal of Having Carbon Emissions Peak by 2030. Available online: https://apnews.com/article/europe-business-china-environment-and-nature-climate-change-7e29d68ea8a77ee8ebbe1460f0f09ffd (accessed on 3 August 2021).
  26. Tracker, T.C.A. China Overall Rating. Available online: https://climateactiontracker.org/countries/china/ (accessed on 15 September 2021).
  27. Wang, J. Managing national reputation and international relations in the global era: Public diplomacy revisited. Public Relat. Rev. 2006, 32, 91–96. [Google Scholar] [CrossRef]
  28. Buhmann, A.; Ingenhoff, D. Advancing the country image construct from a public relations perspective: From model to measurement. J. Commun. Manag. 2015, 19, 62–80. [Google Scholar] [CrossRef] [Green Version]
  29. Yang, M.; Wan, H. The Influence of Social Media on the Design of the National Image in the Globalization Context. In Proceedings of the Social Computing and Social Media, Toronto, ON, Canada, 17–22 July 2016; Lecture Notes in Computer Science. Springer: Cham, Switzerland, 2016; pp. 234–246. [Google Scholar]
  30. Bosch, T. Blogging and tweeting climate change in South Africa. Ecquid Novi Afr. J. Stud. 2012, 33, 44–53. [Google Scholar] [CrossRef]
  31. Gottfried, J.; Shearer, E. News Use across Social Media Platforms 2016; Pew Research Center: Washington, DC, USA, 2016. [Google Scholar]
  32. Lück, J.; Wozniak, A.; Wessler, H. Networks of Coproduction: How Mainstream NGOs and Journalists Create Common Interpretations of the UN Climate Summits. Int. J. Press Politics 2015, 21, 25–47. [Google Scholar] [CrossRef] [Green Version]
  33. Anderson, A. Sources, media, and modes of climate change communication: The role of celebrities. WIREs Clim. Chang. 2011, 2, 535–546. [Google Scholar] [CrossRef]
  34. Jang, S.M.; Hart, P.S. Polarized frames on ‘‘climate change’’ and ‘‘global warming’’ across countries and states: Evidence from Twitter big data. Glob. Environ. Chang. 2015, 32, 11–17. [Google Scholar] [CrossRef]
  35. Schuldt, J.P.; Enns, P.K.; Cavaliere, V. Does the label really matter? Evidence that the US public continues to doubt “global warming” more than “climate change”. Clim. Chang. 2017, 143, 271–280. [Google Scholar] [CrossRef]
  36. Pathak, N.; Henry, M.J.; Volkova, S. Understanding Social Media’s Take on Climate Change through Large-Scale Analysis of Targeted Opinions and Emotions. In 2017 AAAI Spring Symposium Series; Aaai Press: Palo Alto, CA, USA, 2017. [Google Scholar]
  37. Cody, E.M.; Reagan, A.J.; Mitchell, L.; Dodds, P.S.; Danforth, C.M. Climate Change Sentiment on Twitter: An Unsolicited Public Opinion Poll. PLoS ONE 2015, 10, e0136092. [Google Scholar] [CrossRef] [Green Version]
  38. Veltri, G.A.; Atanasova, D. Climate change on Twitter: Content, media ecology and information sharing behaviour. Public Underst. Sci. 2017, 26, 721–737. [Google Scholar] [CrossRef]
  39. Baylis, P. Temperature and temperament: Evidence from Twitter. J. Public Econ. 2020, 184, 104161. [Google Scholar] [CrossRef]
  40. Berglez, P.; Al-Saqaf, W. Extreme weather and climate change: Social media results, 2008–2017. Environ. Hazards 2021, 20, 382–399. [Google Scholar] [CrossRef]
  41. Kirilenko, A.P.; Molodtsova, T.; Stepchenkova, S.O. People as sensors: Mass media and local temperature influence climate change discussion on Twitter. Glob. Environ. Chang. 2015, 30, 92–100. [Google Scholar] [CrossRef]
  42. Abbar, S.; Zanouda, T.; Berti-Equille, L.; Borge-Holthoefer, J. Using Twitter to Understand Public Interest in Climate Change: The Case of Qatar. In Proceedings of the Tenth International AAAI Conference on Web and Social Media, Cologne, Germany, 17–20 May 2016. [Google Scholar]
  43. Sisco, M.R.; Bosetti, V.; Weber, E.U. When do extreme weather events generate attention to climate change? Clim. Chang. 2017, 143, 227–241. [Google Scholar] [CrossRef]
  44. Kirilenko, A.P.; Stepchenkova, S.O. Public microblogging on climate change: One year of Twitter worldwide. Glob. Environ. Chang. 2014, 26, 171–182. [Google Scholar] [CrossRef]
  45. Verma, I.M. Editorial Expression of Concern: Experimental evidence of massivescale emotional contagion through social networks. Proc. Natl. Acad. Sci. USA 2014, 111, 10779. [Google Scholar] [CrossRef] [PubMed] [Green Version]
  46. Margolin, D.; Liao, W. The emotional antecedents of solidarity in social media crowds. New Media Soc. 2018, 20, 3700–3719. [Google Scholar] [CrossRef] [Green Version]
  47. Brady, W.J.; Wills, J.A.; Jost, J.T.; Tucker, J.A.; Van Bavel, J.J. Emotion shapes the diffusion of moralized content in social networks. Proc. Natl. Acad. Sci. USA 2017, 114, 7313–7318. [Google Scholar] [CrossRef] [Green Version]
  48. Priyadarshini, I.; Mohanty, P.; Kumar, R.; Sharma, R.; Puri, V.; Singh, P.K. A study on the sentiments and psychology of twitter users during COVID-19 lockdown period. Multimed. Tools Appl. 2021, 1–23. [Google Scholar] [CrossRef] [PubMed]
  49. Zhang, C.; Yu, M.C.; Marin, S. Exploring public sentiment on enforced remote work during COVID-19. J. Appl. Psychol. 2021, 106, 797–810. [Google Scholar] [CrossRef]
  50. Cabezas, J.; Moctezuma, D.; Fernandez-Isabel, A.; Martin de Diego, I. Detecting Emotional Evolution on Twitter during the COVID-19 Pandemic Using Text Analysis. Int. J. Environ. Res. Public Health 2021, 18, 6981. [Google Scholar] [CrossRef] [PubMed]
  51. Medhat, W.; Hassan, A.; Korashy, H. Sentiment analysis algorithms and applications: A survey. Ain Shams Eng. J. 2014, 5, 1093–1113. [Google Scholar] [CrossRef] [Green Version]
  52. Chaudhry, H.N.; Javed, Y.; Kulsoom, F.; Mehmood, Z.; Khan, Z.I.; Shoaib, U.; Janjua, S.H. Sentiment Analysis of before and after Elections: Twitter Data of U.S. Election 2020. Electronics 2021, 10, 2082. [Google Scholar] [CrossRef]
  53. Chauhan, P.; Sharma, N.; Sikka, G. The emergence of social media data and sentiment analysis in election prediction. J. Ambient. Intell. Humaniz. Comput. 2021, 12, 2601–2627. [Google Scholar] [CrossRef]
  54. Dandannavar, P.S.; Mangalwede, S.R.; Deshpande, S.B. Emoticons and Their Effects on Sentiment Analysis of Twitter Data. In Proceedings of the EAI International Conference on Big Data Innovation for Sustainable Cognitive Computing, Coimbatore, India, 17–18 December 2020; pp. 191–201. [Google Scholar] [CrossRef]
  55. Faizi, R.; El Fkihi, S.; Ezzahid, S.S.; El Afia, A. Using Sentiment Analysis to Derive Business Value. In Proceedings of the 32nd Conference of the International-Business-Information-Management-Association (IBIMA), Seville, Spain, 15–16 November 2018; pp. 6781–6785. [Google Scholar]
  56. Naseem, U.; Razzak, I.; Khushi, M.; Eklund, P.W.; Kim, J. A Large-Scale Benchmark Twitter Data Set for COVID-19 Sentiment Analysis. IEEE Trans. Comput. Soc. Syst. 2021, 8, 1003–1015. [Google Scholar] [CrossRef]
  57. Huang, Z.; Arifon, O. Chinese public diplomacy on Twitter: Creating a harmonious polyphony. Hermès La Rev. 2018, 81, 45–53. [Google Scholar] [CrossRef]
  58. Huang, Z.A.; Wang, R. Building a Network to “Tell China Stories Well”: Chinese Diplomatic Communication Strategies on Twitter. Int. J. Commun. 2019, 13, 2984–3007. [Google Scholar]
  59. Zhao, J.; Gui, X. Comparison Research on Text Pre-processing Methods on Twitter Sentiment Analysis. IEEE Access 2017, 5, 2870–2879. [Google Scholar] [CrossRef]
  60. Saif, H.; He, Y.; Fernandez, M.; Alani, H. Semantic Patterns for Sentiment Analysis of Twitter. In Proceedings of the International Semantic Web Conference, Riva del Garda, Italy, 19–23 October 2014; Volume 8797, pp. 324–340. [Google Scholar] [CrossRef]
  61. Terrana, D.; Augello, A.; Pilato, G. Automatic Unsupervised Polarity Detection on a Twitter Data Stream. In Proceedings of the 2014 IEEE International Conference on Semantic Computing (ICSC), Newport Beach, CA, USA, 16–18 June 2014; pp. 128–134. [Google Scholar] [CrossRef]
  62. Saif, H.; Fernandez, M.; He, Y.; Alani, H. On Stopwords, Filtering and Data Sparsity for Sentiment Analysis of Twitter. In Proceedings of the LREC 2014—9th International Conference on Language Resources and Evaluation, Reykjavik, Iceland, 26–31 May 2014; pp. 810–817. [Google Scholar]
  63. Sattar, N.S.; Arifuzzaman, S. COVID-19 Vaccination Awareness and Aftermath: Public Sentiment Analysis on Twitter Data and Vaccinated Population Prediction in the USA. Appl. Sci. 2021, 11, 6128. [Google Scholar] [CrossRef]
  64. Hutto, C.; Gilbert, E. VADER: A Parsimonious Rule-based Model for Sentiment Analysis of Social Media Text. In Proceedings of the International AAAI Conference on Web and Social Media, Ann Arbor, MI, USA, 1–4 June 2014; Volume 8, pp. 216–225. [Google Scholar]
  65. Ribeiro, F.N.; Araújo, M.; Gonçalves, P.; André Gonçalves, M.; Benevenuto, F. SentiBench—A benchmark comparison of state-of-the-practice sentiment analysis methods. EPJ Data Sci. 2016, 5, 1–29. [Google Scholar] [CrossRef] [Green Version]
  66. Zunic, A.; Corcoran, P.; Spasic, I. Sentiment Analysis in Health and Well-Being: Systematic Review. JMIR Med. Inform. 2020, 8, e16023. [Google Scholar] [CrossRef] [PubMed]
  67. Fan, R.; Varol, O.; Varamesh, A.; Barron, A.; van de Leemput, I.A.; Scheffer, M.; Bollen, J. The minute-scale dynamics of online emotions reveal the effects of affect labeling. Nat. Hum. Behav. 2018, 3, 92–100. [Google Scholar] [CrossRef]
  68. Zheng, J.; Mi, Z.; Coffman, D.M.; Milcheva, S.; Shan, Y.; Guan, D.; Wang, S. Regional development and carbon emissions in China. Energy Econ. 2019, 81, 25–36. [Google Scholar] [CrossRef]
  69. Shahin, S.; Huang, Q.E. Friend, Ally, or Rival? Twitter Diplomacy as “Technosocial” Performance of National Identity. Int. J. Commun. 2019, 13, 5100–5118. [Google Scholar]
  70. Wang, A.H.-E.; Lee, M.-C.; Wu, M.-H.; Shen, P. Influencing overseas Chinese by tweets: Text-images as the key tactic of Chinese propaganda. J. Comput. Soc. Sci. 2020, 3, 469–486. [Google Scholar] [CrossRef] [PubMed]
  71. Liss, A. Images of China in the American Print Media: A survey from 2000 to 2002. J. Contemp. China 2003, 12, 299–318. [Google Scholar] [CrossRef]
  72. Peng, Z. Representation of China: An across time analysis of coverage in the New York Times and Los Angeles Times. Asian J. Commun. 2004, 14, 53–67. [Google Scholar] [CrossRef]
  73. Tang, L. Transitive representations of China’s image in the US mainstream newspapers: A corpus-based critical discourse analysis. Journalism 2018, 22, 804–820. [Google Scholar] [CrossRef]
  74. Carraro, C.; Siniscalco, D. The international dimension of environmental policy. Eur. Econ. Rev. 1992, 36, 379–387. [Google Scholar] [CrossRef]
  75. Li, B.; Xu, Z. China’s Self-identity Construction as a Responsible Power in the Post-cold War Era. Teach. Res. 2006, 1, 49–56. [Google Scholar]
  76. Tom, L. Whither China: From membership to responsibility? NBR Anal. 2005, 16, 5–14. [Google Scholar]
  77. Xie, T.; Page, B.I. What Affects China’s National Image? A cross-national study of public opinion. J. Contemp. China 2013, 22, 850–867. [Google Scholar] [CrossRef]
  78. Aldrich, J.; Lu, J.; Kang, L. How Do Americans View the Rising China? J. Contemp. China 2014, 24, 203–221. [Google Scholar] [CrossRef]
  79. Kang, L.; Chu, Y.-H. China’s Rise through World Public Opinion: Editorial Introduction. J. Contemp. China 2014, 24, 197–202. [Google Scholar] [CrossRef]
  80. Chu, Y.-H.; Kang, L.; Huang, M.-H. How East Asians View the Rise of China. J. Contemp. China 2014, 24, 398–420. [Google Scholar] [CrossRef]
  81. Kušen, E.; Strembeck, M. Something draws near, I can feel it: An analysis of human and bot emotion-exchange motifs on Twitter. Online Soc. Netw. Media 2019, 10, 1–17. [Google Scholar] [CrossRef]
  82. Kušen, E.; Strembeck, M. “Evacuate everyone south of that line” Analyzing structural communication patterns during natural disasters. J. Comput. Soc. Sci. 2020, 4, 531–565. [Google Scholar] [CrossRef]
  83. Wojcik, S.; Hughes, A. Sizing up Twitter Users; Pew Research Center: Washington, DC, USA, 2019. [Google Scholar]
  84. Xu, H.; Zhang, N.; Zhou, L. Validity Concerns in Research Using Organic Data. J. Manag. 2020, 46, 1257–1274. [Google Scholar] [CrossRef]
Figure 1. Daily timelines of tweets about China’s carbon policy. (Panel (b) reduces the range to provide a higher-resolution version of Panel (a).)
Energies 14 07782 g001
Figure 2. The average count of Tweets about China’s carbon policy from 2008 to 2021.
Energies 14 07782 g002
Figure 3. Box chart of the daily count of tweets about China’s carbon emission from 2008 to 2021.
Energies 14 07782 g003
Figure 4. Percentage of positive, negative, and neutral attitudes towards China’s carbon policy from 2008 to 2021.
Energies 14 07782 g004
Figure 5. Top frequency word distribution for different sentiments, (a) positive, (b) negative, (c) neutral.
Energies 14 07782 g005aEnergies 14 07782 g005b
Figure 6. The percentage of the positive attitude (a), negative attitude (b), and neutral attitude (c) of 25 countries towards China’s carbon policy: (1) Pakistan; (2) France; (3) India; (4) Sweden; (5) South Africa; (6) Philippines; (7) New Zealand; (8) United Kingdom; (9) Canada; (10) Belgium; (11) Italy; (12) Thailand; (13) United States; (14) Ireland; (15) Nigeria; (16) Australia; (17) Qatar; (18) Switzerland; (19) Spain; (20) Germany; (21) Netherlands; (22) Colombia; (23) Brazil; (24) Mexico.
Energies 14 07782 g006
Table 1. Profiles of Chinese diplomatic Twitter accounts.
Twitter AccountUserCreation Time
@zlj517Zhao Lijian (diplomat in Pakistan)2010.05
@ChinaEUMissionMission of the People’s Republic of China to the European Union2013.09
@ChinaEmbOttawaEmbassy of the People’s Republic of China in Canada2014.06
@Chinamission2unPermanent Mission of the People’s Republic of China to the United Nations2015.04
@ChinaMissionGvaPermanent Mission of the People’s Republic of China to the United Nations at Geneva and Other International Organizations in Switzerland2015.05
@CathayPakEmbassy of the People’s Republic of China in the Islamic Republic of Pakistan2015.09
@ChinaembmanilaEmbassy of the People’s Republic of China in the Republic of the Philippines2017.02
@ChinaConsulateConsulate General of the People’s Republic of China in Chicago2017.02
@weiasecasWei Qiang (ambassador to Panama)2017.11
@ChinaEmSloveniaEmbassy of the People’s Republic of China in the Republic of Slovenia2017.12
@China_Amb_IndiaLuo Zhaohui (ambassador to India)2017.12
@ChineseEmb_UgaEmbassy of the People’s Republic of China in the Republic of Uganda2018.01
@ChineseZimbabweEmbassy of the People’s Republic of China in the Republic of Zimbabwe2018.09
Table 2. The impact of China’s official accounts Twitter data on the total count of tweets.
CountCoef.St.Err.t-Valuep-Value[95% ConfInterval]Sig.
original tweets6.9122.7722.490.0151.37812.446**
retweet–0.0410.008–5.250–0.057–0.026***
reply–2.3970.697–3.440.001–3.788–1.005***
like0.0390.037 1.070.288–0.0340.113
quote9.9042.185 4.5305.54114.268***
*** p < 0.01, ** p < 0.05, * p < 0.1.
Table 3. The impact of China’s official accounts Twitter data on the count of positive tweets.
CountCoef.St.Err.t-Valuep-Value[95% ConfInterval]Sig.
original tweets2.6861.006 2.670.010.6784.694***
retweet−0.0170.003−5.440−0.023−0.011***
reply−0.8770.305−2.880.005−1.485−0.269***
like0.0090.017 0.540.591−0.0250.044
quote3.8080.919 4.1401.9725.643***
*** p < 0.01, ** p < 0.05, * p < 0.1.
Table 4. The impact of China’s official accounts Twitter data on the count of negative tweets.
CountCoef.St.Err.t-Valuep-Value[95% ConfInterval]Sig.
original tweets1.4520.9430 1.540.128−0.433.335
retweet−0.0110.003−4.330−0.016−0.006***
reply−0.8930.219−4.070−1.331−0.455***
like0.0150.013 1.180.241−0.010.04
quote3.4240.755 4.5401.9184.931***
*** p < 0.01, ** p < 0.05, * p < 0.1.
Table 5. The impact of China’s official accounts Twitter data on the count of neutral tweets.
CountCoef.St.Err.t-Valuep-Value[95% ConfInterval]
original tweets2.7740.975 2.840.0060.8274.721
retweet−0.0140.002 −5.610−0.018−0.009
reply−0.6270.198−3.170.002−1.021−0.232
like0.0150.009 1.750.085−0.0020.033
quote2.6730.587 4.5501.53.845
*** p < 0.01, ** p < 0.05, * p < 0.1.
Publisher’s Note: MDPI stays neutral with regard to jurisdictional claims in published maps and institutional affiliations.

