Article

Numerical Modeling of the Effects of Pore Characteristics on the Electric Breakdown of Rock for Plasma Pulse Geo Drilling

1
Geothermal Energy and Geofluids Group, Institute of Geophysics, Department of Earth Sciences, ETH Zurich, 8092 Zurich, Switzerland
2
Theoretical Physics Research Group, Physics Department, Faculty of Science, Mansoura University, Mansoura 35516, Egypt
3
Department of Earth and Environmental Sciences, University of Minnesota, Minneapolis, MN 55455, USA
*
Authors to whom correspondence should be addressed.
Energies 2022, 15(1), 250; https://doi.org/10.3390/en15010250
Submission received: 22 November 2021 / Revised: 22 December 2021 / Accepted: 25 December 2021 / Published: 30 December 2021
(This article belongs to the Section H: Geo-Energy)

Abstract

:
Drilling costs can be 80% of geothermal project investment, so decreasing these deep drilling costs substantially reduces overall project costs, contributing to less expensive geothermal electricity or heat generation. Plasma Pulse Geo Drilling (PPGD) is a contactless drilling technique that uses high-voltage pulses to fracture the rock without mechanical abrasion, which may reduce drilling costs by up to 90% of conventional mechanical rotary drilling costs. However, further development of PPGD requires a better understanding of the underlying fundamental physics, specifically the dielectric breakdown of rocks with pore fluids subjected to high-voltage pulses. This paper presents a numerical model to investigate the effects of the pore characteristics (i.e., pore fluid, shape, size, and pressure) on the occurrence of the local electric breakdown (i.e., plasma formation in the pore fluid) inside the granite pores and thus on PPGD efficiency. Investigated are: (i) two pore fluids, consisting of air (gas) or liquid water; (ii) three pore shapes, i.e., ellipses, circles, and squares; (iii) pore sizes ranging from 10 to 150 μ m; (iv) pore pressures ranging from 0.1 to 2.5 MPa. The study shows how the investigated pore characteristics affect the local electric breakdown and, consequently, the PPGD process.

1. Introduction

Geothermal energy is in principle a limitless clean energy resource that exists everywhere and is a baseload energy resource, i.e., it is available at all hours of the day throughout the year. Geothermal energy can also serve as a dispatch energy resource to support other, only intermittently available, energy sources such as wind and solar energy. However, producing heat or generating electricity from geothermal energy resources, employing so-called advanced [1] or enhanced [2,3] geothermal systems, requires access to deep, typically crystalline basement, rock formations that exhibit temperatures of 150 C or more [4]. To note, when subsurface carbon dioxide (CO 2 ) is used to extract geothermal energy from naturally permeable, sedimentary-basin-type reservoirs, temperatures of ≳ 80 C appear sufficient to economically generate electricity [5,6,7,8]. While binary systems can make use of T ≳ 100 C to potentially generate cost-competitive electricity, this approach is challenging for reservoir temperatures <150 C [9]. Furthermore, larger subsurface temperatures always improve the economics of geothermal energy utilization, thereby often necessitating deep drilling, often into deep crystalline rocks. Deeper drilling becomes particularly important when other subsurface parameters are less favorable. These include low, or even just, for the continental crust, standard temperature gradients of ∼ 30 C/km and small effective reservoir transmissivities (i.e., product of effective reservoir permeability and thickness). However, to reach temperatures of ≳ 150 C for example requires drilling to depths of >5 km in most regions of Europe [10].
Unfortunately, traditional mechanical rotary drilling is commonly too expensive to enable economical geothermal energy extraction from deep crystalline rocks, due to the associated energy requirements and significant drill bit wear. The latter requires long tripping times, particularly when considerable drilling depths are reached, to exchange worn drill heads [11,12]. Therefore, in hopes of reducing deep geothermal drilling costs, novel, typically contactless, drilling technologies are being considered [1,11]. These include Plasma Pulse Geo Drilling (PPGD) [13], thermal spallation drilling [14,15,16], laser drilling [17], and microwave drilling [18], to name a few.
PPGD is a contactless drilling technology that uses high-voltage electric pulses to fracture the rock without mechanical abrasion. During PPGD, two electrodes of a gap distance, d E , expose the rock surface to electric pulses, V E , of >200 kV and pulse durations of ≲2 microseconds, a schematic of which is shown in Figure 1. These pulses induce an electric breakdown inside the rock pores, causing high tensile stresses that fracture the rock [19,20,21,22,23]. Experimentally, Anders et al. [24] found PPGD to be up to 17% cheaper than mechanical rotary drilling under ambient operating conditions. Rodland [25] and Schiegg et al. [4] suggested that further research may reduce PPGD drilling costs by up to 90%, compared to current mechanical rotary drilling costs. Given that PPGD works especially well in hard rocks, it is expected to eventually replace conventional mechanical rotary drilling in fields such as geothermal energy extraction [4,24], mineral ore crushing [26], and coal seam permeability enhancement [27].
While it can be shown that the PPGD process is highly efficient, its practical applicability is complicated by typical drilling environments. Particularly challenging is the requirement that the electrodes that deliver the high-voltage electric pulses need to be in direct contact with both the rock surface and the drilling fluid, as shown in Figure 1. The drilling fluid is assumed to have the electrical properties of water so that usually the drilling fluid has an electric conductivity that is larger than that of the rock. Thus, the drilling fluid has less dielectric strength than the rock, where the dielectric strength is the maximum electric field that a material can withstand before electric breakdown occurs. Here, electric field refers to the negative gradient of the voltage field, i.e., the electric potential. This terminology is commonly used in physics and electrical engineering. Thus, the electric breakdown occurs favorably within the drilling fluid, which would leave the rock mass intact and the drilling method ineffective. However, Vorob’ev et al. [29] found that using pulses with short rise times of < 0.5 μ s favors the electric breakdown to occur inside the rock pores and not within the drilling fluid outside the rock and its pores. Currently, no satisfying theoretical explanation seems to exist for this behavior. Consequently, the PPGD technology involves several nonlinear processes that occur over extremely short time scales, i.e., the electric pulse time scale, and over small spatial scales, i.e., rock pore sizes, resulting in a complex problem that is difficult to understand [19,30,31]. The conditions that cause rock fragmentation during PPGD have been reported in several studies, suggesting that plasma formation leads to high tensile stresses that eventually fragment the rock [13,19,20,23,28,32,33,34]. However, even less well understood are the physical processes that underlie the formation of the plasma in the rock pore fluid, which have not yet been modeled. Hence, to date no satisfying theoretical explanation exists why, and under what conditions, the PPGD process is successful, necessitating further research to accelerate the PPGD development to an industrial application level.
In an attempt to explain the electric breakdown of a dielectric material, Jonscher and Lacoste [30] suggested that the breakdown starts in naturally existing defects, such as pores and microcracks, rather than creating new defects. This local electric breakdown in the defects, i.e., plasma formation in the pore fluid, increases the pore-fluid pressure [23], causing pore expansion that may lead to the formation of microcracks in the rock matrix, which eventually creates an inter-electrode channel through the rock, as shown by Phases I and II in Figure 1. Several electric pulses (i.e., so-called shots) are necessary to form this inter-electrode channel, where the plasma channel forms, increasing the tensile stresses in the rock [28,33], as shown by Phases III and IV in Figure 1. Therefore, the pore characteristics (i.e., the pore fluid, pore size, pore shape, and pore-fluid pressure) crucially affect the PPGD process, requiring further investigations as done here.
A few experimental studies have investigated the impact of the pore characteristics on electro- or plasma-pulse type drilling processes, and even fewer numerical studies have investigated the individual effect of each pore characteristics (e.g., fluid compositions and pore-fluid pressure) on the effectiveness of such drilling technologies. We thus introduce here a numerical model to investigate the impact of the pore characteristics on the PPGD process. Experimentally, Lisitsyn et al. [19] and Timoshkin et al. [32] observed the impact of the pore fluid on the PPGD process. Lisitsyn et al. [19] observed that damage occurred in dried granite samples, while no damage occurred in water-saturated granite samples. Conversely, Timoshkin et al. [32] later reported that damage occurred within a brine-saturated rock, but with a 35% reduction in the penetration rate compared to that achieved in dry rocks. Numerically, Vogler et al. [35] found that the damage efficiency increases with water salinity. Experimentally, Lisitsyn et al. [19] found that damage in tuff rock samples is easier to achieve than in granites as the tuff rock has a lower uniaxial compression strength and greater porosity (10–40 MPa and 20–35%), i.e., larger pore sizes, than those typically observed in granites (100–200 MPa and 1–3%). Numerically, Ezzat et al. [23] found that the pore pressure, due to the plasma formation in pores, increases with pore size and that, therefore, the pore size plays a crucial role during the PPGD process. Experimentally, Vazhov et al. [36] found that fragmentation during PPGD occurs more slowly with increasing pressure (i.e., pore-fluid pressure and lithostatic pressure) up to 5.5 MPa, and that further increases in hydrostatic (i.e., pore-fluid) pressure do not affect the PPGD process. It is thus important to improve our understanding of the effect of the pore pressure on the PPGD process.
In this paper, we introduce an electrostatic model to investigate the impact of the pore characteristics on the occurrence of the local electric breakdown, i.e., the generation of a plasma in the rock pores, which are filled with a fluid (liquid or gas). The novelty of these simulations is to provide insights into how the rock characteristics, at the pore scale, can affect the first step of the PPGD process, i.e., the local electric breakdown. An improved understanding of the local electric breakdown mechanism should in turn facilitate determining the rock pore characteristics that are favorable for PPGD success. To this end, we first calculate the electric field across the pore by modeling the electric field at the sample scale. Next, we define the electric breakdown criteria of two typical pore fluids, namely air gas and liquid water. Then, we combine the computed electric field (at the pore scale) and our derived electric breakdown criteria to examine whether the local electric breakdown, i.e., plasma formation, should occur at the pore scale (e.g., <150 μ m). Therefore, the effect of the pore size and the pore pressure on the dielectric strength can be quantified. Finally, we validate our results by comparing the dielectric strength of granite, calculated by our model, with the experimental data from Inoue et al. [20].

2. Model Description

The local electric breakdown process in pores (i.e., plasma generation in pores) is the first step during the partial discharge mechanism that ultimately leads to the electric breakdown of rock and thus drilling success with PPGD [19,22,23]. Here, we introduce a numerical model to simulate the local electric breakdown process in pores and study the impact of the pore characteristics, i.e., pore fluid, shape, size, and pressure, on the local electric breakdown process. The model steps are summarized as follows: First, we perform simulations at the sample scale to calculate the distribution of the enhancement factor across the sample, adapted from Inoue et al. [20], where the “enhancement factor” is defined as the electric field calculated at any given position divided by the electric field applied between the two electrodes. Secondly, we perform pore-scale simulations to determine how the pore characteristics, i.e., the pore fluid composition, shape, and size, impact the enhancement factor across the pore. Large values of the enhancement factor indicate a large electric field, which increases the local electric breakdown and the associated PPGD process. Thirdly, we calculate the dielectric strength for different pore fluids, i.e., air and water, pore pressures that range from 0.1 to 2.5 MPa, and pore sizes that range from 10 to 150 μ m. Finally, we validate the model by comparing the calculated dielectric strength of granite to the experimental values provided by Inoue et al. [20].

2.1. Sample-Scale Simulation

The sample-scale simulations aim to calculate the distribution of the enhancement factor of the electric field across the sample, which is the calculated distribution of the electric field normalized to the electric field applied between the two electrodes. Therefore, we can define which regions experience large enhancement factor values and consequently high electric field values, which is more favorable for PPGD. Even though the sample-scale simulation cannot resolve the electric field at the pore scale, we use it for the pore-scale simulations to calculate the electric field across pores smaller than 150 μ m.

2.1.1. Simulation Domain and Parameters

We adopt the simulation domain and parameters from Inoue et al. [20], as we validate our numerical model against their experimental results. Figure 2 shows the two-dimensional (2D) simulation domain, which represents a rectangular granite sample with a width of W S = 13 cm and a height of H S = 3 cm, exposed to a voltage pulse of V E = 380 kV via two electrodes, separated by an electrode gap distance of d E = 5 cm. The voltage pulse and the electrode gap distance used here represent the average of the corresponding ranges used by Inoue et al. [20], i.e., 2 to 10 cm for the electrode gap distance and 240 to 480 kV for the pulse voltage. The simulation parameters, including the boundary conditions, are listed in Table 1 and the nomenclature is given in the nomenclature section at the end.
To perform the 2D sample-scale simulation, we assume the following. First, the granite sample is assumed to be electrically homogeneous, as we use the average electric permittivity of granite of ε = 6, which is an approximation of the value ε = 5.85, which we calculated before [23]. We thus neglect any effects that may be caused by electric permittivity variations in the granite due to a heterogeneous mineral distribution. Second, we use the peak value of the voltage pulse, V E , and not the voltage pulse profile (i.e., voltage versus time), as we follow the electrostatic and not the electrodynamic approach to calculate the electric field. We hence neglect any nonlinearity effects of the granite’s electric properties, i.e., electric permittivity and dielectric strength.

2.1.2. Electric Field Distribution

Here, we introduce the three steps we employ to calculate the electric field, E S , and the associated enhancement factor, E E F , S . First, the voltage distribution, V S , is calculated with the Poisson equation [37],
· ε V S = ρ e ,
where ε is the electric permittivity of the medium (here granite) and ρ e is the free electron density, which is negligible for granite (i.e., ρ e = 0 ) as the dielectric material (i.e., electric insulators such as granite) contains few free electrons [38]. Thus, the Poisson Equation (1) is reduced to the Laplace equation,
· ε V S = 0 .
Secondly, we calculate the electric field, E S , given by the negative gradient of the voltage,
E S = V S .
Lastly, we calculate the enhancement factor distribution, E E F , S , across the sample,
E E F , S = E S / E E ,
where E E is the electric field applied at the electrodes, defined as V E / d E = 76 kV/cm.
We solve Equations (2)–(4) using the MOOSE framework, an open-source MultiPhysics object-oriented simulation framework developed at Idaho National Laboratory [39]. Ultimately, we calculate the electric field enhancement factor across the sample, E E F , S , for the parameters and boundary conditions listed in Table 1.

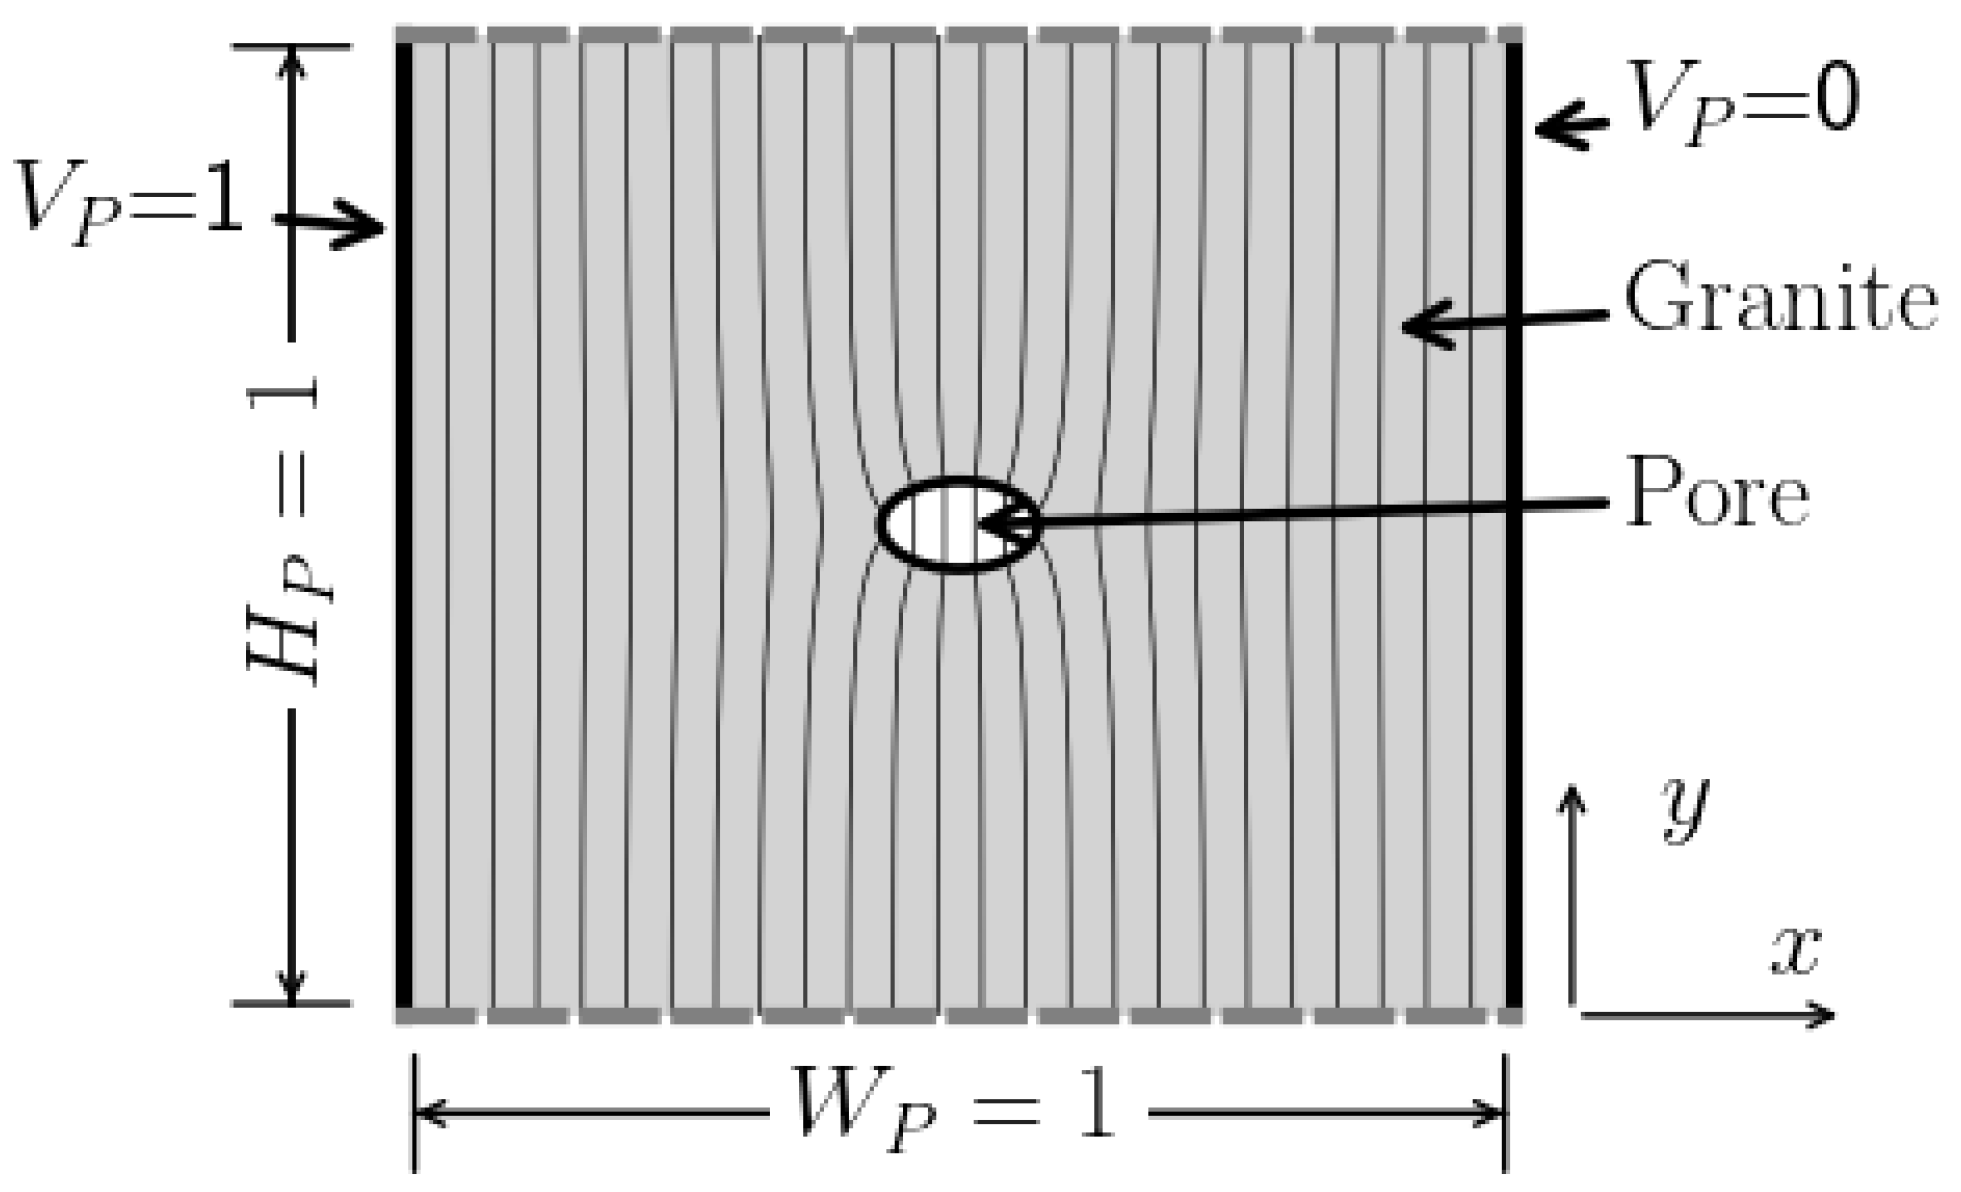
2.2. Pore-Scale Simulation

The pore-scale simulation approach aims at calculating the enhancement factor of the electric field distribution at the pore scale, which has three advantages as outlined next. First, the approach links the sample-scale parameters, such as the electric field applied between the electrodes, and the resulting electric field in a single pore. Second, the method relates the pore characteristics to the electric breakdown in the rocks and the associated PPGD process. Lastly, our approach constitutes a dimensionless simulation that can be generalized for any given sample, such as the sample adapted from Inoue et al. [20] and shown in Figure 2.

2.2.1. Simulation Domain and Parameters

Figure 3 shows the two-dimensional domain for the pore-scale simulation, which is a square of granite with unit side length (i.e., a width of W P = 1 and a height of H P = 1 ) that includes a single pore with a surface area of 1% of the square’s surface area. The porosity, ϕ , is the ratio between the surface area of the pore and the surface area of the whole square and has the same value of 1% for all studied pore shapes, i.e., ellipses with varying orientations, a circle, and a square. The two ellipses studied have major axes parallel (ellipse ) and perpendicular (ellipse ) to the predominant direction of the applied electric field, thereby representing the two end members of random pore orientations.
We select a 1% porosity for two reasons: Firstly, the typical porosity of granite ranges from 0.1 to 2%, so that we pick the approximate average. Secondly, porosities larger than 5% induce an interaction between the pore boundary and the boundary used for the granite square, affecting the results. Rock pores often contain air, brine, or water, which have different electric permittivities and different dielectric strengths. For instance, the electric permittivity of air is ε a = 1 [40], that of water is ε w = 80 [41], and that of brine is ε b = 70 to ε b = 52 for salinities of 1 to 20%, respectively [42]. Therefore, we study air ( ε a = 1) and water ( ε w = 80) as they represent the lower and the upper limit for the electric permittivity, respectively, and as their dielectric strength formulas are known. However, further research is required to deduce the dielectric strength formula for brine.
While the left and right sides of the square have Dirichlet boundary conditions of 1 unit voltage and 0 unit voltage, respectively, the top and the bottom sides have Neumann boundary conditions, i.e., 0 unit voltage/unit length. The used units make the problem dimensionless, yielding generalized results that are applicable to any given sample and boundary conditions, which vary as a function of the square position in the simulated sample. Using unit boundary conditions is sufficient to define the impact of the pore shape and size as well as the fluid pressure and composition on the PPGD process.
However, to apply these pore-scale results to a case study to simulate the experimental work of Inoue et al. [20] (i.e., employ the model validation), we need to define the position and the orientation of the square (i.e., the pore-scale simulation) in the sample, thereby obtaining the boundary conditions. Hence, for the model validation calculation, we assume that the square’s position is in the near-electrode region (defined in Section 3.1) as the damage onset occurs in this region.
Table 2 contains the parameters and the boundary conditions used in the pore-scale simulations. The nomenclature section at the end defines the parameters.

2.2.2. Electric Field Distribution

Now, that the domain, parameters, and boundary conditions (Table 2) for the pore-scale simulation are defined, we aim to calculate the electric field, E P , and the associated enhancement factor, E E F , P . We use the MOOSE framework [39] to solve Equations (2)–(4), previously used in the sample-scale simulation. To distinguish the variables used in the pore-scale simulation from the ones used in the sample-scale simulation, we change the subscript S to P , so that the pore-scale variables become V P , E P , and E E F , P for the voltage, the electric field, and the enhancement factor of the electric field, respectively.
In the sample-scale simulation, we used a single average value for the electric permittivity, assuming a homogeneous granite, neglecting the pore space that exhibits sizes smaller than the computational mesh size. However, the pore fluid, i.e., air or water, and the surrounding rock grains, i.e., granite, have different electric permittivity values. Therefore, we use a heterogeneous electric permittivity field in the Laplace formula (Equation (2)) for the pore-scale simulations.

2.3. Dielectric Strength of the Pore Fluid

The aim here is to define the dielectric strength of the pore fluids used in the study, i.e., air and water, as a function of the pore pressure and pore size, and to examine the impact of these pore characteristics on the PPGD process. Defining the dielectric strength of the pore fluid is the first step towards calculating the dielectric strength of granite numerically, which we then compare with the experimentally determined dielectric strength for granite from Inoue et al. [20] to validate the model.

2.3.1. Air Dielectric Strength

The Paschen law [44],
V D S , a P P , d P = B P P d P ln A P P d P ln ln 1 + 1 γ s e c ( d P > 10 μ m , P P < 2.5 MPa ) ,
yields the breakdown voltage of any gas, such as air, V D S , a , for a given pore pressure, P P , and pore size, d P . In Equation (5), A = 9 Pa/m and B = 256.5 Pa/m are the Paschen curve’s first and second constants, respectively. These constants are specific to air and have been determined experimentally [45]. The secondary ionization coefficient, γ s e c , has also been determined experimentally and ranges from 0.01 to 0.05 for the dielectric boundary (e.g., rock grains) and the electrical conductor boundary, respectively [45]. Nonetheless, Paschen’s law is a semi-empirical formula that is not supported by experimental measurements for pressures exceeding 2.5 MPa. Thus, our model is limited to P P < 2.5 MPa [46]. Furthermore, the electric breakdown criterion deviates from the Paschen law for pore sizes smaller than 10 μ m, thereby limiting our model to pore sizes larger than 10 μ m (i.e., d P > 10 μ m) [47,48,49].
In this study, we use the dielectric strength of air, E D S , a , instead of the breakdown voltage, to combine the applied voltage and the gap distance, i.e., the pore size, in one parameter, thereby simplifying the problem analysis. We thus divide both sides of the conventional Paschen law (Equation (5)) by the pore size, d P , to define the dielectric strength of air,
E D S , a P P , d P = B P P ln A P P d P ln ln 1 + 1 γ s e c ( d P > 10 μ m , P P < 2.5 MPa ) .

2.3.2. Dielectric Strength of Water

The electric breakdown of water is a complex problem that includes several nonlinear processes. Several empirical formulas exist that attempt to predict the dielectric strength of water, depending on the dominant parameter [50]. Here, we use Martin’s formula, as it includes the effects of pore pressure and size (i.e., approximately the square root of the pore’s cross-sectional area), which are the crucial parameters for PPGD. Zicheng et al. [51] define Martin formula as
E D S , W ( P ) = 185 · S 1 / 16 · t e f f 1 / N · P 1 / 8 ,
where S is the pore’s cross-sectional area, t e f f is the effective pulse time, i.e., the time it takes for the pulse to reach 60% of its peak value, P is the pore pressure, i.e., here the liquid water pressure, and N is a parameter that equals 3 when the effective pulse time, t e f f , exceeds 2 μ s, which is the operation time window for PPGD.

3. Results and Discussion

Above, we have designed the sample-scale and pore-scale simulations (i.e., the domain, the operation parameters, and the boundary conditions), based on the experimental setup used by Inoue et al. [20], as illustrated in Figure 2 and Figure 3 and given in Table 1 and Table 2. The following first three Section 3.1, Section 3.2, Section 3.3 aim at introducing how the pore characteristics, i.e., pore fluid composition, pressure, shape, and size affect the local electric breakdown process and thus PPGD. The fourth Section 3.4 aims at validating our model against the experimental findings of Inoue et al. [20].

3.1. Sample-Scale Electric Field

Figure 4 shows the electric field enhancement factor across the modeled sample, E E F , S , which is defined as the calculated electric field normalized to the electric field applied at the electrodes, E E = V E / d E = 76 kV/cm. High values of the enhancement factor reflect high values of the calculated electric field, which is favorable for the local electric breakdown process and vice versa. One can use the enhancement factor to calculate the electric field distribution for any electric field applied at the electrodes and for the same given geometry and dimensions.
The average enhancement factor in the near-electrode regions, E E F , S , N E ¯ , is the highest with 4.5, meaning that the local electric breakdown is more likely to start at the electrodes’ contact points within the rock. Even though the enhancement factor distributions around the two electrodes are the same, they have opposite directions, as shown in the two insets of Figure 4. This finding agrees with several experimental observations that reported the initiation of the rock damage path near the electrodes [19,20,21]. Using a different modeling approach, Vogler et al. [35], Walsh and Vogler [52], Walsh et al. [53], and Ezzat et al. [23] reached the same conclusion numerically. Several laboratory experiments have shown that the damage path takes place in the inter-electrode region [20,54], which is enclosed by the dashed white arc in Figure 4. Here, we construct this arc, i.e., the deepest damage path from the rock surface, where the electrodes are in contact with the rock, as introduced by Ezzat et al. [23]. To this end, we use the inter-electrode distance of 5 cm and the relative penetration depth of 0.2 (which is the penetration depth divided by the electrode gap distance) [54]. Using this, we find that the average enhancement factor in the inter-electrode region is E E F S I E ¯ = 0.9 , which is higher than the E E F S I E ¯ value in the remainder of the sample, i.e., away from the arc or the electrodes. This result suggests that the local electric breakdown and the associated rock damage are more likely to occur between the two electrodes, which is consistent with experimental observations [19,20,21].
These sample-scale simulation results provide insights into which regions, relative to the electrode positions, favor local electric breakdown. Next, we calculate the enhancement factor of the electric field across pores to investigate the impact of the pore fluid composition, pressure, as well as pore shape and size on the local electric breakdown process and associated success of PPGD.

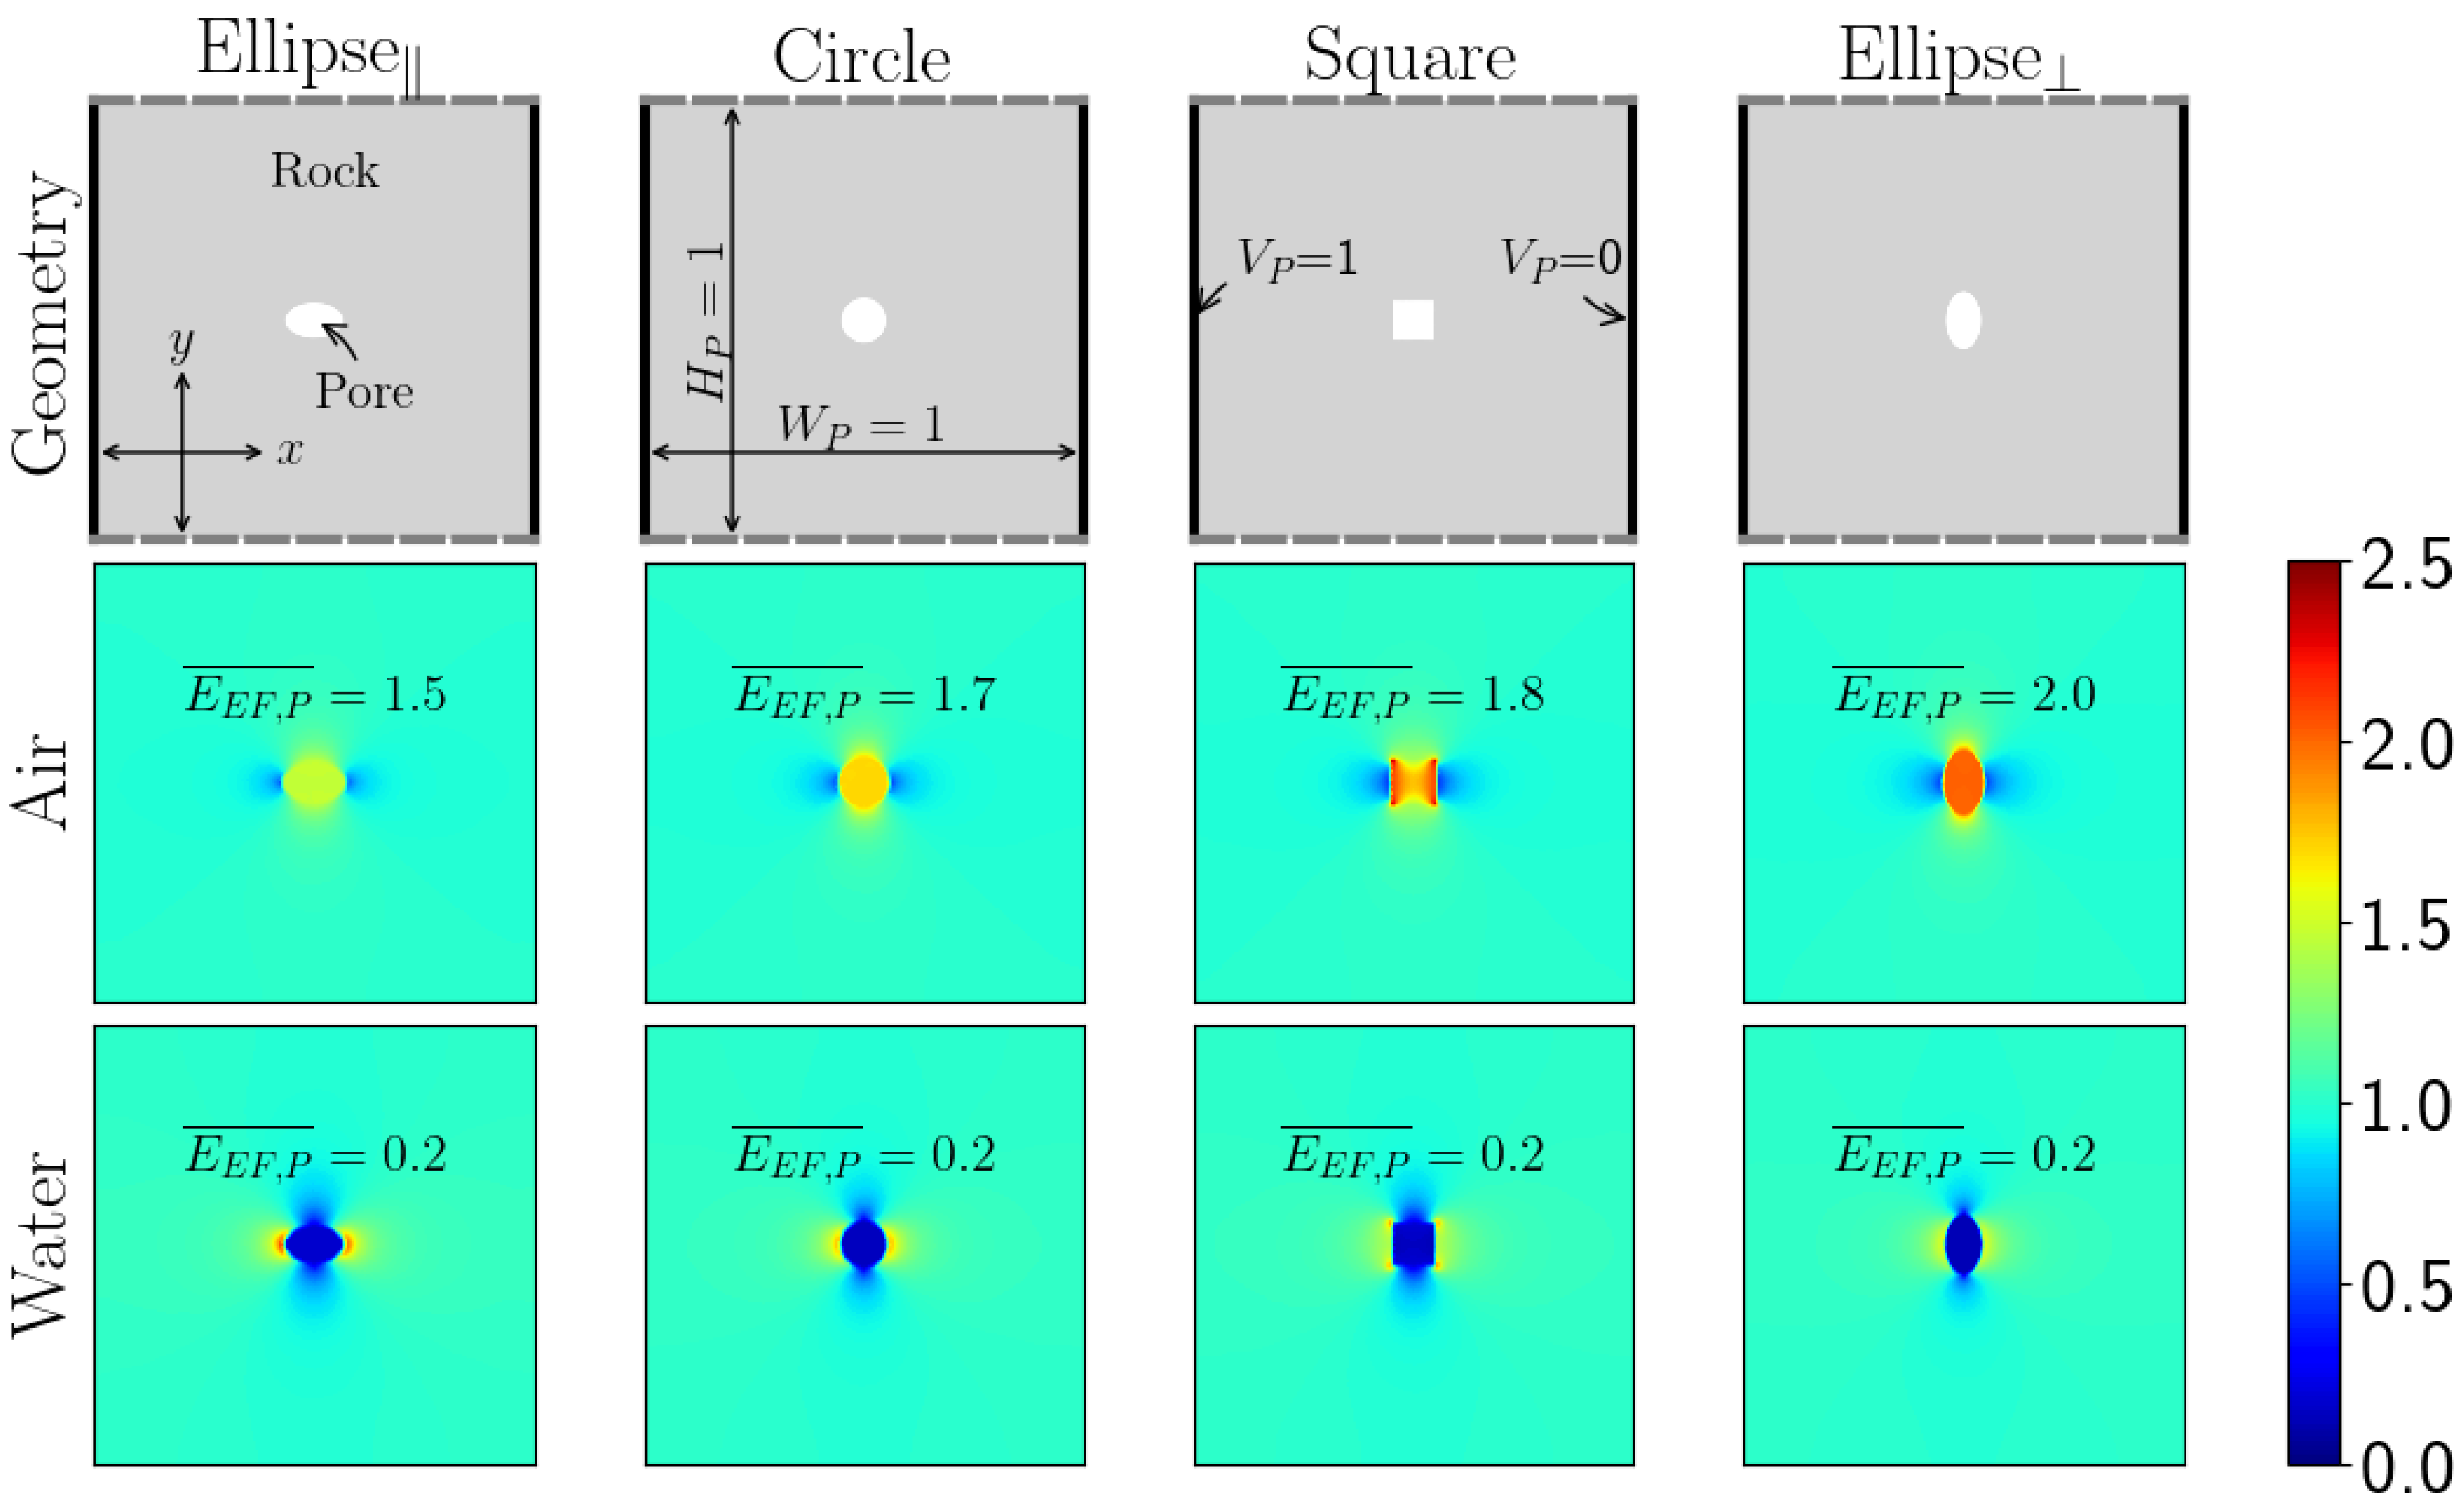
3.2. Pore-Scale Electric Field

Local electric breakdown occurs when the electric field across the pore exceeds the dielectric strength of the pore fluid with a given composition (e.g., water or air) and given conditions (i.e., pore-fluid pressure as well as pore shape and size). Analogous to what we discussed for the sample-scale simulations, we calculate now the enhancement factor of the electric field across the pore, E E F , P ¯ , which is the electric field normalized to the electric field applied at the domain boundaries. Figure 5 shows the enhancement factor of the electric field across the pore, E E F , P ¯ , for two pore fluids, air and water, and for four pore shapes, ellipse , circle, square, and ellipse . An enhancement factor of one means that the electric field is the same as the electric field applied at the boundaries.
The second row in Figure 5 shows the enhancement factor for the air-filled pore cases, ranging from 1.5 for the ellipse pore shape to 2.0 for the ellipse pore shape. In other words, air-filled pores experience an electric field of 1.5 to 2.0 times, depending on the pore shape, the electric field applied at the domain boundary. Such high enhancement factors for the air-filled pores can be attributed to the lower electric permittivity of the pore fluid, i.e., air ( ε a = 1), compared to the surrounding granite ( ε g = 6). In contrast, the enhancement factor for the water-filled pores is only about 0.2 for all shapes, which means that the water-filled pores experience only 20% of the electric field applied. Unlike air, the electric permittivity of water is ε w = 80 , which is actually larger than that of granite ( ε g = 6). Thus, the enhancement factor of water-filled pores is 1/10th that of the air-filled pores. Therefore, using pore fluids with small electric permittivities is favorable for enhancing the electric field, thereby promoting local electric breakdown and successful PPGD operations. This result is consistent with the findings of Lisitsyn et al. [19], who reported damage in dry granite samples and no damage in the granite samples that were saturated with water. This finding can pose a challenge for PPGD, as rocks are (frequently) not filled by a gas (e.g., air, methane), particularly crystalline (basement) rocks at great depths. Additionally, Timoshkin et al. [32] found a reduction of the damage efficiency by 15% when exchanging the dry samples with samples saturated to 10% KCL brine. This finding is also consistent with our numerical results, as the electric permittivity of 10% KCL brine is 54 [42] and thus lies between those of air ( ε a = 1) and water ( ε w = 80).
Figure 5 shows that the enhancement factor of the electric field across pores increases from left to right, i.e., from ellipse to circle to square to ellipse , keeping in mind that all shapes have the same porosity of ϕ = 1. The enhancement factor is inversely proportional to the width of the pore shape along the x-axis, which is the predominant direction of the electric field applied at the boundary. Therefore, pores with shapes and orientations that allow larger pore widths along the applied electric field are favorable for enhancing the electric field, promoting local electric breakdown and thus rock fragmentation.
The pore-scale simulation domain (Figure 3) is a generalization that can be placed at any position within the sample-scale simulation domain (Figure 2). Furthermore, we can see from the sample-scale simulations (Figure 4) that the predominant direction of the electric field is vertical near the electrode contact points and horizontal between the electrodes. Therefore, a higher enhancement factor results when pores near the rock surface (i.e., near the electrodes) are elongated in the vertical direction. In contrast, pores that are located inside the rock mass (i.e., between the electrodes) cause larger enhancement factors when they are elongated in the horizontal direction.

3.3. Pore Fluid Dielectric Strength

Local electric breakdown is more likely to occur in pore fluids with lower dielectric strengths. We now investigate the impact of the pore size on the dielectric strength of the pore fluids investigated, i.e., air and water.
Figure 6a,b show the dielectric strength of air in a pore, E D S , P , as a function of the pore size, d P , and the pore pressure, P P , i.e., the electric field required across the air-filled pores to induce local electric breakdown. Producing sufficiently large electric fields across air-filled pores requires the application of a critical electric field at the electrodes, E C R , E , as represented by the right y-axis of Figure 6a,b. The ratio between the dielectric strength of air and the critical electric field applied at the electrodes is 7.87, which is the product of the average enhancement factor of the sample-scale simulations at the electrodes (4.5, see also Figure 4), and the pore-scale simulations (1.75, see also Figure 5, air row).
Figure 6a,b show that the dielectric strength of air in pores decreases with the pore size, d P , and increases with the pore pressure, P P . Therefore, it is likely that damage in rocks with larger pores, such as sandstone, is easier to achieve than in rocks with small pores, such as granite. Lisitsyn et al. [19] have observed a similar trend, as one electric pulse was enough to cause damage in tuff rock samples, whereas at least three pulses were necessary for granite rock samples. Our results also suggest that higher pore-fluid pressures, P P , reduce the damage efficiency, as previously observed in experimental work by Vazhov et al. [55].
Similar to air, Equation (7) shows that the dielectric strength of water in pores increases with pore-fluid pressure, P P , and decreases with the pore size, S (i.e., the square root of the pore surface area). For instance, the dielectric strength of water in a 50 μ m diameter pore and under 0.1 MPa pore-fluid pressure is 235 kV/cm. To reach the dielectric strength of water, we need to apply a 261 kV/cm electric field at the electrodes, given that the enhancement factor of the water-filled pore is 0.9 on average. This enhancement factor of 0.9 is the product of the average enhancement factors of the sample-scale simulations at the electrode tips (4.5, see also Figure 4) and the pore-scale simulations for water-filled pores (0.2, see also Figure 5, water row). Our results are consistent with the observations by Lisitsyn et al. [19], who found that 96 kV/cm, used in their experiment, was insufficient to induce damage in the granite sample, saturated with water. Furthermore, Timoshkin et al. [32] experimentally and Vogler et al. [35] numerically observed similar effects, specifically that saturating granite with brine, instead of water, increased the speed of the PPGD process. Therefore, rock saturated with a pore fluid of electric permittivity lower than that of water ( ε w = 80), such as air ( ε a = 1) or brine ( ε 20 % KCL = 54), is favorable for the PPGD process.

3.4. Granite Dielectric Strength

Even though the trends of our model align with the experimental findings of Lisitsyn et al. [19], Timoshkin et al. [32], and Vazhov et al. [36], we further validate the model against the experiment of Inoue et al. [20], employing the same parameters as they used in their experiment. To do so, we use the experimental data obtained by Inoue et al. [20] to estimate the dielectric strength of granite and compare it with the dielectric strength calculated for granite by our model.
Inoue et al. [20] used sixteen combinations of pulse voltages, V E , and electrode gap distances, d E , to evaluate which combinations induce rock damage and which do not. Figure 7 shows the sixteen data points, where circles indicate rock damage cases and squares represent cases, where no damage occurred. Ideally, the dielectric strength of granite is the slope of the threshold line, V E / d E , separating the damage and the no-damage zones. Even though the pulse rise time and the rock type, i.e., granite, were the same for all experiments, the heterogeneity of the granite has led to two dielectric strength values for the granite, namely a maximum dielectric strength of E D S , E x p , M a x = 58 kV/cm and a minimum dielectric strength of E D S , E x p , M i n = 47 kV/cm (Figure 7). Consequently, applying an electric field exceeding the maximum dielectric strength will induce rock damage, whereas electric fields less than the minimum dielectric strength are insufficient to induce damage. In the region between the maximum and the minimum dielectric strengths, specific combinations of the pulse voltages and the electrode gap distances need to be chosen to induce damage. Based on this analysis, we can introduce three zones, namely a damage zone, a no-damage zone, and a zone, where damage may or may not occur, depending on the specifics of the above parameters (Figure 7).
Figure 7 shows the dielectric strength of granite under 0.1 MPa of pore-fluid pressure, calculated by our model, E D S , N u m = 71 for the 10 μ m pore size, which is larger than the maximum ( E D S , E x p , M a x = 58 kV/cm) and the minimum ( E D S , E x p , M i n = 47 kV/cm) dielectric strengths estimated for granite, based on experimental data from Inoue et al. [20]. Our model calculates the minimum experimental dielectric strength (ES = 47 kV/cm) by assuming a 13 μ m pore size, and this suggests that the granite tested by Inoue et al. [20] has had a typical pore size of 13 μ m or less. Furthermore, using large pore sizes of 50 to 100 μ m in our numerical model underestimates the dielectric strength of granite, as shown in Figure 7. This result is reasonable as typical pore sizes in granite are smaller than 50 μ m. To this end, all numerical dielectric strength estimates presented here have the same average value for the critical electric field, which we define in Section 3.3. Therefore, rocks with larger pore sizes are favorable for PPGD, as they exhibit smaller dielectric strengths, accelerating the local electric breakdown and thus associated PPGD. Even though the model predictions align well with experimental results, additional laboratory PPGD experiments on rock samples with known pore size distributions would enable improved testing of our numerical model calculations.
This numerical model uses an electrostatic approach to investigate the impact of the pore characteristics on the electric breakdown of rock for Plasma Pulse Geo Drilling (PPGD). The used electrostatic approach eliminates the electrodynamic effects that would be interesting to investigate in future work. Additionally, the used Paschen curve is limited to pore sizes larger than 10 μ m and pore pressures less than 2.5 MPa. One can extend these limits by performing more experiments on the air electric breakdown under pressures greater than 2.5 MPa. Coupling this model with the plasma formation in pore model [23], with the plasma channel formation model [28], and with crack growth models would be beneficial to model the entire PPGD process. This would improve our understanding of the electric breakdown mechanism in heterogeneous materials, such as rock, when employing PPGD.

4. Conclusions

In this work, we developed a numerical model to investigate the impact of the pore characteristics (pore fluid type, size, shape, and pressure) on the Plasma Pulse Geo Drilling (PPGD) process. Our analysis suggests the following conclusions.
1
The electric field enhancement factor is always largest in the near-electrode region, with an average value of 4.5, causing local rock damage. However, an average enhancement factor of only 0.9 tends to result in the inter-electrode region. Therefore, local electric breakdowns (i.e., the plasma formation inside the pores), and the associated fracturing of the rock, are more likely to occur near the electrodes and between them.
2
The pore-scale electric field enhancement factor for air-filled pores varies between1.5 and 2, depending on the pore shape and orientation. Values of 1.5 and 2 apply to an ellipse with its major axis oriented parallel and perpendicular to the predominant electric field direction, respectively. Hence, pores near the electrodes that are elongated parallel to the rock surface (given our model geometry) and pores in the mid-point region between the electrodes with perpendicular elongations yield increased electric field enhancement factors, promoting local electric breakdown and associated rock damage, and thus PPGD operations.
3
The average enhancement factor for the air-filled pores is 1.75, that for water is typically less than 0.2, and that for brine is between these two values. Therefore, rock saturated with a pore fluid of electric permittivity lower than that of water ( ε w = 80), such as air ( ε a = 1) or brine ( ε 20 % KCL = 54), facilitates the PPGD process. Additionally, this finding can pose a challenge for PPGD as rocks at great depths, particularly crystalline basement rocks that are more common at greater depths, are unlikely to have gas-filled (e.g., air or methane) pores and are more likely liquid water-filled or, for the PPGD process better, brine-filled.
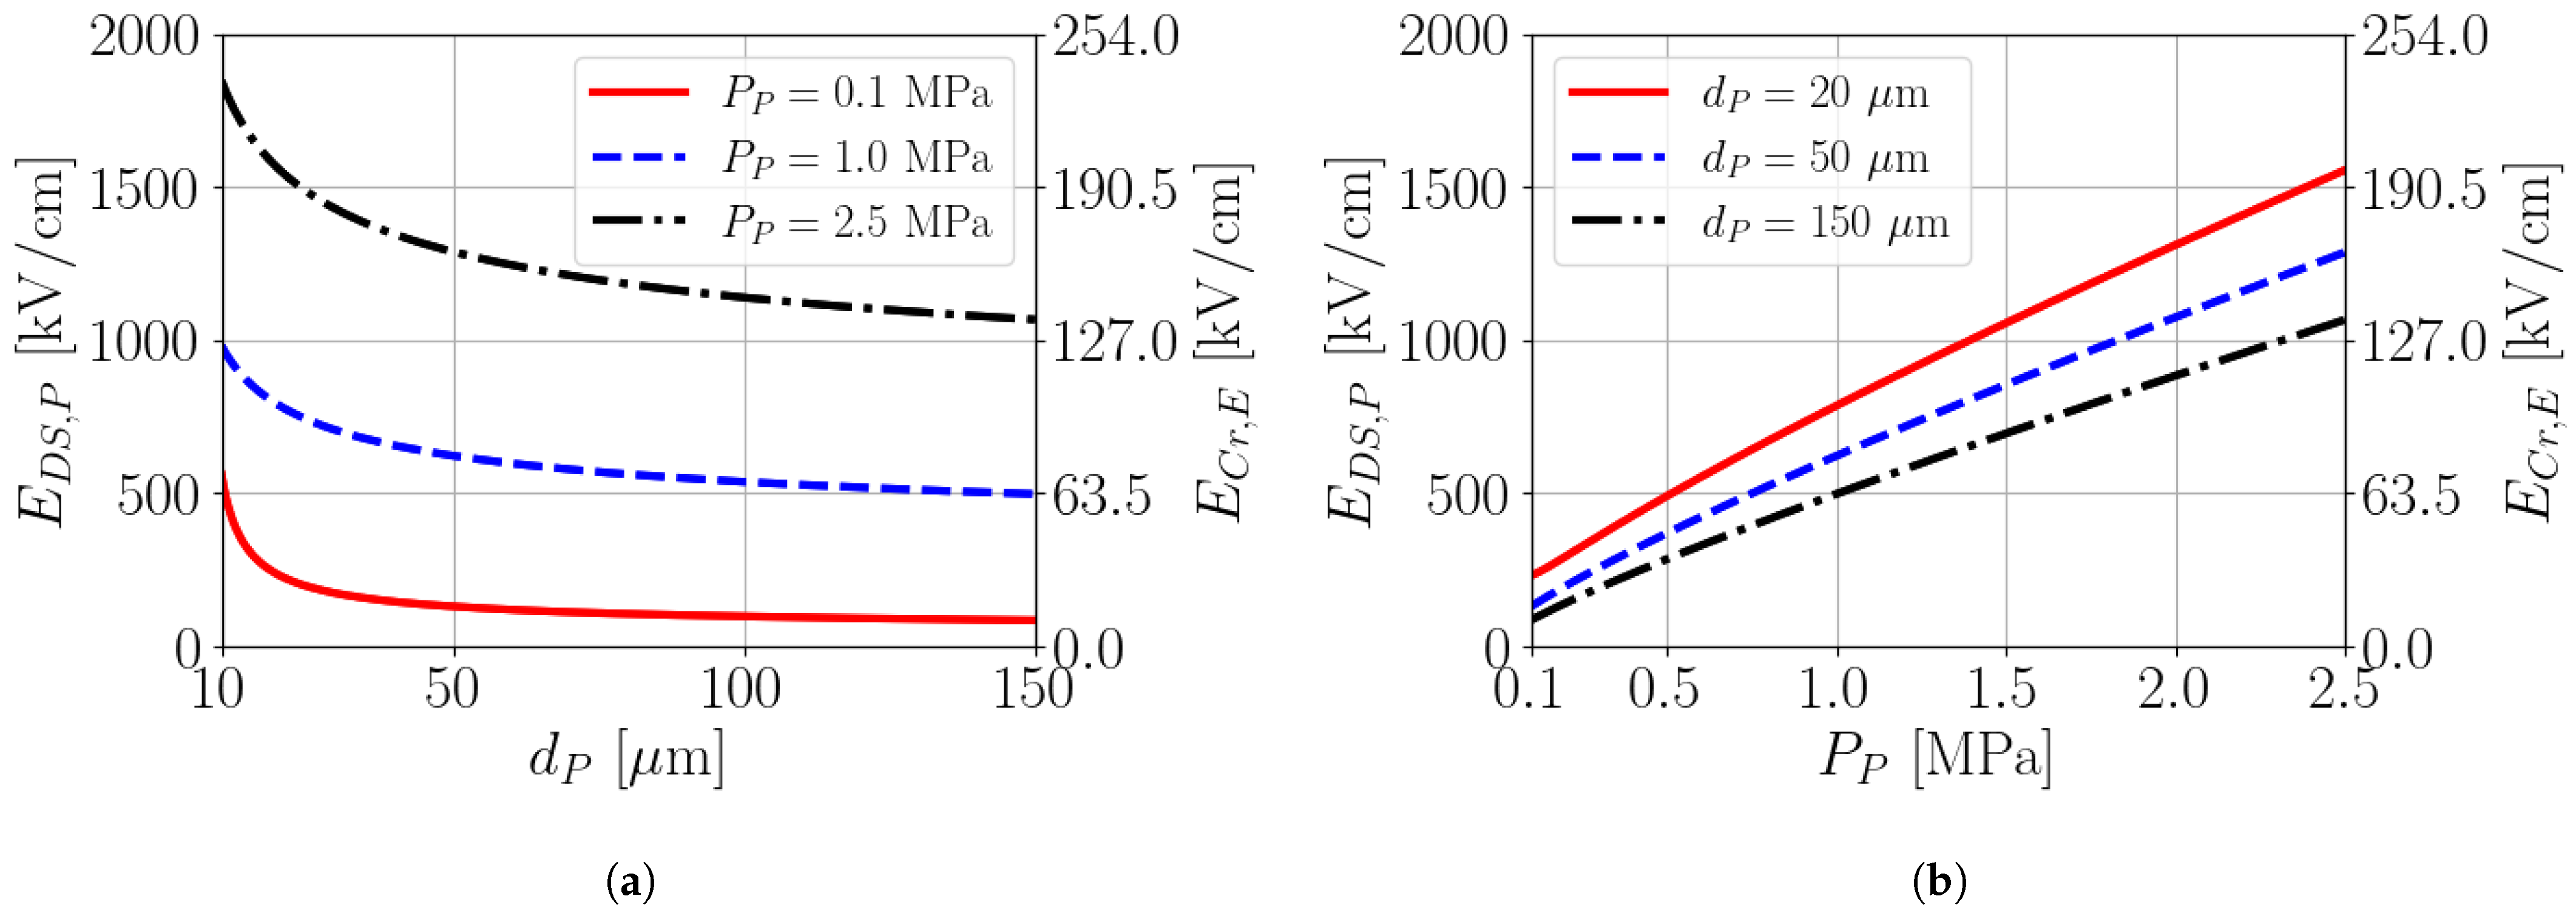
4
The dielectric strength of air-filled pores, required to be overcome to cause local electric breakdown to damage the rock, decreases with pore size (larger than 10 μ m) and increases with air pressure in the pore (less than 2.5 MPa). Therefore, achieving damage in rocks that exhibit rather large pore (e.g., sandstones and tuffs) is easier than in rocks with comparatively smaller pores (e.g., granites), which is consistent with the experimental observations of Lisitsyn et al. [19].
5
Experimental results from Inoue et al. [20] show a range of granite dielectric strengths between 47 kV/cm and 58 kV/cm, compared to our numerical model estimates, which range from 47 kV/cm to 71 kV/cm. Using an average pore enhancement factor of 7.87 and pore sizes of 13 and 10 μ m, we estimate a range of dielectric strengths for granite from 47 kV/cm to 71 kV/cm, which agrees well with the values observed by Inoue et al. [20].

Author Contributions

Conceptualization, M.E., D.V. and B.M.A.; methodology, M.E., D.V. and B.M.A.; software, M.E.; resources, M.E. and D.V.; data curation, M.E.; writing—original draft preparation, M.E.; writing—review and editing, B.M.A., D.V., M.O.S. and M.E.; visualization, M.E.; supervision, B.M.A., D.V. and M.O.S.; project administration, M.O.S.; funding acquisition, M.O.S. and D.V. All authors have read and agreed to the published version of the manuscript.

Funding

This research was funded by Innosuisse—Swiss Innovation Agency—under Grant No. 28305.1 PFIW-IW.

Institutional Review Board Statement

Not applicable.

Informed Consent Statement

Not applicable.

Data Availability Statement

Not applicable.

Acknowledgments

This project was supported by Innosuisse—Swiss Innovation Agency—under Grant No. 28305.1 PFIW-IW. M.O.S. further thanks the Werner Siemens Foundation (Werner Siemens-Stiftung, WSS) for their support of the Geothermal Energy and Geofluids (GEG.ethz.ch) group at ETH Zurich, Switzerland. We thank the editor and the five anonymous reviewers for their comments, which improved an earlier version of the manuscript.

Conflicts of Interest

The authors confirm that there are no known conflict of interest associated with this publication and that there has been no significant financial support for this work that could have influenced its outcome.

References

  1. Malek, A.E.; Adams, B.; Rossi, E.; Schiegg, H.O.; Saar, M.O. Electric Power Generation, Specific Capital Cost, and Specific Power for Advanced Geothermal Systems (AGS). In Proceedings of the 46th Workshop on Geothermal Reservoir Engineering, Online, 16–18 February 2021. [Google Scholar] [CrossRef]
  2. Amann, F.; Gischig, V.; Evans, K.; Doetsch, J.; Jalali, R.; Valley, B.; Krietsch, H.; Dutler, N.; Villiger, L.; Brixel, B.; et al. The seismo-hydromechanical behavior during deep geothermal reservoir stimulations: Open questions tackled in a decameter-scale in situ stimulation experiment. Solid Earth 2018, 9, 115–137. [Google Scholar] [CrossRef] [Green Version]
  3. Gischig, V.S.; Giardini, D.; Amann, F.; Hertrich, M.; Krietsch, H.; Loew, S.; Maurer, H.; Villiger, L.; Wiemer, S.; Bethmann, F.; et al. Hydraulic stimulation and fluid circulation experiments in underground laboratories: Stepping up the scale towards engineered geothermal systems. Geomech. Energy Environ. 2020, 24, 100175. [Google Scholar] [CrossRef]
  4. Schiegg, H.O.; Rødland, A.; Zhu, G.; Yuen, D.A. Electro-pulse-boring (EPB): Novel super-deep drilling technology for low cost electricity. J. Earth Sci. 2015, 26, 37–46. [Google Scholar] [CrossRef]
  5. Randolph, J.B.; Saar, M.O. Combining geothermal energy capture with geologic carbon dioxide sequestration. Geophys. Res. Lett. 2011, 38, 1–7. [Google Scholar] [CrossRef] [Green Version]
  6. Adams, B.M.; Vogler, D.; Kuehn, T.H.; Bielicki, J.M.; Garapati, N.; Saar, M.O. Heat depletion in sedimentary basins and its effect on the design and electric power output of CO2 Plume Geothermal (CPG) systems. Renew. Energy 2021, 172, 1393–1403. [Google Scholar] [CrossRef]
  7. Ezekiel, J.; Kumbhat, D.; Ebigbo, A.; Adams, B.M.; Saar, M.O. Sensitivity of reservoir and operational parameters on the energy extraction performance of combined co2-egr–cpg systems. Energies 2021, 14, 6122. [Google Scholar] [CrossRef]
  8. Ezekiel, J.; Adams, B.M.; Saar, M.O.; Ebigbo, A. Numerical analysis and optimization of the performance of CO2-Plume Geothermal (CPG) production wells and implications for electric power generation. Geothermics 2022, 98, 102270. [Google Scholar] [CrossRef]
  9. Adams, B.M.; Kuehn, T.H.; Bielicki, J.M.; Randolph, J.B.; Saar, M.O. A comparison of electric power output of CO2 Plume Geothermal (CPG) and brine geothermal systems for varying reservoir conditions. Appl. Energy 2015, 140, 365–377. [Google Scholar] [CrossRef]
  10. Chamorro, C.R.; García-Cuesta, J.L.; Mondéjar, M.E.; Pérez-Madrazo, A. Enhanced geothermal systems in Europe: An estimation and comparison of the technical and sustainable potentials. Energy 2014, 65, 250–263. [Google Scholar] [CrossRef]
  11. Tester, J.; Anderson, B.; Batchelor, A.; Blackwell, D.; DiPippo, R.; Drake, E.; Garnish, J.; Livesay, B.; Moore, M.; Nichols, K.; et al. The Future of Geothermal Energy; Idaho National Laboratory: Idaho Falls, ID, USA, 2006. [Google Scholar]
  12. Lukawski, M.Z.; Anderson, B.J.; Augustine, C.; Capuano, L.E.; Beckers, K.F.; Livesay, B.; Tester, J.W. Cost analysis of oil, gas, and geothermal well drilling. J. Pet. Sci. Eng. 2014, 118, 1–14. [Google Scholar] [CrossRef]
  13. Ushakov, V.Y.; Vajov, V.F.; Zinoviev, N.T. Electro-Discharge Technology for Drilling Wells and Concrete Destruction; Springer: Cham, Switzerland, 2019. [Google Scholar]
  14. Vogler, D.; Walsh, S.D.; von Rohr, P.R.; Saar, M.O. Simulation of rock failure modes in thermal spallation drilling. Acta Geotech. 2020, 15, 2327–2340. [Google Scholar] [CrossRef]
  15. Rossi, E.; Kant, M.A.; Madonna, C.; Saar, M.O.; Rudolf von Rohr, P. The Effects of High Heating Rate and High Temperature on the Rock Strength: Feasibility Study of a Thermally Assisted Drilling Method. Rock Mech. Rock Eng. 2018, 51, 2957–2964. [Google Scholar] [CrossRef]
  16. Rossi, E.; Adams, B.; Vogler, D.; Rudolf von Rohr, P.; Kammermann, B.; Saar, M.O. Advanced drilling technologies to improve the economics of deep geo-resource utilization. In Proceedings of the 2nd Applied Energy Symposium: MIT A+ B (MITAB 2020) (virtual). ETH Zurich, Geothermal Energy & Geofluids, Cambridge, MA, USA, 12–14 August 2020; p. 148. [Google Scholar] [CrossRef]
  17. Buckstegge, F.; Michel, T.; Zimmermann, M.; Roth, S.; Schmidt, M. Advanced Rock Drilling Technologies Using High Laser Power. Phys. Procedia 2016, 83, 336–343. [Google Scholar] [CrossRef] [Green Version]
  18. Woskov, P.P.; Einstein, H.H.; Oglesby, K.D. Penetrating rock with intense millimeter-waves. In Proceedings of the 2014 39th International Conference on Infrared, Millimeter, and Terahertz Waves (IRMMW-THz), Tucson, AZ, USA, 14–19 September 2014; pp. 1–2. [Google Scholar] [CrossRef]
  19. Lisitsyn, I.; Inoue, H.; Nishizawa, I.; Katsuki, S.; Akiyama, H. Breakdown and destruction of heterogeneous solid dielectrics by high voltage pulses. J. Appl. Phys. 1998, 84, 6262–6267. [Google Scholar] [CrossRef]
  20. Inoue, H.; Lisitsyn, I.V.; Akiyama, H.; Nishizawa, I. Pulsed Electric Breakdown and Destruction of Granite. Jpn. J. Appl. Phys. 1999, 38, 6502–6505. [Google Scholar] [CrossRef]
  21. Yan, F.; Xu, J.; Peng, S.; Zou, Q.; Zhou, B.; Long, K.; Zhao, Z. Breakdown process and fragmentation characteristics of anthracite subjected to high-voltage electrical pulses treatment. Fuel 2020, 275, 117926. [Google Scholar] [CrossRef]
  22. Zhu, X.; Luo, Y.; Liu, W.; He, L.; Gao, R.; Jia, Y. On the Mechanism of High-Voltage Pulsed Fragmentation from Electrical Breakdown Process. Rock Mech. Rock Eng. 2021, 54, 4593–4616. [Google Scholar] [CrossRef]
  23. Ezzat, M.; Vogler, D.; Saar, M.O.; Adams, B.M. Simulating Plasma Formation in Pores under Short Electric Pulses for Plasma Pulse Geo Drilling (PPGD). Energies 2021, 14, 4717. [Google Scholar] [CrossRef]
  24. Anders, E.; Voigt, M.; Lehmann, F.; Mezzetti, M. Electric Impulse Drilling: The Future of Drilling Technology Begins Now. In Proceedings of the 36th International Conference on Ocean, Offshore & Arctic Engineering, Trondheim, Norway, 25–30 June 2017; OMAE: Trondheim, Norway, 2017; Volume 8. [Google Scholar] [CrossRef]
  25. Rodland, A. Deep geothermal energy; photonics for harvesting. In Proceedings of the Swissphotonics-Workshop, Photonics for Deep Geothermal Energy Harvesting, Neuchâtel, Switzerland, 7 November 2012. [Google Scholar]
  26. Wang, E.; Shi, F.; Manlapig, E. Pre-weakening of mineral ores by high voltage pulses. Miner. Eng. 2011, 24, 455–462. [Google Scholar] [CrossRef]
  27. Zhu, C.; Lu, X.; Gao, Z.; Yan, F.; Guo, C.; Zhang, X. Effect of high-voltage thermal breakdown on pore characteristics of coal. Int. J. Min. Sci. Technol. 2017, 27, 1051–1055. [Google Scholar] [CrossRef]
  28. Li, C.; Duan, L.; Tan, S.; Chikhotkin, V.; Fu, W. Damage model and numerical experiment of high-voltage electro pulse boring in granite. Energies 2019, 12, 727. [Google Scholar] [CrossRef] [Green Version]
  29. Vorob’ev, A.; Vorob’ev, G.; Chepikov, A. Regularities of Breakdown of a Solid Dielectric at the Interface with a Liquid Dielectric under the Action of a Voltage Pulse; Certificate of the Opening of NA-122; Vyshaya Shkola: Moscow, Russia, 1961. (In Russian) [Google Scholar]
  30. Jonscher, A.; Lacoste, R. On a cumulative model of dielectric breakdown in solids. IEEE Trans. Electr. Insul. 1984, 6, 567–577. [Google Scholar] [CrossRef]
  31. Lehr, J.; Ron, P. Foundations of Pulsed Power Technology; John Wiley & Sons: Hoboken, NJ, USA, 2017. [Google Scholar]
  32. Timoshkin, I.V.; Mackersie, J.W.; MacGregor, S.J. Plasma channel miniature hole drilling technology. IEEE Trans. Plasma Sci. 2004, 32, 2055–2061. [Google Scholar] [CrossRef]
  33. Li, C.; Duan, L.; Wu, L.; Tan, S.; Zheng, J.; Chikhotkin, V. Experimental and numerical analyses of electro-pulse rock-breaking drilling. J. Nat. Gas Sci. Eng. 2020, 77, 103263. [Google Scholar] [CrossRef]
  34. Zhao, L. Theoretical calculation on formative time lag in polymer breakdown on a nanosecond time scale. IEEE Trans. Dielectr. Electr. Insul. 2020, 27, 1051–1058. [Google Scholar] [CrossRef]
  35. Vogler, D.; Walsh, S.D.; Saar, M.O. A numerical investigation into key factors controlling hard rock excavation via electropulse stimulation. J. Rock Mech. Geotech. Eng. 2020, 12, 793–801. [Google Scholar] [CrossRef]
  36. Vazhov, V.F.; Gafarov, R.R.; Datskevich, S.Y.; Zhurkov, M.Y.; Lopatin, V.V.; Muratov, V.M.; Jeffryes, B. Breakage of rocks by pulsed electric discharge at elevated pressures and temperatures. Tech. Phys. Lett. 2011, 37, 383. [Google Scholar] [CrossRef]
  37. Griffiths, D.J. Introduction to Electrodynamics, 4th ed.; Cambridge University Press: Cambridge, UK, 2017. [Google Scholar] [CrossRef]
  38. Sychev, V.V. Insulators. In Complex Thermodynamic Systems; Springer: New York, NY, USA, 1973; pp. 95–117. [Google Scholar]
  39. Permann, C.J.; Gaston, D.R.; Andrš, D.; Carlsen, R.W.; Kong, F.; Lindsay, A.D.; Miller, J.M.; Peterson, J.W.; Slaughter, A.E.; Stogner, R.H.; et al. MOOSE: Enabling massively parallel multiphysics simulation. SoftwareX 2020, 11, 100430. [Google Scholar] [CrossRef]
  40. Haffen, S.; Géraud, Y.; Rosener, M.; Diraison, M. Thermal conductivity and porosity maps for different materials: A combined case study of granite and sandstone. Geothermics 2017, 66, 143–150. [Google Scholar] [CrossRef]
  41. Archer, D.G.; Wang, P. The dielectric constant of water and Debye-Hückel limiting law slopes. J. Phys. Chem. Ref. Data 1990, 19, 371–411. [Google Scholar] [CrossRef] [Green Version]
  42. Gavish, N.; Promislow, K. Dependence of the dielectric constant of electrolyte solutions on ionic concentration: A microfield approach. Phys. Rev. E 2016, 94, 012611. [Google Scholar] [CrossRef] [Green Version]
  43. Hector, L.G.; Schultz, H.L. The Dielectric Constant of Air at Radiofrequencies. Physics 1936, 7, 133–136. [Google Scholar] [CrossRef]
  44. Fu, Y.; Zhang, P.; Verboncoeur, J.P.; Wang, X. Electrical breakdown from macro to micro/nano scales: A tutorial and a review of the state of the art. Plasma Res. Express 2020, 2, 013001. [Google Scholar] [CrossRef]
  45. Husain, E.; Nema, R.S. Analysis of Paschen Curves for air, N2 and SF6 Using the Townsend Breakdown Equation. IEEE Trans. Electr. Insul. 1982, EI-17, 350–353. [Google Scholar] [CrossRef]
  46. Hopf, A.; Rossner, M.; Berger, F.; Prucker, U. Dielectric Strength of Alternative Insulation Gases at High pressureStreamer influence on Paschen’s law at high pressure. In Proceedings of the Electroenergetica Glasamy Molodeshny, Ivanovo, Russia, 21 November 2015; pp. 394–399. [Google Scholar]
  47. Slade, P.; Taylor, E. Electrical breakdown in atmospheric air between closely spaced (0.2 mum–40 mum) electrical contacts. IEEE Trans. Compon. Packag. Technol. 2002, 25, 390–396. [Google Scholar] [CrossRef]
  48. Tirumala, R.; Go, D.B. An analytical formulation for the modified Paschen’s curve. Appl. Phys. Lett. 2010, 97, 151502. [Google Scholar] [CrossRef]
  49. Loveless, A.M.; Meng, G.; Ying, Q.; Wu, F.; Wang, K.; Cheng, Y.; Garner, A.L. The transition to Paschen’s law for microscale gas breakdown at subatmospheric pressure. Sci. Rep. 2019, 9, 5669. [Google Scholar] [CrossRef] [Green Version]
  50. Martin, J.; Reess, T.; De Ferron, A.; Ruscassié, R.; Bethbeder, F.R. Influence of hydrostatic pressure and temperature on the water dielectric strength and on the dynamic pressure wave. In Proceedings of the 2012 IEEE International Power Modulator and High Voltage Conference (IPMHVC), San Diego, CA, USA, 3–7 June 2012; pp. 370–373. [Google Scholar] [CrossRef]
  51. Zicheng, Z.; Jiande, Z.; Jianhua, Y. Experimental Study on High Electrical Breakdown of Water Dielectric. Plasma Sci. Technol. 2005, 7, 3161–3165. [Google Scholar] [CrossRef]
  52. Walsh, S.D.; Vogler, D. Simulating electropulse fracture of granitic rock. Int. J. Rock Mech. Min. Sci. 2020, 128, 104238. [Google Scholar] [CrossRef] [Green Version]
  53. Walsh, S.; Czaszejko, T.; Vogler, D. Electropulse stimulation of rock: Insights from grain-scale experimental studies and numerical models. In Proceedings of the ISRM International Symposium-EUROCK 2020, OnePetro, physical Event Not Held, 14–19 June 2020. [Google Scholar]
  54. Vazhov, V.F.; Gafarov, R.; Datskevich, S.Y.; Zhurkov, M.Y.; Muratov, V.M. Electric-pulse breakdown and the breakage of granite. Tech. Phys. 2010, 55, 833–838. [Google Scholar] [CrossRef]
  55. Vazhov, V.F.; Datskvich, S.Y.; Zhurkov, M.Y.; Muratov, V.M. Electric pulse breakdown and rock fracture in a coupled environment of increased pressure and temperature. J. Phys. Conf. Ser. 2014, 552, 012050. [Google Scholar] [CrossRef] [Green Version]
Figure 1. Schematic showing the PPGD concept and arrangement, i.e., the electrodes, the drilling fluid, and the rock. Phase I and Phase II show the plasma formation in the pores and the resultant pore space expansion [23]. Phases III and IV show the plasma channel formation, expansion, and rock damage [28].
Energies 15 00250 g001
Figure 2. 2D numerical simulation domain. The contour lines represent equal electric potentials. The red boxes should align parallel/perpendicular to the equipotential lines. In the later “pore-scale” analysis, it is assumed that the equipotential lines are parallel/perpendicular to the sample boundaries.
Energies 15 00250 g002
Figure 3. The pore-scale simulation domain. The single pore occupies 1% of the square area. The contours represent the equipotential lines, where “potential” refers to the electric potential.
Energies 15 00250 g003
Figure 4. The dimensionless enhancement factor (color bar) of the electric field across the sample. The enhancement factor is the electric field normalized to the electric field at the electrode contacts with the rock. The left inset is an enlarged view of electric field direction at the high-voltage electrode, and the right inset is an enlarged view of that at the grounded electrode. The insets mark the near-electrode regions with average enhancement factors of E E F , S , N E ¯ = 4.5 . The white-dashed arc marks the inter-electrode region with an average enhancement factor of E E F , S , I E ¯ = 0.9 .
Energies 15 00250 g004
Figure 5. The dimensionless enhancement factor (color bar) of the electric field for the pore-scale simulations, E E F , P , where E E F , P ¯ denotes the average enhancement factor across the pore. The enhancement factor is the electric field normalized to the electric field at the domain boundary. The first row shows the model geometry and boundary conditions. The second and third rows show the results for air-filled and water-filled pores, respectively.
Energies 15 00250 g005
Figure 6. The dielectric strength of air in pores, E D S , P , and the critical electric field required at the electrodes, E C r , E , to induce an electric field equal to the dielectric strength of air. Both variables are given as a function of (a) the pore size, d P , and (b) the pore-fluid pressure, P P .
Energies 15 00250 g006
Figure 7. Comparison of the dielectric strength for granite, estimated based on the experimental data from Inoue et al. [20] ( E D S , E x p , M a x , E D S , E x p , M i n ) versus the predictions by our model ( E D S , N u m ). Circles represent cases, where rock damage occurred in the experiments, whereas squares stand for no damage, as reported in Inoue et al. [20].
Energies 15 00250 g007
Table 1. The parameters and boundary conditions used during the sample-scale simulations.
NameSymbolValueUnitReference
Sample width W S 13cmInoue et al. [20]
Sample height H S 3cmInoue et al. [20 a
Electrode gap distance d E 5cmInoue et al. [20 a
Electrode voltage V E 380kVInoue et al. [20] a
Electric permittivity of granite ε r 6-Ezzat et al. [23 a
Left electrode: Dirichlet BC-380kVInoue et al. [20 a
Right electrode: Dirichlet BC-0kVInoue et al. [20 a
Rest of boundaries: Neumann BC-0kV/cmInoue et al. [20 a
a Adapted from the reference.
Table 2. The parameters and boundary conditions used in the pore-scale simulations.
NameSymbolValueUnitReference
Domain width W P 1unit lengthJustified
Domain height H P 1unit lengthJustified
Porosity ϕ 1%-Haffen et al. [40 a
Electric permittivity of granite ε r 6-Ezzat et al. [23 a
Electric permittivity of air ε a 1-Hector and Schultz [43]
Electric permittivity of water ε w 80-Archer and Wang [41]
Left side: Dirichlet BC-1unit voltageJustified
Right side: Dirichlet BC-0unit voltageJustified
Top and bottom sides: Neumann BC-0unit voltage/unit lengthJustified
a Adapted from the reference.
Publisher’s Note: MDPI stays neutral with regard to jurisdictional claims in published maps and institutional affiliations.

