Article

Integrated Surrogate Optimization of a Vertical Axis Wind Turbine

by
Marco A. Moreno-Armendáriz
1,
Eddy Ibarra-Ontiveros
1,
Hiram Calvo
1,* and
Carlos A. Duchanoy
2
1
Instituto Politécnico Nacional, Centro de Investigación en Computación, Av. Juan de Dios Bátiz s/n, Ciudad de Mexico 07738, Mexico
2
Gus Chat, Av. Paseo de la Reforma 26-Piso 19, Ciudad de Mexico 06600, Mexico
*
Author to whom correspondence should be addressed.
Energies 2022, 15(1), 233; https://doi.org/10.3390/en15010233
Submission received: 3 November 2021 / Revised: 24 December 2021 / Accepted: 27 December 2021 / Published: 30 December 2021
(This article belongs to the Special Issue Vertical-Axis Wind Turbine)

Abstract

:
In this work, a 3D computational model based on computational fluid dynamics (CFD) is built to simulate the aerodynamic behavior of a Savonius-type vertical axis wind turbine with a semi-elliptical profile. This computational model is used to evaluate the performance of the wind turbine in terms of its power coefficient (Cp). Subsequently, a full factorial design of experiments (DOE) is defined to obtain a representative sample of the search space on the geometry of the wind turbine. A dataset is built on the performance of each geometry proposed in the DOE. This process is carried out in an automated way through a scheme of integrated computational platforms. Later, a surrogate model of the wind turbine is fitted to estimate its performance using machine learning algorithms. Finally, a process of optimization of the geometry of the wind turbine is carried out employing metaheuristic optimization algorithms to maximize its Cp; the final optimized designs are evaluated using the computational model for validating their performance.

1. Introduction

The issue of renewable energy is a topic that has gained relevance in recent years, mainly due to the depletion of traditional energy sources and the environmental impact. Consequently, more and more countries are interested in developing a sustainable energy industry based on renewable energy sources, such as solar, hydro, or wind energy.
The conventional way of harnessing the energy of the wind is through wind turbines. According to the orientation of its axis of rotation to the direction of the wind flow, two types are distinguished: the so-called Horizontal Axis Wind Turbine (HAWT) and those of Vertical Axis Wind Turbine (VAWT).
VAWT represents a good option for implementation in small-scale applications for self-consumption purposes, in areas with limited space and changing wind conditions, such as urban and rural environments [1]. In particular, the Savonius VAWT has a simple design that allows it to operate regardless of wind direction and at relatively low wind speeds. In addition, it has the advantage of having high capacity for self-starting [2] and low cost of construction and maintenance. However, the main disadvantage of this wind turbine resides in its low efficiency in the use of the energy available in the wind, being the design with the lowest theoretical efficiency of all [3,4,5].
Despite the inherent advantages of the Savonius VAWT for its implementation in small-scale power generation applications, its low efficiency makes it an unprofitable option for its practical implementation. Therefore, its use in practical applications is not widely spread.
A possible solution with which to solve this problem is the optimization of the design of the Savonius wind turbine, seeking to maximize its efficiency. In recent years, there has been growing interest in the design and optimization of vertical axis wind turbines [6,7]. For instance, in [8] the authors performed a study focused on finding the optimal values of the design parameters of Darrieus VAWT blade airfoil. The authors also studied the effect of varying the number of blades on the rotor, concluding that a four-blade configuration has better efficiency than a three-blade configuration. Such an optimization study was carried out by using the QBlade simulation software for wind turbine blade design. Similarly, in [9], the authors performed an optimization process on the blade profile of a Savonius wind turbine. The authors built a 2D computational model for the Savonius wind turbine by employing the software Ansys Fluent, and later they surrogated the computational model by means of a Kriging model. Finally, the authors employed the surrogate model along with a PSO algorithm to optimize the Savonius blade profile, claiming to reach a maximum C p of 0.262 with the optimized design. On the other hand, in [10] a fluid-structure interaction analysis was carried out to study the stresses occurring on the blade of a small horizontal axis wind turbine designed to operate urban areas. This study employed a 2D computational model built on Ansys Fluent, which was validated with wind tunnel tests, showing that the computational model tends to underestimate the wind turbine performance but has an acceptable level of matching between simulation and experimental results. Another interesting example is found in [11], where the authors study the effect of varying the helix angle of blades for a Darrieus VAWT, analyzing its influence on the aerodynamic performance of the wind turbine. The authors employ a 3D computational model to simulate the wind turbine’s performance and find the optimal helix angle from a small set of helix angles. In [12], a review of the rotor parameters on the performance of Savonius wind turbine is presented. The review focuses on analyzing a series of works concerning the design parameters modifications of Savonius wind turbines and their effect on the wind turbine’s performance. The authors highlight some interesting remarks about the Savonius wind turbine configurations, for instance, better performance is expected from turbines with two blades rather than turbines with three blades, operating at low wind speeds. Besides, it is suggested to employ end plates to cover the turbine blades in order to increase the air volume acting on the advancing blade. Moreover, the existence of an overlap region between the turbine blades has shown to have a positive effect on the Savonius wind turbine performance. Finally, it is remarked that the use of curtains or wind deflectors to guide the airflow to the advancing blade is a promisingly alternative to significantly improve the Savonius wind turbine performance. A more detailed review about different proposals of wind deflectors is presented in [13], where the authors analyze different kinds of wind deflectors designed for a variety of VAWT’s, including some Savonius and Darrieus wind turbines. It is highlighted that flat wind deflectors are more suitable for Savonius type wind turbines with two blades; meanwhile, aerodynamic deflector profiles are more suitable for Darrieus-type wind turbines, even having the possibility of using one single wind deflector on arrangements of at least two vertical axis wind turbines. Finally, in [14] the authors present a proposal to improve the performance of VAWT, based on the design and implementation of an improved wind duct to increase the wind speed. The optimum parameters of the wind duct are found by means of numerical simulations and a surrogate model based on DOE and the Kriging method. The authors simulate the behavior of an H-Darrieus VAWT placed at the inside of the improved wind duct, and the results show that the VAWT power coefficient can be enhanced up to 2.9 times.
In this work, we propose optimizing the design of a vertical wind turbine type Savonius to maximize its efficiency in terms of its energy conversion capacity through metaheuristic algorithms and using a surrogate model of the Savonius wind turbine obtained through techniques of machine learning.
By performing the optimization process using a surrogate model of the wind turbine, it intended to reduce the computational cost of the optimization process and, therefore, reduce the time spent in the design and optimization process of the Savonius wind turbine.

2. State of the Art

2.1. Design and Optimization Based on Experimental Tests

The design methodology based on experimental tests in controlled environments is one of the classic approaches most used by researchers due to the fidelity of the data collected concerning the physical phenomenon being studied. The most used technique in this type of test consists of wind tunnels to carry out the different experiments associated with the design and optimization process [15,16,17,18,19,20,21,22].
For example, in [23] a series of experimental tests was carried out to design a new blade profile for the Savonius wind turbine based on progressive modifications on the Bach and Benesh blade profiles (2013–2015). During this process, the authors sought to achieve an optimal design for the geometry of the wind turbine blades to maximize the power coefficient of the wind turbine as a function of the tip speed ratio or TSR. Roy and Saha’s profile was tested using a prototype with a frontal area of 0.0529 m 2 in an open section wind tunnel. Several other profiles reported in the literature show an increase in the power coefficient of up to 34.8 % compared to the classic semicircular profile, reaching a maximum C p of up to 0.31 at a T S R of 0.82 with a Reynolds number of 1.2 × 10 5 and a wind speed of 6 m/s. The work reported by the authors also considers a correction factor for their experimental data due to the blocking effect produced by the construction of the wind tunnel. In these works, the authors carried out the optimization process by trial and error. The number of prototypes analyzed was small, and therefore the authors explored a limited search space during the optimization process. The sample was small due to the time and cost required for construction and experimentation with the prototypes.
On the other hand, work in [23] tests small prototypes, with a frontal area of only 0.0377 to 0.0529 m 2 , obtaining a meager amount of total energy available in the wind. Furthermore, the efficiency values achieved with designs in this order of dimension are not necessarily maintained when scaling up to larger prototypes since these tend to decrease as the dimension of the wind turbines increases.

2.2. Design and Optimization Based on Computational Models

An alternative methodology to experimental tests in controlled environments is that which makes use of computational models. This methodology has become quite popular in recent years because it allows for the modeling of many physical phenomena through computational tools with relatively high precision, thus reducing the costs and times associated with the design and optimization process. It reduces the number of experimental tests required for this process. The most widely used technique in this field is computational fluid dynamics or CFD, which solves the complex equations that describe the behavior of fluids using finite element or finite volume methods [24,25,26,27,28].
In 2016, Alom et al. [29] used a CFD model of a Savonius wind turbine with a semi-elliptical profile and a frontal area of 0.286 m 2 to optimize this wind turbine’s geometry. For this, dynamic simulations are carried out in a 2D space following the sliding mesh method to simulate the rotation of the wind turbine. The study analyzed the torque and power coefficients of the wind turbine as a function of the TSR, while the angle Theta varied. They evaluated four different cut angles. As a result, they obtained an optimal cutting angle of 47 . 5 , reaching a maximum power coefficient of up to 0.33 at T S R = 0.80 , considering a wind speed of 6.2 m/s. Subsequently, steady-state simulations were performed in 3D space to evaluate the wind speed and pressure contours on the wind turbine blades. Finally, in [30], the authors validated their optimized design through dynamic simulations in a 3D space and experimental tests in a wind tunnel, using a prototype with a frontal area of 0.046 m 2 and keeping the wind speed constant at 6.2 m/s, which resulted in significantly lower performance values than previously estimated in 2D studies and reported in [29,30]. Through 3D simulations, a maximum C p of 0.1288 was estimated at a T S R = 0.80 , while through experimental wind tunnel tests, a C p maximum of 0.134 at a T S R = 0.49 ; this indicates that the 2D computational model can overestimate the maximum value of C p by a factor of up to 2.4 times, while the 3D model estimated values were closer to those obtained through experimental tests.
They also highlight the differences between the power coefficient values estimated by the computational models and the values obtained through experimental tests, where the 2D computational models can overestimate up to a factor of up to 2.4 times the value of the maximum C p [29,30]. In contrast, the 3D models show a better correspondence with the experimental data [30]. This improvement is because neglecting the rotor height phenomenon leaves out a crucial factor in the design of the Savonius wind turbine, which directly affects the precision of the estimates made by such 2D models.

2.3. Design and Optimization Based on Surrogate Models

The use of surrogate models in the Savonius wind turbine design and optimization processes has begun to gain popularity among researchers in recent years [31,32,33]. This interest is mainly because these models offer the possibility of modeling complex systems at a low computational cost and without the need to thoroughly understand the intrinsic relationships between the inputs and the outputs of the system. In addition, they have the particularity of being built from data collected from experimental tests and computer simulations.
In 2018, in Mohammadi et al. [33], the experimental data on the performance of a Savonius wind turbine reported in 2009 in [34] were taken as a basis. They built a computational model using CFD software to emulate the experimental results reported in [34], where wind tunnel tests are carried out with Savonius wind turbine prototypes with a twisted semicircular profile and frontal areas of around 0.062 m 2 . The computational model contemplates a 3D space and uses the sliding mesh method to simulate the rotation of the wind turbine. Such a model shows an acceptable correspondence with the data reported in [34]. Subsequently, they built a surrogate model based on artificial neural networks (ANN) to replace the computational model of the wind turbine, having as input the geometric parameters of the wind turbine and the characteristic speed and as output the power coefficient of the wind turbine. This surrogate model was a multilayer perceptron or MLP and showed an excellent correspondence with the data collected through simulations using the computational model. Next, an optimization process was carried out through genetic algorithms using the surrogate model of the computational model. This process evaluated 100 possible designs for the wind turbine in each generation of the genetic algorithm, which would demand a high computational cost for the 3D computational model. However, using the surrogate model during the optimization process makes it possible to evaluate a more significant number of possible designs for the wind turbine with a significantly lower computational cost. Finally, the authors assessed the optimized design of the Savonius wind turbine using the original computational model. This model showed good correspondence with the performance estimate produced by the surrogate model and obtained a significant improvement with the base design reported in [34], reaching a C p maximum up to 0.222 with a wind speed of 8.75 m/s.
From the works presented in this section, the advantage of substituting computational models or experimental schemes in wind tunnels with surrogate models stands out; these allow one to carry out the optimization process in a considerably shorter period, without losing precision or generality with the results obtained by the original models.

3. Methodology

This work uses the following proposed methodology to optimize the design of a Savonius wind turbine, using a surrogate model based on data collected through simulations of a wind turbine’s computational model and metaheuristic optimization algorithms to maximize the power coefficient of the wind turbine.
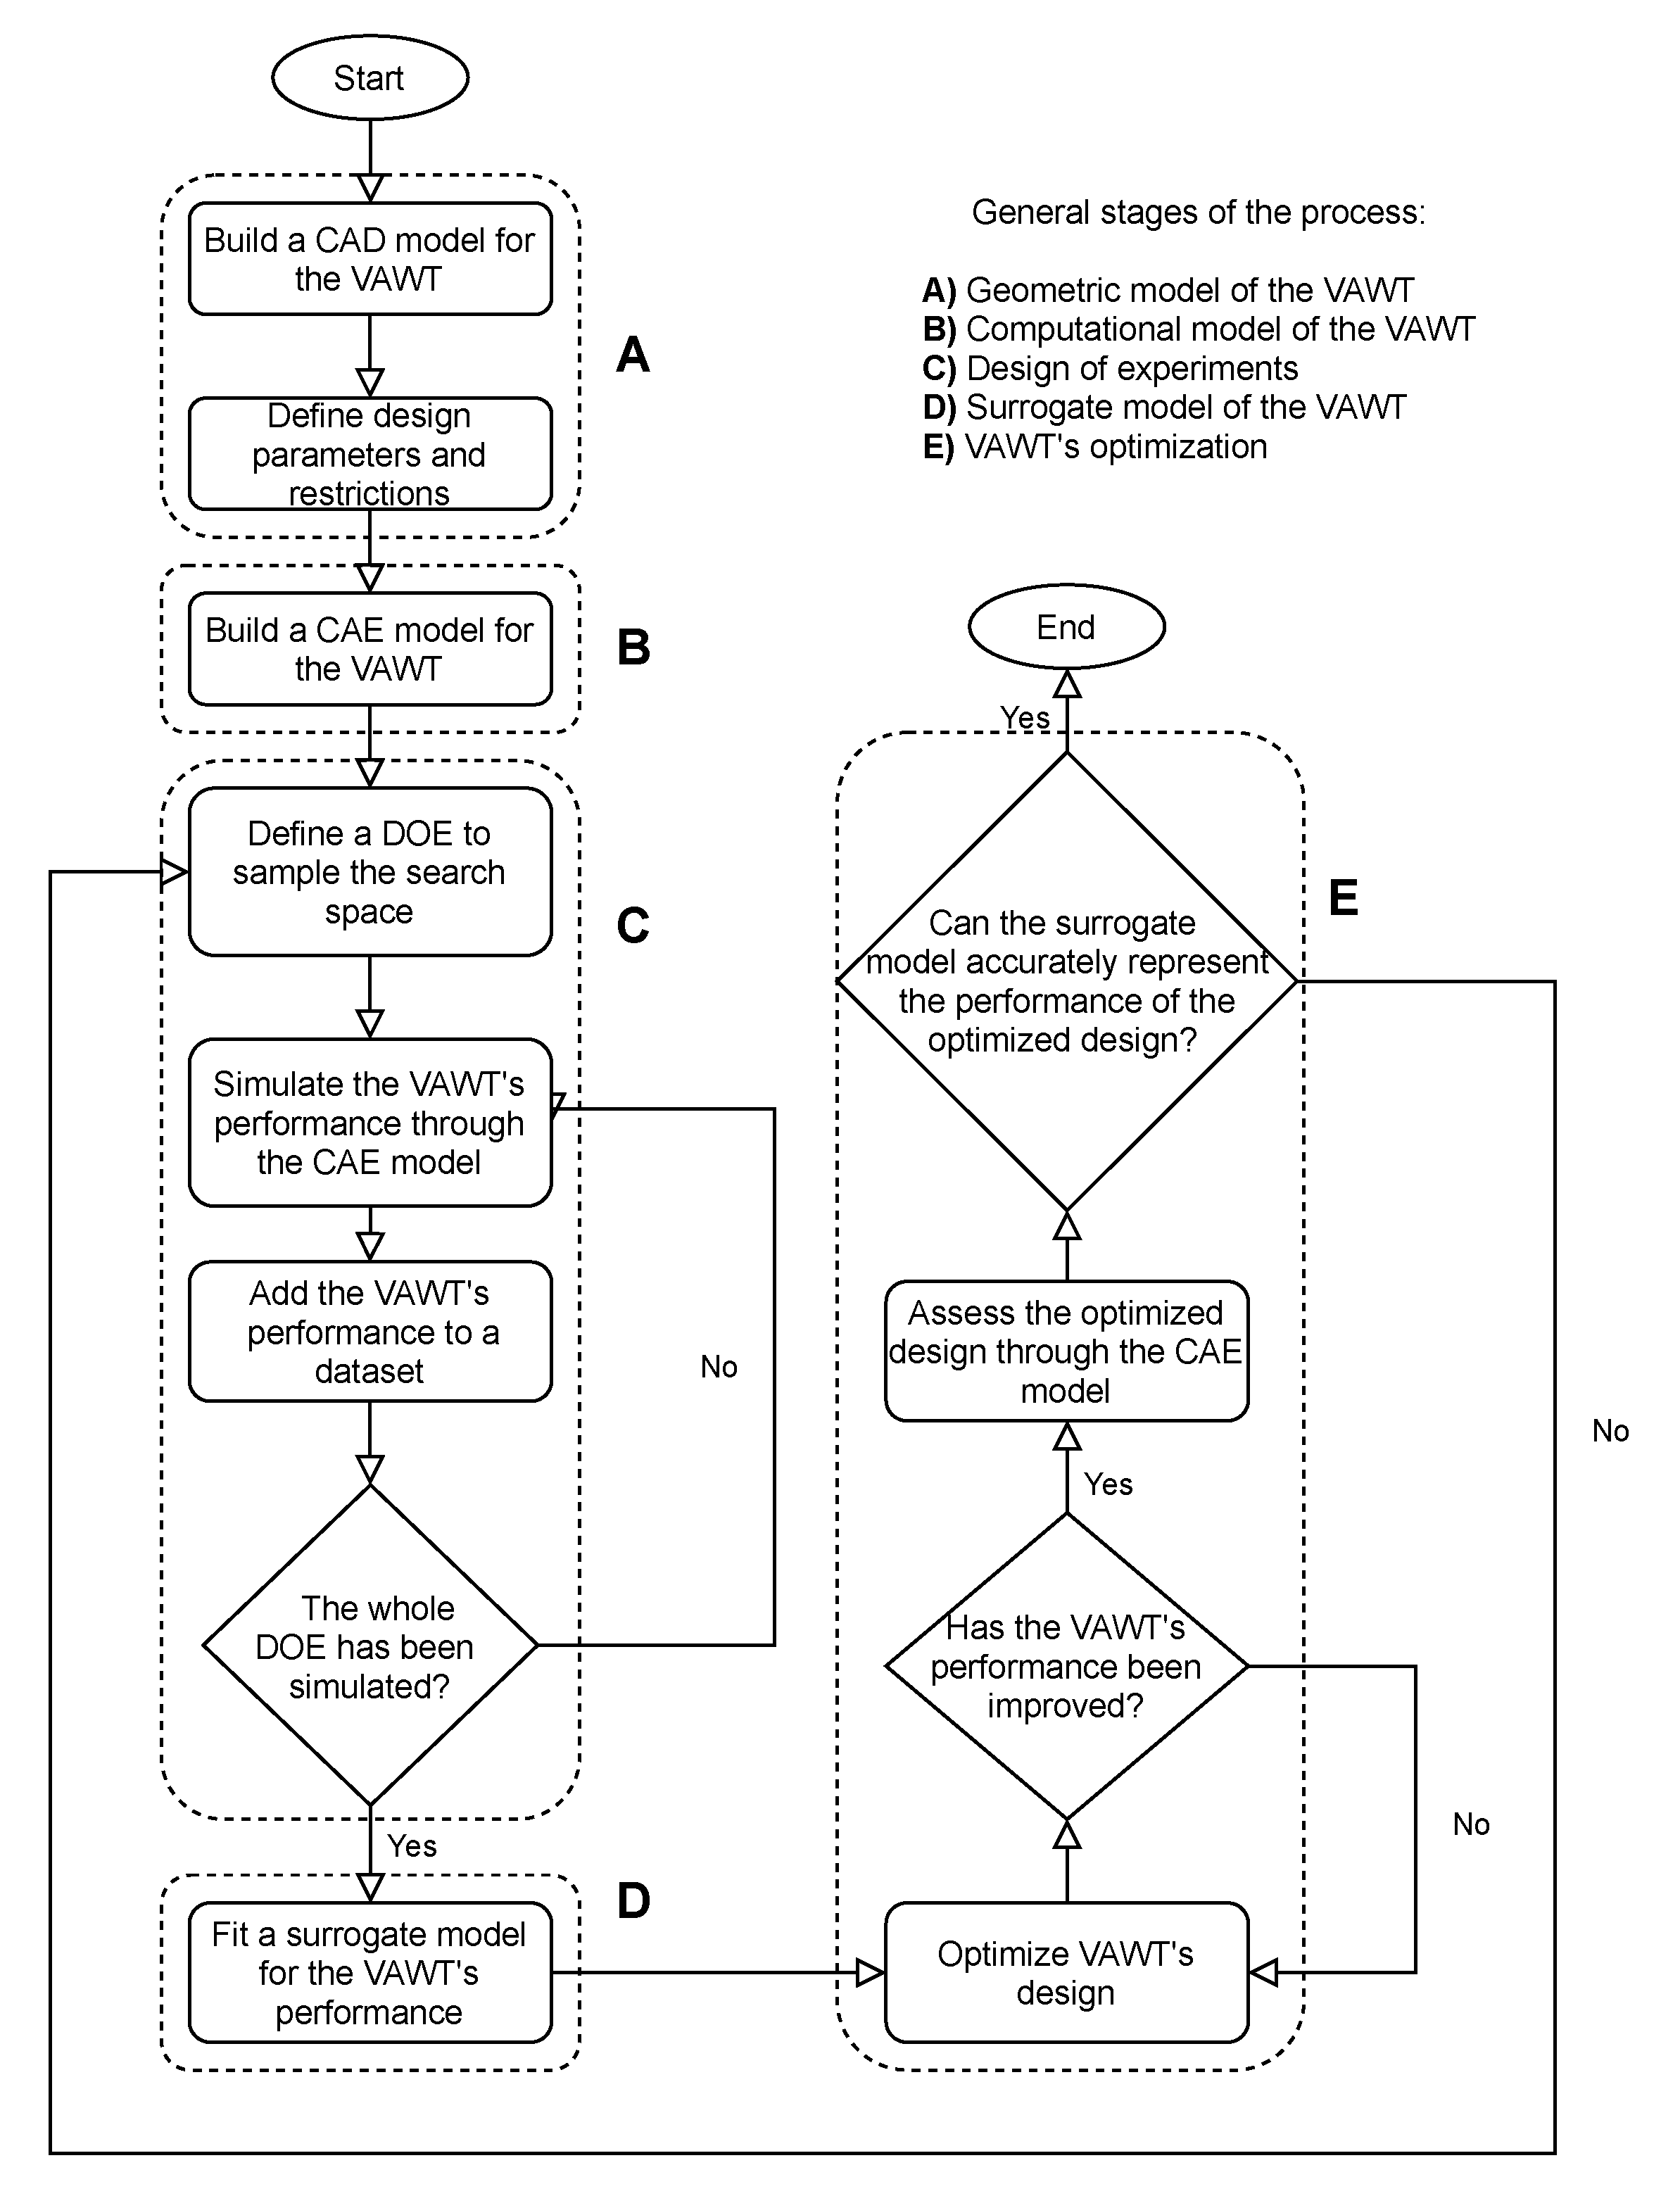
Figure 1 shows the flow diagram of the methodology to be followed in this work to optimize the Savonius wind turbine that includes five stages. Each one is detailed later. However, in general, they consist of the following:
  • (A) Geometric model of the wind turbine: a blade profile is chosen for the wind turbine. Using computer-aided design software (CAD), a 3D model of the wind turbine is built. The design parameters and their respective limits and restrictions are defined.
  • (B) A computational model of the wind turbine: through the use of computer-aided engineering (CAE) software, a computational model of the wind turbine capable of simulating the rotor’s interaction with the wind flow is built, allowing one to calculate its performance.
  • (C) Design of experiments: a set of experiments to simulate a representative sample of the solution space corresponding to the wind turbine design is designed. The necessary data are collected to form a representative data set on the wind turbine phenomenon.
  • (D) Surrogate model of the wind turbine: using the data set collected in the previous stage, a surrogate model of the wind turbine is built using machine learning algorithms.
  • (E) Wind turbine optimization: the optimization process for the wind turbine design using the surrogate model and metaheuristic optimization algorithms is executed.

3.1. Geometry

As shown in [8], there are several VAWT configurations and geometries, which include Darrieus VAWT and different Savonius blade profiles. In order to have a better guidance on the choice of VAWT type and blade profile, in Table 1 advantages and disadvantages for some VAWT types and blade profiles are summarized. From such Table 1, it is clear that Savonius VAWT type is more suitable for self-consumption applications in urban and rural areas, where normally the wind flow speed is lower and the power demand is not higher than 1 kW. Moreover, Savonius VAWT with semi circular blade profiles represent one of the simplest geometry designs, which, however, still have the potential to improve their capabilities with modifications on their geometric parameters that lead to more promising designs, such as the semi-elliptical blade profile.
The profile of the wind turbine blade proposed in this work is semi-elliptical and is obtained by taking the upper section of the sectional cut made on an ellipse, as shown in Figure 2a. The geometric parameters that define the semi-elliptical profile are the largest radius of the ellipse ( O A ), a minor radius of an ellipse ( O B ), distance to cut point ( O M ), and cut angle ( t h e t a ).
The rotor configuration of the wind turbine proposed in this work includes two blades with an overlap between them, without a central axis, and an upper cover and a lower cover for the rotor. Figure 2b shows the parameters that define the geometry of the wind turbine rotor and correspond to the overlap distance between blades (e), the length of the blade chord (d), the rotor height (H), the diameter (D), and the diameter of the rotor caps ( D o ). Additionally, Equation (1) defines the dimensionless parameter known as the overlap ratio ( O r ).
O r = e d
The design parameters selected in this work and their respective restrictions for the optimization process are in Table 2. On the other hand, the geometric parameters that remain constant are in Table 3.

3.2. Computational Model of the Wind Turbine

The study of the aerodynamic characteristics of the Savonius wind turbine is carried out following the CFD approach and making use of the finite element analysis method to solve the transport equations that describe the interaction of the wind turbine with a wind flow at a constant speed. A computational model of the Savonius wind turbine using the CAE multiphysics simulation software Comsol Multiphysics is built.

3.2.1. Definition of Parameters

A set of global parameters is defined to drive the computational model, shown in Table 4.

3.2.2. Geometry Construction

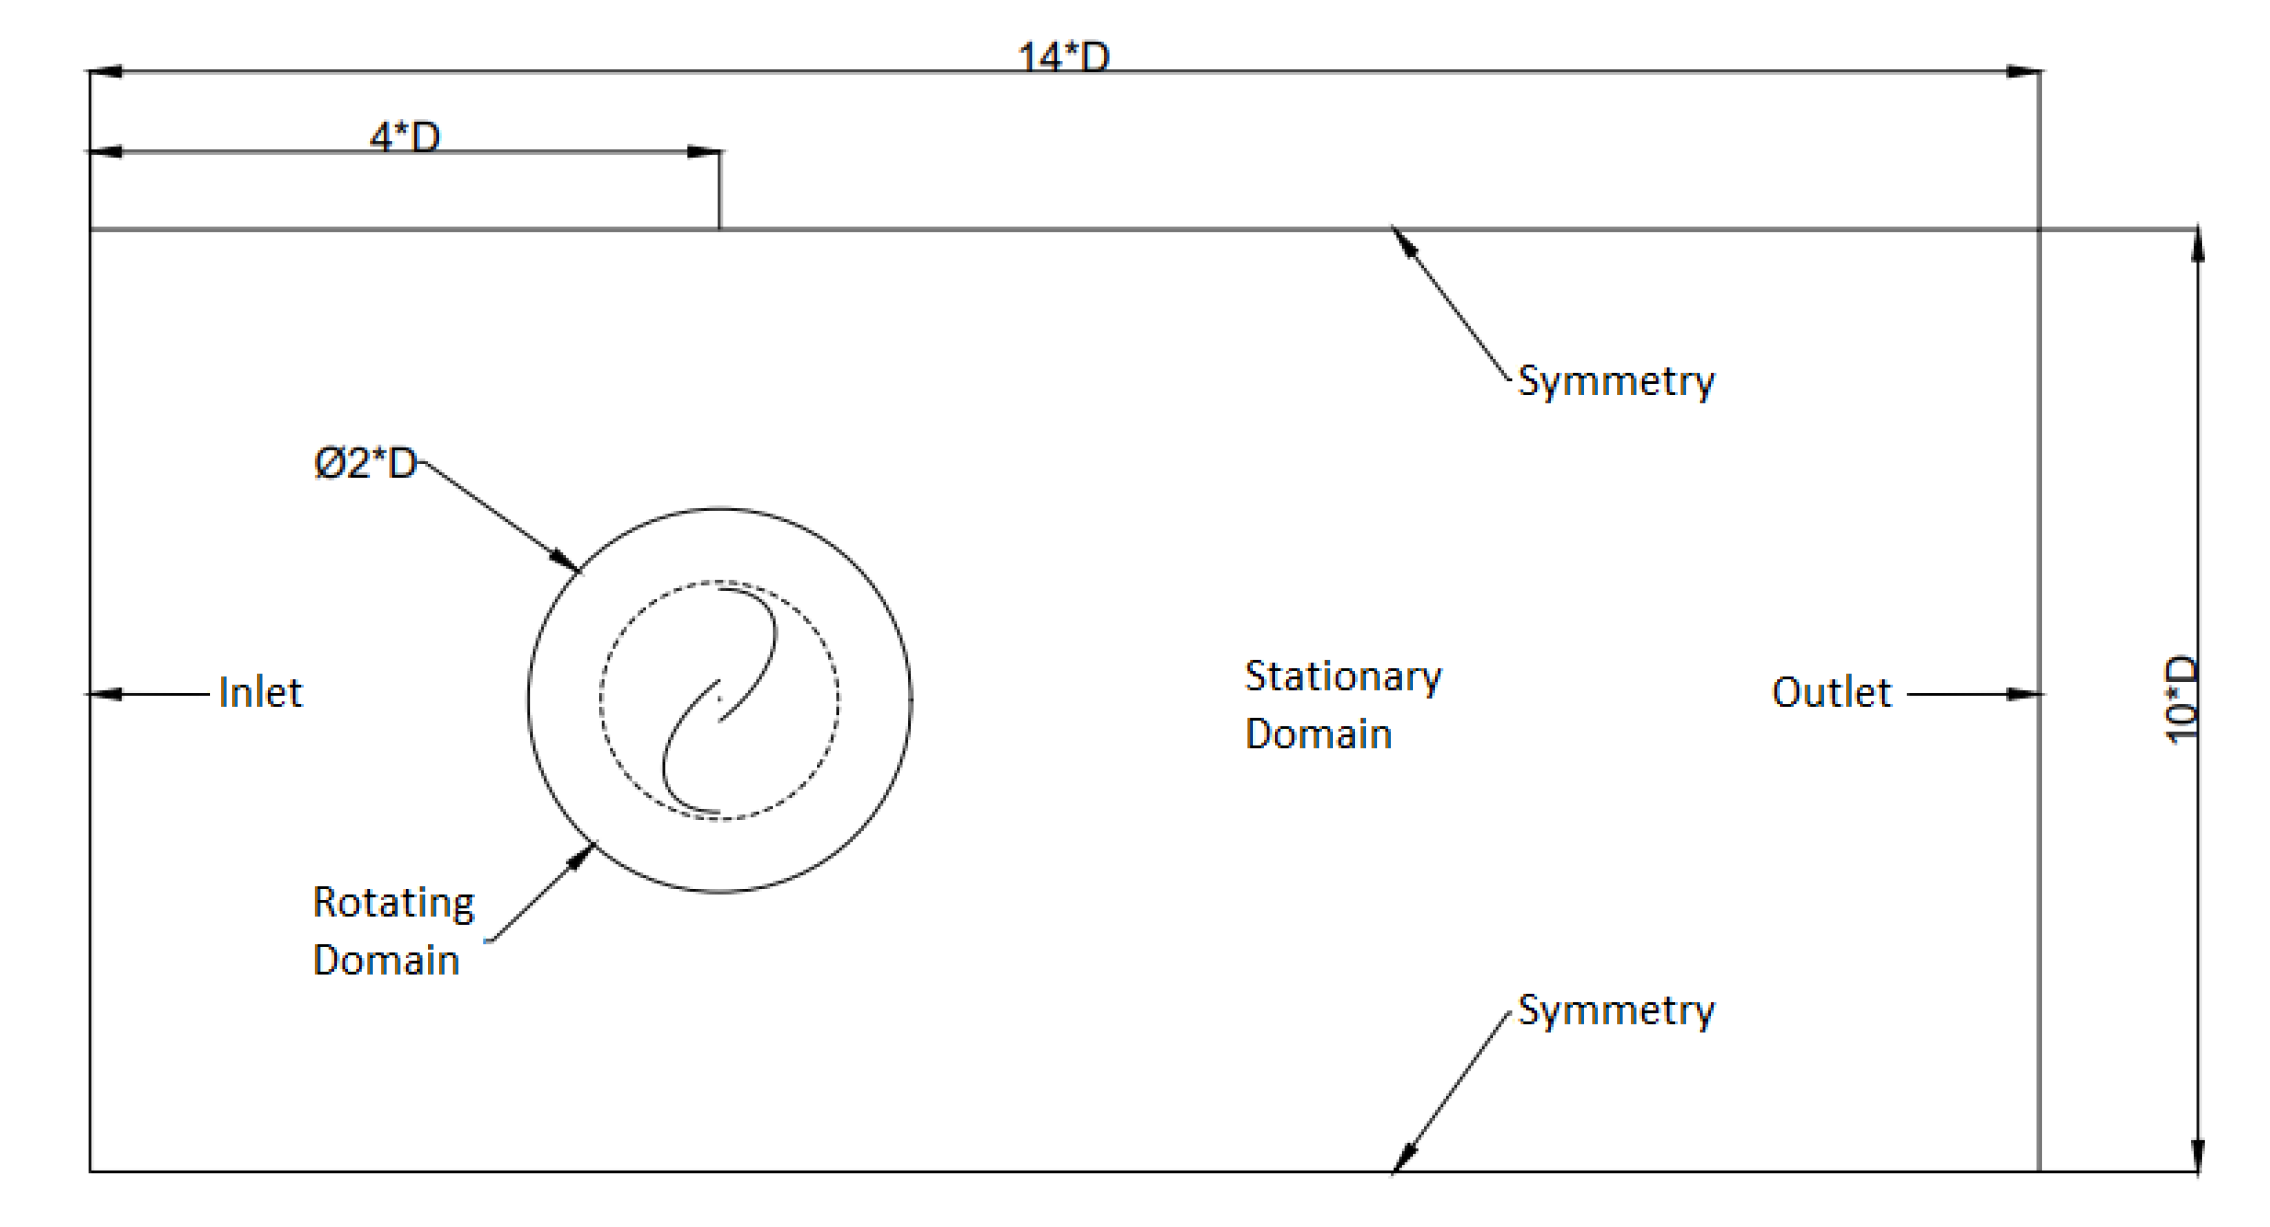
The simulation space has two computational domains: a rectangular prismatic domain to limit the total domain of the air within, called the stationary domain, and a cylindrical domain that surrounds the geometry of the Savonius wind turbine, called the rotating domain. Figure 3 illustrates the dimensions corresponding to these domains as a function of the rotor diameter and the respective contours intended for the inlet and outlet of the airflow. The simulation is set for the wind to flow from the inlet contour at constant speed and interacting with the Savonius VAWT on its way to the outlet contour, while the symmetry contours are set simply as symmetric side walls dedicated to contain the airflow within the stationary domain. It is worth mentioning that the height of both domains corresponds to four times the height of the rotor.

3.2.3. Physics Configuration

The selected physical interface corresponds to a single-phase and laminar flow without considering any turbulence model. This interface is applied to both the stationary and rotating domains, adding an inlet boundary condition to set the airflow inlet constant V velocity.

3.2.4. Sliding Mesh

We use the moving mesh method to simulate the rotation of the wind turbine at a constant angular speed N. At the same time, it is exposed to airflow at a constant speed V; this configuration is applied on the rotary domain. The angular speed is N / ( 2 . p i ) revolutions per second, where N is the angular velocity in rad/s.

3.2.5. Study Configuration

Two study steps are set up: a stationary step called a frozen rotor, and a temporary step. The function of the frozen rotor study is to approximate the solution to the dynamic problem of wind turbine rotation through a stationary study, to later use this approximate solution as initial conditions for the temporary study.

3.2.6. Definition of Study Variables

The total torque τ exerted on the Savonius wind turbine is defined as the difference in forces exerted between the forward blade and the return blade, as shown in Equation (2).
τ = τ a v τ r e t
where τ a v is the torque exerted by the forward blade and τ r e t is the torque exerted by the return blade.
To calculate this magnitude in Comsol Multiphysics, firstly, a series of integration operators are defined: the surface of the concave face of the advance blade ( i n t o p 1 ), the surface of the convex face of the advance blade ( i n t o p 2 ), the surface of the concave face of the return blade ( i n t o p 3 ), and the surface of the convex face of the return blade ( i n t o p 4 ). Subsequently, the variables in Equations (3) and (4) are defined in Comsol Multiphysics:
F 1 = x ( S t r e s s y ) y ( S t r e s s x )
F 2 = y ( S t r e s s x ) x ( S t r e s s y )
where x and y denote the position of a point within the Comsol coordinate frame. S t r e s s x and S t r e s s y refer to the total stresses, which include the contributions of the pressure force and the viscous force exerted on a point on axes x and y, respectively. In both cases, these variables are created automatically in the Comsol simulation environment.
Finally, in Equation (5), a variable for the total torque is defined.
T o r q u e = i n t o p 1 ( F 1 ) i n t o p 2 ( F 2 ) i n t o p 3 ( F 2 ) + i n t o p 4 ( F 1 ) .

3.3. Design of Experiments: Full Factorial

A full factorial design of experiments is designed with three design parameters and three levels for each one (see Table 5), and the total number of experiments required is defined as N e x p = 3 3 , which gives a total of 27 experiments that correspond to the 27 combinations of the levels of the design parameters.

Performance Metrics for the Design of Experiments

The performance of each Savonouis geometry is measured in terms of the power coefficient and TSR as defined in Equations (6) and (7).
C p = P r P v
T S R = N · R V
Furthermore, P r and P v are the rotor and total wind power, respectively, defined in Equations (8) and (9).
P r = T · N
P v = 1 2 ρ · A · V 3
where T is the average torque of the wind turbine in a time interval, ρ is the density of the wind, and A is the frontal area of the wind turbine (defined as A = D · H ).
Using the computational model of the wind turbine, we obtain Equation (10), which corresponds to the total torque exerted on the wind turbine rotor during the time interval from t 0 to t f , where t f is the total simulation time. With this, the dynamic behavior of the total torque over time is computed.
Now, the average torque (T) is obtained by integrating the total torque obtained from (5) in the period t 1 to t 2 , which is the time interval of the last complete rotation of the rotor, as shown in Equation (10).
T = t 1 t 2 T o r q u e d t t 2 t 1
Thus, the rotor power is obtained using (10) in (8), and the total wind power is obtained using ρ = 1.225 in (9). Finally, the value of C p is obtained by substituting (8) and (9) in (6). This calculation is repeated for all the T S R values indicated in the parametric sweep defined in Comsol Multiphysics. We obtained the behavior of the C p as a function of the T S R .

3.4. Integration of Computing Platforms

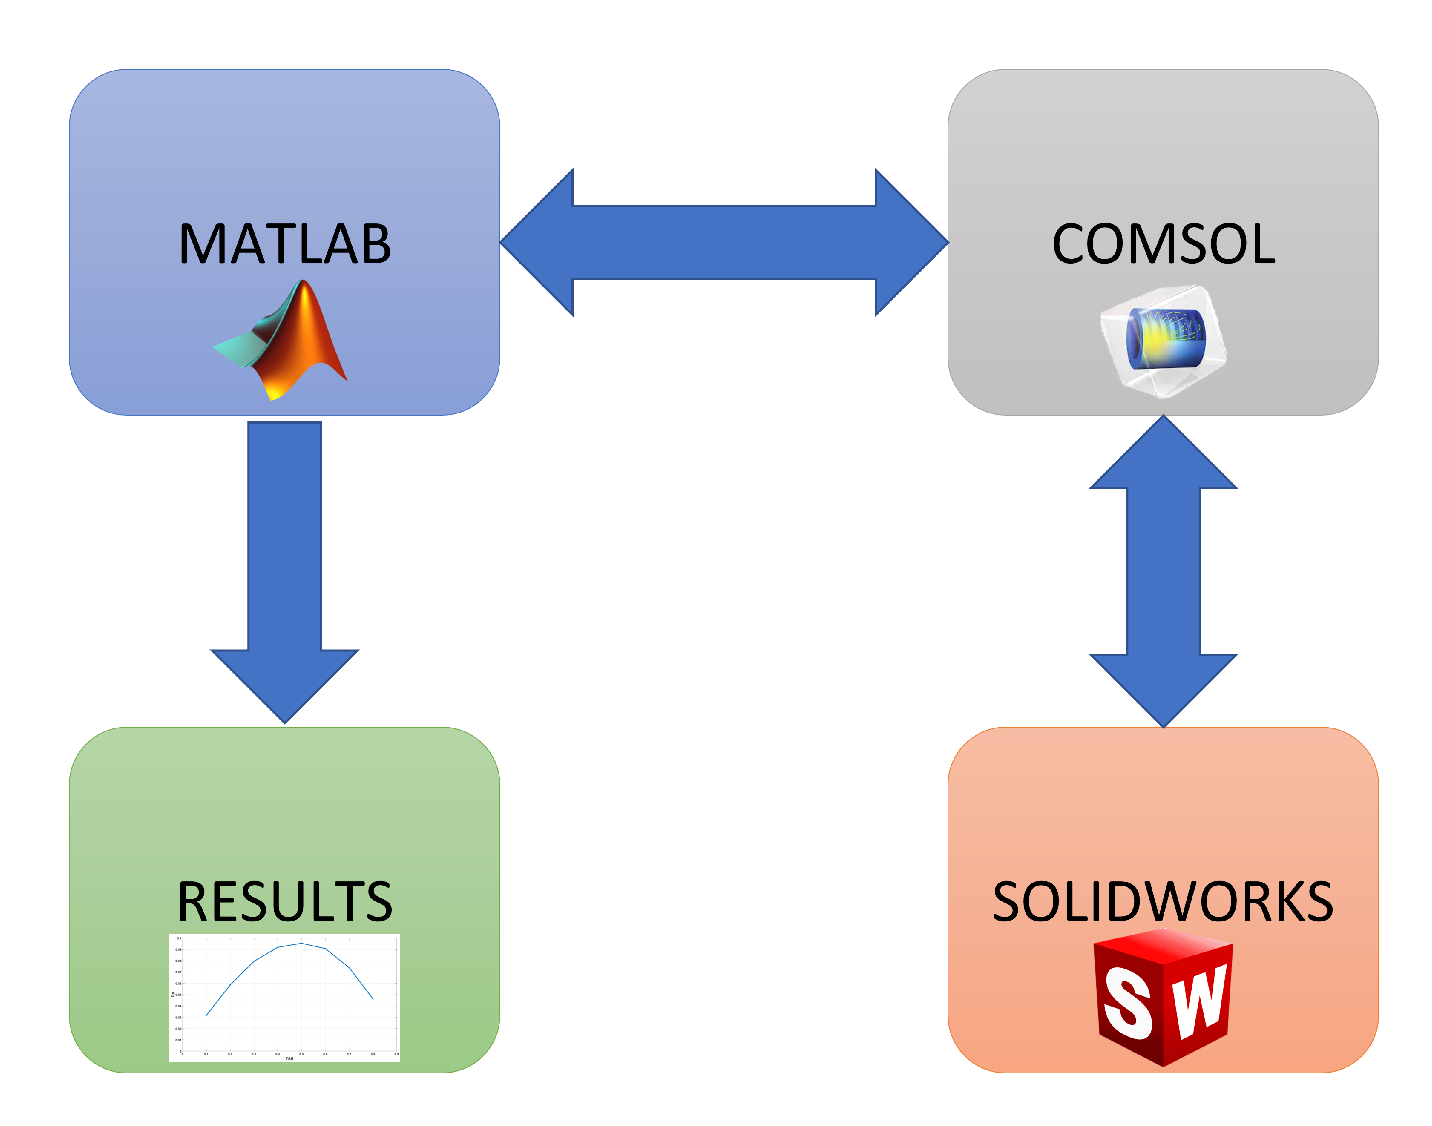
The process of evaluating the performance of the different geometries of the Savonius wind turbine is carried out automatically through the integration of the different computational platforms used for the construction and execution of the computational model of the wind turbine.
For this, a client-server type link is established between Matlab and Comsol Multiphysics and a direct link between Comsol Multiphysics and SolidWorks; in this way, the three platforms are perfectly integrated, with Matlab being the base platform from which the others are driven. Figure 4 shows a diagram of the interaction between the different integrated computing platforms.

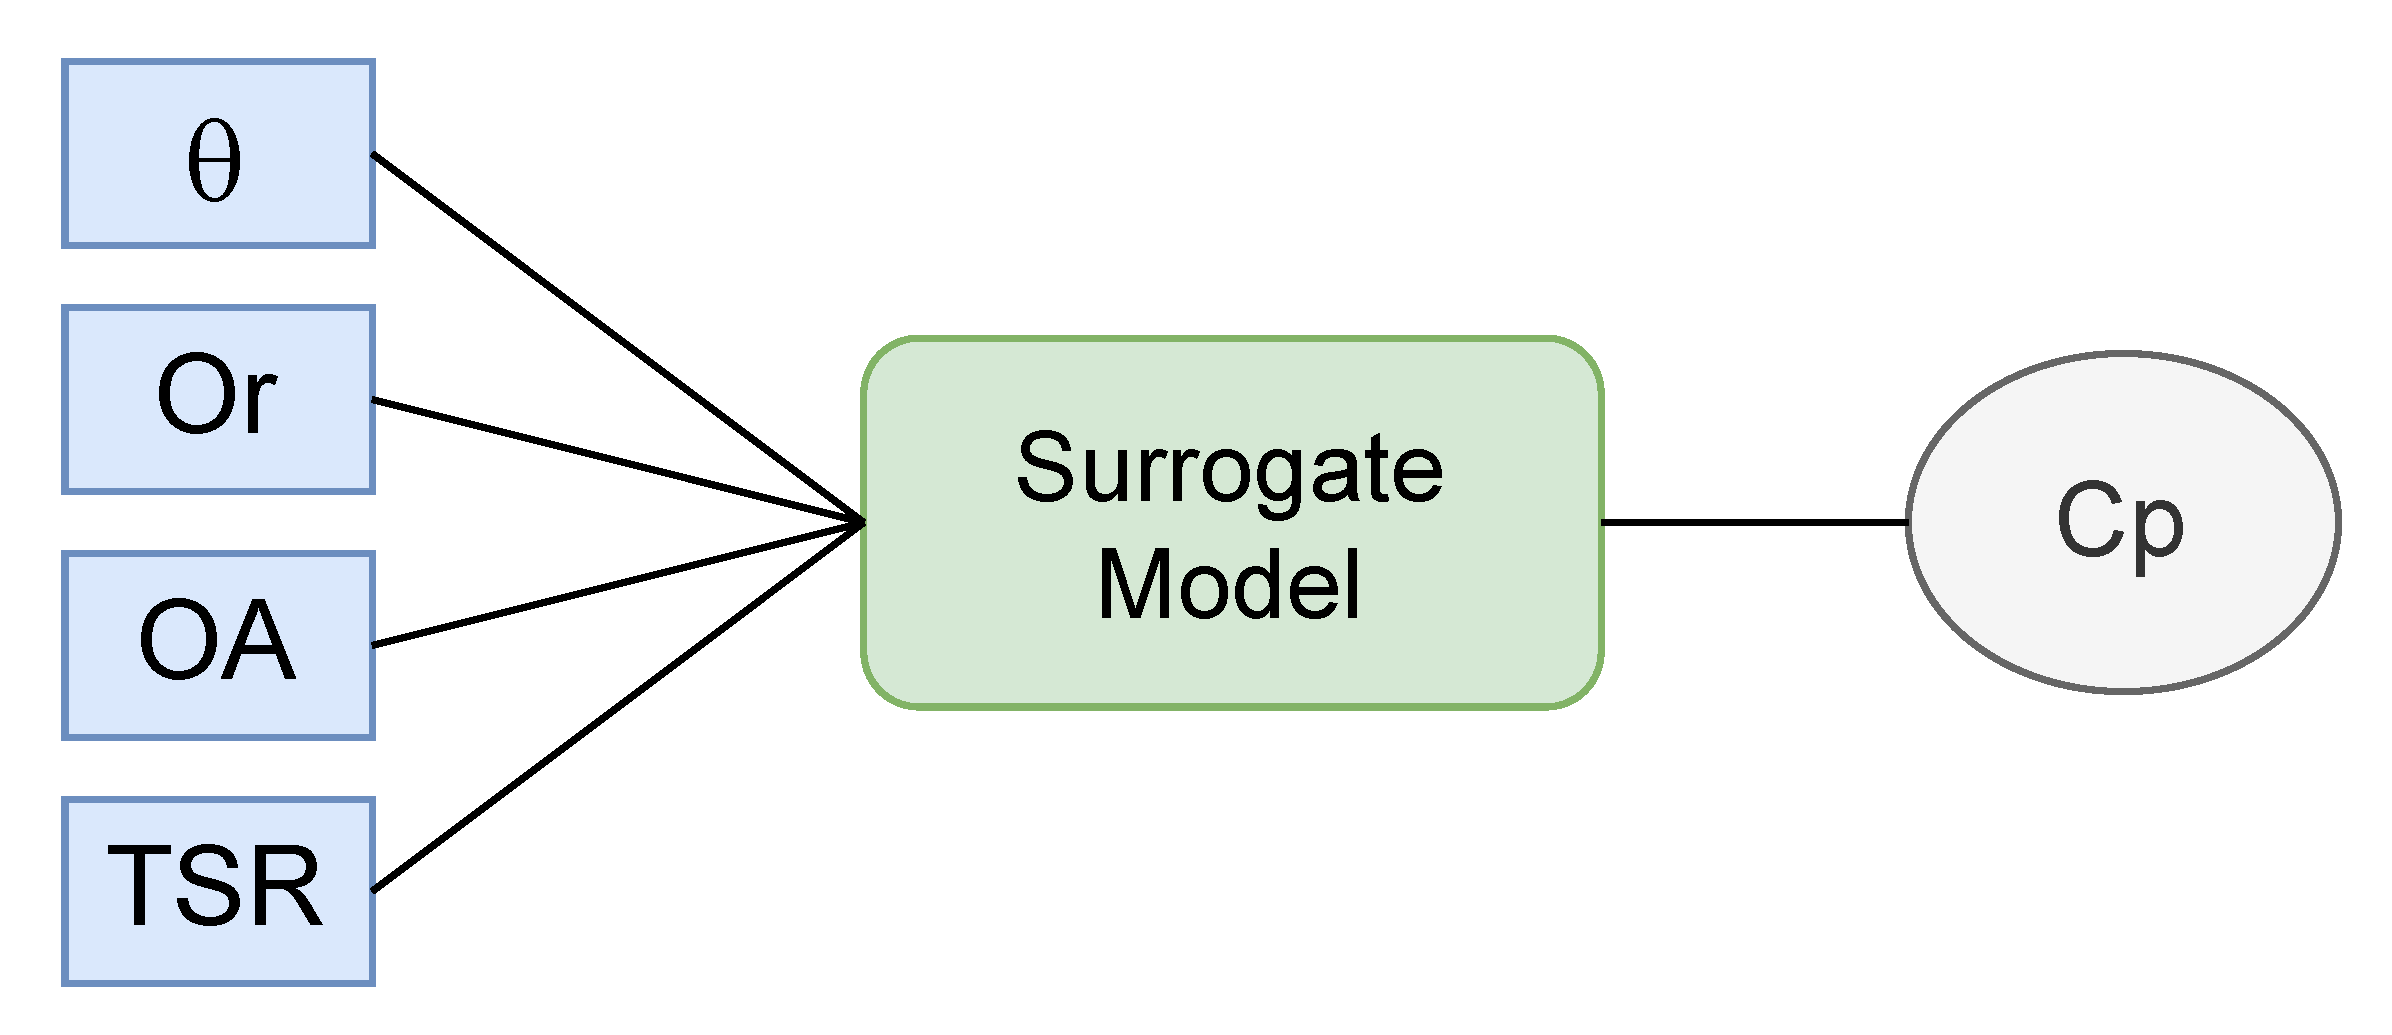
3.5. Surrogate Model of the Wind Turbine

The dataset of the Savonius wind turbine obtained through the DOE is made up of 216 values, with the input vector X = [ θ , O r , O A , T S R ] and as a target Y = C p , see Figure 5. This data set is separated into 80 % data for the training stage and 20 % for the testing stage, during the surrogate model fitting process.
The aim is to fit a surrogate model that receives the input data X (design parameters of the wind turbine) and estimates the output Y (power coefficient of the wind turbine). Figure 1 shows the diagram that illustrates this process. For this purpose, machine learning algorithms are used for regression, following the supervised learning approach.
The algorithms that are selected to build the surrogate model are the following:
  • Support vector machine (SVM);
  • Random forest (RFR);
  • Bayesian ridge regression (BR);
  • Multilayer perceptron (MLP);
The hyperparameters of each of these algorithms are adjusted by means of a grid search, using the cross-validation method. The metric used during this process is the root mean square error (MSE), see Equation (11).
M S E = 1 n i = 1 n ( y i y ¯ i ) 2
where n is the total number of data, y i is the correct label, and y ¯ i corresponds to the estimated label.
In Table 6, the selected values of the hyperparameters of each algorithm and its performance are shown.

3.6. Wind Turbine Optimization

The wind turbine optimization problem is approached as a single objective optimization problem in which the objective function to be maximized is the power coefficient of the wind turbine, while the design parameters to be optimized are the cut angle ( t h e t a ), the overlap ratio ( O r ), and the ellipse’s largest radius ( O A ), and the T S R . So, the problem is stated in Equation (12)
f o b ( X ) = C p ,
where C p R , X R 1 × 4 , X = [ θ , O r , O A , T S R ] , and it seeks to maximize the value of f o b .
Finally, the restrictions of each design parameter are shown in Table 2. Additionally, we establish that 0.595 T S R 0.605 .
The optimization process uses metaheuristic algorithms, specifically population algorithms based on hive intelligence and evolutionary algorithms. The algorithms selected to carry out this task are the following:
  • Artificial Bee Colony (ABC);
  • Genetic Algorithm (GA);
  • Particle Swarm Optimization (PSO).

Hyperparameters of Optimization Algorithms

The hyperparameters associated with each optimization algorithm are adjusted manually, seeking to balance each algorithm’s exploration and exploitation capabilities. Table 7, Table 8 and Table 9 list the hyperparameters selected for each algorithm during the wind turbine optimization process.

4. Experiments and Results

4.1. Computational Model Validation

The CAE computational model is validated based on two criteria: with a mesh independence study, where the model’s behavior is analyzed based on the number of mesh elements, and through a direct comparison of the data on the performance of the Savonius VAWT calculated with the model against experimental performance data reported in state of the art to analyze the level of correspondence between the simulated and experimental data.

4.1.1. Mesh Convergence Study

The mesh convergence study is carried out through an iterative mesh refinement process. This process consists of the following steps:
  • Build different models with increasingly finer mesh elements.
  • Analyze the variations in the output result of the model as a function of the number of mesh elements used.
  • When no significant variations are observed, the model has reached convergence in terms of the mesh density.
  • Finish the process since the precision of the model is already totally independent of the number of mesh elements used, given that better results will not be achieved with finer meshes.
Figure 6 shows a variation in the model’s output of less than 0.3% in terms of C p as the number of mesh elements increases considerably. Therefore, the model has reached convergence.

4.1.2. Comparison with Experimental Data

Figure 7 shows a direct comparison between the experimental data reported by [30], referring to the performance of a Savonius wind turbine with a semi-elliptical profile and the data calculated by the CAE model proposed in this work for a Savonius wind turbine with the same reported design at [30]. From this Figure, the good shape of the C p T S R curve and good operating range of the wind turbine are observed. However, there is no precise correspondence in the C p since there is an average error of 0.0548; this indicates a tendency for the CAE model to underestimate the value of C p . However, since the CAE model presents good convergence in terms of the mesh, the CAE model, although built correctly, could be leaving out some physical phenomenon, such as the level of turbulence present in the flow of wind, which could cause this tendency to underestimate the C p .

4.2. Validation of Surrogate Models

The coefficient of determination ( R 2 ) metric is used to test the performance of surrogate models previously adjusted using machine learning algorithms. The coefficient of determination is a widely used metric to measure the performance of regression algorithms and is defined in Equation (13), where S S R and S S T are determined in (14) and (15).
R 2 = 1 S S R S S T
S S R = i = 1 n ( y i y ¯ i ) 2
S S T = i = 1 n ( y i μ ) 2
where n is the total number of data, y i is the target, y ¯ i is the estimated label, and μ is the average of the data.
By applying this metric on the surrogate models adjusted with the hyperparameters of Table 6, Table 10 is obtained. This Table shows that the surrogate model with the best performance is the Random Forests algorithm, with a coefficient of determination of 0.97 and 0.98 in the training and testing stages, respectively.

4.3. Savonius Wind Turbine Optimization

Table 11 groups the design parameters delivered by each optimization algorithm at the end of this process. It is important to note that, although the T S R does not correspond to a design parameter of the wind turbine geometry, it is relevant to indicate the maximum performance point of a given design. However, the performance of each optimized design must be evaluated over the entire operating range of the TSR ( 0.1 to 0.8 ). Figure 8 shows the C p vs. T S R curves corresponding to the optimized designs in Table 11, estimated by the RFR surrogate model. It is observed that the performance of the three designs is practically identical, as estimated by the surrogate model.
It is important to note that during the optimization process, around 8980 evaluations were carried out. The three algorithms evaluated 8980 possible designs in total, which consumed around one hour of computational time using the surrogate model. Considering that each evaluation requires between 1 to 1.5 h of computational time in the CAE model, the optimization process would have required between 12.47 to 18.7 months to complete. This meaningful amount of time highlights one of the significant advantages of using the surrogate model regarding the computation time required to complete the optimization process.
In Figure 9, the evolution of the population through generations of the GA is shown, where each dot represents an individual or candidate solution and each color represents a different generation of the algorithm execution. It is clear that during the first generations the population is more spread; this happens because at the beginning the algorithm is doing more exploration on the search space, and this is illustrated by the blue, red, and pink dots on Figure 9, which are more separate from each other. However, from generation 20 onwards the individuals start concentrating at some local optima near the circled region on Figure 9 (green, cyan, and dark red dots), where finally a global optima is found at the last generation (yellow dots).

Optimized Design Validation

The CAE model evaluates the designs in Table 11 to re-estimate their performance in terms of C p , and then they are compared with the estimation of the surrogate model. Figure 10 shows the comparison between the C p curves estimated by the RFR surrogate model and the curves calculated by the CAE model, corresponding to the optimized designs in Table 11, where a good correspondence between the general shape of the curves is observed. However, in all cases, the surrogate model underestimates the value of Cp for all T S R points more significant than 0.1 . Specifically, Table 12 shows a comparison between the maximum C p values estimated by the RFR model and those calculated by the CAE model, and the difference or error between them. Finally, notice that the absolute error does not exceed 0.008 ; considering that C p is measured in a range from 0 to 100%, it is equivalent to a margin of error of less than 1%.
Table 13 shows the MSE and R 2 metrics to measure the performance of the RFR model in the region of the optimized models. It is observed that the value of R 2 remains in a range between 0.80 and 0.95 , which indicates that the regression model adjusted by the RFR algorithm has a reasonably acceptable performance in the region of the search space that corresponds to the optimal design. Since regression models tend to fail precisely at critical points in the search space, such as where the optimal design is found, in our case, the RFR model’s acceptable performance in this region can be considered as a further test of the generality of the fitted regression model.
From the same Figure 10 and Table 12, it is observed that the design with the best overall performance in terms of C p is the one corresponding to the design delivered by the GA algorithm, which has a maximum C p of 0.1296 , while the design delivered by the ABC algorithm reaches a maximum C p of 0.1264 and the design delivered by the PSO algorithm reaches a maximum C p of 0.127 , all at a TSR of 0.6 , as calculated with the CAE model.
Finally, Figure 11 shows a comparison between the performance of the optimized design using the GA algorithm and the design with the best performance found during the DOE, which reached a maximum C p of 0.1266 at a T S R of 0.6 with a design of θ = 40 , O r = 0.10 , and O A = 200 mm. In this Figure, observe that the optimized design using the GA algorithm has superior performance to the best design found during the DOE throughout all the T S R points. In particular: (1) there is an increase in C p of up to 9.49% at a T S R of 0.5, (2) an increase of up to 21.78% at a T S R of 0.8 , and (3) an increase of 2.36% in the maximum C p at a T S R of 0.6.

5. Discussion

5.1. Optimized Geometry Analysis

The optimized geometry of the wind turbine blade, as can be seen in Figure 12a–d, obtains the following results: 1. it favors the concentration of the airflow directly towards the tips of the blades; 2. it increases the pressure that is exerted on the tips, which in turn helps to increase the torque exerted on them; and 3. the pressure lines exerted on the blades are shown in the instants of time when the torque is more outstanding.
In the same way: (1) The overlap between blades is kept at an intermediate value. This value indicates that the redirection of flow from the forward blade to the return blade through the overlap between blades is a vital characteristic to reduce the negative effect of the return blade; (2) overlap should not be too wide so as not to cause air to escape freely through that space. This phenomenon is illustrated in Figure 13a–d, where it is observed that the wind flows through the overlap between blades with a speed of up to 4 m/s and that same wind flow runs through the entire concave surface of the return blade, providing it with an extra boost. We provide all necessary material to reproduce these results (https://tinyurl.com/68sn3ftc (accessed on 26 December 2021)).

5.2. Comparison with the State of the Art

Due to the different approaches and methodologies followed by different studies over the years on the study of Savonius VAWT, it is complicated to establish a direct comparison between previous works and the present work. Specifically, such comparison is difficult because of the variety of blade profiles present in the state of the art and the different rotor dimensions considered for their prototypes, as well as the wind speeds considered on their tests. All these factors have been shown to have a strong impact on the final results, complicating the comparison task. Therefore, a fair comparison must consider works with similar features on the Savonius blade profile, the rotor dimensions, and the flow wind speed. The most suitable work complying with these characteristics is the one developed by Alom et al. on [30], and a comparison between this work and the present work is presented below.
The optimized design of this work reaches a maximum C p of 0.1296 at T S R = 0.6 ; this is a marginally better performance than observed in the state of the art [30]. Alom et al., through a trial-and-error optimization process, report a maximum C p of 0.1288 at a T S R = 0.8 for a Savonius wind turbine with a semi-elliptical profile, as estimated by their 3D computational model for the wind turbine. However, the performance of the design obtained in this work using metaheuristic optimization algorithms is below to that obtained by [30] through experimental tests in a wind tunnel, where they report a maximum C p of 0.134 for their Savonius wind turbine with a semi-elliptical profile. However, it is essential to note the tendency of underestimating the C p values concerning the experimental measurements reported in [30] that involves the CAE 3D model built in this work. Therefore, it is necessary to validate the results of this work through experimental tests to determine with certainty to what degree an improvement in the performance of the wind turbine was achieved or not, concerning that reported in state of the art. This experimental validation is proposed below, along with some other considerations only as future work.

6. Conclusions and Future Work

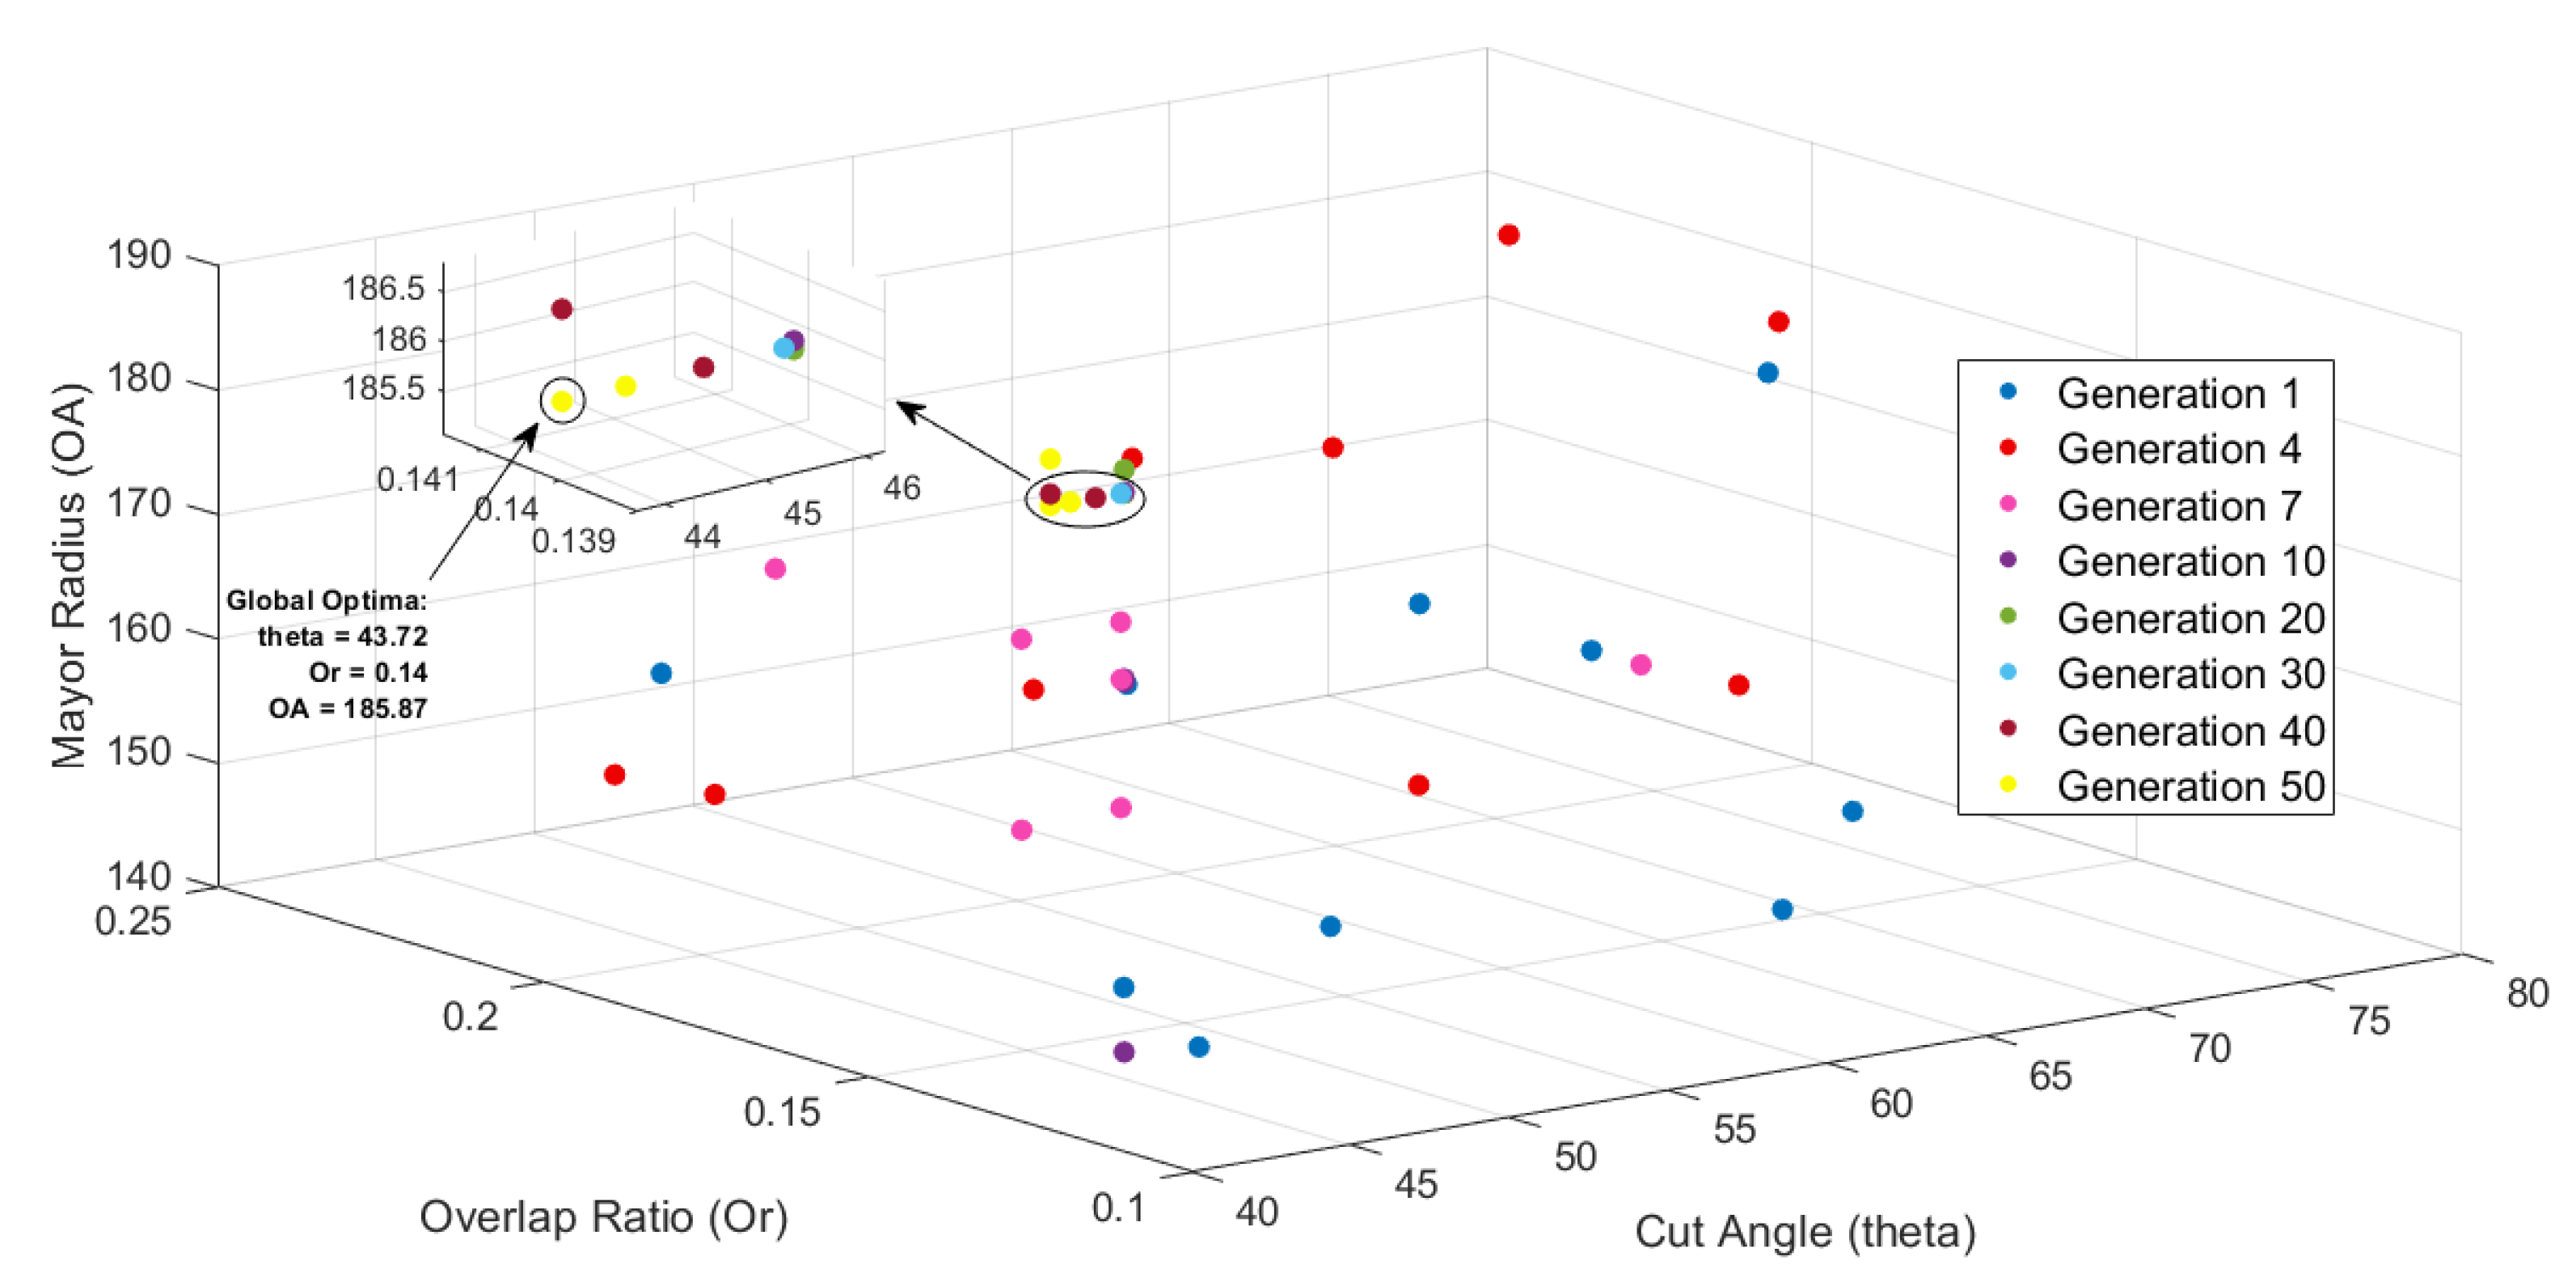
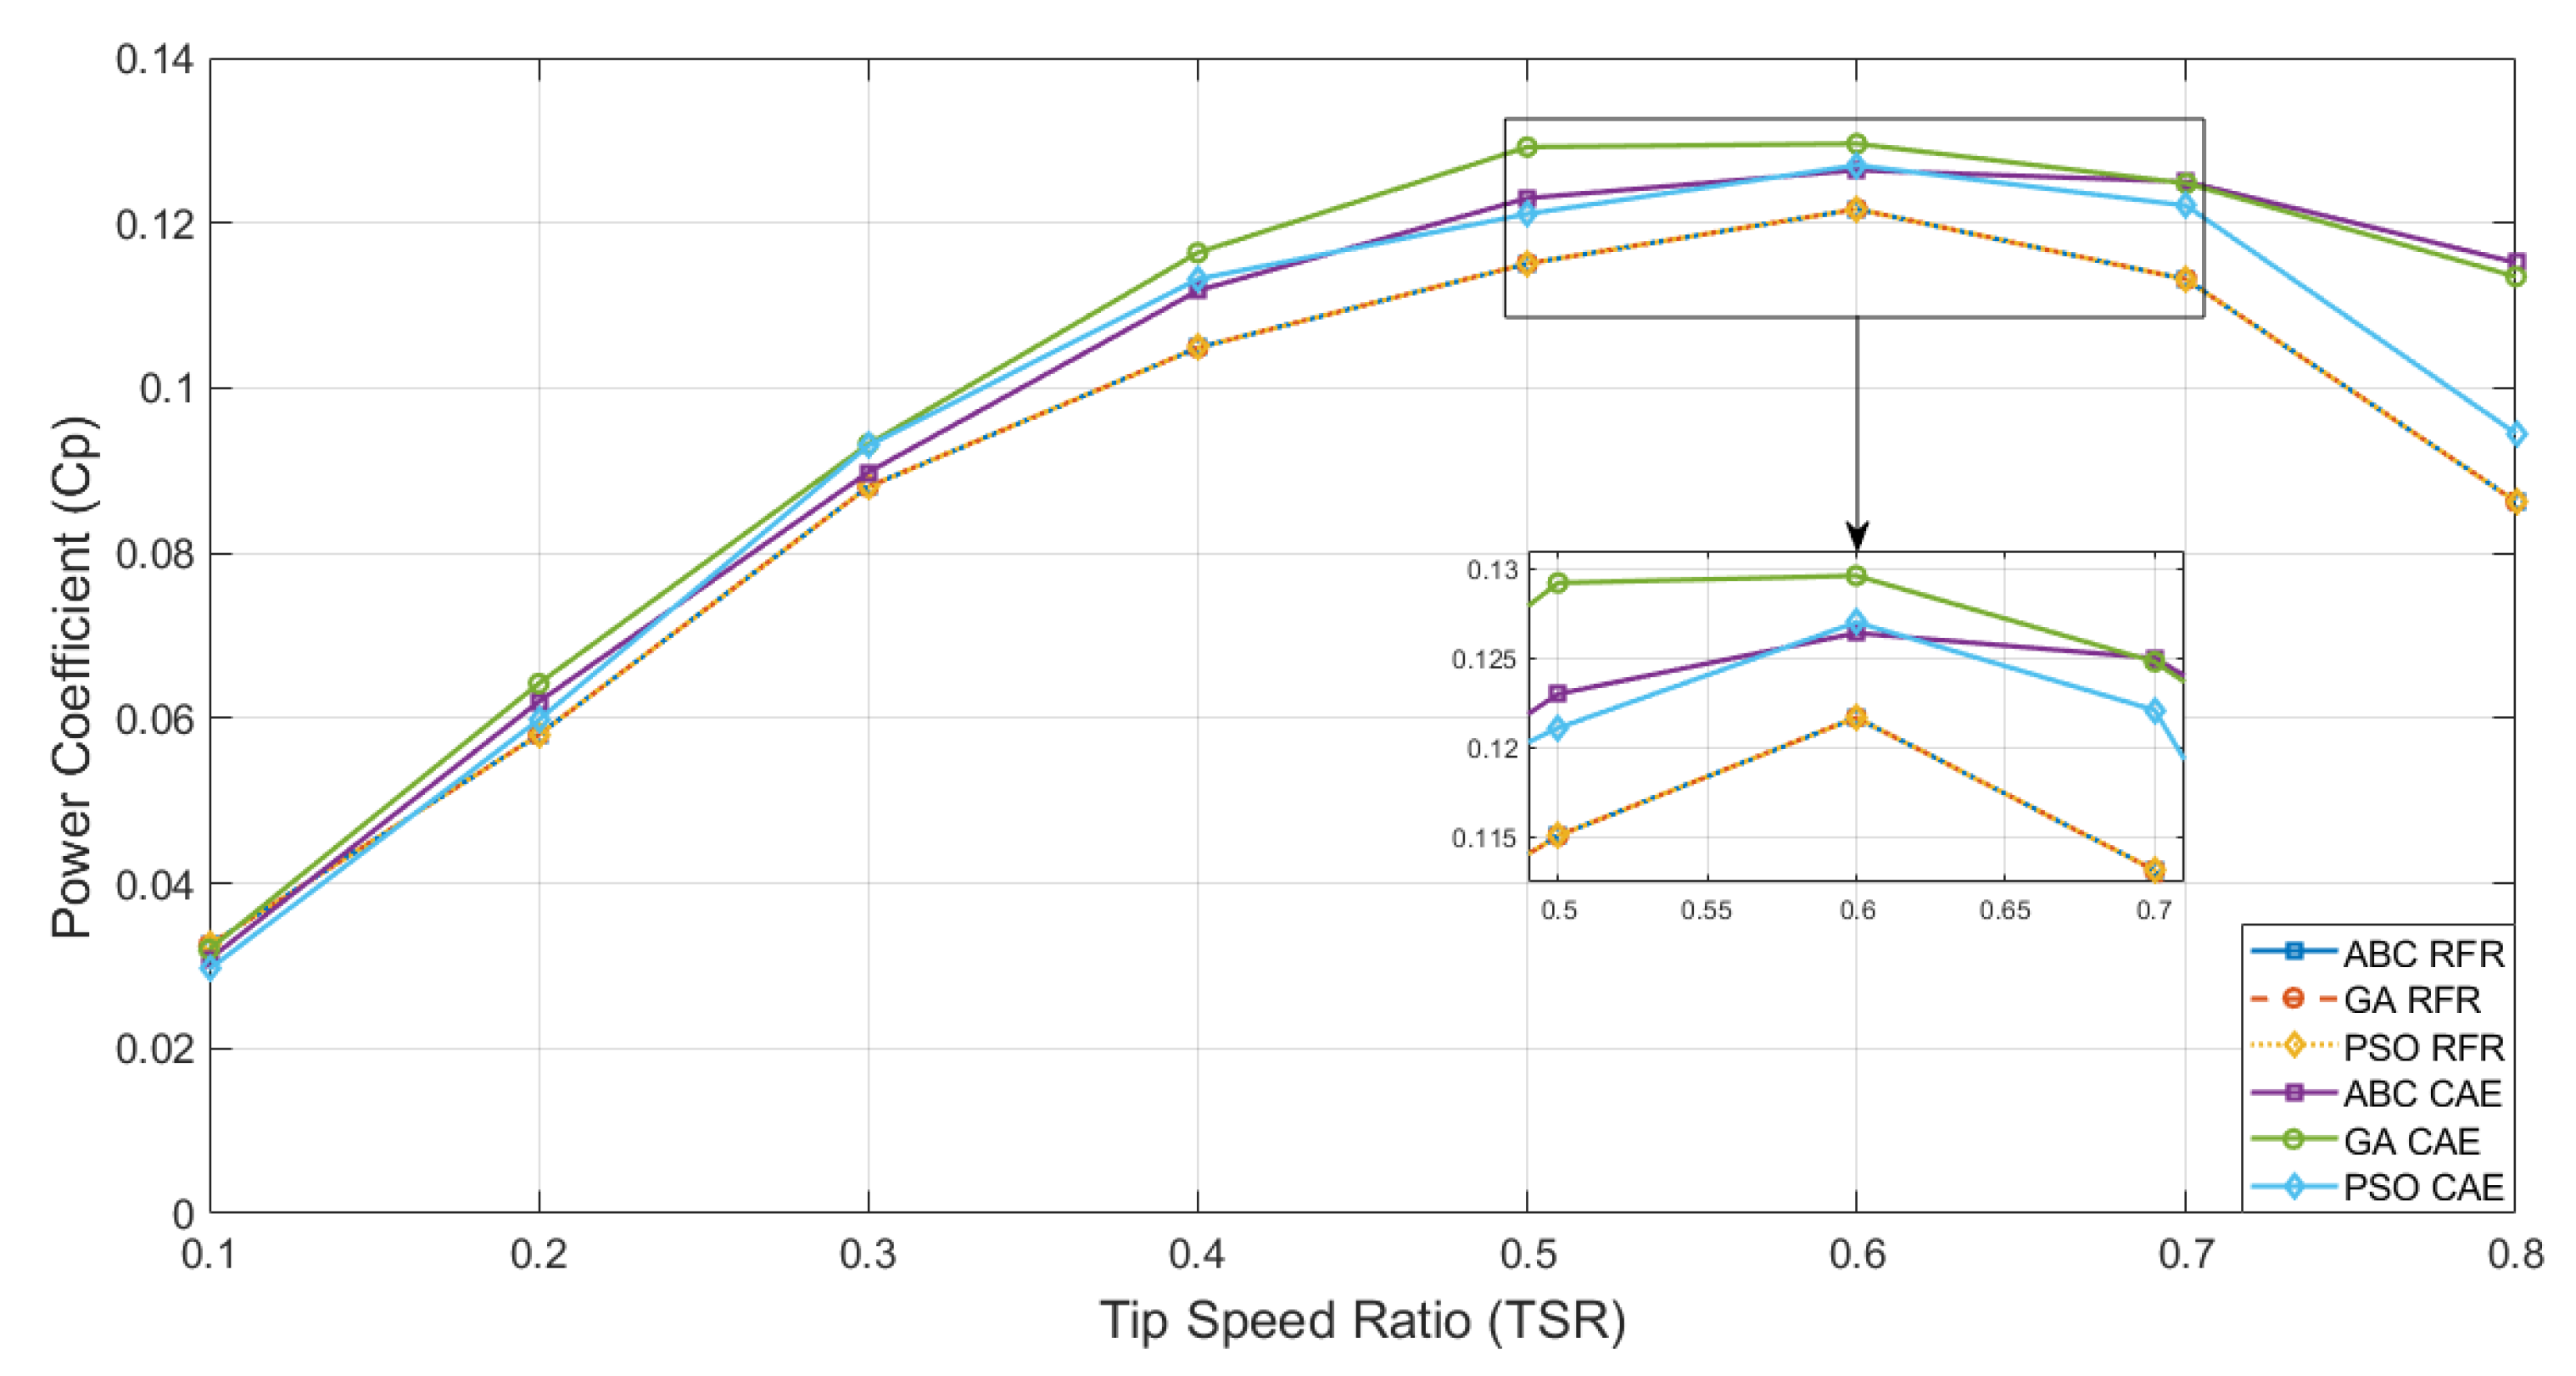
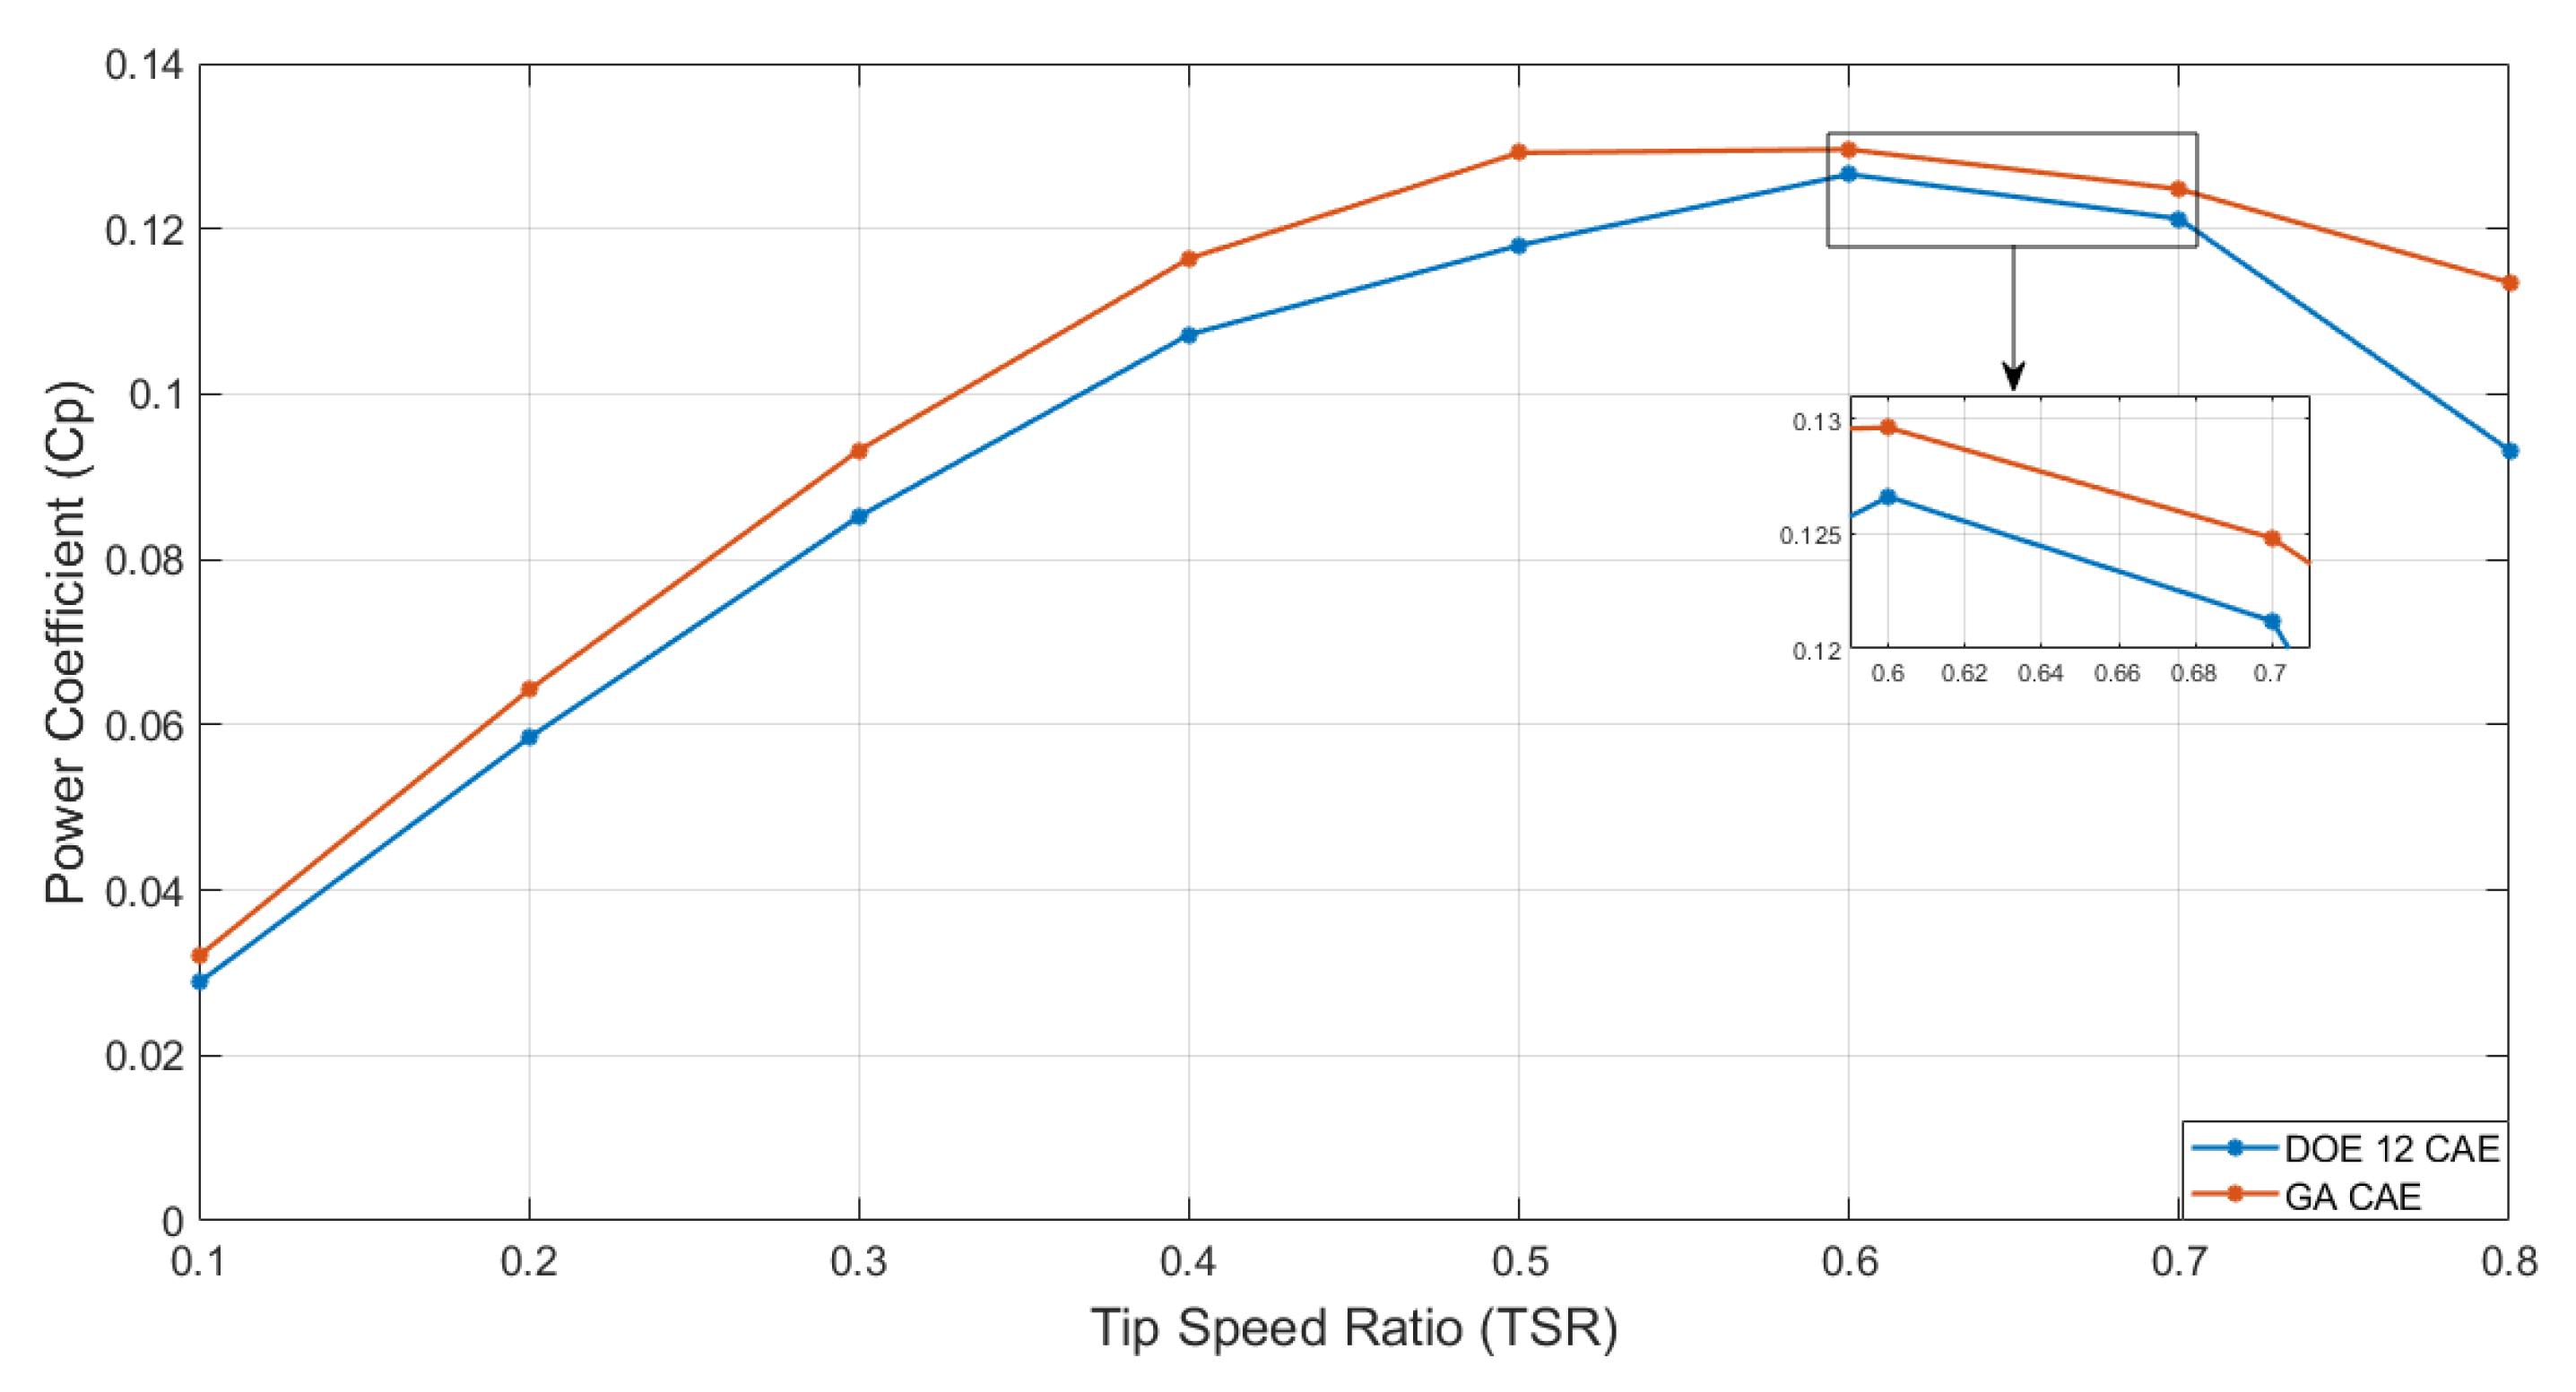
The design of a Savonius wind turbine was optimized through a GA. This design obtained improved performance in C p , showing an increase of 21.78% with T S R = 0.8 and up to 2.36% in the maximum C p with T S R = 0.6 . However, the optimal design resulting from this work was not superior to that found in the state-of-the-art Savonius wind turbines with the same profile.
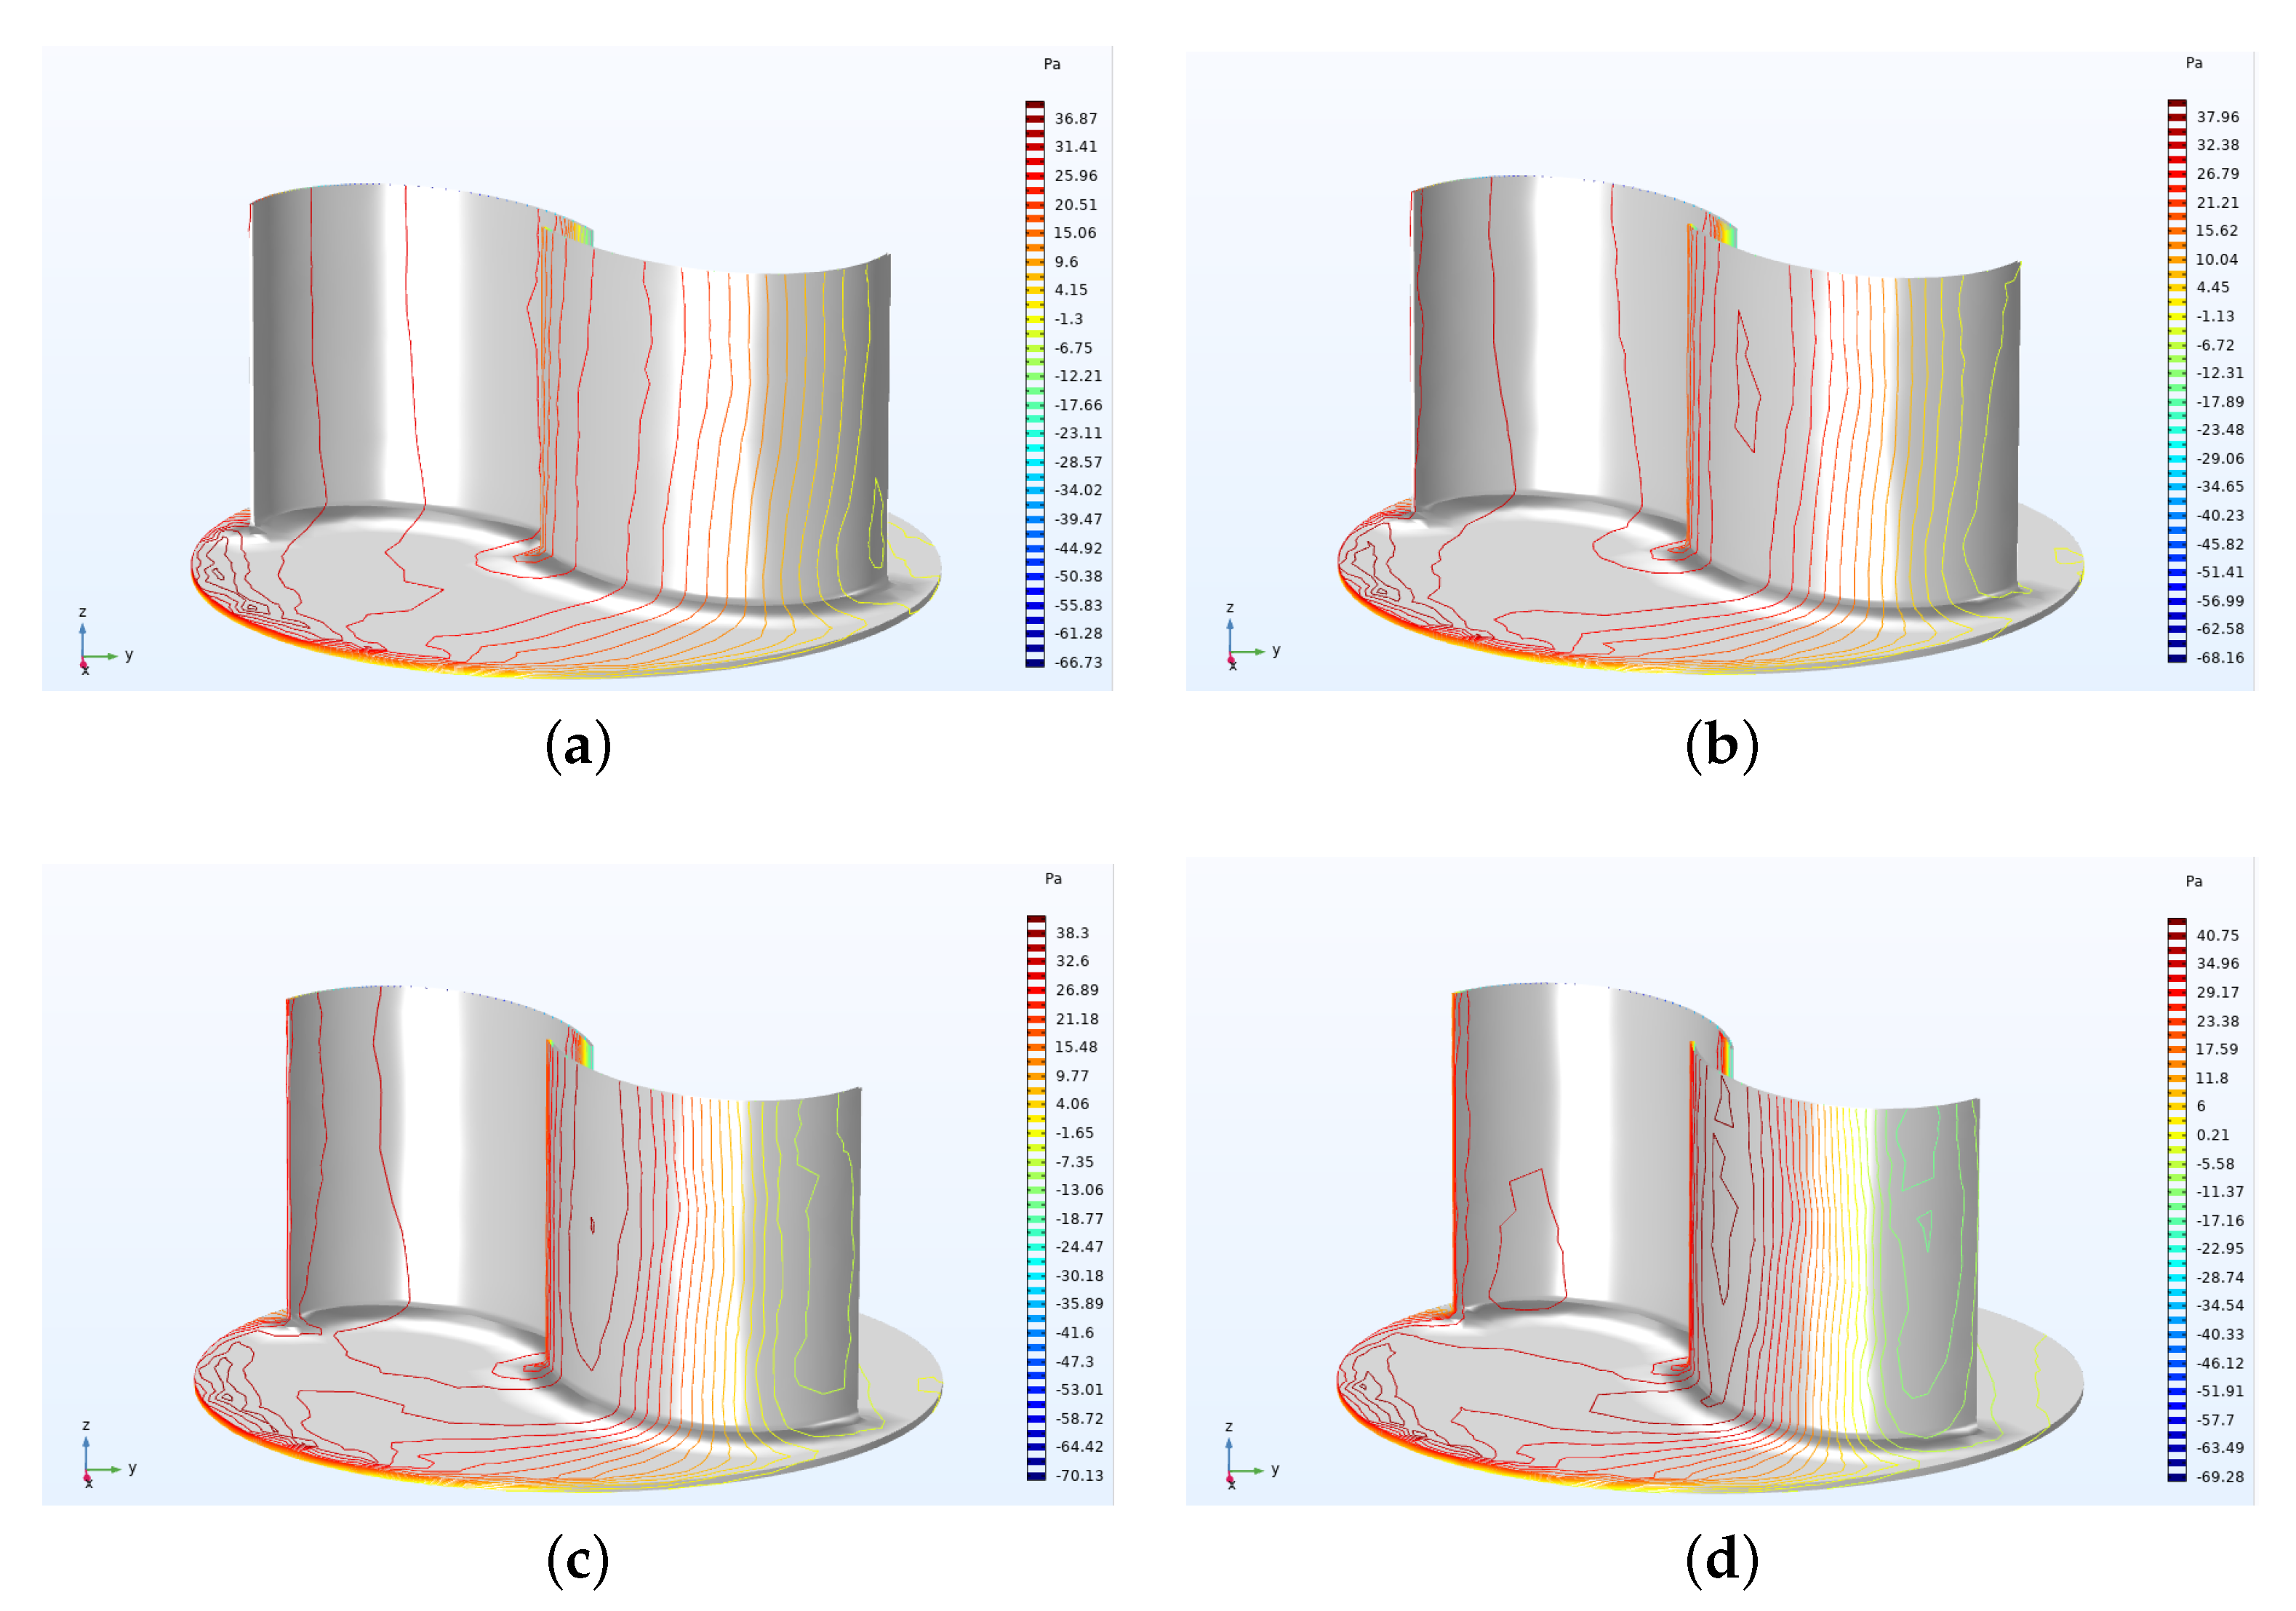
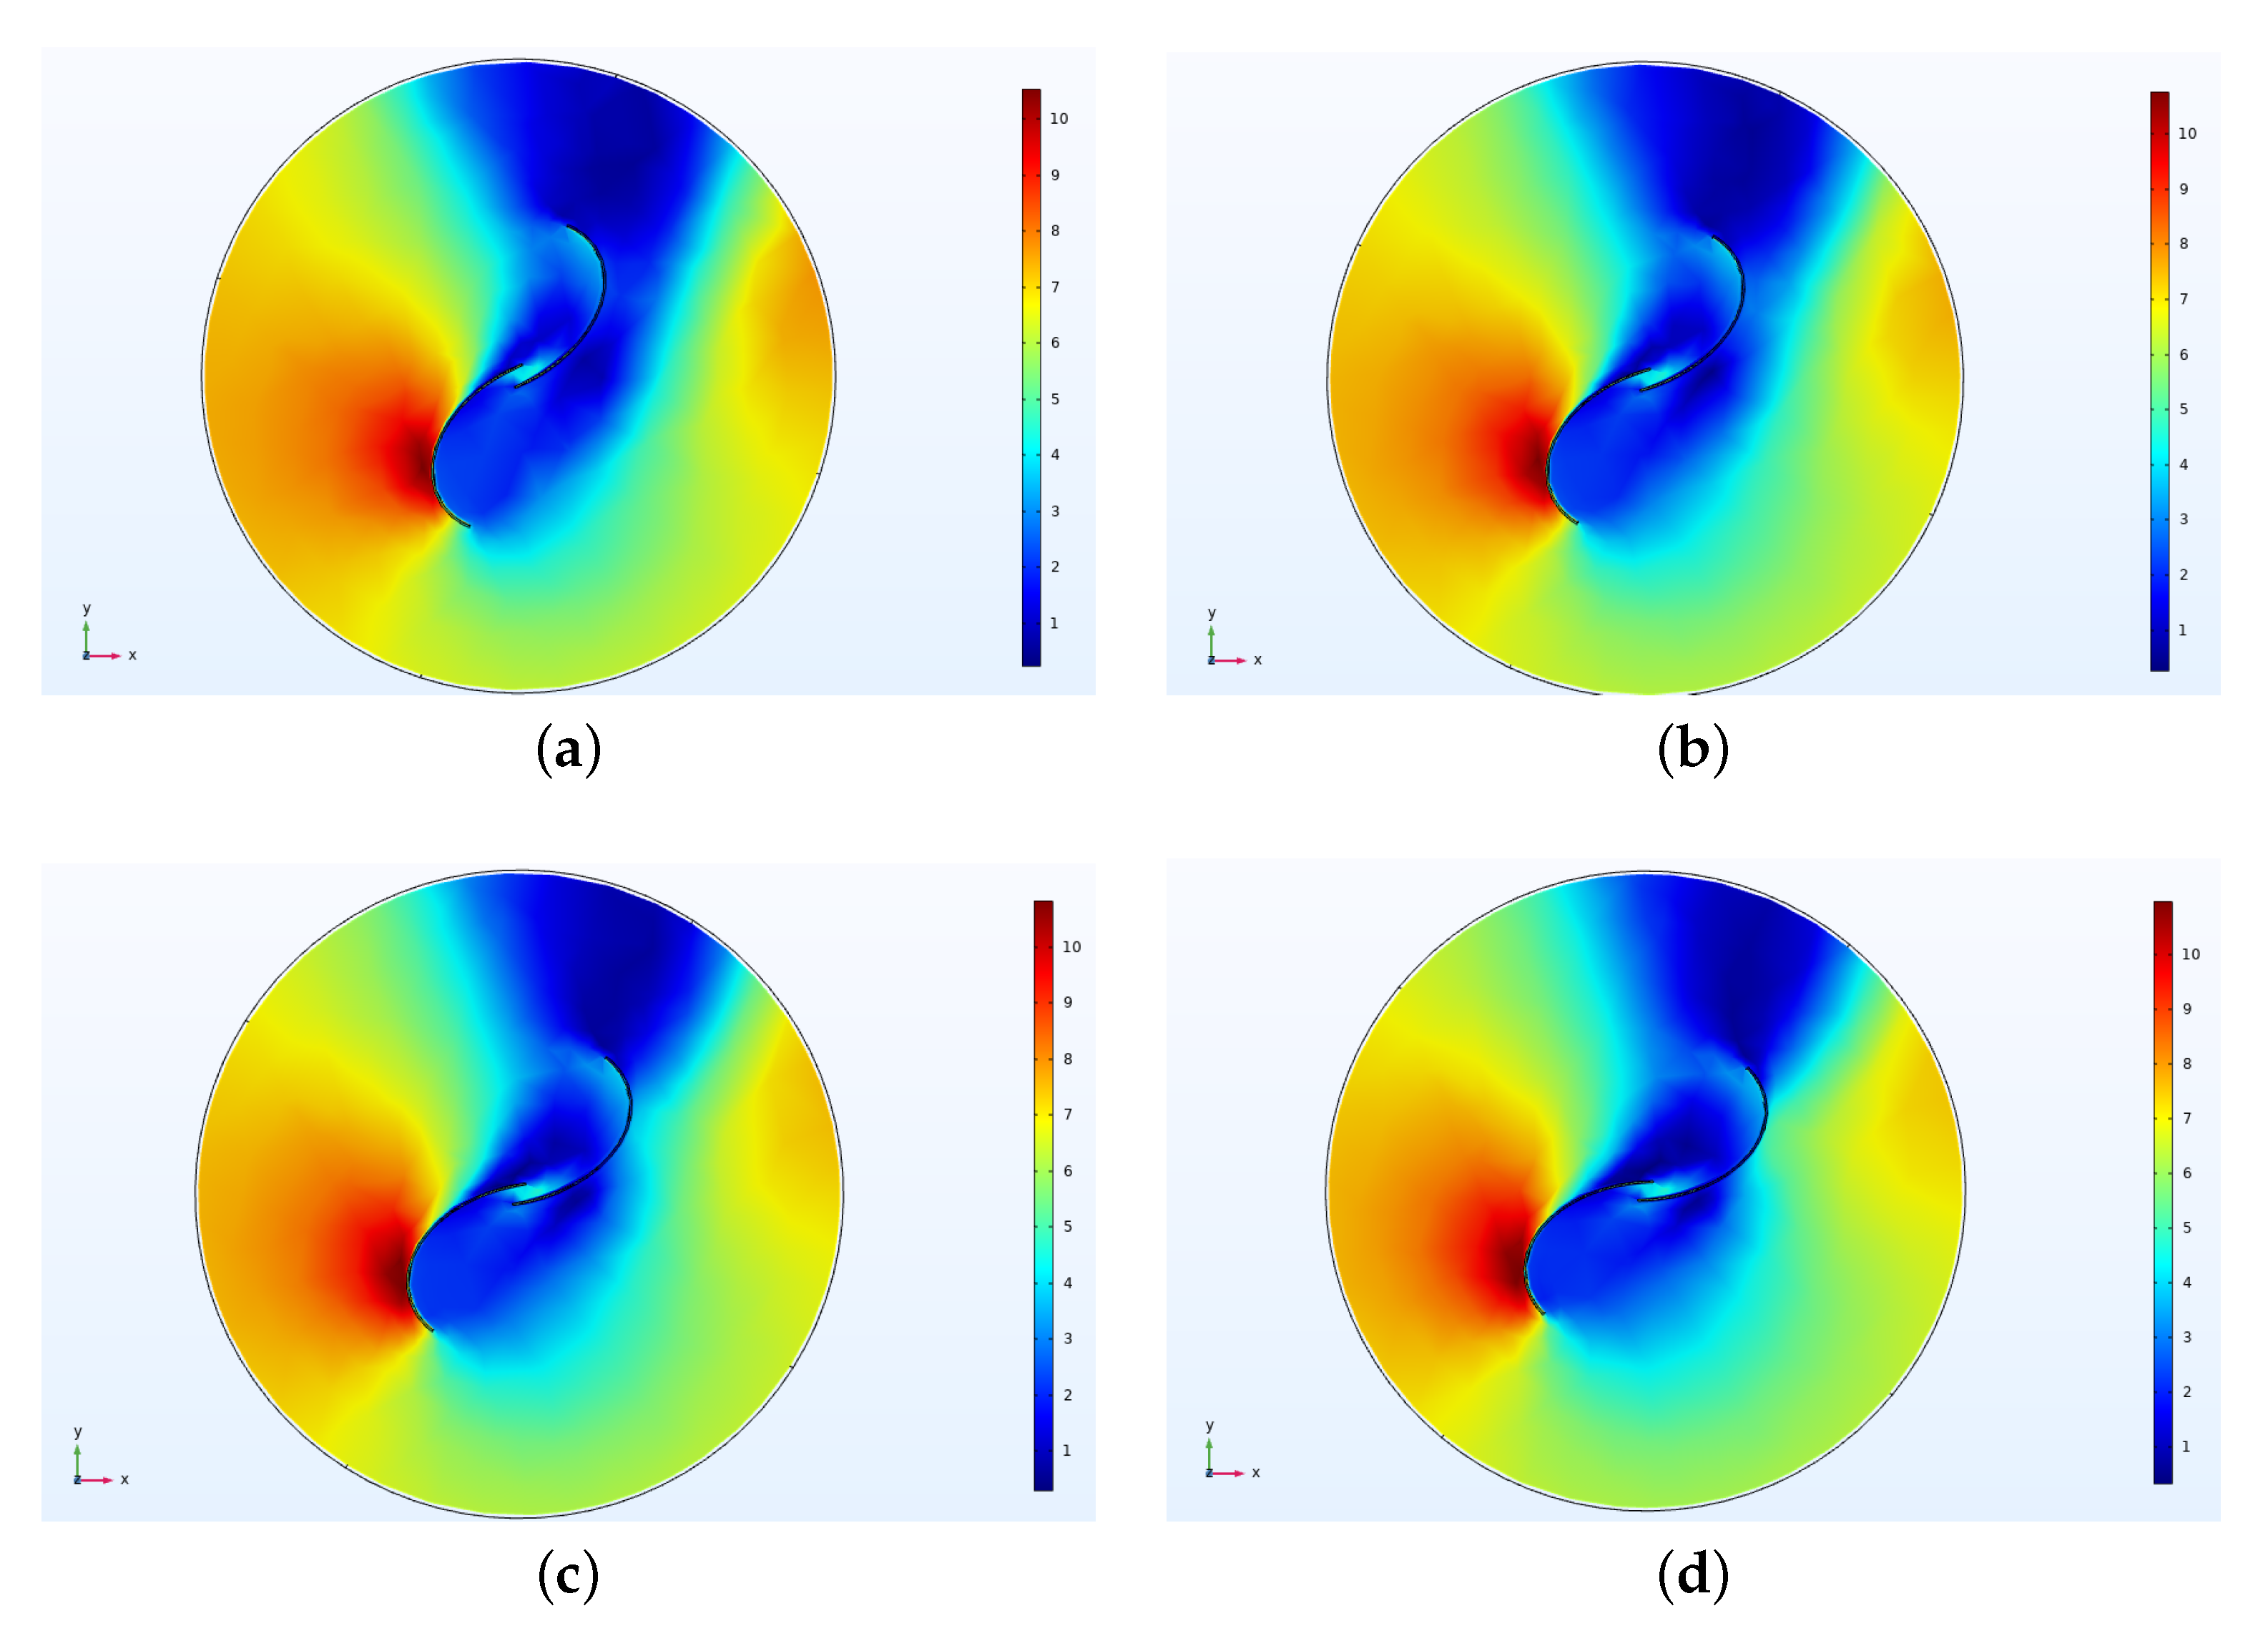
From the optimized geometry analysis, it is concluded that Savonius VAWT has better performance with blade profiles, which tend to concentrate the wind flow at the tips of the blade, exerting more pressure and, therefore, generating more torque on the blades. For this to be accomplished, the most relevant parameter is the cut angle, which must keep values between 40 and 50 (see Figure 9). Another relevant feature of the optimized blades is the overlap region between blades, which allow the wind to flow all along the concave side of the returning blade and, therefore, reduce the negative torque exerted by such blade. From Figure 9, it is observed that the overlap ratio should be kept at values between 0.14 and 0.15.
These results are valid for the operating conditions considered in this work, i.e, a wind speed of 6 m/s; a tip speed ratio from 0.1 to 0.8 ; and a Savonius VAWT with the following dimensions: diameter = 0.5 m and height = 0.5 m. Any change to these main conditions may yield slightly different final results on Savonius VAWT performance.
As future work, we plan to: (1) incorporate a turbulence model into the computational model of the wind turbine in order to capture the interactions of turbulent fluids inside the wind turbine and thus improve the accuracy of the model, (2) design a more extensive DOE to collect a more significant amount of data representing a more representative sample of the problem search space, (3) fit a new surrogate model with the extended data set to obtain a more accurate model and possibly free of local optimum, and (4) build and implement a test bench to test the optimized Savonius wind turbine prototype to measure and practically validate its performance.

Author Contributions

Conceptualization, methodology, M.A.M.-A. and C.A.D.; investigation and resources, M.A.M.-A., C.A.D., H.C. and E.I.-O.; software, visualization, and data curation, E.I.-O.; validation H.C.; formal analysis, M.A.M.-A., C.A.D. and H.C.; writing–original draft preparation, M.A.M.-A., E.I.-O. and H.C.; writing–review and editing, H.C., C.A.D. and M.A.M.-A.; supervision, project administration and funding acquisition, M.A.M.-A. All authors have read and agreed to the published version of the manuscript.

Funding

This work has been possible thanks to the support of the Mexican government through the FORDECYT-PRONACES program of Consejo Nacional de Ciencia y Tecnología (CONACYT) under grant APN2017 – 5241; the SIP-IPN research grants SIP 2083, SIP 20210169, and SIP 20210189; and IPN-COFAA and IPN-EDI.

Institutional Review Board Statement

Not applicable.

Informed Consent Statement

Not applicable.

Data Availability Statement

The authors are committed to providing access to all the necessary information so that readers can fully reproduce the results presented in this work. For this, all the necessary information is available in the following repository at https://tinyurl.com/68sn3ftc (accessed on 26 December 2021).

Conflicts of Interest

The authors declare no conflict of interest.

References

  1. Riegler, H. HAWT versus VAWT: Small VAWTs find a clear niche. Refocus 2003, 4, 44–46. [Google Scholar]
  2. Shankar, P.N. Development of vertical axis wind turbines. Proc. Indian Acad. Sci. Sect. C Eng. Sci. 1979, 2, 49–66. [Google Scholar]
  3. Akwa, J.V.; Vielmo, H.A.; Petry, A.P. A review on the performance of Savonius wind turbines. Renew. Sustain. Energy Rev. 2012, 16, 3054–3064. [Google Scholar] [CrossRef]
  4. Mohamed, M.H.; Janiga, G.; Pap, E.; Thévenin, D. Optimization of Savonius turbines using an obstacle shielding the returning blade. Renew. Energy 2010, 35, 2618–2626. [Google Scholar] [CrossRef]
  5. Schaffarczyk, A.P. Introduction to Wind Turbine Aerodynamics; Springer: Berlin/Heidelberg, Germany, 2014. [Google Scholar]
  6. Alom, N.; Saha, U.K. Four decades of research into the augmentation techniques of Savonius wind turbine rotor. J. Energy Resour. Technol. 2018, 140, 050801. [Google Scholar] [CrossRef]
  7. Alom, N.; Saha, U.K. Evolution and progress in the development of Savonius wind turbine rotor blade profiles and shapes. J. Sol. Energy Eng. 2019, 141, 030801. [Google Scholar] [CrossRef]
  8. Altmimi, A.I.; Alaskari, M.; Abdullah, O.I.; Alhamadani, A.; Sherza, J.S. Design and Optimization of Vertical Axis Wind Turbines Using QBlade. Appl. Syst. Innov. 2021, 4, 74. [Google Scholar] [CrossRef]
  9. Zhang, B.; Song, B.; Mao, Z.; Tian, W.; Li, B.; Li, B. A novel parametric modeling method and optimal design for Savonius wind turbines. Energies 2017, 10, 301. [Google Scholar] [CrossRef] [Green Version]
  10. Lipian, M.; Czapski, P.; Obidowski, D. Fluid–Structure Interaction Numerical Analysis of a Small, Urban Wind Turbine Blade. Energies 2020, 13, 1832. [Google Scholar] [CrossRef]
  11. Divakaran, U.; Ramesh, A.; Mohammad, A.; Velamati, R.K. Effect of helix angle on the performance of Helical Vertical axis wind turbine. Energies 2021, 14, 393. [Google Scholar] [CrossRef]
  12. Fanel Dorel, S.; Adrian Mihai, G.; Nicusor, D. Review of Specific Performance Parameters of Vertical Wind Turbine Rotors Based on the Savonius Type. Energies 2021, 14, 1962. [Google Scholar] [CrossRef]
  13. Rajpar, A.H.; Ali, I.; Eladwi, A.E.; Bashir, M.B.A. Recent Development in the Design of Wind Deflectors for Vertical Axis Wind Turbine: A Review. Energies 2021, 14, 5140. [Google Scholar] [CrossRef]
  14. Ranjbar, M.H.; Rafiei, B.; Nasrazadani, S.A.; Gharali, K.; Soltani, M.; Al-Haq, A.; Nathwani, J. Power Enhancement of a Vertical Axis Wind Turbine Equipped with an Improved Duct. Energies 2021, 14, 5780. [Google Scholar] [CrossRef]
  15. Alexander, A.J.; Holownia, B.P. Wind tunnel tests on a Savonius rotor. J. Wind Eng. Ind. Aerodyn. 1978, 3, 343–351. [Google Scholar] [CrossRef]
  16. Kamoji, M.A.; Kedare, S.B.; Prabhu, S.V. Experimental investigations on single stage modified Savonius rotor. Appl. Energy 2009, 86, 1064–1073. [Google Scholar] [CrossRef]
  17. Wenehenubun, F.; Saputra, A.; Sutanto, H. An experimental study on the performance of Savonius wind turbines related with the number of blades. Energy Procedia 2015, 68, 297–304. [Google Scholar] [CrossRef] [Green Version]
  18. Blackwell, B.F.; Feltz, L.V.; Sheldahl, R.E. Wind Tunnel Performance Data for Two-and Three-Bucket Savonius Rotors; Sandia Laboratories: Albuquerque, NM, USA, 1977. [Google Scholar]
  19. Saha, U.K.; Thotla, S.; Maity, D. Optimum design configuration of Savonius rotor through wind tunnel experiments. J. Wind Eng. Ind. Aerodyn. 2008, 96, 1359–1375. [Google Scholar] [CrossRef]
  20. Roy, S.; Mukherjee, P.; Saha, U.K. Aerodynamic performance evaluation of a novel Savonius-style wind turbine under an oriented jet. In Proceedings of the ASME 2014 Gas Turbine India Conference, New Delhi, India, 15–17 December 2014. [Google Scholar]
  21. Roy, S.; Saha, U.K. Investigations on the effect of aspect ratio into the performance of Savonius rotors. In Proceedings of the ASME 2013 Gas Turbine India Conference, Bangalore, Karnataka, India, 5–6 December 2013. [Google Scholar]
  22. Roy, S. Aerodynamic Performance Evaluation of a Novel Savonius-Style Wind Turbine through Unsteady Simulations and Wind Tunnel Experiments. Ph.D. Thesis, Indian Institute of Technology Guwahati, Guwahati, Assam, India, 2014. [Google Scholar]
  23. Roy, S.; Saha, U.K. Wind tunnel experiments of a newly developed two-bladed Savonius-style wind turbine. Appl. Energy 2015, 137, 117–125. [Google Scholar] [CrossRef]
  24. Alom, N.; Saha, U.K. Influence of blade profiles on Savonius rotor performance: Numerical simulation and experimental validation. Energy Convers. Manag. 2019, 186, 267–277. [Google Scholar] [CrossRef]
  25. Hosseini, A.; Goudarzi, N. Design and CFD study of a hybrid vertical-axis wind turbine by employing a combined Bach-type and H-Darrieus rotor systems. Energy Convers. Manag. 2019, 189, 49–59. [Google Scholar] [CrossRef]
  26. Kacprzak, K.; Liskiewicz, G.; Sobczak, K. Numerical investigation of conventional and modified Savonius wind turbines. Renew. Energy 2013, 60, 578–585. [Google Scholar] [CrossRef]
  27. Kacprzak, K.; Sobczak, K. Numerical analysis of the flow around the Bach-type Savonius wind turbine. J. Physics Conf. Ser. 2014, 530, 012063. [Google Scholar] [CrossRef] [Green Version]
  28. Ramadan, A.; Yousef, K.; Said, M.; Mohamed, M.H. Optimization and experimental validation of a drag vertical axis wind turbine. Energy 2018, 151, 839–853. [Google Scholar] [CrossRef]
  29. Alom, N.; Kolaparthi, S.C.; Gadde, S.C.; Saha, U.K. Aerodynamic design optimization of elliptical-bladed Savonius-style wind turbine by numerical simulations. In Proceedings of the ASME 2016 35th International Conference on Ocean, Offshore and Arctic Engineering, Busan, Korea, 19–24 June 2016. [Google Scholar]
  30. Alom, N.; Saha, U.K. Performance evaluation of vent-augmented elliptical-bladed Savonius rotors by numerical simulation and wind tunnel experiments. Energy 2018, 152, 277–290. [Google Scholar] [CrossRef]
  31. García, D.; Pineda, J.; Paz, S. Modelo de Generador eólico Vertical Usando Redes Neuronales. Bachelor’s Thesis, Escuela Superior de Cómputo IPN, Ciudad de Mexico, Mexico, 2019. [Google Scholar]
  32. Moreno, T.; Juan, C. Multi-Objective Optimization of a Vertical Axis Wind Turbine Rotor for Self-Supply Applying Metaheuristics. Master’s Thesis, Centro de Investigación en Computación IPN, Ciudad de Mexico, Mexico, 2019. [Google Scholar]
  33. Mohammadi, M.; Lakestani, M.; Mohamed, M.H. Intelligent parameter optimization of Savonius rotor using artificial neural network and genetic algorithm. Energy 2018, 143, 56–68. [Google Scholar] [CrossRef]
  34. Kamoji, M.A.; Kedare, S.B.; Prabhu, S.V. Performance tests on helical Savonius rotors. Renew. Energy 2009, 34, 521–529. [Google Scholar] [CrossRef]
Figure 1. Proposed methodology.
Energies 15 00233 g001
Figure 2. Geometric aspects of the Savonius wind turbine, (a) Sectional cut of an ellipse, (b) Savonius rotor geometry.
Energies 15 00233 g002
Figure 3. 2D view of the computational domain of the CAE model of the Savonius VAWT.
Energies 15 00233 g003
Figure 4. Integration of computing platforms.
Energies 15 00233 g004
Figure 5. Surrogate model diagram.
Energies 15 00233 g005
Figure 6. Output values of the CAE model as a function of the number of mesh elements.
Energies 15 00233 g006
Figure 7. Comparison between data calculated using the CAE model and data collected experimentally.
Energies 15 00233 g007
Figure 8. C p curves estimated by the RFR model.
Energies 15 00233 g008
Figure 9. Evolution of population in genetic algorithm.
Energies 15 00233 g009
Figure 10. C p curves estimated by RFR and CAE.
Energies 15 00233 g010
Figure 11. Performance comparison between GA-optimized design and best performance achieved during DOE.
Energies 15 00233 g011
Figure 12. Pressure lines ( P a ) on the lower half of the geometry of the GA-optimized Savonius wind turbine, (a) Instant pressure at t = 1.2217 , (b) Instant pressure at t = 1.2305 , (c) Instant pressure at t = 1.239 , (d) Instant pressure at t = 1.248 .
Energies 15 00233 g012
Figure 13. Wind speed (m/s) over the profile of the GA optimized Savonius wind turbine, (a) Instant speed at t = 1.2217 , (b) Instant speed at t = 1.2305 , (c) Instant speed at t = 1.239 , (d) Instant speed at t = 1.248 .
Energies 15 00233 g013
Table 1. Comparison of different VAWT Types.
VAWT TypeAdvantagesDisadvantages
Darrieus type
  • Independence of wind flow direction
  • Higher rated power coefficient
  • Tolerance to turbulence wind flow
  • Scalable to higher dimensions
  • Suitable to medium scale power generation
  • Higher cut-in speed
  • Higher rated wind speed
  • Poor self-starting capability
  • Complex geometry and construction
Savonius Semi-circular and semi-elliptical blade profiles
  • High self starting capability
  • Independence of wind flow direction
  • Low cut-in speed
  • Lower rated wind speed
  • Tolerance to turbulent wind flow
  • Simple geometry and construction
  • Suitable for small scale power generation
  • Lower rated power coefficient
  • Not suitable for larger-scale power generation
Savonius twisted blade profiles
  • High self-starting capability
  • Independence of wind flow direction
  • Low cut-in speed
  • Lower rated wind speed
  • Tolerance to turbulent wind flow
  • Suitable for small scale power generation
  • Lower rated power coefficient
  • More complex geometry and construction
  • Not suitable for larger scale power generation
Table 2. Design parameters of the Savonius wind turbine.
Design ParameterRestrictionUnits
Cutting angle40 ≤ θ ≤ 90
Overlap ratio0.1 ≤ O r ≤ 0.3
Major radius of the ellipse140 ≤ O A ≤ 200mm
Table 3. Constant parameters of the geometry of the Savonius wind turbine.
ParameterValueUnits
Rotor height (H)500mm
Rotor diameter (D)500mm
Caps diameter ( D o ) 1.1 × D mm
Distance to cut-off point ( O M ) 0.54 × O A mm
Table 4. Global parameters of the computational model in Comsol Multiphysics.
NameValueUnitDescription
V6m/sWind speed
T S R [0.1:0.1:0.8]-Characteristic speed
R0.25mRotor radius
N ( T S R V ) / R rad/sRotor angular velocity
Cutting angle θ °Cutting angle
Overlap O r -Overlap relationship
Major radius O A mmMajor radius of the ellipse
Table 5. Design parameter levels.
Design ParameterLevel 1Level 2Level 3Units
Cutting angle ( θ )406590
Overlap ratio ( O r )0.10.20.3
Major radius of the ellipse ( O A )140170200mm
Table 6. Selected hyperparameters for each machine learning algorithm.
AlgorithmSelected HyperparametersPerformance (MSE)
SVMkernel = linear; C = 0.01; gamma = 1 9.40 × 10 4
RFRmax_depth = None; max_features = log2; min_samples_leaf = 1; min_samples_split = 2, n_estimators = 1000 9.95 × 10 5
BRalpha_1 = 0.0001; alpha_2 = 1 × 10 7 ; lambda_1 = 1 × 10 7 ; lambda_2 = 0.0001 7.55 × 10 4
MLPactivation = tanh; hidden_layer_sizes = (30, 30) 6.82 × 10 4
Table 7. Selected hyperparameters for the ABC algorithm.
HyperparameterValue
Number of employed bees10
Number of Onlookers10
Selection methodRoulette
Number of steps150
Number of cycles100
Table 8. Selected hyperparameters for the GA algorithm.
HyperparameterValue
Number of individuals10
Encoding methodBinary
Selection methodTournament [2 Ind.]
Cross methodCrosses at 3 points
Mutation methodBinary [threshold = 0.01]
Number of iterations50
Table 9. Selected hyperparameters for the PSO algorithm.
HyperparameterValue
Number of individuals81
Cognitive constant1.3
Social constant0.7
Inertia range [ 0 , 1.2 ]
Decay of inertia0.95 every 10 Iter.
Number of iterations40
Table 10. Performance of the surrogate models of the wind turbine based on the coefficient of determination.
Algorithm R 2 in Training R 2 in Testing
SVM 4.19 × 10 30 0.0
RFR 0.973 0.981
BR 6.03 6.73
MLP 9.61 13.63
Table 11. Design parameters delivered by each optimization algorithm at the end of the process.
AlgorithmDesign Parameters [ θ , O r , OA , TSR ] Estimated Maximum Value of  C p
ABC [ 47.077 , 0.135 , 192.96 , 0.6 ] 0.1216873
GA [ 43.72 , 0.14 , 185.87 , 0.59 ] 0.121364
PSO [ 40.00005 , 0.1000001 , 199.999 , 0.599 ] 0.1216873
Table 12. Maximum Cp values estimated by the RFR model and calculated by the CAE model for the optimized designs with TSR = 0.6.
Optimized byMaximum C p (RFR)Maximum C p (CAE)Absolute Error in C p
ABC0.12160.12640.0048
GA0.12160.12960.008
PSO0.12160.12700.0054
Table 13. Error metrics for C p values of optimized designs.
Optimized byMSE R 2
ABC0.0001410.831
GA0.0001670.801
PSO 3.97 × 10 5 0.952
Publisher’s Note: MDPI stays neutral with regard to jurisdictional claims in published maps and institutional affiliations.

