Article

Identification of Metro-Bikeshare Transfer Trip Chains by Matching Docked Bikeshare and Metro Smartcards

1
School of Civil and Transportation Engineering, Hebei University of Technology, Tianjin 300401, China
2
School of Architecture and the Built Environment, Royal Institute of Technology (KTH), 114 28 Stockholm, Sweden
3
School of Architecture and Art Design, Hebei University of Technology, Tianjin 300401, China
4
Department of Transport & Planning, Faculty of Civil Engineering and Geosciences, Delft University of Technology, Stevinweg 1, P.O. Box 5048, 2600 GA Delft, The Netherlands
*
Author to whom correspondence should be addressed.
Energies 2022, 15(1), 203; https://doi.org/10.3390/en15010203
Submission received: 15 November 2021 / Revised: 22 December 2021 / Accepted: 27 December 2021 / Published: 29 December 2021
(This article belongs to the Topic Sustainable Built Environment)

Abstract

:
Metro-bikeshare integration, an important way of improving the efficiency of public transportation, has grown rapidly during the last decades in many countries. However, most previous analysis of metro-bikeshare transfer trips were based on limited sample size and the number of recognized metro-bikeshare trips were not sufficient. The primary objective of this study is to derive a method to recognize metro-bikeshare transfer trips. The two data sources are provided by Nanjing Metro Company and Nanjing Public Bicycle Company over the same period from 9–29 March 2016. The identifying method includes three steps: (1) Matching Card Pairs (2) Filtering Card Pairs and (3) Identifying Card Pairs. The case study indicates that the Support Vector Classification (SVC) performs best with a high prediction accuracy of 95.9% using seamless smartcards. The identifying method is then used to recognize the transfer trips from other types of cards, resulting in 17,022 valid metro-bikeshare transfer trips made by 2948 travelers. Finally, travel patterns extracted from the two groups of identified transfer trips are analyzed comparatively. The method proposed presents new opportunities for analyzing metro-bikeshare transfer trip characteristics.

1. Introduction

Due to the heavy reliance on the automobile, several problems such as traffic congestion, air pollution, respiratory health issues and climate change have been caused around the world [1,2,3]. To reduce energy consumption and air pollution, the construction or extension of an existing metro system with sufficient capacity is often promoted [4]. However, the metro network cannot be too dense regarding the feeding of traffic demand, especially in the suburban areas of a city, due to the high construction costs and low service efficiency [5]. As a result, transit use is affected by the first mile/last mile problems [6], particularly by the access/egress distances between metro stations and trip origin/destination locations that are greater than that which travelers are typically willing to walk [7]. Therefore, an effective multimodal transfer system has received attention from transport policymakers and planners to increase the catchment of metro stations and attract more passengers [5]. As a feeder mode, cycling has a relatively faster speed than walking and is a more flexible and economical service than bus transit [8]. The combination of bikes and metro is considered as a competitive alternative to private cars and feeder buses, because of the seamless connections [9,10,11].
A marriage between bikeshare and metro offers an approach to sustainable transportation, a mode pursued by many countries. European countries such as The Netherlands, Denmark and Germany, have already integrated public transit with bikeshare as its feeder mode [12]. Fishman et al. and Martens et al. suggested that “improved public transport integration” is one of the most important developing trends in the bikeshare domain [13,14]. The bikeshare programs can reduce users’ travel time, increase the peak-hour capacity of the metro and enlarge the service area of metro transport, which will improve the efficiency of the metro and make it more attractive [15]. Combined with other public transportation, a bikeshare system attracts more cyclists and saves much time for travelers [16]. To understand such trip-chain behavior of the transfer users can improve the performance of metro–bikeshare integration.
The current bikeshare systems worldwide can be classified into two categories: docked bikeshare and dockless bikeshare [17]. Unlike the dockless bikeshare system [18,19], which allows users to find and use shared bikes through their smartphone APPs [20], docked bikeshare systems instead require users to rent the shared bikes from designated docking stations and then return them to available lockers in docking stations [21].
Nowadays, smartcards have been widely adopted in both metro and docked bikeshare systems across many cities worldwide. It is necessary to identify valid metro-bikeshare transfer trips from a massive amount of smartcard datasets for behavior analysis of metro–bikeshare integration. The metro–bikeshare trip-chain behavior can be derived from the information from three types of card, dedicated bikeshare cards, dedicated metro smart cards and seamless smartcards for bikeshare and metro. Dedicated bikeshare cards can only be used for public (docked) bikeshare systems. Dedicated metro smart cards can only be used for metro. Finally, seamless smartcards allow use of different transport modes, both shared bikes and the metro. Specifically, in this context there are two streams of such trip-chain information: a. transfer records of the same travelers using only seamless smartcards. b. transfer records of the same persons using different types of card. For the former, the valid transfer records can be easily identified from the seamless smart cards of the same identified IDs. Previous studies have utilized such information to reveal the travel patterns of such metro–bikeshare integration. There is also abundant information from the second data source [21,22]. However, to identify the transfer trip chain by matching the metro and bikeshare smartcards used by the same travelers is a challenging task. This work develops an identifying algorithm to meet such a challenge.
The main contribution of this research is that it develops a method to identify metro–bikeshare transfer trips from bikeshare dedicated bikeshare card data and metro smartcard data. Specifically, four types of conflict (personal attribute conflict, temporal conflict, spatial conflict and highest frequency) are proposed to filter out invalid metro–bikeshare card pairs. Secondly, five features (transfer time, transfer distance, transfer speed, the variance of transfer speed and frequency of card pair) are defined as the input features for matching metro–bikeshare trips. The experimental results and analysis presented in this study can serve as benchmarks for future studies with regard to metro–bikeshare integration. The algorithm can also work to integrate docked bikeshare trips with metro trips, and it can be extended to match the transfer trips with dockless bikeshare legs. Moreover, previous studies explored travel behavior on metro–bikeshare trips based on the survey data or the spatial relationship between shared bikes and the catchment of metro stations. This study can help fill the gap by recognizing metro–bikeshare trips for travel behavior analysis, and further informs planners of how to integrate a bikeshare system around metro station areas.
The rest of the paper is organized as follows. The next section reviews existing research on the recognition methods, travel characteristics of metro–bikeshare trips and use of classifier in metro and bikeshare area. Subsequently, the paper introduces the study area, data source, and the methodology used to recognize transfer trips from smartcard data, followed by the results and conclusion.

2. Literature Review

There is extensive literature on the integration of (regular) cycling and metro trips, covering topics such as travel patterns of bike–metro integrated trips [5,23], the accessibility of bike–metro [24,25], bike parking issues around metro stations [26] and bike–metro transfer demand prediction [27]. This literature review focuses on the integration of bikeshare with the metro, including recognition of metro–bikeshare transfer trips, and metro–bikeshare usage patterns.

2.1. Recognition of Metro–Bikeshare Transfer Trips

Previous studies have adopted a variety of methods to understand how bikeshare services interact with transit systems. A few studies focused on passengers who integrated bikeshare with metro and conducted surveys to explore passengers’ preferences for travel mode choices [28,29,30]. However, conducting surveys is costly and it is hard to get information on precise travel time, location and variation in trip records for multi-days [21]. Some studies used historical dockless bikeshare data and the spatial distributions of dockless shared bikes around metro stations to recognize metro–bikeshare transfer trips. Ji et al. explored the temporal and spatial usage patterns of dockless bikeshare around metro stations using dockless bikeshare trip data and metro station data [31]. If the origin/destination location of a dockless shared bike falls within the buffer area of 150 m around each metro station, then a transfer trip is expected to occur between dockless bikeshare and metro. Lin et al. analyzed the catchment areas of dockless shared bikes connecting metro stations using dockless trajectory data. They extracted the metro–bikeshare trips by tracing the bikeshare trips which start or end within a distance of 50 m around the metro station entrance [32]. Li et al. collected dockless data and adopted K-means clustering to analyze the travel patterns of dockless bikeshare systems around metro stations [33]. The metro–bikeshare trips were recognized if the dockless shared bikes are located within 100 m around the metro station. Wu et al. selected the dockless bikeshare trips within 100 m originated from any metro station entrance and measured the cycling destination accessibility of metro station areas [34]. Ni et al. compared the temporal–spatial distribution of two modes (dockless bikeshare and taxi) as first mile/last mile connectors to metros and found out that socio-demographic and built-environment factors impacted their usage [35]. Different thresholds were set for recognizing transfer trips for connecting metro networks,50 m for dockless bikeshare and 100 m for taxi, respectively. Xu et al. focused on the parking problem of dockless bikeshare around an urban metro system. They found that most of the dockless shared bikes were parked within a 300 m radius from the metro stations. Liu et al. found that 150 m is an acceptable transfer distance between bikeshare and metro and explored the spatiotemporal characteristics of bikeshare as a feeder mode to metro [10]. Recently, studies used historical trip data from both docked bikeshare and metro networks to recognize metro–bikeshare transfer trips. Ma et al. revealed the travel patterns of metro–bikeshare integration by isolating metro–bikeshare transfer trips from an integrated payment system in which users can use the same smart card to pay for both docked bikeshare and metro trips [19]. Song et al. developed a spatial-temporal framework to explore the potential competitive and complementary relationships between bikeshare and metro systems by using docked bikeshare and public transit historical trip data [36].

2.2. Usage Patterns of Metro–Bikeshare Transfer Trips

Numerous studies have been conducted to investigate the analysis of metro–bikeshare integration behavior. Using a nested logit model, Ji et al. found that female travelers, the elderly, and low-income commuters were less likely to use bikeshare integrated with the metro [28]. In addition, commuters with bike theft experience are more likely to use bikeshare integrated with metro. Yang et al. reported that male commuters who have experienced unpleasant trips were more likely to be attracted to metro–bikeshare integration [29]. Audikana et al. reported that long-trip-distance commuters were more likely to use bikeshare as a complementary mode to public transit [37]. Ma et al. analyzed the usage pattern of metro-bikeshare from four aspects: transfer time, date, space and access/egress modes [21]. They found that metro-bikeshare travel patterns vary across different user groups. Ji et al. found that the access/egress distance for metro stations had a negative association with metro–bikeshare integration [22]. Bachand-Marleau et al. reported that bikeshare users with a regular subscription (i.e., monthly or annual membership) were more inclined to integrate bikeshare with metro [38]. Population density within the metro station’s catchment area is negatively associated with passenger intention to use bikeshare when they exit from metro stations [9,39]. A few studies found a strong positive association between bikeshare usage and proximity distance to train and metro stations [40,41], especially near the interchange stations and terminal stations on metro lines [39]. A high density of bikeshare stations near passengers’ homes encouraged metro–bikeshare integration [42]. Bikeshare was found to be more closely connected with metro ridership in suburban or exurban areas than core urban areas [43]. Xu et al. reported that the integration between bikeshare and metro was greater in smaller, less transit-intensive cities than in bigger cities [44].

2.3. Use of Classifiers in Metro and Bikeshare Area

Several classifiers have been used for demand forecasting, passenger flow forecasting and travel mode selection forecasting in the field of metro and bikeshare. Xiao et al. used a naïve bayes (NB) classifier with selection procedures to detect the next travel modes after metro trips [45]. Chin et al. applied NB to explore the impact of weather data on short trips for cyclists [46]. Support vector machine (SVM) can also generate selection procedures [47,48], identify travel mode and predict the usage demand of bikeshare systems [49]. Apart from forecasting demand for bikeshare, Joo et al. used SVM to classify the bicycle environment, defined by the safety and comfort of the riders [50]. In addition, a large number of studies have also applied SVM to the prediction of metro passenger flow [51,52,53,54]. Similarly, the random forest (RF) method can also provide a good understanding of passengers’ travel mode choice and the prediction of metro passenger flow [55]. Lin et al. used RF combined with a Long Short-Term Memory (LSTM) model to forecast short-term metro passenger flow [56]. Some research has focused on short-term forecasting for bikeshare usage with RF, which can help cyclists plan their trips and help operators make effective decisions properly [57,58,59,60]. Similar to the previous algorithms, decision tree (DT) can also predict bikeshare demand and short-term metro ridership [61]. In addition, Lee et al. inferred bikeshare trip purpose with DT and revealed the causes of bikeshare movement in the city [62]. In other studies, gradient boosting decision trees or gradient boosting regression trees were also employed in predictive research into bikeshare and metro [61,63,64,65].

2.4. Research Gap

Most of the aforementioned studies aim to give a portrait of metro–bikeshare trip chaining based on survey data or the spatial relationship between the rent/return location of shared bikes and the metro stations. Studies using survey data are difficult to implement at a multi-day level and to explore the integration usage from a spatial-temporal perspective. When the focus is on historical bikeshare trip data and metro station data, the transfer distance threshold between the rent/return location of bikeshare and the metro stations varies from 30 m to 300 m in different case studies, thus the recognized metro–bikeshare transfer trips are not sufficiently compelling. Recently, Ma et al. recognized metro-bikeshare transfer trips derived from seamless smart cards based on the same identified IDs [21]. However, there are also abundant passengers who use both seamless smartcards for metro and dedicated bikeshare cards to form metro–bikeshare transfer trips. To the best of our knowledge, proposing a method to recognize metro–bikeshare transfer trips for the same persons who are using two different types of smartcard, which can only be used for either accessing metro or bikeshare system, respectively, is rare. This paper aims to fill this gap and advances a method to combine metro smartcard records and bikeshare smartcard records, which cannot be connected by the smartcard ID.

3. Methodology

3.1. Study Area and Data Source

Nanjing is the capital of Jiangsu province and a core area of the Yangtze River Delta economic zone, which has long ranked second as the commercial center of the East China region, following Shanghai. The city covers an area of 6587 km2 and has an expected urban population of 9.1 million by 2020. By the end of 2017, there are 9 metro lines with 164 stations, which cover 347.38 km, and 2576 docked bike stations with 100,115 bikes [66].
Bikeshare smartcards used in Nanjing fall into two categories: seamless smartcards that are sold by Nanjing Metro Company and dedicated bikeshare cards that are released by Nanjing Public Bicycle Company. The former allows the usage of both the public bikeshare system and other public transportation modes (such as metro, bus and ferry). At the same time, the seamless smartcard records the transactions of all public transport trips with the same IDs. The second is only used for bikeshare. Therefore, there are two trip streams in metro–bikeshare integration: a. transfer records of the same travelers using only seamless smartcards (with the same card IDs); b. transfer records of the same persons who are using two different types of smartcard (with different card IDs). The main assumption for the first dataset is that the two transfer legs recorded by the same seamless smartcards (thus the same IDs) are conducted by the same travelers.
This study aims to identify transfer trips that belong to the same travelers from the second data source, namely metro–bikeshare transfer trips that are identified through metro smartcard data and bikeshare smartcard data. The data sources are obtained for the period from 9 March 2016 to 29 March 2016, from the Nanjing Metro Company and the Nanjing Public Bicycle Company, respectively, shown in Figure 1.
Bikeshare smartcard data (Figure 1a) and metro smartcard data (Figure 1b) have the same structure, including three profiles regarding trips, stations and customers. The trip profile includes the following anonymous information: member ID, trip origin date and time, trip destination date and time, trip origin station ID, trip destination station ID. The station profile includes station ID and the longitude/latitude of the docking or metro station. The customer profile includes age information from bikeshare users, and card types of metro smartcards regarding different age groups (e.g., Student card (below 18 years old), elderly card (above 60 years old)). The age group of holders of student cards and elderly cards can be inferred.

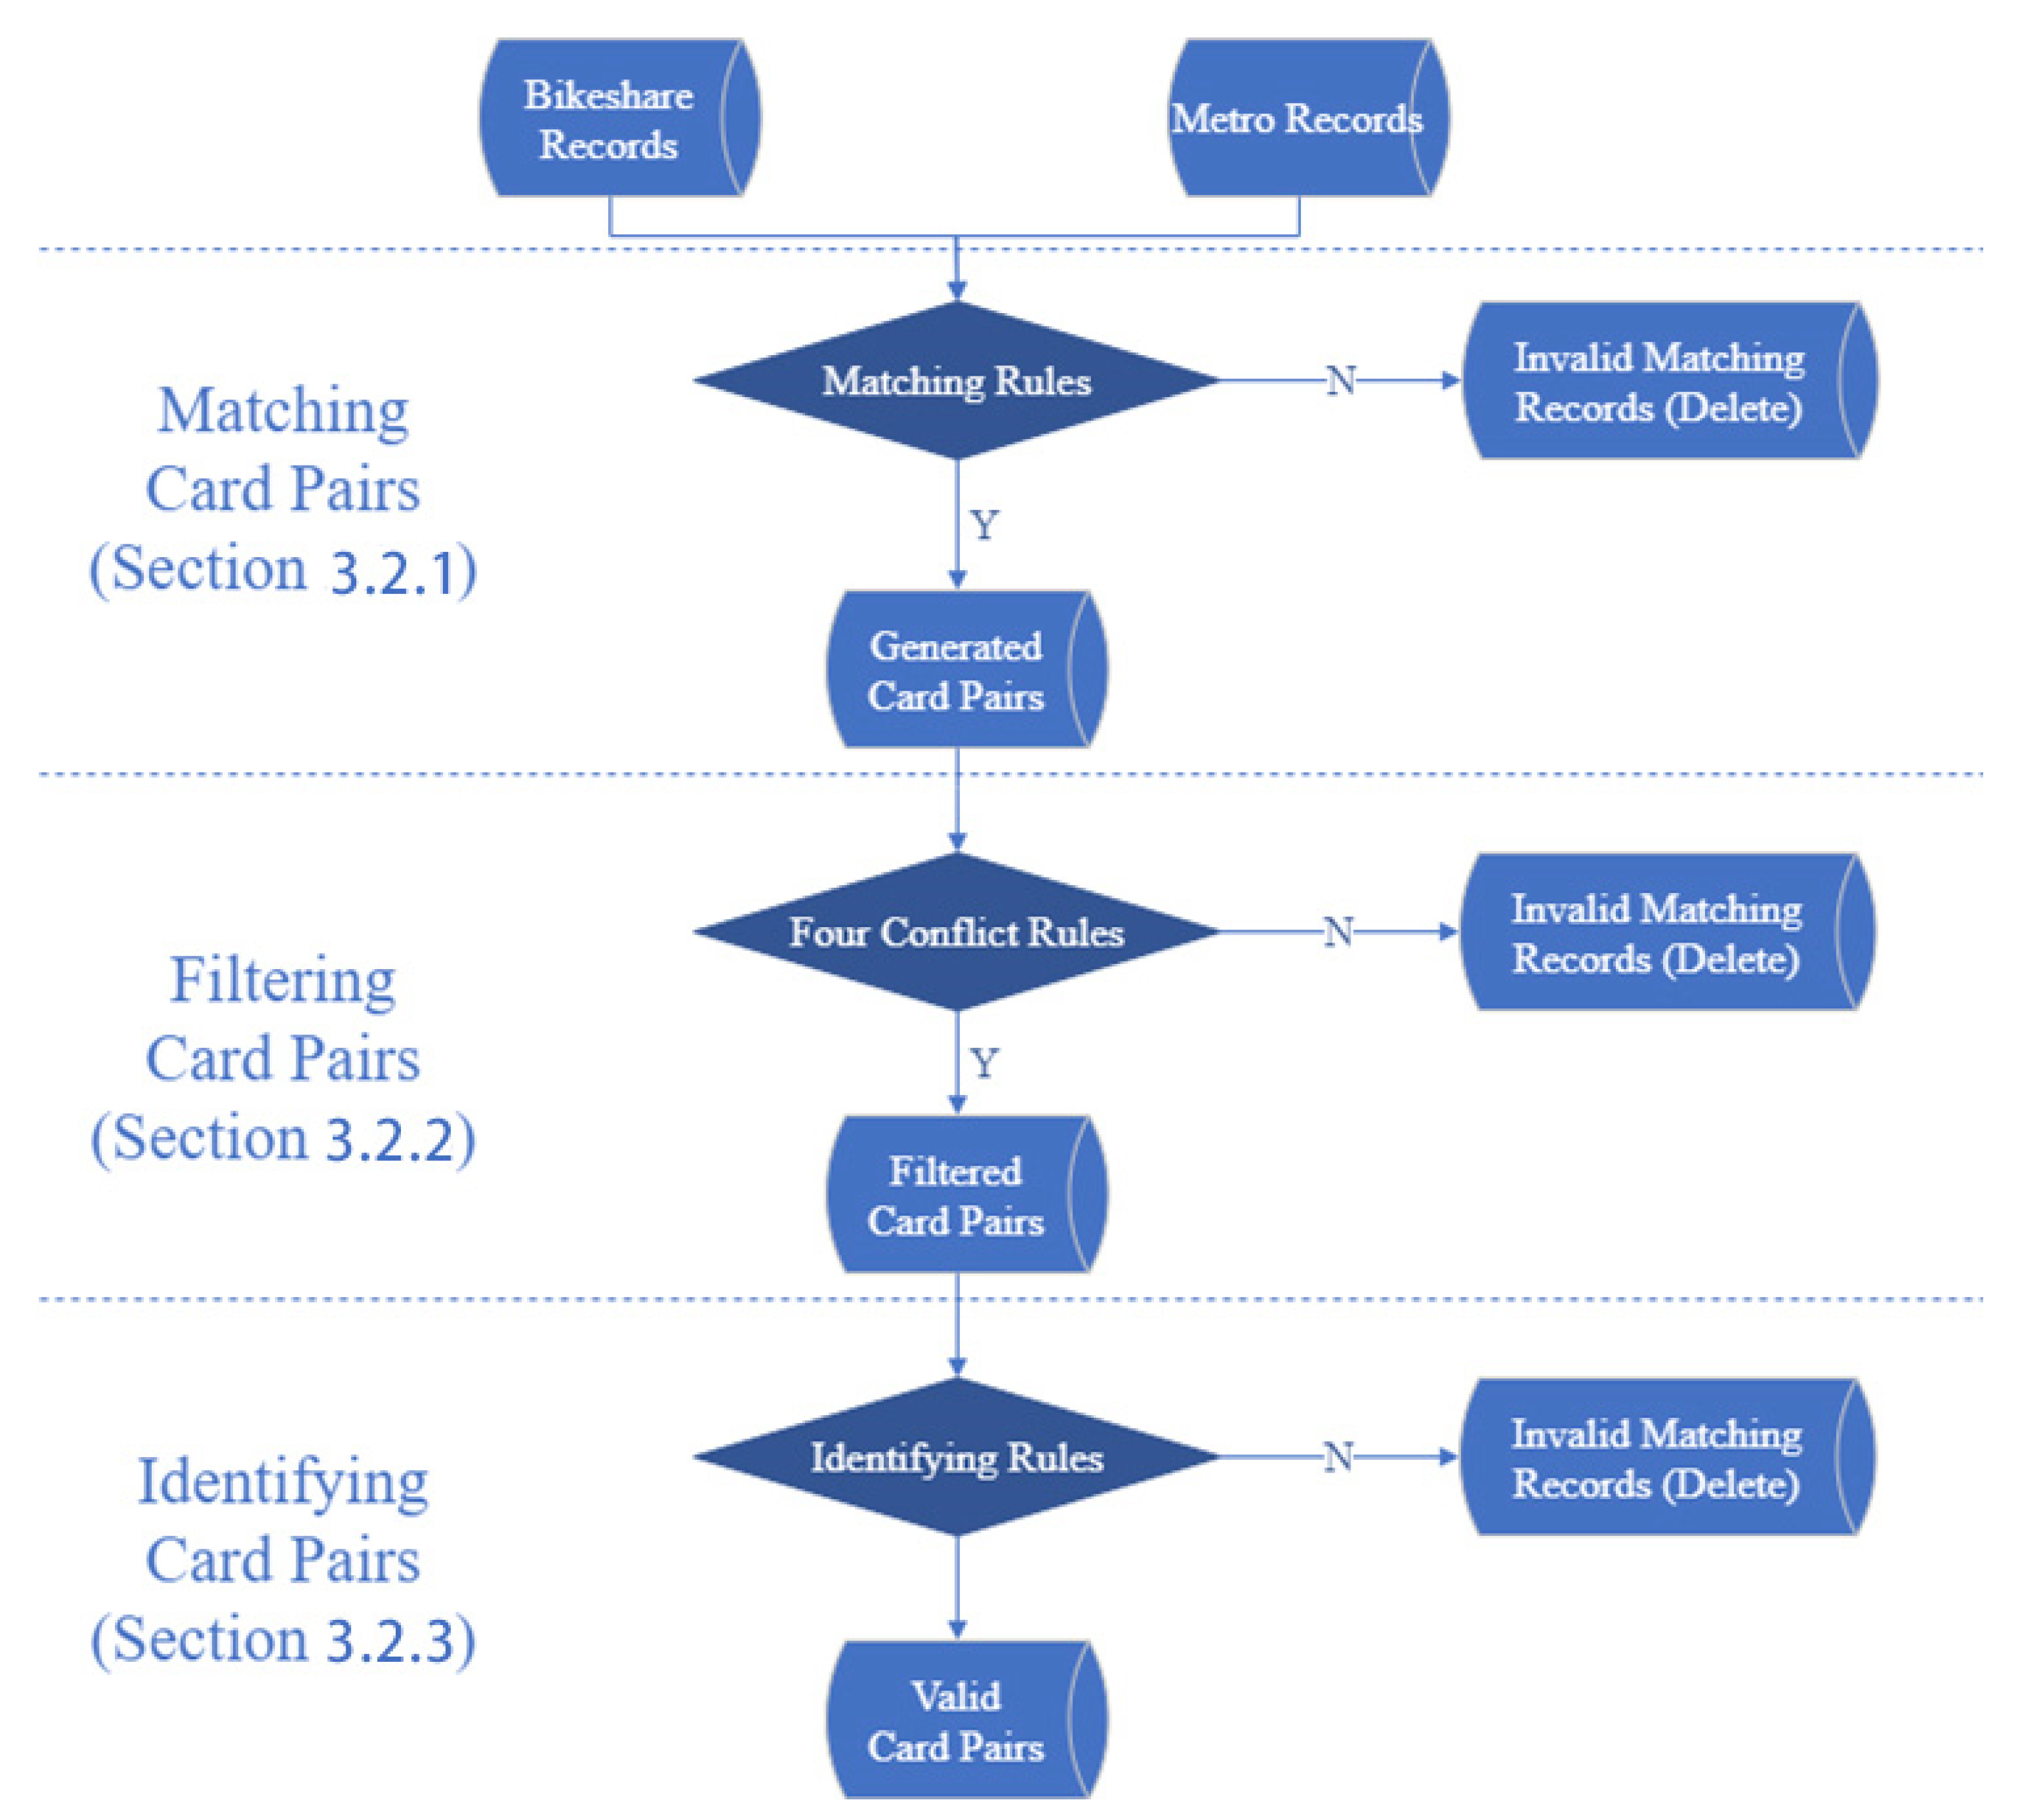
3.2. Methodology for the Identification of Metro–Bikeshare Transfer Trips

The proposed method is used to identify valid transfer trips recorded by a dedicated bikeshare card (“Member ID” begins with letters “NJ”) and a metro card (“Member ID” begins with letters number “9”) used by the same person, which cannot be recognized with the same ID. Note that the transfer trip information derived solely from the seamless smartcard for the same period is used for algorithm demonstration, model calibration (training), and model validation. This is because the ground truth information is available: the transfer trips in two legs recorded by the same seamless smartcards are always featured by the same card IDs, and therefore valid transfer trips can be easily identified by checking if the records of two connected legs have the same IDs. Next, the validated methodology will be further applied to the second data type.
This method contains three main steps: (1) Matching Card Pairs; (2) Filtering Card Pairs; (3) Identifying Card Pairs. Figure 2 and Algorithm 1 illustrate the schematic process of the method. In the rest of this section, we will elaborate the method step by step.
Algorithm 1: Generation of Metro-Bikeshare Trips
Input:card pair database call, judge value jud
Output:prediction accuracy acc
1correct_predction ← 0 # Recording the number of correct prediction
2N ← total number of card pair
2for i ← 1 to N do
3        x ← Average of all match records prediction value in call[i]
4        if x > jud then
5                  correct_predctioncorrect_predction + 1
6        end if
7end for
8acccorrect_predction / |call|
9returnacc

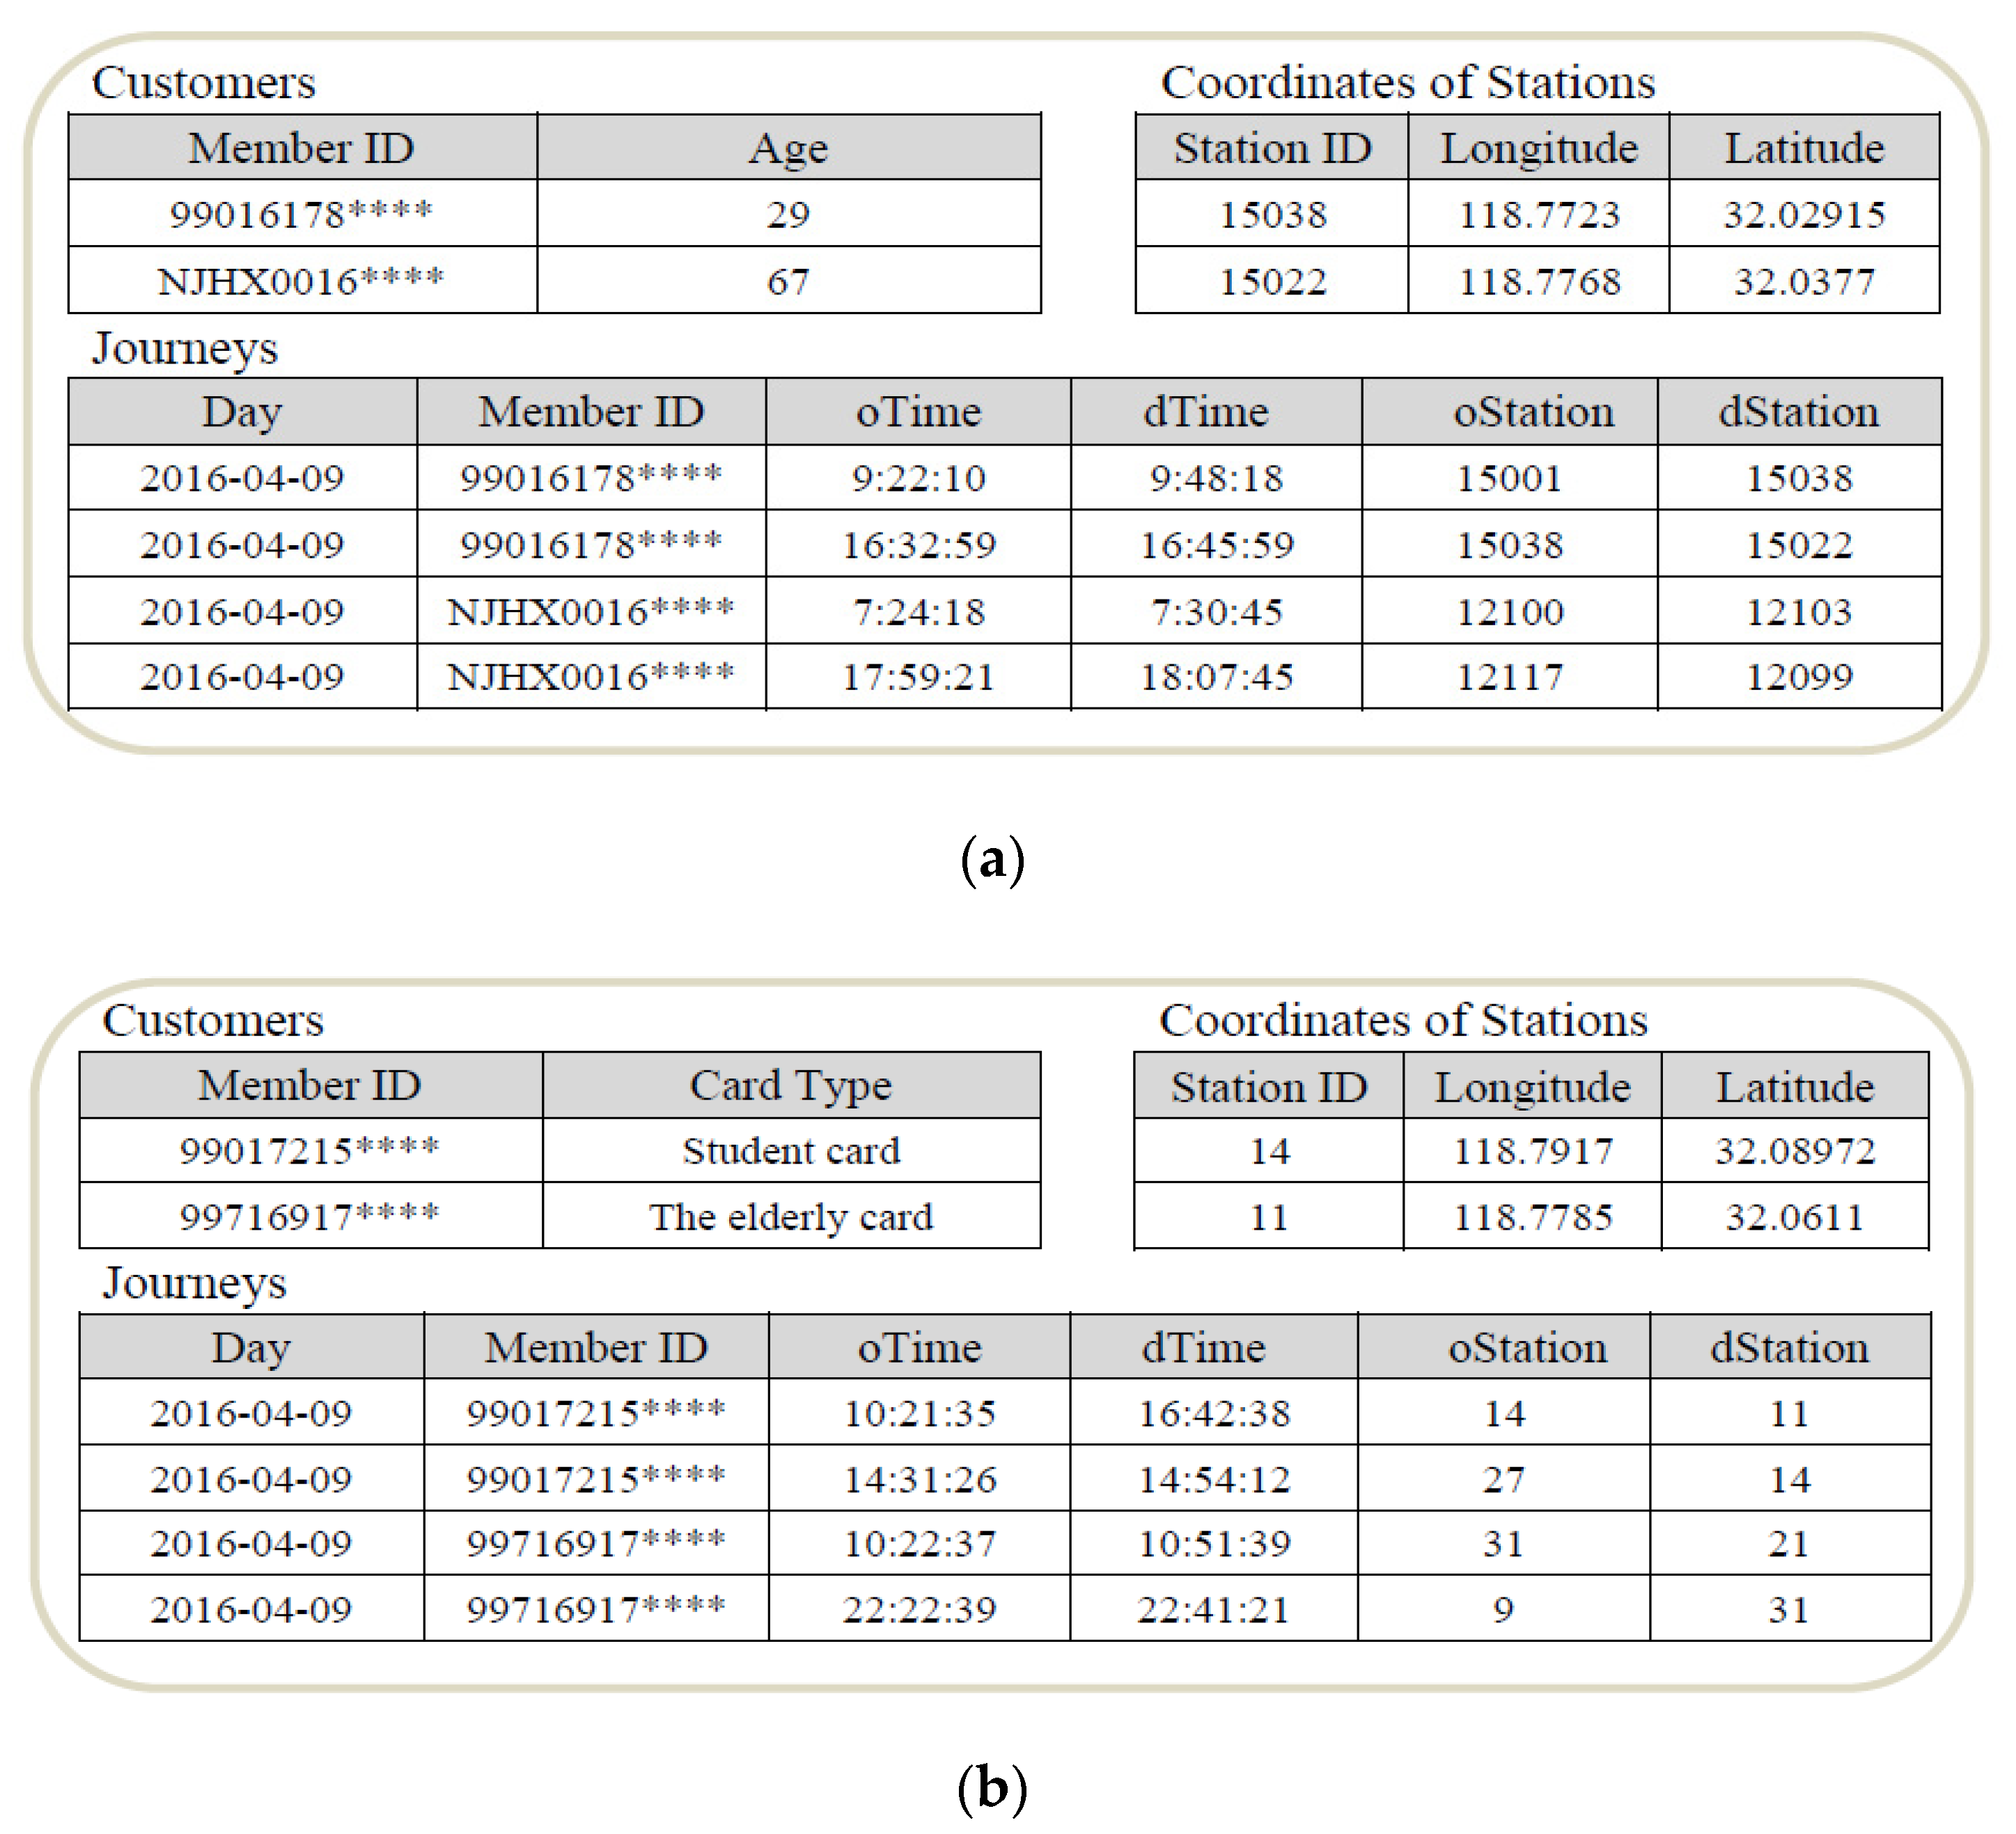
3.2.1. Generating Card Pair

As a basic element in the algorithm, we introduce a concept called Card Pair, which describes the potential connection between two smartcard types (metro and bikeshare) according to two attributes: maximal transfer time and transfer distance.
  • Transfer time and distance range
Transfer time (T_trans) refers to the egress/access time duration between the moment of exiting/entering the metro ticket gate and the moment of leasing/returning a public bike. This definition is based on the fact that smartcard data in Nanjing metro stations is only collected at the moment that a passenger exits or enters through the metro ticket gate. Thus, the walking time from the metro compartment/platform to the ticket gate is not captured in the data analysis. Transfer distance (D_trans) is defined as the Euclidean distance between the locations of metro stations and bikeshare docking stations, which is calculated through their geographic coordinates. The Euclidean distance is commonly used in bikeshare related literature [67,68,69].
Previous studies showed that most passengers finish their transfer trips within 300 m and 10 min [21]. Therefore, in this study, transfer distance less than 300 m (D_trans ≤ 300 m) and transfer time less than 10 min (T_trans ≤ 10 min) are defined as a basic matching rule to generate Card Pairs.
  • Two types of transfer trip
“Access” transfer trip: return bikeshare and enter metro within maximum transfer distance of 300 m and transfer time of 10 min; “Egress” transfer trip: exit metro and lease bikeshare within maximum transfer distance of 300 m and transfer time of 10 min [21].
  • Card pair generation process
Card pair indicates a potential combination of a metro trip recoded by a seamless smartcard and a bikeshare trip recorded by a dedicated bikeshare card, which was conducted by the same card owner. Each card pair consists of a set of metro–bikeshare matching records satisfying the rule of a transfer distance and transfer time. There are four main steps: (1) Transfer time calculation; (2) Transfer distance calculation; (3) Testing matching rule; (4) Card pair generation.
Figure 3 shows an example of the process for card pair generation. In this example, we take the trip records only from the seamless smartcard with the same ID, since it can be assured that the transfer trips were accomplished by the same person. The transfer time is calculated as 100 s (the time difference between the bikeshare return time 9:27:19 and the metro enter time 9:28:59). The transfer distance is calculated as 95.78 m (the distance between the bikeshare docking station 14,023 and the metro station 5). The same process can be used to generate card pairs with different card IDs.

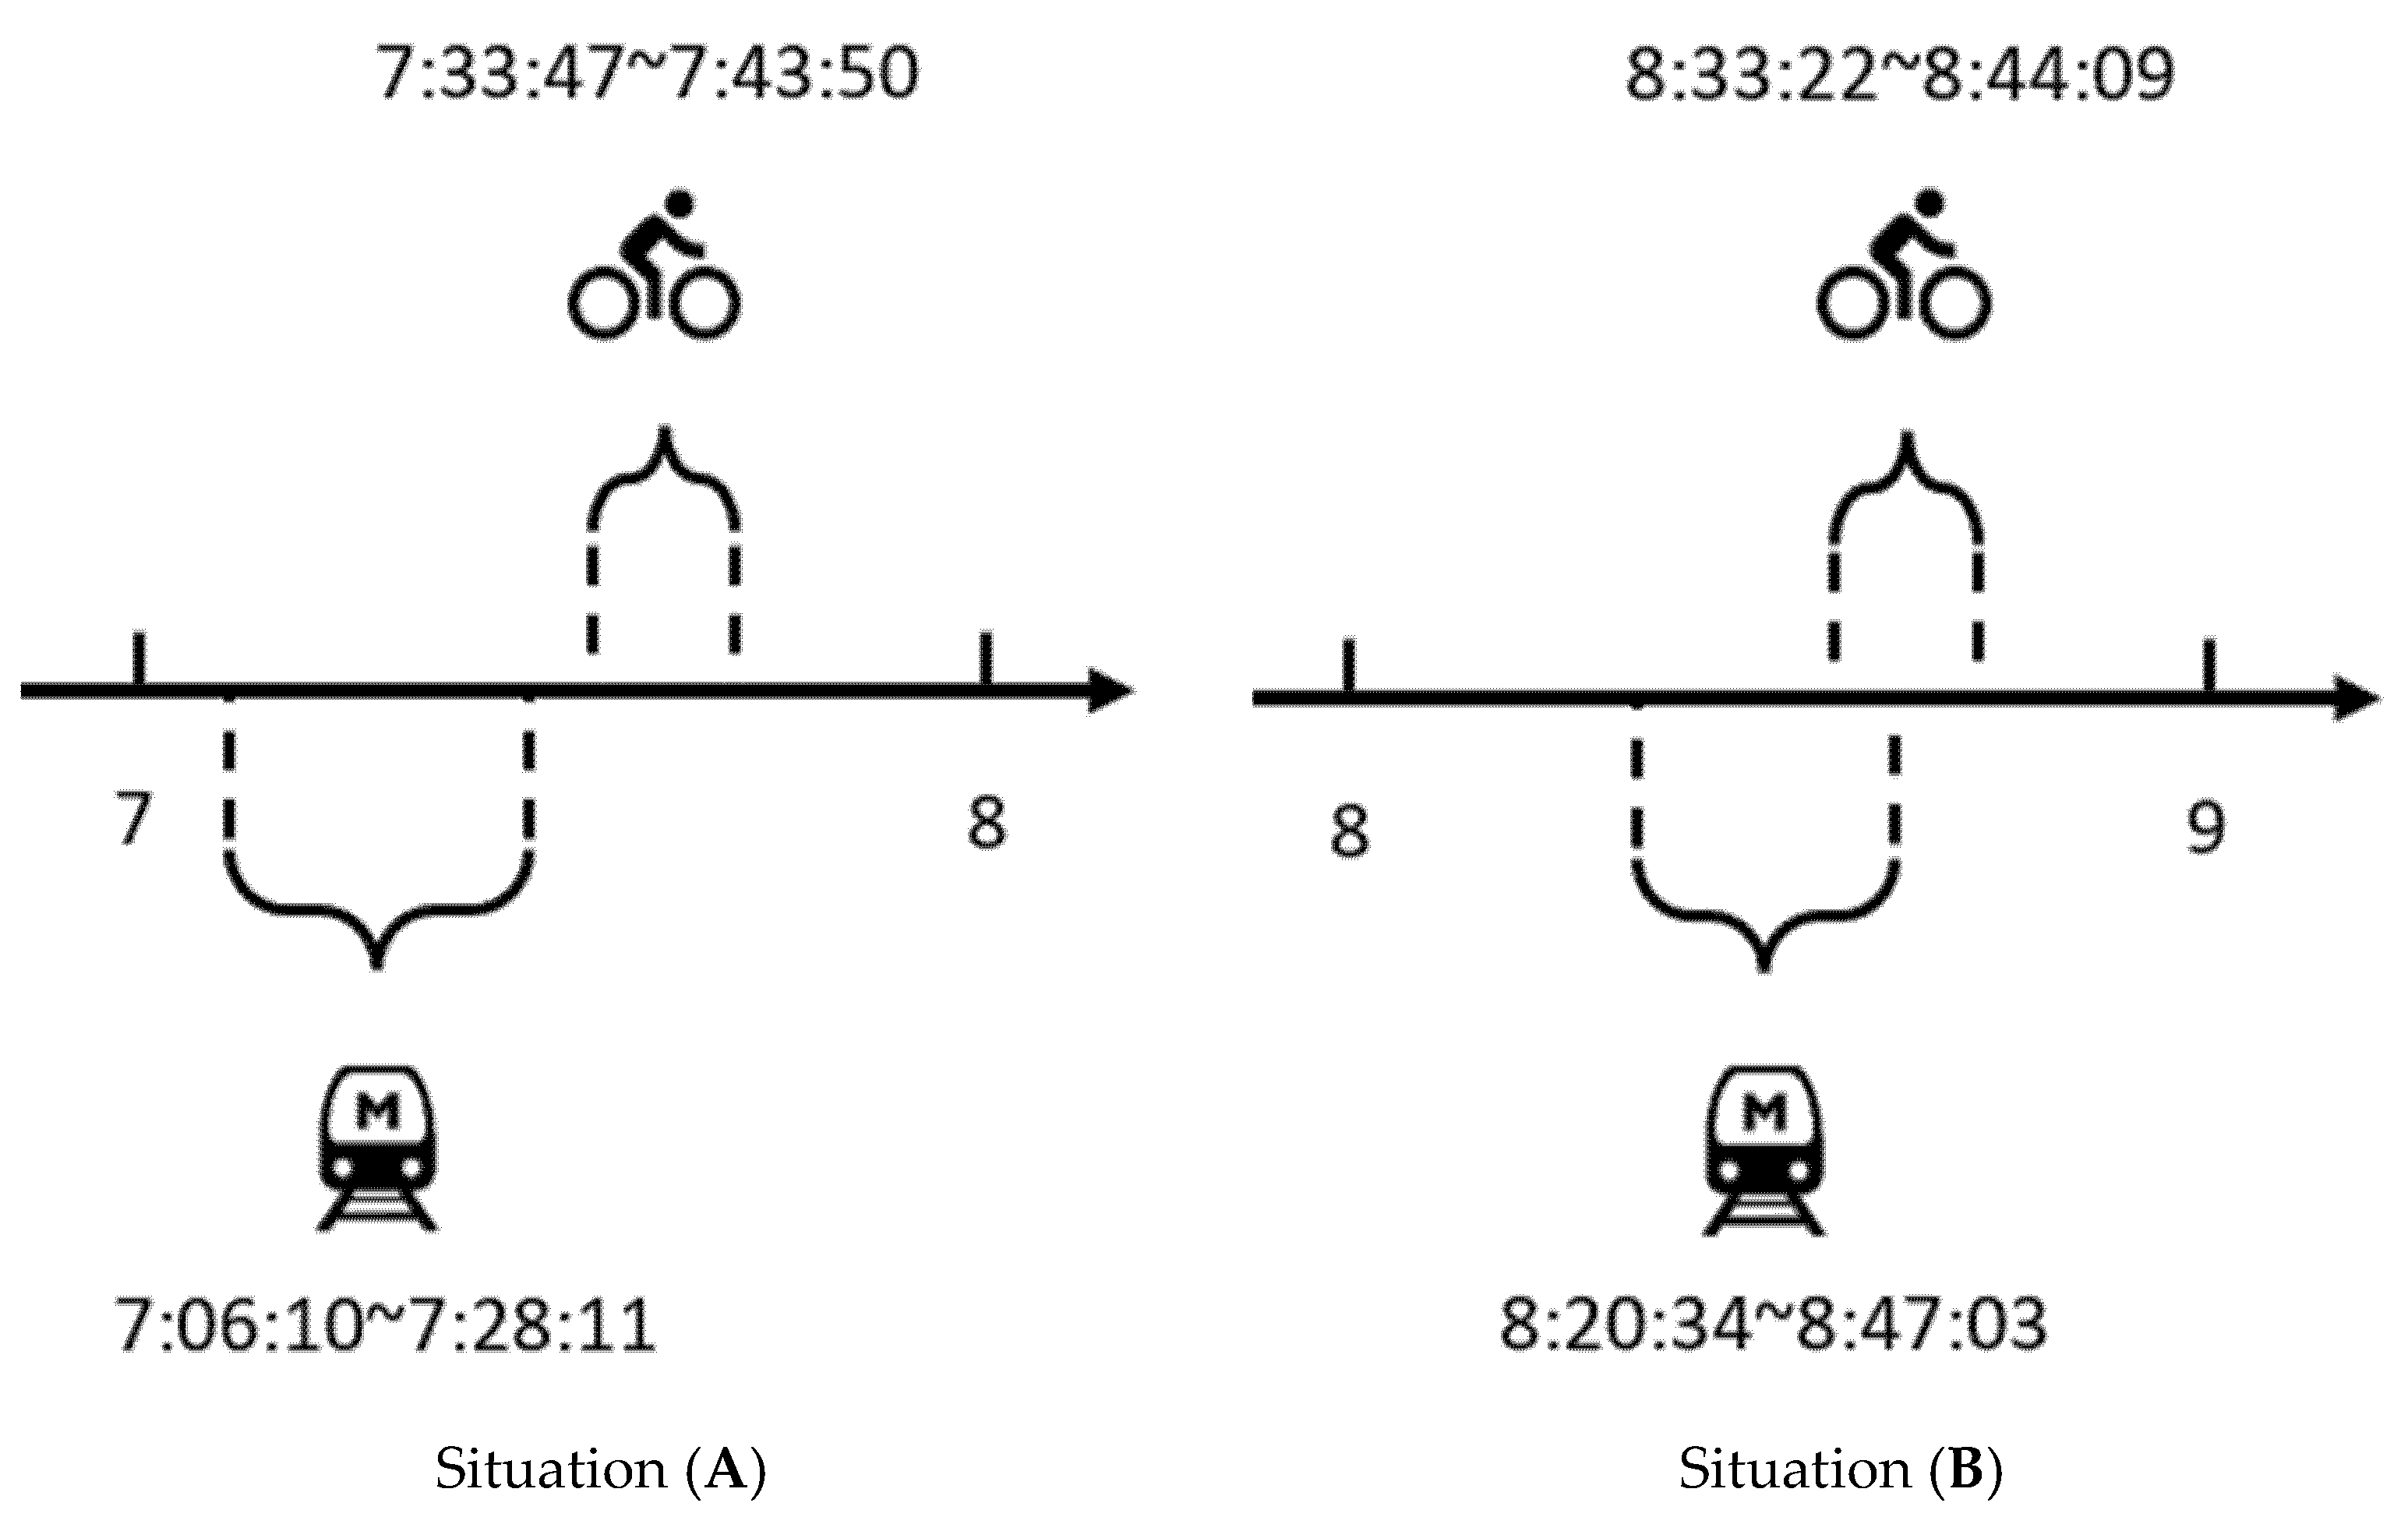
3.2.2. Filtering Invalid Card Pair

Based on the method presented in “Generating card pair”, we might obtain a substantial number of matching card pairs that do not reflect the actual transfer trips performed by the same individual travelers (referred to as invalid card pairs). In this work, four types of conflicts are considered to filter out invalid card pairs.
  • Personal attribute conflict
As it is assumed that a transfer trip recorded by two smartcards in a card pair should belong to a same person, the age information from the bikeshare card must be consistent with that of its paired metro card, which could be inferred from the card type. If not, then this card pair must be an invalid match and all its matching records should be wiped out. For example, if the type of a metro card shows that its owner is over 60, but its paired bikeshare card shows that the user age is 24, this is conflict information.
  • Temporal conflict
Bikeshare riding duration is defined as T i m e B i k e s h a r e = {Lease time, Return time}, and metro riding duration defined as T i m e M e t r o = {Enter time, Exit time}. Both are available from their respective trip records. If T i m e B i k e s h a r e and T i m e M e t r o intersect, the situation will be determined as a temporal conflict. As a result, all the related matching records from the card pair should be wiped out due to the fact that the same person cannot use two transport modes at the same time. The concept of temporal conflict is shown as follows:
T i m e B i k e s h a r e T i m e M e t r o
Figure 4 shows an example of the process considering temporal conflict. The T i m e M e t r o of situation (A) is 7:06:10–7:28:11, and the T i m e B i k e s h a r e of situation (A) is 7:33:47–7:43:50, and   T i m e B i k e s h a r e T i m e M e t r o = . Therefore, temporal conflict does not occur. However, the T i m e M e t r o of situation (B) is 8:20:34–8:47:03, and the T i m e B i k e s h a r e of situation (B) is 8:33:22–8:44:09, and the T i m e B i k e s h a r e T i m e M e t r o . Therefore, temporal conflict occurs.
  • Spatial conflict
We introduce the rule for spatial conflict: the transfer distance between bikeshare stations and metro stations should be smaller than the transfer period times the (predefined) maximum travel speed. If it is not a walking transfer between the metro and bike station, it is not a metro–bikeshare transfer. Therefore, the walking speed of 5 km/h is regarded as the maximum travel speed [38]. The maximum travel speed is used to calculate the maximum transfer distance. Spatial conflict occurs when the calculated maximum transfer distance is lower than the actual transfer distance. The concept of spatial conflict is shown as follow:
  Max   D i s t a n c e W a l k i n g = T i m e T r a n s f e r × V m a x < D i s t a n c e T r a n s f e r
Figure 5 shows an example of the process considering spatial conflict. The T i m e T r a n s f e r of situation (A) is 1042 s (the time difference between metro exit time 18:13:12 and the bikeshare lease time 18: 30:34), and Max   D i s t a n c e W a l k i n g = 1447.2 m (calculated by the maximum walking speed and transfer time duration) which is longer than the   D i s t a n c e T r a n s f e r = 1302 m (through their geographic coordinates of bikeshare and metro stations). Therefore, spatial conflict does not occur. However, the T i m e T r a n s f e r of situation (B) is 441 s, and D i s t a n c e W a l k i n g = 612.5 m, which is shorter than the   D i s t a n c e T r a n s f e r   = 835 m. Therefore, spatial conflict occurs.
  • Highest Frequency
After deleting the card pairs with personal attribute conflicts, temporal conflicts, and spatial conflicts, a bikeshare card ID may be matched with several metro card IDs in the remaining card pairs. The identification frequency means the frequency of a card pair in the remaining card pairs. A bikeshare card ID may have several identification frequencies of card pairs. We will keep the card pair with the highest identification frequency and delete others. The highest frequency of the card pair implies the highest possibility of a valid matching.

3.2.3. Valid Card Pair Identification

In this section, we establish five prediction models to identify valid pairs of metro and bikeshare smartcards after the filtering process. The models are Naive Bayes, Support Vector Classification, Random Forest, Decision Tree and Boosting Algorithm.
There also exist both valid and invalid card pairs in the full list of generated card pairs. The main objective of the prediction models is to identify the valid card pairs, based on the transfer patterns observed in the matching records. Specifically, we extract transfer features and define the identifier to each matching record. Then, we construct a new dataset based on card pair in order to classify the matching record (See Table 1). To this end, the prediction model is used. The result from the prediction model for each matching record is called the Predicted Identifier. Then, the concept of Card Pair Value is proposed to determine whether the two cards belong to the same person. The Card Pair Value will compare with a threshold and then obtain the final prediction. Finally, we propose a performance indicator to quantify the accuracy of different models.
  • Features extracting and identifier definition
Five features of the matching records for the prediction model are defined in view of the transfer pattern and are shown as follows:
(a) Transfer time; (b) Transfer distance; (c) Transfer speed: transfer distance divided by transfer time; (d) The variance of transfer speed: calculated by all the matching records of one card pair; (e) Frequency of card pair: the number of times one card pair appears in the dataset (over 21 days in this study).
Transfer time, distance and speed are the basic parameters of a transfer trip. Besides, speed VAR is calculated to reflect the variance of travel speeds among these trips. High frequency identification of a card pair means that these two cards more often satisfy the matching rule, indicating a higher possibility that these two cards are used by the same person.
To examine whether the extracted card pair is the valid one, we define the concept of Identifier. By observing the card ID, the value of the Identifier can be determined. Specifically, if the two card IDs in the card pair are the same, the card pair will be recorded as valid and the Identifier for this card pair is 1. Otherwise, the card pair will be invalid, and the Identifier is 0.
  • Dataset construction
The dataset for prediction modeling consists of three parts: card pair, input parameters/features and identifier. The format of the dataset is shown in Table 1. Transfer time, Transfer distance and Transfer speed vary between different matching records. Speed VAR and Frequency should be the same between the matching records that belong to the same card pairs, but different from the other card pairs. This dataset will be used to train the prediction models.
  • Definition: predicted identifier, card pair value and prediction value of card pair
I. Predicted Identifier: When Predicted Identifier equals 1, the trip of this card pair is predicted as a valid trip. When Predicted Identifier equals 0, the trip of this card pair is predicted as an invalid one.
II. The Average of Predicted Identifier: Predicted Identifier is used to calculate The Average of Predicted Identifier, which can be calculated as Equation (3).
T h e   A v e r a g e   o f   P r e d i c t e d   I d e n t i f i e r = T h e   s u m   o f   P r e d i c t e d   I d e n t i f i e r     T o t a l   n u m b e r   o f   trips   generated   by   the   Card   Pair
III. Predicted Value of Card Pair: To depict the prediction results for card pairs, the Prediction Value of Card Pair is defined based on Identifier Threshold and The Average of Predicted Identifier, which can be calculated by Equation (4). When the Prediction Value of Card Pair equals 1, the card pair is considered as valid according to the prediction result. Otherwise, the Prediction Value of Card Pair equals 0, and the card pair is predicted as an invalid card pair. Before the determination of Prediction Value of Card Pair, Identifier Threshold is defined to represent to what extent the card pair can be considered as valid by the prediction model.
  P r e d i c t i o n   V a l u e   o f   C a r d   P a i r = { 1   ,   i f   T h e   A v e r a g e   o f   P r e d i c t e d   I d e n t i f i e r > I d e n t i f i e r   T h r e s h o l d 0   ,   i f   T h e   A v e r a g e   o f   P r e d i c t e d   I d e n t i f i e r I d e n t i f i e r   T h r e s h o l d
Corresponding to the Prediction Value of Card Pair, the range of Identifier Threshold is set between 0 and 1. We set four values (0.5, 0.6, 0.7, 0.8) for this parameter to find the best one in the sensitivity analysis.
Table 2 illustrates prediction results for seamless card pairs. Identifier Threshold is set to 0.6 as an example. The output of the prediction model is the Prediction Value of Card Pair, which is binomial. For model evaluation, the validity of seamless card pairs is observed from card IDs, and then compared with the predicted validity. Prediction results are classified into four types, including a valid card pair predicted as valid; a valid card pair predicted as invalid; an invalid card pair predicted as valid; and an invalid card pair predicted as invalid.
  • Model evaluation
The application of prediction models is to extract valid card pairs for transfer behavior investigation. Predicted valid card pairs (the card pairs labeled as “a valid card pair predicted as a valid one” and “an invalid card pair predicted as a valid one”) are used to calculate the Prediction Accuracy P (Equation (5)). The value of Prediction Accuracy P indicates the proportion of correct prediction (the card pairs labeled as “a valid card pair predicted as a valid one”, which are observed values) among all predicted valid card pairs (the card pairs labeled as “a valid card pair predicted as a valid one” and “an invalid card pair predicted as a valid one”, which are predicted values).
P = V V V V + I V
where VV represents the number of card pairs labeled as “a valid card pair predicted as a valid one” and IV represents the number of card pairs labeled as “an invalid card pair predicted as a valid one”.

4. Case Study

In this section, the data solely from seamless smartcards that contain both bikeshare and metro trip legs are used to train the proposed models. After choosing the best performing prediction model, we further apply to identify the card pairs that consist of dedicated bikeshare card and metro smartcard data. Finally, general patterns between the seamless card users and dedicated bikeshare card users are compared to validate the model

4.1. Card Pair Generation and Filter
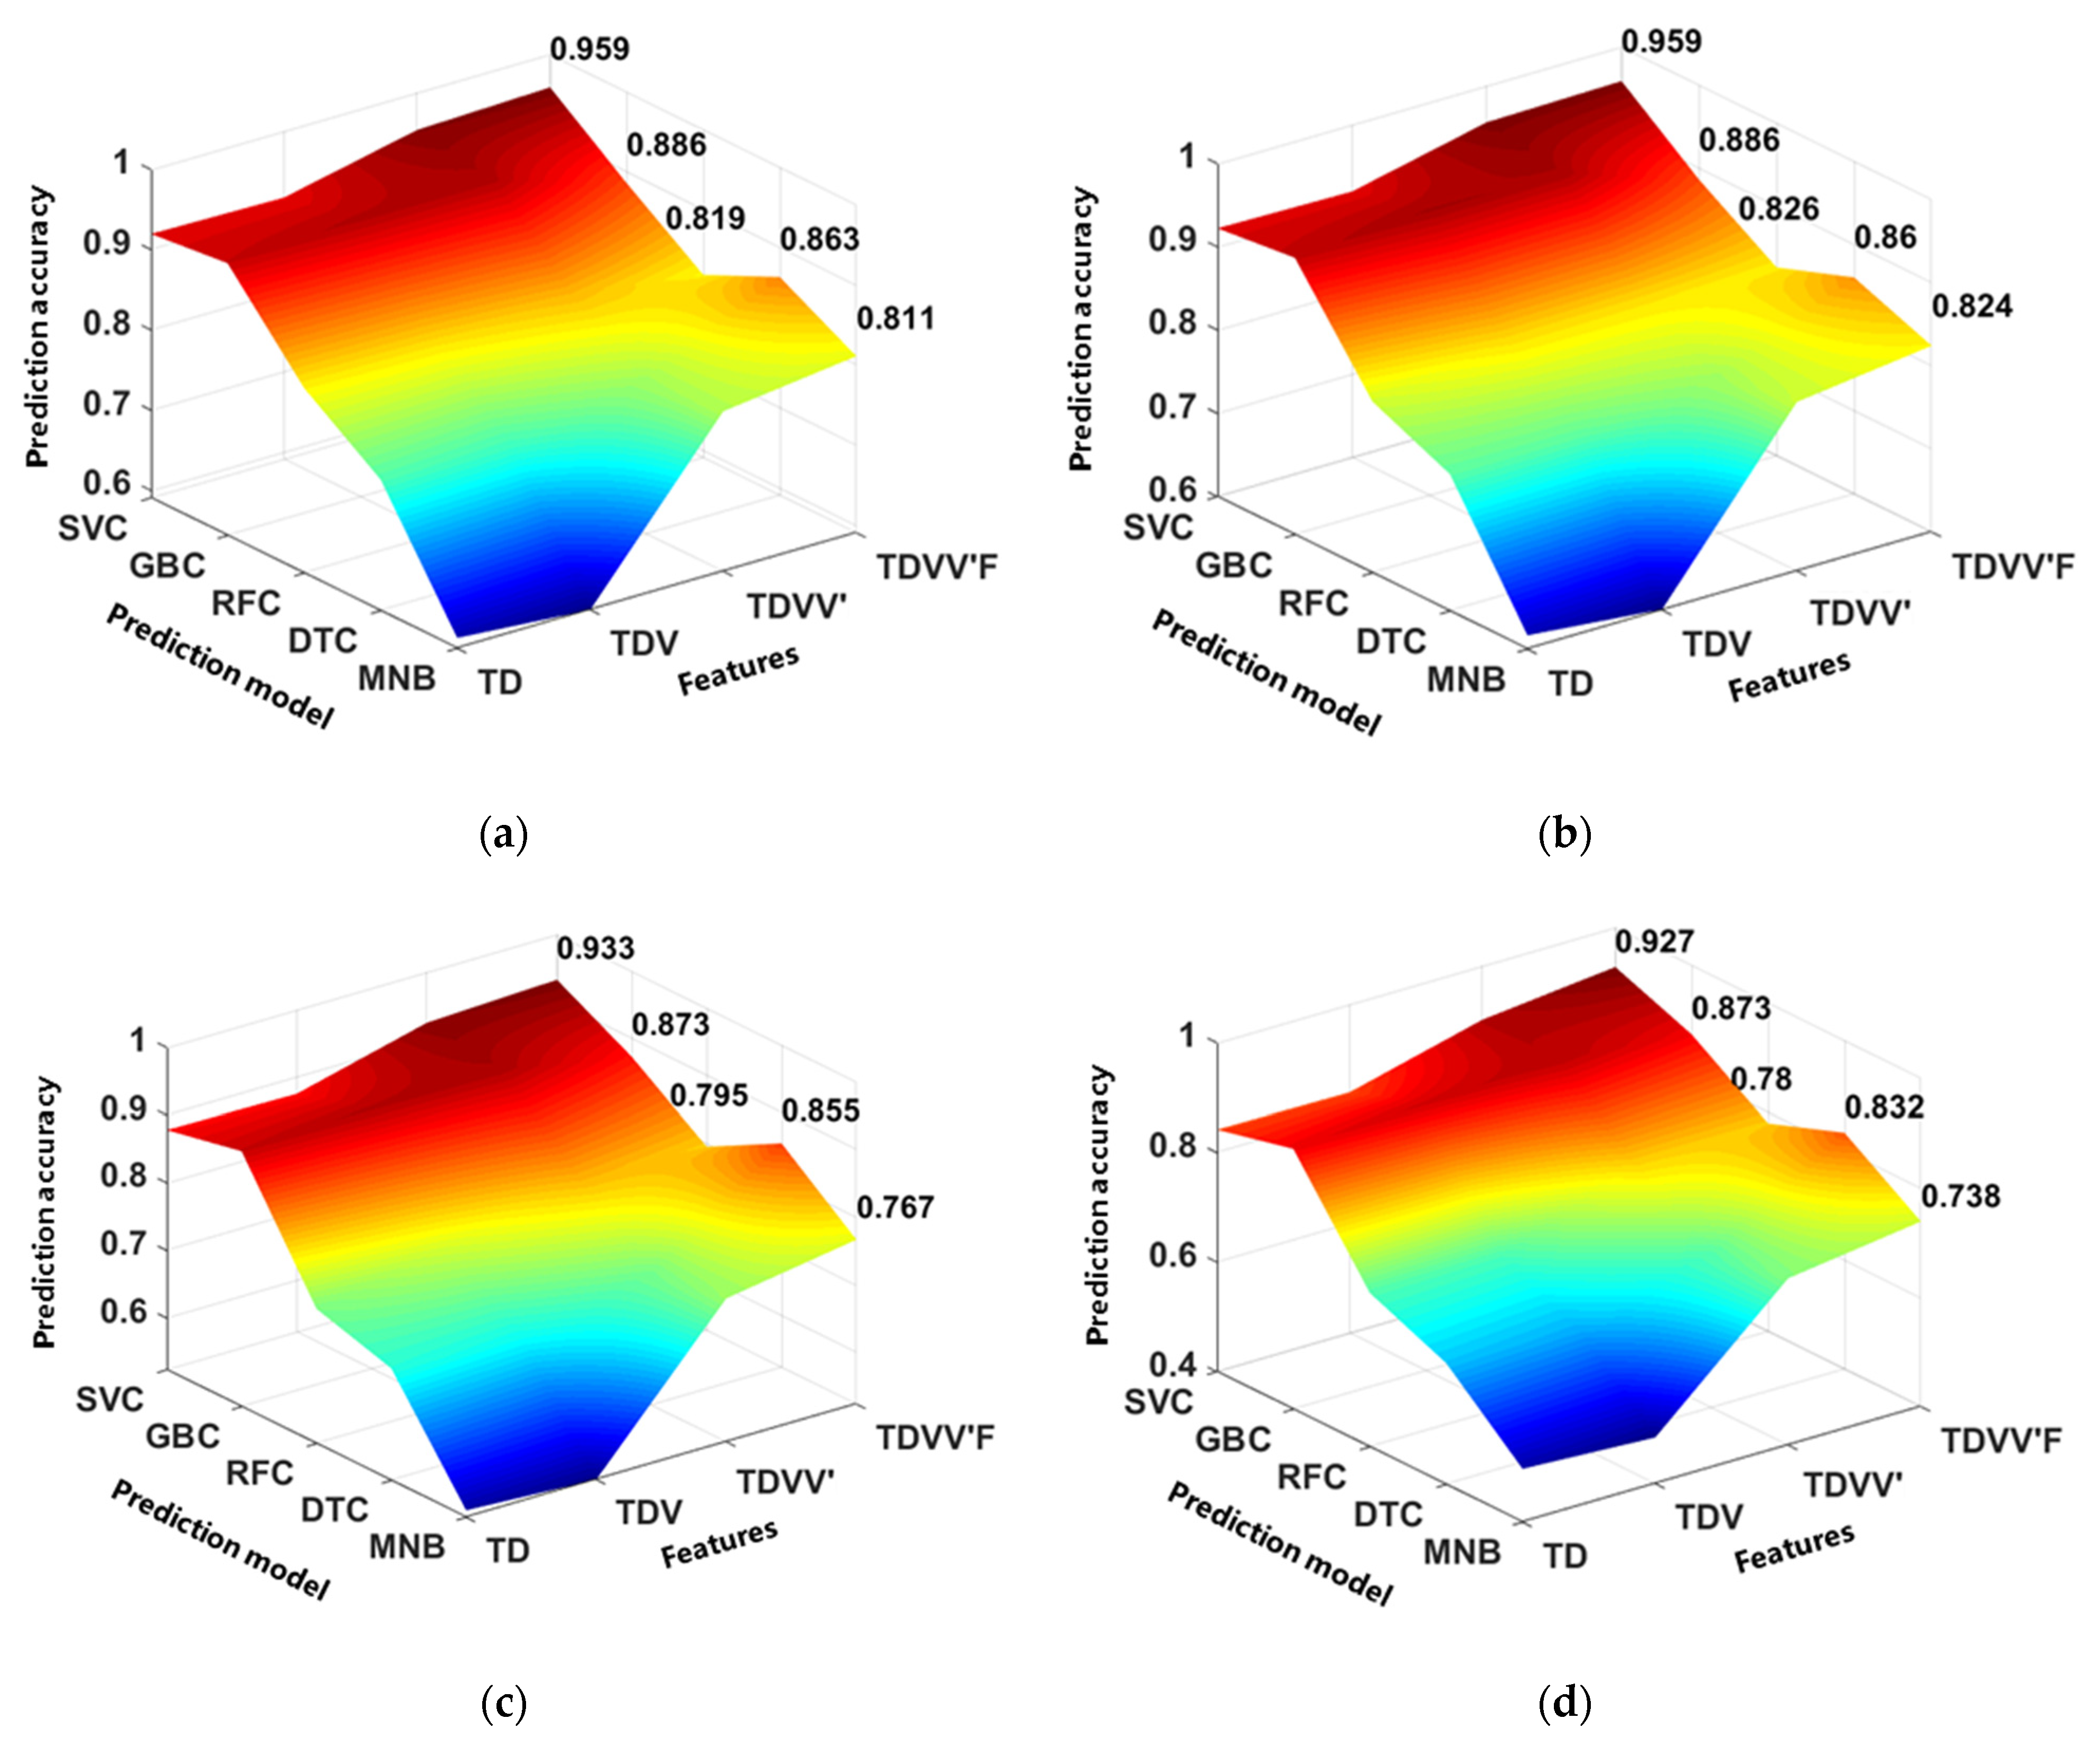
Firstly, the dataset of seamless cards for bikeshare and metro is used to generate the matching records. Based on the card pair generation methods, 2,143,229 matching records are extracted. Then, 240,828 matching records are deleted due to personal attribute conflict; 609,678 matching records are deleted due to temporal conflict; 360,610 matching records are deleted due to spatial conflict; and 705,647 matching records are deleted due to frequency conflict. After the filtering step, there are 226,466 matching records left and all these trip records belong to 217,147 different card pairs.

4.2. Model Training

Five models were applied to predict the validity of extracted card pairs, Naive Bayes, Support Vector Machine, Random Forest, Decision Tree and Boosting Algorithm in Python package named “sklearn”, which are: the “Multinomial NB” function in “naïve_bayes” module; the “SVC” function in “svm” module; the “Decision Tree Classifier” in “tree” module; “Random Forest Classifier” and “Gradient Boosting Classifier” function in “ensemble” module. All the models are trained and tested on a Windows 10 computer with CPU (Intel(R) Core (TM) i5-5200U CPU @ 2.20 GHz), 16 GB random-access memory (RAM) and one NVIDIA GeForce 940 M with 1 GB memory.
For simplicity, transfer time, transfer distance, transfer speed, speed variance and identification frequency are abbreviated respectively as T, D, V, V’ and F; Multinomial Naive Bayes, Support Vector Classification, Random Forest Classifier, Decision Tree Classifier and Gradient Boosting Algorithm are abbreviated respectively as MNB, SVC, RFC, DTC and GBC. The input parameter is added one by one in the order of T, D, V, V’ and F to find the best input parameter. Four different Identifier Threshold values (0.5, 0.6, 0.7 and 0.8) are used to test five models with different input parameters. We assume that the card pairs with low frequency may affect the prediction accuracy of models. In order to explore the influence of frequency on model prediction accuracy, we run the models by putting four different datasets, including “All the card pairs”, “All the card pairs with more than one frequency”, “All the card pairs with more than two frequencies” and “All the card pairs with more than three frequencies”.
Figure 6 only presents the predicting accuracy of five predicting models using the dataset “All the card pairs with more than three frequencies” (because of its high predicting accuracy overall). Results show that the high predicting accuracy for each dataset is 0.467 of RFC, 0.620 of DTC, 0.805 of DTC, and 0.959 of SVC, respectively. The total training time consumed by MNB, SVC, RFC, DTC and GBC are similar, all at around 0.5–1.5 s, where MNB is the fastest and SVC is the slowest. Nevertheless, the training time of all prediction models is acceptable. When using the SVC model with parameters of TDVV’F and Identifier Threshold of 0.5 or 0.6, the highest prediction accuracy (0.959) occurs. For each prediction model with parameters of TDVV’F, higher prediction accuracy can be obtained by setting Identifier Threshold to 0.5 and 0.6, rather than 0.7 and 0.8. Figure 6a,b show that using parameters of TDVV’F, for SVC, GBC, the prediction accuracies are the same with an Identifier Threshold of 0.5 and 0.6, which are 0.959 and 0.886, respectively. For RFC and MNB, models with Identifier Threshold of 0.6 outperform those with Identifier Threshold of 0.5. In contrast, DTC performs better in Figure 6b. based on the prediction results analysis, SVC model with parameters of TDVV’F and Identifier Threshold of 0.6 is chosen for model application.

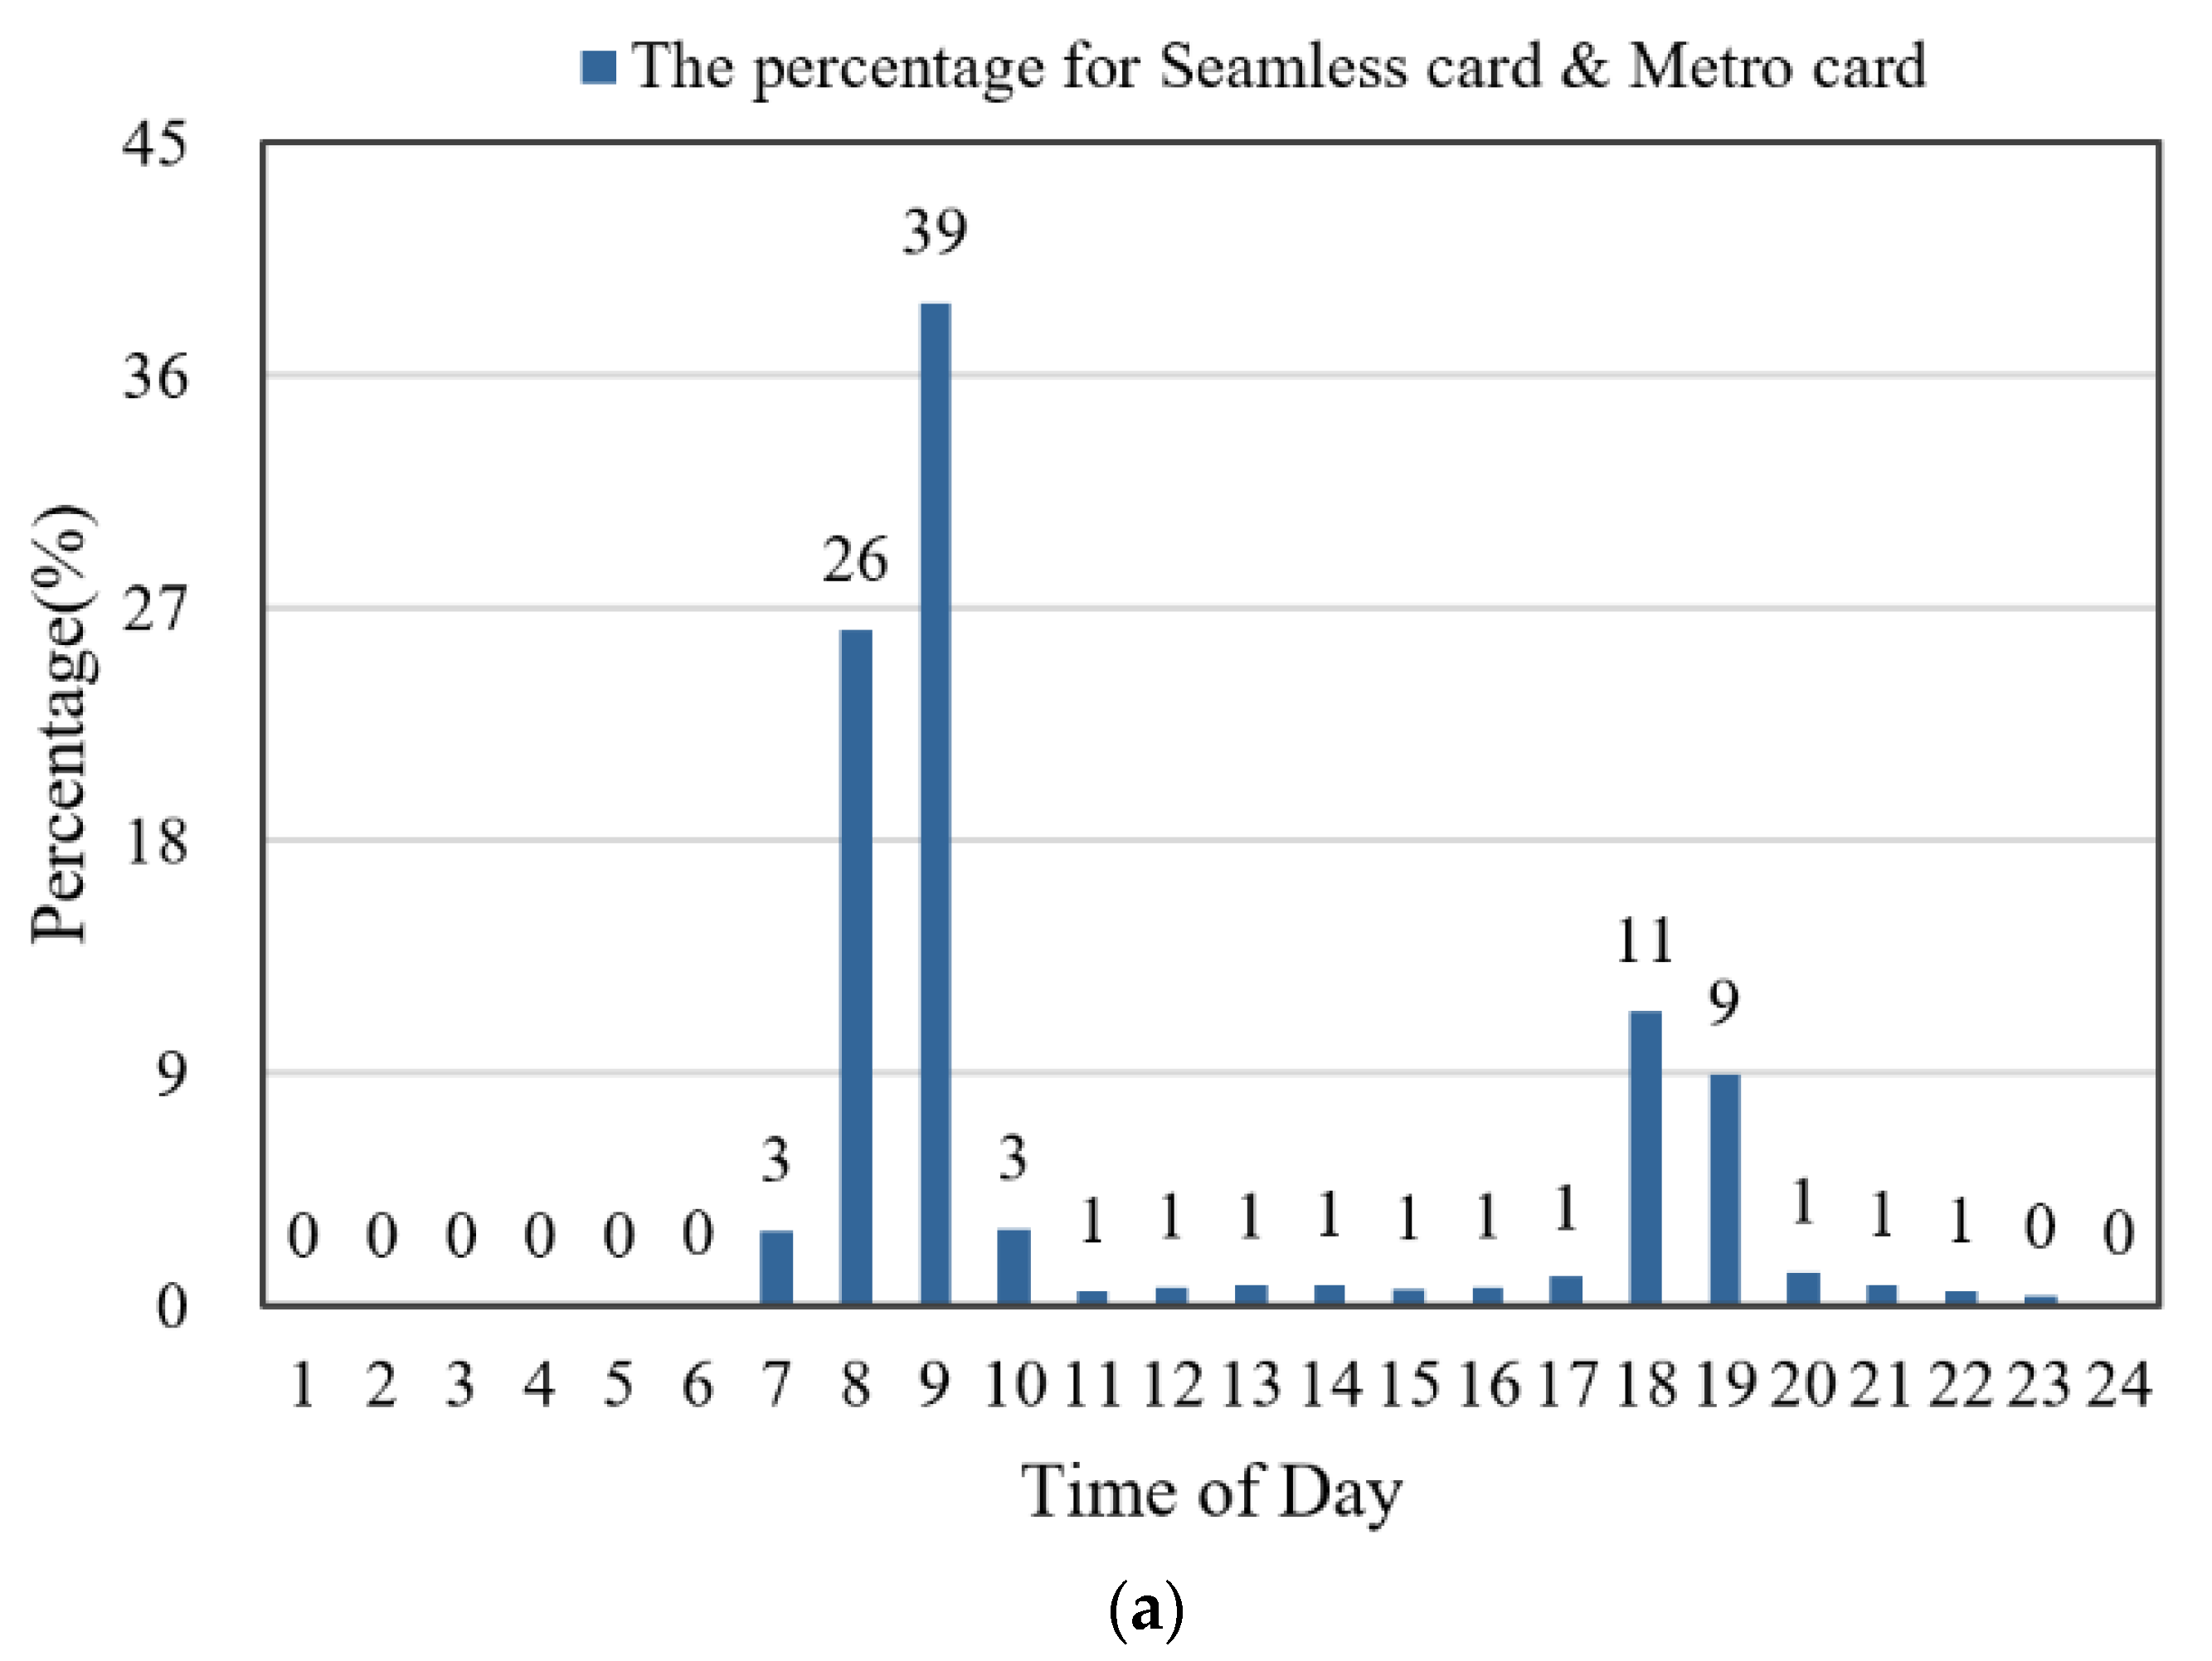
4.3. Model Application

This section shows the model application on the dataset of seamless card pairs and the dataset of dedicated bikeshare card and metro smartcard. We identified all the card pairs using dedicated bikeshare card data and metro smartcard data. The data structure of dedicated bikeshare card and dedicated metro smartcard are the same as that for the seamless card, which means that all the input parameters can be obtained using the proposed methods. Firstly, we derived 1,903,316 card pairs consisting of 19,634,609 matching records from the card pair generation process. After checking personal attributes, temporal, spatial and frequency conflicts, invalid records were deleted and 3101 card pairs consisting of 17,687 matching records remained to be put into the trained prediction model. Finally, 2948 card pairs consisting of 17,022 identified records were obtained.
The temporal patterns of predicted valid transfer trips are visualized respectively. There are similarities between these two types of transfer trips, which were analyzed in detail. Figure 7 shows the temporal distribution of two groups of the transfer trips identified by the prediction model. The selected prediction model is the Support Vector Machine. Transfer time, transfer distance, transfer speed, speed variance and identification frequency are used as input features of trips. The parameter Identifier Threshold is set as 0.6. Figure 7a consists of 17,022 matching records extracted from seamless smartcard data for bikeshare and metro. Figure 7b consists of 226,466 matching records extracted from dedicated bikeshare card data and metro smartcard data.
As Figure 7 shows, obvious travel peaks can be observed in the morning (7:00–9:00) and in the afternoon (17:00–19:00) on workdays for both identified transfer trips, which reveals that the main purpose of integration bikeshare and metro integration is commuting. For the transfer trips extracted from seamless bikeshare smartcard data and metro smartcard data, there are 46% and 24% of users a week traveling during the morning peak hours and afternoon peak hours, respectively. Similarly, for transfer trips extracted from dedicated bikeshare smartcard data and metro smartcard data, there are 65% and 20% of users on workdays who are traveling during the morning peak hours and afternoon peak hours, respectively. It can be seen that, for both identified transfer trips, more people travel during the morning peak hours, compared with afternoon peak hours. This is reasonable because after-work trips in the afternoon tend to have less strict time constraints and are more likely to relate to diversified travel purposes than morning commuting trips. Specifically, for both transfer trips, during the morning peaks, trips during 8:00–9:00 are more than that during 7:00–8:00. During the afternoon peak hours, the number of trips during 17:00–18:00 is higher than that during 18:00–19:00.

5. Conclusions

This paper explores the bikeshare mode as a feeder to metro by mining smartcard data. The matching method consists of three steps: (1) Generating card pair using a maximum transfer distance of 300 m and maximum transfer time of 10 min. (2) Filtering the invalid card pair using personal attributes, temporal, spatial and frequency conflicts. (3) Using prediction models to recognize valid transfer trips recorded by metro and bikeshare smartcards. SVC model (accuracy of 95.9%) is chosen with input parameters including transfer time, distance, speed, variance of speed, frequency. Identification Threshold equals to 0.6. Finally, by comparing the temporal patterns of two groups of identified transfer trips, the identifying method is validated.
This study has several limitations. First, although personal attributes, temporal attributes, and spatial attributes have been considered for matching the metro-bikeshare trips, land use attributes around metro stations are not considered. Second, the authors only used docked bikeshare vendor data, which provides an incomplete picture of metro–bikeshare trip recognition. Future research can be developed along the following directions. First, although the prediction accuracy of SVC using card pair identification results can reach 0.959, the prediction results can still involve invalid card pairs. It is possible that a metro trip and a bikeshare trip generated by two different travelers may be predicted as a transfer trip by one traveler. To solve this problem, advanced deep learning methods can be used to improve the model prediction accuracy, especially for card pairs with low frequency. Second, this work could be extended by obtaining data over a longer period and including more features, which helps in the in-depth exploration and analysis of travel behavior. Last but not least, future work could apply the proposed method to identify transfer behavior between dockless bikeshare trip legs and public transit trip legs.

Author Contributions

Conceptualization, X.M.; methodology, X.M. and Y.J.; investigation, S.Z. and M.Z.; data curation, X.M. and S.Z.; writing—original draft preparation, X.M., M.Z. and Y.J.; writing—review and editing, Y.Y.; supervision, Y.Y. All authors have read and agreed to the published version of the manuscript.

Funding

This research was funded by National Natural Science Foundation of China, grant number and 51908187 and 52172304“, and “The APC was funded by National Natural Science Foundation of China, grant number 52172304”.

Conflicts of Interest

The authors declare no conflict of interest.

References

  1. Hensher, D.A. Climate change, enhanced greenhouse gas emissions and passenger transport—What can we do to make a difference? Transp. Res. Part D 2008, 13, 95–111. [Google Scholar] [CrossRef] [Green Version]
  2. Shelat, S.; Huisman, R.; van Oort, N. Analysing the trip and user characteristics of the combined bicycle and transit mode. Res. Transp. Econ. 2018, 69, 68–76. [Google Scholar] [CrossRef]
  3. Gehrke, S.R.; Russo, B.J.; Sadeghinasr, B.; Riffle, K.R.; Smaglik, E.J.; Reardon, T.G. Spatial interactions of shared e-scooter trip generation and vulnerable road user crash frequency. J. Transp. Saf. Secur. 2021, 1–17. [Google Scholar] [CrossRef]
  4. Meng, M.; Koh, P.P.; Wong, Y.D. Influence of socio-demography and operating streetscape on last-mile mode choice. J. Public Transp. 2016, 19, 38–54. [Google Scholar] [CrossRef]
  5. Pan, H.; Shen, Q.; Xue, S. Intermodal Transfer Between Bicycles and Rail Transit in Shanghai, China. Transport. Res. Rec. 2010, 2144, 181–188. [Google Scholar] [CrossRef]
  6. Gehrke, S.R.; Akhavan, A.; Furth, P.G.; Wang, Q.; Reardon, T.G. A cycling-focused accessibility tool to support regional bike network connectivity. Transp. Res. Part D Transp. Environ. 2020, 85, 102388. [Google Scholar] [CrossRef]
  7. Tilahun, N.; Thakuriah, P.V.; Li, M.; Keita, Y. Transit use and the work commute: Analyzing the role of last mile issues. J. Transp. Geogr. 2016, 54, 359–368. [Google Scholar] [CrossRef] [Green Version]
  8. Keijer, M.J.N.; Rietveld, P. How do people get to the railway station? The dutch experience. Transp. Plan. Technol. 2000, 23, 215–235. [Google Scholar] [CrossRef] [Green Version]
  9. Martin, E.W.; Shaheen, S.A. Evaluating public transit modal shift dynamics in response to bikesharing: A tale of two U.S. cities. J. Transp. Geogr. 2014, 41, 315–324. [Google Scholar] [CrossRef] [Green Version]
  10. Liu, L.; Sun, L.; Chen, Y.; Ma, X. Optimizing fleet size and scheduling of feeder transit services considering the influence of bike-sharing systems. J. Clean. Prod. 2019, 236, 117550. [Google Scholar] [CrossRef]
  11. Tavassoli, K.; Tamannaei, M. Hub network design for integrated Bike-and-Ride services: A competitive approach to reducing automobile dependence. J. Clean. Prod. 2020, 248, 119247. [Google Scholar] [CrossRef]
  12. Puello, L.L.P.; Geurs, K. Modelling observed and unobserved factors in cycling to railway stations: Application to transit-oriented-developments in The Netherlands. Eur. J. Transp. Infrastruct. Res. 2015, 15, 27–50. [Google Scholar]
  13. Fishman, E. Bikeshare: A Review of Recent Literature. Transp. Rev. 2015, 36, 92–113. [Google Scholar] [CrossRef]
  14. Martens, K. Promoting bike-and-ride: The Dutch experience. Transp. Res. Part A Policy Pract. 2007, 41, 326–338. [Google Scholar] [CrossRef]
  15. Li, W.; Joh, K. Do Residents Value the Integration of Bicycling and Transit? Assessing Their Revealed Preferences Based on Property Sale Transactions. In Proceedings of the Transportation Research Board 95th Annual Meeting, Washington, DC, USA, 10–14 January 2016. [Google Scholar]
  16. Jäppinen, S.; Toivonen, T.; Salonen, M. Modelling the potential effect of shared bicycles on public transport travel times in Greater Helsinki: An open data approach. Appl. Geogr. 2013, 43, 13–24. [Google Scholar] [CrossRef]
  17. Liu, Y.; Szeto, W.Y.; Ho, S.C. A static free-floating bike repositioning problem with multiple heterogeneous vehicles, multiple depots, and multiple visits. Transp. Res. Part C Emerg. Technol. 2018, 92, 208–242. [Google Scholar] [CrossRef]
  18. Sadeghinasr, B.; Akhavan, A.; Furth, P.G.; Gehrke, S.R.; Wang, Q.; Reardon, T.G. Mining dockless bikeshare data for insights into cyclist behavior and preferences: Evidence from the Boston region. Transp. Res. Part D Transp. Environ. 2021, 100, 103044. [Google Scholar] [CrossRef]
  19. Gehrke, S.R.; Sadeghinasr, B.; Wang, Q.; Reardon, T.G. Patterns and predictors of dockless bikeshare trip generation and duration in Boston’s suburbs. Case Stud. Transp. Policy 2021, 9, 756–766. [Google Scholar] [CrossRef]
  20. Zhang, Y.; Lin, D.; Mi, Z. Electric fence planning for dockless bike-sharing services. J. Clean. Prod. 2019, 206, 383–393. [Google Scholar] [CrossRef]
  21. Ma, X.; Ji, Y.; Yang, M.; Jin, Y.; Tan, X. Understanding bikeshare mode as a feeder to metro by isolating metro-bikeshare transfers from smart card data. Transp. Policy 2018, 71, 57–69. [Google Scholar] [CrossRef]
  22. Ji, Y.; Ma, X.; Yang, M.; Jin, Y.; Gao, L. Exploring Spatially Varying Influences on Metro-Bikeshare Transfer: A Geographically Weighted Poisson Regression Approach. Sustainability 2018, 10, 1526. [Google Scholar] [CrossRef] [Green Version]
  23. Martens, K. The bicycle as a feedering mode: Experiences from three European countries. Transp. Res. Part D Transp. Environ. 2004, 9, 281–294. [Google Scholar] [CrossRef]
  24. Flamm, B.J.; Rivasplata, C.R. Public Transit Catchment Areas: The Curious Case of Cycle-Transit Users. Transport. Res. Rec. 2014, 2419, 101–108. [Google Scholar] [CrossRef]
  25. Rietveld, P. The accessibility of railway stations: The role of the bicycle in The Netherlands. Transp. Res. Part D Transp. Environ. 2000, 5, 71–75. [Google Scholar] [CrossRef]
  26. Mead, D.; Johnson, M.; Rose, G. Factors Influencing Variability in the Usage of Secure Bicycle Parking at Railway Stations in Melbourne, Australia. In Proceedings of the Transportation Research Board 95th Annual Meeting, Washington, DC, USA, 10–14 January 2016. [Google Scholar]
  27. Caulfield, B.; Brick, E.; McCarthy, O.T. Determining bicycle infrastructure preferences—A case study of Dublin. Transp. Res. Part D Transp. Environ. 2012, 17, 413–417. [Google Scholar] [CrossRef] [Green Version]
  28. Ji, Y.; Fan, Y.; Ermagun, A.; Cao, X.; Wang, W.; Das, K. Public bicycle as a feeder mode to rail transit in China: The role of gender, age, income, trip purpose, and bicycle theft experience. Int. J. Sustain. Transp. 2017, 11, 308–317. [Google Scholar] [CrossRef]
  29. Yang, M.; Liu, X.; Wang, W.; Li, Z.; Zhao, J. Empirical Analysis of a Mode Shift to Using Public Bicycles to Access the Suburban Metro: Survey of Nanjing, China. J. Urban Plan. Dev. 2016, 142, 05015011. [Google Scholar] [CrossRef]
  30. Fan, A.; Chen, X.; Wan, T. How Have Travelers Changed Mode Choices for First/Last Mile Trips after the Introduction of Bicycle-Sharing Systems: An Empirical Study in Beijing, China. J. Adv. Transport. 2019, 2019, 5426080. [Google Scholar] [CrossRef] [Green Version]
  31. Ji, Y.; Cao, Y.; Liu, Y.; Ma, X. Analysis of temporal and spatial usage patterns of dockless bike sharing system around rail transit station area. J. Southeast Univ. (Engl. Ed.) 2019, 35, 228–235. [Google Scholar]
  32. Lin, D.; Zhang, Y.; Zhu, R.; Meng, L. The analysis of catchment areas of metro stations using trajectory data generated by dockless shared bikes. Sustain. Cities Soc. 2019, 49, 101598. [Google Scholar] [CrossRef]
  33. Li, Y.; Zhu, Z.; Guo, X. Operating Characteristics of Dockless Bike-Sharing Systems near Metro Stations: Case Study in Nanjing City, China. Sustainability 2019, 11, 2256. [Google Scholar] [CrossRef] [Green Version]
  34. Wu, X.; Lu, Y.; Lin, Y.; Yang, Y. Measuring the Destination Accessibility of Cycling Transfer Trips in Metro Station Areas: A Big Data Approach. Int. J. Environ. Res. Public Health 2019, 16, 2641. [Google Scholar] [CrossRef] [Green Version]
  35. Ni, Y.; Chen, J. Exploring the Effects of the Built Environment on Two Transfer Modes for Metros: Dockless Bike Sharing and Taxis. Sustainability 2020, 12, 2034. [Google Scholar] [CrossRef] [Green Version]
  36. Song, Y.; Huang, Y. Investigating Complementary and Competitive Relationships between Bikeshare Service and Public Transit: A Spatial-Temporal Framework. Transp. Res. Rec. 2020, 2674, 260–271. [Google Scholar] [CrossRef]
  37. Audikana, A.; Ravalet, E.; Baranger, V.; Kaufmann, V. Implementing bikesharing systems in small cities: Evidence from the Swiss experience. Transp. Policy 2017, 55, 18–28. [Google Scholar] [CrossRef]
  38. Bachand-Marleau, J.; Lee, B.H.Y.; El-Geneidy, A.M. Better Understanding of Factors Influencing Likelihood of Using Shared Bicycle Systems and Frequency of Use. Transport. Res. Rec. 2012, 2314, 66–71. [Google Scholar] [CrossRef] [Green Version]
  39. Cheng, Y.H.; Lin, Y.C. Expanding the effect of metro station service coverage by incorporating a public bicycle sharing system. Int. J. Sustain. Transp. 2018, 12, 241–252. [Google Scholar] [CrossRef]
  40. Noland, R.B.; Smart, M.J.; Guo, Z. Bikeshare trip generation in New York City. Transp. Res. Part A Policy Pr. 2016, 94, 164–181. [Google Scholar] [CrossRef]
  41. Zhao, J.; Wang, J.; Deng, W. Exploring bikesharing travel time and trip chain by gender and day of the week. Transp. Res. Part C Emerg. Technol. 2015, 58, 251–264. [Google Scholar] [CrossRef]
  42. Zhao, P.; Li, S. Bicycle-metro integration in a growing city: The determinants of cycling as a transfer mode in metro station areas in Beijing. Transp. Res. Part A Policy Pract. 2017, 99, 46–60. [Google Scholar] [CrossRef]
  43. Ma, T.; Knaap, G. Estimating the Impacts of Capital Bikeshare on Metrorail Ridership in the Washington Metropolitan Area. Transp. Res. Rec. 2019, 2673, 371–379. [Google Scholar] [CrossRef]
  44. Xu, D.; Bian, Y.; Rong, J.; Wang, J.; Yin, B. Study on Clustering of Free-Floating Bike-Sharing Parking Time Series in Beijing Subway Stations. Sustainability 2019, 11, 5439. [Google Scholar] [CrossRef] [Green Version]
  45. Xiao, G.; Juan, Z.; Gao, J. Detecting Travel Modes Using Particular Rules Combined with a Nave Bayesian Classifier. In Proceedings of the Transportation Research Board 94th Annual Meeting, Washington, DC, USA, 11–15 January 2015. No. 15-4530. [Google Scholar]
  46. Chin, J.; Callaghan, V.; Lam, I. Understanding and personalising smart city services using machine learning, The Internet-of-Things and Big Data. In Proceedings of the 2017 IEEE 26th International Symposium on Industrial Electronics (ISIE), Edinburgh, UK, 19–21 June 2017. [Google Scholar]
  47. Patalas-Maliszewska, J.; Halikowski, D. A model for generating workplace procedures using a CNN-SVM architecture. Symmetry 2019, 11, 1151. [Google Scholar] [CrossRef] [Green Version]
  48. Taigman, Y.; Yang, M.; Ranzato, M.A. Deepface: Closing the gap to human-level performance in face verification. In Proceedings of the IEEE conference on computer vision and pattern recognition, Columbus, OH, USA, 23–28 June 2014; pp. 1701–1708. [Google Scholar]
  49. Jahangiri, A.; Rakha, H. Developing a support vector machine (SVM) classifier for transportation mode identification by using mobile phone sensor data. In Proceedings of the Transportation Research Board 93rd Annual Meeting, Washington, DC, USA, 12–16 January 2014; Volume 14, p. 1442. [Google Scholar]
  50. Joo, S.; Oh, C.; Jeong, E.; Lee, G. Categorizing bicycling environments using GPS-based public bicycle speed data. Transp. Res. Part C Emerg. Technol. 2015, 56, 239–250. [Google Scholar] [CrossRef]
  51. Zhu, K.; Xun, P.; Li, W.; Li, Z.; Zhou, R. Prediction of passenger flow in urban rail transit based on big data analysis and deep learning. IEEE Access 2019, 7, 142272–142279. [Google Scholar] [CrossRef]
  52. Zhou, G.; Tang, J. Forecast of urban rail transit passenger flow in holidays based on support vector machine model. IEEE Access 2020, 7, 585–589. [Google Scholar]
  53. Wang, X.; Zhang, N.; Zhang, Y.; Shi, Z. Forecasting of short-term metro ridership with support vector machine online model. J. Adv. Transp. 2018, 2018, 3189238. [Google Scholar] [CrossRef]
  54. Nurviana, N.; Ati, S.K.; Hanifah, H.P. Predictive Model of Passengers Trans Metro Bandung Encouraging Smart Transportation. J. Sist. Cerdas 2019, 2, 111–118. [Google Scholar] [CrossRef]
  55. Cheng, L.; Chen, X.; De Vos, J.; Lai, X.; Witlox, F. Applying a random forest method approach to model travel mode choice behavior. Travel Behav. Soc. 2018, 14, 1–10. [Google Scholar] [CrossRef]
  56. Lin, S.; Tian, H. Short-Term Metro Passenger Flow Prediction Based on Random Forest and LSTM. In Proceedings of the 4th Information Technology, Networking, Electronic and Automation Control Conference (ITNEC), Chongqing, China, 12–14 June 2020; Volume 1, pp. 2520–2526. [Google Scholar]
  57. Patil, A.; Musale, K.; Rao, B.P. Bike share demand prediction using RandomForests. IJISET Int. J. Innov. Sci. Eng. Technol. 2015, 2, 1218–1223. [Google Scholar]
  58. Wang, B.; Kim, I. Short-term prediction for bike-sharing service using machine learning. Transp. Res. Procedia 2018, 34, 171–178. [Google Scholar] [CrossRef]
  59. Ruffieux, S.; Mugellini, E.; Spycher, N. Real-Time Usage Forecasting for Bike-Sharing Systems. In Proceedings of the 2017 Intelligent Systems Conference, London, UK, 7–8 September 2017. [Google Scholar]
  60. Datla, M.V. Bench marking of classification algorithms: Decision Trees and Random Forests-a case study using R. In Proceedings of the 2015 international conference on trends in automation, communications and computing technology (I-TACT-15), Bangalore, India, 21–22 December 2015; pp. 1–7. [Google Scholar]
  61. Ding, C.; Wang, D.; Ma, X.; Li, H. Predicting short-term subway ridership and prioritizing its influential factors using gradient boosting decision trees. Sustainability 2016, 8, 1100. [Google Scholar] [CrossRef] [Green Version]
  62. Lee, J.; Yu, K.; Kim, J. Public Bike Trip Purpose Inference Using Point-of-Interest Data. ISPRS Int. J. Geo-Inf. 2021, 10, 352. [Google Scholar] [CrossRef]
  63. Gan, Z.; Yang, M.; Feng, T.; Timmermans, H.J. Examining the relationship between built environment and metro ridership at station-to-station level. Transp. Res. Part D Transp. Environ. 2020, 82, 102332. [Google Scholar] [CrossRef]
  64. Ling, X.; Huang, Z.; Wang, C.; Zhang, F.; Wang, P. Predicting subway passenger flows under different traffic conditions. PLoS ONE 2018, 13, e0202707. [Google Scholar]
  65. Zhang, Z.; Ma, Y.; Chen, S.; Hu, S.; Li, Z. A Microscopic Spatial-Temporal Forecast Framework for Inflow and Outflow Gap of Free-Floating Bike Sharing System. In Proceedings of the CICTP 2020, Xi’an, China, 14–16 August 2020; pp. 4667–4679. [Google Scholar]
  66. Nanjing Transport Annual Report; Nanjing Planning Bureau: Nanjing, China, 2018.
  67. Zhao, D.; Ong, G.P.; Wang, W.; Hu, X. Effect of built environment on shared bicycle reallocation: A case study on Nanjing, China. Transp. Res. Part A Policy Pr. 2019, 128, 73–88. [Google Scholar] [CrossRef]
  68. Zhang, Y.; Thomas, T.; Brussel, M.; van Maarseveen, M. Exploring the impact of built environment factors on the use of public bikes at bike stations: Case study in Zhongshan, China. J. Transp. Geogr. 2017, 58, 59–70. [Google Scholar] [CrossRef]
  69. Imani, A.F.; Eluru, N.; El-Geneidy, A.M.; Rabbat, M.; Haq, U. How land-use and urban form impact bicycle flows: Evidence from the bicycle-sharing system (BIXI) in Montreal. J. Transp. Geogr. 2014, 41, 306–314. [Google Scholar] [CrossRef]
Figure 1. Structure of the datasets of Nanjing Metro and Bikeshare (Note: “Member ID” of dedicated bikeshare cards begins with letters “NJ”, whereas the ID of seamless smartcards begins with number “9”). (a) Structure of the datasets of Nanjing Bikeshare, (b) Structure of the datasets of Nanjing Metro. Note: User ID are not fully presented to ensure privacy of smartcard users.
Energies 15 00203 g001
Figure 2. Flowchart of the identification process.
Energies 15 00203 g002
Figure 3. Process of generating Card Pair (an example using a seamless smartcard with the ID 970071260853).
Energies 15 00203 g003
Figure 4. Schematic diagram of temporal conflict.
Energies 15 00203 g004
Figure 5. Process of considering spatial conflict.
Energies 15 00203 g005
Figure 6. Prediction accuracy of different models. (a) Identifier Threshold = 0.5, (b) Identifier Threshold = 0.6, (c) Identifier Threshold = 0.7, (d) Identifier Threshold = 0.8.
Energies 15 00203 g006
Figure 7. Temporal distribution of the bikeshare usage. (a) Transfer trips extracted from seamless bikeshare smartcard data and metro smartcard data, (b) Transfer trips extracted from dedicated bikeshare card data and metro smartcard data.
Energies 15 00203 g007aEnergies 15 00203 g007b
Table 1. The structure of the dataset used in the model.
Card PairTransfer Time (s)Transfer Distance (m)Transfer Speed (m/s)Speed VARFrequency (Times)
Matched card pair
970475145994–970475145994288109.970.3820.0084
970475145994–970475145994204109.970.5390.0084
970475145994–970475145994176109.970.6250.0084
970475145994–970475145994212109.970.5190.0084
Unmatched card pair
970071247468–9907760800907294.251.3092.6004
970071247468–99077608009043494.250.2172.6004
970071247468–9907760800902294.254.2842.6004
970071247468–99077608009018794.250.5042.6004
Table 2. Four types of prediction result for card pairs.
Card PairPredicted IdentifierThe Average of Predicted IdentifierPrediction Value of Card Pair
993171107872–99317110787210.75 (> threshold 0.6)1 (a valid card pair predicted as a valid one)
993171107872–9931711078720
993171107872–9931711078721
993171107872–9931711078721
976675052251–97667505225100 (< threshold 0.6)0 (a valid card pair predicted as an invalid one)
976675052251–9766750522510
976675052251–9766750522510
970071637524–99657249483400.67 (> threshold 0.6)1 (an invalid card pair predicted as a valid one)
970071637524–9965724948341
970071637524–9965724948341
970071637524–97007477474100.33 (< threshold 0.6)0 (an invalid card pair predicted as an invalid one)
970071637524–9700747747410
970071637524–9700747747411
Publisher’s Note: MDPI stays neutral with regard to jurisdictional claims in published maps and institutional affiliations.

