
Investments in Croatian RES Plants and Energy Efficient Building Retrofits: Substitutes or Complements?


Abstract
:1. Introduction
- Scenario 1—Intensive energy transition requires reduction of greenhouse gas emissions of 40% by 2030 and 75% by 2050 (compared to the level of emissions in 1990). Energy efficient renovation of the building stock is expected at an average annual rate of 3%, which will make the entire building stock low-energy by 2050. The share of RES is expected to increase to 66% by 2030 and to 88% by 2050.
- Scenario 2—Moderate energy transition requires reduction of greenhouse gas emissions of 35% by 2030 and 65% by 2050. Energy efficient renovation of the building stock is expected at an average annual rate of 1.6. The share of renewable energy sources is expected to increase to 61% by 2030 and to 83% by 2050.
2. Literature Review
3. Research Methodology
- Calculation of matrix of technical coefficients (A), and diagonal matrices V (GVA coefficients) and E (employment coefficients) are based on the official Croatian IO table (available at www.dzs.hr, accessed on 2 October 2021).
- Vectors of final demand (Y) present the value of investments in RES plants (wind, solar, biomass and hydro energy) and energy efficient building retrofit (private and public buildings). Total value for each type of investment is based on the Croatian energy strategy data (Table 1). The structure of investments in RES is based on the survey conducted on the sample which include more than 70% of totally installed capacities of RES plants in Croatia. The investors provided a detailed investment structure according to the types of equipment installed in the plant and separated to the domestic and imported equipment. The cost structures of retrofit works are based on project applications collected by Ministry of Construction and Physical Planning of the Republic of Croatia in the scope of the government’s grant scheme.
- Direct effects include output, GVA and employment generated by economic units which directly contracted delivery of equipment to investors. Indirect effects include output, GVA and employment generated by all domestic producers which deliver intermediate inputs that are directly or indirectly required for the investment. Direct and indirect output induced by different type of investment are estimated by Equation (1).
- Total GVA and employment effects for different types of investments, which include effects of induced personal consumption, are estimated by Equations (4) and (5).
- Results are expressed as absolute values (total GVA and employment induced in period to 2050) and in relative terms (effects induced by EUR 1 million of investments).
4. Results
4.1. Relative Gross Value Added (GVA) and Employment Effects by Categories
4.2. Productivity Growth and Employment Factors in the Period 2020–2050
4.3. GVA Effects of Energy Transition in Croatia in the Period 2020–2050
4.4. Employment Effects of Energy Transition in the Period 2020–2050
5. Discussion and Conclusions
Author Contributions
Funding
Institutional Review Board Statement
Informed Consent Statement
Conflicts of Interest
References
- European Commission. The European Green Deal; COM(2019) 640 Final; European Commission: Brussels, Belgium, 2019; Available online: https://eur-lex.europa.eu/legal-content/EN/TXT/HTML/?uri=CELEX:52019DC0640&from=EN (accessed on 20 September 2021).
- Cameron, L.; van der Zwaan, B. Employment factors for wind and solar energy technologies: A literature review. Renew. Sustain. Energy Rev. 2015, 45, 160–172. [Google Scholar] [CrossRef] [Green Version]
- Ryan, L.; Campbell, N. Spreading the Net: The Multiple Benefits of Energy Efficiency Improvements; International Energy Agency: Paris, France, 2012. [Google Scholar]
- Mikulić, D.; Lovrinčević, Ž.; Keček, D. Valorization of economic effects from the programme of energy renovation of public buildings in Croatia. Build. Res. Inf. 2020, 49, 561–573. [Google Scholar] [CrossRef]
- Croatian Parliament. Low-Carbon Development Strategy of the Republic of Croatia until 2030 with an Outlook to 2050; Croatian Parliament: Zagreb, Croatia, 2020. [Google Scholar]
- Miller, R.E.; Blair, P.D. Input-Output Analysis: Foundations and Extensions; Cambridge University Press: New York, NY, USA, 2009. [Google Scholar]
- Sovacool, B.K.; Martiskainen, M.; Hook, A.; Baker, L. Beyond cost and carbon: The multidimensional co-benefits of low carbon transitions in Europe. Ecol. Econ. 2020, 169, 106529. [Google Scholar] [CrossRef]
- Lamb, W.F.; Antal, M.; Bohnenberger, K.; Brand-Correa, L.I.; Müller-Hansen, F.; Jakob, M.; Minx, J.C.; Raiser, K.; Williams, L.; Sovacool, B.K. What are the social outcomes of climate policies? A systematic map and review of the ex-post literature. Environ. Res. Lett. 2020, 15, 113006. [Google Scholar] [CrossRef]
- Füllemann, Y.; Moreau, V.; Vielle, M.; Vuille, F. Hire fast, fire slow: The employment benefits of energy transitions. Econ. Syst. Res. 2019, 32, 202–220. [Google Scholar] [CrossRef]
- Neofytou, H.; Sarafidis, Y.; Gkonis, N.; Mirasgedis, S.; Askounis, D. Energy efficiency contribution to sustainable development: A multi-criteria approach in Greece. Energy Sources Part B Econ. Plan. Policy 2020, 15, 572–604. [Google Scholar] [CrossRef]
- Dejuan, O.; Portella-Carbo, F.; Ortiz, M. Economic and environmental impacts of decarbonisation through a hybrid MRIO multiplier-accelerator model. Econ. Syst. Res. 2020, 1–21. [Google Scholar] [CrossRef]
- Garrett-Peltier, H. Green versus brown: Comparing the employment impacts of energy efficiency, renewable energy, and fossil fuels using an input-output model. Econ. Model. 2017, 61, 439–447. [Google Scholar] [CrossRef]
- Markandya, A.; Arto, I.; González-Eguino, M.; Román, M.V. Towards a green energy economy? Tracking the employment effects of low-carbon technologies in the European Union. Appl. Energy 2016, 179, 1342–1350. [Google Scholar] [CrossRef] [Green Version]
- Bulavskaya, T.; Reynès, F. Job creation and economic impact of renewable energy in The Netherlands. Renew. Energy 2018, 119, 528–538. [Google Scholar] [CrossRef] [Green Version]
- Ragwitz, M.; Schade, W.; Breitschopf, B.; Walz, R.; Helfrich, N. The Impact of Renewable Energy Policy on Economic Growth and Employment in the European Union (EmployRES); Final Report, Contract No.: TREN/D1/474/2006; Fraunhofer ISI: Karlsruhe, Germany, 2009. [Google Scholar]
- Schreiner, L.; Madlener, R.A. Pathway to green growth? Macroeconomic impacts of power grid infrastructure investments in Germany. Energy Policy 2021, 156, 112289. [Google Scholar] [CrossRef]
- Tobben, J. Regional net impacts and social distribution effects of promoting renewable energies in Germany. Ecol. Econ. 2017, 135, 195–208. [Google Scholar] [CrossRef]
- IRENA. Measuring the Socio-Economics of Transition: Focus on Jobs; International Renewable Energy Agency: Abu Dhabi, United Arab Emirates, 2020. [Google Scholar]
- Keček, D.; Mikulić, D.; Lovrinčević, Ž. Deployment of renewable energy: Economic effects on the Croatian economy. Energy Policy 2019, 126, 402–410. [Google Scholar] [CrossRef]
- Mikulić, D.; Lovrinčević, Ž.; Keček, D. Economic effects of wind power plant deployment on the Croatian economy. Energies 2018, 11, 1881. [Google Scholar] [CrossRef] [Green Version]
- Xie, J.-B.; Fu, J.-X.; Liu, S.-Y.; Hwang, W.-S. Assessments of carbon footprint and energy analysis of three wind farms. J. Clean. Prod. 2020, 254, 120159. [Google Scholar] [CrossRef]
- Hong, C.; Tsai, Y.; Lee, T. Energy transition, economic growth, and CO2 emission: An application of energy and environment in dynamic input-output models. In Proceedings of the 2018 9th International Conference on Awareness Science and Technology (iCAST), Fukuoka, Japan, 19–21 September 2018; pp. 1–5. [Google Scholar] [CrossRef]
- Jackson, R.W.; Neto, A.B.F.; Erfanian, E. Woody biomass processing: Potential economic impacts on rural regions. Energy Policy 2018, 115, 66–77. [Google Scholar] [CrossRef] [Green Version]
- Ren, F.R.; Tian, Z.; Liu, J.; Shen, Y.T. Analysis of CO2 emission reduction contribution and efficiency of China’s solar photovoltaic industry: Based on Input-output perspective. Energy 2020, 199, 117493. [Google Scholar] [CrossRef]
- Kolpakov, A.Y.; Galinger, A.A. Economic efficiency of the spread of electric vehicles and renewable energy sources in Russia. Her. Russ. Acad. Sci. 2020, 90, 25–35. [Google Scholar] [CrossRef]
- Wang, Q.; Liu, Y. India’s renewable energy: New insights from multi-regional input output and structural decomposition analysis. J. Clean. Prod. 2021, 283, 124230. [Google Scholar] [CrossRef]
- Wen, L.; Guang, F.; Sharp, B. Dynamics in Aotearoa New Zealand’s energy consumption between 2006/2007 and 2012/2013. Energy 2021, 225, 120186. [Google Scholar] [CrossRef]
- Ali, Y.; Ciaschini, M.; Socci, C.; Pretaroli, R.; Sabir, M. Identifying the sources of structural changes in CO2 emissions in Italy. Econ. Polit. 2019, 36, 509–526. [Google Scholar] [CrossRef]
- Mata, É.; Sasic Kalagasidis, A.; Johnsson, F. Contributions of building retrofitting in five member states to EU targets for energy savings. Renew. Sustain. Energy Rev. 2018, 93, 759–774. [Google Scholar] [CrossRef]
- Meijer, F.; Visscher, H.; Nieboer, N.; Kroese, R. Jobs Creation through Energy Renovation of the Housing Stock; Working Paper No. D14.2; NEUJOBS: Brussels, Belgium, 2012; Available online: http://www.iza.org/conference_files/neujobs_2014/4.pdf (accessed on 22 August 2021).
- Ürge-Vorsatz, D.; Arena, D.; Tirado Herrero, S.; Burcher, A. Employment Impact of a Large-Scale Deep Building Energy Retrofit Programme in Hungary; Center for Climate Change and Sustainable Energy Policy: Budapest, Hungary, 2010. [Google Scholar]
- Solmaz, A.S. Optimisation of energy performance and thermal comfort of an office building. Građevinar 2018, 70, 581–592. [Google Scholar] [CrossRef]
- Mikulić, D.; Slijepčević, S.; Buturac, G. Energy renovation of multi apartment buildings: Contributions to economy and climate changes. Energy Build. 2020, 224, 110247. [Google Scholar] [CrossRef]
- Webber, P.; Gouldson, A.; Kerr, N. The impacts of household retrofit and domestic energy efficiency schemes: A large scale, ex post evaluation. Energy Policy 2015, 18, 35–43. [Google Scholar] [CrossRef] [Green Version]
- Hartwig, J.; Kockat, J. Macroeconomic effects of energetic building retrofit: Input-output sensitivity analyses. Constr. Manag. Econ. 2016, 34, 79–97. [Google Scholar] [CrossRef]
- Hartwig, J.; Kockat, J.; Schade, W.; Braungardt, S. The macroeconomic effects of ambitious energy efficiency policy in Germany—Combining bottom-up energy modelling with a non-equilibrium macroeconomic model. Energy 2017, 124, 510–520. [Google Scholar] [CrossRef]
- Ma, J.-J.; Liu, L.-Q.; Su, B.; Xie, B.-C. Exploring the critical factors and appropriate polices for reducing energy consumption of China’s urban civil building sector. J. Clean. Prod. 2015, 103, 446–454. [Google Scholar] [CrossRef]
- Mancini, F.; Basso, G.L. How climate change affects the building energy consumptions due to cooling, heating and electricity demands of Italian residential sector. Energies 2020, 13, 410. [Google Scholar] [CrossRef] [Green Version]
- Hoppe, T.; Miedema, M.A. Governance approach to regional energy transition: Meaning, conceptualization and practice. Sustainability 2020, 12, 915. [Google Scholar] [CrossRef] [Green Version]
- Mikulić, D. Osnove Input-Output Analize s Primjenom na Hrvatsko Gospodarstvo; Ekonomski Institute: Zagreb, Croatia, 2018. [Google Scholar]
- Ten Raa, T. The Economics of Input-Output Analysis; Cambridge Univeristy Press: Cambridge, UK, 2005. [Google Scholar]
- Energetski Institut Hrvoje Požar. Zelena Knjiga: Analize i Podloge za Izradu Strategije Energetskog Razvoja Republike Hrvatske; Ministarstvo Zaštite Okoliša i Energetike: Zagreb, Croatia, 2018. Available online: https://www.hup.hr/EasyEdit/UserFiles/Granske_udruge/CRO%20industrija/Marija%20%C5%A0utina/zelena-knjiga.pdf (accessed on 30 August 2021).


| Scenario 1 | Scenario 2 | |||||||
|---|---|---|---|---|---|---|---|---|
| 2020–2030 | 2031–2040 | 2041–2050 | 2020–2050 | 2020–2030 | 2031–2040 | 2041–2050 | 2020–2050 | |
| RES | 2192 | 2442 | 2887 | 7520 | 1815 | 1803 | 2261 | 5879 |
| Wind power plants | 852 | 1062 | 1296 | 3209 | 647 | 743 | 907 | 2297 |
| Solar energy | 663 | 1069 | 791 | 2523 | 490 | 748 | 554 | 1792 |
| Biomass | 122 | 0 | 125 | 247 | 122 | 0 | 125 | 247 |
| Hydro energy | 555 | 311.5 | 675 | 1542 | 555 | 311.5 | 675 | 1542 |
| Buildings retrofit | 3468 | 3626 | 3783 | 10,877 | 1733 | 1813 | 1891 | 5438 |
| Private buildings | 2292 | 2432 | 2572 | 7296 | 1111 | 1181 | 1249 | 3541 |
| Public buildings | 1176 | 1194 | 1210 | 3580 | 622 | 632 | 642 | 1897 |
| Total | 5660 | 6068 | 6669 | 18,397 | 3549 | 3616 | 4152 | 11,316 |
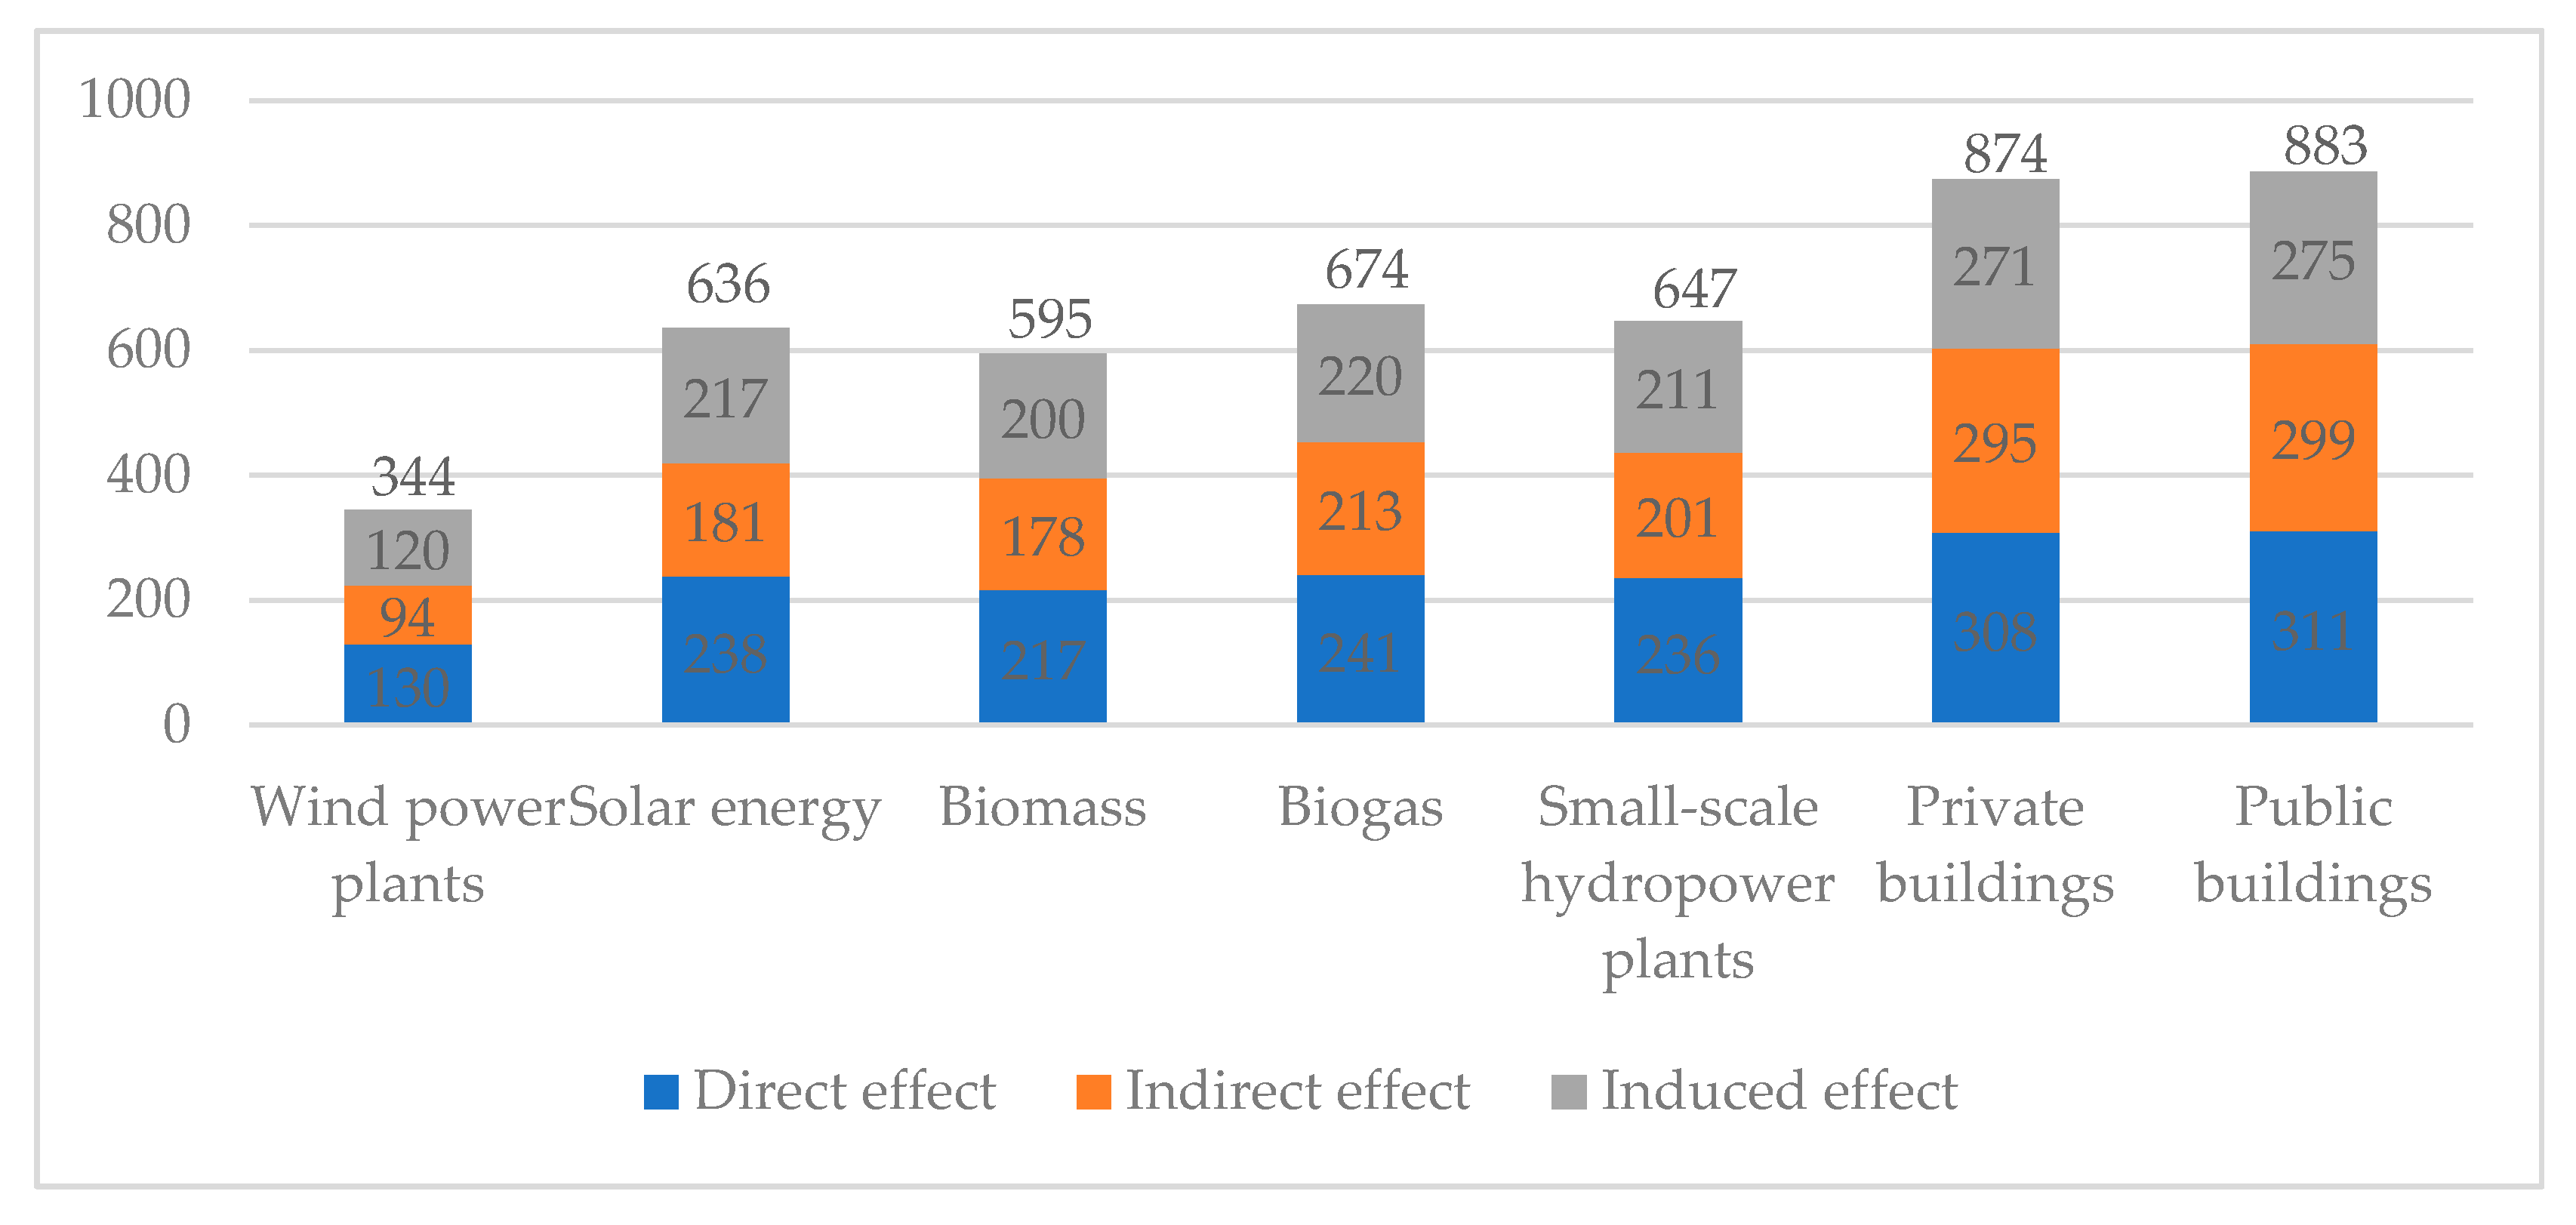
| Direct Effect | Indirect Effect | Induced Effect | Total Effect | |
|---|---|---|---|---|
| GVA induced by investments in RES a | ||||
| Wind power plants | 130 | 94 | 120 | 344 |
| Solar energy | 238 | 181 | 217 | 636 |
| Biomass | 217 | 178 | 200 | 595 |
| Biogas | 241 | 213 | 220 | 674 |
| Hydro energy | 236 | 201 | 211 | 647 |
| GVA induced by investments in energy efficient building retrofit a | ||||
| Private buildings | 308 | 295 | 271 | 874 |
| Public buildings | 311 | 299 | 275 | 883 |
| Employment (FTE) induced by investments in RES | ||||
| Wind power plants | 6.1 | 3.2 | 5.0 | 14.3 |
| Solar energy | 8.2 | 6.5 | 8.5 | 23.2 |
| Biomass | 9.8 | 6.5 | 8.6 | 24.9 |
| Biogas | 11.9 | 6.6 | 9.0 | 27.5 |
| Hydro energy | 11.6 | 6.1 | 8.3 | 26.0 |
| Employment (FTE) induced by investments in energy efficient building retrofit | ||||
| Private buildings | 15.0 | 11.1 | 9.4 | 35.5 |
| Public buildings | 15.0 | 11.2 | 9.4 | 35.5 |
| Current | Average 2020–2030 | Average 2031–2040 | Average 2041–2050 | |
|---|---|---|---|---|
| RES | ||||
| Wind power plants | 14.3 | 12.0 | 10.0 | 8.3 |
| Solar energy | 23.2 | 19.4 | 16.1 | 13.4 |
| Biomass | 24.9 | 21.0 | 17.6 | 14.7 |
| Hydro energy | 26.0 | 22.5 | 19.4 | 16.7 |
| Retrofit | ||||
| Private buildings | 35.5 | 31.3 | 27.5 | 24.1 |
| Public buildings | 35.5 | 31.1 | 27.1 | 23.6 |
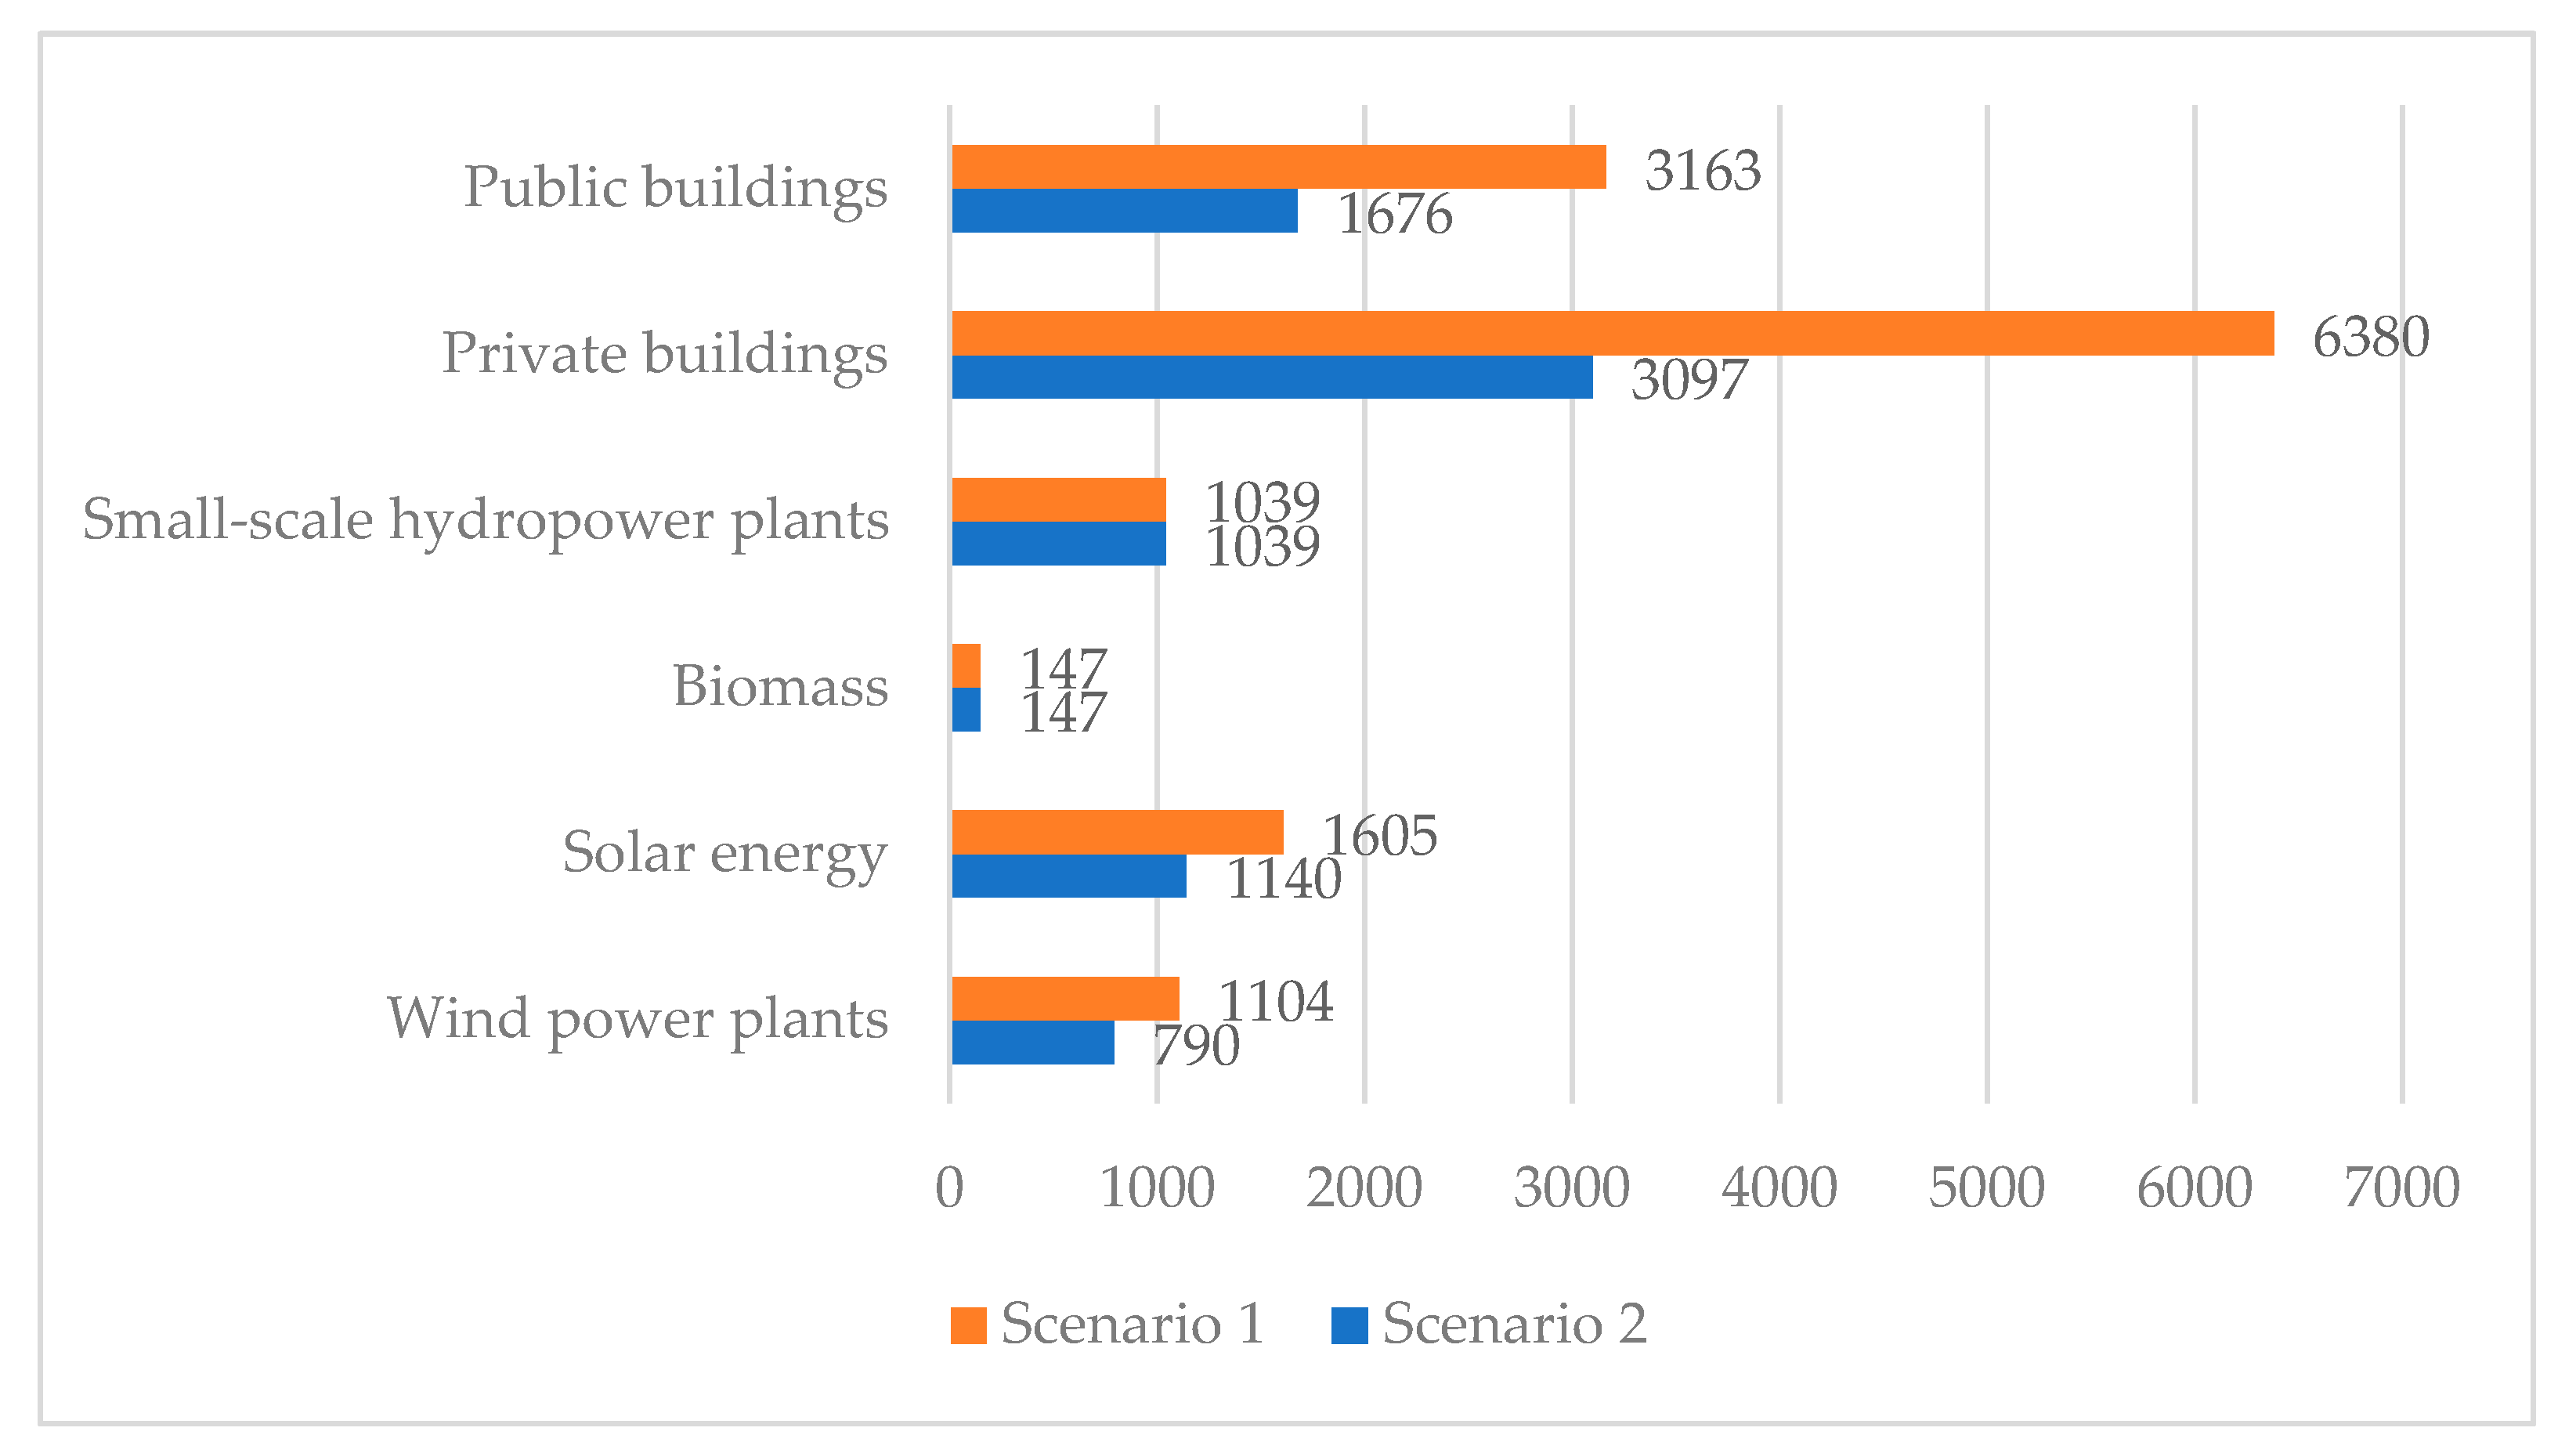
| Scenario 1 | Scenario 2 | |||||||
|---|---|---|---|---|---|---|---|---|
| 2020–2030 | 2031–2040 | 2041–2050 | 2020–2050 | 2020–2030 | 2031–2040 | 2041–2050 | 2020–2050 | |
| RES | 1162 | 1255 | 1478 | 3895 | 982 | 942 | 1194 | 3117 |
| Wind power plants | 293 | 365 | 446 | 1104 | 223 | 256 | 312 | 790 |
| Solar energy | 422 | 680 | 503 | 1605 | 312 | 476 | 352 | 1140 |
| Biomass | 73 | 0 | 74 | 147 | 73 | 0 | 74 | 147 |
| Hydro energy | 374 | 210 | 455 | 1039 | 374 | 210 | 455 | 1039 |
| Buildings retrofit | 3043 | 3182 | 3319 | 9544 | 1521 | 1591 | 1660 | 4772 |
| Private buildings | 2004 | 2127 | 2249 | 6380 | 971 | 1032 | 1093 | 3097 |
| Public buildings | 1039 | 1055 | 1069 | 3163 | 550 | 559 | 567 | 1676 |
| Total | 4205 | 4437 | 4797 | 13,439 | 2503 | 2533 | 2853 | 7889 |
| Scenario 1 | Scenario 2 | |||||||
|---|---|---|---|---|---|---|---|---|
| 2020–2030 | 2031–2040 | 2041–2050 | 2020–2050 | 2020–2030 | 2031–2040 | 2041–2050 | 2020–2050 | |
| RES | 0.18 | 0.17 | 0.18 | 0.18 | 0.15 | 0.13 | 0.15 | 0.14 |
| Wind power plants | 0.05 | 0.05 | 0.05 | 0.05 | 0.03 | 0.04 | 0.04 | 0.04 |
| Solar energy | 0.07 | 0.09 | 0.06 | 0.07 | 0.05 | 0.07 | 0.04 | 0.05 |
| Biomass | 0.01 | 0.00 | 0.01 | 0.01 | 0.01 | 0.00 | 0.01 | 0.01 |
| Hydro Energy | 0.06 | 0.03 | 0.06 | 0.05 | 0.06 | 0.03 | 0.06 | 0.05 |
| Buildings retrofit | 0.47 | 0.44 | 0.41 | 0.44 | 0.24 | 0.22 | 0.20 | 0.22 |
| Private buildings | 0.31 | 0.29 | 0.27 | 0.29 | 0.15 | 0.14 | 0.13 | 0.14 |
| Public buildings | 0.16 | 0.15 | 0.13 | 0.14 | 0.09 | 0.08 | 0.07 | 0.08 |
| Total | 0.65 | 0.61 | 0.59 | 0.61 | 0.39 | 0.35 | 0.35 | 0.36 |
| Scenario 1 | Scenario 2 | |||||||
|---|---|---|---|---|---|---|---|---|
| 2020–2030 | 2031–2040 | 2041–2050 | 2020–2050 | 2020–2030 | 2031–2040 | 2041–2050 | 2020–2050 | |
| RES | 38,110 | 33,905 | 34,497 | 106,511 | 32,322 | 25,548 | 28,082 | 85,953 |
| Wind power plants | 10,203 | 10,630 | 10,816 | 31,649 | 7758 | 7442 | 7571 | 22,770 |
| Solar energy | 12,845 | 17,224 | 10,566 | 40,635 | 9502 | 12,056 | 7396 | 28,955 |
| Biomass | 2562 | 0 | 1843 | 4405 | 2562 | 0 | 1843 | 4405 |
| Hydro Energy | 12,499 | 6051 | 11,272 | 29,822 | 12,499 | 6051 | 11,272 | 29,822 |
| Buildings retrofit | 108,347 | 99,348 | 90,539 | 298,235 | 54,145 | 49,660 | 45,251 | 149,056 |
| Private buildings | 71,783 | 66,954 | 61,987 | 200,723 | 34,795 | 32,502 | 30,110 | 97,406 |
| Public buildings | 36,565 | 32,394 | 28,553 | 97,512 | 19,350 | 17,158 | 15,141 | 51,649 |
| Total | 146,457 | 133,253 | 125,036 | 404,746 | 86,467 | 75,208 | 73,333 | 235,008 |
Publisher’s Note: MDPI stays neutral with regard to jurisdictional claims in published maps and institutional affiliations. |
© 2021 by the authors. Licensee MDPI, Basel, Switzerland. This article is an open access article distributed under the terms and conditions of the Creative Commons Attribution (CC BY) license (https://creativecommons.org/licenses/by/4.0/).
Share and Cite
Mikulić, D.; Keček, D. Investments in Croatian RES Plants and Energy Efficient Building Retrofits: Substitutes or Complements? Energies 2022, 15, 2. https://doi.org/10.3390/en15010002
Mikulić D, Keček D. Investments in Croatian RES Plants and Energy Efficient Building Retrofits: Substitutes or Complements? Energies. 2022; 15(1):2. https://doi.org/10.3390/en15010002
Chicago/Turabian StyleMikulić, Davor, and Damira Keček. 2022. "Investments in Croatian RES Plants and Energy Efficient Building Retrofits: Substitutes or Complements?" Energies 15, no. 1: 2. https://doi.org/10.3390/en15010002
APA StyleMikulić, D., & Keček, D. (2022). Investments in Croatian RES Plants and Energy Efficient Building Retrofits: Substitutes or Complements? Energies, 15(1), 2. https://doi.org/10.3390/en15010002